Article

Photosynthetic and Agronomic Traits of Winter Barley (Hordeum vulgare L.) Varieties

Institute of Crop Sciences, Faculty of Agricultural and Food Sciences and Environmental Management, University of Debrecen, Böszörményi str. 138, H-4032 Debrecen, Hungary
*
Author to whom correspondence should be addressed.
Agronomy 2020, 10(12), 1999; https://doi.org/10.3390/agronomy10121999
Submission received: 7 November 2020 / Revised: 5 December 2020 / Accepted: 17 December 2020 / Published: 19 December 2020

Abstract

:
We tested six winter barley (Hordeum vulgare L.) cultivars in a small plot field experiment, measuring photosynthesis and other parameters three times during the growing season. Four genotypes—Andoria, Jakubus, Paradies and Zophia—are new, promising varieties with requirements of intensive technology, high yield potential and very good disease resistance. The two popular Hungarian varieties (KG Apavár and KG Puszta) are relatively old but they have good tolerance to extreme ecological conditions and outstanding resistance and winter hardiness. The aim of our research was to test the new varieties’ performance. Several recent studies found close connections among various photosynthetic parameters in barley, and we confirmed that in our research. There were significant differences between the varieties in the assimilation rate—the highest values were measured at the BBCH 47–49 stage (end of booting), except Jakubus and Zophia, where the highest values were at BBCH 73–75 (milk ripe). The cultivars’ response to irradiation change varied, especially at higher photosynthetic photon flux density (PPFD) levels. In April and May, the plants were in drought stress according to the intercellular CO2 level and the total conductance to carbon dioxide. The differences between the air and leaf temperature were also low, indicating water stress, but the assimilation rate was relatively high (9.07–14.09 µmol m−2 s−1).We found a close connection between normalized difference vegetation index (NDVI) values and grain protein content in each of the tested barley cultivars. The correlation was significant, at p = 0.01 level. The protein yield per hectare was determined rather by grain yield than protein content. The relationship between the NDVI values and grain yield was moderate, but NDVI values and protein content are in strong correlation.

1. Introduction

Barley (Hordeum vulgare L.) is the fourth-most-important cereal crop in the world, being mainly used for animal feed, however, in regions where the climate for other cereal crops is not favorable, it is also a principal food source. In many parts of the world, barley is an extensively cultivated crop, but it is mainly produced in Europe (more than 60% of world production) using medium or intensive technology. The Mediterranean region of Europe is one of the most important production areas. Water shortage often lowers the productivity and yield of barley in this region, despite its good water-stress tolerance [1,2]. Notwithstanding that barley is mainly used as animal feed, malting barley is a more valuable product and beer is the most popular alcoholic beverage in Europe. Currently, barley is being studied as a promising biofuel source, too. Global food security is threatened by climate change and the rapid growth of the human population. As cereals (e.g., barley) are the nutritional basis of humans and animals, barley production must increase in a sustainable manner [3,4,5].
Barley can tolerate a wide range of environmental conditions, including extremes of latitude and longitude. It has a good level of adaptability to unfavorable environments (e.g., cold, drought, poor soils, shallow layer, high salt concentration) [6,7,8,9]. Compared to other cereals, barley is well-adapted to drought [10,11]. The strong, well-developed root system helps in drought tolerance. Barley is more tolerant than wheat to adverse climatic conditions [3].
The scientific topics that have interested barley researchers related to agronomy are mainly in terms of crop rotation and fertilizer application. Achieving higher yields with less input requires genetic improvement of varieties towards enhancing nutrient and water utilization efficiency of barley plants [12,13,14]. There are many papers published on nutrients, especially on the nitrogen supply of barley [15,16]. Drew (1975) wrote that barley has a strong root system and that the lateral roots of barley grow into patches of high concentration of NO3 and NH4+ [17]. Siebrecht et al. (1995) stated N-starved barley seedlings, once supplied with nitrate, demonstrated almost immediate uptake [18]. The estimation of N concentration in barley is possible using near infrared (NIR) reflectance of the leaf [19]. Barley cultivars react diversely to N supply, and significant differences can be detected in the yield and normalized difference vegetation index (NDVI) value [20].
Many projects are exploring the increase of water uptake and utilization of barley cultivars. Water uptake ability and water use efficiency of barley are determined by many factors and there are complex relationships between them [21,22,23,24]. Better drought tolerance of barley is another aim for plant breeders [2,25].
Decreasing light conditions cause generally lower photosynthetic activity in plants. Barley reacts similar to shade, but its acclimation ability is better than that of wheat, and researchers have found that varieties differ in their reaction to low irradiance conditions [15,26].
In our study we tested six winter barley varieties to explore their performance and the relationships between the photosynthesis parameters and agronomic traits. We investigated the reactions of the barley cultivars to nitrogen supply and different light conditions in details, because no information of that kind can be found in the literature according to these varieties. To achieve this we made wide range of measurements.

2. Materials and Methods

The experiment was set up in 2019 fall at the Látókép research site of the Debrecen University. The crop production experiment site was established in 1983. It has balanced, homogeneous soil and provides for individual water extraction, both of which were fundamental requirements for launching crop production and irrigation research. The experiment site’s coordinates are: 47°33′42″ N; 21°27′02″ E, about 15 km from Debrecen, Hungary.
The soil of the experimental area is calciferous chernozem formed on the Hajdúság loess ridge. Humus content of the upper layer is average (Hu% = 2.7–2.8), the thickness of the humus layer is around 80 cm. The soil plasticity index (KA) was between 43 and 47.6. The acidity of the upper soil layers is almost neutral (pHKCl = 6.46–6.6). The phosphorus supply of the calcareous soil is average (AL-soluble P2O5 133 mg kg−1), while its potassium supply is average-good (AL-soluble K2O 240 mg kg−1). The bulk density of the soil in the cultivated layers is 1.40–1.46 g cm−3, while it is 1.23–1.28 g cm−3 in the lower layers (Table 1). The pore volume is between 45–53.7% in the soil profile. It has a favorable water regime—the field water storing capacity is 808 mm in the 0–200 cm layer. The unavailable water content is 295 mm in the 0–200 cm layer. The amount of available water in saturated state is 513 mm in the 0–200 cm layer, of which 342 mm are readily available. The water table is at 3–5 m depth (Table 2).
The measurements were carried out in a small plot (2 × 9.2 m = 18.4 m2) experiment, with four independent real repetitions. Sowing was done on 5 October 2019, using a Sulky sowing machine adjusted to 400 seeds per m2 seed rate, with the depth at 5 cm. Fertilization levels were: N90P45K50 and N150P45K50 kg ha−1, plant protection treatments were average (1 × fungicide spray: 84 g L−1 epoxikonazol + 250 g L−1 fenpropimorf 1.2 L ha−1), intensive (3 × fungicide spray: 1 × 53 g L−1 (5.4 m/m%) prothioconazole + 224 g L−1 (22,9 m/m%) spiroxamine + 148 g L−1 (15,1 m/m%) tebuconazole 1.0 L ha−1 + 2 × 125 g L−1 (12.7 m/m %) prothioconazole + 125 g L−1 (12.7 m/m %) tebuconazole 1.0 L ha−1).
We measured the photosynthesis parameters, release of water vapor (H2O) by leaf, leaf area index (LAI) and normalized difference vegetation index (NDVI) 3 times (3 April (BBCH 27–29); 28 April (BBCH 47–49); 26 May (BBCH 73–75)) [27], maximum plant height, grain yield, grain moisture content and protein content. The six tested winter barley (Hordeum vulgare L.) genotypes—Andoria, Jakubus, Paradies and Zophia—are new, promising varieties, which are under registration (Jakubus, Zophia) or newly registered (Andoria in 2019, Paradies in 2020) in Hungary. They require rather intensive technology. Andoria is a 6-row winter barley variety, it has good straw stability and lodging resistance. This cultivar has a high thousand grain weight (TGW) and balanced disease resistance. Jakubus is a 6-row winter barley with extraordinary yield potential, good yield stability and high winter hardiness. It has good tolerance against leaf diseases (powdery mildew, brown rust) and is able to recover rapidly after damages. It is grown on large areas in Europe and its significance is increasing. Paradies is a 6-row winter barley variety with very good winter hardiness. It is one of the healthiest varieties of winter barley. It exhibits a high resistance to mildew and rust (APS 3). It also has resistance against barley yellow dwarf virus (BYDV) and barley yellow mosaic virus (BYMV). Zophia is a 2-row winter barley variety, with excellent disease resistance. The two Hungarian varieties are relatively old and fit mainly to extensive production conditions. KG Apavár (registered in 2011) is a 6-row winter barley variety with good tolerance of extreme ecological conditions and drought resistance. Its yield potential, disease resistance and winter hardiness is outstanding. KG Puszta (registered in 2002) is a 6-row winter barley variety. It is the oldest variety among the six tested genotypes (2002). Its yield potential is around the standard average, resistance and winter hardiness are outstanding and it has good tolerance to extreme ecological conditions.
Assimilation parameters were measured in intact leaves using the LI-6800 (LI-COR, USA) portable photosynthesis system. This system has two high-precision infrared gas analyzers to measure CO2 and H2O mole fraction in air. Using input and output of CO2 (μmol mol−1) and H2O (mmol mol−1), leaf temperature (°C), atmospheric pressure (kPa), flow rate (μmol s−1) and other measured parameters the instrument calculates net assimilation, transpiration, stomatal conductance, intercellular CO2 concentration [28] and other physiological parameters. The light was controlled in the sample chamber, we used 1000 µmol photon m−2 s−1 PAR, with 90% red (625 nm) and 10% blue (475 nm) light. For the light response curves, we used decreasing photon flux density in 9 steps (2000, 1500, 1200, 900, 600, 300, 150, 50, 20 µmol m−2 s−1).
The Li-6800-01A multiphase flash fluorometer head was used as a light source, the aperture was 2 cm2. The CO2 concentration was controlled in the chamber: 400 μmol mol−1 using injector and carbon-dioxide patrons. The ambient CO2 level was 399.946 μmol mol−1. The air humidity was controlled using Stuttgarter Masse ceramic substrate, the setpoint was 70%. There were two leaf thermocouple thermometers in the leaf chamber to measure leaf temperature [29]. We measured light-adapted leaves, six times per leaf on two plants per plot. Readings were logged when the measured parameters stabilized, but after a minimum of 120 s. Efficiency of photosystem 2 (PS2) was calculated using formula [29]:
PHIPS2 = 1 − Fs/Fm’
Water use efficiency parameters were calculated from the measured data.
WUE = assimilated CO2 (g)/transpirated H2O (kg)
Normalized difference vegetation index (NDVI) was estimated based on the absorption and reflection of near infrared and visible red light (Equation (3)) [30].
N D V I = ( N I R R e d ) ( N I R + R e d )
We used a Trimble (USA) GreenSeeker handheld crop sensor to do NDVI measurements. This sensor utilizes active illumination with light emitting diodes (LED) at two wavelengths 656 nm and 774 nm. The two-band optical reflectance sensor (optical reflectance ratio) records the intensity of the reflected light (Red and NIR). The sensor started to operate by pulling the trigger at the start of each row. We took multiple readings and an average was calculated when the trigger was released at the end of the sensed area. We held the sensor consistently 60 cm above the canopy for optimal reading.
Leaf area index (LAI) was measured using an LAI-2000 Plant Canopy Analyzer (LI-COR, USA) in one sensor mode, above-canopy and below-canopy readings were obtained using the same LAI-2050 optical sensor. We did 2 above- and 8 below-canopy readings for each plot. The 8 readings were averaged to each of the sensed plots.
Photosynthesis, LAI and NDVI measurements were taken from 8 to 10 am each time.
Grain yield of each plot was measured by a Sampo Rosenlew SR 2010 plot combine harvester equipped with a Coleman weighing system. It has a 2-m cutting width, so one plot can be harvested in one turn. We took a 2-kg sample from each plot in the combine and used Pfeuffer Granolyser NIR (Pfeuffer, Germany) equipment to determine moisture and protein content of the harvested grains. It uses NIR (near infrared) diode array technology, making 1500 individual scans per sample. The built-in spectrometer scans within the range of 950 to 1540 nm. The equipment was calibrated to barley grains.
Protein yield was calculated using the formula 4:
Protein yield (kg ha−1) = Grain yield (kg ha−1) × Protein content (%)/100
Climatic and weather conditions are continental and often extreme. Figure 1 shows the climatic conditions of the 2019/2020 crop year for the winter barley experiment in Debrecen. Thirty years’ (1981–2010) annual average temperature is 10.3 °C; precipitation is 560.1 mm. The sum of precipitation from September to June was 487.8 mm in 2019/2020 and the 30 years’ average is 444.9 mm, so the sum was higher than the 30 years’ average, but the distribution was uneven. In August, September and October, rainfall was in sum 51 mm less than the 30 years’ average, with temperatures higher than average, as well. The moisture content of the soil was very low around the sowing time and during germination, and the emergence of barley. In October, rain fell only on two days, (4th, 8.3 mm and 6th, 15 mm).
These conditions had a negative effect on the germination and early development of barley plants. In November, the rainfall was double the 30 years’ average and the temperature was notably higher. Winter barley has good adaptability and, due to the beneficial late fall and early winter weather, the varieties were able to compensate for the disadvantageous start. In February and March, the precipitation was higher than the 30 years’ average and it was warmer, so the barley developed well. April and May were very dry, the difference was −55.3 mm in sum compared to the 30 years’ average and there were only three rainy days in April. There were large cracks in the now-dry soil. In June, the rainfall was above the average, 52 mm higher than the 30 years’ average, but this was too late to aid the growth and development of the barley.
We analyzed and evaluated the data of experimental results with the IBM SPSS 22.0 (IBM Corp. Chicago, IL, USA) statistical software package using a GLM model to compare the means, with options of descriptive statistics and LSD post hoc tests, Pearson correlation analysis (2-tailed) to test the linear connections and MS Excel 2013 software to calculate natural logarithmic regression functions in analysis of assimilation rate light responses.

3. Results

In this study, we analyze photosynthetic, assimilation performance of barley cultivars and the relationship of these parameters with the other measured and calculated data, such as NDVI value, LAI, height, grain yield, protein content and protein yield. The analyses were based on the measurements made in the field in three developing stages in the growing season. First, we evaluate the assimilation parameters of the barley cultivars, then examine whether there are connections between assimilation parameters and yield and its quality.

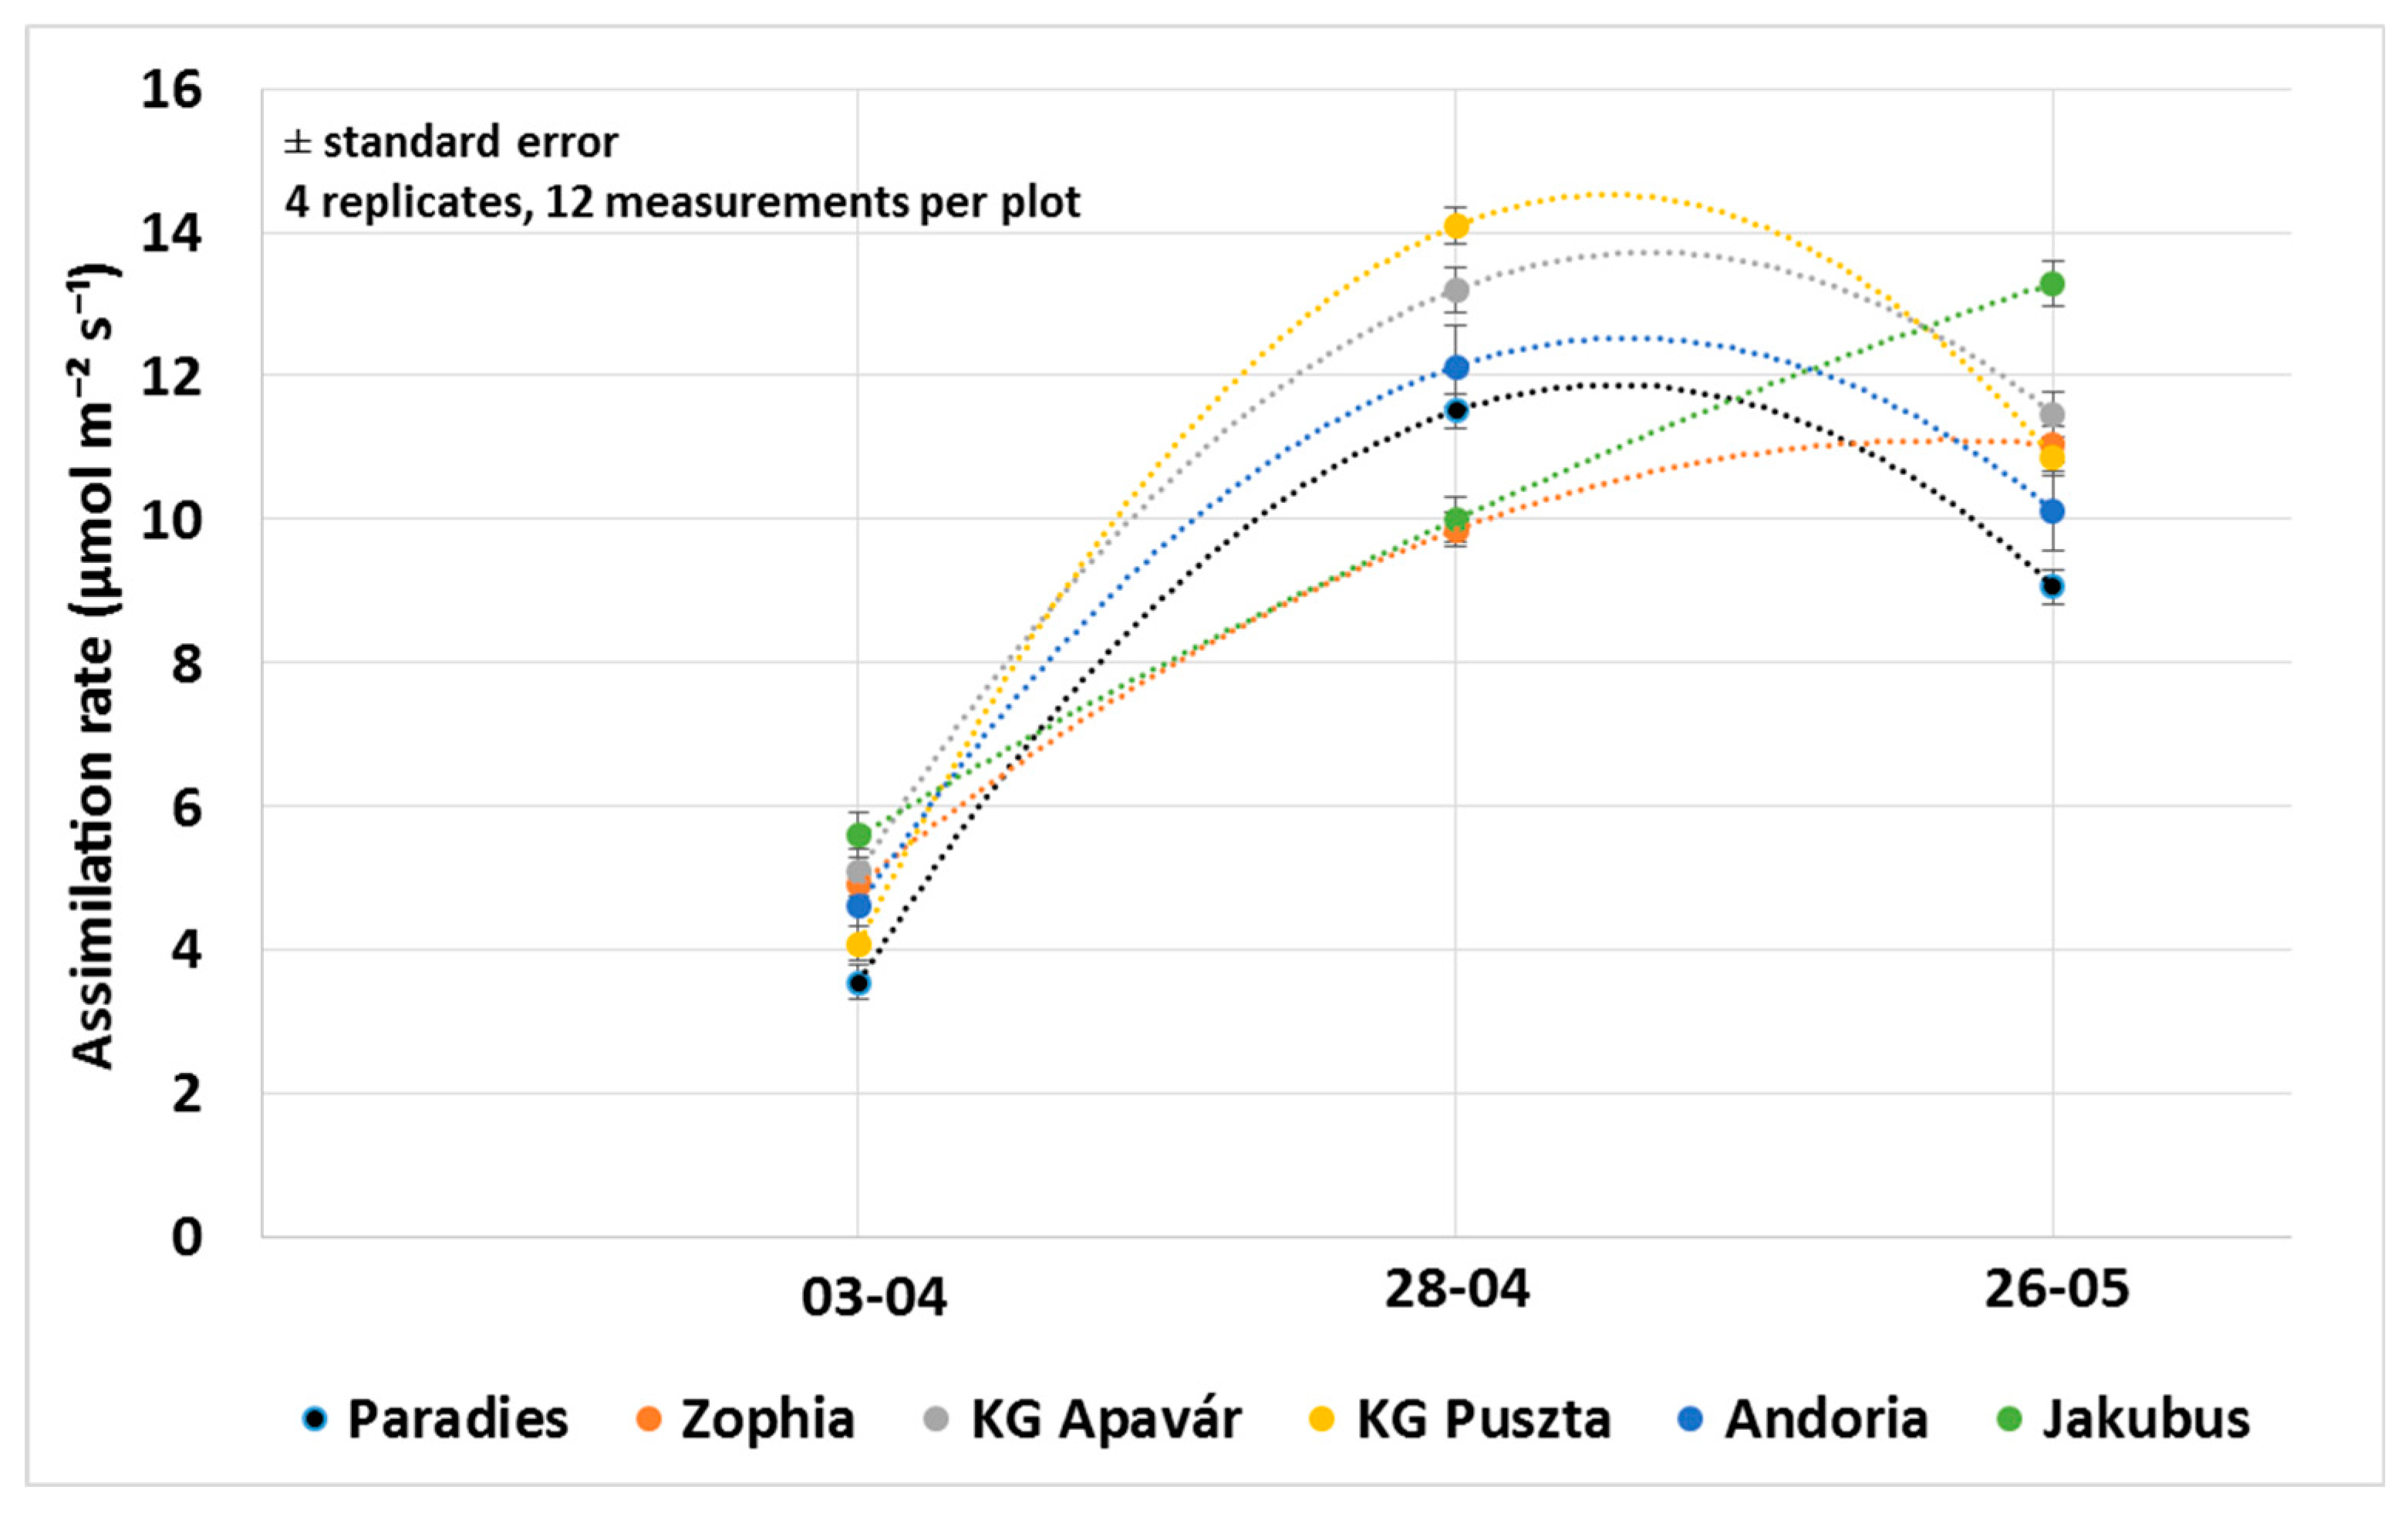
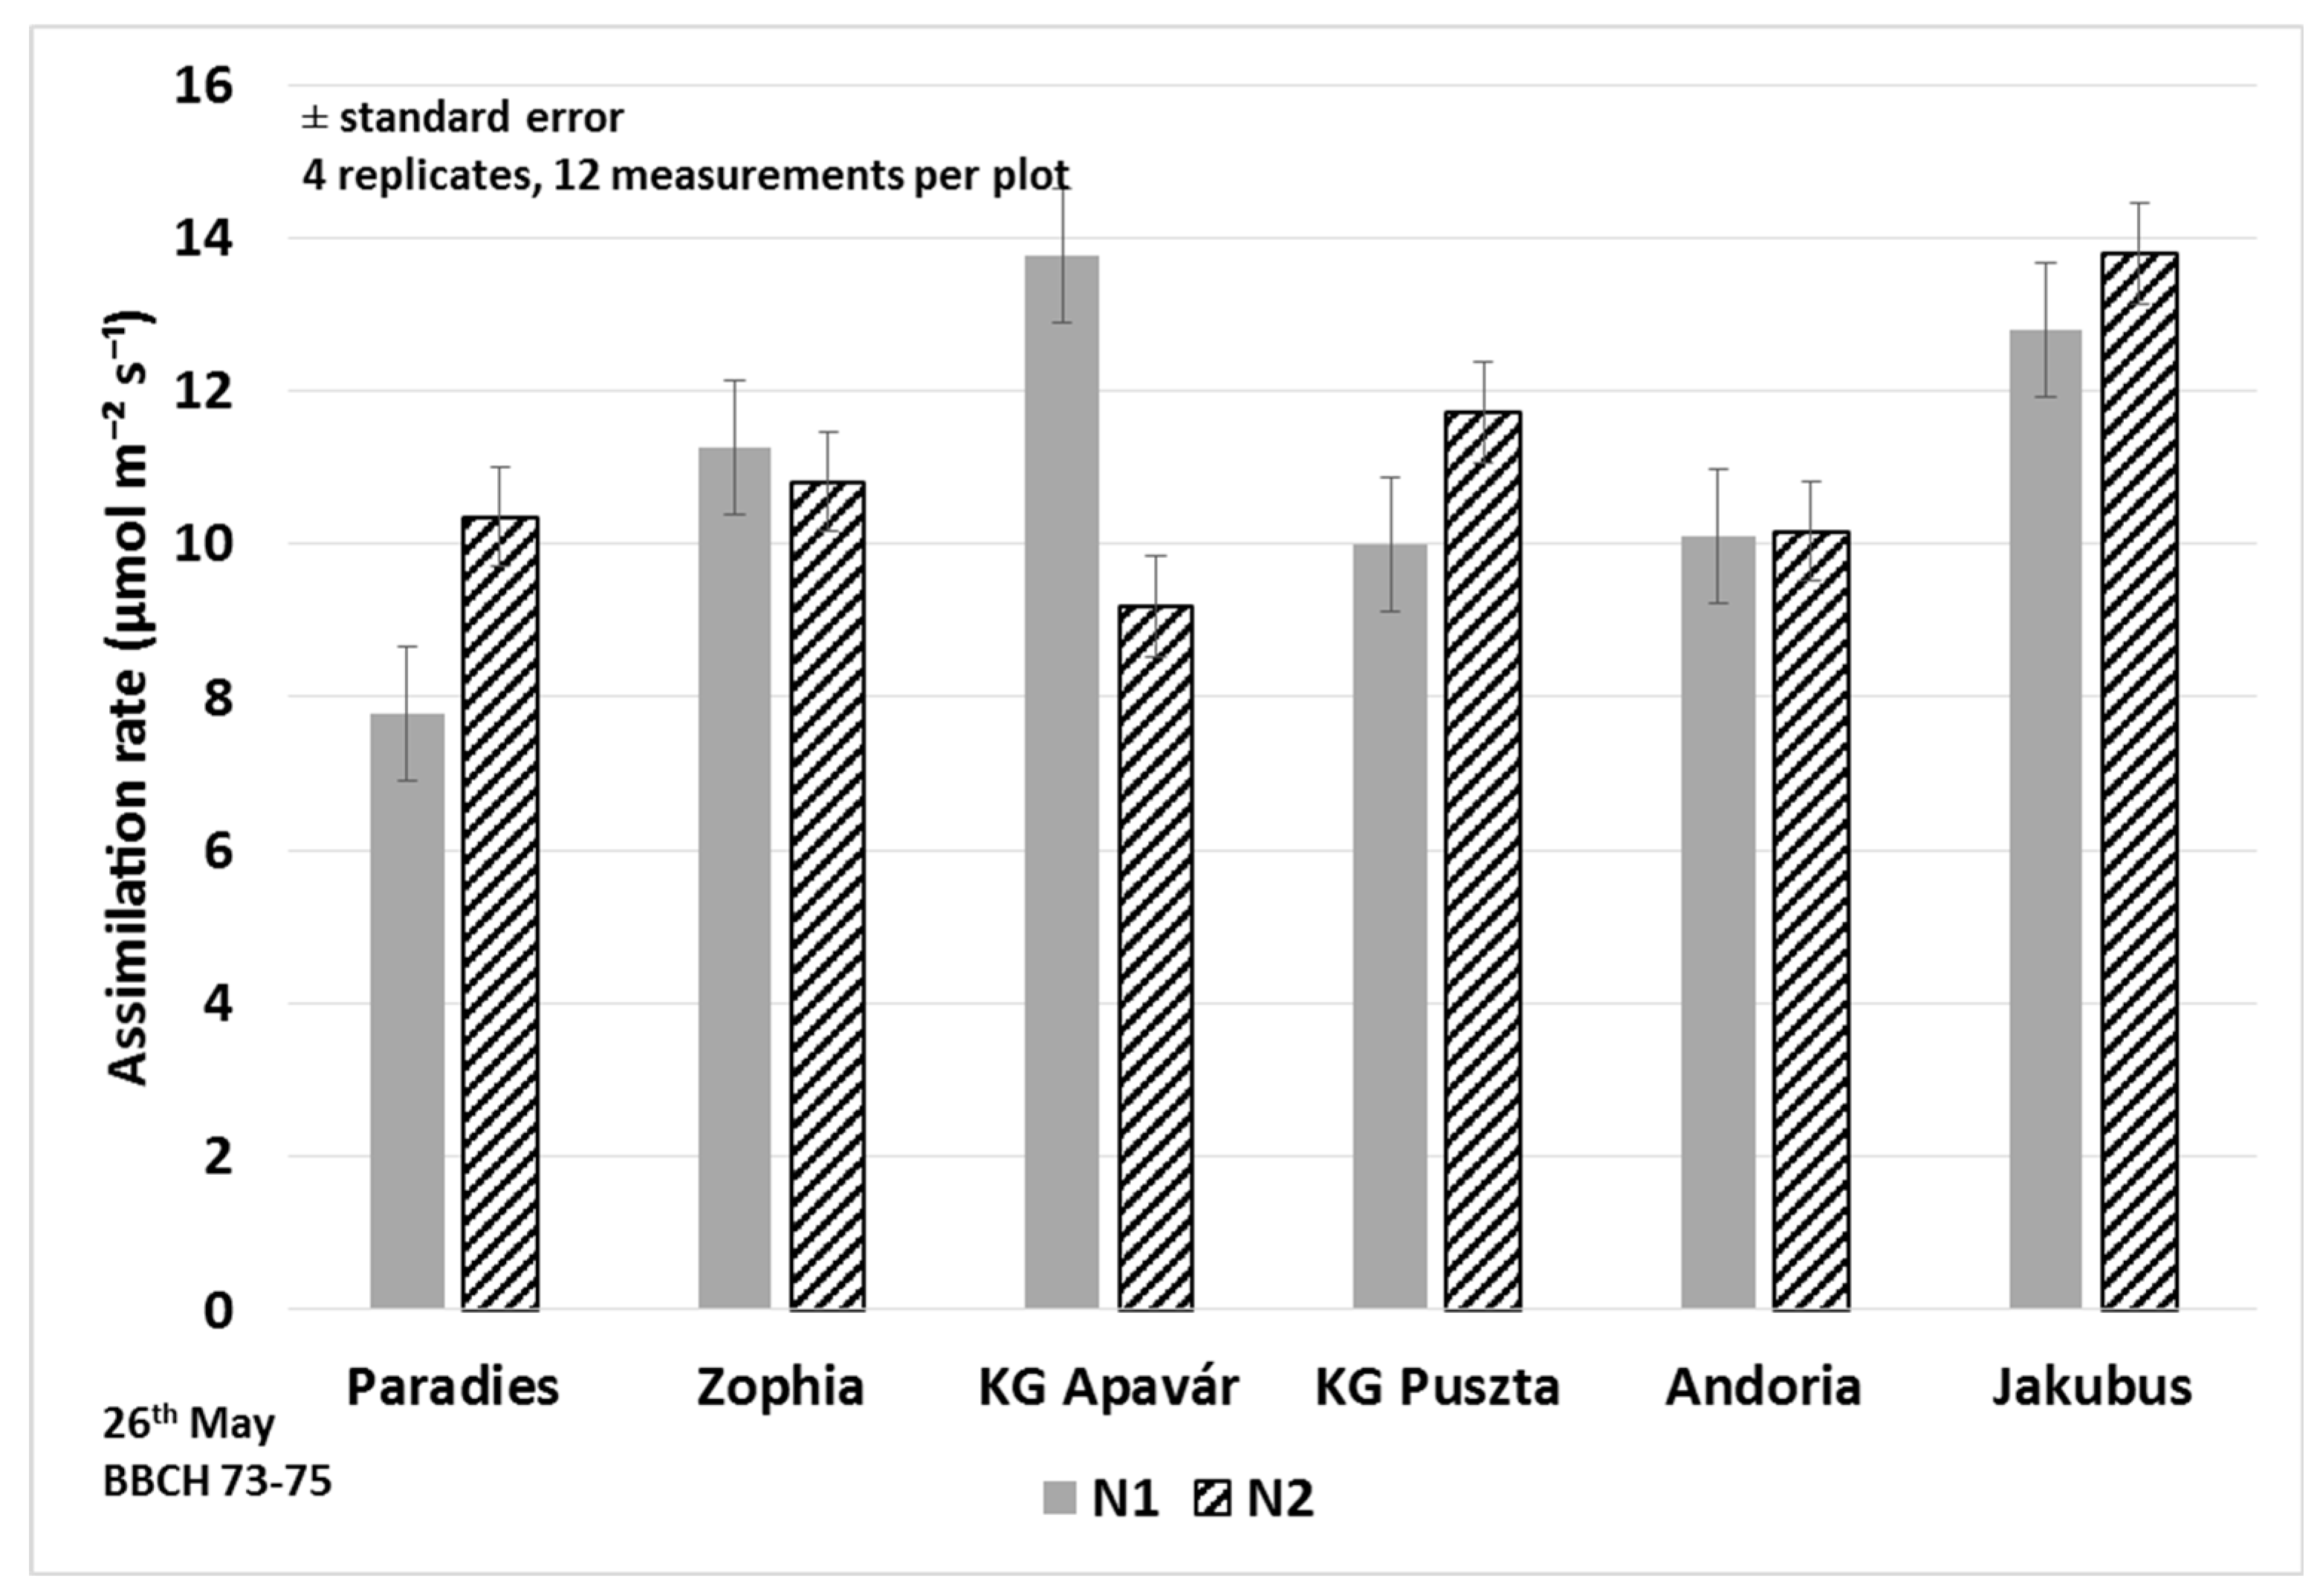
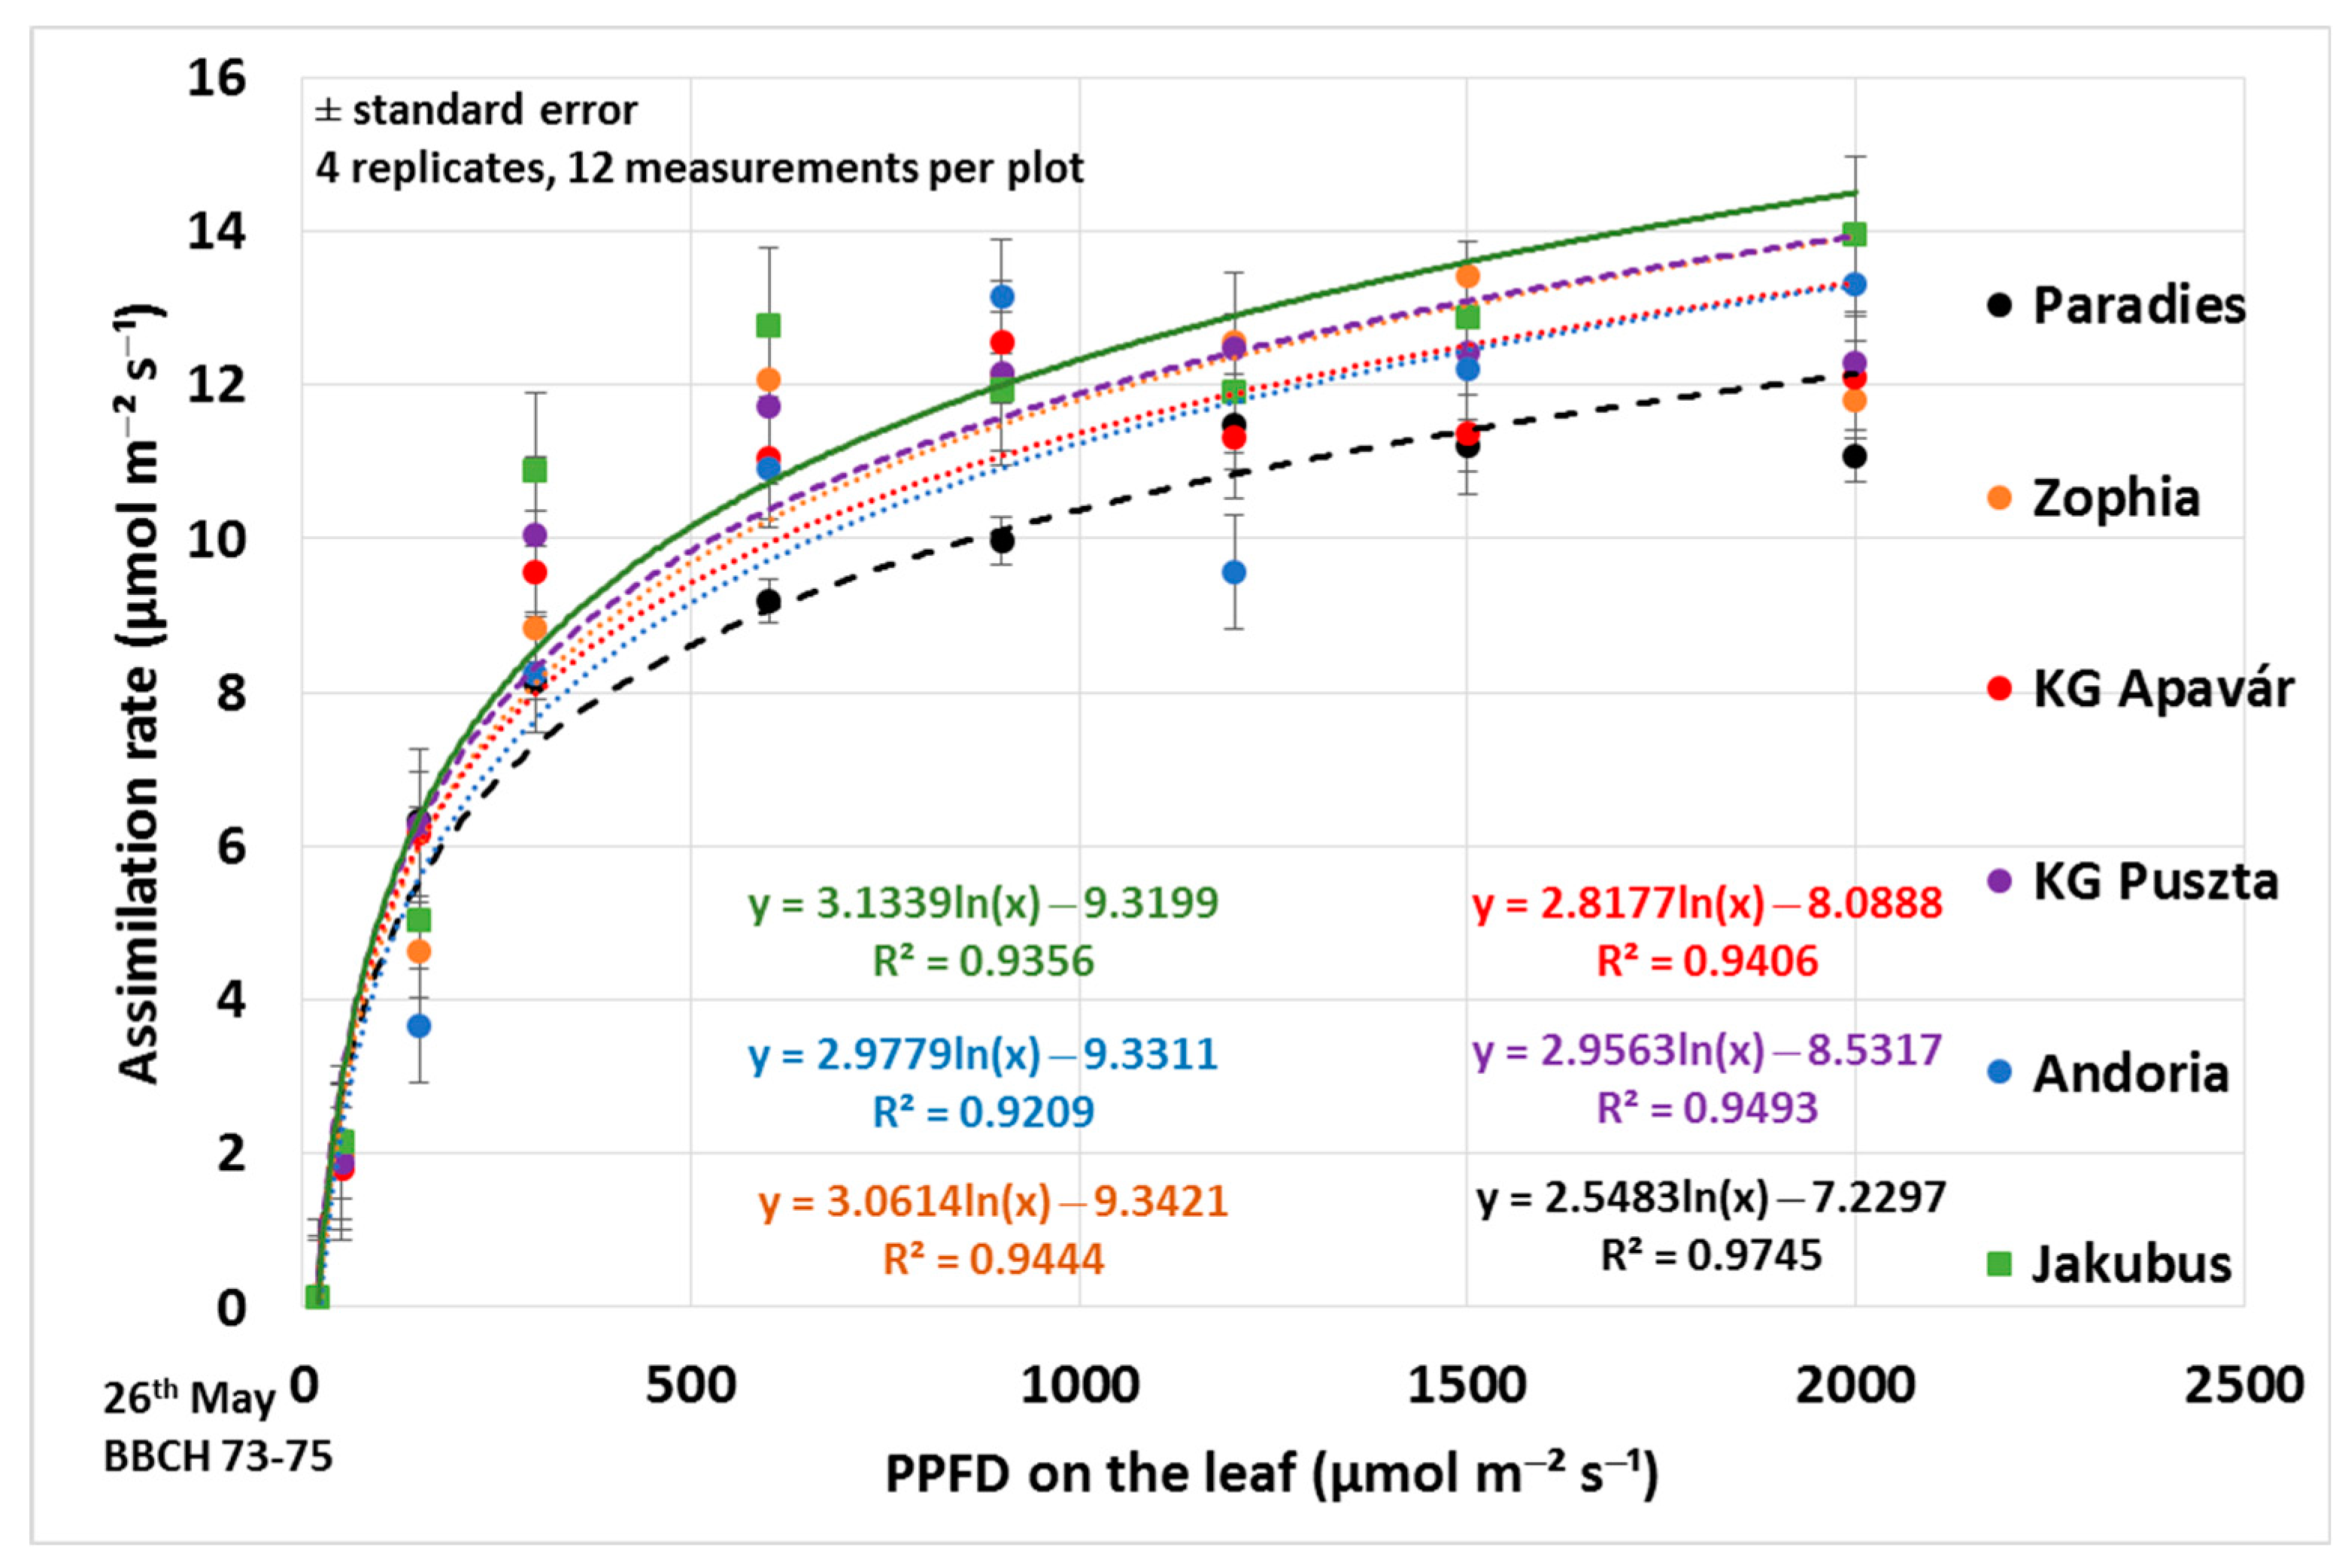
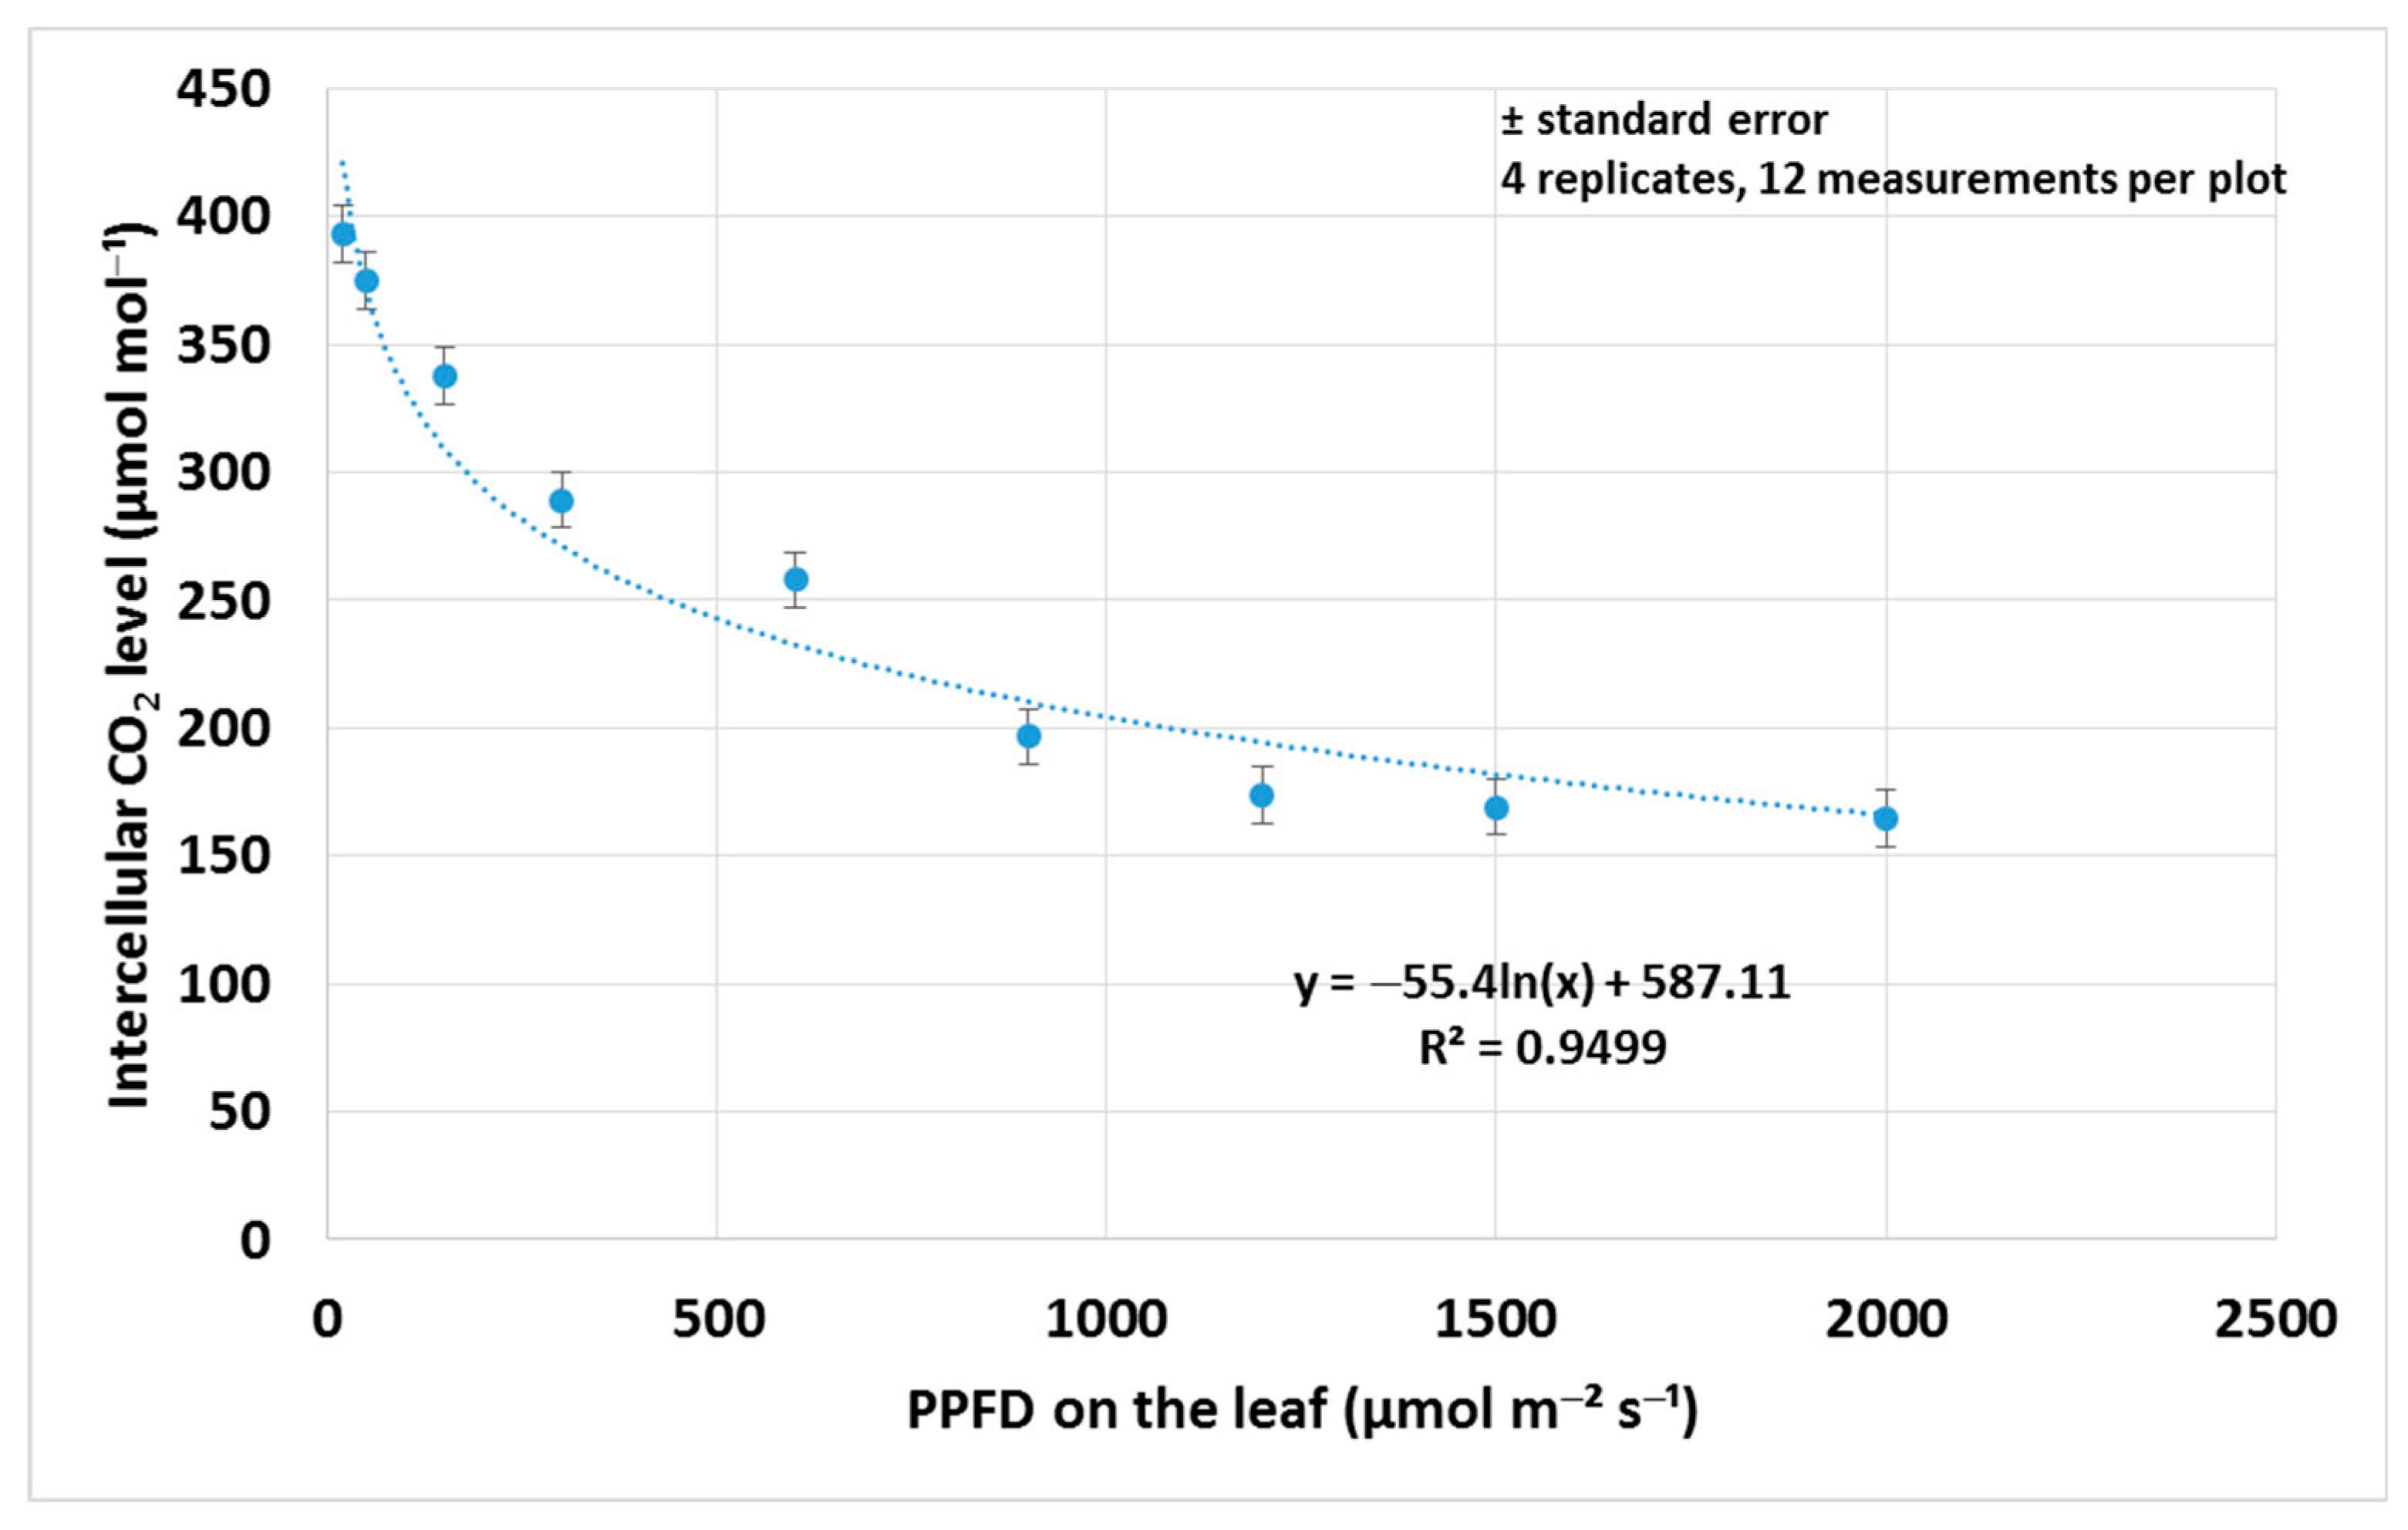
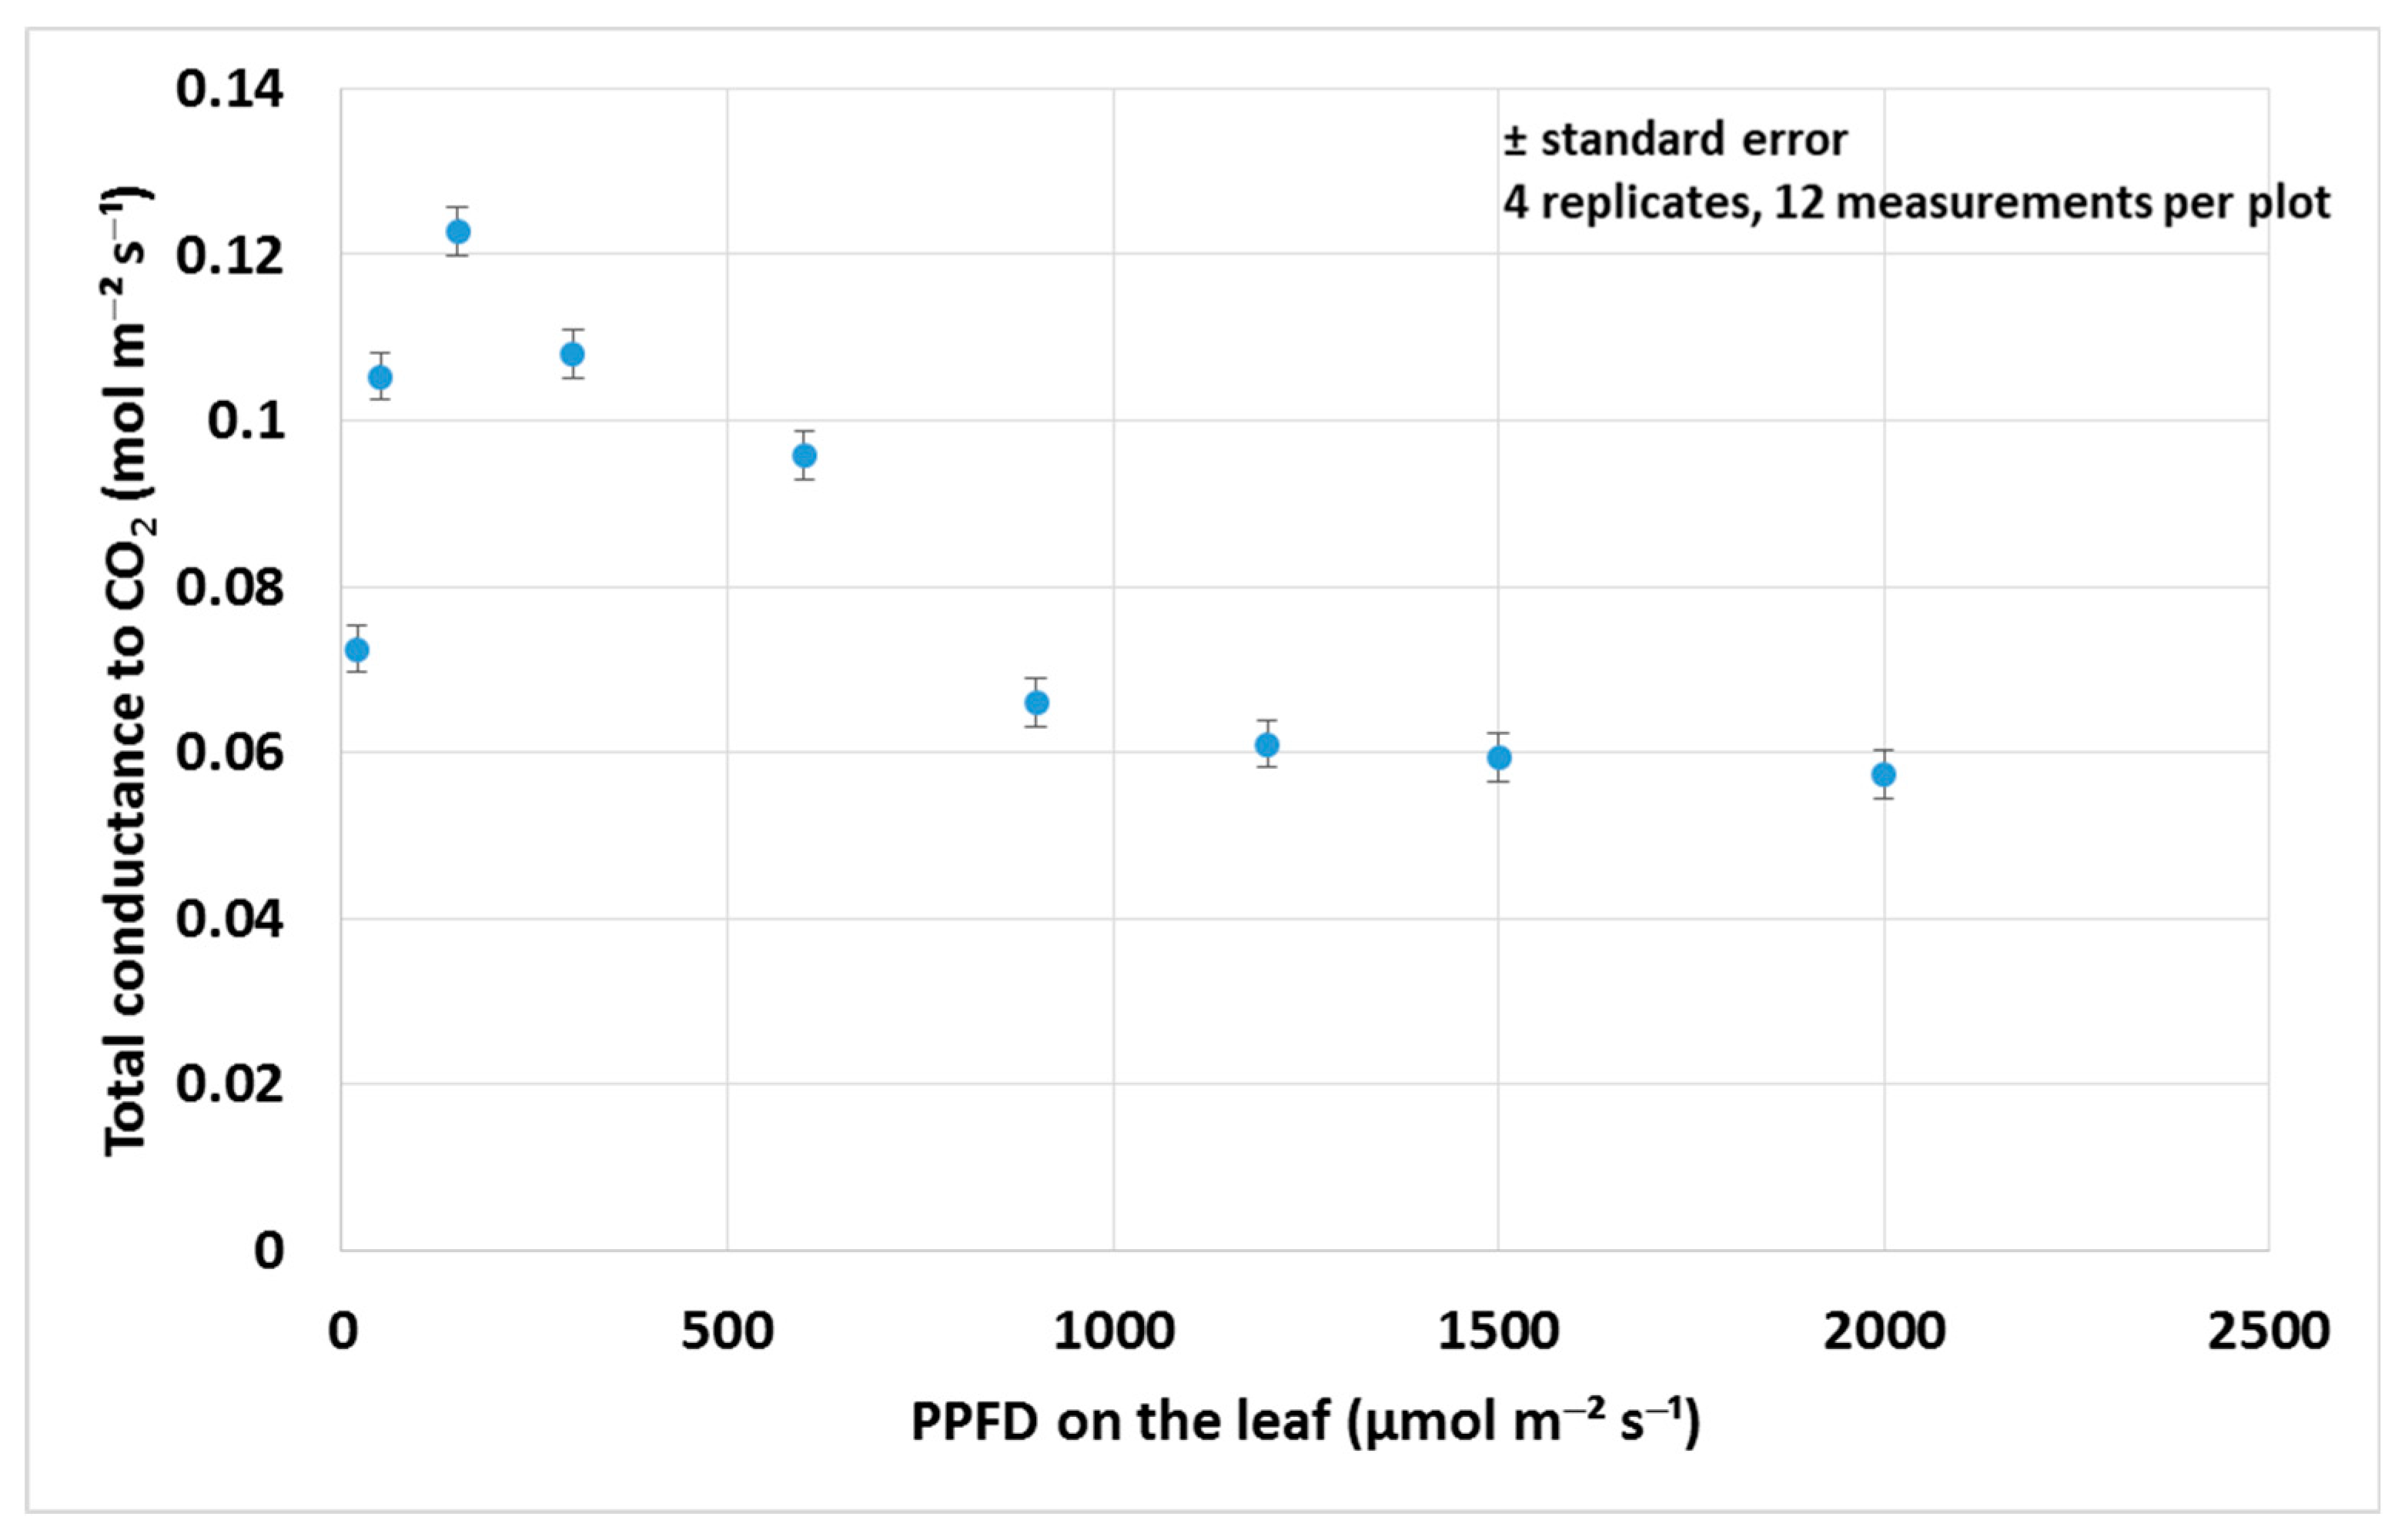
3.1. Assimilation Parameters

We detected changes in the assimilation rate of the winter barley cultivars during the growing season. Of course, these are actual values, but we can compare the varieties to each other at different dates. The differences among the varieties were significant (p < 0.05). Highest values were measured on 28 April (BBCH 47–49), except for Jakubus and Zophia, where the highest values were on 26 May (BBCH 73–75) (Figure 2). The changes varied by genotype, but curves run fairly likewise in Paradies, KG Puszta, Andoria and KG Apavár. Jakubus has the highest value among the varieties on 3 April and 26 May, but the second lowest on 28 April. Its assimilation rate changed near linearly in the whole growing season, while the others’ rates slightly decreased after 28 April.
The experiment has demonstrated that N fertilization caused not significant differences in assimilation rate (p = 0.90) in general, but as Figure 3 shows the cultivars had varying reactions. Paradies, KG Puszta and Jakubus had higher assimilation rates at higher N levels, while Zophia and KG Apavár had lower rates, and the photosynthesis of Andoria did not change. The discrepancy in KG Apavár was −4.58 µmol m−2 s−1. KG Apavár is an extensive variety and cannot tolerate the higher N doses. The difference was significant in three varieties (KG Apavár, KG Puszta and Paradies) at p = 0.05 level, but in general the differences were not statistically significant, because the varying reactions of the cultivars.
We found weak correlation between transpiration and assimilation rate (r = 0.297, p = 0.04) on 28 April and a strong relationship between these two parameters on 26 May (r = 0.662, p < 0.01). There was no correlation at the first date, 3 April, according to the findings (r = 0.077, p = 0.60). Total conductance to water vapor was determined mainly by the stomatal conductance to water, since the correlation coefficient was 0.992 (p < 0.01) with it and 0.047, (p = 0.75) with boundary layer conductance to water vapor (Table 3).
We calculated the water use efficiency (WUE) of each involved cultivar. WUE varied from 24.78 to 61.29 g CO2 kg−1 H2O, according to the variety. The genotypes exhibited significant differences (p < 0.001).
We recorded light response curves of the genotypes with decreasing photon flux density in 9 steps. As Figure 4 shows, the six cultivars’ assimilation rates were similar at the low PPFD levels, but there are differences at higher light levels. The natural logarithmic regression functions fit well to the measured data points (R2: 0.9209–0.9745). The excellent fit is reflected in how clearly the curves delineate the differences. The assimilation rate did not differ significantly among the varieties at the PPFD levels in general, but pairwise comparison showed significant difference in some cases. Highest values were shown by Jakubus, then KG Puszta and Zophia. The curve of Paradies ran lower than that of the others at every photon flux density level. Assimilation rate of all the barley varieties fell rapidly below 300 µmol m−2 s−1 PPFD light levels, but it ranged between 1.81 and 2.17 µmol CO2 m−2 s−1 even at 50 µmol m−2 s−1 PPFD. Above 900 µmol m−2 s−1 light intensity, the changes were not significant between the PPDF levels, due to the effect of photorespiration on the assimilation rate.
We summed the assimilation rate values of the nine PPFD levels of each cultivar, in order to test the correlation with the yield. A strong positive linear correlation between the sum values and the yield (r = 0.864) was found and it was significant, at p = 0.05 level.
Intercellular CO2 level in barley leaves was reduced as light intensity increased. The change was especially expressed from 20 to 900 µmol m−2 s−1 PPFD levels; values decreased from 393.08 µmol mol−1 to half (196.65 µmol mol−1) of the ambient CO2 concentration (399.97 µmol mol−1). Higher light levels induced changes in photosynthesis system of the plants and resulted in low intercellular CO2 concentration (764.89−173.93 µmol mol−1); the stomata were closed because of stress (Figure 5). The natural logarithmic regression function fits well (R2: 0.9499). Total conductance to CO2 showed a different curve. It increased between 20 and 150 µmol m−2 s−1 PPFD from 0.073 to 0.123 mol m−2 s−1, but decreased between 150 and 2000 µmol m−2 s−1 PPFD from 0.123 to 0.057 mol m−2 s−1, although the change was significant above 900 µmol m−2 s−1 PPFD levels, as stomata on the leaves were closed (Figure 6).
Pearson correlation analysis was used to test whether a statistically significant linear connection exists between photosynthetically active radiation (PAR) and assimilation parameters. The results of the analysis (Table 4) showed PAR a very strong positive linear correlation with the assimilation rate (r = 0.764), very strong negative correlation with intercellular CO2 level (r= −0.921), temperature difference between air and leaf (r = −0.996), total conductance to CO2 (r = −0.765) and electron transport rate (r = −0.970). The connection was moderate with CO2 assimilation efficiency (r = 0.357), in a positive direction. We also found a very strong linear relationship between the intercellular CO2 level and assimilation rate (r = −0.931) in the negative range, between the intercellular CO2 level and the electron transport rate (r = 0.903), with the temperature difference of air and leaf (r = 0.885) in a positive direction.
The correlation coefficients pointed to very strong positive connection between efficiency of the PS2 system, transpiration (r = 0.788) and total conductance to CO2 (r = 0.949). According to the stomata opening, we expected close relationships between total conductance and some assimilation parameters. The analysis proved a connection to intercellular CO2 level (r = 0.688), temperature difference of air and leaf (r = 0.790), electron transport rate (r = 0.776) and transpiration (r = 0.727), respectively.

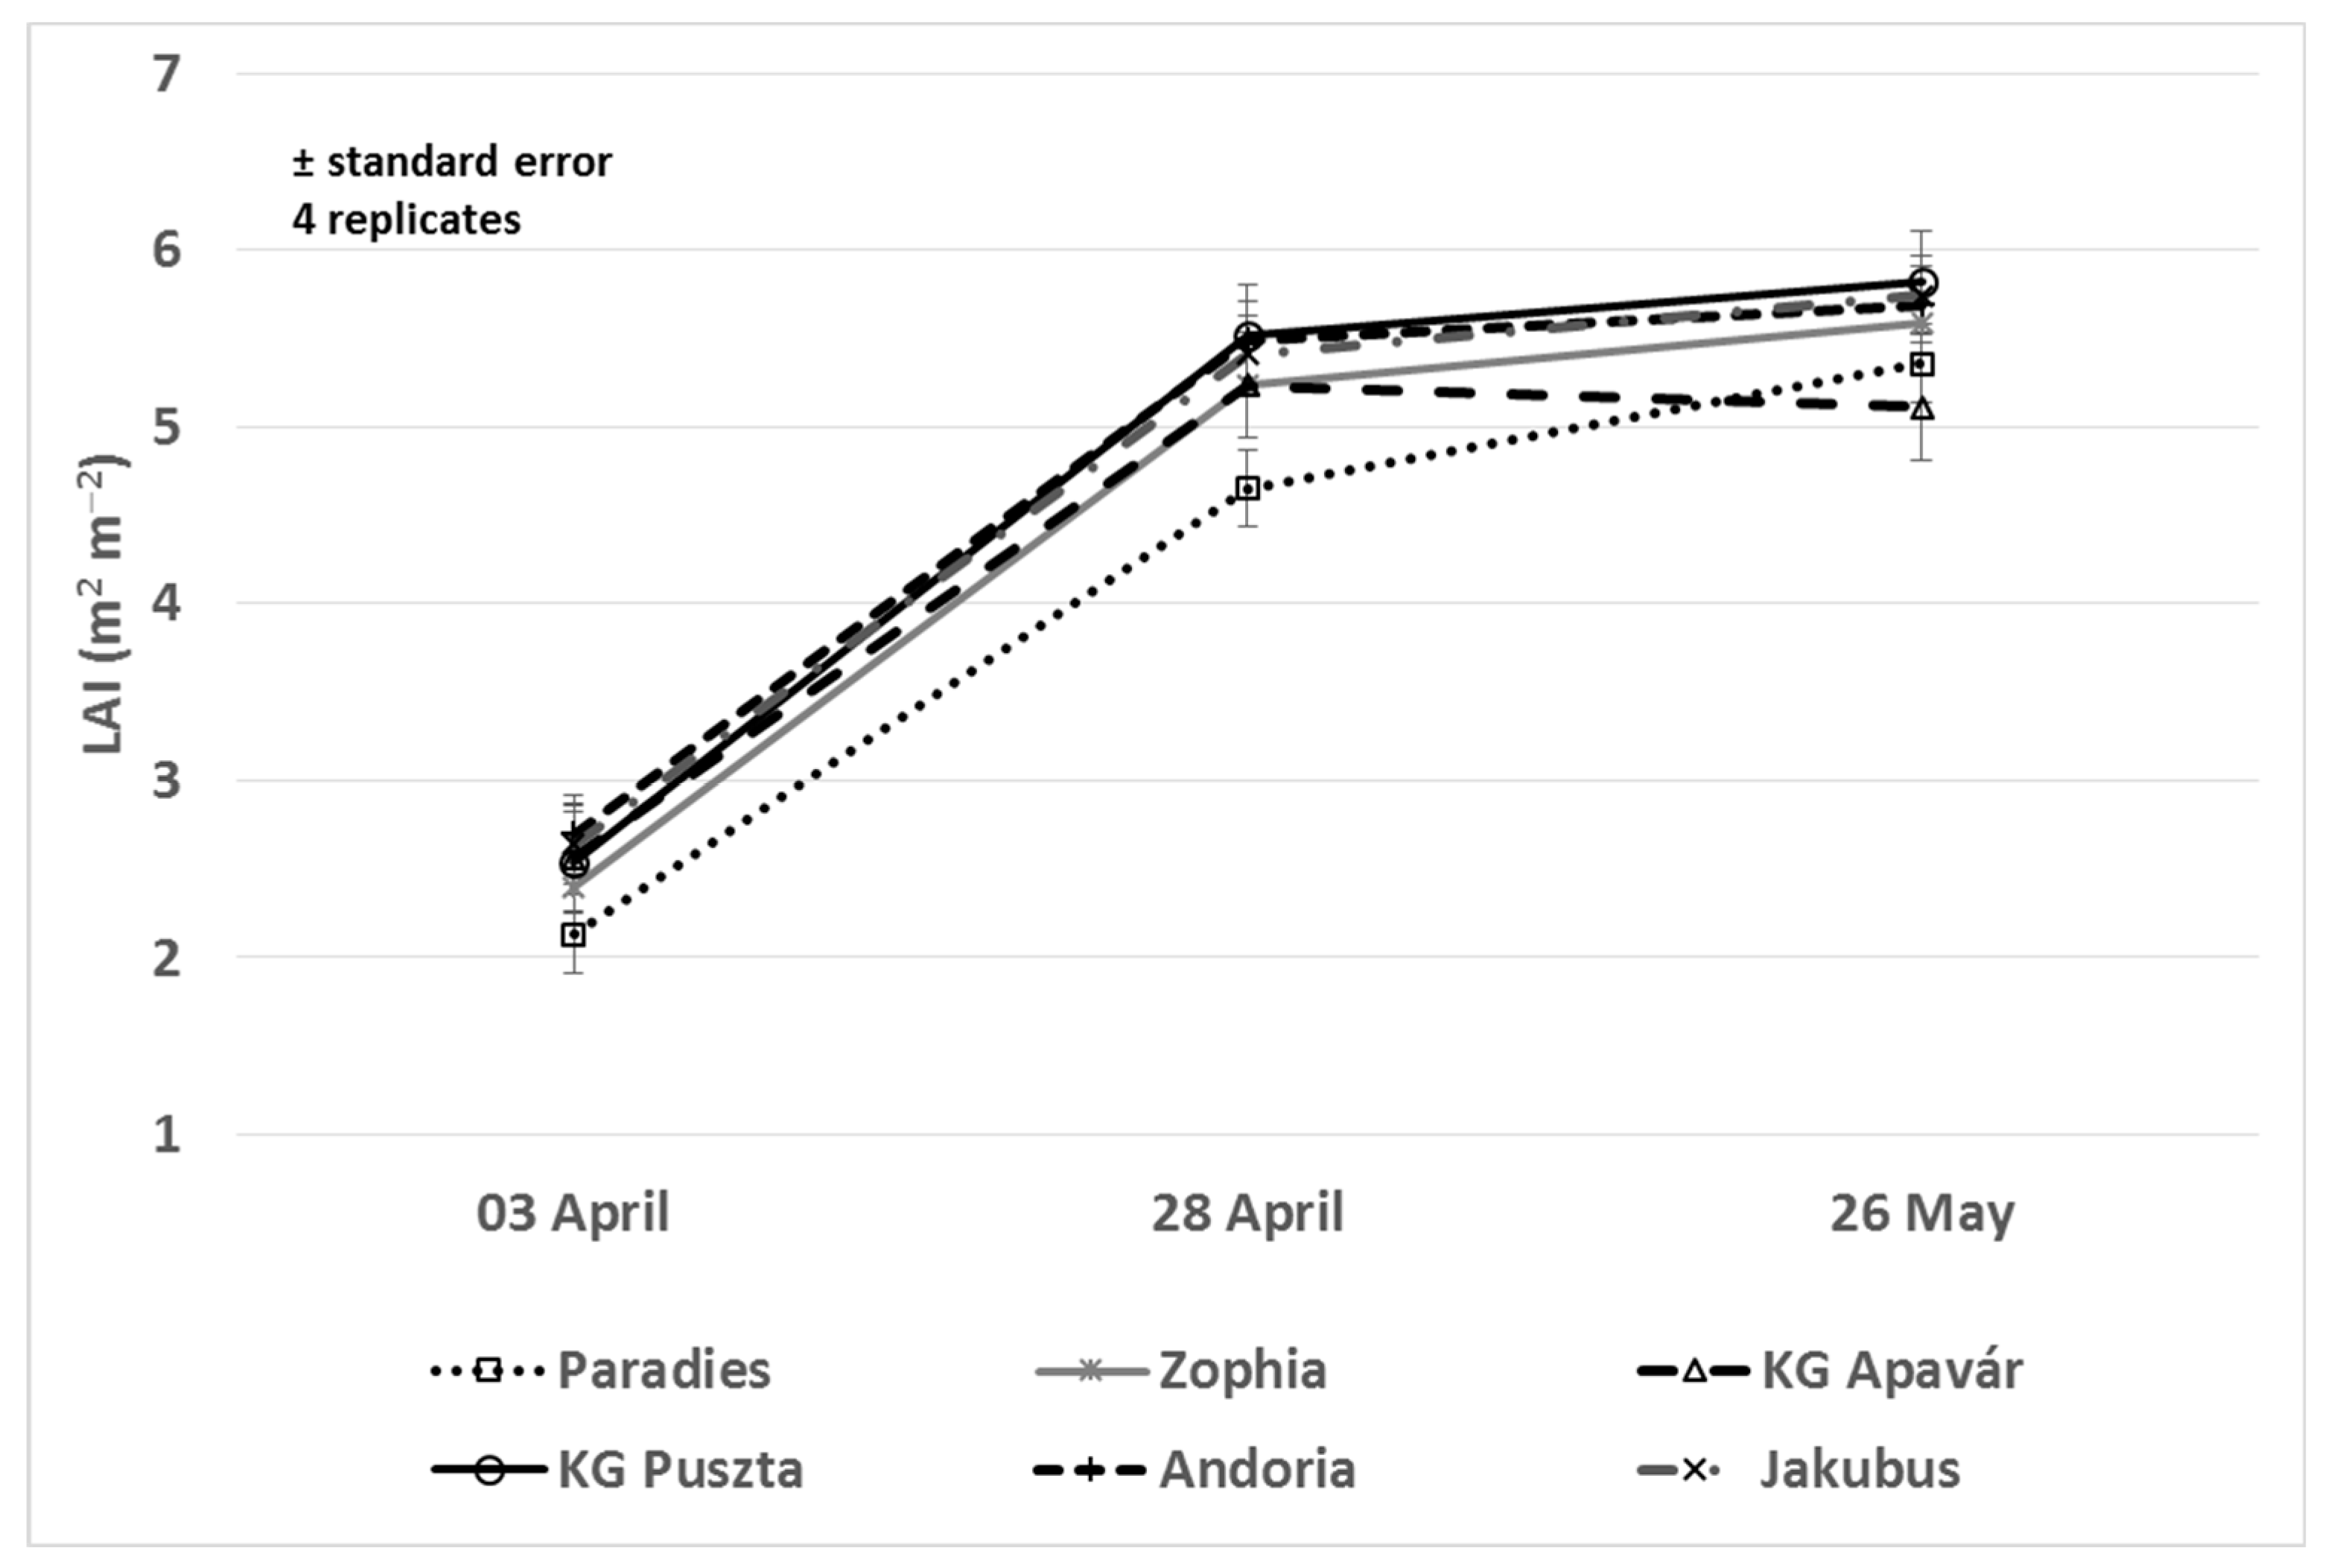
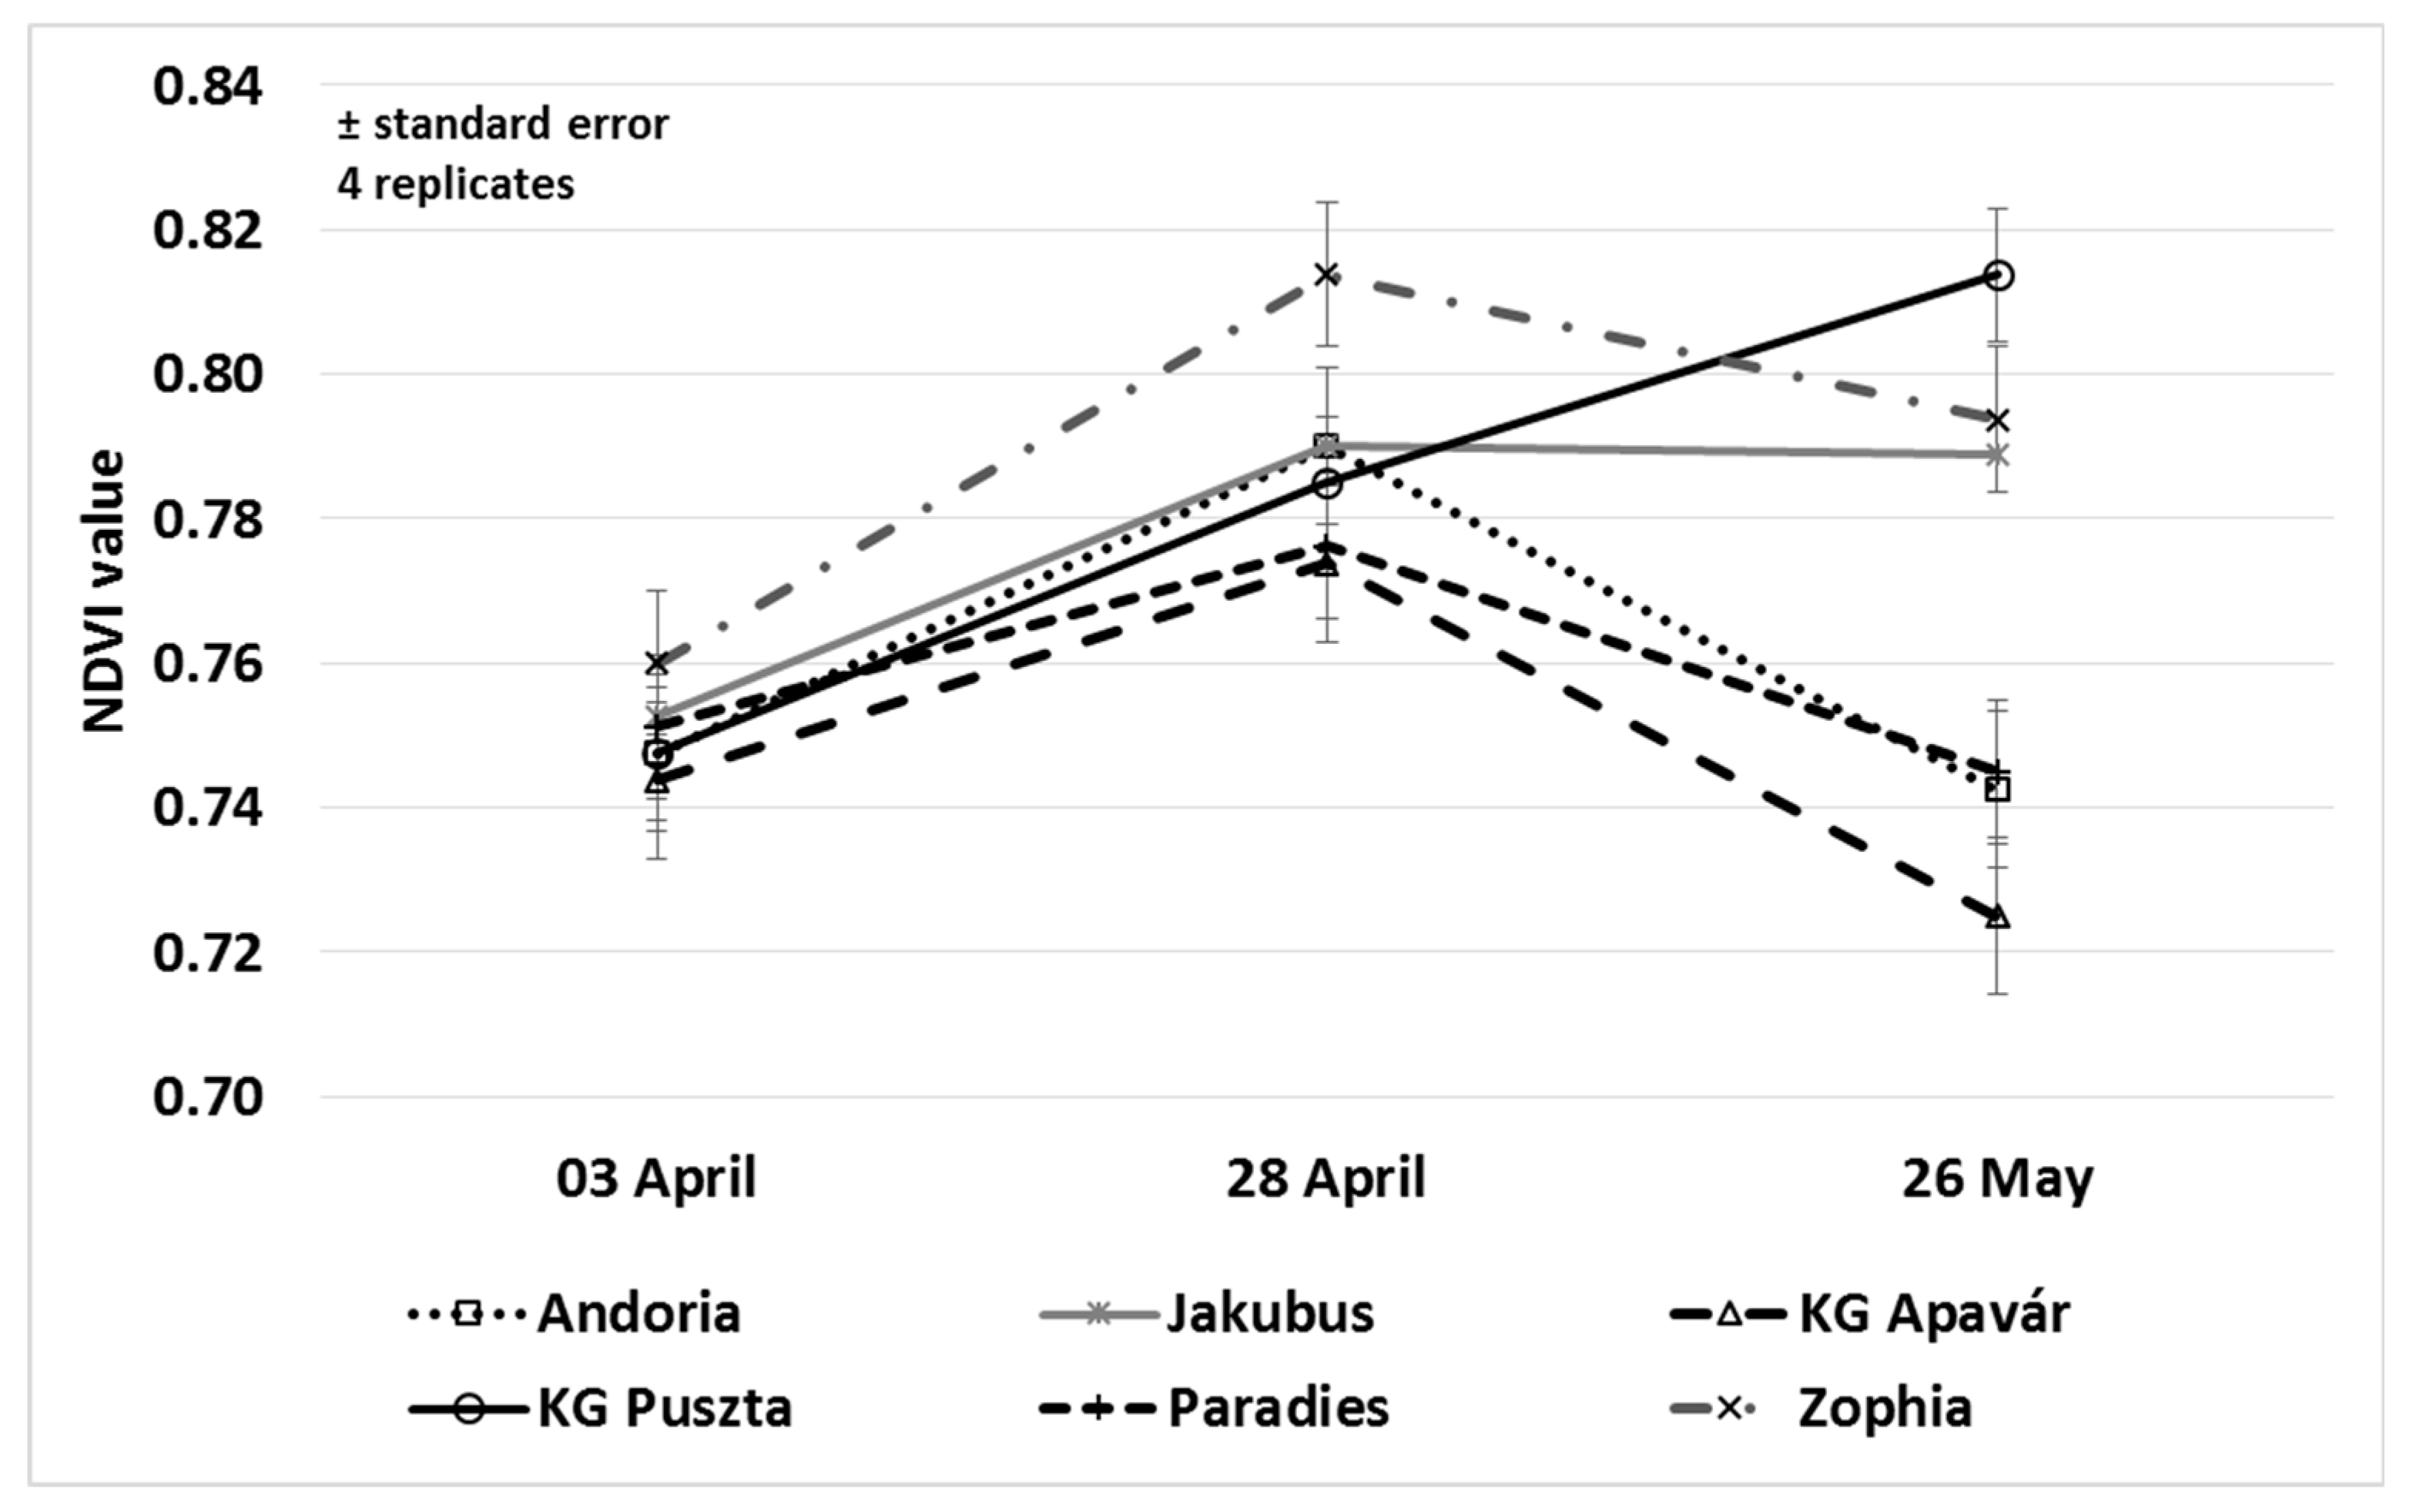
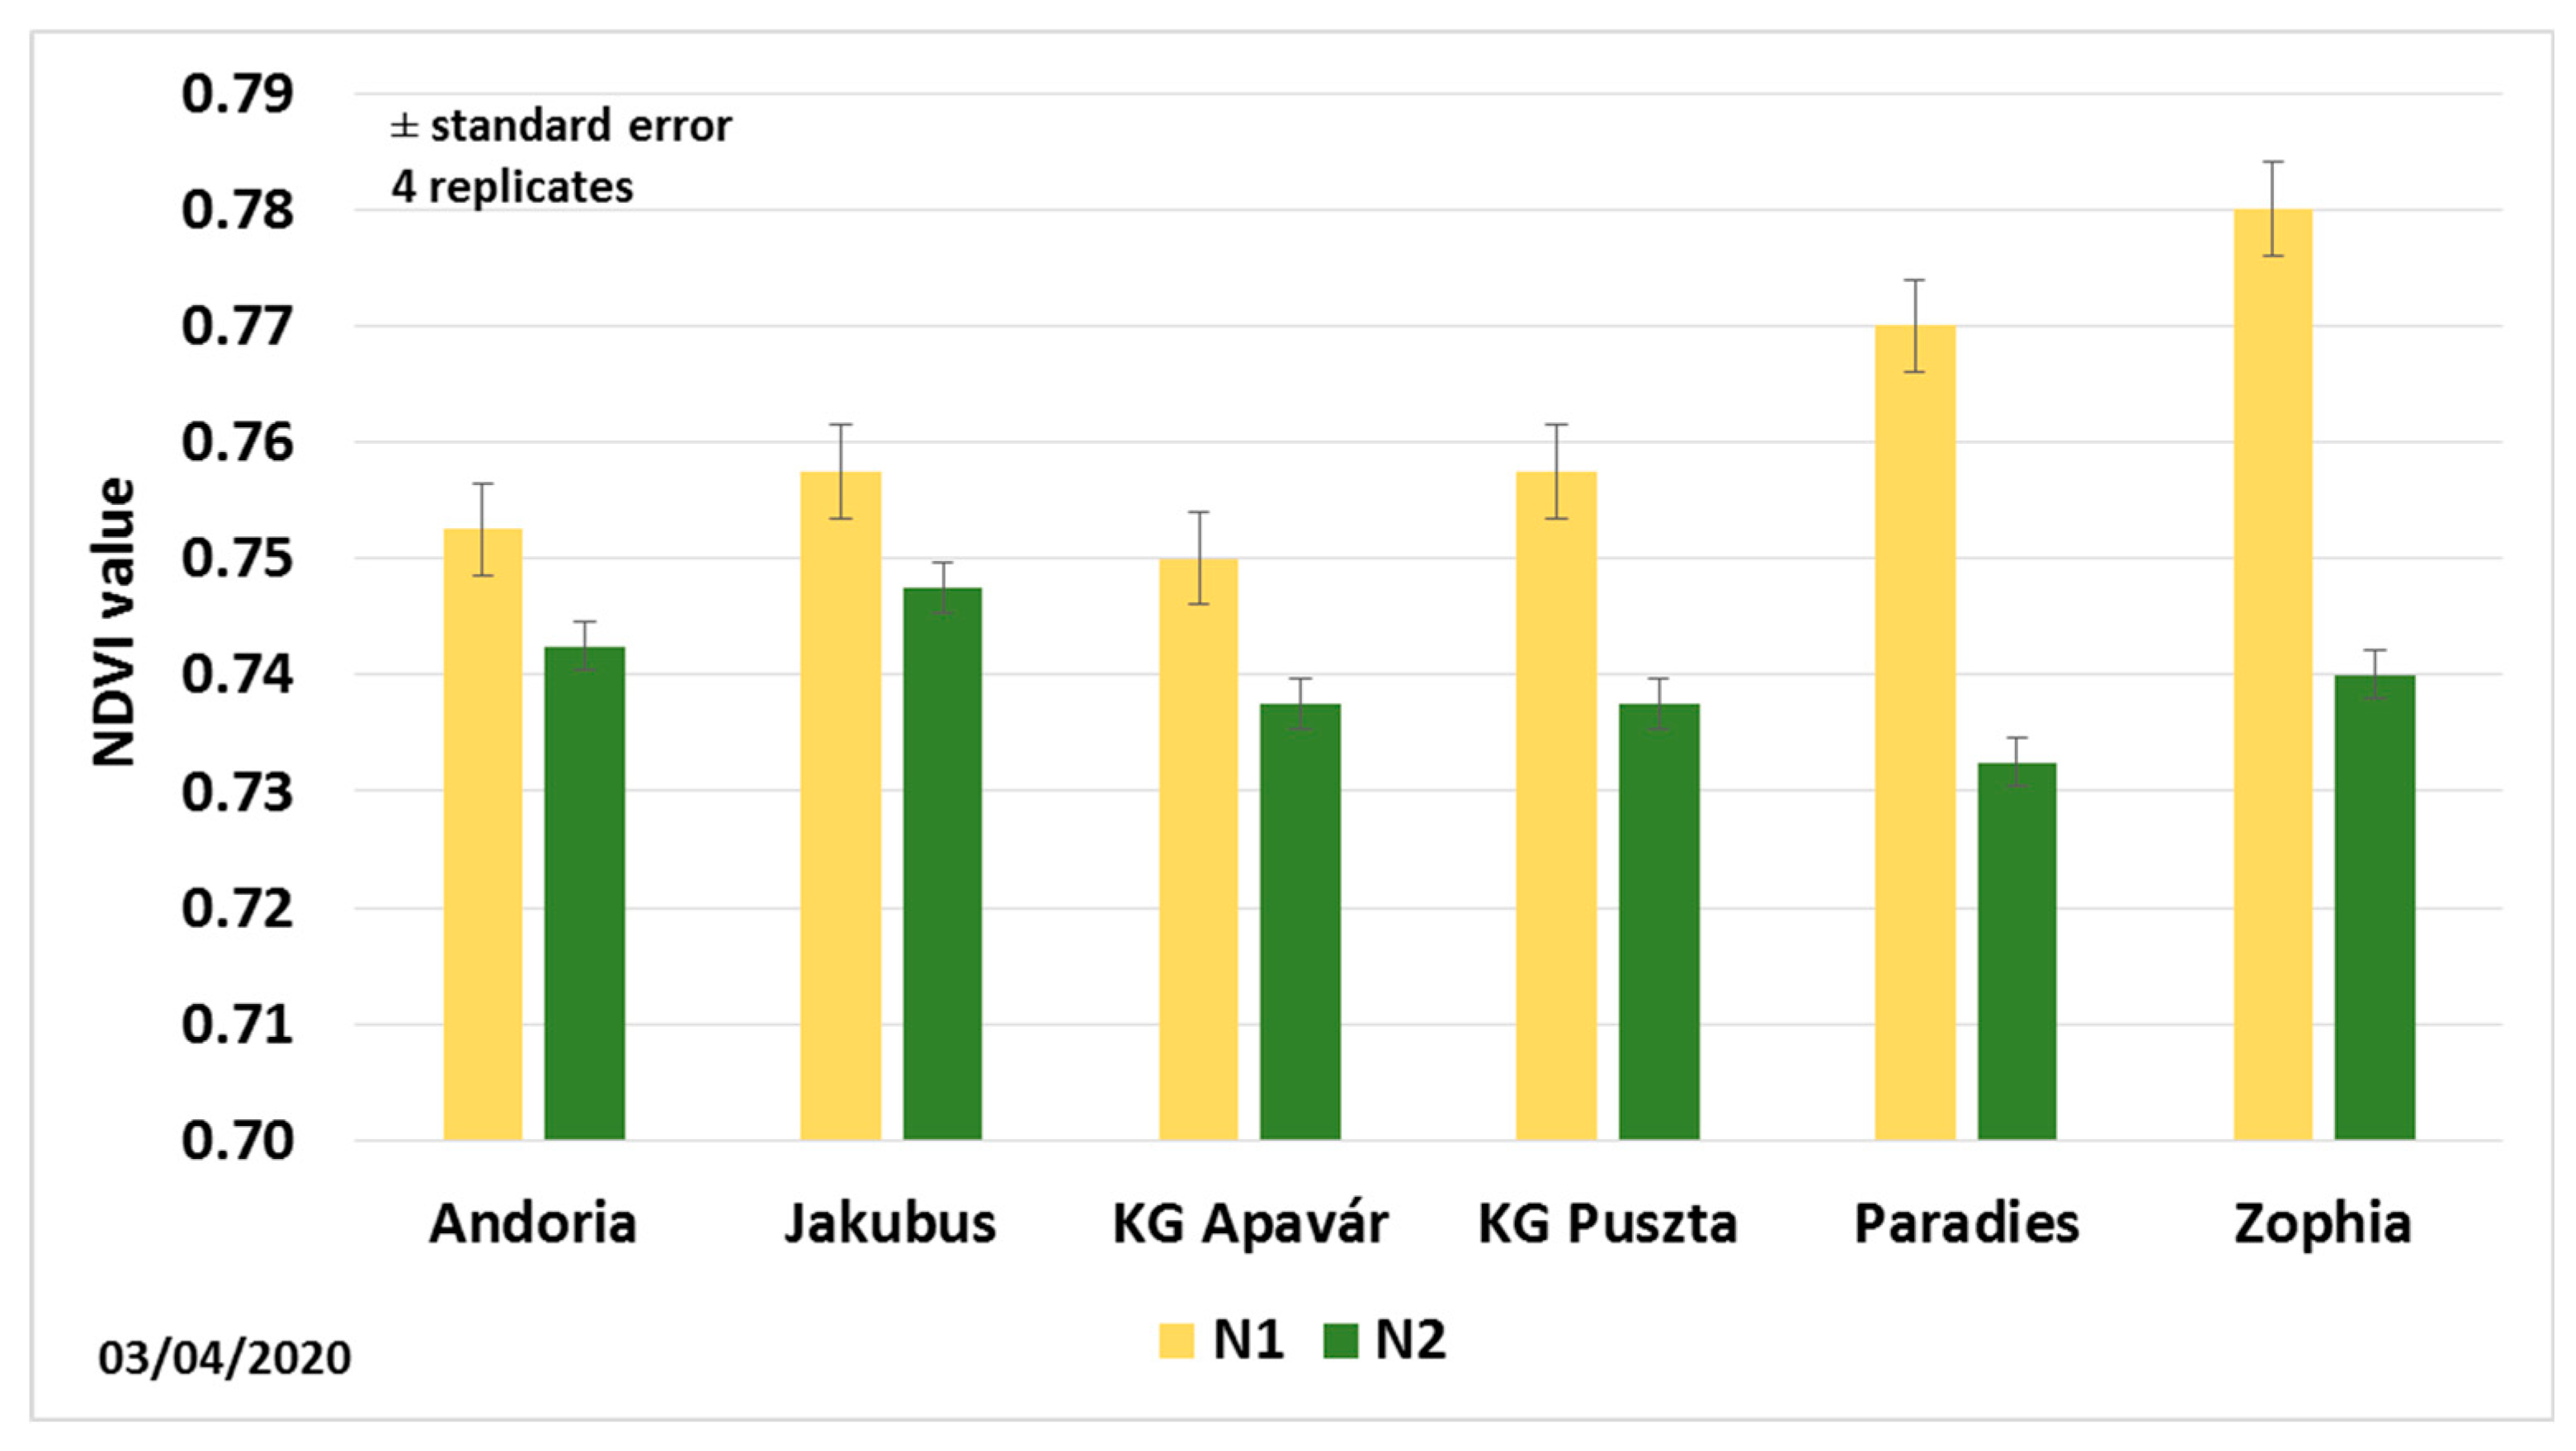
3.2. Leaf Area and NDVI Values

Leaf area index was measured three times in the growing season in each plot. Statistical analysis did not prove significant differences among the varieties on any date. Highest values were registered on 26 May, from 5.11 to 5.82 m2 m−2 depending on the cultivar (Figure 7). Leaf area development of barley plants almost was complete by 28 April (BBCH 47−49), it changed on average by 0.3 m2 m−2 afterwards. Leaf area formation time was somewhat diverse, but correlation analysis showed a strong to very strong significant relationship (r= 0.663−0.759, p < 0.001) among the LAI values of the different dates in the varieties.
The results of NDVI measurements showed differences between the cultivars on each of the three dates. On 3 April (BBCH 27−29), the discrepancies were not significant statistically, the variations were from 0.748 to 0.760. On 28 April (BBCH 47−49), only the NDVI value of Zophia (0.814) was higher significantly, compared to other cultivars (0.774−0.790). On 26 May, NDVI data showed significant differences among the varieties (p < 0.001). NDVI values of KG Puszta grew continuously in the growing season (0.748, 0.785, 0.814). The other five varieties had highest values on 28 April and these values decreased after that date (Figure 8). The KG Apavár variety had the lowest values in all of the three measurements (0.744, 0.774, 0.725).
We also investigated the effect of N supply on the NDVI values. The results on 3 April differed from our expectations, as Figure 9 shows the plots under higher N fertilization had lower NDVI values. The difference was statistically significant at p = 0.05 level in all varieties. Later in the season, the 60 kg ha−1 plus nitrogen dose had an effect on the NDVI data and we measured on average 0.0046-higher NDVI values in the N2 treatment plots. The difference varied from −0.015 (Paradies) to 0.028 (Jakubus), depending on the variety (Table 5).

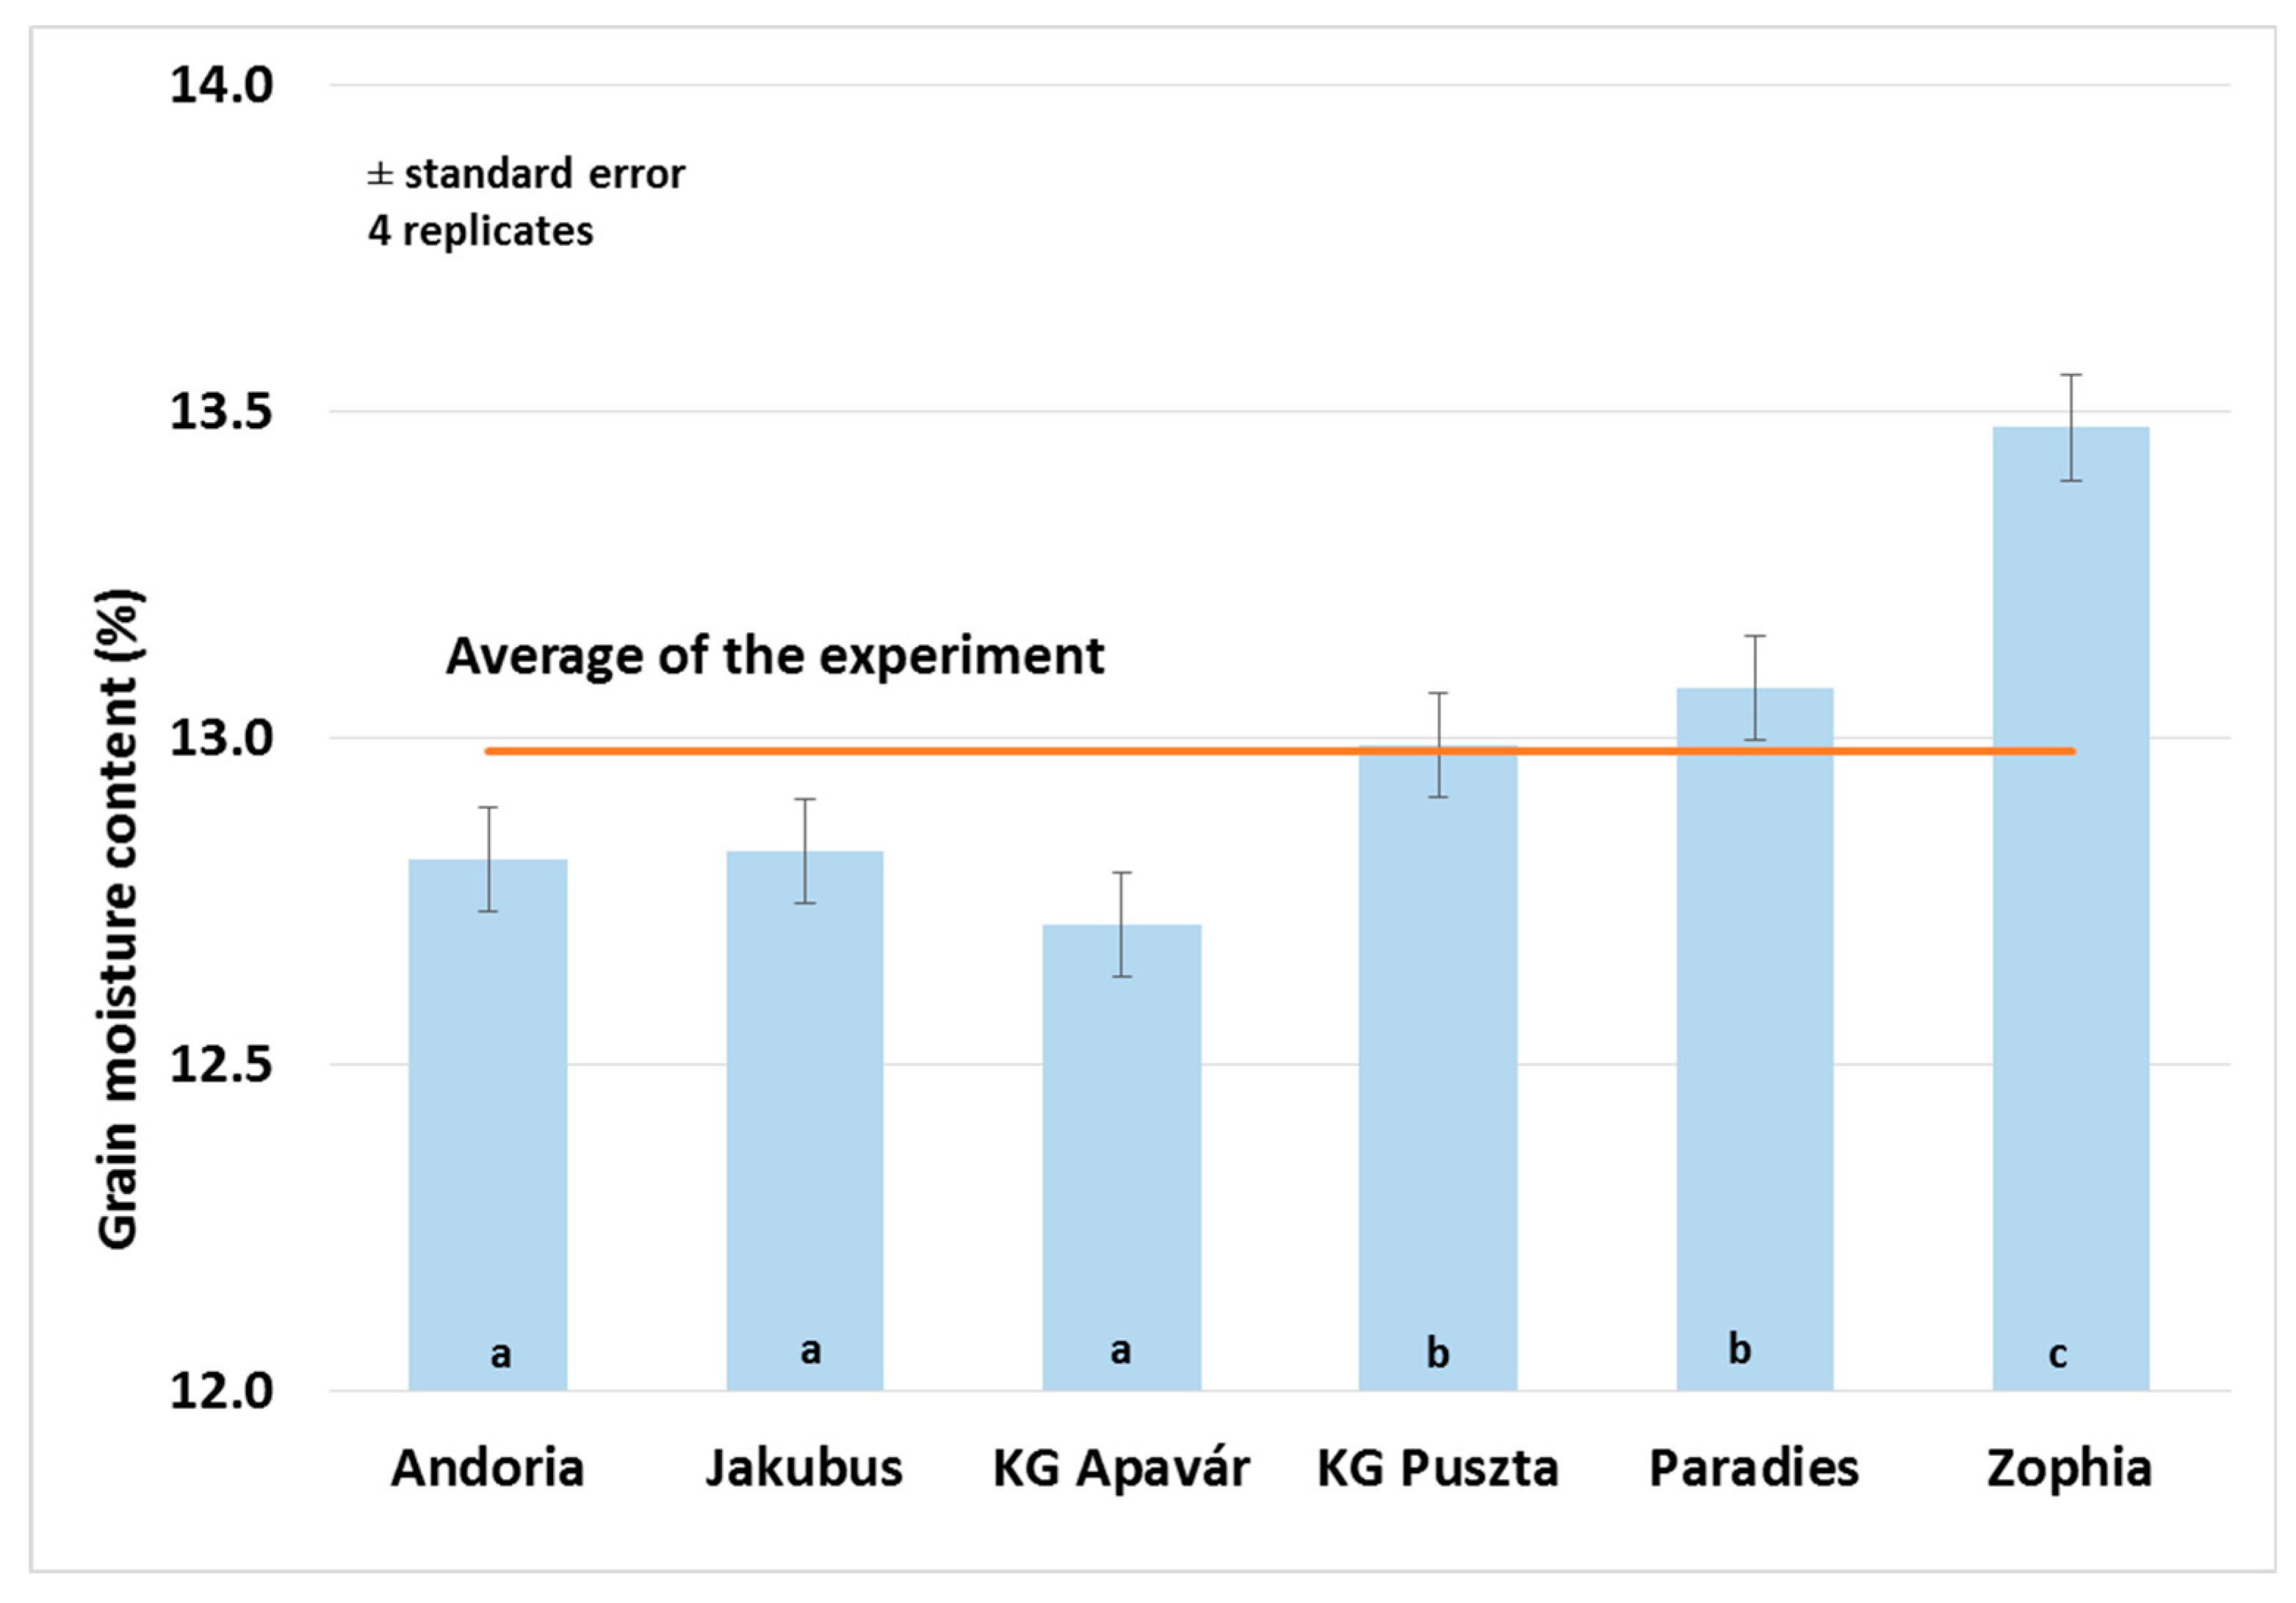
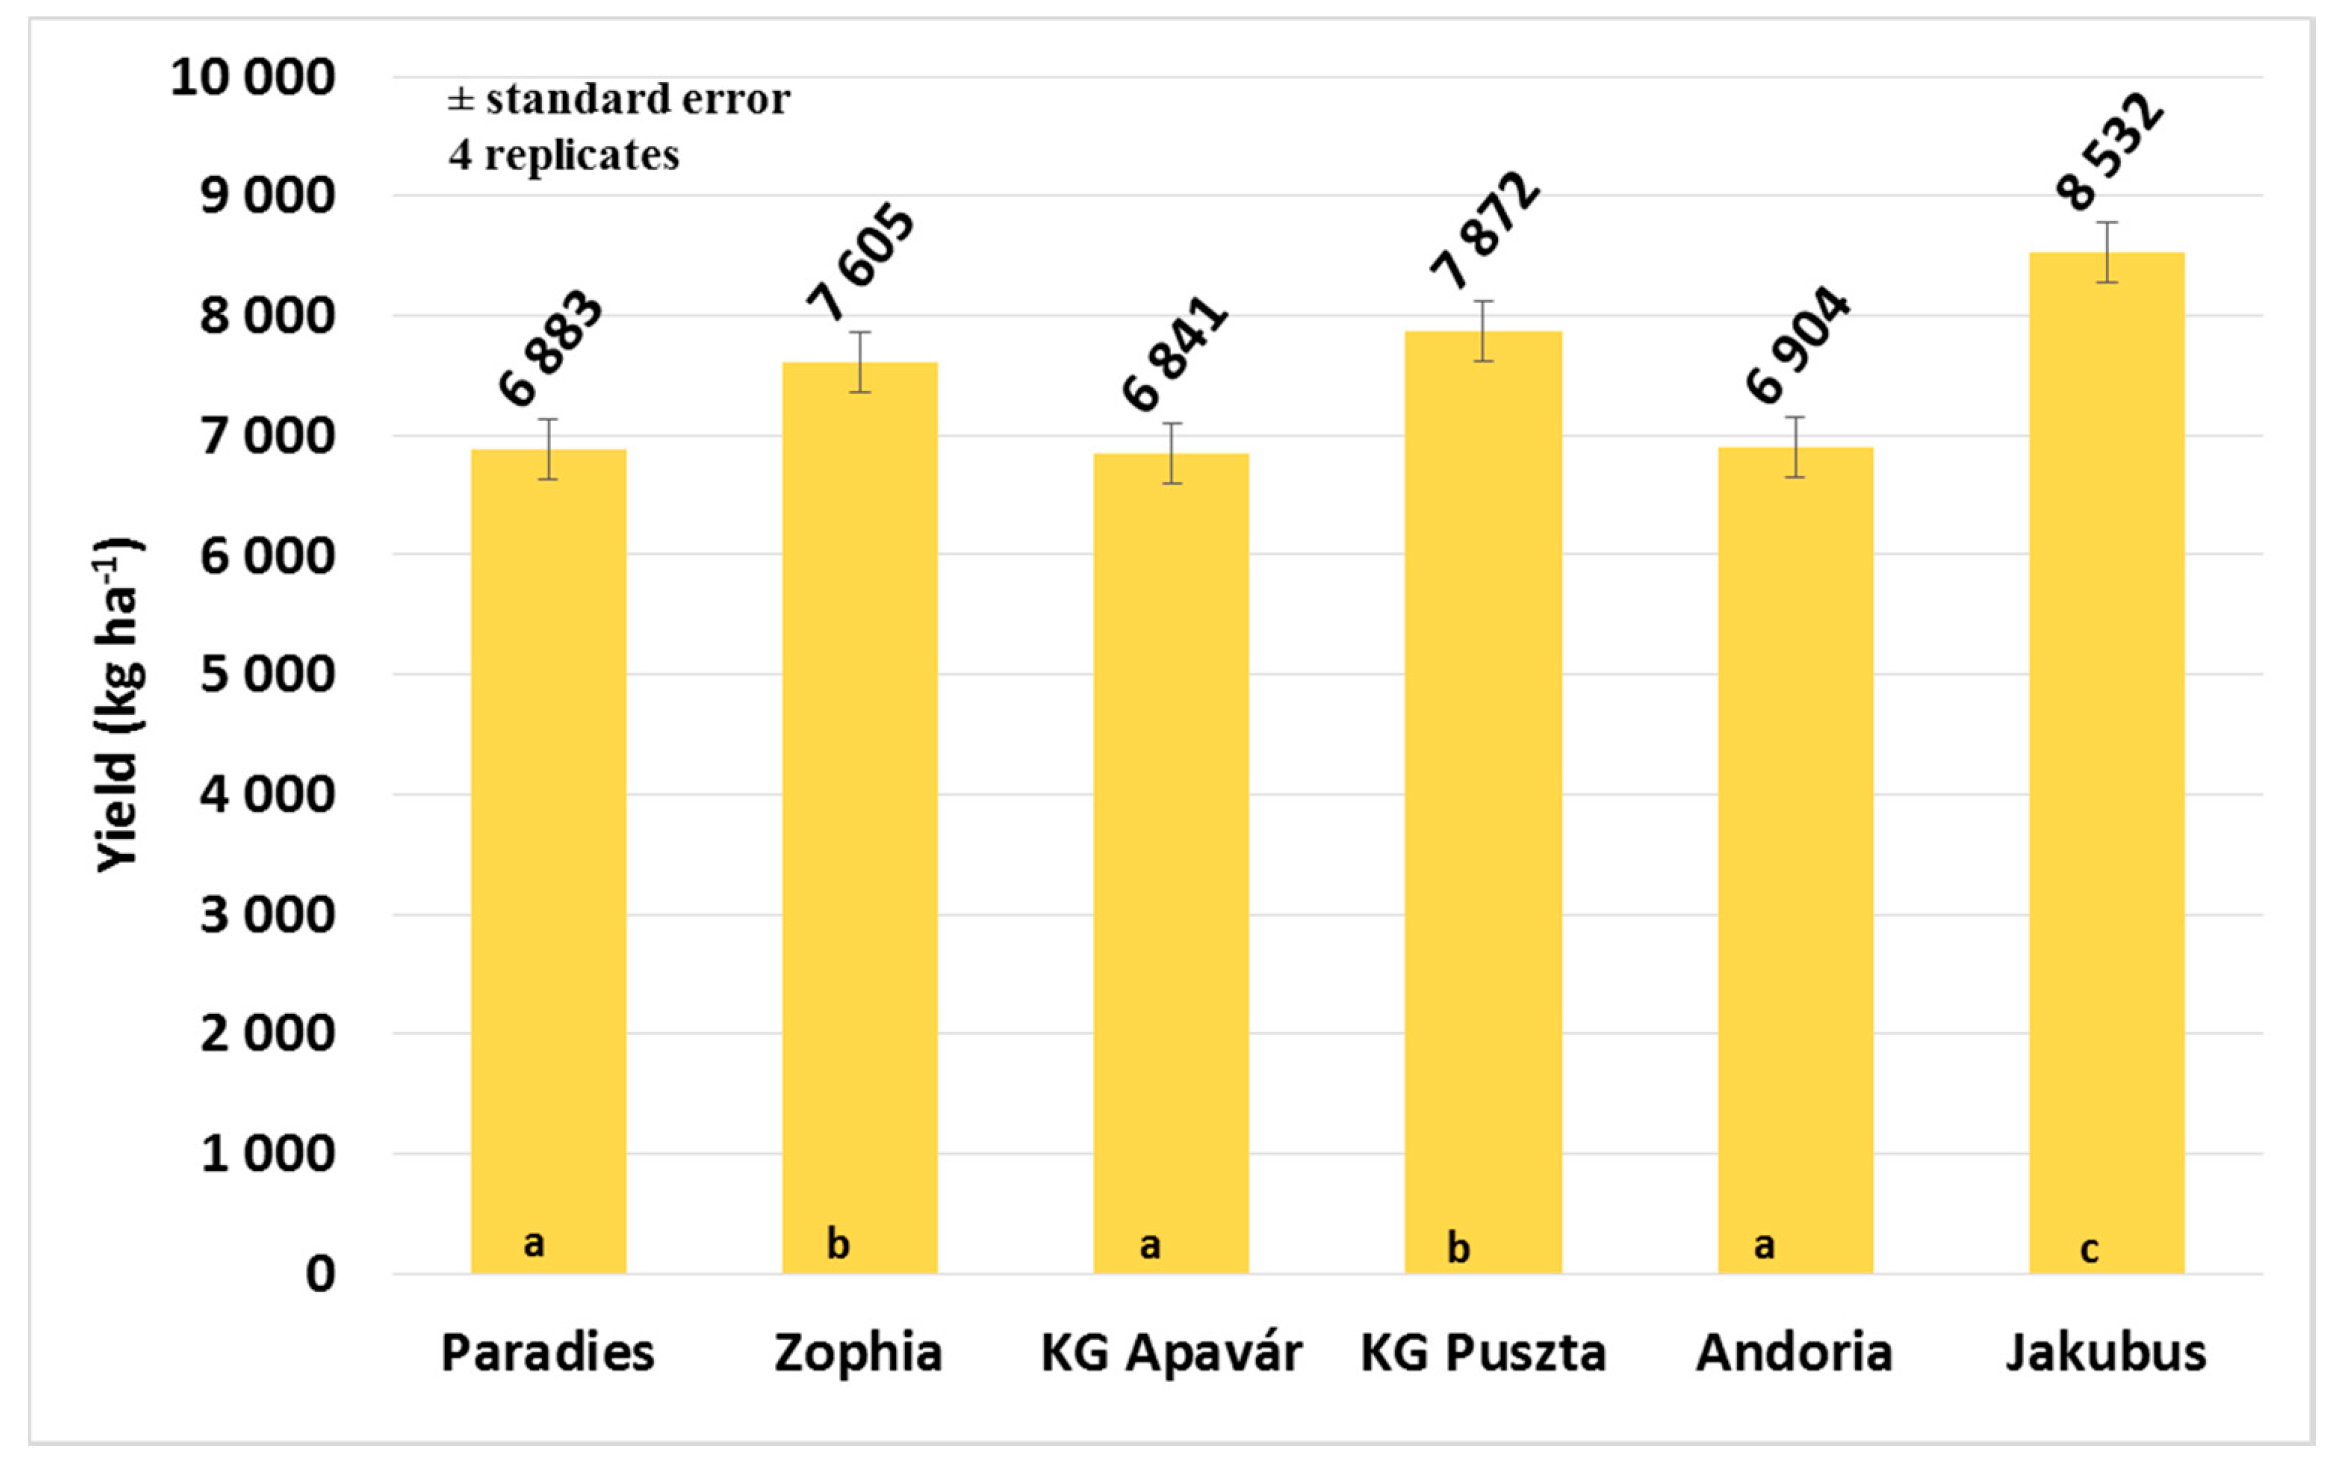
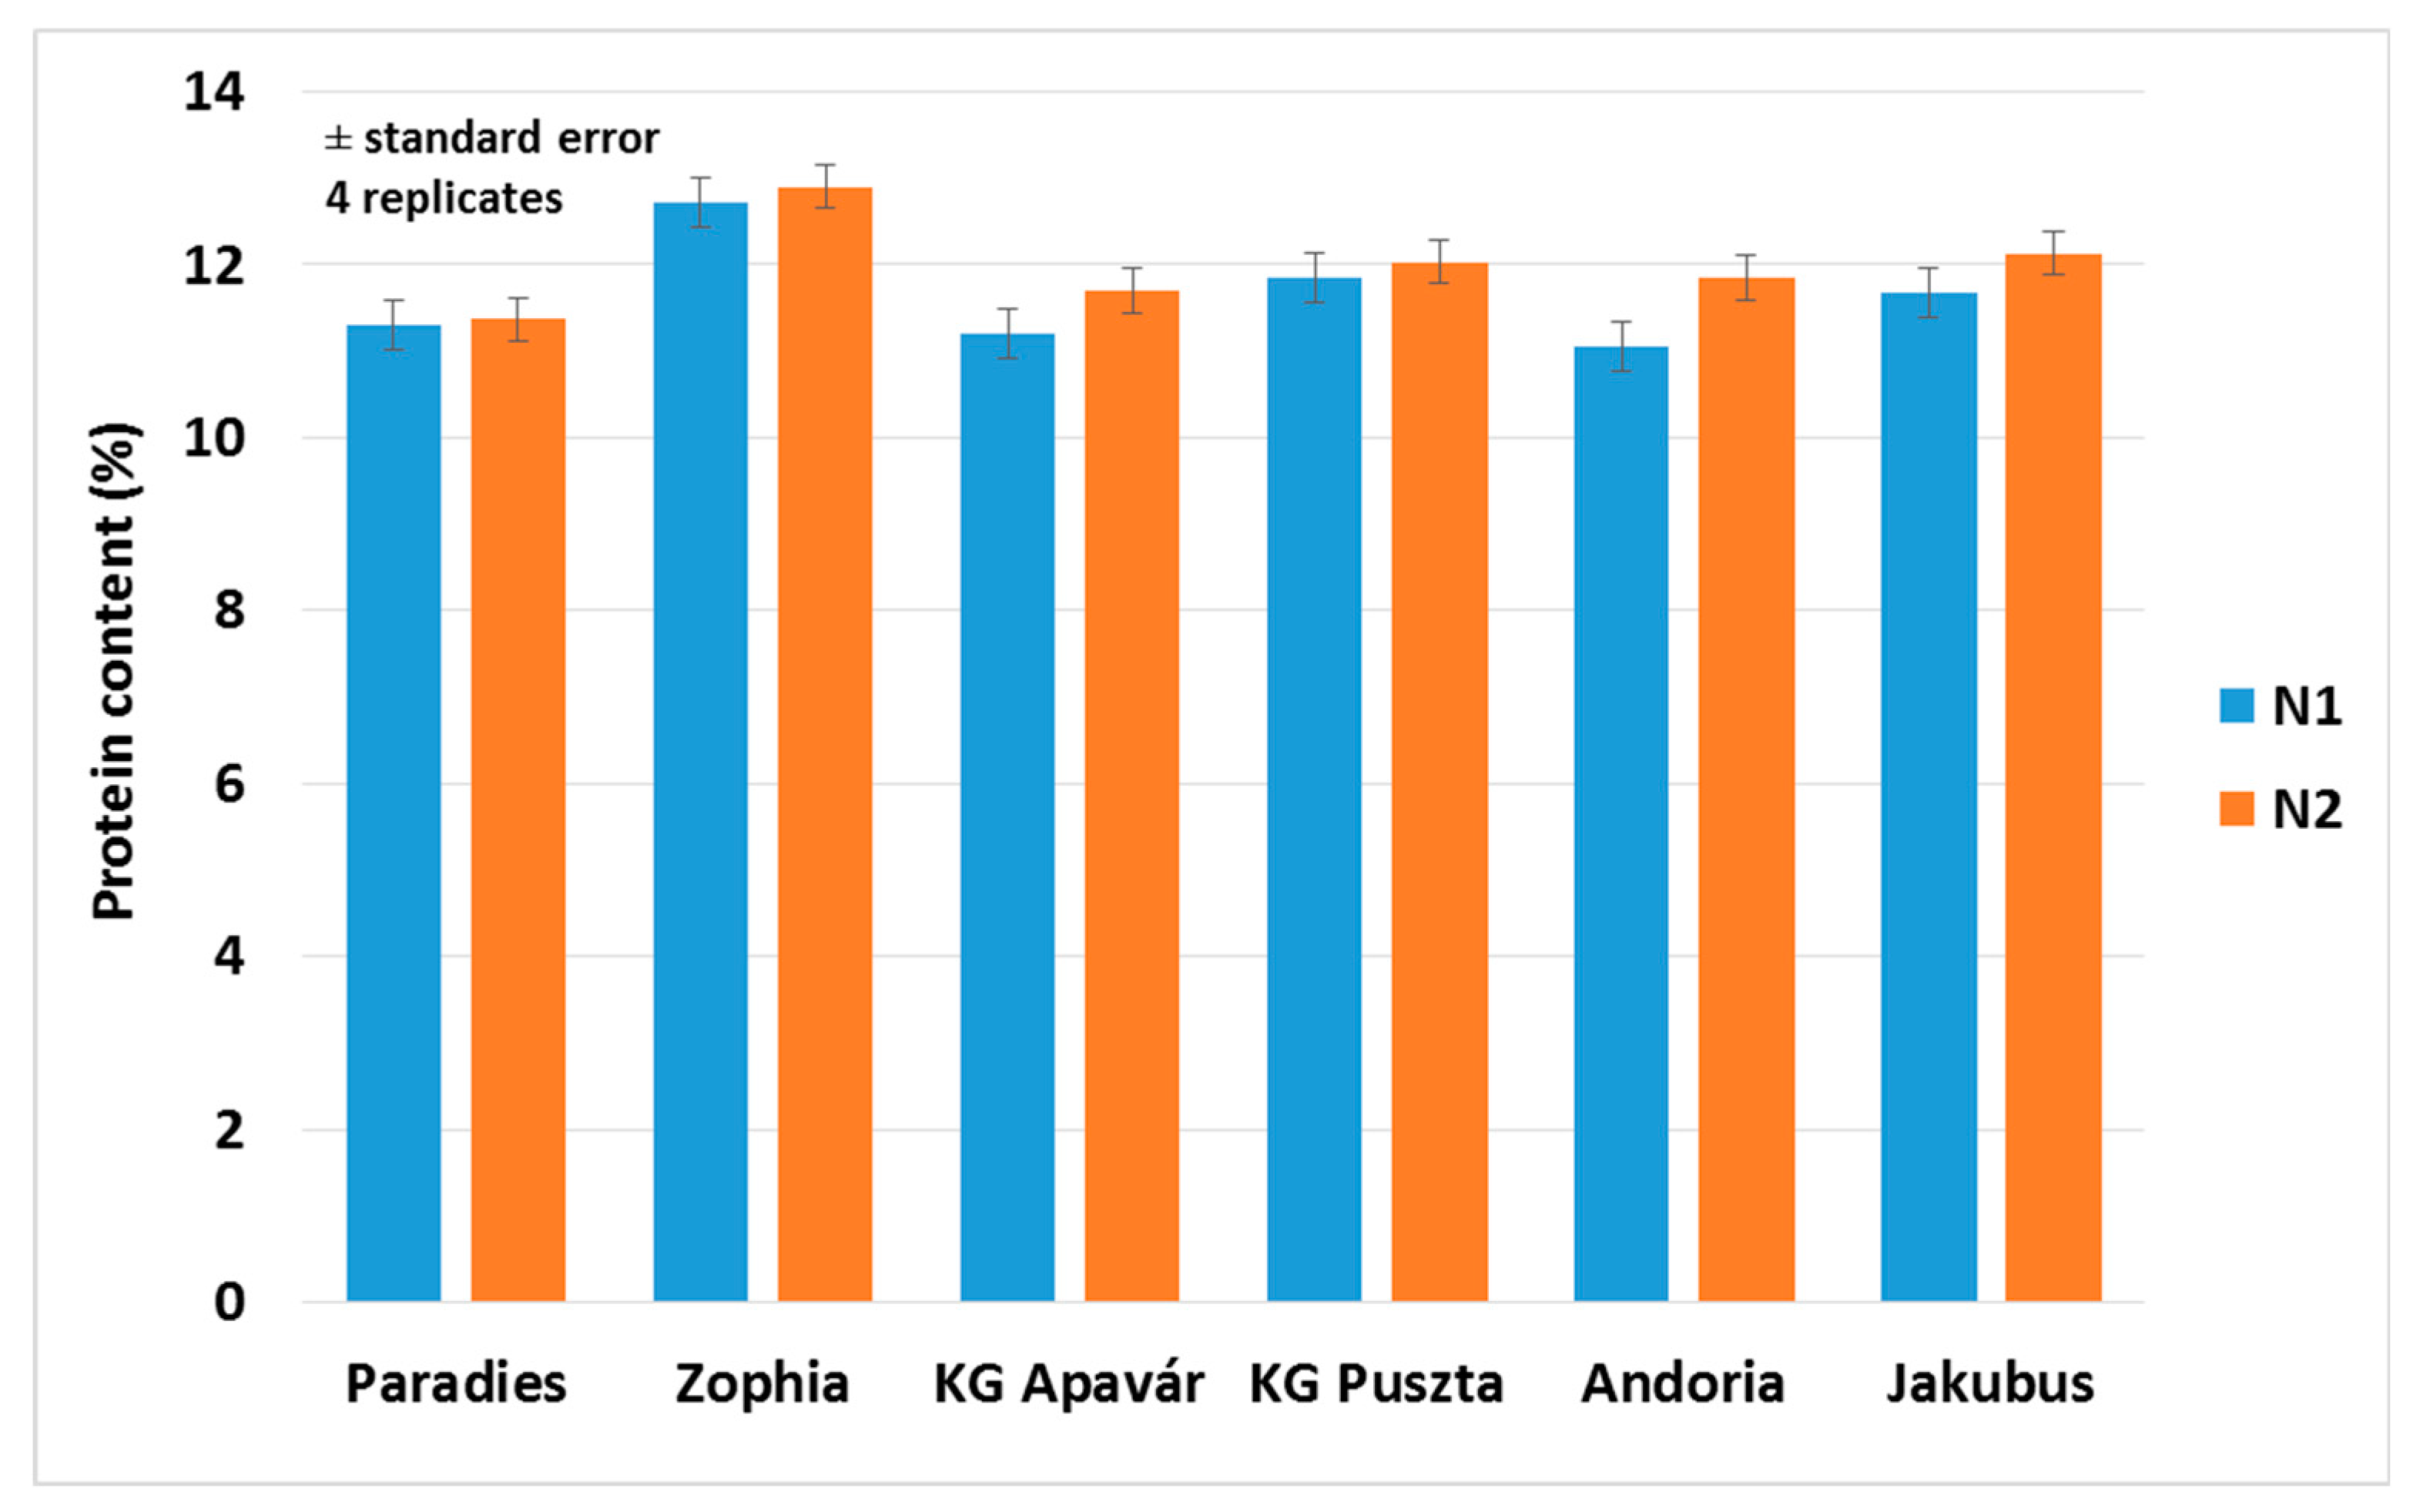
3.3. Yield and Quality

Based on climatic conditions, 2019/2020 was average for winter barley. The differences in grain yields were statistically significant among the varieties (p < 0.001), but not significant as for fertilization levels (p = 0.070). The grain moisture content varied from 12.1% to 14.1%, with the average of the whole experiment being 12.98% (standard deviation: 0.41%). The effect of varieties was significant (p < 0.001). Zophia had the highest value, 13.48%, but it was even low enough to the safe storage. (Figure 10). The yield was between 6840.7 kg ha−1 and 8532.3 kg ha−1. Jakubus gave, at 1691.6 kg ha−1 (24.7%), a higher yield than the lowest yielder, KG Apavár, in an average of fertilization levels (Figure 11).
As the processed data shows, the higher nitrogen fertilization dose resulted in higher yields in all the tested six cultivars, with an average surplus yield of 497.5 kg ha−1, but the effect size varied and was not statistically proved. The difference was highest in KG Puszta (1273.3 kg ha−1) and lowest in KG Apavár (26.6 kg ha −1). According to the cost of plus 60 kg ha−1 nitrogen fertilizer and its result in increasing the yield, this application is unprofitable.
There were significant differences among the varieties in protein content of grains (p = 0.038), but the positive effect of higher N level on protein content has not been proved (p = 0.195). Protein content was determined genetically and the effect of N supply was low in our experiment (Figure 12).
We calculated the protein yield of barley for each plot using yield and protein content data. Statistical analysis showed significant differences in protein yield between both varieties (p < 0.001) and fertilization levels (p = 0.003). The lowest protein yield (737.7 kg ha−1) was Andoria in the N1 treatment, while the highest (1049.9 kg ha−1) was Jakubus in the N2 treatment (Table 6). In an average of cultivars, protein yield was 75 kg ha−1 higher in N2 (N150P45K50 kg ha−1) plots than N1 plots (N90P45K50). The difference between the two N treatments (N2−N1) varied from −31.4 kg ha−1 to 169.9 kg ha−1 (Table 6).

3.4. Connections between Assimilation Parameters and Yield and Quality

The results of Pearson correlation analysis, which we used to study the relationships among the measured data, have shown a moderate (r = 0.374), but significant (p < 0.01) positive linear connection between the yield and the NDVI3 values. When analyzing the cultivars respectively, KG Apavár had the lowest NDVI values for all the measuring dates and its grain yield was the lowest.
We found strong positive correlations between NDVI values and grain protein content. The correlation coefficients (r) varied from 0.561 to 0.668, depending on the NDVI measuring date, and the correlations were significant at p = 0.01 level (2-tailed). Protein content correlated with LAI—the relationship was moderate in positive ranges (r = 0.391−0.392, p < 0.01).
The protein yield per hectare was determined more by grain yield than protein content. The correlation was very strongly positive as for yield (r = 0.832, p < 0.01), while only strong as for protein content (r = 0.503, p < 0.01).
The plant height was in weak to moderate correlation with transpiration (r = −0.306, p < 0.05), temperature difference between leaf and air (r = 0.369, p < 0.01), stomatal conductance to water vapor (r = 0.297, p < 0.05) and total conductance to water vapor (r = 0.299, p < 0.05).

4. Discussion

We found significant (p < 0.05) differences among the barley varieties in assimilation rate, although these discrepancies changed over the growing season. This reflects the results of other studies [14,31]. The cultivars reacted variably to N fertilization and we could detect no significant difference between N supply levels in general, but the Hungarian variety KG Puszta and Paradies showed a statistically proved, increasing in assimilation rate at higher N fertilization. At the lower N rate highest photosynthesis rate was recorded in KG Apavár.
According to Arenas et al., barley has good adaptation to low irradiance levels under shade conditions and acclimation is better than that of wheat [26]. We found that the light response curves indicated good assimilation parameters for barley cultivars under low light conditions. Jakubus cultivar has potentially better photosynthetic acclimation than other tested varieties in shade conditions, as it showed higher photosynthetic activity at lower PPFD levels. Therefore, light quantum capture and carbon fixation ability were also better. Our results for the light response of barley cultivars are similar to those of Pang et al. (2018), based on their measurements for wheat [32].
Drought affects photosynthesis parameters of the plants, especially stomatal conductance and in consequence intercellular CO2 level of the leaves [33,34,35,36]. In April and May, the plants were in drought stress according to the intercellular CO2 levels and the total conductance to carbon dioxide. The differences between the air and leaf temperature were also low, which indicates water stress, but the assimilation rate was relatively high. Water use efficiency was also be affected by genotypes. The best performance was recorded in Zophia and Jakubus; the lowest in the two Hungarian cultivars KG Apavár and KG Puszta. WUE was determined mainly by the transpiration—the best varieties had lower transpiration values, not higher photosynthesis rates, comparing to the other genotypes.
Several recent studies recognized close connections among various photosynthetic parameters in barley [37,38,39]. These statements are confirmed in this study, as we also found significant, very strong, to strong correlations among the photosynthetic parameters of barley cultivars. Our research showed the transpiration was in close connection with stomatal conductance to water vapor and the correlation was stronger, then between transpiration and total conductance.
Chapin et al. (1988) wrote in their paper that limited N supply increased the photosynthetic rate of barley in young leaves, but reduced it in older leaves. N supply had an effect on the photosynthesis rate and leaf area development of barley [40]. Cai et al. (2011) confirmed net photosynthetic rate and the accumulated dry matter showed the same response to N application as grain yield in their study [41]. We found in our study that the assimilation rate of the varieties did not change similarly in connection to N application, and the effect was not significant in general, but higher N dose resulted in higher yields and higher protein yields in all of the six tested cultivars. Highest N fertilization induced reaction to yield was recorded in the oldest variety, KG Puszta and lowest in Paradies.
There were differences in leaf area, but the statistical analysis did not prove significant differences either among the varieties or among the N fertilization rates any time during the course of our research. These statements do not correspond to other studies, for example Dubey (2017) found that N treatment increased significantly the leaf area index (LAI) of barley [42].
Misse and Gupta (2018) stated that higher N rates indicated higher NDVI values in barley [43]. We have proved this in our study, but only later in the growing season, in BBCH 47−49 and BBCH 73−75 developing stages, but the difference was small, 0.6−3.6%. Jakubus presented the best reaction to N supply in NDVI values, the second was the KG Apavár. In the BBCH 27−29 stage, the effect of higher N dose was not present. We measured lower NDVI values, comparing to the N1 treatment. The relationship was moderate among the NDVI values and grain yields, but NDVI values and protein contents are in strong correlation. Our results are similar to those of other studies [44,45,46].
The protein content was influenced by the varieties. The performance of newly evolved 2-row barley, Zophia was the best, then Jakubus and KG Puszta. In general, higher N fertilization did not result in significantly higher protein production in the tested genotypes.

5. Conclusions

Testing newly introduced barley genotypes and detecting their reactions to different agroecological and agrotechnical conditions is essential to achieve higher efficiency of inputs in the production. Barley varieties show great variability in their agronomic and physiological traits. Our results clearly show that there are real differences among the genotypes in the photosynthesis parameters such as assimilation rate and water use efficiency. The tested barley cultivars reacted differently to the changing light intensity in assimilation parameters and the deviations were more expressed at high PPFD levels. Very low light conditions (PPFD below 300 µmol m−2 s−1) induced similarly sharp decreasing in assimilation rate of all genotypes. Competitive ability of the tested barley cultivars is not good under shady conditions. Jakubus was the best in the light curve response test (according to the assimilation rate) and it had the highest yield and protein yield as well. It corresponds with the reports on its excellent adaptability and performance under different ecological conditions. KG Puszta is the oldest variety among the tested ones, but it performed well, its yield was the second highest in average of N fertilization, which shows its good adaptation to Hungarian ecological conditions. KG Apavár is also an extensive variety—its reaction to N fertilization was the lowest in assimilation rate and yield. The protein content of the varieties is highly coded genetically and higher N fertilization did not result in significantly higher protein production in the tested genotypes. In our experiment the protein yield of the varieties was determined more by grain yield than protein content.

Author Contributions

Conceptualization, E.K. and J.C.; methodology, J.C.; writing—original draft preparation, E.K. and J.C.; writing—review and editing E.K. and J.C.; visualization E.K. and J.C.; supervision, P.P. All authors have read and agreed to the published version of the manuscript.

Funding

This research was funded by the EFOP-3.6.3-VEKOP-16-2017-00008 project. The project is cofinanced by the European Union and the European Social Fund.

Conflicts of Interest

The authors declare no conflict of interest. The funders had no role in the design of the study; in the collection, analyses or interpretation of data; in the writing of the manuscript, or in the decision to publish the results.

References

  1. Lopes, M.S.; Nogués, S.; Araus, J.L. Nitrogen source and water regime effects on barley photosynthesis and isotope signature. Funct. Plant Biol. 2004, 31, 995. [Google Scholar] [CrossRef] [PubMed]
  2. Robredo, A.; Pérez-López, U.; De La Maza, H.S.; González-Moro, B.; Lacuesta, M.; Mena-Petite, A.; Muñoz-Rueda, A. Elevated CO2 alleviates the impact of drought on barley improving water status by lowering stomatal conductance and delaying its effects on photosynthesis. Environ. Exp. Bot. 2007, 59, 252–263. [Google Scholar] [CrossRef]
  3. Godfray, H.C.J.; Beddington, J.R.; Crute, I.R.; Haddad, L.; Lawrence, D.; Muir, J.F.; Pretty, J.; Robinson, S.; Thomas, S.M.; Toulmin, C. Food Security: The Challenge of Feeding 9 Billion People. Science 2010, 327, 812–818. [Google Scholar] [CrossRef] [PubMed] [Green Version]
  4. Newton, A.; Flavell, A.J.; George, T.S.; Leat, P.; Mullholland, B.; Ramsay, L.; Revoredo-Giha, C.; Russell, J.; Steffenson, B.J.; Swanston, J.S.; et al. Crops that feed the world 4. Barley: A resilient crop? Strengths and weaknesses in the context of food security. Food Secur. 2011, 3, 141–178. [Google Scholar] [CrossRef]
  5. Giraldo, P.; Benavente, E.; Manzano-Agugliaro, F.; Gimenez, E. Worldwide Research Trends on Wheat and Barley: A Bibliometric Comparative Analysis. Agronomy 2019, 9, 352. [Google Scholar] [CrossRef] [Green Version]
  6. Bertholdsson, N.-O. Screening for Barley Waterlogging Tolerance in Nordic Barley Cultivars (Hordeum vulgare L.) Using Chlorophyll Fluorescence on Hydroponically-Grown Plants. Agronomy 2013, 3, 376–390. [Google Scholar] [CrossRef] [Green Version]
  7. Al-Ajlouni, Z.I.; Al-Abdallat, A.M.; Al-Ghzawi, A.L.A.; Ayad, J.Y.; Abu Elenein, J.M.; Al-Quraan, N.A.; Baenziger, P.S. Impact of Pre-Anthesis Water Deficit on Yield and Yield Components in Barley (Hordeum vulgare L.) Plants Grown under Controlled Conditions. Agronomy 2016, 6, 33. [Google Scholar] [CrossRef] [Green Version]
  8. Carter, A.Y.; Hawes, M.C.; Ottman, M.J. Drought-Tolerant Barley: I. Field Observations of Growth and Development. Agronomy 2019, 9, 221. [Google Scholar] [CrossRef] [Green Version]
  9. Degl’Innocenti, E.; Hafsi, C.; Guidi, L.; Navari-Izzo, F. The effect of salinity on photosynthetic activity in potassium-deficient barley species. J. Plant Physiol. 2009, 166, 1968–1981. [Google Scholar] [CrossRef]
  10. Ahmed, I.M.; Nadira, U.A.; Zhang, G.; Wu, F. Exploration and Utilization of Drought-Tolerant Barley Germplasm; Academic Press: Cambridge, MA, USA, 2016; pp. 115–152. [Google Scholar]
  11. Sallam, A.; Alqudah, A.M.; Dawood, M.F.; Baenziger, P.S.; Börner, A. Drought Stress Tolerance in Wheat and Barley: Advances in Physiology, Breeding and Genetics Research. Int. J. Mol. Sci. 2019, 20, 3137. [Google Scholar] [CrossRef] [Green Version]
  12. Doré, T.; Makowski, D.; Malézieux, E.; Munier-Jolain, N.; Tchamitchian, M.; Tittonell, P. Facing up to the paradigm of ecological intensification in agronomy: Revisiting methods, concepts and knowledge. Eur. J. Agron. 2011, 34, 197–210. [Google Scholar] [CrossRef]
  13. Tittonell, P. Ecological intensification of agriculture—Sustainable by nature. Curr. Opin. Environ. Sustain. 2014, 8, 53–61. [Google Scholar] [CrossRef]
  14. Kovacevic, J.; Mazur, M.; Lalić, A.; Josipovic, M.; Josipovic, A.; Kocar, M.M.; Markovic, M.; Antunović, J.; Cesar, V. Photosynthetic performance index in early stage of growth, water use efficiency, and grain yield of winter barley cultivars. Chil. J. Agric. Res. 2015, 75, 275–283. [Google Scholar] [CrossRef] [Green Version]
  15. Zheng, Y.; Mai, B.; Wu, R.; Feng, Y.; Sofo, A.; Ni, Y.; Sun, J.; Li, J.; Xu, J. Acclimation of winter wheat (Triticum aestivum, cv. Yangmai 13) to low levels of solar irradiance. Photosynthetica 2011, 49, 426. [Google Scholar] [CrossRef]
  16. Kadar, I.; Csathó, P. N-Cu interactions in a field experiment on spring barley. Agrokém. Talajt. 2013, 62, 345–358. [Google Scholar] [CrossRef]
  17. Drew, M.C. Comparison of the effects of a localized supply of phosphate, nitrate, ammonium and potassium on the growth of the seminal root system, and the shoot, in barley. New Phytol. 1975, 75, 479–490. [Google Scholar] [CrossRef]
  18. Siebrecht, S.; Tischner, R.; Mäck, G. Function and contribution of the root tip in the induction of NO3− uptake along the barley root axis. J. Exp. Bot. 1995, 46, 1669–1676. [Google Scholar] [CrossRef]
  19. Perry, E.M.; Fitzgerald, G.; Nuttall, J.G.; O’Leary, G.J.; Schulthess, U.; Whitlock, A. Rapid estimation of canopy nitrogen of cereal crops at paddock scale using a Canopy Chlorophyll Content Index. Field Crop. Res. 2012, 134, 158–164. [Google Scholar] [CrossRef]
  20. Csajbók, J.; Kutasy, E. Results of N Supply and Plant Protection Testing Experiment on Winter Barley Varieties. In Proceedings of the 17th Alps-Adria Scientific Workshop, Hnanice, Czech Republic, 9 April 2018; pp. 134–135. [Google Scholar]
  21. Oukarroum, A.; El Madidi, S.; Schansker, G.; Strasser, R.J. Probing the responses of barley cultivars (Hordeum vulgare L.) by chlorophyll a fluorescence OLKJIP under drought stress and re-watering. Environ. Exp. Bot. 2007, 60, 438–446. [Google Scholar] [CrossRef]
  22. Hejnak, V.; Zamecnikova, B.; Neckarova, J. The influence of high natrium and chlorine ion concentration on physiological responses of various spring barley varieties. Turk. J. Field Crops 2011, 16, 93–98. [Google Scholar]
  23. Hein, J.A.; Sherrard, M.E.; Manfredi, K.P.; Abebe, T. The fifth leaf and spike organs of barley (Hordeum vulgare L.) display different physiological and metabolic responses to drought stress. BMC Plant Biol. 2016, 16, 1–12. [Google Scholar] [CrossRef] [PubMed] [Green Version]
  24. Song, T.; Yang, F.; Das, D.; Chen, M.; Hu, Q.; Tian, Y.; Cheng, C.; Liu, Y.; Zhang, J. Transcriptomic analysis of photosynthesis-related genes regulated by alternate wetting and drying irrigation in flag leaves of rice. Food Energy Secur. 2020, 9. [Google Scholar] [CrossRef]
  25. Blum, A. Selection for Sustained Production in Water Deficit Environments. In International Crop Science I; Crop Science Society of America (CSSA): Madison, WI, USA, 1993; pp. 343–347. [Google Scholar]
  26. Arenas-Corraliza, M.G.; Rolo, V.; López-Díaz, M.L.; Moreno, G. Wheat and barley can increase grain yield in shade through acclimation of physiological and morphological traits in Mediterranean conditions. Sci. Rep. 2019, 9, 1–10. [Google Scholar] [CrossRef] [PubMed]
  27. Hack, H.; Bleiholder, H.; Buhr, L.; Meier, U.; Schnock-Fricke, U.; Weber, E.; Witzenberger, A. Einheitliche Codierung der Phänologischen Entwicklungsstadien mono- und dikotyler Pflanzen Erweiterte BBCH-Skala, Allgemein. Nachrichtenbl. Deut. Pflanzenschutzd. 1992, 44, 265–270. [Google Scholar]
  28. Von Caemmerer, S.; Farquhar, G.D. Some relationships between the biochemistry of photosynthesis and the gas exchange of leaves. Planta 1981, 153, 376–387. [Google Scholar] [CrossRef]
  29. LI-COR, Inc. Li-6800 Portable Photosynthesis System, Software Version 1.2; LI-COR, Inc.: Lincoln, NE, USA, 2017. [Google Scholar]
  30. Rouse, W.J.; Haas, R.H.; Schell, J.A.; Deering, D.W. Monitoring Vegetation Systems in the Great Plains with ERTS. In Proceedings of the Third ERTS Symposium, Washington DC, USA, 10–14 December 1973; pp. 309–317. [Google Scholar]
  31. Blum, A. Photosynthesis and Transpiration in Leaves and Ears of Wheat and Barley Varieties. J. Exp. Bot. 1985, 36, 432–440. [Google Scholar] [CrossRef]
  32. Pang, G.; Xu, Z.; Wang, T.; Cong, X.; Wang, H. Photosynthetic light response characteristics of winter wheat at heading and flowering stages under saline water irrigation. IOP Conf. Ser. Earth Environ. Sci. 2018, 170. [Google Scholar] [CrossRef] [Green Version]
  33. Vos, J.; Groenwold, J. Characteristics of photosynthesis and conductance of potato canopies and the effects of cultivars and transient drought. Field Crop. Res. 1989, 20, 237–250. [Google Scholar] [CrossRef]
  34. Flexas, J.; Medrano, H. Drought inhibition of photosynthesis in C3 plants: Stomatal limitations revisited. Ann. Bot. 2002, 89, 183–189. [Google Scholar] [CrossRef] [Green Version]
  35. Kutasy, E.; Csajbók, J.; Borbély, É.H. Relations between yield and photosynthetic activity of winter wheat varieties. Cereal Res. Commun. 2005, 33, 173–176. [Google Scholar] [CrossRef]
  36. Mejri, M.; Siddique, K.H.M.; Saif, T.; Abdelly, C.; Hessini, K. Comparative effect of drought duration on growth, photosynthesis, water relations, and solute accumulation in wild and cultivated barley species. J. Plant Nutr. Soil Sci. 2016, 179, 327–335. [Google Scholar] [CrossRef]
  37. Küpper, P.M.; Perkons, U.; Pries, C.; Antar, P.M.; Kautz, T.; Köpke, U. Rates of photosynthesis and transpiration of wheat and barley as influenced by fodder precrops and their cropping period. In Proceedings of the 4th ISOFAR Scientific Conference—‘Building Organic Bridges’, Istanbul, Turkey, 13–15 October 2014. [Google Scholar]
  38. Allel, D.; Ben-Amar, A.; Abdelly, C. Leaf photosynthesis, chlorophyll fluorescence and ion content of barley (Hordeum vulgare) in response to salinity. J. Plant Nutr. 2017, 41, 497–508. [Google Scholar] [CrossRef]
  39. Panfilova, A.; Korkhova, M.; Gamayunova, V.; Fedorchuk, M.; Drobitko, A.; Nikonchuk, N.; Kovalenko, O. Formation of photosynthetic and grain yield of spring barley (Hordeum vulgare L.) depend on varietal characteristics and plant growth regulators. Agron. Res. 2019, 17, 608–620. [Google Scholar] [CrossRef]
  40. Chapin, F.S.; Walter, C.H.S.; Clarkson, D.T. Growth response of barley and tomato to nitrogen stress and its control by abscisic acid, water relations and photosynthesis. Planta 1988, 173, 352–366. [Google Scholar] [CrossRef]
  41. Cai, J.; Jiang, D.; Wollenweber, B.; Dai, T.; Cao, W. Effects of nitrogen application rate on dry matter redistribution, grain yield, nitrogen use efficiency and photosynthesis in malting barley. Acta Agric. Scand. Sect. B Plant Soil Sci. 2012, 62, 1–10. [Google Scholar] [CrossRef]
  42. Dubey, S.; Tiwari, A.; Pandey, V.; Singh, V.; Singh, G. Effect of nitrogen levels and its time of application on growth parameters of barley (Hordeum vulgare L.). J. Pharmacogn. Phytochem. 2018, 7, 333–338. [Google Scholar] [CrossRef]
  43. Paul, T.E.M.; Madan, G. Sensor-based algorithms to improve barley nitrogen efficiency in Queensland. Afr. J. Agric. Res. 2018, 13, 1476–1486. [Google Scholar] [CrossRef]
  44. Fetch, T.G.; Steffenson, B.J., Jr.; Pederson, V.D. Predicting agronomic performance of barley using canopy reflectance data. Can. J. Plant Sci. 2004, 84, 1–9. [Google Scholar] [CrossRef]
  45. Lalic, A.; Kovacevic, J.; Novoselovic, D.; Simic, G.; Abicic, I.; Guberac, V. Agronomic and quantitative traits of winter barley varieties (Hordeum vulgare L.) under growing conditions in Croatia. Agric. Conspec. Sci. 2009, 74, 283–289. [Google Scholar]
  46. Ram, H.; Dhaliwal, S.S. Effect of varieties and integrated nutrient management techniques on growth, productivity, quality and economics of barley (Hordeum vulgare L.). Int. J. Agric. Sci. 2012, 8, 91–97. [Google Scholar]
Figure 1. Monthly sums of precipitation and averages of temperature comparing to the 30 years’ average (Debrecen, 2019/2020). 30 years av. prec: 30 years average precipitation; 30 years av. temp: 30 years average temperature, numbers in the bars: sum precipitation of the month.
Agronomy 10 01999 g001
Figure 2. Assimilation rate of winter barley cultivars, (Debrecen, 2020), means of N treatments, standard error of means. 4 replicates, 12 measurements (2 leaves, 6 recordings per leaf). The assimilation rate of the winter barley cultivars changed during the growing season. The differences among the varieties were significant, p < 0.05.
Agronomy 10 01999 g002
Figure 3. Assimilation rate of winter barley cultivars at different N supply (Debrecen, 2020). Standard error of means, 4 replicates, 12 measurements (2 leaves, 6 recordings per leaf). N fertilization did not cause significant differences in assimilation rate in general, but the cultivars had varying reactions.
Agronomy 10 01999 g003
Figure 4. Assimilation rate light curves of winter barley cultivars, 26 May (BBCH 73−75), N90P45K50 (Debrecen, 2020) 4 replicates, 12 measurements (2 leaves, 6 recordings per leaf). Barley cultivars’ assimilation rates were similar at the low PPFD levels, but there are differences at higher light levels. PPFD: photosynthetic photon flux density.
Agronomy 10 01999 g004
Figure 5. Intercellular CO2 level light curve in winter barley, average of cultivars, 26 May (BBCH 73–75), N90P45K50 (Debrecen, 2020) 4 replicates, 12 measurements (2 leaves, 6 recordings per leaf). Increasing PPFD resulted in decreasing intercellular CO2 level caused by stomata closing. The change was especially expressed from 20 to 900 µmol m−2 s−1 PPFD levels. PPFD: photosynthetic photon flux density.
Agronomy 10 01999 g005
Figure 6. Total conductance to CO2 light curve in winter barley, average of cultivars, 26 May (BBCH 73–75), N90P45K50 (Debrecen, 2020) 4 replicates, 12 measurements (2 leaves, 6 recordings per leaf). Higher PPFD levels caused stress and decreased significantly the total conductance to CO2. The change was significant above 900 µmol m−2 s−1 PPFD levels. PPFD: photosynthetic photon flux density.
Agronomy 10 01999 g006
Figure 7. Leaf area index values of winter barley cultivars in the growing season (Debrecen, 2020) Means of N treatments, standard error of means, 4 replicates. Leaf area development of barley plants almost was complete at BBCH 47−49 (28 April), statistical analysis did not prove significant differences among the varieties.
Agronomy 10 01999 g007
Figure 8. Normalized difference vegetation index (NDVI) values of winter barley cultivars in the growing season, mean of N treatments (Debrecen, 2020) Standard error of means, 4 replicates. NDVI measurements (BBCH 27−29, BBCH 47−49, BBCH 73−75) showed differences between the cultivars each of the measurement days. NDVI values of KG Puszta grew continuously in the growing season.
Agronomy 10 01999 g008
Figure 9. NDVI values of winter barley cultivars in different N fertilization doses (Debrecen, 2020) Standard error of means, 4 replicates. At BBCH 27−29 plots under higher N fertilization had lower NDVI values. The difference was statistically significant (p < 0.05). N1: N90P45K50; N2: N150P45K50 kg ha−1.
Agronomy 10 01999 g009
Figure 10. Grain moisture content of winter barley cultivars, average of N treatments (Debrecen, 2020). Standard error of means, 4 replicates. Means are compared to the average of the experiment. All varieties had adequately low grain moisture content to the storage. The differences in grain moisture content were statistically significant among the varieties. Different letters mean statistically significant difference (p < 0.05).
Agronomy 10 01999 g010
Figure 11. Grain yield of winter barley cultivars, average of N treatments (Debrecen, 2020). Standard error of means, 4 replicates. The differences in grain yields were statistically significant among the varieties. Different letters means statistically significant discrepancy between averages (p < 0.05).
Agronomy 10 01999 g011
Figure 12. Protein content of winter barley cultivars in connection to N-supply (Debrecen, 2020). Standard error of means, 4 replicates. The positive effect of higher N level on protein content has not been proved, protein content was determined genetically. N1: N90P45K50; N2: N150P45K50 kg ha−1.
Agronomy 10 01999 g012
Table 1. Soil analysis results of the experiment area (2015, Debrecen).
Layer
0–25 cm
Layer
25–50 cm
Layer
50–75 cm
Layer
75–100 cm
Layer
100–130 cm
pH (KCl)6.466.366.587.277.36
KA4344.647.646.645.4
CaCO3 (%)00010.2512.75
Humus (%)2.762.161.520.90.59
Organic C (%)1.601.250.880.520.34
Total N (%)0.150.120.0860.0830.078
NO3 + NO2 (mg kg−1)6.21.740.61.921.78
P2O5 (AL) (mg kg−1)133.44840.439.831.6
K2O (AL) (mg kg−1)239.8173.612393.678
Mg (mg kg−1)332.4405.4366.6249286.6
Na (mg kg−1)3866.255.467.862.6
Zn (mg kg−1)2.80.80.580.480.84
Cu (mg kg−1)5.864.543.642.241.64
Mn (mg kg−1)438406339744
SO4 (mg kg−1)9.259.1310.87.9522.98
Note: KA: upper limit of plasticity according to Arany, Arany-type plasticity; AL: ammonium lactate-soluble; total N%: total nitrogen by Kjeldahl method.
Table 2. Soil analysis results of the experiment area (2019, Debrecen).
Soil LayerBulk Density (g cm−3)Porosity %Field Capacity w w−1 %Permanent Wilting Point w w−1 %hy
5–25 cm1.4645.033.315.552.715
27–33 cm1.4047.337.315.702.783
47–53 cm1.2353.638.314.752.755
72–78 cm1.2453.038.914.202.563
97–103 cm1.2652.640.611.132.168
122–128 cm1.2851.842.39.381.853
147–153 cm1.2552.844.69.031.778
197–203 cm1.2353.746.08.501.690
hy: hygroscopicity according to Kuron.
Table 3. Pearson correlation coefficient values between assimilation parameters in winter barley (2020, Debrecen).
AssTranspGTWGBWGSW
Correlation Coefficients (3 April, BBCH 27−29)
Transp0.07710.927 **0.0280.931 **
GTW0.0270.927 **1−0.0660.999 **
GBW−0.2100.028−0.0661−0.062
GSW0.0320.931 **0.999 **−0.0621
Correlation Coefficients (28 April, BBCH 47−49)
Transp0.297 *10.932 **0.0290.935 **
GTW0.2550.932 **1−0.0660.998 **
GBW0.0670.029−0.0661−0.063
GSW0.2520.935 **0.998 **−0.0631
Correlation Coefficients (26 May, BBCH 73−75)
Transp0.662 **10.992 **0.0470.991 **
GTW0.667 **0.992 **10.0410.999 **
GBW0.0120.0470.04110.038
GSW0.667 **0.991 **0.999 **0.0381
Significance as follows: * Correlation is significant at the 0.05 level (2-tailed). ** Correlation is significant at the 0.01 level (2-tailed). 4 replicates, 12 measurements (2 leaves, 6 recordings per leaf). Ass: assimilation rate (μmol m−2 s−1); transp: transpiration rate (mmol m−2 s−1); GTW: total conductance to water vapor (mol m−2 s−1); GSW: stomatal conductance to water vapor (mol m−2 s−1); GBW: boundary layer conductance to water vapor (mol m−2 s−1).
Table 4. Pearson correlation coefficient values between PAR and assimilation parameters in winter barley (2020, Debrecen).
AssCiPhi CO2TranspTair-TleafPhi PS2ETRGTC
PAR0.764 *−0.921 **−0.667 *−0.133−0.996 **0.357−0.970 **−0.765 *
Ci−0.931 **10.5780.0940.885 **−0.4520.903 **0.688 *
Phi CO2−0.3560.57810.788 *0.699 *−0.4630.6410.949 **
Transp0.1190.0940.788 *10.174−0.1270.1550.727 *
Tair−Tleaf−0.703 *0.885 **0.699 *0.1741−0.3370.969 **0.790 *
Phi PS20.534−0.452−0.463−0.127−0.3371−0.204−0.308
ETR−0.715 *0.903 **0.6410.1550.969 **−0.20410.776 *
GTC−0.4240.688 *0.949 **0.727 *0.790 *−0.3080.7761
Significance as follows: * Correlation is significant at the 0.05 level (2-tailed). ** Correlation is significant at the 0.01 level (2-tailed). 4 replicates, 12 measurements (2 leaves, 6 recordings per leaf). PAR: photosynthetically active radiation (μmol m−2 s−1); ass: assimilation rate (μmol m−2 s−1), Ci: intercellular CO2 level (μmol mol−1); Phi CO2: CO2 assimilation efficiency (µmol µmol−1); transp: transpiration rate (mmol m−2 s−1); Tair-Tleaf: temperature difference between air and leaf (°C); PhiPS2: efficiency of PS2 system; ETR: electron transport rate (μmol m−2 s−1); GTC: total conductance to CO2 (mol m−2 s−1).
Table 5. NDVI values of winter barley cultivars (2020, Debrecen).
Nitrogen Dose (kg ha−1)ParadiesZophiaKG ApavárKG PusztaAndoriaJakubus
NDVI values (3 April)
N1:N90P45K500.770 a0.780 a0.750 a0.758 a0.753 a0.758 a
N2:N150P45K500.733 a0.740 a0.738 a0.738 a0.743 a0.748 a
NDVI values (28 April)
N1:N90P45K500.795 a0.828 b0.780 c0.788 c0.788 c0.788 c
N2:N150P45K500.758 a0.800 b0.768 a0.783 b0.793 c0.793 c
NDVI values (26 May)
N1:N90P45K500.753 a0.793 b0.715 c0.820 d0.740 a0.775 b
N2:N150P45K500.738 a0.795 b0.735 a0.808 b0.745 a0.803 b
The different letters mean significantly different values at p = 0.05 level.
Table 6. Protein yield of winter barley cultivars (2020, Debrecen).
Nitrogen Dose (kg ha−1)Protein Yield (kg ha−1)
ParadiesZophiaKG ApavárKG PusztaAndoriaJakubus
N1: N90P45K50795.0 a916.3 b762.5 c850.2 d737.7 c984.0 b
N2: N150P45K50763.6 a1020.7 b797.3 a1020.1 b844.0 c1049.9 b
Different letters mean significant difference at p = 0.05 level.
Publisher’s Note: MDPI stays neutral with regard to jurisdictional claims in published maps and institutional affiliations.

