Article

Orchard Planting Density and Tree Development Stage Affects Physiological Processes of Apple (Malus domestica Borkh.) Tree

by
Kristina Laužikė
1,*,
Nobertas Uselis
1,
Darius Kviklys
2 and
Giedrė Samuolienė
1
1
Lithuanian Research Centre for Agriculture and Forestry, Institute of Horticulture, Kauno 30, Babtai, LT-54333 Kaunas, Lithuania
2
Department of Horticulture, Norwegian Institute of Bioeconomy Research, NIBIO Ullensvang, Ullensvangvegen 1005, NO-5781 Lofthus, Norway
*
Author to whom correspondence should be addressed.
Agronomy 2020, 10(12), 1912; https://doi.org/10.3390/agronomy10121912
Submission received: 4 November 2020 / Revised: 1 December 2020 / Accepted: 2 December 2020 / Published: 4 December 2020
(This article belongs to the Special Issue Eco-Physiology of Fruit Tree and Innovative Agricultural Practices)

Abstract

:
One of the most important factors affecting photosynthesis and metabolism is light absorbance by leaves and penetration through the canopy. The aim of this study was to evaluate the influence of planting density and tree development stages on photosynthetic activity, photosynthetic pigments, and carbohydrates in apple (Malus domestica Borkh.) trees in a combined way. The apple tree, Auksis, was grafted on dwarfing rootstock P 22. Space between rows was 3 m, trees were planted in 2001 in four distances: 0.25 m, 0.50 m, 0.75 m, and 1.00 m. Measurements and leaf samples were taken in the end of May (leaves fully expanded BBCH 20–25), in the middle of July (beginning of apple maturity BBCH 73–75) and at the end of August (harvest time BBCH 87–88) according BBCH—growth stages. Photosynthetic rate was significantly the lowest in the spring and tended to rise until fruit ripening, when it increased up to 19.4% compared to spring. Significantly the highest chlorophyll b and carotene α and β contents were found at the BBCH 73–75. The lowest levels of fructose and sorbitol in leaves were found at BBCH 73–75. The amount of starch accumulated in the leaves increased three times in summer compared to spring. Reduced distance between trees to four times (from 1 m to 0.25 m) showed clear competitive stress, as the decrease of photosynthetic rate (up to 36.4–38.6%) and total starch (up to 37–53%) was observed. The photosynthetic behaviour of apple trees was significantly affected by the development stage during the particular season which is related with physiological changes of metabolites transport and their distribution during fruit ripening and leaf senescence.

1. Introduction

One of the most important factors affecting photosynthesis and metabolism is light absorbance by leaves and penetration through the canopy. The composition of light changes during the day and as well as during the season [1]. Studies have shown seasonal changes in photosynthetic processes and pigments that are associated with leaf spring development and autumn aging [2,3]. Metabolic changes associated with nutrient resorption underpin the temporal variation of respiratory and photosynthetic rates once senescence starts. In mid-latitude regions with marked climate seasonality, changes in photosynthetic processes and metabolism are due to concurrent changes in leaf age and environmental conditions [4,5].
Leaf age affects light absorption and utilization, and protection systems against excess light. Younger leaves are less prone to photoinhibition than older ones [6]. Leaf chlorophyll content varies in response to environmental factors and natural aging stage. Each photosynthetic pigment has its own location in the cell, functions, and the range of absorbed light wavebands [7,8]. Chlorophylls are the main absorbers of light, while carotenes not only absorb light that is not taken up by chlorophylls, but also has a photoprotective function [7,9,10,11]. Alpha carotene is the main carotene; however, in low light α-carotene can be replaced by β-carotene, but only then if both carries out the same functions [9,12]. β-carotene exert a beneficial photoprotective action by quenching excited chlorophyll molecules [13,14,15]. However, the main function of fruit β-carotene is an antioxidant [16,17]. During the growth, in more sunlit leaves, the aging process begins earlier. The chlorophylls start to degrade, but the carotenes remain stable and some of them are transported to fruits [3,17].
Carbohydrates are produced in the leaves of plants during photosynthetic processes, and the end compounds provide energy enhancing plant growth and productivity. Abiotic stressors alter the formation of soluble sugars (e.g., fructose, glucose, sucrose, and sorbitol), helping the identification of plant stress [2,18]. Sucrose is the main end product of photosynthesis, which is synthesized in green leaves and transported by sucrose transporters to the fruits and the rest of the plants as reserved material [19]. However, in Rosaceae family species, sorbitol together with sucrose is a primary end product of photosynthesis, and it is a major phloem-translocated carbohydrate, accounting 60–80% of the photosynthates produced in apple (Malus domestica Borkh.) leaves [20,21,22]. Sorbitol is not only a source of energy for plant growth, but it also can be as a signalling molecule involved in regulation of plant growth, development, and environmental stress response. One of the reduced sorbitol biosynthesis effects is to defective stamen development and inhibition of pollen tube growth in apple [23,24,25]. The synthesis of starch is highly dependent on sugar content in leaves. Higher amounts of sugars stimulate the expression of the major starch synthesis enzyme ADP-glucose pyrophosphoryl (AGPase) resulting more intensive starch synthesis [20]. Moreover, the total amount of starch in the leaves is significantly influenced by day duration, over a longer photoperiod plants accumulate more starch [26]. Changes in the content of soluble carbohydrates and starch are mechanistically linked to transitions in plant freezing tolerance. During spring, starch is re-synthesized and mobilized for renewed growth, providing energy and building blocks before buds swelling [27]. Relationships between leaves indices and carbohydrates accumulation appear at the beginning of fruit maturity when fruits become major sink organs and carbohydrates are typically transported from leaves to fruits [28]. In a complex process regulated by the rate of photosynthesis, phloem loading, long-distance transfer and unloading, post-phloem transport, and metabolism, sugars synthesized in shell tissue are distributed to other apple tissues such as fruits and seeds [29].
The rate of photosynthesis also depends on the photoperiod. According to researches, young leaves become more photosynthetic during the long day, and the rate of photosynthesis decreases during leave senescence [30,31]. Another factor that affects the rate of photosynthesis and other photosynthesis indices is light. In many cases, the decreased light reduces the rate of photosynthesis [26,31,32,33]. On the other hand, other authors show, that too much sunlight begins to inhibit photosynthetic processes, saving water, so shading nets or dense planting schemes helps to optimize the intensity of photosynthesis [31,32,33]. However, due to the competition between the trees, the trunk diameter decreases with decreasing distances between trees density. At the same time as the diameter of the trunk decreases, its ability to supply water and nutrients to the crown also decreases [34,35,36]. There are few reasons of such tree behaviour. The lack of water closes the stomata, thus reducing water loss through the leaves, resulting in decreased transpiration along with the decrease in the rate of photosynthesis [37,38,39].
Apple growth, physiological activity and yields are influenced not only by environmental factors, but also by rootstock. In the experiments performed in Lithuania main apple rootstocks were divided into groups according to induced growth vigour: super dwarf (P 22, P 59), dwarf (P 60, B.396, M.9), semi-dwarf (P.14, M.26), and semi-vigorous (B.118, MM.106) [40,41,42]. Super-dwarfing P 22 rootstock resulted in the smallest yield and fruits [41].
The aim of this study was to evaluate the influence of apple development stage and planting density on photosynthetic activity, photosynthetic pigments and carbohydrates in apple trees.

2. Materials and Methods

2.1. Plant Material and Growing Conditions

A trial was carried out in the experimental orchard in Lithuania, (55°60′ N, 23°48′ E) in 2018–2019 in a fully matured orchard. The apple (Malus domestica Borkh.) tree Auksis was grafted on super-dwarfing rootstock P 22. Trees were planted in 2001, space between rows was 3 m, trees were planted in the row at four distances: 0.25 m, 0.50 m, 0.75 m, and 1.00 m. Differences in apple height and crown diameter depending on planting density are given in the Table 1. Three single trees in each planting distance were fully randomized. Pest and disease management was carried out according to the integrated plant protection practice, the orchard was not irrigated. Soil conditions of the experimental orchard were as follows: clay loam, pH 7.3, humus 2.8%, P2O5 255 mg kg−1, K2O 230 mg kg−1. Measurements and leaf samples were collected at the end of May (leaves fully expanded, BBCH 20–25), in the middle of July (beginning of apple maturity, BBCH 73–75) and at the end of August (harvest time, BBCH 87–88).

2.2. Measurements

Photosynthetic rate (Pn (µmol CO2 m−2 s−1)), stomatal conductance (gs (mol H2O m−2 s−1)), and transpiration rate (E (mmol H2O m−2 s−1)) was measured at 9:00–12:00 AM using a LI-6400XT portable open flow gas exchange system (Li-COR Biosciences, Lincoln, NE, USA). The timing of the measurements was chosen taking into account the dynamics and stability of photosynthesis during each season. Reference air (CO2) (400 μmol mol−1), light intensity (1000 μmol m−2 s−1), block temperature (21 °C), and the flow rate of gas pump (500 mmol s−1) were set. Measurements of photosynthesis were performed on 3 trees selecting 3 leaves from 1.00–1.20 m above ground (Figure 1).

2.3. Biochemical Analyses

2.3.1. Determination of Chlorophylls (a and b) and Carotenes (α and β) by High-Performance Liquid Chromatography (HPLC)

Chlorophylls and carotenes were evaluated using HPLC method with diode array detection (DAD) on Shimadzu 10A (Shimadzu, Kyoto, Japan). About 0.5 g of fresh plant tissue was ground and diluted with 80% glacial acetone. The extraction was carried out for 24 h at +4 °C temperature. Extract centrifugate at 10,000 rpm for 15 min. Then solution was filtered over a 0.22 µm PTPE syringe filter (VWR International, Radnor, PA, USA). The sample separation was performed on Chromegabond C30 3µ 120 Å, 15 cm × 2.1 mm column (ES Industries, West Berlin, NJ, USA). A 10 µm of sample was injected; the column oven temperature was set at +20 °C. The pigments were eluted for 30 min with gradient solvent systems A (Methanol:water, 1:4) and B (Ethyl acetate) at a flow rate of 0.2 mL min−1. Initial conditions were 20% B for 2.5 min, followed by linear gradient to 30% B at 5 min, hold 30% B for 5 min, then elevated till 80% B in 2.5 min, till 87% B in 7.5 min and till 100% in 5 min, and again 20% B until the end of run. Calibration method was used for chlorophylls and carotenes quantification (mg g−1 in FW).

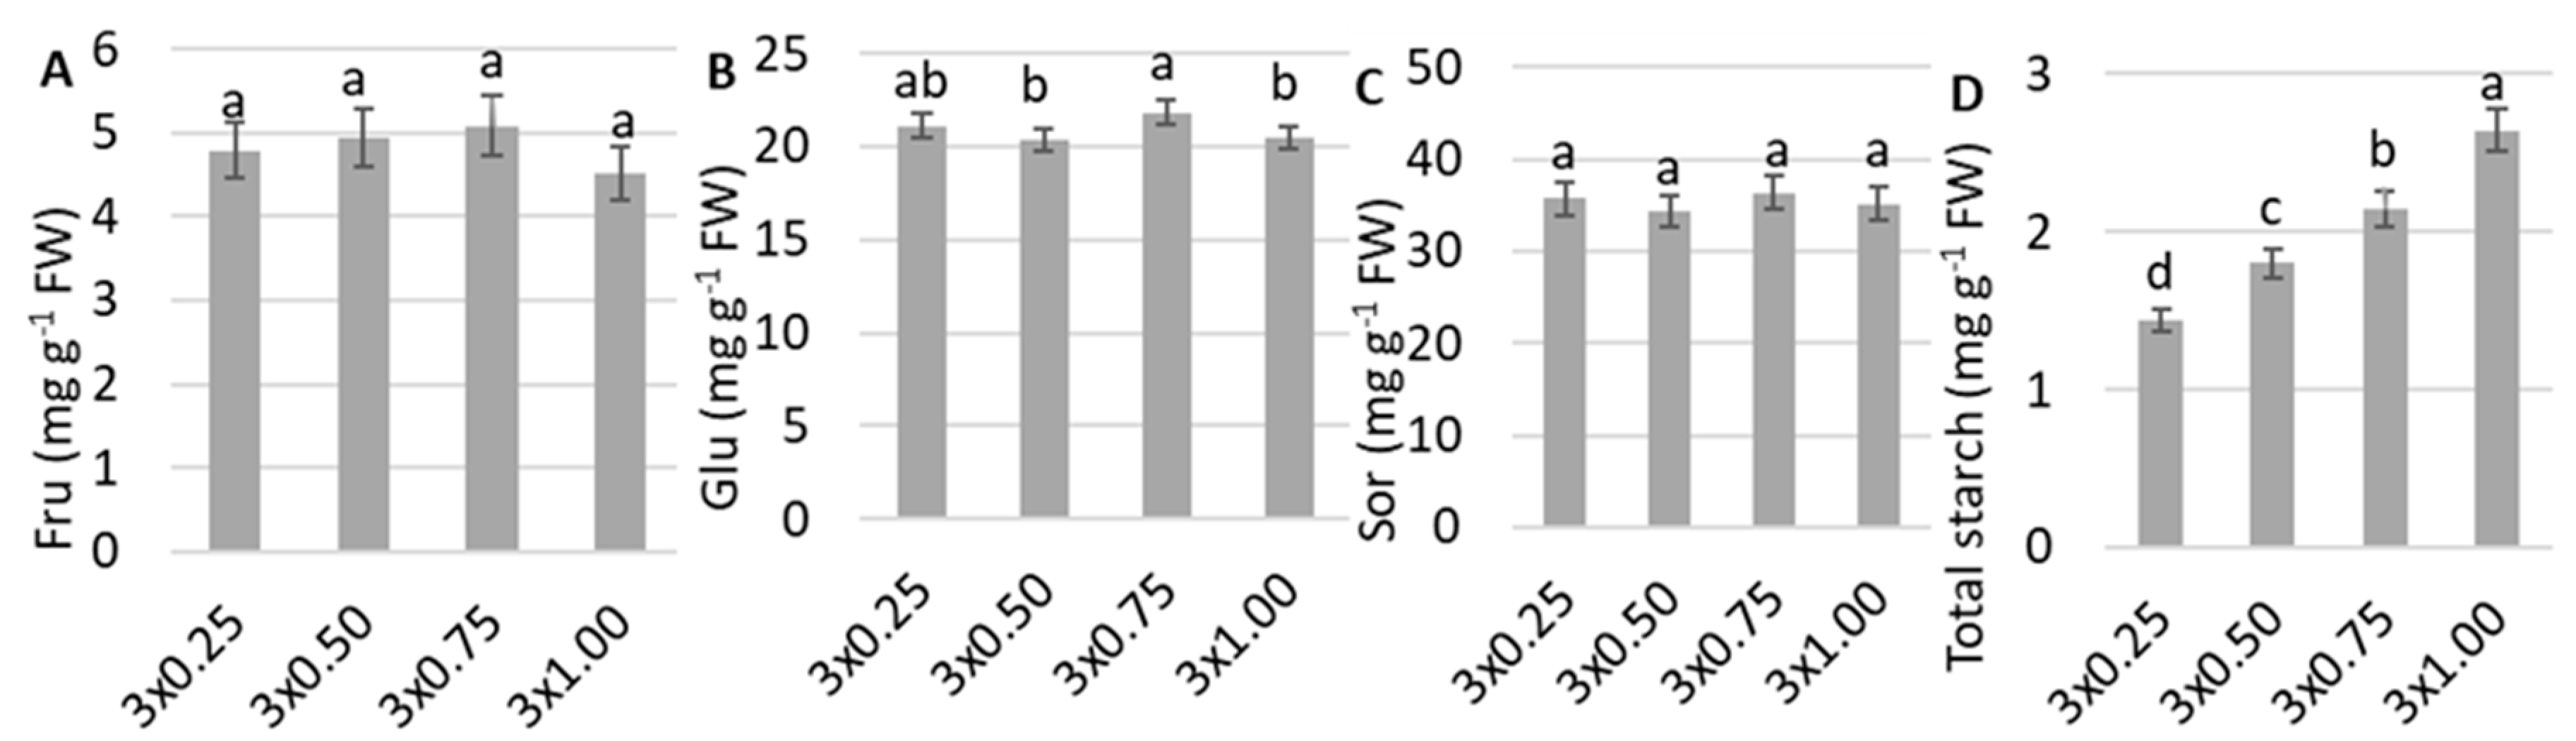
2.3.2. Determination of Soluble Sugars Byultra-Performance Liquid Chromatography (UPLC)

Soluble sugar (fructose, glucose, and sorbitol) contents were evaluated using HPLC method with evaporative scattering detection (ELSD) on Shimadzu Nexera UPLC (SHIMADZU, Kyoto, Japan) system [43]. About 0.5 g of fresh plant tissue was ground and diluted with deionized water. The extraction was carried out for 4 h at room temperature, centrifuged at 14,000× g for 15 min. A cleanup step, based on Brons and Olieman [44] was performed prior to the chromatographic analysis: 1 mL of the supernatant was mixed with 1 mL 0.01% (w:v) ammonium acetate in acetonitrile and incubated for 30 min at +4 °C. After incubation, samples were centrifuged at 14,000× g for 15 min and filtered through 0.22 µm PTPE syringe filter (VWR International, Radnor, PA, USA). Separation was performed on a Supelcosil 250 × 4 mm NH2 column (Supelco, Bellefonte, PA, USA) using 77% acetonitrile as the mobile phase at 1 mL min−1 flow rate. Calibration method was used for sugar quantification (mg g−1 in FW).

2.3.3. Determination of Total Starch by Spectrophotometric Method

The total starch content was determined using the total starch Megazyme assay kit, a total starch assay kit based on the use of thermostable a-amylase and amyloglucosidase (Megazyme International Ireland Limited, Wicklow, Ireland), method of determination of starch in samples which also contains D-glucose and/or maltodextrins.

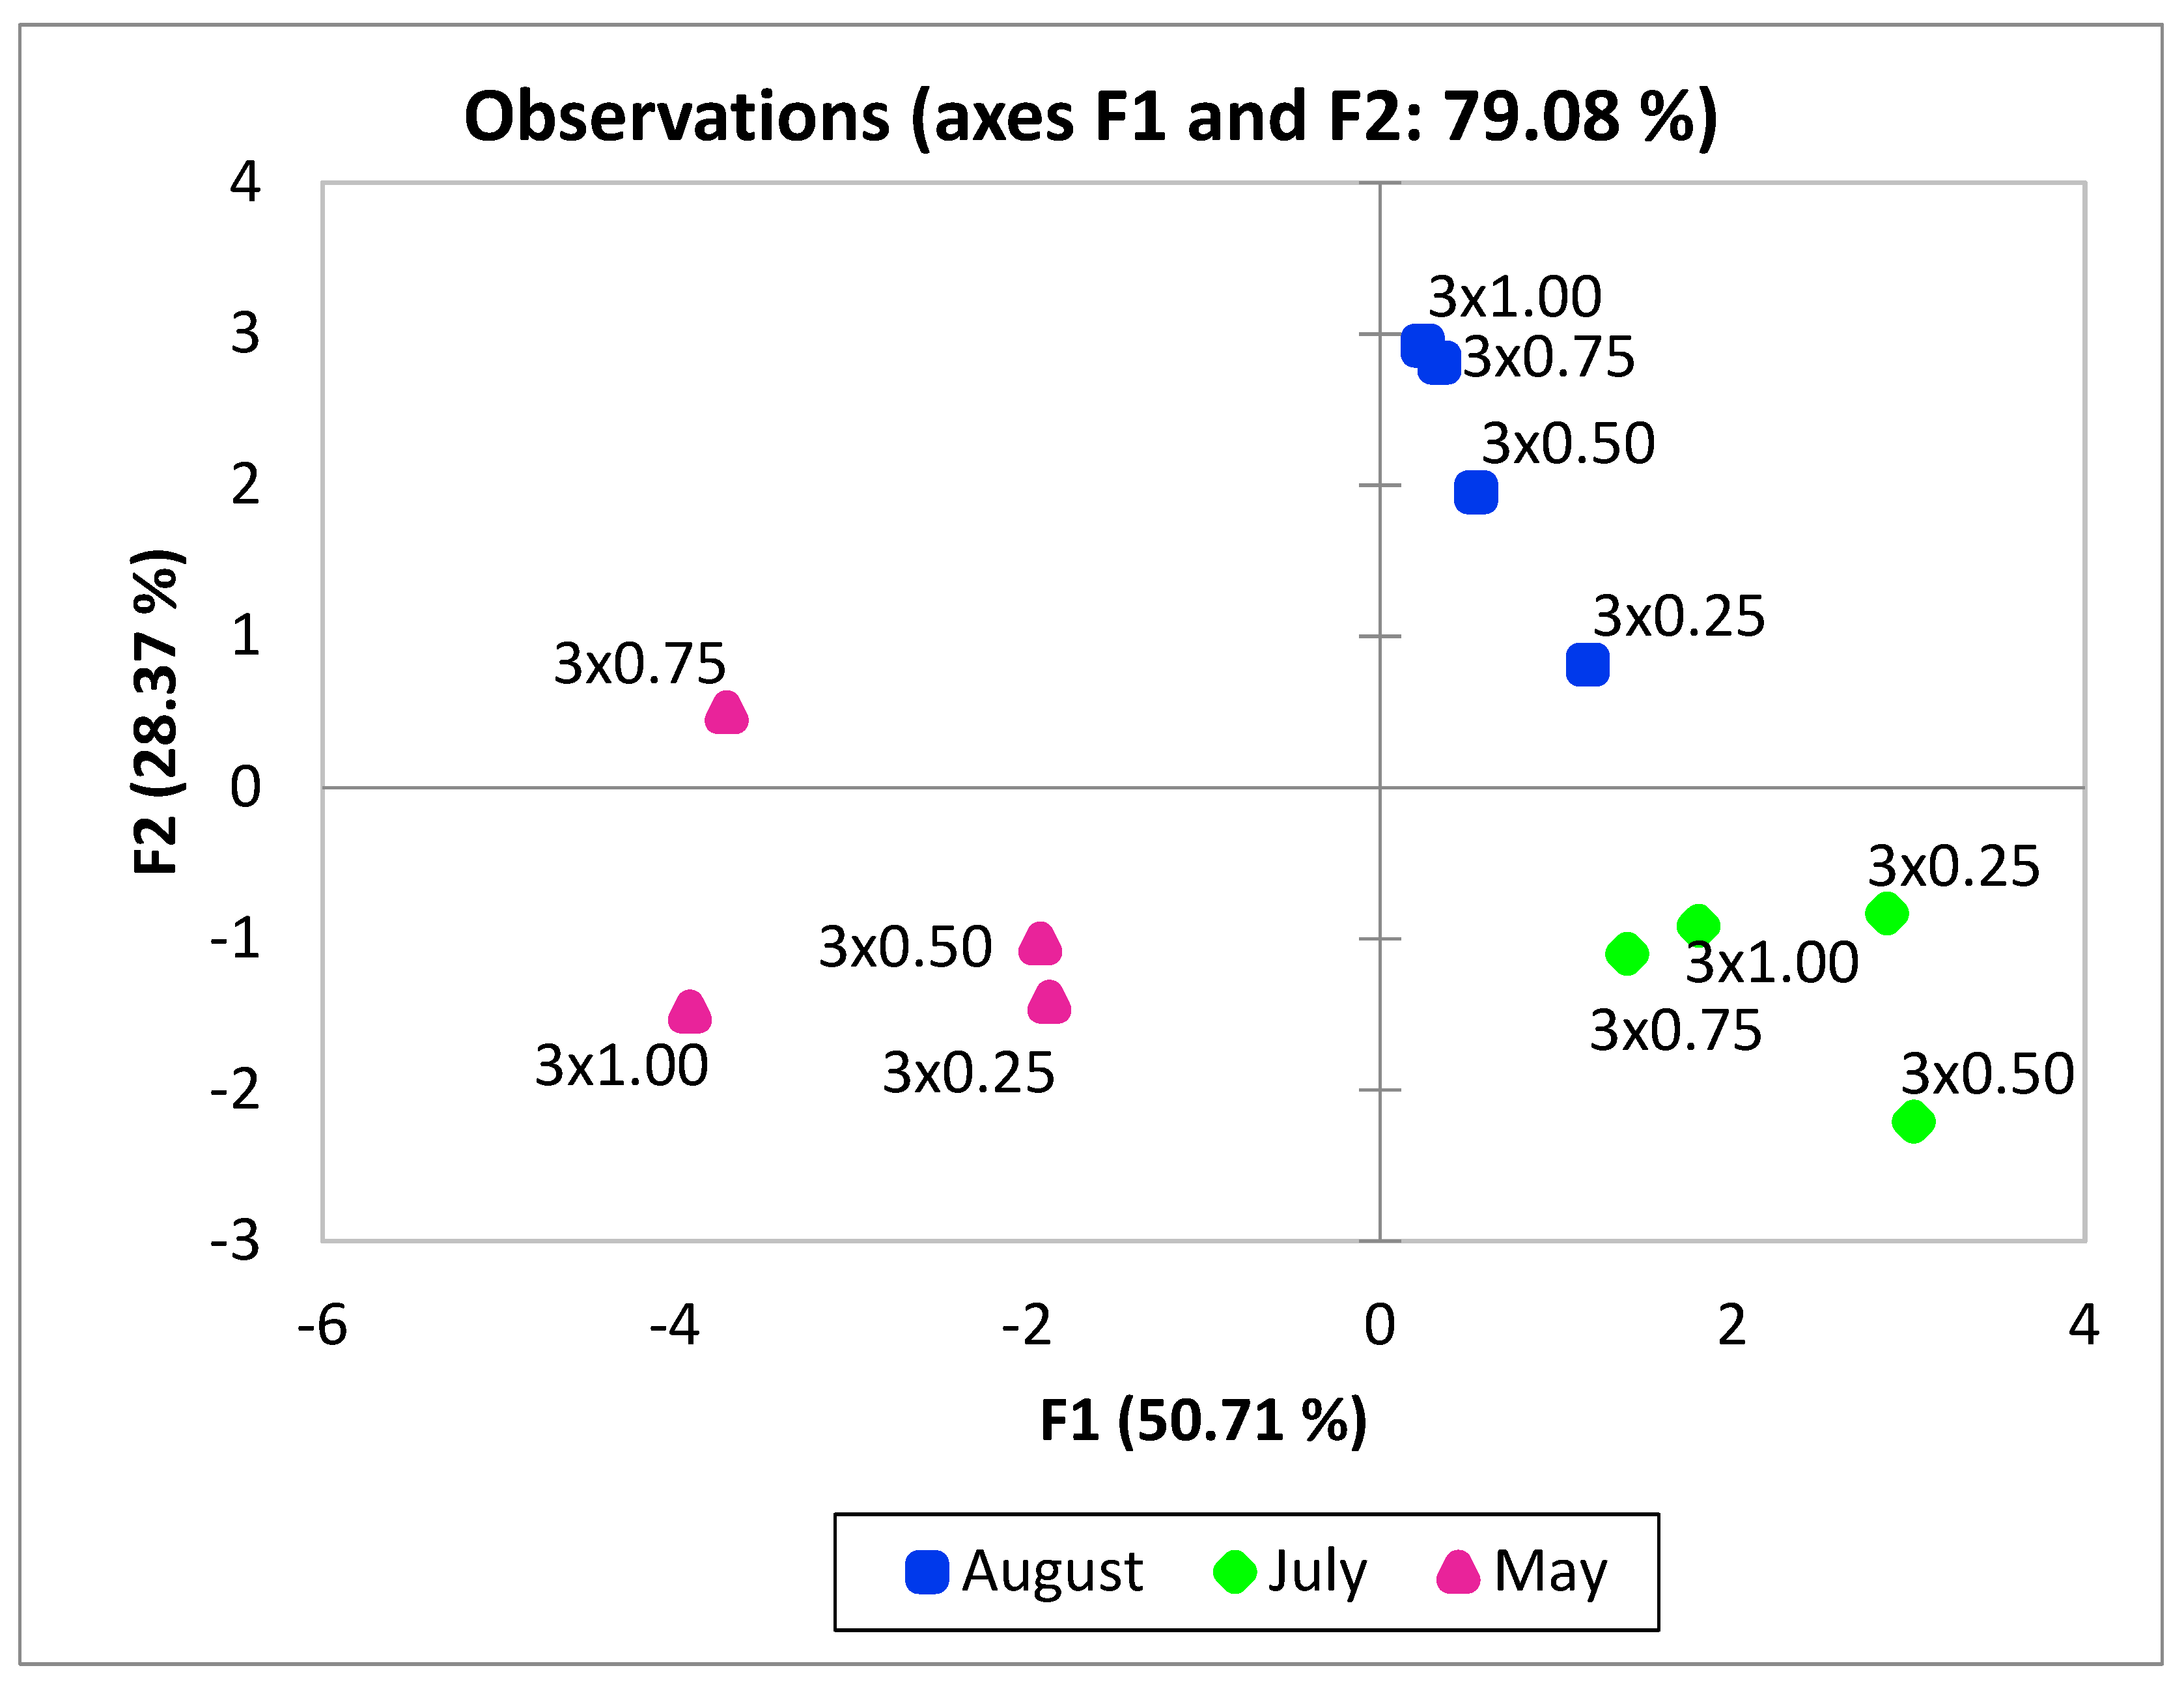
2.4. Statistical Analysis

MS Excel Version 2010 and XLStat 2017 Data Analysis and Statistical Solution for Microsoft Excel (Addinsoft, Paris, France) statistical software were used for data processing. The data are presented as mean ± standard deviation (n = 3 replications). After performing a two-way ANOVA and not establishing a substantial interaction between the factors (distance and stage of development), the data were further processed by a one-way ANOVA. Analysis of variance (ANOVA) was carried out along with Turkey multiple comparisons test for statistical analyses, p ≤ 0.05. Differences were considered to be significant at p < 0.05. Multivariate principal component analysis (PCA) was performed. The results are presented in PCA scatter plot that indicate distinct levels of photosynthetic indices, soluble sugars, chlorophylls a and b, α and β carotenes.
The agglomerative hierarchical cluster (AHC) analysis was used to generate similarity cluster diagrams based on season, density, metabolites similarity, and variables similarity.

2.5. Meteorological Conditions

The meteorological data were collected from “iMetos” meteorological station at Institute of Horticulture, LAMMC, Lithuania. Meteorological station stands in the experimental orchard. The temperature was close to perennial regardless of the year (Table 2).
In 2018, a dry, natural drought was announced in Lithuania (Lithuania, lat. 55° N, 2018). Since apple trees are perennial plants, they had enough water and no signs of drought were found. While 2019 had 14% more rainfall than perennial average, with particularly heavy rainfall, which fell out in a few days, on harvest time in August (Table 3), but such conditions had no negative impact on fruit tree development.

3. Results

Reducing planting distances up to four times (from 1 m to 0.25 m) resulted in the tendency to decreased values of photosynthetic indices. Depending on the season the rate of photosynthesis decreased up to 36.4–38.6%, stomatal conductance up to 58–60%, and transpiration rate up to 37–55% (Table S1). Stomatal conductance and transpiration rates were the highest in spring and were significantly lower in mid-summer. As fruits matured, stomatal conductance and transpiration rates increased significantly up to 27% and 23%, respectively, compared to the summer at BBCH 73–75 (Figure 2A,C). The photosynthetic rate was significantly the lowest in the spring and tended to rise until fruit ripening up to 19.4% (Figure 2B).
By evaluating the effect of planting distances, it was established that along increase of planting distances the photosynthetic parameters—photosynthesis rate, stomatal conductance, and transpiration—increased significantly throughout the season (Figure 3). Increasing the distance between trees by four times gs increased 2.5 times (Figure 3A), Pn–58% (Figure 2B), E–79% (Figure 3C).
The amount of photosynthetic pigments fluctuated throughout the year. In spring, content of chlorophyll a and b differed, but no general trends were observed, while carotenes content was significantly higher at 0.25–0.5 m distances compared to 0.5–1.0 m (Table S2). The same trends persisted at the BBCH 73–75 and BBCH 87–88. The seasonality, regardless on the distance, resulted in a significant decrease of the accumulation of chlorophylls and carotenes in spring (Figure 4A–C). Significantly the highest accumulation of chlorophylls and carotenes was at BBCH 73–75 (Figure 4B,C).
Regardless seasonality, no significant differences on photosynthetic pigments were found between the distances (Figure 5A–C).
The amount of soluble sugars in the leaves varied between treatments and seasons. Higher sugar content in the leaves accumulates in the spring for the rapid growth of shoots, which stops during the summer. The soluble sugars in apple (Malus domestica Borkh.) leaves were in order: sorbitol (27.06–42.81 mg g−1 FW), glucose (14.48–23.25 mg g−1 FW), and fructose (3.79–5.89 mg g−1 FW) (Table S3). The lowest levels of fructose (Figure 6A) and sorbitol (Figure 6C) in leaves were found during the summer at BBCH 73–75. Meanwhile, glucose lowest level was found from spring till summer, and increased at the harvest time. The amount of starch accumulated in the leaves increased threefold at BBCH 73–75 and BBCH 87–88 compared to spring (Figure 6D).
No significant differences were found in the amount of fructose and sorbitol depending on distances between apple trees. The highest contents of glucose were found in apple tree leaves planted at 0.75 m (Figure 7A–C). The decreased distance up to 4 times (from 1 m to 0.25 m) resulted the decrease of total starch up to 37–53% (Figure 7D).
PCA results show the average coordinates of individual photosynthetic indices (stomatal conductance, photosynthetic rate, transpiration rate), pigments (Chlorophyll a and b, carotene α and β), soluble sugars (fructose, sorbitol, glucose), and total starch in response to different distances between trees at different development stages during the season. The first two factors (F1 vs. F2) of the PCA, as shown in the scatterplot (Figure 8), explained 79.08% of the total data variance. F1 explained 50.71% of the total variance, whereas F2 explained 28.37%) of the total variability. The PCA scatterplot show significant differences between at different development stages during the season (Figure 8). The photosynthetic response obtained in May significantly differs from July and August.
The agglomerative hierarchical cluster (AHC) analysis was used to divide the distances between apple trees and seasonality into groups of increasing dissimilarity. Three clusters were identified in samples (Figure 9). This division correspond to different development stages during the season, which belong to 3 different clusters. With regard to stomatal conductance, photosynthetic rate, transpiration rate, photosynthetic pigments, soluble sugars, and total starch also three clusters were identified. Group, which included May and July, was characterized by low photosynthetic rate and low glucose concentration in C1, and low sorbitol concentrations in C3).

4. Discussion

During the growing season, the rate of photosynthesis mostly depends on the photoperiod; however, research showed that young leaves are more photosynthetically active during the long day, and the rate of photosynthesis decreases as the leaves age [26,30]. Significant decrease of stomatal conductance followed by transpiration rate in July and August was observed (Figure 2). According to Green [45], fruit harvesting has no significant effect on the photosynthetic rate and it is the same from fruit maturity beginning till harvest and after harvest. However, in contrast to previous statements, photosynthetic rate continued to increase till fruit harvesting (Figure 2). Photosynthetic indices were influenced not only by seasonality but also by the distance between the trees. These changes may be affected by the light penetration in the canopy (Table 1) and competition for nutrients and water. The photosynthetic rate (Figure 3B), stomatal conductance (Figure 3A) and transpiration rate (Figure 3C) increased with increasing distance between trees. A similar effect was obtained by pruning trees [46,47]. Strongly sunny plants can be damaged by sunlight, too intense sun can inhibit photosynthetic processes [26,33,48]. The distance of 1 m between fruit trees resulted the most intensive photosynthesis activity. Nevertheless, the Pn decreased uniformly with decreased distance between trees (Figure 3), but plant shedding to each other remained supporting the efficiency of photosynthesis as no significant differences in photosynthetic pigments (Figure 4) and in fructose and sorbitol (Figure 5A,B) contents were observed.
Photosynthetic activity depends on light energy receptor chlorophylls. In spring, young leaves distinguished in the lowest chlorophyll content compared to all growing season. As the vegetation remained active during fruit ripening, the aging processes of the leaves did not occur strongly and the chlorophyll had not yet begun to decay (Figure 4). Charbonnier et al. [49] states that in case of too much light chlorophyll content decreases, it can be increased by shading the plants, his research was supported by other authors [50,51]. However, in our study, apple planting distances did not show significant differences in the composition of photosynthetic pigments (Figure 5A,B).
According to Furze et al. [52] studies trees can accumulate reserves not only in the form of starch but also in the form of sugars, in apples mostly sorbitol and sucrose. Studies of fructiferous trees have shown that when the fruit begins to accumulate starch, decrease in the leaves is observed, and after fruit ripening, the starch increases rapidly in the leaves [53]. In July, when the fruit maturity began, in contrast to Fru, Glu, and Sor significant increase of starch in leaves was observed. During harvesting the contents of soluble sugars increased (Figure 6). Sorbitol transported from the leaves to the fruit is converted to fructose by sorbitol dehydrogenase [54,55], After harvesting, sorbitol is no longer transported to the fruit, leading to a significant increase in its content in the leaves (Figure 6). According to Li et al. [56] almost all of the sorbitol and half of the sucrose is converted to fructose in fruits. In agreement with Oren et al. [57] plants with stronger sunlight accumulate more—another reserve material—starch. Greater distances between trees resulted the significant increase of starch, besides significantly more starch was accumulated in July and August (Figure 7C).
Dwarfing rootstocks not only significantly reduce tree size, facilitating an increase in planting density, but also have a significant effect on photosynthesis rates, chlorophyll content, and other photosynthetic parameters [58]. Apple trees on dwarf and super-dwarf rootstocks form smaller leaves but are higher in soluble sugars and chlorophylls content [41,59]. Due to the smaller canopy and smaller leaves, compared to the vigorous rootstocks, for apple trees on super-dwarf rootstock P 22, the decreasing distance had no significant effect on the photosynthetic pigments and sugars in the leaves (Figure 5 and Figure 6).
According to the PCA scatterplot (Figure 6) and AHC (Figure 7) analysis, tested indices significantly affected by development stages, but not by the distances between apples.

5. Conclusions

The photosynthetic indices of apples are most affected by development stages during the season which is related with physiological changes of metabolites transport and distribution during fruit ripening and leaf senescence. The photosynthetic rate from spring to harvest tended to increase, the amount of starch accumulated in the leaves increased threefold during fruit maturity period compared to spring, the sugar content in leaves increased significantly during harvest time, when it was no longer transported to the fruit. The decreased distance between the apple trees increased the competition for light, water, and nutrients, followed by reduction of the photosynthetic rate, transpiration, and starch accumulation. The strongest competitive stress in apple tree cv. Auksis grafted on P22 rootstock occurs in the spring and harvest time.

Supplementary Materials

The following are available online at https://www.mdpi.com/2073-4395/10/12/1912/s1, Table S1: Effect of distances between trees and seasonality on the photosynthetic indices, Table S2: Effect of distances between trees and seasonality on the photosynthetic pigments, Table S3: Effect of distances between trees and seasonality on the carbohydrates.

Author Contributions

Investigation, writing—original draft preparation, visualization K.L.; writing—review and editing D.K.; methodology, installation and maintenance of the experiment N.U.; writing—review and editing, supervision G.S. All authors have read and agreed to the published version of the manuscript.

Funding

This research received no external funding.

Acknowledgments

This work was carried out within the framework of long-term research program “Horticulture: agrobiological basics and technologies” implemented by Lithuanian Research Centre for Agriculture and Forestry.

Conflicts of Interest

The authors declare no conflict of interest.

References

  1. Thorne, H.C.; Jones, K.H.; Peters, S.P.; Archer, S.N.; Dijk, D.-J. Daily and Seasonal Variation in the Spectral Composition of Light Exposure in Humans. Chrono Int. 2009, 26, 854–866. [Google Scholar] [CrossRef] [PubMed] [Green Version]
  2. Yang, J.; Zhang, J.; Li, C.; Zhang, Z.; Ma, F.; Li, M. Response of sugar metabolism in apple leaves subjected to short-term drought stress. Plant Physiol. Biochem. 2019, 141, 164–171. [Google Scholar] [CrossRef] [PubMed]
  3. Sheikh, A.Q.; Pandit, A.K.; Ganai, B.A. Seasonal variation in chlorophyll content of some selected plant species of Yousmarg grassland ecosystem. Asian J. Plant Sci. Res. 2017, 7, 33–36. [Google Scholar]
  4. Marron, N.; Brignolas, F.; Delmotte, F.M.; Dreyer, E. Modulation of leaf physiology by age and in response to abiotic constraints in young cuttings of two Populus deltoides times P. nigra genotypes. Ann. For. Sci. 2008, 65, 1. [Google Scholar] [CrossRef]
  5. Rodríguez-Calcerrada, J.; Limousin, J.-M.; Martin-StPaul, N.K.; Jaeger, C.; Rambal, S. Gas exchange and leaf aging in an evergreen oak: Causes and consequences for leaf carbon balance and canopy respiration. Tree Physiol. 2012, 32, 464–477. [Google Scholar] [CrossRef] [PubMed]
  6. Bielczynski, L.W.; Łącki, M.K.; Hoefnagels, I.; Gambin, A.; Croce, R. Leaf and Plant Age Affects Photosynthetic Performance and Photoprotective Capacity. Plant Physiol. 2017, 175, 1634–1648. [Google Scholar] [CrossRef]
  7. Croce, R.; Van Amerongen, H. Light-harvesting and structural organization of Photosystem II: From individual complexes to thylakoid membrane. J. Photochem. Photobiol. B Biol. 2011, 104, 142–153. [Google Scholar] [CrossRef] [Green Version]
  8. Esteban, R.; Barrutia, O.; Artetxe, U.; Fernández-Marín, B.; Hernández, A.; García-Plazaola, J.I. Internal and external factors affecting photosynthetic pigment composition in plants: A meta-analytical approach. New Phytol. 2015, 206, 268–280. [Google Scholar] [CrossRef]
  9. Cazzaniga, S.; Li, Z.; Niyogi, K.K.; Bassi, R.; Dall’Osto, L. The Arabidopsis szl1 mutant reveals a critical role of β-carotene in photosystem I photoprotection. Plant Physiol. 2012, 159, 1745–1758. [Google Scholar] [CrossRef] [Green Version]
  10. Croce, R.; Van Amerongen, H. Light-harvesting in photosystem I. Photosynth. Res. 2013, 116, 153–166. [Google Scholar] [CrossRef] [Green Version]
  11. Rattan, K. Comparative analyses of physiological assays and chlorophyll a variable fluorescence parameters: Investigating the importance of phosphorus availability in oligotrophic and eutrophic freshwater systems. Aquat. Ecol. 2017, 51, 359–375. [Google Scholar] [CrossRef]
  12. Young, A.J.; Britton, G. The distribution of α-carotene in the photosynthetic pigment-protein complexes of higher plants. Plant Sci. 1989, 64, 179–183. [Google Scholar] [CrossRef]
  13. Morganti, P. The photoprotective activity of nutraceuticals. Clin. Dermatol. 2009, 27, 166–174. [Google Scholar] [CrossRef] [PubMed]
  14. Niyogi, K.K.; Björkman, O.; Grossman, A.R. The roles of specific xanthophylls in photoprotection. Proc. Natl. Acad. Sci. USA 1997, 94, 14162–14167. [Google Scholar] [CrossRef] [PubMed] [Green Version]
  15. Holt, N.E.; Zigmantas, D.; Valkunas, L.; Li, X.P.; Niyogi, K.K.; Fleming, G.R. Carotenoid cation formation and the regulation of photosynthetic light harvesting. Science 2005, 307, 433–436. [Google Scholar] [CrossRef] [Green Version]
  16. Rafieian-Kopaei, M.; Baradaran, A.; Rafieian, M. Plants antioxidants: From laboratory to clinic. J. Nephropathol. 2013, 2, 152–153. [Google Scholar] [CrossRef]
  17. Leisso, R.; Buchanan, D.A.; Lee, J.; Mattheis, J.P.; Sater, C.; Hanrahan, I.; Watkins, C.B.; Gapper, N.; Johnston, J.W.; Schaffer, R.J.; et al. Chilling-related cell damage of apple (Malus & times; domesticaBorkh.) fruit cortical tissue impacts antioxidant, lipid and phenolic metabolism. Physiol. Plant. 2014, 153, 204–220. [Google Scholar] [CrossRef]
  18. Rosa, M.; Prado, C.; Podazza, G.; Interdonato, R.; González, J.A.; Hilal, M.; Prado, F.E. Soluble sugars: Metabolism, sensing and abiotic stress: A complex network in the life of plants. Plant Signal. Behav. 2009, 4, 388–393. [Google Scholar] [CrossRef] [Green Version]
  19. Ruan, Y.-L. Sucrose Metabolism: Gateway to Diverse Carbon Use and Sugar Signaling. Annu. Rev. Plant Biol. 2014, 65, 33–67. [Google Scholar] [CrossRef]
  20. Cheng, L.; Zhou, R.; Reidel, E.J.; Sharkey, T.D.; Dandekar, A.M. Antisense inhibition of sorbitol synthesis leads to up-regulation of starch synthesis without altering CO2 assimilation in apple leaves. Planta 2005, 220, 767–776. [Google Scholar] [CrossRef]
  21. Escobar-Gutierrez, A.J. Gaudillere, J.P. Carbon partitioning in source leaves of peach, a sorbitol synthesizing species, is modified by photosynthetic rate. Physiol. Plant 2007, 100, 353–360. [Google Scholar] [CrossRef]
  22. Filip, M.; Vlassa, M.; Coman, V.; Halmagyi, A. Simultaneous determination of glucose, fructose, sucrose and sorbitol in the leaf and fruit peel of different apple cultivars by the HPLC & ndash; RI optimized method. Food Chem. 2016, 199, 653–659. [Google Scholar] [CrossRef] [PubMed]
  23. Dai, M.; Shi, Z.; Xu, C.-J. Genome-Wide Analysis of Sorbitol Dehydrogenase (SDH) Genes and Their Differential Expression in Two Sand Pear (Pyrus pyrifolia) Fruits. Int. J. Mol. Sci. 2015, 16, 13065–13083. [Google Scholar] [CrossRef] [PubMed] [Green Version]
  24. Meng, D.; Li, C.-L.; Park, H.-J.; González, J.; Wang, J.; Dandekar, A.M.; Turgeon, B.G.; Cheng, L. Sorbitol Modulates Resistance to Alternaria alternata by Regulating the Expression of an NLR Resistance Gene in Apple. Plant Cell 2018, 30, 1562–1581. [Google Scholar] [CrossRef] [PubMed] [Green Version]
  25. Fang, T.; Cai, Y.; Yang, Q.; Ogutu, C.O.; Liao, L.; Han, Y. Analysis of sorbitol content variation in wild and cultivated apples. J. Sci. Food Agric. 2020, 100, 139–144. [Google Scholar] [CrossRef] [PubMed]
  26. Liu, Y.; Zhang, W.; Wang, Z.; Ma, L.; Guo, Y.; Ren, X.; Mei, L. Influence of shading on photosynthesis and antioxidative activities of enzymes in apple trees. Photosynthetica 2019, 57, 857–865. [Google Scholar] [CrossRef] [Green Version]
  27. Pagter, M.; Andersen, U.B.; Andersen, L. Winter warming delays dormancy release, advances budburst, alters carbohydrate metabolism and reduces yield in a temperate shrub. AoB Plants 2015, 7, 7. [Google Scholar] [CrossRef] [Green Version]
  28. Nii, N. Changes of Starch and Sorbitol in Leaves Before and After Removal of Fruits from Peach Trees. Ann. Bot. 1997, 79, 139–144. [Google Scholar] [CrossRef] [Green Version]
  29. Patrick, J.W.; Offler, C.E. Compartmentation of transport and transfer events in developing seeds. J. Exp. Bot. 2001, 52, 551–564. [Google Scholar] [CrossRef]
  30. Zhang, J.; Liu, J.; Yang, C.; Du, S.; Yang, W. Photosynthetic performance of soybean plants to water deficit under high and low light intensity. South Afr. J. Bot. 2016, 105, 279–287. [Google Scholar] [CrossRef]
  31. Li, Y.; Li, H.; Li, Y.; Zhang, S. Improving water-use efficiency by decreasing stomatal conductance and transpiration rate to maintain higher ear photosynthetic rate in drought-resistant wheat. Crop. J. 2017, 5, 231–239. [Google Scholar] [CrossRef]
  32. Lopez, G.; Boini, A.; Manfrini, L.; Torres-Ruiz, J.; Pierpaoli, E.; Zibordi, M.; Losciale, P.; Morandi, B.; Corelli-Grappadelli, L. Effect of shading and water stress on light interception, physiology and yield of apple trees. Agric. Water Manag. 2018, 210, 140–148. [Google Scholar] [CrossRef]
  33. Berry, Z.C.; Goldsmith, G. Diffuse light and wetting differentially affect tropical tree leaf photosynthesis. New Phytol. 2019, 225, 143–153. [Google Scholar] [CrossRef] [PubMed] [Green Version]
  34. Kairiūkštis, L.; Malinauskas, A. The influence of the initial density on spruce (Picea abies Karsten) wood quality. Balt. For. 2001, 7, 8–17. [Google Scholar]
  35. Kuliešis, A.; Saladis, J.; Kuliešis, A.A. Development and productivity of young scots pine stands by regulating density. Balt. For. 2010, 16, 235–246. [Google Scholar]
  36. Castedo-Dorado, F.; Crecente-Campo, F.; Alvarez-Alvarez, P.; Barrio-Anta, M. Development of a stand density management diagram for radiata pine stands including assessment of stand stability. Forestry 2009, 82, 1–16. [Google Scholar] [CrossRef]
  37. Tombesi, S.; Nardini, A.; Frioni, T.; Soccolini, M.; Zadra, C.; Farinelli, D.; Poni, S.; Palliotti, A. Stomatal closure is induced by hydraulic signals and maintained by ABA in drought-stressed grapevine. Sci. Rep. 2015, 5, 12449. [Google Scholar] [CrossRef]
  38. Wang, Z.; Li, G.; Sun, H.; Ma, L.; Guo, Y.; Zhao, Z.; Gao, H.; Mei, L. Effects of drought stress on photosynthesis and photosynthetic electron transport chain in young apple tree leaves. Biol. Open 2018, 7, bio035279. [Google Scholar] [CrossRef] [Green Version]
  39. Bhusal, N.; Han, S.-G.; Yoon, T.-M. Impact of drought stress on photosynthetic response, leaf water potential, and stem sap flow in two cultivars of bi-leader apple trees (Malus & times; domestica Borkh.). Sci. Hortic. 2019, 246, 535–543. [Google Scholar] [CrossRef]
  40. Kviklys, D.; Kviklienė, N.; Bielicki, P.; Bite, A.; Lepsis, J.; Univer, T.; Univer, N.; Uselis, N.; Lanauskas, J. Baltic fruit rootstock studies: Evaluation of apple (Malus domestica Borkh.) new rootstocks. Zemdirbyste-Agriculture 2013, 100, 441–446. [Google Scholar] [CrossRef]
  41. Samuolienė, G.; Viškelienė, A.; Sirtautas, R.; Kviklys, D. Relationships between apple tree rootstock, crop-load, plant nutritional status and yield. Sci. Hortic. 2016, 211, 167–173. [Google Scholar] [CrossRef]
  42. Kviklys, D.; Lanauskas, J.; Uselis, N.; Viškelis, J.; Viškelienė, A.; Buskienė, L. Samuolienė, G. Rootstock vigour and leaf colour affect apple tree nutrition. Zemdirb. Agric. 2017, 104, 185–190. [Google Scholar] [CrossRef] [Green Version]
  43. Ma, C.; Sun, Z.; Chen, C.; Zhang, L.; Zhu, S. Simultaneous separation and determination of fructose, sorbitol, glucose and sucrose in fruits by HPLC & ndash;ELSD. Food Chem. 2014, 145, 784–788. [Google Scholar] [CrossRef] [PubMed]
  44. Brons, C.; Olieman, C. Study of the high-performance liquid chromatographic separation of reducing sugars, applied to the determination of lactose in milk. J. Chromatogr. A 1983, 259, 79–86. [Google Scholar] [CrossRef]
  45. Greer, D.H. Limitations to photosynthesis of leaves of apple (Malus domestica) trees across the growing season prior to and after harvest. Photosynthetica 2019, 57, 483–490. [Google Scholar] [CrossRef] [Green Version]
  46. Susanti, R.A.; Hadley, P.; Daymond, A.J.; Bastide, P.; Lambert, S.; Ingram, K.; Motamayor, J.C. The effect of pruning on photosynthetic rate of cacao tree in a novel cropping system. In Proceedings of the 2017 International Symposium on Cocoa Research (ISCR), Lima, Peru, 13 November 2017. [Google Scholar]
  47. Laužikė, K.; Sirgedaitė-Šėžienė, V.; Uselis, N.; Samuolienė, G. The Impact of Stress Caused by Light Penetration and Agrotechnological Tools on Photosynthetic Behavior of Apple Trees. Sci. Rep. 2020, 10, 1–9. [Google Scholar] [CrossRef]
  48. Zeng, G.; Guo-Yun, W.; Xu, J.; Hu, M.; Zheng, J.; Wu, Z. Partial shade optimizes photosynthesis and growth in bayberry (Myrica rubra) trees. Hortic. Environ. Biotechnol. 2017, 58, 203–211. [Google Scholar] [CrossRef]
  49. Charbonnier, F.; Roupsard, O.; Le Maire, G.; Guillemot, J.; Casanoves, F.; Lacointe, A.; Vaast, P.; Allinne, C.; Audebert, L.; Cambou, A.; et al. Increased light-use efficiency sustains net primary productivity of shaded coffee plants in agroforestry system. Plant Cell Environ. 2017, 40, 1592–1608. [Google Scholar] [CrossRef]
  50. Muhidin, M.; Syam’Un, E.; Kaimuddin, M.; Musa, Y.; Sadimantara, G.R.; Usman, M.; Leomo, S.; Rakian, T.C. The effect of shade on chlorophyll and anthocyanin content of upland red rice. IOP Conf. Ser. Earth Environ. Sci. 2018, 122, 012030. [Google Scholar] [CrossRef]
  51. Chen, H.; Li, Q.-P.; Zeng, Y.-L.; Deng, F.; Ren, W.-J. Effect of different shading materials on grain yield and quality of rice. Sci. Rep. 2019, 9, 1–9. [Google Scholar] [CrossRef]
  52. Furze, M.; Huggett, B.A.; Aubrecht, D.M.; Stolz, C.D.; Carbone, M.S.; Richardson, A.D. Whole-tree nonstructural carbohydrate storage and seasonal dynamics in five temperate species. New Phytol. 2019, 221, 1466–1477. [Google Scholar] [CrossRef] [PubMed]
  53. Mesa, K.; Serra, S.; Masia, A.; Gagliardi, F.; Bucci, D.; Musacchi, S. Seasonal trends of starch and soluble carbohydrates in fruits and leaves of ‘Abbé Fétel’ pear trees and their relationship to fruit quality parameters. Sci. Hortic. 2016, 211, 60–69. [Google Scholar] [CrossRef]
  54. Berüter, J.; Feusi, M.E.S.; Rüedi, P. Sorbitol and sucrose partitioning in the growing apple fruit. J. Plant Physiol. 1997, 151, 269–276. [Google Scholar] [CrossRef]
  55. Teo, G.; Suzuki, Y.; Uratsu, S.L.; Lampinen, B.; Ormonde, N.; Hu, W.K.; DeJong, T.M.; Dandekar, A.M. Silencing leaf sorbitol synthesis alters long-distance partitioning and apple fruit quality. Proc. Natl. Acad. Sci. USA 2006, 103, 18842–18847. [Google Scholar] [CrossRef] [Green Version]
  56. Li, F.; Lei, H.; Zhao, X.; Tian, R.; Li, T. Characterization of Three Sorbitol Transporter Genes in Micropropagated Apple Plants Grown under Drought Stress. Plant Mol. Biol. Rep. 2011, 30, 123–130. [Google Scholar] [CrossRef]
  57. Oren, I.; Mannerheim, N.; Dumbur, R.; Fangmeier, A.; Buchmann, N.; Grünzweig, J.M. Patterns and dynamics of canopy–root coupling in tropical tree saplings vary with light intensity but not with root depth. New Phytol. 2019, 225, 727–739. [Google Scholar] [CrossRef]
  58. Hampson, C.R.; Quamme, H.A.; Kappel, F.; Brownlee, R.T. Varying Density with Constant Rectangularity: II. Effects on Apple Tree Yield, Fruit Size, and Fruit Color Development in Three Training Systems over Ten Years. Hortic. Sci. 2004, 39, 507–511. [Google Scholar] [CrossRef] [Green Version]
  59. Šabajevienė, G.; Kviklys, D.; Duchovskis, P. Rootstock effect on photosynthetic pigment system formation in leaves of apple cv.‘Auksis’. Sodininkystė ir Daržininkystė 2006, 25, 357. [Google Scholar]
Figure 1. Dynamics of photosynthesis rate during the day in different development stages of apple trees “Auksis” with rootstock P22. The mean value (n = 9) ± standard deviation is presented.
Agronomy 10 01912 g001
Figure 2. Effect of seasonality regardless distances between trees on the stomatal conductance gs (A), photosynthetic rate Pn (B), and transpiration rate E (C). The different letters in graphics indicate significant differences. The data were processed using one-way analysis of variance (Anova), the Turkey (HSD) test at the confidence level p = 0.05.
Agronomy 10 01912 g002
Figure 3. Effect of distances between trees on the stomatal conductance gs (A), photosynthetic rate Pn (B), and transpiration rate E (C). The different letters in graphics indicate significant differences. The data presented as an average of three measurements during the season. The data were processed using analysis of variance (Anova), the Turkey (HSD) test at the confidence level p = 0.05.
Agronomy 10 01912 g003
Figure 4. Effect of seasonality on the accumulation of chlorophyll a (A), chlorophyll b (B) carotenes α and β (C). The different letters in graphics indicate significant differences. The data presented as an average of four planting distances. The data were processed using analysis of variance (Anova), the Turkey (HSD) test at the confidence level p = 0.05.
Agronomy 10 01912 g004
Figure 5. Effect of planting distances regardless distances between trees on chlorophyll a (A), chlorophyll b (B) carotenes α and β (C). The different letters in graphics indicate significant differences. The data were processed using analysis of variance (Anova), the Turkey (HSD) test at the confidence level p = 0.05.
Agronomy 10 01912 g005
Figure 6. Effect of seasonality distances between trees on accumulation of fructose (A), glucose (B), sorbitol (C) and total starch (D). The data presented as an average of four planting distances. The different letters in graphics indicate significant differences. The data were processed using analysis of variance (Anova), the Turkey (HSD) test at the confidence level p = 0.05.
Agronomy 10 01912 g006
Figure 7. Effect of distances between trees regardless seasonality on fructose–Fru (A), glucose–Glu (B) sorbitol–Sor (C), and total starch (D). The different letters in graphics indicate significant differences. The data were processed using analysis of variance (Anova), the Turkey (HSD) test at the confidence level p = 0.05.
Agronomy 10 01912 g007
Figure 8. The PCA scatterplot, indicating distinct differences in photosynthetic rate, stomatal conductance, transpiration rate, soluble sugars, total starch and photosynthetic pigments depending on the planting distances.
Agronomy 10 01912 g008
Figure 9. Agglomerative hierarchical cluster (AHC) analysis in stomatal conductance, photosynthetic rate transpiration rate, photosynthetic pigments, soluble sugars and total starch grouped by similarities in concentration mean and intensity values.
Agronomy 10 01912 g009
Table 1. Apple tree height and crown (super spindle) radius depending on planting density. The mean value (n = 15) ± standard deviation is presented.
Distances between trees3 × 0.25 m3 × 0.50 m3 × 0.75 m3 × 1.00 m
Tree high2.5 ± 0.05 m2.5 ± 0.05 m2.5 ± 0.05 m2.5 ± 0.05 m
Canopy high2.3 ± 0.08 m2.3 ± 0.08 m2.3 ± 0.08 m2.3 ± 0.08 m
Crown radius0.50 ± 0.03 m0.81 ± 0.04 m 0.94 ± 0.04 m1.13 ± 0.06 m
Table 2. Average monthly temperature (°C) in 2018 and 2019 compared to multiannual (100-year average).
JanuaryFebruaryMarchAprilMayJuneJulyAugustSeptemberOctoberNovemberDecember
Multiannual−5.1−4.6−0.75.411.915.416.716.211.97.22.0−2.4
2018−1.4−6.5−1.710.616.717.720.319.214.58.03.6−1.0
2019−4.61.85.29.112.517.817.421.011.78.23.41.6
Table 3. Total monthly precipitation (mm) in 2018 and 2019 compared to multiannual (average of 100 years).
JanuaryFebruaryMarchAprilMayJuneJulyAugustSeptemberOctoberNovemberDecember
Multiannual52.030.037.042.052.068.079.076.068.060.065.056.0
201855.08.614.866.818.222.8117.886.217.839.413.832.4
201940.050.845.84.643.437.0121.2207.289.685.424.430.4
Publisher’s Note: MDPI stays neutral with regard to jurisdictional claims in published maps and institutional affiliations.

