The Colonization of Grape Bunch Trash by Microorganisms for the Biocontrol of Botrytis cinerea as Influenced by Temperature and Humidity


Abstract
:1. Introduction
2. Materials and Methods
2.1. Plant Material
2.2. Treatment of Bunch Trash with BCAs
2.3. Assessment of Colony Forming Units (CFUs)
2.4. Data Analysis
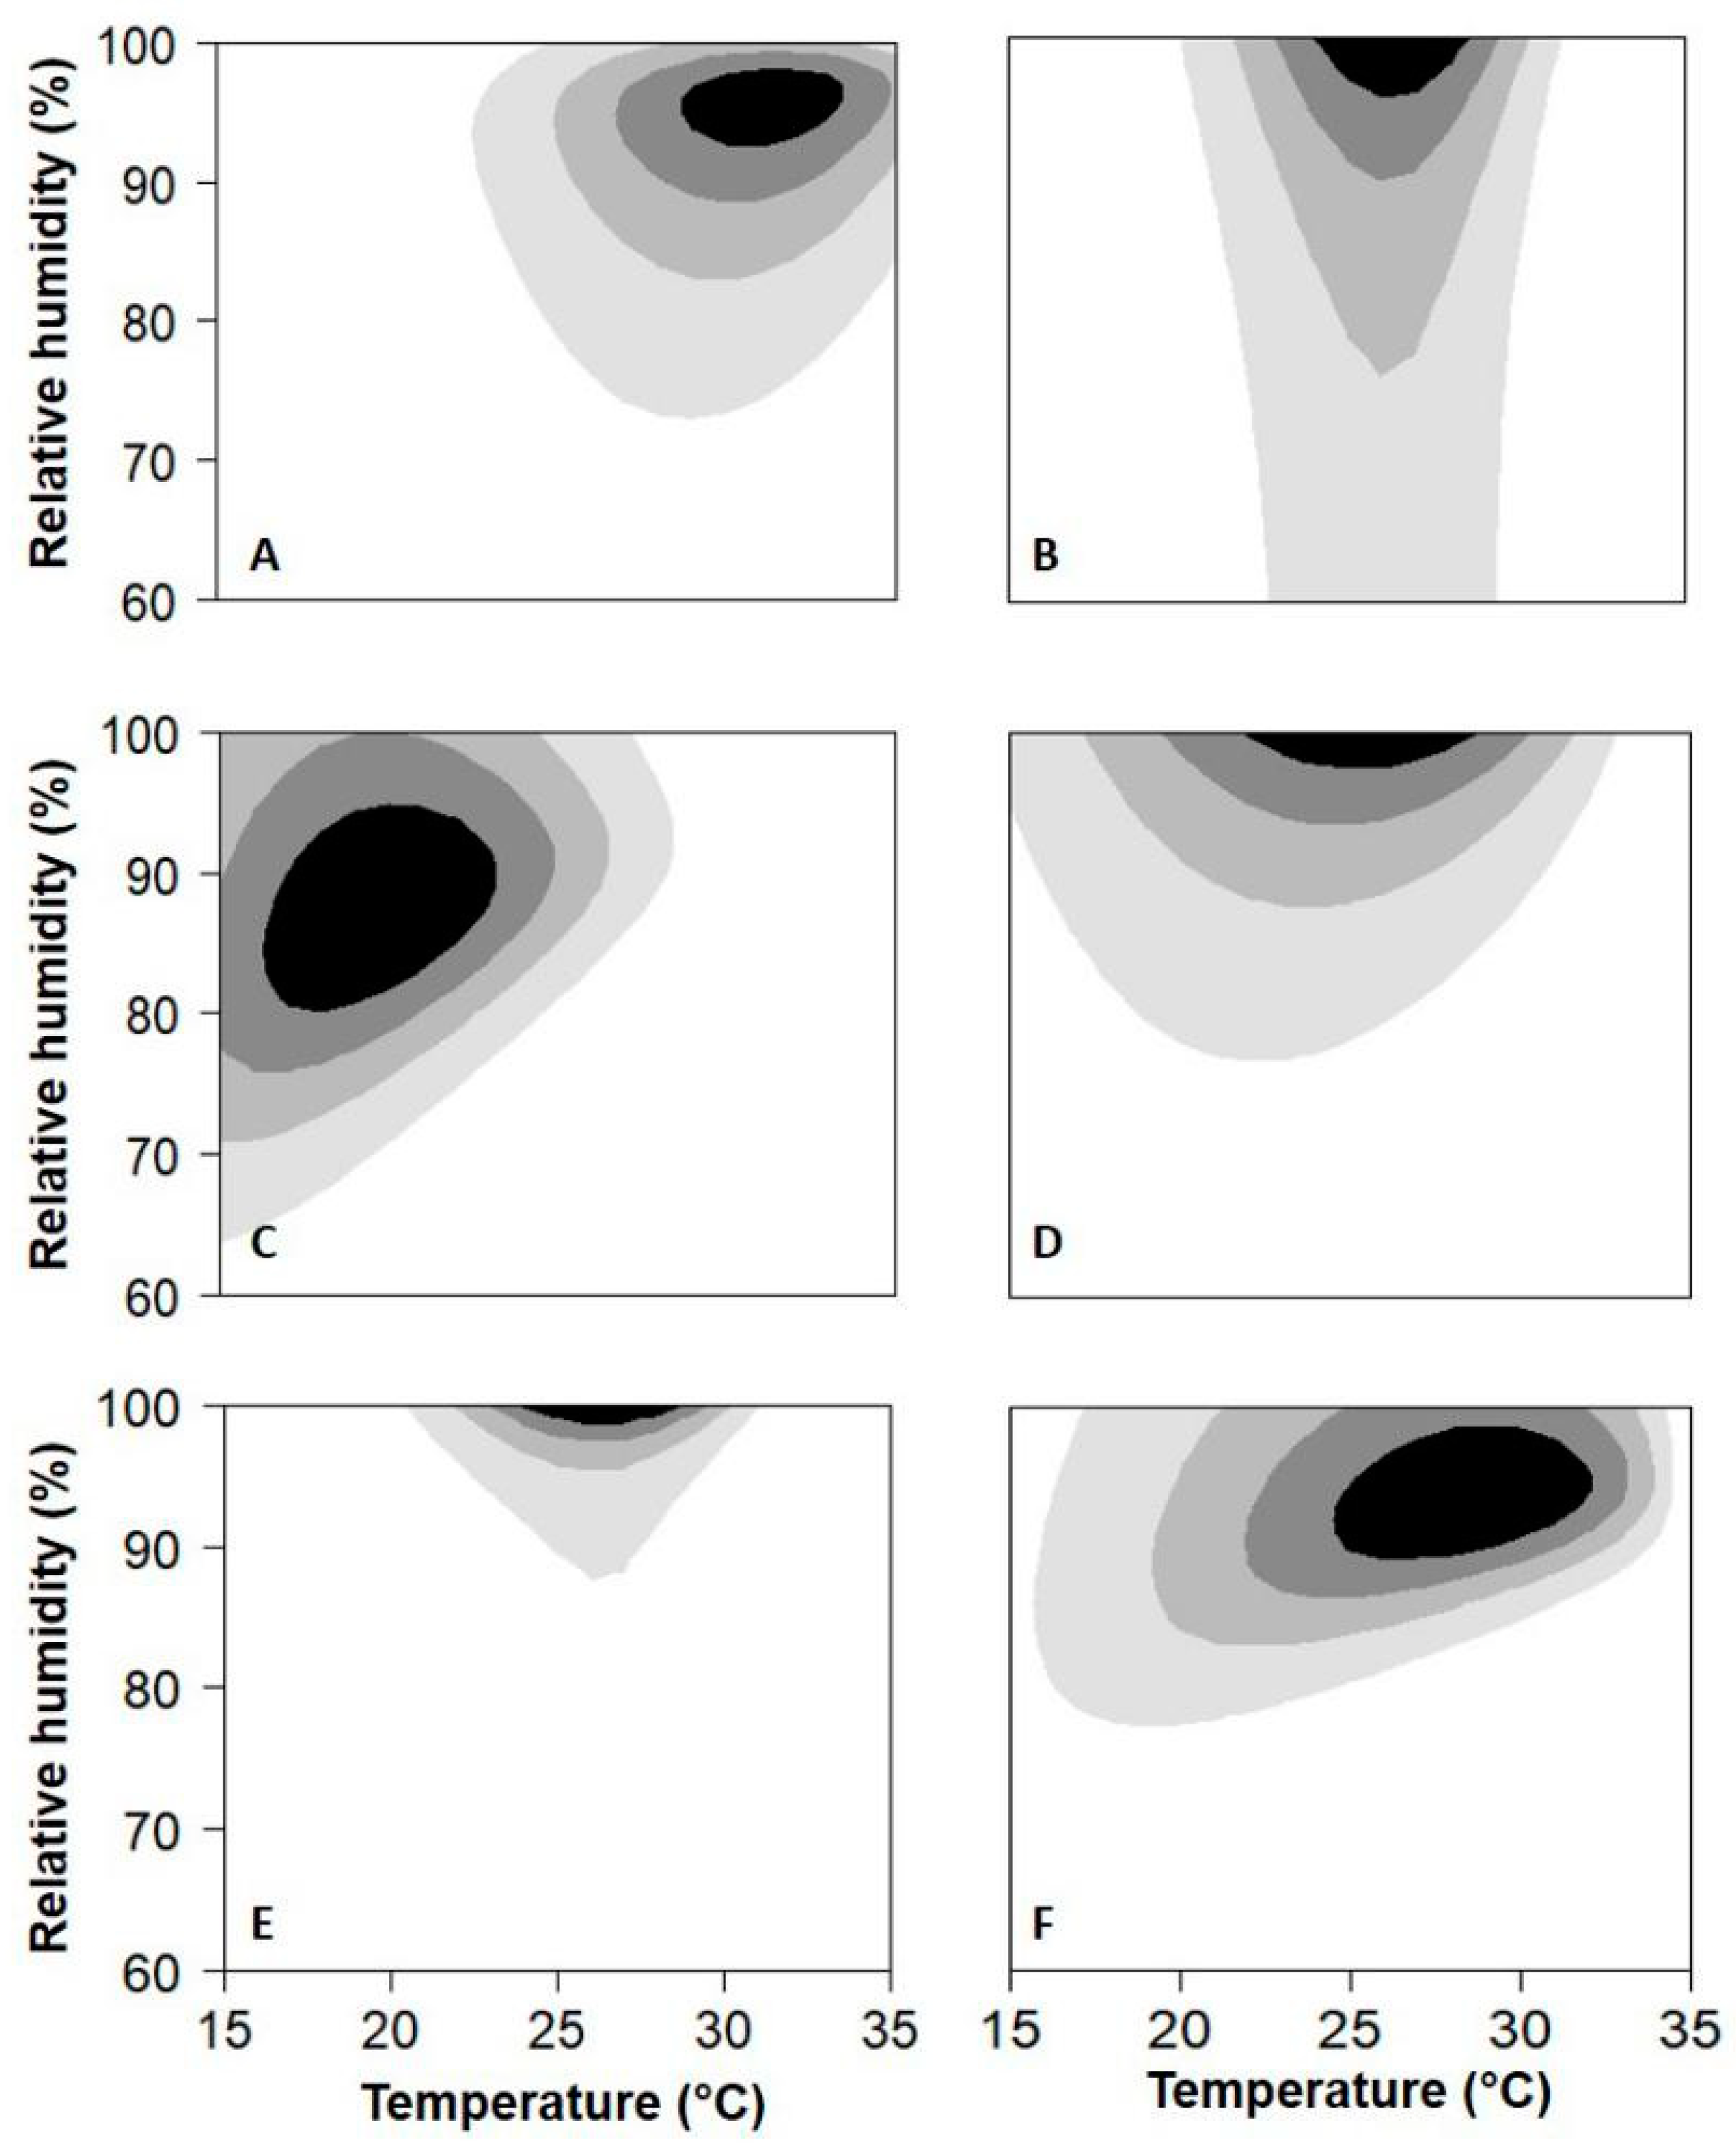
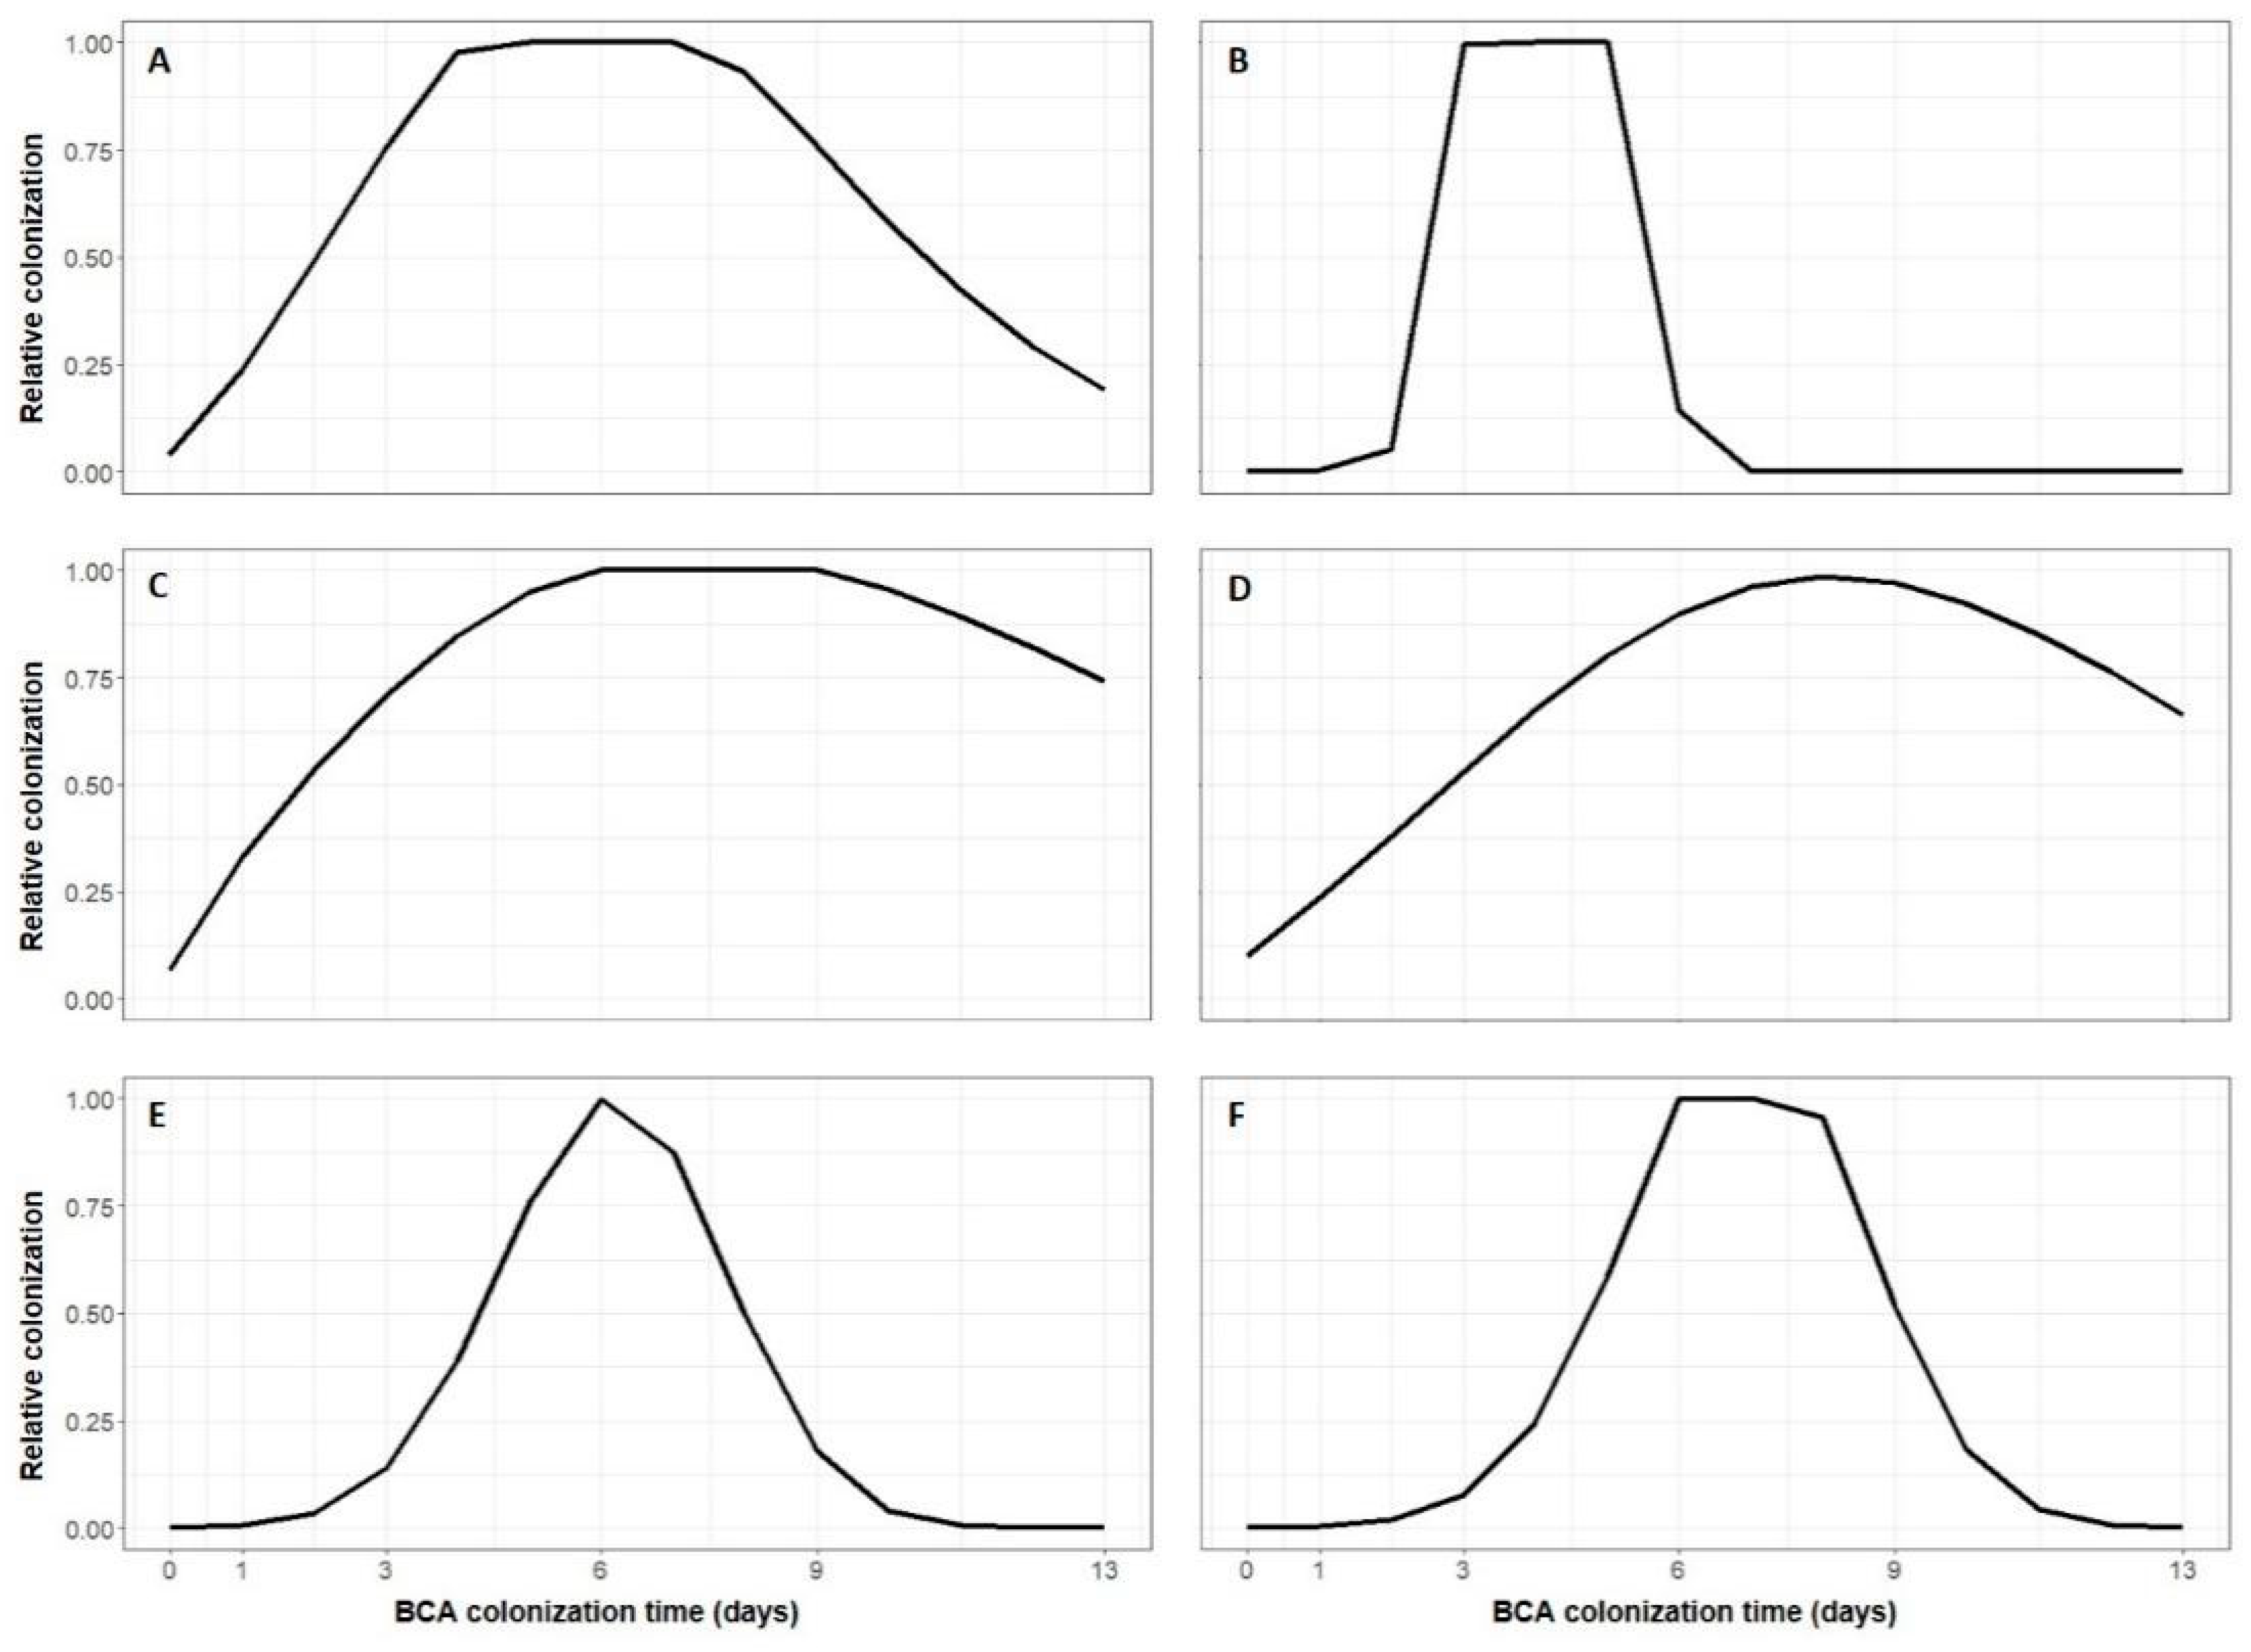
3. Results
4. Discussion
Author Contributions
Funding
Conflicts of Interest
References
- Elmer:, P.A.G.; Michailides, T.J. Epidemiology of Botrytis cinerea in orchard and vine crops. In Botrytis: Biology, Pathology and Control; Elad, Y., Williamson, B., Tudzynski, P., Delen, N., Eds.; Springer: Dordrecht, The Netherlands, 2007; pp. 243–272. [Google Scholar]
- Ciliberti, N.; Fermaud, M.; Roudet, J.; Rossi, V. Environmental conditions affect Botrytis cinerea infection of mature grape berries more than the strain or transposon genotype. Phytopathology 2015, 105, 1090–1096. [Google Scholar] [CrossRef] [PubMed] [Green Version]
- Ciliberti, N.; Fermaud, M.; Roudet, J.; Languasco, L.; Rossi, V. Environmental effects on the production of Botrytis cinerea conidia on different media, grape bunch trash, and mature berries. Aust. J. Grape Wine Res. 2016, 22, 262–270. [Google Scholar] [CrossRef]
- Ciliberti, N.; Fermaud, M.; Languasco, L.; Rossi, V. Influence of fungal strain, temperature, and wetness duration on infection of grapevine inflorescences and young berry clusters by Botrytis cinerea. Phytopathology 2015, 105, 325–333. [Google Scholar] [CrossRef] [PubMed]
- Elad, Y.; Williamson, B.; Tudzynski, P.; Delen, N. Botrytis spp. and diseases they cause in agricultural systems–An introduction. In Botrytis: Biology, Pathology and Control; Elad, Y., Williamson, B., Tudzynski, P., Delen, N., Eds.; Springer: Dordrecht, The Netherlands, 2007; pp. 1–8. [Google Scholar]
- Lorenz, D.H.; Eichhorn, K.W.; Bleiholder, H.; Klose, R.; Meier, U.; Weber, E. Phenological growth stages of the grapevine (Vitis vinifera L. ssp. vinifera)-Codes and descriptions according to the extended BBCH scale. Aust. J. Grape Wine Res. 1995, 1, 100–103. [Google Scholar] [CrossRef]
- Broome, J.; English, J.T.; Marois, J.J.; Latorre, B.A.; Aviles, J.C. Development of an infection model for Botrytis Bunch Rot of grapes based on wetness duration and temperature. Phytopathology 1995, 85, 97–102. [Google Scholar] [CrossRef]
- Bulit, J.; Lafon, R.; Guillier, G. Périodes favorables a l’application de traitments pour lutter contre la pourriture grise de la vigne. Phytiatr.-Phytopharm. 1970, 19, 159–165. [Google Scholar]
- Elmer, P.A.G.; Reglinski, T. Biosuppression of Botrytis cinerea in grapes. Plant Pathol. 2006, 55, 155–177. [Google Scholar] [CrossRef]
- Elad, Y.; Stewart, A. Microbial control of Botrytis spp. In Botrytis: Biology, Pathology and Control; Springer: Dordrecht, The Netherlands, 2007; pp. 223–241. [Google Scholar]
- Haidar, R.; Fermaud, M.; Calvo-Garrido, C.; Roudet, J.; Deschamps, A. Modes of action for biological control of Botrytis cinerea by antagonistic bacteria. Phytopathol. Mediterr. 2016, 33, 13–34. [Google Scholar]
- Calvo-Garrido, C.; Viñas, I.; Elmer, P.A.G.; Usall, J.; Teixidó, N. Suppression of Botrytis cinerea on necrotic grapevine tissues by early- season applications of natural products and biological control agents. Pest Manag. Sci. 2014, 70, 595–602. [Google Scholar] [CrossRef]
- Fedele, G.; González-Domínguez, E.; Si Ammour, M.; Languasco, L.; Rossi, V. Reduction of Botrytis cinerea colonization of and sporulation on bunch trash. Plant Dis. 2020, 104, 808–816. [Google Scholar] [CrossRef]
- Calvo-Garrido, C.; Roudet, J.; Aveline, N.; Davidou, L.; Dupin, S.; Fermaud, M. Microbial antagonism toward Botrytis Bunch Rot of grapes in multiple field tests using one Bacillus ginsengihumi strain and formulated biological control products. Front. Plant Sci. 2019, 10, 105. [Google Scholar] [CrossRef] [PubMed]
- O’Neill, T.M.; Elad, Y.; Shtienberg, D.; Cohen, A. Control of grapevine grey mould with Trichoderma harzianum T39. Biocontrol Sci Technol. 1996, 6, 139–146. [Google Scholar] [CrossRef]
- Pertot, I.; Giovannini, O.; Benanchi, M.; Caffi, T.; Rossi, V.; Mugnai, L. Combining biocontrol agents with different mechanisms of action in a strategy to control Botrytis cinerea on grapevine. Crop Prot. 2017, 97, 85–93. [Google Scholar] [CrossRef]
- Card, S.D.; Walter, M.; Jaspers, M.V.; Sztejnberg, A.; Stewart, A. Targeted selection of antagonistic microorganisms for control of Botrytis cinerea of strawberry in New Zealand. Australas. Plant Pathol. 2009, 38, 183–192. [Google Scholar] [CrossRef]
- Castoria, R.; De Curtis, F.; Lima, G.; Caputo, L.; Pacifico, S.; De Cicco, V. Aureobasidium pullulans (LS-30) an antagonist of postharvest pathogens of fruits: Study on its modes of action. Postharvest Biol. Technol. 2001, 22, 7–17. [Google Scholar] [CrossRef]
- Di Francesco, A.; Roberti, R.; Martini, C.; Baraldi, E.; Mari, M. Activities of Aureobasidium pullulans cell filtrates against Monilinia laxa of peaches. Microbiol. Res. 2015, 181, 61–67. [Google Scholar] [CrossRef]
- Di Francesco, A.; Ugolini, L.; Lazzeri, L.; Mari, M. Production of volatile organic compounds by Aureobasidium pullulans as a potential mechanism of action against postharvest fruit pathogens. Biol. Control 2015, 81, 8–14. [Google Scholar] [CrossRef]
- Fedele, G.; Bove, F.; González-Domínguez, E.; Rossi, V. A generic model accounting for the interactions among pathogens, host plants, biocontrol agents, and the environment, with parametrization for Botrytis cinerea on grapevines. Agronomy 2020, 10, 222. [Google Scholar] [CrossRef] [Green Version]
- Leifert, C.; Li, H.; Chidburee, S.; Hampson, S.; Workman, S.; Sigee, D.; Epton, H.A.S.; Harbour, A. Antibiotic production and biocontrol activity by Bacillus subtilis CL27 and Bacillus pumilus CL45. J. Appl. Bacteriol. 1995, 78, 97–108. [Google Scholar] [CrossRef]
- Tracy, E.F. The promise of biological control for sustainable agriculture: A stakeholder-based analysis. J. Sci. Policy Goverance 2014, 5. [Google Scholar]
- Steyaert, J.M.; Chomic, A.; Nieto-Jacobo, M.; Mendoza-Mendoza, A.; Hay, A.J.; Braithwaite, M.; Stewart, A. Yield and cold storage of Trichoderma conidia is influenced by substrate pH and storage temperature. J. Basic Microbiol. 2017, 57, 419–427. [Google Scholar] [CrossRef] [PubMed]
- Jeger, M.J.; Jeffries, P.; Elad, Y.; Xu, X.M. A generic theoretical model for biological control of foliar plant diseases. J. Ther. Biol. 2009, 256, 201–214. [Google Scholar] [CrossRef] [PubMed]
- Elad, Y.; Freeman, S. Biological control of fungal plant pathogens. In Agricultural Applications; Kempken, F., Ed.; Springer: Berlin/Heidelberg, Germany, 2002; pp. 93–109. [Google Scholar]
- Fedele, G.; González-Domínguez, E.; Rossi, V. Influence of environment on the biocontrol of Botrytis cinerea: A systematic literature review. In How research can Stimulate the Development of Commercial Biological Control against Plant Diseases, Progress Biologic Control; De Cal, A., Melgarejo, P., Magan, N., Eds.; Springer: Dordrecht, The Netherlands, 2020; Volume 21, in press. [Google Scholar]
- Kredics, L.; Antal, Z.; Manczinger, L.; Szekeres, A.; Kevei, F.; Nagy, E. Influence of environmental parameters on Trichoderma strains with biocontrol potential. Food Technol. Biotechnol. 2003, 41, 37–42. [Google Scholar]
- Xu, X.; Robinson, J.; Jeger, M.; Jeffries, P. Using combinations of biocontrol agents to control Botrytis cinerea on strawberry leaves under fluctuating temperatures. Biocontrol Sci. Technol. 2010, 20, 359–373. [Google Scholar] [CrossRef]
- Fedele, G.; Brischetto, C.; Rossi, V. Biocontrol of Botrytis cinerea on grape berries as influenced by temperature and humidity. Front. Plant Sci. 2020, 11, 1232. [Google Scholar] [CrossRef]
- MIPAAF (Ministero delle Politiche Agricole, Alimentari e Forestali). Linee Guida Nazionali di Produzione Integrata. Available online: https://www.reterurale.it/flex/cm/pages/ServeBLOB.php/L/IT/IDPagina/16328 (accessed on 4 May 2020).
- Dallyn, H.; Fox, A. Spoilage of material of reduced water activity by xerophilic fungi. In Microbial Growth and Survival in Extreme Environments; Gould, G.H., Corry, E.L., Eds.; Academic Press: London, UK; New York, NY, USA, 1980; pp. 129–139. [Google Scholar]
- Akaike, H. Likelihood of a model and information criteria. J. Econ. 1981, 16, 3–14. [Google Scholar] [CrossRef]
- Buck, A.L. New equations for computing vapour pressure and enhancement factor. J. Appl. Meteorol. 1981, 20, 1527–1532. [Google Scholar] [CrossRef] [Green Version]
- Analytis, S. Über die Relation zwischen biologischer Entwicklung und Temperatur bei phytopathogenen Pilzen. J. Phytopathol. 1977, 1, 64–76. [Google Scholar] [CrossRef]
- Duthie, J.A. Models of the response of foliar parasites to the combined effects of temperature and duration of wetness. Phytophathology 1997, 87, 1088–1095. [Google Scholar] [CrossRef] [Green Version]
- Reed, K.L.; Hamerly, E.R.; Dinger, B.E.; Jarvis, P.G. An analytical model for field measurement of photosynthesis. J. Appl. Ecol. 1976, 13, 925. [Google Scholar] [CrossRef]
- Wadia, K.D.R.; Butler, D.R. Relationships between temperature and latent periods of rust and leaf-spot diseases of groundnut. Plant Pathol. 1994, 43, 121–129. [Google Scholar] [CrossRef] [Green Version]
- Peleg, M.; Corradini, M.G. Microbial growth curves: What the models tell us and what they cannot. Crit. Rev. Food Sci. Nutr. 2011, 51, 917–945. [Google Scholar] [CrossRef] [PubMed]
- R Core Team. R: A Language and Environment for Statistical Computing. 2019. Available online: https://www.r-project.org/ (accessed on 3 February 2020).
- Lin, L.I.-K. A Concordance Correlation Coefficient to evaluate reproducibility. Biometrics 1989, 45, 255–268. [Google Scholar] [CrossRef] [PubMed]
- Nash, J.E.; Sutcliffe, J.V. River flow forecasting through conceptual models part I–A discussion of principles. J. Hydrol. 1970, 10, 282–290. [Google Scholar] [CrossRef]
- Wickham, H. Modelr: Modelling Functions that Work with the Pipe. R Package Version 0.1. 2019, p. 4. Available online: https://rdrr.io/cran/modelr/man/modelr-package.html (accessed on 20 October 2020).
- Signorell, A. DescTools: Tools for Descriptive Statistics. R Package Version 0.99. 2020, p. 38. Available online: https://cran.r-project.org/web/packages/DescTools/index.html (accessed on 25 October 2020).
- Madden, L.V.; Hughes, G.; van den Bosch, F. The Study of Plant Disease Epidemics; The American Phytopathological Society: Paul, MN, USA, 2007. [Google Scholar]
- Calvo-Garrido, C.; Usall, J.; Viñas, I.; Elmer, P.A.G.; Cases, E.; Teixido, N. Potential secondary inoculum sources of Botrytis cinerea and their influence on bunch rot development in dry Mediterranean climate vineyards. Pest Manag. Sci. 2014, 70, 922–930. [Google Scholar] [CrossRef]
- Holz, G.; Gütschow, M.; Coertze, S.; Calitz, F.J. Occurrence of Botrytis cinerea and subsequent disease expression at different positions on leaves and bunches of grape. Plant Dis. 2003, 87, 351–358. [Google Scholar] [CrossRef]
- Nair, N.G.; Guilbaud-Oultorfi, S.; Barchia, I.; Emmett, R. Significance of carry over inoculum, flower infection and latency on the incidence of Botrytis cinerea in berries of grapevines at harvest in new south wales. Aust. J. Exp. Agric. 1995, 35, 1177–1180. [Google Scholar] [CrossRef]
- Viret, O.; Keller, M.; Jaudzems, V.G.; Cole, F.M. Botrytis cinerea infection of grape flowers: Light and electron microscopical studies of infection sites. Phytopathology 2004, 94, 850–857. [Google Scholar] [CrossRef] [PubMed] [Green Version]
- Keller, M.; Viret, O.; Cole, F.M. Botrytis cinerea infection in grape flowers: Defense reaction, latency, and disease expression. Phytopathology 2003, 93, 316–322. [Google Scholar] [CrossRef] [PubMed] [Green Version]
- McClellan, W.D.; Hewitt, W.B. Early Botrytis Rot of Grapes: Time of infection and latency of Botrytis cinerea Pers. in Vitis vinifera L. Phytopathology 1973, 63, 1151–1157. [Google Scholar] [CrossRef]
- Seyb, A.; Gaunt, R.; Trought, M.; Frampon, C.; Balasubramaniam, R.; Jaspers, M.V. Relationship between debris within grape bunches and Botrytis infection of berries. N. Z. Plant Prot. 2000, 53, 451. [Google Scholar] [CrossRef] [Green Version]
- González-Domínguez, E.; Fedele, G.; Languasco, L.; Rossi, V. Interactions among fungicides applied at different timings for the control of Botrytis bunch rot in grapevine. Crop Prot. 2019, 120, 30–33. [Google Scholar] [CrossRef]
- González-Domínguez, E.; Fedele, G.; Caffi, T.; Delière, L.; Sauris, P.; Gramaje, D.; Ramos-Saez de Ojer, J.L.; Díaz-Losada, E.; Díez-Navajas, A.M.; Bengoa, P.; et al. A network meta-analysis provides new insight into fungicide scheduling for the control of Botrytis cinerea in vineyards. Pest Manag. Sci. 2019, 75, 324–332. [Google Scholar] [CrossRef]
- Fedele, G.; González-Domínguez, E.; Caffi, T.; Mosetti, D.; Bigot, G.; Rossi, V. Valutazione di un modello matematico per la muffa grigia della vite. In Proceedings of the ATTI Giornate Fitopatologiche, Chianciano Terme, Italy, 6–9 March 2018. [Google Scholar]
- Wolf, T.K.; Baudoin, A.B.A.M.; Martinez-Ochoa, N. Effect of floral debris removal from fruit clusters on Botrytis bunch rot of Chardonnay grapes. Vitis 1997, 36, 27–33. [Google Scholar]
- Baldacci, E.; Belli, G.; Fogliani, G. Osservazioni sul Ciclo Vitale della Botrytis Cinerea Pers nella vite. Not. Mal. delle Piante. 1962, 62, 29–43. [Google Scholar]
- Reglinski, T.; Elmer, P.A.G.; Taylor, J.T.; Parry, F.J.; Marsden, R.; Wood, P.N. Suppression of Botrytis bunch rot in Chardonnay grapevines by induction of host resistance and fungal antagonism. Australas. Plant Pathol. 2005, 34, 481–488. [Google Scholar] [CrossRef]
- Xu, X.-M.; Salama, N.; Jeffries, P.; Jeger, M.J. Numerical studies of biocontrol efficacies of foliar plant pathogens in relation to the characteristics of a biocontrol agent. Phytopathology 2010, 100, 814–821. [Google Scholar] [CrossRef] [Green Version]
- Hjeljord, L.G.; Stensvand, A.; Tronsmo, A. Effect of temperature and nutrient stress on the capacity of commercial Trichoderma products to control Botrytis cinerea and Mucor piriformis in greenhouse strawberries. Biol. Control 2000, 19, 149–160. [Google Scholar] [CrossRef]
- Köhl, J.; Lombaers-Van Der Plas, C.H.; Moehoek, W.M.L.; Kessel, G.J.T.; Goossen-Van Der Geijn, H.M. Competitive ability of the antagonists Ulocladium atrum and Gliocladium roseum at temperatures favourable for Botrytis spp. development. BioControl 1999, 44, 329–346. [Google Scholar] [CrossRef]
- Guetsky, R.; Shtienberg, D.; Elad, Y.; Dinoor, A. Combining biocontrol agents to reduce the variability of biological control. Phytopathology 2001, 91, 621–627. [Google Scholar] [CrossRef] [PubMed] [Green Version]
- Calvo, H.; Marco, P.; Blanco, D.; Oria, R.; Venturini, M.E. Potential of a new strain of Bacillus amyloliquefaciens BUZ-14 as a biocontrol agent of postharvest fruit diseases. Food Microbiol. 2017, 63, 101–110. [Google Scholar] [CrossRef] [PubMed] [Green Version]
- Teixido, N.; Vinas, I.; Usall, J.; Sanchis, V.; Magan, N. Ecophysiological responses of the biocontrol yeast Candida sake to water, temperature and pH stress. J. Appl. Microbiol. 1998, 84, 192–200. [Google Scholar] [CrossRef]
- Xu, X.M. On estimating non-linear response of fungal development under fluctuating temperatures. Plant Pathol. 1996, 45, 163–171. [Google Scholar] [CrossRef]
- Rossi, V.; Pattori, E.; Ravanetti, A.; Giosuè, S. Effect of constant and fluctuating temperature regimes on sporulation of four fungi causing head blight of wheat. J. Plant Pathol. 2002, 95–105. [Google Scholar]
- Legler, S.E.; Caffi, T.; Rossi, V. A nonlinear model for temperature-dependent development of Erysiphe necator chasmothecia on grapevine leaves. Plant Pathol. 2012, 61, 96–105. [Google Scholar] [CrossRef]
- Janisiewicz, W.J.; Korsten, L. Biological control of postharvest diseases of fruits. Annu. Rev. Phytopathol. 2002, 40, 411–441. [Google Scholar] [CrossRef] [Green Version]
- Gao, L.; Liu, X. Nutritional requirements of mycelial growth and sporulation of several biocontrol fungi in submerged and on solid culture. Microbiology 2010, 79, 612–619. [Google Scholar] [CrossRef]
- Gao, L.; Sun, M.H.; Liu, X.Z.; Che, Y.S. Effects of carbon concentration and carbon to nitrogen ratio on the growth and sporulation of several biocontrol fungi. Mycol. Res. 2007, 111, 87–92. [Google Scholar] [CrossRef] [PubMed]
- Longa, C.M.O.; Pertot, I.; Tosi, S. Ecophysiological requirements and survival of a Trichoderma atroviride isolate with biocontrol potential. J. Basic Microbiol. 2008, 48, 269–277. [Google Scholar] [CrossRef] [PubMed]
- Calvo-Garrido, C.; Viñas, I.; Usall, J.; Rodríguez-Romera, M.; Ramos, M.C.; Teixidó, N. Survival of the biological control agent Candida sake CPA-1 on grapes under the influence of abiotic factors. J. Appl. Microbiol. 2014, 117, 800–811. [Google Scholar] [CrossRef] [PubMed]


| Active Ingredient | Commercial Product (Acronym) | Producer | Label Dose (g/ha) |
|---|---|---|---|
| Bacillus amyloliquefaciens D747 | Amylo-X (AMY) | CBC S.r.l. | 2000 |
| Aureobasidium pullulans DMS 14941-14940 | Botector (BOT) | Manica S.p.A. | 400 |
| Metschnikowia fructicola | Noli (NOL) | Koppert Italia | 2000 |
| Bacillus subtilis QST 713 | Serenade max (SER) | Bayer S.p.A. | 3000 |
| Bacillus amyloliquefaciens FZB24 | Taegro (TAE) | Syngenta | 370 |
| Trichoderma atroviride SC1 | Vintec (VIN) | Belchim S.p.A. | 1000 |
| BCA | Tmin/Tmax 1 | Equation Parameters 2 | Statistics 3 | ||||||||||
|---|---|---|---|---|---|---|---|---|---|---|---|---|---|
| a | b | c | d | e | f | g | h | R2 | RMSE | CRM | CCC | ||
| AMY | 5/40 | 2.102 (0.118) | 3.000 (0.348) | 3.000 (0.207) | - | - | 15.40 (0.759) | 1.538 (1.174) | 8.00 (10.513) | 0.918 | 0.090 | −0.037 | 0.961 |
| BOT | 5/35 | 2.313 (0.076) | 2.511 (0.176) | 5.000 (1.279) | 0.686 (0.066) | 0.063 (0.043) | - | - | - | 0.892 | 0.105 | 0.069 | 0.945 |
| NOL | 0/37 | 3.641 (0.475) | 1.148 (0.217) | 5.643 (5.135) | - | - | 12.00 (4.356) | 1.00 (0.564) | 0.389 (1.206) | 0.956 | 0.071 | 0.127 | 0.902 |
| SER | 0/35 | 2.207 (0.070) | 2.712 (0.160) | 1.985 (0.361) | 0.991 (0.042) | 0.096 (0.022) | - | - | - | 0.990 | 0.032 | 0.007 | 0.995 |
| TAE | 0/35 | 2.091 (0.069) | 3.126 (0.243) | 6.350 (1.997) | 0.837 (0.084) | 0.0001 (0.0004) | - | - | - | 0.933 | 0.085 | 0.060 | 0.967 |
| VIN | 0/35 | 1.750 (0.238) | 54.762 (1.815) | 0.920 (0.704) | - | - | 12.00 (1.293) | 1.00 (0.234) | 0.269 (0.283) | 0.984 | 0.048 | 0.043 | 0.991 |
| BCA | Equation Parameters 2 | Statistics 3 | ||||||
|---|---|---|---|---|---|---|---|---|
| m1 | Tmin | Topt | Tmax | R2 | RMSE | CRM | CCC | |
| AMY | 3 | 17.24 (2.95) | 35.00 (24.41) | 40.00 (89.08) | 0.976 | 0.514 | 0.018 | 0.992 |
| BOT | 3.8 | 11.80 (1.52) | 27.00 (2.40) | 30.14 (0.56) | 0.973 | 0.468 | −0.018 | 0.989 |
| NOL | 2.7 | 11.21 (1.83) | 27.25 (2.21) | 60.00 (61.90) | 0.959 | 0.212 | 0.005 | 0.984 |
| SER | 7 | 10.00 (7.99) | 24.75 (6.20) | 33.29 (18.68) | 0.874 | 0.695 | 0.069 | 0.862 |
| TAE | 4.5 | 16.09 (9.28) | 35.485 (41.61) | 50.00 (389.91) | 0.907 | 0.844 | −0.033 | 0.963 |
| VIN | 9 | 13.83 (2.41) | 27.57 (1.36) | 40.65 (6.98) | 0.999 | 0.012 | −0.014 | 0.993 |
| BCA | Equation Parameters 1 | Statistics 2 | ||||||
|---|---|---|---|---|---|---|---|---|
| tcg | tcd | m1 | m2 | R2 | RMSE | CRM | CCC | |
| AMY | 0.33 | 3.00 (14.758) | 0.621 (0.832) | 1.436 (2.391) | 0.919 | 0.091 | 0.031 | 0.949 |
| BOT | 0.50 | 3.573 (630.049) | 1.196 (31.143) | 5.00 (1482.421) | 0.942 | 0.078 | 0.207 | 0.966 |
| NOL | 0.30 | 3.602 (24.803) | 0.50 (0.891) | 1.116 (1.874) | 0.872 | 0.111 | 0.027 | 0.946 |
| SER | 1.00 | 4.00 (6.459) | 0.770 (0.534) | 1.418 (0.374) | 0.889 | 0.095 | −0.071 | 0.941 |
| TAE | 0.50 | 2.999 (3.041) | 0.994 (0.253) | 2.299 (1.182) | 0.989 | 0.033 | 0.058 | 0.994 |
| VIN | 0.70 | 2.557 (305.636) | 1.204 (41.006) | 2.173 (89.386) | 0.792 | 0.154 | 0.277 | 0.871 |
Publisher’s Note: MDPI stays neutral with regard to jurisdictional claims in published maps and institutional affiliations. |
© 2020 by the authors. Licensee MDPI, Basel, Switzerland. This article is an open access article distributed under the terms and conditions of the Creative Commons Attribution (CC BY) license (http://creativecommons.org/licenses/by/4.0/).
Share and Cite
Fedele, G.; Brischetto, C.; González-Domínguez, E.; Rossi, V. The Colonization of Grape Bunch Trash by Microorganisms for the Biocontrol of Botrytis cinerea as Influenced by Temperature and Humidity. Agronomy 2020, 10, 1829. https://doi.org/10.3390/agronomy10111829
Fedele G, Brischetto C, González-Domínguez E, Rossi V. The Colonization of Grape Bunch Trash by Microorganisms for the Biocontrol of Botrytis cinerea as Influenced by Temperature and Humidity. Agronomy. 2020; 10(11):1829. https://doi.org/10.3390/agronomy10111829
Chicago/Turabian StyleFedele, Giorgia, Chiara Brischetto, Elisa González-Domínguez, and Vittorio Rossi. 2020. "The Colonization of Grape Bunch Trash by Microorganisms for the Biocontrol of Botrytis cinerea as Influenced by Temperature and Humidity" Agronomy 10, no. 11: 1829. https://doi.org/10.3390/agronomy10111829