Article

Seasonal Herbaceous Structure and Biomass Production Response to Rainfall Reduction and Resting Period in the Semi-Arid Grassland Area of South Africa

by
Thabo Patrick Magandana
1,
Abubeker Hassen
1,* and
Eyob Habte Tesfamariam
2
1
Department of Animal Science, Faculty of Natural and Agricultural Sciences, University of Pretoria, P/Bag X 20, Hatfield 0028, Pretoria, South Africa
2
Department of Plant and Soil Science, Faculty of Natural and Agricultural Sciences, University of Pretoria, P/Bag X 20, Hatfield 0028, Pertoria, South Africa
*
Author to whom correspondence should be addressed.
Agronomy 2020, 10(11), 1807; https://doi.org/10.3390/agronomy10111807
Submission received: 30 September 2020 / Revised: 11 November 2020 / Accepted: 13 November 2020 / Published: 17 November 2020
(This article belongs to the Special Issue Effects of Climate Change on Grassland Biodiversity and Productivity)

Abstract

:
Reduction in rainfall is amongst the major climate change manifestation phenomena, and will have a significant impact on grassland ecosystems. A split plot experimental design was used to investigate the interactive effect of rainfall reduction and resting period (RP) (70 and 90 days) on herbaceous biomass production and rainwater use efficiency in semi-arid grasslands of South Africa. Different levels of rainfall reduction (RD) were setup as main plot treatments while resting periods were set as sub-plot treatments. Four 0.5 m × 0.5 m quadrats were harvested in spring, summer and autumn of 2016/17 and 2017/18 from each sub-plot to determine herbaceous species structure, aboveground biomass production and rainwater use efficiency (RUE). Grasses were most affected by rainfall reduction than forbs at the 30% and 60% RD levels. In contrast, the forbs were more affected at 15% RD while the grasses showed resilience up to 15% reduction in rainfall. The RUE was higher at 30% RD and 70 days RP in almost all three seasons, except in spring 2016/17. Our results show that herbaceous above ground biomass showed resilience up to 15% reduction but were affected more as the rainfall reduction exceeded 30%. The future predicted reduction in rainfall may result in domination of forbs and increaser grass species in the grassland.

1. Introduction

Reduction in rainfall is amongst the major climate change manifestation phenomena, and will have a significant impact on water resource availability in the grassland [1,2]. One of the major challenges for ecologists today is assessing mechanisms that determine ecosystems recovery and response as well as ecological changes that come as a result of climatic changes and frequent extreme climate [3]. However, the response of the rangelands to the rainfall reduction is highly variable and ranges from minimal level impacts [4,5,6] to prolonged change in ecosystem function structure and recovery [7,8,9,10]. The impact of reduced rainfall and its extremes has a potential to alter the ecosystem function depending on its influence on botanical composition, abundance of the species impacted [11] and might even lead to soil erosion due to loss of vegetation cover.
Moreover, increase in precipitation variability is generally related to an increase in rainfall extremes and the frequencies of drought events [12]. The availability of water is among the most critical factors that regulate the biological activities in arid and semi-arid ecosystems [13]. Precipitation dictates to a large extent the availability of soil moisture and species abundance in arid and semi-arid ecosystems [14,15]. Harvesting by grazing animals is a common occurrence in the grassland ecosystem [16]. The intensity of harvesting and resting period can impact the ability of certain species to compete and survive under reduced rainfall condition. These disturbances could exacerbate the negative impacts of environmental stress on plant production [17].
Some studies have shown that resistance strategies have been developed by certain plant species to maintain their reproductive capabilities and stability [18]. Some plants have tolerance strategies to resist combinations of defoliation and environmental stress [19]. Indigenous grass species are often the most dominant plants because of their superior adaptation to stress and extreme conditions such as water stress and extensive grazing and thus preserve stability and productivity of the rangeland in semi-arid environments [20]. These species are categorised grossly into those species that are abundant in good rangelands but decrease in abundance when the rangeland is undergrazed or overgrazed (decreasers), those that are abundant when the rangeland is overgrazed (increaser II) and those that are abundant when the rangeland is undergrazed (increaser I) [21].
The increase in abundance of unpalatable functional groups, such as some increaser grass species and forbs, at the expense of palatable and taller grass species as a result of overgrazing and extreme weather events such as reduced rainfall are often used as an indication of land degradation [22]. However, increases in these unpalatable functional groups may not be completely unnecessary to the functioning of the rangeland as they still provide soil cover [23]. For example, forbs are high quality food for feeding of browsers in South African rangelands [24]. However, the response of forbs to common drivers of vegetation dynamics such as grazing and rainfall variability remain under studied [23].
Therefore, it is very important to know how grasslands are going to respond to decreasing rainfall that is expected in Southern African region and how the extent of reduction in rainfall and grazing by animals will affect the ecosystem species dynamics and biomass productivity of the system and state transitions. This can be done through monitoring the aboveground biomass yield, in particular by focusing on the dynamics of grass and forbs composition and abundance under future anticipated rainfall reduction climate scenarios in South Africa [13]. The objective of this study was to investigate the impact of simulated rainfall reduction/deficit and resting periods on seasonal change in herbaceous species vegetation structure and aboveground biomass production of natural grassland in the semi-arid areas of South Africa.

2. Materials and Methods

2.1. Site

The study was conducted at the University of Pretoria, Hatfield Experimental Farm. The farm is situated at an altitude of 1372 m above sea level. The coordinates of the study sites are 25°45’ S and 28°16’ E. The farm is situated in a summer rainfall area with a long-term mean annual precipitation of 674 mm [25]. The long-term mean cumulative monthly precipitation as well as the cumulative monthly precipitation during the study period is presented in Figure 1. Similarly, the long-term mean monthly temperature and mean monthly temperature during the study period is presented in Figure 2. The soil on the farm is categorized as non-calcareous with a homogenous red color, weak structure of Hutton form and is sandy loam with 20–35% clay [26] and has a pH (H2O) of 5.1 in a 2.5:1 soil–water ratio (Table 1). The research was conducted by using rainout shelters that was constructed in 2012 on a natural and unfertilized semi-arid grassland vegetation [25,27] in a site excluded from grazing for more than 60 years. Initial changes in vegetation structure associated with the rainfall reduction and resting period for 2013/14 and 2013/14 season was well described by [25].

2.2. Rainout Shelters and Resting Periods

Rainout shelters were established as described by [28] with a modification as described on [25]. Rainfall reduction was employed as main plot treatment at four different levels of reduction, namely: 15%, 30%, 60% and 0% (control/ambient). The main plot treatments were each replicated five times in a split plot experimental design and two resting period (75 and 90 days) were introduced as a sub-plot treatment. The main plots were 49 m2 (7 m × 7 m) in size and were covered by metal frame structures with v-shaped clear ultraviolet filter free acrylic bands on top. The bands were constructed with a longitudinal plate of 120° and a mean height of 1 m at the lowest side of the shelter was maintained. Each acrylic band was 7 m long and had a width of 12 cm. The 15% rainfall reduction (RD) was achieved by laying 9 acrylic bands parallel to each other with 68.5 cm space left between bands, 30% RD was achieved by laying 19 acrylic bands parallel to each other with 26.8 cm space left between bands while 60% RD was achieved by laying 35 acrylic bands parallel to each other with 8.5 cm space left between bands. Water was collected from the acrylic material and channeled through the gutters away from the plots. The experimental plots were sub-divided into two sub-plots (3.5 m × 7 m) to determine the effect of resting periods (70 and 90 days). A 25 cm ditch was excavated along the boundary of the experimental site to avoid water runoff into the plots. Ambient rainfall was measured after each rainfall event using five rain gauges that were scattered over the experimental site.

2.3. Data Collection

Plant height and diameter within each quadrat was measured using a tape measure. In order to have a similar starting point, all grasses and forbs in all pots were cut at a height of 5 cm above the ground at the beginning of the research trial in September 2016 and 2017. The sub-plot treatments were harvested to determine aboveground biomass production in spring, summer and autumn of 2016/17 and 2017/18. Four 0.5 m × 0.5 m (0.25 m2) quadrats of herbage were harvested from each sub-plot (Figure 1). Herbaceous vegetation was separated into functional groups (grasses and forbs) as shown in Table 2. Grasses were further categorized into their ecological statuses (increasers or decreasers). The harvested herbage samples were oven dried at 60 °C for 72 h to a constant weight [29]. Rainwater use efficiency (RUE) was calculated as the amount of herbaceous aboveground dry matter produced per millimeter of rainwater received between two consecutive harvests by the respective plots [25]. Long-term rainfall and temperature data were acquired from Hatfield Experimental Farm Station (Station number 0513465-1) weather records kept by the South African Weather Services.

2.4. Statistical Analysis

The plots were arranged in a split plot design with rainfall reduction being the main plot treatment while the resting period was used as the sub-plot treatment. Data on biomass yield, sward height and rain use efficiency were analysed using two-way analysis of variance (ANOVA) using general linear model procedure (Proc GLM) [30]. The factors that were tested were rainfall reduction, resting periods and their interactions on biomass yield, sward height and rainwater use efficiency. The data was tested for normality before it was analysed. Where the data were not normally distributed (Shapiro-Wilk test < 0.9), it was either transformed using square root or log function in order to normalise it. Where transformed data were used for analysis, the original mean values were retained in the table, but the mean separation were reported using the transformed data. Data for the three seasons for each year were analysed separately because of the observed significant (p < 0.05) three-way interaction effect between rainfall reduction, resting period and season during the preliminary analysis of the data. Where the factors showed significant effect on the parameters studied least square means (LSM) were separated using Tukey’s test at a significance level of 5%. The results are presented in a table, where there is no interaction between rainfall reduction and resting period. However, where there are significant interaction effects the results are presented in a figure.

3. Results

Data for studied parameters which include: sward height, overall biomass yield, herbaceous structure, ecological status of the grass species (decreasers and increasers) and rainwater use efficiency over a period of two years (2016/17 and 2017/18) were presented by seasons (spring, summer and autumn).

3.1. Seasonal Vegetation Sward Height Response to Rainfall Reduction and Resting Period

3.1.1. Spring Cut

There was a significant (p < 0.05) interaction effect between rainfall reduction and resting period on vegetation sward height in 2016/17 (Figure 3) while the interaction effect between rainfall reduction and resting period was not significant in 2017/18 (Table 3). Regardless of the rainfall reduction level, resting for 90 days resulted in a significantly (p < 0.05) taller sward height than the 70 days resting period in 2017/18 (Table 3). On the other hand, compared to control (ambient rainfall), the 60% rainfall reduction treatment significantly (p < 0.05) reduced the sward height in 2017/18 (Table 3) while similar effect was observed in 2016/17 only for plots subjected to 90 days resting period (Figure 3). In contrast, in 2016/17 season the effect of rainfall reduction was not significant when the plots were harvested after 70 days resting period. Similarly, 90 days resting resulted in a higher plant height when the rainfall reduction was set at 0%, 15% and 30%, whereas at 60% rainfall reduction resting period has no effect (p < 0.05).

3.1.2. Summer Cut

Rainfall reduction and resting period had no significant (p < 0.05) interaction effect on the vegetation sward height in both years (Table 3). Rainfall reduction at 60% significantly (p < 0.05) reduced sward height in both years. While the effect of resting period was inconsistent over the years. During the summer of 2016/17, resting periods of 70 days lead to significant increase in sward height compared with 90 days of resting period. This is in contrast to the summer season of 2017/18, which did not show any significant (p < 0.05) sword height difference between resting periods.

3.1.3. Autumn Cut

In both years, there was no significant interaction effect between rainfall reduction and resting period on the sward height. Generally, both rainfall reduction and resting period had a significant effect on vegetation sward height in both years. Unlike the spring cut, in the autumn cut, resting for 70 days resulted in a significantly taller sward height than the 90 days resting period in both 2016/17 and 2017/18 growing season. Meanwhile, compared to the ambient rainfall, 60% rainfall reduction treatment significantly (p < 0.05) reduced the sward height in 2016/17 but not in 2017/18 growing seasons (Table 3).

3.2. Seasonal Biomass Production Response of Different Functional Groups and Grass Ecological Statuses to Rainfall Reduction and Resting Period

3.2.1. Spring Harvest

In both years, there were no significant interaction effect between rainfall reduction and resting period on both grasses and forbs biomass production (Table 4 and Table 5). Regardless of the growing season, resting for 90 days resulted in a significantly (p < 0.05) higher forbs biomass production than 70 days resting period. On the other hand, 15% rainfall reduction resulted in a significantly (p < 0.05) lower forbs biomass production than the ambient rainfall in both years. Similar to forbs, resting for 90 days also resulted in a significantly (p < 0.05) higher grass biomass production than 70 days resting (Table 5). Compared to the ambient rainfall, 60% rainfall reduction severely reduced grass biomass production in both years.
There was no significant (p > 0.05) interaction effect between rainfall reduction and resting period on grass yield and ecological status. Resting for 90 days period significantly (p < 0.05) increased the biomass production of both decreaser (Table 6) and increaser (Table 7) grass species in both years. Whereas in both years, the 60% rainfall reduction treatments significantly (p < 0.05) reduced biomass production of both decreasers (Table 6) and increaser (Table 7) grass species compared to 0% rainfall reduction treatments. Moreover, resting period resulted in a significantly (p < 0.05) higher decreaser (Table 6) and increaser (Table 7) biomass yield at 90 days resting period than 70 days resting period in both years.

3.2.2. Summer Cut

There was no significant interaction (p > 0.05) effect between rainfall reduction and resting period on both forbs and grass biomass yield. Resting period had no significant (p > 0.05) effect on forbs biomass production in both years (Table 4). However, in 2016/17 a 15% rainfall reduction resulted in a significantly (p < 0.05) low forbs biomass production. In contrast, in 2017/18, rainfall reduction had no significant effect on forbs biomass production. Similar to forbs, resting period had no significant (p > 0.05) effect on grass biomass production in both years. However, the 60% rainfall reduction severely decreased grass biomass production compared to the rest of the rainfall reduction treatments.
Rainfall reduction and resting period had no significant (p > 0.05) interaction effect on grass ecological status in both years. In both years, resting period had no significant (p > 0.05) effect on biomass production of both decreaser (Table 6) and increaser (Table 7) grass species. The decreaser species grass biomass production at 60% rainfall reduction was 87% less than 0% rainfall reduction in 2016/17 while it was 82% less than 0% rainfall reduction in 2017/18. Compared to 0% reduction, the increaser grass species biomass production of the 60% rainfall reduction was reduced by 63% in 2016/17 and by 82% in 2017/18.

3.2.3. Autumn Cut

Rainfall reduction and resting period had no significant interaction effect on forbs in both years (Table 4). However, there was a significant (p < 0.05) interaction effect between resting period and rainfall reduction on grass biomass production in 2016/17 (Figure 4) but not in 2017/18 (Table 5). Unlike the spring and summer seasons, 60% rainfall reduction in autumn resulted in a significantly (p < 0.05) high forbs biomass production in 2016/17 compared to 0% and 15% rainfall reduction while both 30% and 60% rainfall reductions had a significantly high forbs biomass production in 2017/18 growing season compared to 0% and 15% rainfall reduction. The 70 days resting period resulted in a significant (p < 0.05) high forbs biomass production than 90 days resting period. Similarly, the 70 days resting period had the highest grass biomass production than 90 days resting period in both years. In 2017/18, rainfall reduction at 30% resulted in a significantly higher grass biomass production compared to the 60% rainfall reduction treatments.
During the 2016/17 season there was a significant (p < 0.05) interaction effect on grass biomass yield between rainfall reduction and resting period. The 60% rainfall reduction significantly reduced grass biomass production as compared to the rest of the rainfall reduction treatments. Resting the veld for 70 days gave more biomass production in the 0%, 15% and 30% rainfall reduction treatments, but not in the 60% rainfall reduction plots. Compared to the 90 days resting period, resting for 70 days resulted in a significantly (p < 0.05) high decreaser (Table 6) and increaser (Table 7) grass biomass yield in both years. At 60% rainfall reduction, the decreaser grass species biomass production was reduced by 89% compared to ambient treatment in 2016/17. Although the increaser grass biomass production at 60% rainfall reduction was significantly (p < 0.05) lower than 15% and 30% rainfall reduction biomass production, it was not significantly different to 0% rainfall reduction in 2016/17.

3.3. Seasonal Response in Total Aboveground Biomass Yield to Rainfall Reduction and Resting Period

3.3.1. Spring Cut

There was no significant (p > 0.05) interaction effect between rainfall reduction and resting period on total above biomass yield in both years (Figure 5a,b). Resting for 90 days interval resulted in a significantly (p < 0.05) higher overall biomass yield in 2016/17 than the 70 days resting period. In 2017/18, 60% rainfall reduction significantly (p < 0.05) reduced overall biomass yield compared to the rest of the rainfall reduction treatments. Intercepting rainfall by 60% resulted in a 75% reduction in overall biomass production in 2016/17, while it was reduced by 61% in 2017/18.

3.3.2. Summer Cut

There was no significant (p > 0.05) interaction effect between rainfall reduction and resting period on the total aboveground biomass yield in both years. In both years, 60% rainfall reduction significantly (p < 0.05) reduced overall biomass yield compared to the rest of the rainfall reduction treatments (Figure 5a,b). Intercepting rainfall by 60% resulted in 59% reduction in overall biomass production in both years compared to 0% rainfall reduction.

3.3.3. Autumn Cut

Rainfall reduction and resting period interaction had no significant (p > 0.05) effect on the total aboveground biomass yield in both years. In both years, resting for 90 days significantly decreased (p < 0.05) the overall biomass yield compared to 70 days resting period. Rainfall reduction had a significant effect on aboveground biomass (p < 0.05) at 60% rainfall reduction in 2016/17 while it had no significant effect in 2017/18 in the same season.

3.4. Seasonal Response in Rainwater Use Efficiency (RUE) to Rainfall Reduction and Resting Period

3.4.1. Spring Cut

Rainfall reduction and resting period interaction had a significant (p < 0.05) effect on rainwater use efficiency in both years (Figure 6a,b). In 2016/17, 90 days resting period resulted in a significantly high RUE compared to 70 days resting period irrespective of the rainfall reduction. In both 2016/17 and 2017/18, rain use efficiency was significantly lower at 60% rainfall reduction for 70 days resting period whereas for the 90 days resting period rainwater use efficiency was lowest, at 30% rainfall reduction in 2016/17 and at 15% rainfall reduction in 2017/18.

3.4.2. Summer Cut

There was no significant interaction effect between rainfall reduction and resting period on rain use efficiency in both years. Rainfall reduction and resting period had a significant (p < 0.05) effect on rain use efficiency in both years (Table 8). Resting for 70 days resulted in a significantly (p < 0.05) higher RUE than the 90 days resting period in both years. In both 2016/17 and 2017/18, the RUE was significantly (p < 0.05) reduced at 60% as compared to the control as well as 15% and 30% rain reduction treatments.

3.4.3. Autumn Cut

Rainfall reduction and resting period interaction had a significant (p < 0.05) effect on rainwater use efficiency in both years (Figure 6c,d). In 2016/17, the 70 days resting period had significantly higher RUE than 90 days resting period across all the rainfall reductions. In the 2016/17 season, the 60% rainfall reduction had a significantly lower RUE compared to 0% rainfall reduction at 70 days resting period, while there was no significant difference between 0% and 60% rainfall reduction at 90 days resting period.

3.5. Overall Relationship between Rainfall Reduction, Resting Period and Vegetation Response Parameters

Principal component analysis was performed in order to investigate the overall relationship between vegetation response parameters and rainfall reduction and resting period. The first two principal component analysis (PCA) accounted for 93% of the variation. The first PC were correlated with D. eriantha, decreasers, E. curvula, and increasers in both years (Figure 7 and Figure 8). D. eriantha is a decreaser grass species that contributed the most towards decreaser grass biomass production, while E. curvula had a greater contribution towards the increaser biomass in both years. On the other hand, forbs were correlated with PCA 2 though not separated into species, Ipomoea crisspes was the most dominant forb in both years. At a lower rainfall reduction (0% and 15% rainfall reduction), E. curvula correlated well with 70 days resting period (v1 = 0% RD, 70 RP and v3 = 15% RD, 70 RP) while D. eriantha correlated well with 90 days resting period (v2 = 0% RD, 90 RP and v4 = 15% RD, 90 RP) in 2016/17 (Figure 7). Similarly, forbs biomass production correlated well with a reduction in rainfall (30% and 60% rainfall reduction) at both 70 and 90 days resting period in 2016/17 (Figure 7). Unlike the 2016/17 season, D. eriantha correlated well with 70 days resting period for higher rainfall (0% and 15% reduction) while forbs correlated well with lower rainfall (30% and 60% rainfall reduction) treatments (Figure 8).

4. Discussion

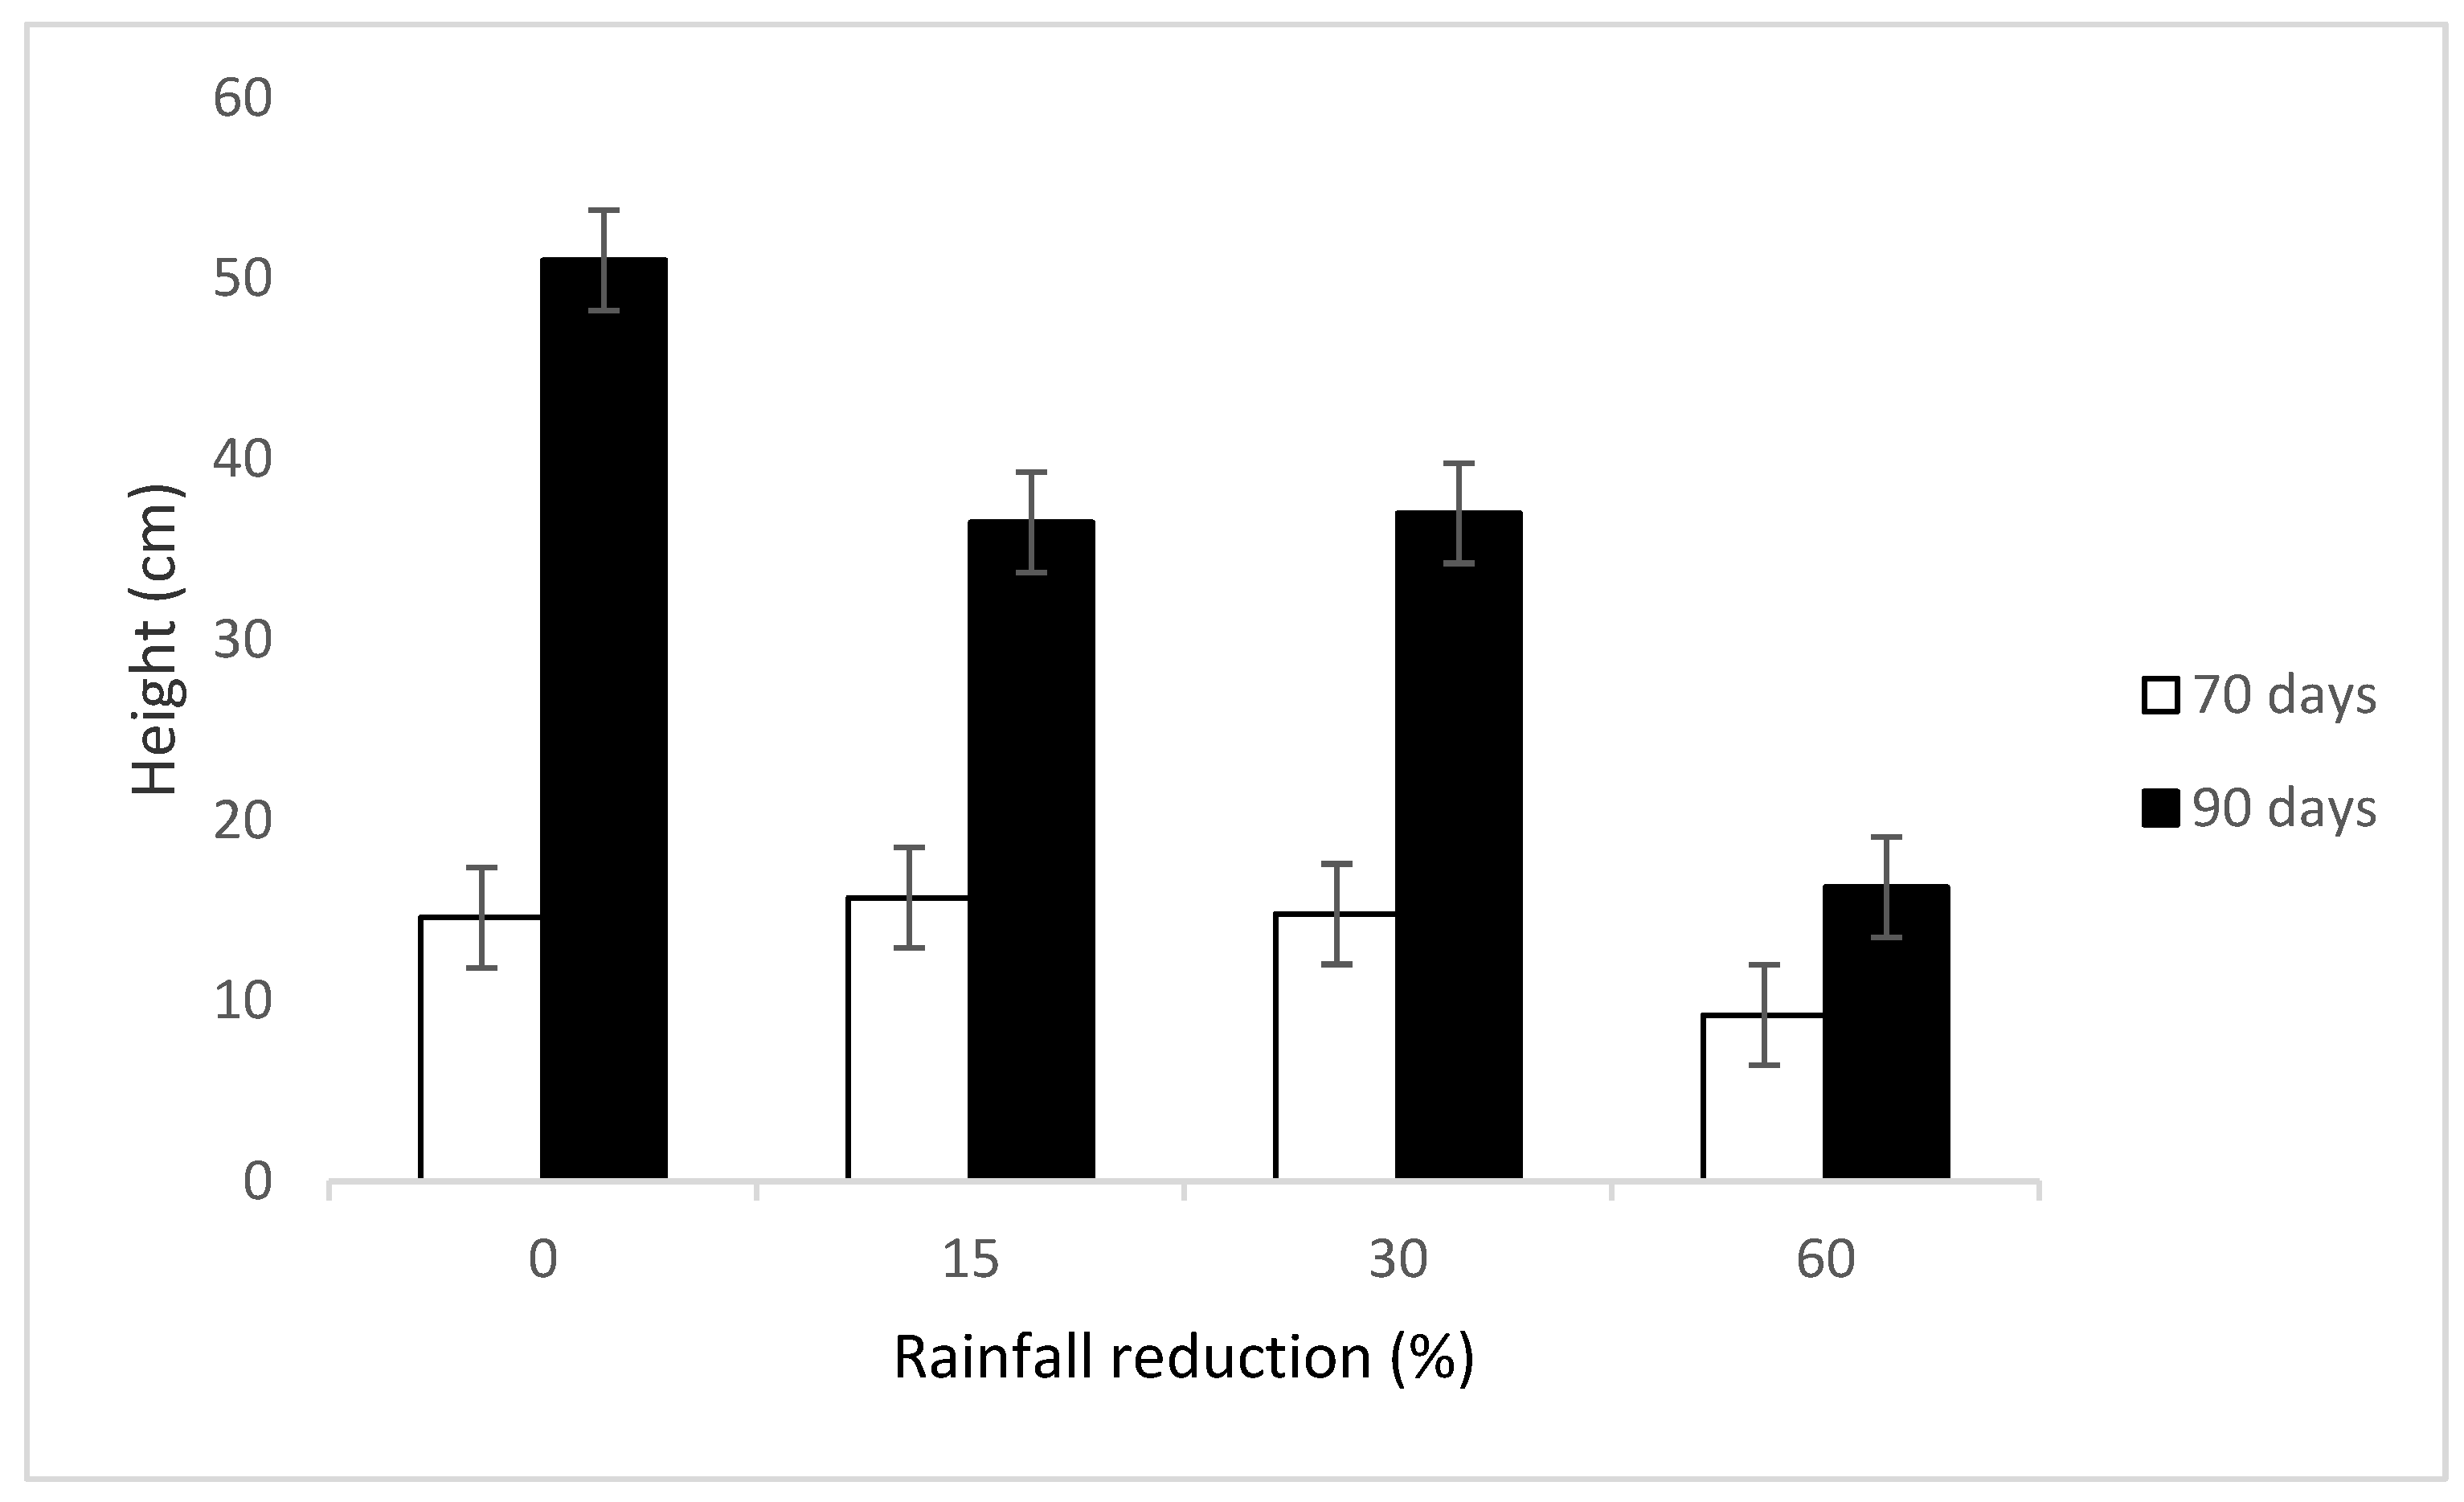
Our results showed that the vegetation height coincides with the vegetation biomass yield, which suggests that there is a positive relationship between vegetation height and the biomass production. The vegetation was taller at lower rainfall reduction treatments (0% and 15%) than the higher rainfall reduction treatments (30% and 60%). The heights were also affected by the seasons as the season with higher rainfall had taller vegetation (Table 3). Vegetation height and biomass are very much influenced by available resources such as nutrients and water [31]. These results concur with those of [32,33], who reported that vegetation growth mainly depends upon summer rainfalls, as the rainfall is generally lower in other seasons due to skewed distribution, particularly in summer rainfall areas.
Moreover, resting period affected vegetation height in different ways in different seasons. In spring, the vegetation was taller at the 90 days resting period rather than the 70 days one, while the opposite was true in autumn in both years. This is due to the fact that in spring the extra 20 days for the 90 days resting period gave this resting period extra time to grow. On the other hand, the 70 days resting period had a taller vegetation than the 90 days resting period in autumn in both years. This could be due to the fact that the 70 days resting period received rainfall just after it was cut and it was cut while getting summer rainfall and before the 90 days resting period was cut in summer. This gave an advantage to the 70 days resting period as the rainfall starts to decline in autumn and some annual plants begin to die. Height also correlated well with biomass in both years. Resting for 90 days in spring improved grass biomass production while resting for 70 days improved grass biomass yield in autumn in both years. The higher biomass yield in the 70 days resting period in autumn is attributed to the 20 day delay for 90 days cutting in December as the rainfalls are beginning to decrease while the 70 days resting period gets the summer rainfall (Figure 1).
Grass harvest sampling every 70 days and 90 days over three seasons over a period of two years was able to show seasonal differences in terms of biomass production. This was also reported by [33,34]. In this study, shorter resting periods improved grass biomass production in autumn while in spring longer resting periods improved grass biomass production. The 0%, 15% and 30% rainfall reduction treatments had higher grass biomass production than the 60% rainfall reduction. According to [35], the dominant grasses such as D. eriantha and E. curvula at different treatments appear to contribute more biomass production than the less dominant grass species such as A. conaesta and M. repens, hence these grasses will determine whether the rangeland will be productive for animal production or not.
Rainfall reduction significantly reduced overall biomass production only at 60% rainfall reduction. This clearly shows that the grasslands were able to show resilience by making adjustments in terms of species composition up to the level of 30% reduction in rainfall, however severe reduction in rainfall amount (60%) will have a significantly negative impact on rangeland productivity, which will lead to less biomass production and subsequently fodder for animal production (Figure 5). This basically means that in 2016/17 the rainfall was better and hence it was possible to improve resilience of the system or support better growth by modifying the resting period (changing from 75 to 90 days), but such benefit will not be sustained with modification of resting period once the rainfall reduction becomes severe.
The native pasture biomass production was not as such affected by up to 30% reduction in rainfall due to resilience of increaser species such as E. curvula that dominated the 15% and 30% rainfall reduction plots (Figure 7 and Figure 8). In a study that was conducted by [36], it was found that increasers are more tolerant to grazing than decreasers. In that study, three increaser grass species had a higher compensation regrowth after four episodes of clipping. As observed in our study, E. curvula is able to regrow after it has been harvested, even at high frequencies.
There is the expectation that a reduction in rainfall associated with climate change will have a negative impact on natural grazing land in arid and semi-arid areas of sub-Saharan Africa [37]. This is mainly based on the fact that forage production in these areas is sensitive to rainfall reduction as it is the case in our study site. This also concurs with the results that were reported by [38], who reported that the rangeland in the Sub-Saharan Africa is sensitive to climate change. In general, as expected season had an impact on overall biomass production as the summer season had a higher biomass production than spring and autumn in both years. Here, higher temperature and rainfall is the main driving force for the higher biomass production recorded in summer than in spring and autumn. This agrees with other studies that reported similar results pertaining the response of grassland biomass production to simulated climate change [9,35,39]. The cumulative biomass yield was significantly higher in 2016/17 than 2017/18 because of the higher rainfall amount received in 2016/17. This means that with the expected decrease in rainfall associated with climate change and subsequently decrease in biomass accumulation, the farmers need to consider to supplement the animals and/or destock where possible in the event of severe rainfall reduction encounters.
The decreasers are resilient to up to 15% reduction in rainfall thereafter, however they are more prone to rainfall reduction than the increaser grass species as they were dominant and performed much better at 0% and 15% rainfall reduction plots while increasers were better performers at 30% and relatively even at 60% rainfall reductions (Table 6 and Table 7). This implies that continued rainfall reduction will potentially lead to disappearance of decreaser grass species such as D. eriantha and T. triandra in favour of increaser grass species such as E. curvula and C. dactylon and possibly forbs. In this study, the increaser grass species were more resilient to severe reduction in rainfall (as judged from increase in rainfall reduction) than decreaser grass species. The results from this study concur with the findings reported by [40], who reported that decreaser grass species fluctuate with variation in soil moisture while the increaser grass species were more resilient to water deficiency than decreaser grass species. This means that decreasers require more water to produce the same unit of biomass than increaser grass species or forbs that require less water. However, [41] reported that vegetation changes induced by drought may shift vegetation from grass-dominated to forb dominated community. This is in agreement with the finding of this study where grasses had a higher biomass production at 0%, 15% and 30% rainfall reduction while forbs had higher biomass production at 60% rainfall reduction and dominated the 30% and 60% rain reduction plots. This could be partly related to the failure of grasses to produce seeds and grasses having shorter-lived seeds than dominant forbs [41], that have heavy seeds. Differences in the root systems of the grasses and forbs could also explain why forbs are dominant in low rainfall treatments. The deep root system of the forbs allows the forbs to access water and nutrients from the deeper soil layers, while on the other hand grasses have a shallow root system, hence they are not able to access water from the deeper soil layers [42]. In addition, in low rainfall reduction treatments, i.e., 0% and 15% RD, grasses may likely over shade and outcompete the smaller forbs for resources such as light, soil nutrients and soil water [43].
The rainfall reduction effect not only affects the aboveground biomass production and height but also modifies the species richness, diversity and functional group richness [31]. It can be said that the deep root system of the forbs enables the competitive dominance of these species over grasses under moisture deficit conditions [44,45,46]. In this study, the forbs are outcompeted by grasses at 0% and 15% as the grasses dominated these plots because of adequate precipitation that was available to support the growth of the decreaser grasses that dominated at 0% and 15% rainfall reduction and increaser grasses that dominated the 30% rainfall reduction treatments. The decline in grass production with rainfall reduction leads to a gradual build up in forb production, while the decline in forbs populations leads to grass build up [44]. Forbs perform better when there is weak grass competition while grasses are more responsive to precipitation. The differences in environmental favorability between grasses and forbs is as a result of the competition [44].
Our results show that the longer resting periods in autumn resulted in less grass biomass production, which ultimately resulted in less overall aboveground biomass production, while the effect of resting on the forbs biomass production was not consistent. The pattern of variation in seasonal precipitation had a strong significant effect on the pattern of overall biomass production in both years. The 2016/17 spring and summer seasons had lower rainfall than the 2017/18 spring and summer seasons, while the 2016/17 autumn season had a higher rainfall than the 2017/18 autumn season (Figure 1). Hence, the vegetation height and biomass production of 2017/18 in spring and summer was higher compared to the same period in 2016/17, while in autumn of 2016/17 the biomass production was higher compared to 2017/18. These results concur with those reported by [47], who reported that seasonal precipitation is an important driver of temporal dynamics of perennial grass richness. The overall biomass production was directly proportional to the rainfall amount received in each season as this was reflected through the biomass production where the overall biomass production was lower in the spring and autumn seasons of 2016/17 than the summer season in both years.
The results observed in this study could also suggest that reduction in precipitation is not the only factor that plays a major role in terms of biomass production but its interaction with resting period and the season in which the precipitation reduction occurs also matter a lot in affecting biomass production [47,48,49,50,51]. In this study, the summer season had the highest amount of precipitation in both years (2016/17 and 2017/18) and had the highest biomass production compared to the other two seasons (spring and autumn). The resting period of 90 days in the spring season in both years benefited plants by providing them enough time to recover from the physiological shock that might have been caused by cutting at the beginning of the spring season after winter and the low temperature of the winter season. The higher biomass at the 90 days resting period can be also partly attributed to grass flowering that occurred after the 70 days resting period as the flowering parts also add to biomass [52]. The biomass production was higher in summer than the spring and autumn seasons, which is because of the high summer rainfall during summer season in both years.
Overall biomass production decreases with the increase in rainfall reduction. This trend agrees with the trend reported by [40], who reported higher biomass production in plots that did not experience rainfall reduction than the ones that experienced severe rainfall reduction treatments. Seasons alter biomass production and hence it is important that interpretation of the response take seasons into consideration in order to capture these differences that occur in different seasons. This is supported by the variability of the drought effect observed from season to season elsewhere [53,54]. Annual seasonal rainfall patterns are the main drivers of rangeland ecosystem and its duration determines biomass yield [50]. This reduction in rainfall is also accompanied by an increase in monthly average temperature which exceeded the 30 years monthly average temperatures of the study site for both years (Figure 2).
The rain use efficiency (RUE) was higher at the 90 days resting period in spring at all plots than the 70 days resting period in 2016/17, while in summer of both years the highest RUE was recorded for plots with the 70 days resting period rather than the 90 days one. Our results showed that biomass production is directly proportional to rain use efficiency as the grasses with higher RUE produced higher biomass. The RUE can also be used as a tool to determine biomass production. These results agree with those reported by [55], who reported that water use efficiency coincides with the pattern of biomass production. This study was limited to biomass production as it is the harvestable biomass yield that is of primary interest for animal production.
The PCA showed that decreaser grass species that were dominated by D. eriantha were more abundant at 0% RD and 15% RD in both years. They are less competitive as compared to the increaser species dominated by E. curvula under low rainfall conditions. This implies that decreaser grass species require more water to produce more biomass (Figure 7 and Figure 8). In contrast, E. curvula, which is an increaser II grass species, was more dominant at 30% and 60% RD in 2017/18. Moreover, forbs produced more biomass at 60% RD, which means that they are able to better tolerate water stress compared to grasses (Figure 7 and Figure 8). Forbs can also be an important source of forage in overgrazed and water stressed environments [43].

5. Conclusions

Rainfall reduction associated with climate change poses a threat to our rangeland productivity as it will lead to a decrease of forage biomass yield, as shown in this study. Decreaser grasses are most likely to be negatively affected by severe rainfall reduction than increaser grasses and forbs. Although the grassland productivity has shown resilience to a reduction in rainfall up to 15%, a severe reduction will lead to changes in the herbaceous layer, which may lead to rangelands being dominated more by forbs than grasses beyond a 30% reduction in rainfall. Within the grass species, increasers are more tolerant to rainfall reduction than decreasers and thus are likely to increase with the decrease in precipitation beyond 15%. Resting the rangelands for at least 90 days or more as compared to 70 days will improve rangeland biomass productivity during the spring and summer seasons, while there is no benefit of resting for 90 days as compared to 70 days during autumn harvest. Further studies need to be conducted to quantify the impact of long-term rainfall reduction on the growth pattern of key species, soil vegetation cover, soil nitrogen and carbon dynamics, soils seedbank and soil microbiota diversity in order to accurately model and predict the impact of reduced rainfall on our rangelands in order to come up with relevant climate change adaptation strategies.

Author Contributions

All authors designed the study T.P.M. collected, analysed data and wrote the manuscript while A.H. and E.H.T. reviewed the manuscript. Conceptualization, T.P.M. and A.H.; methodology, T.P.M. and A.H.; software, T.P.M. and A.H.; validation, T.P.M., A.H. and E.H.T.; formal analysis, T.P.M., A.H. and E.H.T.; investigation, T.P.M.; resources, T.P.M. and A.H.; data curation, T.P.M. and A.H.; writing—original draft preparation, T.P.M.; writing—review and editing, T.P.M., A.H. and E.H.T.; visualization, T.P.M.; supervision, A.H. and E.H.T.; project administration, A.H.; funding acquisition, T.P.M. and A.H. All authors have read and agreed to the published version of the manuscript

Funding

The research has received funding from Agricultural Research Council center for climate change collaboration (ARC-CCCC). The first author benefited from the PhD bursary that was available from the National Research Foundation (NRF).

Acknowledgments

Authors would like to thank M. Mndela for assistance during data collection.

Conflicts of Interest

Authors declare that they have no competing interests.

Abbreviations

PCAPrincipal component analysis
Proc GLMProcedure of general linear model
RDRainfall reduction
RUERain use efficiency
SASStatistical analysis system
ANOVAAnalysis of variance
ANPPAnnual net primary productivity

References

  1. Saadat, H.; Adamowski, J.; Bonnell, R.; Sharifi, F.; Namdar, M.; Ale-Ebrahim, S. Land use and land cover classification over a large area in Iran based on single date analysis of satellite imagery. ISPRS J. Photogramm. Remote. Sens. 2011, 66, 608–619. [Google Scholar] [CrossRef]
  2. Mouatadid, S.; Raj, N.; Deo, R.; Adamowski, J.F. Input selection and data-driven model performance optimization to predict the Standardized Precipitation and Evaporation Index in a drought-prone region. Atmos. Res. 2018, 212, 130–149. [Google Scholar] [CrossRef]
  3. Smith, M.D. An ecological perspective on extreme climatic events: A synthetic definition and framework to guide future research. J. Ecol. 2011, 99, 656–663. [Google Scholar] [CrossRef]
  4. Kreyling, J.; Wenigmann, M.; Beierkuhnlein, C.; Jentsch, A. Effects of Extreme Weather Events on Plant Productivity and Tissue Die-Back are Modified by Community Composition. Ecosystems 2008, 11, 752–763. [Google Scholar] [CrossRef]
  5. Jentsch, A.; Kreyling, J.; Elmer, M.; Gellesch, E.; Glaser, B.; Grant, K.; Hein, R.; Lara, M.; Mirzae, H.; Nadler, S.E.; et al. Climate extremes initiate ecosystem-regulating functions while maintaining productivity. J. Ecol. 2011, 99, 689–702. [Google Scholar] [CrossRef]
  6. Dreesen, F.E.; De Boeck, H.J.; Janssens, I.A.; Nijs, I. Summer heat and drought extremes trigger unexpected changes in productivity of a temperate annual/biannual plant community. Environ. Exp. Bot. 2012, 79, 21–30. [Google Scholar] [CrossRef]
  7. White, T.A.; Campbell, B.D.; Kemp, P.D.; Hunt, C.L. Sensitivity of three grassland communities to simulated extreme temperature and rainfall events. Glob. Chang. Biol. 2000, 6, 671–684. [Google Scholar] [CrossRef]
  8. Haddad, N.M.; Tilman, D.; Knops, J. Long-term oscillations in grassland productivity induced by drought. Ecol. Lett. 2002, 5, 110–120. [Google Scholar] [CrossRef] [Green Version]
  9. Breshears, D.D.; Cobb, N.S.; Rich, P.M.; Price, K.P.; Allen, C.D.; Balice, R.G.; Romme, W.H.; Kastens, J.H.; Floyd, M.L.; Belnap, J.; et al. Regional vegetation die-off in response to global-change-type drought. Proc. Natl. Acad. Sci. USA 2005, 102, 15144–15148. [Google Scholar] [CrossRef] [Green Version]
  10. Ciais, P.; Reichstein, M.; Viovy, N.; Granier, A.; Ogée, J.; Allard, V.; Aubinet, M.; Buchmann, N.; Bernhofer, C.; Carrara, A.; et al. Europe-wide reduction in primary productivity caused by the heat and drought in 2003. Nature 2005, 437, 529–533. [Google Scholar] [CrossRef]
  11. Hoover, D.L.; Knapp, A.K.; Smith, M.D. Resistance and resilience of a grassland ecosystem to climate extremes. Ecology 2014, 95, 2646–2656. [Google Scholar] [CrossRef] [Green Version]
  12. Schwinning, S.; Starr, B.; Ehleringer, J. Summer and winter drought in a cold desert ecosystem (Colorado Plateau) part I: Effects on soil water and plant water uptake. J. Arid. Environ. 2005, 60, 547–566. [Google Scholar] [CrossRef]
  13. Báez, S.; Collins, S.L.; Pockman, W.T.; Johnson, J.E.; Small, E.E. Effects of experimental rainfall manipulations on Chihuahuan Desert grassland and shrubland plant communities. Oecologia 2013, 172, 1117–1127. [Google Scholar] [CrossRef] [PubMed]
  14. Muldavin, E.H.; Moore, D.I.; Collins, S.L.; Wetherill, K.; Lightfoot, D. Above ground primary production dynamics in a northern Chihuahuan Desert ecosystem. Oecologia 2008, 155, 123–132. [Google Scholar] [CrossRef]
  15. Collins, S.L.; Sinsabaugh, R.L.; Crenshaw, C.; Green, L.; Porras-Alfaro, A.; Stursova, M.; Zeglin, L.H. Pulse dynamics and microbial processes in aridland ecosystems. J. Ecol. 2008, 96, 413–420. [Google Scholar] [CrossRef]
  16. Zhang, R.; Schellenberg, M.P.; Han, G.; Wang, H.; Li, J. Drought weakens the positive effects of defoliation on native rhizomatous grasses but enhances the drought-tolerance traits of native caespitose grasses. Ecol. Evol. 2018, 8, 12126–12139. [Google Scholar] [CrossRef]
  17. Bork, E.; Broadbent, T.; Willms, W. Intermittent Growing Season Defoliation Variably Impacts Accumulated Herbage Productivity in Mixed Grass Prairie. Rangel. Ecol. Manag. 2017, 70, 307–315. [Google Scholar] [CrossRef]
  18. Volaire, F. A unified framework of plant adaptive strategies to drought: Crossing scales and disciplines. Glob. Chang. Biol. 2018, 24, 2929–2938. [Google Scholar] [CrossRef] [Green Version]
  19. Feller, U.; Vaseva, I. Extreme climatic events: Impacts of drought and high temperature on physiological processes in agronomically important plants. Front. Environ. Sci. 2014, 2, 39. [Google Scholar] [CrossRef] [Green Version]
  20. Mischkolz, J.M.; Schellenberg, M.P.; Lamb, E.G. Early productivity and crude protein content of establishing forage swards composed of combinations of native grass and legume species in mixed-grassland ecoregions. Can. J. Plant Sci. 2013, 93, 445–454. [Google Scholar] [CrossRef]
  21. Van Oudtshoorn, F. Guide to Grasses of Southern Africa, 3rd ed.; Briza Publications: Pretoria, South Africa, 2012; ISBN 978-1920217-35-8. [Google Scholar]
  22. Koerner, S.E.; Collins, S.L. Small-scale patch structure in North American and South African grasslands responds differently to fire and grazing. Landsc. Ecol. 2014, 28, 1293–1306. [Google Scholar] [CrossRef]
  23. Siebert, F.; Scogings, P. Browsing intensity of herbaceous forbs across a semi-arid savanna catenal sequence. S. Afr. J. Bot. 2015, 100, 69–74. [Google Scholar] [CrossRef]
  24. Du Toit, J.T. Large herbivores and Savanna heterogeneity. In The Kruger Experience: Ecology and Management of Savanna Heterogeneity; Du Toit, J.T., Biggs, H.C., Rogers, K.H., Eds.; Island Press: Washington, DC, USA, 2003; pp. 292–309. [Google Scholar]
  25. Talore, D.G. Quantintative and Qualitative Herbage Yield, and Carbon Sequestration in Subtropical Grasslands Subjected to Different Precipitation, Grazing Management and Land use Type. Ph.D. Thesis, University of Pretoria, Pretoria, South Africa, 2015. [Google Scholar]
  26. Soil Classification Working Group. Soil Classification-A Taxonomic System for South Africa; Department of Agricultural Development: Pretoria, South Africa, 1991. [Google Scholar]
  27. Mucina, L.; Rutherford, M.C. (Eds.) The Vegetation of South Africa, Lesotho and Swaziland; Strelitzia 19; South African National Biodiversity Institute: Pretoria, South Africa, 2006. [Google Scholar]
  28. Yahdjian, L.; Sala, O.E. A rainout shelter design for intercepting different amounts of rainfall. Oecologia 2002, 133, 95–101. [Google Scholar] [CrossRef] [PubMed]
  29. AOAC. Official Method of Analysis, 16th ed.; Association of Official Analytical: Washington, DC, USA, 2002. [Google Scholar]
  30. SAS (Stastical Analysis System). User’s Guide; SAS/STAT ® 9.2; SAS Institute Inc.: Cary, NC, USA, 2008. [Google Scholar]
  31. Derner, J.D.; Hickman, K.R.; Polley, H.W. Decreasing Precipitation Variability Does Not Elicit Major Aboveground Biomass or Plant Diversity Responses in a Mesic Rangeland. Rangel. Ecol. Manag. 2011, 64, 352–357. [Google Scholar] [CrossRef]
  32. Snyman, H.A. Influence of fir on litter production and root and litter turnover in a semi-arid grassland of South Africa. S. Afr. J. Bot. 2005, 71, 145–153. [Google Scholar] [CrossRef] [Green Version]
  33. Snyman, H. Root studies on grass species in a semi-arid South Africa along a degradation gradient. Agric. Ecosyst. Environ. 2009, 130, 100–108. [Google Scholar] [CrossRef]
  34. Ingram, L.J. Growth, Nutrient Cycling and Grazing of Three Perennial Tussock Grasses of the Pilbara Region of NW Australia. Ph.D. Thesis, Department of Botany, University of Western Australia, Crawley WA, Australia, 2002. [Google Scholar]
  35. Carlyle, C.N.; Fraser, L.H.; Turkington, R. Response of grassland biomass production to simulated climate change and clipping along an elevation gradient. Oecologia 2014, 174, 1065–1073. [Google Scholar] [CrossRef]
  36. Del-Val, E.; Crawley, M.J. Are grazing increaser species better tolerators than decreasers? An experimental assessment of defoliation tolerance in eight British grassland species. J. Ecol. 2005, 93, 1005–1016. [Google Scholar] [CrossRef]
  37. Hoffman, M.T.; Vogel, C. Climate change impacts on Africa rangelands. Rangelands 2008, 30, 12–17. [Google Scholar] [CrossRef] [Green Version]
  38. Boone, R.B.; Conant, R.T.; Sircely, J.; Thornton, P.; Herrero, M. Climate change impacts on selected global rangeland ecosystem services. Glob. Chang. Biol. 2017, 24, 1382–1393. [Google Scholar] [CrossRef]
  39. Yahdjian, L.; Sala, O.E. Vegetation structure constrains primary production response to water availability in the Patagonian steppe. Ecology 2006, 87, 952–962. [Google Scholar] [CrossRef]
  40. Snyman, H.; Van Rensburg, W. Korttermyn invloed van strawwe droogte op veldtoestand en waterverbruiksdoeltreffendheid van grasveld in die sentrale Oranje-Vrystaat. J. Grassl. Soc. S. Afr. 1990, 7, 249–256. [Google Scholar] [CrossRef]
  41. Stampfli, A.; Zeiter, M. Plant regeneration directs changes in grassland composition after extreme drought: A 13-year study in southern Switzerland. J. Ecol. 2004, 92, 568–576. [Google Scholar] [CrossRef]
  42. Nippert, J.B.; Knapp, A.K. Soil water partitioning contributes to species coexistence in tallgrass prairie. Oikos 2007, 116, 1017–1029. [Google Scholar] [CrossRef]
  43. Van Coller, H.; Siebert, F.; Scogings, P.; Ellis, S. Herbaceous responses to herbivory, fire and rainfall variability differ between grasses and forbs. S. Afr. J. Bot. 2018, 119, 94–103. [Google Scholar] [CrossRef]
  44. Vine, L. Rees Effects of Temporal Variability on Rare Plant Persistence in Annual Systems. Am. Nat. 2004, 164, 350. [Google Scholar]
  45. Suttle, K.B.; Thomsen, M.A.; Power, M.E. Species Interactions Reverse Grassland Responses to Changing Climate. Science 2007, 315, 640–642. [Google Scholar] [CrossRef] [Green Version]
  46. Harrison, S.P.; Gornish, E.S.; Copeland, S. Climate-driven diversity loss in a grassland community. Proc. Natl. Acad. Sci. USA 2015, 112, 8672–8677. [Google Scholar] [CrossRef] [Green Version]
  47. Gremer, J.R.; Bradford, J.B.; Munson, S.M.; Duniway, M.C. Desert grassland responses to climate and soil moisture suggest divergent vulnerabilities across the southwestern United States. Glob. Chang. Biol. 2015, 21, 4049–4062. [Google Scholar] [CrossRef] [Green Version]
  48. Huxman, T.E.; Snyder, K.A.; Tissue, D.; Leffler, A.J.; Ogle, K.; Pockman, W.T.; Sandquist, D.R.; Potts, D.L.; Schwinning, S. Precipitation pulses and carbon fluxes in semiarid and arid ecosystems. Oecologia 2004, 141, 254–268. [Google Scholar] [CrossRef]
  49. Schwinning, S.; Sala, O.E. Hierarchy of responses to resource pulses in arid and semi-arid ecosystems. Oecologia 2004, 141, 211–220. [Google Scholar] [CrossRef] [PubMed]
  50. Heisler-White, J.L.; Knapp, A.K.; Kelly, E.F. Increasing precipitation event size increases aboveground net primary productivity in a semi-arid grassland. Oecologia 2008, 158, 129–140. [Google Scholar] [CrossRef] [PubMed]
  51. Weltzin, J.F.; Loik, M.E.; Schwinning, S.; Williams, D.G.; Fay, P.A.; Haddad, B.M.; Harte, J.; Huxman, T.E.; Knapp, A.K.; Lin, G.; et al. Assessing the Response of Terrestrial Ecosystems to Potential Changes in Precipitation. BioScience 2003, 53, 941–952. [Google Scholar] [CrossRef]
  52. Na, C.-I.; Sollenberger, L.E.; Erickson, J.E.; Woodard, K.R.; Vendramini, J.M.B.; Silveira, M.L. Management of Perennial Warm-Season Bioenergy Grasses. I. Biomass Harvested, Nutrient Removal, and Persistence Responses of Elephantgrass and Energycane to Harvest Frequency and Timing. BioEnergy Res. 2014, 8, 581–589. [Google Scholar] [CrossRef]
  53. Chaves, M.M. Mechanisms underlying plant resilience to water deficits: Prospects for water-saving agriculture. J. Exp. Bot. 2004, 55, 2365–2384. [Google Scholar] [CrossRef] [PubMed] [Green Version]
  54. De Boeck, H.J.; Dreesen, F.E.; Janssens, I.A.; Nijs, I. Whole-system responses of experimental plant communities to climate extremes imposed in different seasons. New Phytol. 2010, 189, 806–817. [Google Scholar] [CrossRef]
  55. Mårtensson, L.M.; Carlsson, G.; Prade, T.; Kørup, K.; Lærke, P.E.; Jensen, E.S. Water use efficiency and shoot biomass production under water limitation is negatively correlated to the discrimination against 13C in the C3 grasses Dactylis glomerata, Festuca arundinacea and Phalaris Arundinacea. Plant Physiol. Biochem. 2017, 113, 1–5. [Google Scholar] [CrossRef]
Figure 1. Time of harvest and long-term average and experimental average monthly rainfall (mm) for University of Pretoria Experimental Farm.
Agronomy 10 01807 g001
Figure 2. Long-term average and experimental year monthly average temperatures (°C) for University of Pretoria Experimental Farm.
Agronomy 10 01807 g002
Figure 3. Interaction effect of rainfall reduction and resting period on vegetation sward height in spring 2016/17 (bars indicate standard error values).
Agronomy 10 01807 g003
Figure 4. Mean interaction effect of rainfall reduction and resting period on grass biomass yield in autumn 2016/17 (bars indicate standard error values).
Agronomy 10 01807 g004
Figure 5. Interaction effect of resting period and rainfall reduction on overall aboveground biomass yield (kg. ha−1) in (a) 2016/17 and (b) 2017/18 (bars indicate standard error values).
Agronomy 10 01807 g005aAgronomy 10 01807 g005b
Figure 6. Interaction effects of rainfall reduction and resting period on rainwater use efficiency in (a) spring 2016/17, (b) spring 2017/18, (c) autumn 2016/17 and (d) autumn 2017/18 (bars indicate standard error values).
Agronomy 10 01807 g006
Figure 7. Principal component analysis (PCA) plot showing the effect of resting period and rainfall reduction on overall biomass yield (kg.ha−1) and other vegetation parameters in 2016/17. Key to symbols: Black dots (●) indicate treatment and the season and vectors ( Agronomy 10 01807 i001) indicate the direction of the relationship between vegetation parameters and treatments. The longer the vector radiating from the centre, the stronger the effects of the resting period and the resting period and the closer the dot to the vector the stronger the relationship between species and soil property. V1 = 0% RD, 70 RP, V2 = 0% RD, 90 RP, V3 = 15% RD, 70 RP, V4 = 15% RD, 90 RP, V5 = 30% RD, 70 RP, V6 = 30% RD, 90 RP, V7 = 60% RD, 70 RP, V8 = 60% RD, 90 RP. Cd = Cynodon dactylon, Die = Digitaria eriantha, Erc = Eragrostis curvula, Tht = Themeda triandra, Erl = Eragrostis lehmaniana, Spf = Sporobolus fimbriatus, Hec = Heteropogon contortus, Sen = Setaria nigrirostris, Ses = Setaria sphacelata, Cye = Cymbopogon excavatus, Umos = Urochloa mosambicensis, Erb = Eragrostis barbinodes, Arc = Aristida congesta, Erpl = Eragrostis plana, Brs = Brachiaria serata, Hyh = Hypperhenia hirta, Mer = Melinis repens Frbs = Forbs, Dec = Decreasers, Inc = Increasers.
Agronomy 10 01807 g007
Figure 8. PCA plot showing the effect of resting period and rainfall reduction on overall biomass yield (kg.ha−1) and other vegetation parameters in 2017/18. Key to symbols: Black dots (●) indicate treatment and the season and vectors ( Agronomy 10 01807 i002) indicate the direction of the relationship between vegetation parameters and treatments. The longer the vector radiating from the centre, the stronger the effects of the resting period and the resting period and the closer the dot to the vector the stronger the relationship between species and soil property. V1 = 0% RD, 70 RP, V2 = 0% RD, 90 RP, V3 = 15% RD, 70 RP, V4 = 15% RD, 90 RP, V5 = 30% RD, 70 RP, V6 = 30% RD, 90 RP, V7 = 60% RD, 70 RP, V8 = 60% RD, 90 RP. Cd= Cynodon dactylon, Die = Digitaria eriantha, Erc = Eragrostis curvula, Tht = Themeda triandra, Erl = Eragrostis lehmaniana, Spf = Sporobolus fimbriatus, Hec = Heteropogon contortus, Sen = Setaria nigrirostris, Ses = Setaria sphacelata, Cye = Cymbopogon excavatus, Umos = Urochloa mosambicensis, Erb = Eragrostis barbinodes, Arc = Aristida congesta, Erpl = Eragrostis plana, Brs = Brachiaria serata, Hyh = Hypperhenia hirta, Mer = Melinis repens, Hei = Height, Ob = Overall biomass, Grss = Grass, Frbs = Forbs, Dec = Decreasers, Inc = Increasers, RUE = Rain use efficiency.
Agronomy 10 01807 g008
Table 1. Table showing soil pH, sand%, clay% and silt% at different rainfall reduction and resting periods.
EffectspHSand %Clay %Silt %Nitrogen
RD 1
0%5.153.132.114.91.0
15%5.150.735.616.90.9
30%5.148.733.817.51.1
60%5.151.234.314.40.9
RP 2
70 days5.151.233.715.10.9
90 days5.150.634.216.71.0
1 RD-rainfall reduction; 2 RP-resting period.
Table 2. Table showing different plant species occurring at the experimental site.
SpeciesFunctional GroupEcological Status
Eragrostis curvulaGrassIncreaser II
Cynodon dactylonGrassIncreaser II
Digitaria erianthaGrassDecreaser
Setaria nigrirostrisGrassDecreaser
Themeda triandraGrassDecreaser
Heteropogon contortusGrassIncreaser II
Setaria sphacelataGrassDecreaser
Eragrostis barbinodesGrassIncreaser II
Melinis repensGrassIncreaser II
Brachiaria serrataGrassDecreaser
Aristida congestaGrassIncreaser II
Ipomoea crassipesForbInvader
Rhyncosia monophyllaForbInvader
Verbana tenuisectaForbInvader
Vermonia oligocephalaForbInvader
Table 3. Main effect of resting period and rainfall reduction on vegetation sward (mean ± S.E) height (cm).
Main Effects2017/18
SummerAutumnSpringSummerAutumn
Rainfall reduction
0%45.0 ± 3.16 a15.7 ± 0.88 a16.2 ± 1.01 a20.4 ± 1.18 a16.8 ± 1.05 ab
15%42.8 ± 3.16 a16.2 ± 0.88 a15.8 ± 1.01 a19.9 ± 1.18 a17.5 ± 1.05 ab
30%38.9 ± 3.16 a16.7 ± 0.88 a15.9 ± 1.01 a21.7 ± 1.18 a19.7 ± 1.05 a
60%28.4 ± 3.16 b10.4 ± 0.88 b9.8 ± 1.01 b13.1 ± 1.18 b15.6 ± 1.05 b
p value0.01340.00090.00210.00110.1639
Resting period
70 days41.5 ± 1.69 a18.0 ± 0.51 a13.6 ± 0.48 b19.6 ± 0.67 a19.2 ± 0.79 a
90 days36.1 ± 1.69 b11.5 ± 0.51 b15.3 ± 0.4 8a18.0 ± 0.67 a15.3 ± 0.79 b
p value0.04010.00010.02050.10740.0028
Different small letter superscripts along the same column in the same year and season were significantly different (p < 0.05); S.E = standard error.
Table 4. Main effect of resting period and rainfall reduction on forbs (mean ± S.E) aboveground biomass yield (kg.ha−1).
Main Effects2016/172017/18
Spring *Summer +Autumn +SpringSummer +Autumn +
Rainfall reduction
0%364 ± 285.2 a618 ± 149.5 a113 ± 52.9 b519 ± 105.6 a411 ± 105.7107 ± 42.6 b
15%68 ± 312.4 b140 ± 158.6 b123 ± 52.9 b265 ± 112.0 b243 ± 100.3111 ± 61.5 b
30%678 ± 238.6 a513 ± 149.5 a220 ± 52.9 ab328 ± 112.0 ab204 ± 125.1137 ± 45.2 a
60%536 ± 208.3 a448 ± 149.5 a349 ± 56.1 a290 ± 105.6 ab338 ± 100.3282 ± 45.2 a
p value0.46960.53400.01620.34130.54980.0389
Resting period
70 days104 ± 149.5 b478 ± 105.7293 ± 32.4 a225 ± 74.6 b266 ± 81.9 143 ± 36.1
90 days719 ± 217.8 a382 ± 109.0110 ± 38.6 b476 ± 79.2 a332 ± 70.9175 ± 33.4
p value0.03270.17820.00190.02810.55190.6259
Different small letter superscripts along the same column in the same season were significantly different (p < 0.05); (*) = log transformed; (+) = square root transformed; S.E = Standard error.
Table 5. Main effect of resting period and rainfall reduction on grass (mean ± S.E) aboveground biomass yield (kg.ha−1).
Main Effects2016/172017/18
Spring +SummerSpring +SummerAutumn
Rainfall reduction
0%744 ± 82.0 a2164 ± 254.3 a659 ± 57.7 a1257 ± 147.3 a837 ± 102.7 ab
15%624 ± 82.0 ab2258 ± 254.3 a719 ± 57.7 a1124 ± 147.3 a840 ± 102.7 ab
30%459 ± 82.0 b2064 ± 254.3 a576 ± 57.7 a1107 ± 147.3 a1015 ± 102.7 a
60%222 ± 82.0 c679 ± 254.3 b171 ± 57.7 b346 ± 147.3 b578 ± 102.7 b
p value0.00010.00260.00010.00040.0687
Resting period
70 days306 ± 58.4 b1733 ± 120.7 a402 ± 41.1 b990 ± 100.2 a998 ± 67.1 a
90 days719 ± 58.4 a1850 ± 120.7 a661 ± 41.1 a928 ± 100.2 a636 ± 67.1 b
p value0.00010.50070.00040.67240.0015
Different small letter superscripts along the same column in the same and season were significantly different (p < 0.05); (+) = square root transformed; S.E.= standard error.
Table 6. Main effect of resting period and rainfall reduction on decreaser grass (mean ± S.E) species (kg.ha−1).
Main Effects2016/172017/18
Spring +Summer *Autumn *SpringSummerAutumn *
Rainfall reduction
0%371 ± 55.3 a1860 ± 512.1 a370 ± 59.3 a301 ± 45.8 a632 ± 92.9 a450 ± 91.7
15%344 ± 49.5 ab1068 ± 512.1 a330 ± 59.3 a250 ± 45.8 a602 ± 103.9 a394 ± 91.7
30%203 ± 64.5 b580 ± 512.1 ab232 ± 62.9 a151 ± 72.5 a351 ± 103.9 ab415 ± 91.7
60%127 ± 55.3 c243 ± 512.1 b46 ± 62.9 b107 ± 72.5 b113 ± 103.9 b218 ± 97.3
p value0.00200.2102<0.00010.03200.01110.3691
Resting period
70 days138 ± 61.2 b735 ± 321.2323 ± 43.2 a102.7 ± 43.5 b418 ± 50.0529 ± 66.9 a
90 days385 ± 56.0 a1141 ± 302.9166 ± 43.2 b256.5 ± 27.5 a431 ± 42.6209 ± 64.9 b
p value0.00610.37170.01540.01360.85380.0053
Different small letter superscripts along the same column in the same year and season were significantly different (p < 0.05); (*) = log transformed; (+) = square root transformed, S.E = standard error.
Table 7. Main effect of resting period and rainfall reduction on increaser grass (mean ± S.E) species (kg.ha−1).
Main Effects2016/172017/18
Spring +SummerAutumnSpringSummerAutumn +
Rainfall reduction
0%413 ± 69.2 a1251 ± 291.5 ab566 ± 89.7 a300.7 ± 45.8 a631.5 ± 92.9 a409 ± 98.6
15%280 ± 69.2 a1053 ± 260.7 ab701 ± 89.7 a250.3 ± 45.8 a601.9 ± 103.9 a448 ± 98.6
30%309 ± 69.2 a1484 ± 260.7 a742 ± 89.7 a150.7 ± 72.5 ab351.3 ± 103.9 ab646 ± 98.6
60%134 ± 77.4 b463 ± 260.7 b299 ± 89.7 b116.6 ± 72.5 b113.1 ± 103.9 b295 ± 104.6
p value0.11470.08730.00090.03200.01110.2223
Resting period
70 days193 ± 43.3 b1026 ± 144.8792 ± 63.5 a102.7 ± 43.5 b418.3 ± 50.0514 ± 71.9 a
90 days375 ± 46.0 a1099 ± 136.5362 ± 63.5 b256.5 ± 27.5 a430.6 ± 42.6384 ± 69.8 b
p value0.01130.72200.00020.01360.85380.1943
Different small letter superscripts along the same column in the same year and season were significantly different (p < 0.05); (+) = square root transformed.
Table 8. Main effect of resting period and rainfall reduction on rainwater use efficiency (mean ± S.E) (kg.ha−1.mm−1).
Main Effects2016/172017/18
SummerSummer
Rainfall reduction
0%12.6 ± 0.22 a3.7 ± 0.17 a
15%11.9 ± 0.22 b4.1 ± 0.17 a
30%13.2 ± 0.22 a4.0 ± 0.17 a
60%7.3 ± 0.22 c1.9 ± 0.17 b
p value0.00010.0001
Resting period
70 days12.5 ± 0.19 a3.8 ± 0.11 a
90 days9.9 ± 0.19 b3.0 ± 0.11 b
p value0.00010.0001
Different small letter superscripts along the same column in the same year and season were significantly different (p < 0.05); S.E = standard error.
Publisher’s Note: MDPI stays neutral with regard to jurisdictional claims in published maps and institutional affiliations.

