Article

Effect of High Tunnel Coverings on Antioxidants of Breaker and Light Red Tomatoes at Harvest and during Ripening

1
Department of Horticulture and Natural Resources, Kansas State University, 22201 W. Innovation Drive, Olathe, KS 66061, USA
2
Department of Horticulture and Natural Resources, Kansas State University, 3036 Throckmorton PSC, 1712 Claflin Road, Manhattan, KS 66506, USA
3
Department of Statistics, Kansas State University, 101 Dickens Hall, 1116 Mid-Campus Drive N, Manhattan, KS 66505, USA
4
Department of Food, Nutrition, and Dietetic Health, Kansas State University, 212 Justin Hall, 1324 Lovers Lane, Manhattan, KS 66506, USA
5
Department of Horticulture and Natural Resources, Olathe Horticulture Research and Extension Center, Kansas State University, 35230 W. 135th Street, Olathe, KS 66061, USA
*
Author to whom correspondence should be addressed.
Agronomy 2020, 10(11), 1639; https://doi.org/10.3390/agronomy10111639
Submission received: 16 October 2020 / Accepted: 22 October 2020 / Published: 24 October 2020

Abstract

:
(1) Background: We assessed the impact of high tunnel coverings and harvest maturity (breaker and light red) on antioxidant capacity, ascorbic acid (AsA), lycopene, β–carotene, and phenolic compound (flavonoid and phenolic acid) accumulation in tomatoes (Solanum lycopersicum) at harvest and postharvest. (2) Methods: The two-year study in Olathe, KS, included six different coverings: a standard polyethylene (standard poly), diffuse poly (diffuse), clear poly (clear), UV-A/UV-B blocking poly (block), 55% shade cloth + standard poly (shade), and removal of standard poly two weeks prior to harvest (movable). (3) Results: Antioxidant capacity increased in fruit grown under the clear covering, compared to the shade covering (p < 0.05); similarly, AsA accumulation increased under the standard and clear coverings, relative to the movable and shade coverings (p < 0.001). Postharvest, at the point of consumption (POC), rutin increased in fruit harvested at light red stage versus breaker stage (p < 0.001), and chlorogenic acid increased in light red harvested fruit by 60% under movable, 55% under shade, and 43% under block covering than breaker harvested fruit (p < 0.01). (4) Conclusions: Based on these results, we conclude that both high tunnel covering and postharvest maturation alter antioxidant capacity, AsA, lycopene, and phenolic compound accumulation profiles by the POC.

1. Introduction

Tomato is the most common warm-season crop grown in high tunnels in the US [1]. The high tunnel system allows a grower the opportunity to select particular polyethylene (poly) and/or shade cloth coverings to maximize yield and other quality parameters that are important to their market [2,3]. Shade cloth is often added to reduce the effect of high temperatures and of direct sunlight (tomato fruits are prone to sunburn) [4]. Several reports have suggested that although high tunnel production may increase tomato fruit biomass, it may decrease antioxidant content [5,6]. Tomato fruit are a source of heath promoting antioxidants like carotenoids, ascorbic acid (AsA) and phenolic compounds [7,8,9]. The poly films and shade cloth that are utilized to cover high tunnels have shown to alter spectral quality, light intensity, plant growth, and antioxidant compound profiles [2,3,5,10,11,12,13]. Photosynthetic active radiation (PAR) and ultraviolet (UV) radiation have been shown to decrease under high tunnel poly film [14] and shade cloth [15], which resulted in decreased antioxidant capacity of tomato [2,16,17].
Antioxidants can reduce reactive oxygen species (ROS) that are by-products of a disrupted electron transport chain in times of environmental stress [18]. Environmental stresses can include UV, light intensity, and some visible regions of the light spectra that have shown to signal the biosynthesis of health-promoting primary and secondary metabolites, such as AsA, carotenoids and phenolic compounds in high tunnel systems [17,19,20,21]. AsA displays antioxidant synergism by regenerating vitamin E (a-tocopherol) to protect against photo-oxidation. This ascorbate regeneration system is a primary response to mitigate oxidative stress as seen in tomatoes [22]. Studies show that increased solar radiation can lead to AsA and tocopherol accumulation in the tissues of high tunnel and greenhouse-grown tomato fruits [16,23,24]. Carotenoids in tomato (mostly lycopene and β-carotene) are responsible for tomato pigmentation and also protect against photo-oxidative damage [17,25]. By limiting photosynthetic activity with added shade or other coverings, the synthesis of carotenoids also lessens [26].
UV-B radiation activates enzymes such as phenylalanine ammonium-lyase (PAL) [27] and chalcone synthase (CHS) [28], which are both important enzymes in the phenylpropanoid pathway and are responsible for the synthesis of phenolic compounds. PAL is the key enzyme in phenolic acid biosynthesis [29]. Phenolic acids, such as chlorogenic acid and others are UV-B absorbing compounds and may serve as UV-B receptors in plants [30]. Previous studies on cucumber (Cucumis sativus) show that seedling exposure to UV-B radiation caused up to 78% increase in PAL [27]. CHS is the first step in the flavonoid biosynthesis pathway [31] and previous studies have found that both blue light and UV-A light enhance the response of CHS to UV-B synergistically [28,32]. It has been shown that full-spectrum, solar radiation can increase the amounts of certain phenolic compounds, such as flavonoids and phenolic acids due to photo-oxidative stress [30,33,34,35,36]. However, responses are crop and species specific, and it has been suggested that solar UV-B may be insufficient to promote flavonoid production [37], therefore, supplemental radiation may be needed for increased accumulation.
Very few studies have examined the effect of manipulation of full-spectrum solar radiation with high tunnel coverings on health promoting antioxidants in tomato. One such study in Greece, found that lycopene was the same in tomatoes grown under a standard poly material, compared to another poly material that absorbed UV light [38]. They suggested that the non-significance may be due to cultivar, which has shown to have a large effect on sensitivity to UV and antioxidant accumulation [24]. In southern Serbia, it was found that a 40% black shade cloth over poly in a high tunnel resulted in greater accumulation of lycopene, but not β–carotene, compared to a no-shade high tunnel control [2]. However, they suggested that temperatures from 32 to 35 °C inhibited the lycopene accumulation in the no-shade control. In Maryland, it was found that tomatoes grown with UV-transmitting poly induced accumulation of both phenolic acid and flavonoid, compared to UV-blocking poly [20]. Levels of caffeic acid, p-coumaric acid, and ferulic acid in tomatoes, were 20% higher under UV-transmitting poly. In a greenhouse study with tomatoes, leaves had a four-fold increase in rutin and chlorogenic acid content under a 30% shade cloth, compared to plants that were grown under a 73% shade cloth [5]. High tunnel coverings have demonstrated the ability to alter microclimate differentially, and tomatoes have shown to increase phenolic content when mean temperatures are between 20 and 22 °C [39]. Preliminary studies with lettuce show that brief increases in light intensity prior to harvest results in greater antioxidant accumulation [40,41,42]. These studies suggest that the use of a movable tunnel could provide protection and season extension during plant establishment and growth, followed by full spectrum exposure to encourage antioxidant accumulation.
Maturity stage is another factor determining the antioxidant capacity of vegetables. During ripening, tomato fruit undergoes a wide range of physiological changes, accompanied by a burst of ethylene, that affect the final fruit composition [43]. As tomato fruit ripens and reddens, chlorophyll degrades as chloroplasts are transformed in to chromoplasts, and carotenoids like lycopene and β–carotene accumulate [43,44]. Furthermore, AsA acts as a growth regulator in plant development and as an electron donor [45]. Early studies show that tomato fruit harvested at the mature green stage and ripened at 20 °C to mature red contained less AsA than those harvested at mature red stage [46]. ROS are known to increase with ripening due to increased respiration, which results in increased antioxidant activity resulting from higher AsA and phenolic compounds [47]. In tomato there is a significant increase in AsA synthesis, recycling, and degradation during ripening [48]. It has been suggested that phenolic compounds are involved in the stability of AsA, as both AsA and total phenolic content in pink stage fruit stored at 12 °C increased during a 15-d storage period [47]. This may be due to a strong reducing capacity of some flavonoids (e.g., quercetin) and phenolic acids (e.g., chlorogenic acid) [49]. In a greenhouse study, it was found that AsA, and phenolic compounds rutin and caffeic acid increased with ripening, while chlorogenic acid has been shown to decrease during ripening [9].
Tomato consumption in the US ranks only second to the potato (Solanum tuberosum), with 43% from raw consumption [50]. Because of this, the average US citizen receives a large amount of dietary AsA, carotenoids, and phenolic compounds through tomato consumption [51]. Since these compounds are known to play an important role as antioxidants in human nutrition, the UV transmission properties of poly coverings are important from a nutritional standpoint. Therefore, the objectives of this study were to evaluate the effect of high tunnel covering, and maturity stage at harvest and at consumption, on antioxidant capacity, AsA, lycopene, β–carotene, flavonoid and phenolic acid concentration in tomato fruit.

2. Materials and Methods

2.1. Plant Material and Experimental Design

Trials were conducted at the Kansas State University Olathe Horticulture Research and Extension Center (OHREC), located in Olathe, Kansas, during summers 2017 and 2018. The hybrid cultivar ‘BHN-589’ tomatoes (Johnny’s Selected Seeds, Winslow, ME, USA) were grown in four, “caterpillar” high tunnels (39.6 m long × 3.7 m wide × 2.1 m high), which are homemade high tunnels whereby hoops are bent out of galvanized metal fencing material, using a specific pipe bender (Quick Hoops Bender; Johnny’s Selected Seeds, Winslow, ME, USA). The construction of a homemade high tunnel allowed for customization to suit the needs of the experiment in regards to plot size and tunnel length. The overall design of the caterpillar tunnel is long and narrow with low ceilings, which provides an ideal structure for an experiment that specifically examines the impact of solar light. Two beds ran lengthwise in each high tunnel (39.6 m long × 0.61 m wide). The trials were arranged in a randomized complete block design (RCBD), using the consecutive trial years and high tunnels as blocks. Each high tunnel, or rep, had six randomly assigned high tunnel coverings (6.1 m long) and an additional 2.1 m area at the ends of each high tunnel. The coverings included a standard poly (standard) that was rated for 92% photosynthetic active radiation (PAR) transmission and blocked radiation <350 nm [single-layer 6-mil (K-50 poly; Klerk’s Plastic Product Manufacturing, Inc., Richburg, SC, USA). A standard poly with poly removal 2 weeks prior to the initial harvest, simulated a movable tunnel (movable). The movable covering allowed plants to establish in a protected environment before full spectrum exposure prior to harvest. Diffuse poly (diffuse) is reported to remove direct radiation of infra-red (IR) light and blocks < 380 nm (Luminance; Visqueen Building Products, London, UK). Clear poly (clear) had full spectrum radiation (6-mil Clear Plastic Sheeting; Lowes, Mooresville, NC, USA). UV-A/UV-B blocking poly (block) blocked radiation < 400 nm (Dura Film Super 4; BWI Companies, Inc., Nash, TX, USA); and a 55% black shade cloth + standard poly underneath (shade) reduced light intensity and canopy temperature (Sunblocker Knitted Shade; FarmTek, Dyersville, IA, USA).
Common cultural methods were consistent with commercial high tunnel production; water was applied through drip irrigation, weeds were suppressed via woven fabric mulch between beds, and plants were grown by using a stake and weave trellis system. In both years, a custom-blended granular fertilizer mix (31-16-16) was incorporated into the beds prior to planting at a rate of 18.2 kg/ha nitrogen. The tomatoes were transplanted on 30 May 2017 and 18 May 2018, in a single row in the center of each bed (45 cm between plants, with 1 m spacing between the beds from center-to-center). Buffer zones (1.5 m) were implemented at either end of each plot to minimize interplot interference. Shade cloth was added on 10 July 2017 and 9 July 2018, to the shade covering treatment. The poly was removed on 7 August 2017 and 22 July 2018 over the movable covering treatment.

UV-A and UV-B Measurement

UV-A and UV-B (w/m2) rates were measured between 10:00 and 13:00 h on cloudless days, using the ILT5000 device (International Light Tech., Peabody, MA, USA). Six measurements of UV-A and UV-B were taken in each plot to represent the plot as a whole. The measurements taken under the movable covering, were considered 100% solar transmittance, and were used to quantify the other covering’s percent transmission (%). UV-A and UV-B measurements were taken three times on 10, 17, and 23 July 2017. The device was not available for use during the second trial year.

2.2. Tomato Sampling for Nutritional Analysis

Fruit was collected from each plot (14 plants per plot) during two harvests each year (10 and 30 August 2017, and 6 and 15 August 2018). Marketable fruit that was free of decay, mold, cracking that extended beyond the shoulder, small size (<3.8 cm diameter), pest damage, and other defects, were utilized to determine nutritional quality. The fruit was transported in an air-conditioned vehicle for further evaluation at the postharvest physiology lab at Kansas State University, Olathe. The fruit was sorted into maturity stage based on skin color (Table 1) with two measurements taken at two opposite 45° angles from the blossom end of the fruit, using an A5 Chroma-Meter (Minolta CR-400; Minolta Co. Ltd., Osaka, Japan) [52].
The two harvest maturity stages studied were breaker (a noticeable break in color with lesser than 10% of other than green color) and light red (between 60 and 90% red) [53]. Analyses were conducted on breaker stage fruit on day 0 (BR), light red stage (BR_LR), and mature red stage (BR_MR) or the point of consumption (POC) (Table 2). Mature red stage is fruit with more than 90% red skin color [53]. To mimic commercial retail, BR_LR fruit was stored at optimum conditions of 12.5 °C at 90% relative humidity (RH) [54] in environmental chambers (Forma Environmental Chambers; ThermoFisher Scientific Inc., Asheville, NC) until day 10 or the corresponding a* value. BR_MR fruit was stored at 12.5 °C and 90% RH until day 10 or the corresponding a* value + market shelf conditions of 21 °C and 65% RH for 5 days or the corresponding a* value. The shelf storage conditions were chosen based on air temperatures and RH of standard commercial unrefrigerated retail displays for tomatoes in the US [55]. These conditions mimic commercial retail distribution where unripe fruit is stored in cooler temperatures to slow ripening and then moved to the retail shelves with higher temperatures to increase the rate of ripening.
Light red mature fruit was first analyzed on day 0 (LR) and then once reaching mature red stage (LR_MR) or the POC (Table 2). LR_MR fruit was held at market shelf conditions of 21 °C and 65% RH for 5 days or the corresponding a* value. These conditions mimic local distribution where harvest occurs at the light red or pink fruit stage and stored unrefrigerated for a shorter period before consumption of a local consumer.
On the analysis days, the four replicates of each covering treatment were comprised of three fruit. Approximately 2 g of fresh sample was homogenized with 20 mL of 6% meta-phosphoric acid (Fisher Scientific, Hampton, NH, USA) with 2N acetic acid solution frozen at −20 °C until AsA analysis. The remaining fresh sample was lyophilized in the freeze dryer (Harvest Right, Salt Lake City, UT, USA), and ground (Waring WSG30; Conair Corporation, Torrington, CT, USA) for antioxidant, lycopene, β–carotene, and phenolic analysis.

2.3. Standards, Reagents, and Equipment

For AsA analysis, a calibration curve with analytical grade ascorbic acid (Fisher Scientific) was created (2.5–50 μg/mL) in 10% meta-phosphoric acid solution and stored for 1 month at −20 °C. For lycopene and β–carotene analysis, acetone and hexane were purchased from Fisher (Fisher Scientific). For antioxidant capacity, 6-hydroxy-2,5,7,8-tetramethylchromane-2-carboxylic acid (Trolox), 2,4,6-Tris(2-pyridyl)-s-triazine (TPTZ), ferric chloride, and sodium acetate, were purchased from Acros Organics (Geel, Belgium). Trolox was used as the standard and the calibration curve was in the range of 7.5 to 380 µM. For phenolic compound analysis, commercial standards were all of analytical grade and included chlorogenic acid, quercetin, isoquercetin, rutin, and ferulic acid, as well as formic acid (purity > 99%) purchased from Acros Organics (Geel, Belgium). The stock standard solutions of individual compounds were prepared [56]. Ammonium acetate, methanol, ethanol, glacial acetic acid (all HPLC grade) were purchased from VWR (VWR, Radnor, PA, USA). Equipment used includes an analytical balance (Mettler Toledo, Columbus, OH, USA), sonicator (Ultrasonic Bath; Fisher Scientific), and centrifuge (Avanti J-E; Beckman Coulter, Indianapolis, IN, USA).

2.4. Extraction and Analysis of AsA

AsA was determined by using a previously developed method with some modifications [57]. Prior to analysis, samples were vortexed, centrifuged (7393 rpm, 10 min, 4 °C), and supernatant was poured into a test tube. Sample extract (200 μL) was combined with 800 μL of 6% meta-phosphoric acid with 2N acetic acid and filtered through a 1 mL 96-well plate, using a 0.22 μm filter (Supor; Pall Co., Port Washington, NY, USA). Samples of 5 uL were injected in to the Waters Acquity UPLC System (Waters Co., Milford, MA, USA), equipped with a binary solvent manager (part number: 186015001), a column manager (part number: 186015009), a sample manager (part number: 186015005), a photodiode array UV/vis detector (PDA part number: 186015026), and a QDa mass detector (part number: 186006511) for further confirmation, using Empower 3 chromatography data software. The chromatographic separation was achieved on a High Strength Silica (HSS) T3 column (100 mm × 2.1 mm, 1.8 μm particle size) with methanol + 1% formic acid (eluent A) and 5 mM potassium phosphate monobasic (KH2PO4) at pH 2.65 (eluent B) as the mobile phases. The linear gradient started with 5% A, increased to 15% A over 1 min, then to 35% A over 1 min, and returned to initial conditions within the next 4 min, with a flow rate of 0.2 mL/min. The eluate was detected by using the PDA, and the chromatogram was recorded at 245 nm. Quantification of AsA was performed with an external standard. AsA was quantified, related to the corresponding standard, and results were expressed as mg AsA/100g fresh weight (FW). For each extract, three subsamples were made.

2.5. Extraction and Analysis of Lycopene and β–Carotene

Lycopene and β-carotene content was measured based on a spectrophotometric method [58]. Protected from the light, 1 mL of de-ionized (DI) water was vortexed with 0.1 g of the lyophilized and ground tissue and allowed to re-hydrate for 30 min. Following, 10 mL of cold acetone/hexane (40/60, v/v) solution was added to the sample, vortexed for 1 min for extraction of the pigments and the phases were left to separate for one hour in −20 °C. From the upper phase, 350 μL of sample was pipetted into a solvent-resistant 96-well microplate (polypropylene, Costar #3364, Corning, Tewksbury, MA, USA) in triplicate. N-Hexane was used as blank, and samples were measured in a plate reader Biotek Synergy H1MD (BioTek Instruments, Inc., Winooski, VT, USA). Lycopene and β-carotene content was calculated utilizing the absorptions of the wavelengths 663, 645, 505 and 453 nm and the respective equations: Lycopene (mg/100 mL) = −0.0458A663 + 0.204A645 + 0.372A505 − 0.0806A453; and β-carotene (mg/100 mL) = 0.216A663 − 1.22A645 − 0.304A505 + 0.452A453. Lycopene and β-carotene are expressed as μg/g dry weight (DW). For each extract, three subsamples were made.

2.6. Extraction for Antioxidant Capacity and Phenolic Compounds

Each replicate of the high tunnel covering treatments was extracted and analyzed in a darkened room with a red safety light to avoid oxidation of the analytes [59]. Lyophilized tomato fruit (0.2 g) were homogenized with 4 mL of extraction solution (ethanol/water, 80/20, v/v) and vortexed (20 s), sonicated (5 min), and centrifuged (4000 rpm, 15 min, 4 °C). The supernatant was transferred into a test tube and the extraction was repeated. Both supernatants were combined and evaporated to dryness under nitrogen flow (2–6 ppm). The residue was reconstituted with 3 mL of 30 mM ammonium acetate in DI water with 5 pH adjusted with formic acid (eluent B) and filtered through a 25 mm 0.22 μm filter (Supor; VWR), into several 1.5 mL Eppendorf tubes, for reserve, and the sample extract was stored in darkness, at −70 °C, until antioxidant-capacity and phenolic analysis.

2.7. Analysis of Antioxidant Capacity

Antioxidant capacity analysis of tomatoes was analyzed by using the ferric reducing ability of plasma (FRAP) method [60]. FRAP monitors the reduction of a ferric ion complex to the ferrous form. Antioxidant activity in the extract reduces the production of the oxidation products and changes the color of the solution to blue. Prior to analysis, a portion of each extracted sample was thawed, vortexed and 30 μL of sample extract was diluted with 270 μL DI water. Then, 50 μL of diluted extract solution was added to 180 μL of FRAP reagent, consisting of ferric chloride and TPTZ in acetate butter (pH 3.6), and plated in triplicate on 96-well microplates. The plate was incubated at 37 °C for 30 min before measuring the absorbance in the microplate reader with the spectrophotometer set at 593 nm. The results were expressed as µmol Trolox equivalents (TE)/100 g DW. For each extract, three subsamples were made.

2.8. Analysis of Phenolic Compounds

Prior to analysis, a portion of each extracted sample was thawed, vortexed and 100 μL sample extract was added to 900 μL 50:50 methanol + 0.1% formic acid (eluent A):eluent B for injection (10% dilution). The analysis was carried out by using a method adapted from [56]. Samples of 3 uL were injected in to the Waters system (Section 2.4), and the separation was achieved on Waters Acquity Ethylene Bridged Hybrid (BEH) C18 column (100 mm × 2.1 mm, 1.7 μm particle size) at 30 °C. Eluting peaks were monitored at 254 nm and 325 nm. The elution was performed with 5% A for 1.5 min, and a linear gradient was then installed to reach 30% A at 4 min, 85% A at 8 min, and 100% A at 10 min. These conditions were maintained for 1.5 min, before returning to the initial conditions in 30 s. The flow rate was set at 0.2 mL/min. Quantification of phenolics was performed with external standards. The phenolic compounds of rutin, quercetin, isoquercetin, ferulic acid and chlorogenic acid were quantified, related to their corresponding standard based on retention time and confirmed by their absorption spectrum in UV. Results were expressed as mg/kg (DW). For each extract, three subsamples were made.

2.9. Statistical Analysis

The summary statistics were presented for the UV-A and UV-B data. The nutrition data were subjected to natural log (ln) transformation before subjected to linear mixed-model analysis. With nutrient compound analysis, assuming log transformation is common to normalize the data. The fixed effects of the model were year, high tunnel covering treatment, maturity stage and maturity stage × covering interaction. Fixed effects were evaluated via type III tests. Year and high tunnel are the blocking factors, are considered repeated measurements, and therefore are not included in the effects table. Random effects of the model were the high tunnel × year, and the high tunnel × year × covering interactions. Each value is presented in the results as the back-transformed least square median (LSMeans) ± back-transformed standard error. The pairwise comparison was carried out by using Tukey’s method at the 0.05 significance level. Statistical analysis was executed via Statistical Analysis Software (SAS version 9.4; Cary, NC, USA) PROC MIXED with option DDFM=KR in MODEL statement.

3. Results

The available solar transmission was considered to be at 100% under the movable covering at the time of UV-A and UV-B measurements, and can be considered an open field control for light measuring purposes. The average percent transmission for UV-A as calculated by the ratio of each covering to the movable covering during the 2017 trial was 16% for standard, 24% for block, 61% for clear, 8% for diffuse, and 7% for shade (Table 3). The average percent transmission for UV-B as calculated by the ratio of each covering to the movable covering during the 2017 trial was 16% for standard, 6% for block, 65% for clear, 7% for diffuse, and 5% for shade.
Table 4 shows the probability values of the effect of high tunnel covering, maturity stage of the tomato at analysis, and their interaction on the FRAP value, AsA, lycopene, β-carotene, and phenolic compound concentration.

3.1. Antioxidant Capacity (FRAP)

The clear covering resulted in greater antioxidant capacity, as compared to the fruit grown under the shade covering (p < 0.05; Figure 1).
Increased antioxidant capacity was observed in light red fruit at harvest (LR), as compared to the breaker fruit at harvest (BR), breaker harvested fruit at the light red stage (BR_LR), and light red harvested fruit at the mature red stage (LR_MR) (p < 0.001; Table 4). However, by the POC, the breaker harvested fruit at the mature red stage (BR_MR) and LR_MR fruits were statistically similar in antioxidant capacity as determined by FRAP (Figure 2).

3.2. AsA Concentration

The AsA concentration was affected by high tunnel covering and maturity stage (p < 0.001 and <0.001, respectively). The standard and clear coverings were statistically similar and greater than the movable and shade coverings (Figure 3). AsA concentration decreased most under the shade covering, as compared to the other coverings.
AsA concentration was statistically similar between the BR_LR, LR, and the LR_MR fruit (Figure 4). At the POC, the AsA concentration in LR_MR fruit was statistically similar to the BR_MR fruit.

3.3. Carotenoid (Lycopene and β-carotene) Concentration

There were no differences between coverings for lycopene or β-carotene concentration (Table 4). There were no differences detected between maturity days for β-carotene concentration (Table 4). The lycopene concentration was less in the BR fruit, as compared to all other maturity stages (Figure 5). At the POC, the BR_MR and LR_MR fruits were statistically similar in lycopene concentration.

3.4. Phenolic Compound Concentration

Three flavonoids and two phenolic acids and were identified from their absorption spectra in the tomato samples. The flavonoids included three flavonols, quercetin, rutin, and isoquercetin. No significant differences were observed under the various high tunnel coverings for the flavonol accumulation (Table 4). The maturity stage affected the amount of quercetin and rutin in the tomato fruit (p < 0.001 and <0.001, respectively). The quercetin concentration in the BR_LR, and LR fruit increased compared to BR fruit (Figure 6A). The rutin concentration in BR_LR, LR, and LR_MR fruit increased, compared to BR_MR fruit (Figure 6B). At the POC, the rutin accumulation increased by 19% in LR_MR fruit, relative to BR_MR fruit. Similar to AsA and lycopene, the LR fruit maintained the rutin and quercetin concentration by the POC, or LR_MR.
The phenolic acids, chlorogenic acid and ferulic acid, were impacted by the maturity stage × covering interactions (p < 0.01 and <0.05, respectively; Table 5). Chlorogenic acid was the highest accumulating phenolic compound in the tomato fruit. The accumulation of chlorogenic acid differed between covering in BR and BR_MR fruit (p < 0.05 and <0.01, respectively; Table 5), with increased amounts observed in the fruit grown under the clear covering. In the LR_MR fruit, chlorogenic acid differed between coverings (p < 0.01), with the block resulting in increased amounts. The amount of chlorogenic acid was highest in BR and LR fruit at harvest, and lowest in BR_MR and LR_MR fruit. At the POC, chlorogenic acid concentration in the LR_MR fruit was significantly greater than BR_MR fruit under the movable, block, and shade coverings (p <0.01, <0.05, and <0.05, respectively).
The ferulic acid concentration differed between coverings in the BR fruit (p < 0.05; Table 6), with increased amount observed under the standard and movable coverings. In the BR_MR fruit, a covering difference was observed (p < 0.05), and the ferulic acid concentration was highest under the shade covering. It was observed that the values increased for the breaker mature fruit during off-plant ripening. In the LR fruit, ferulic acid concentration differed among coverings (p < 0.05), and increased under the block covering. In LR_MR fruit, ferulic acid concentration differed among coverings (p < 0.05) and increased under the clear covering. Inconsistent observations between coverings were observed at various maturity stages for ferulic acid concentration. Unlike the other compounds, the ferulic acid concentration at the POC between the BR_MR fruit exceeded that of the LR_MR under the standard and shade coverings (p <0.05 and <0.01, respectively).

4. Discussion

We examined the changes in antioxidant capacity and health-promoting antioxidants (AsA, carotenoids, and phenolic compounds) as the result of manipulating light with the use of different high tunnel coverings. Antioxidant capacity in tomatoes is related to various bioactive compounds present in the fruit matrix, that delay oxidation [61]. Past studies show that data determined by the FRAP method have strong correlations with individual phenolic concentration (R2 = 0.75) [62], and high lycopene content [
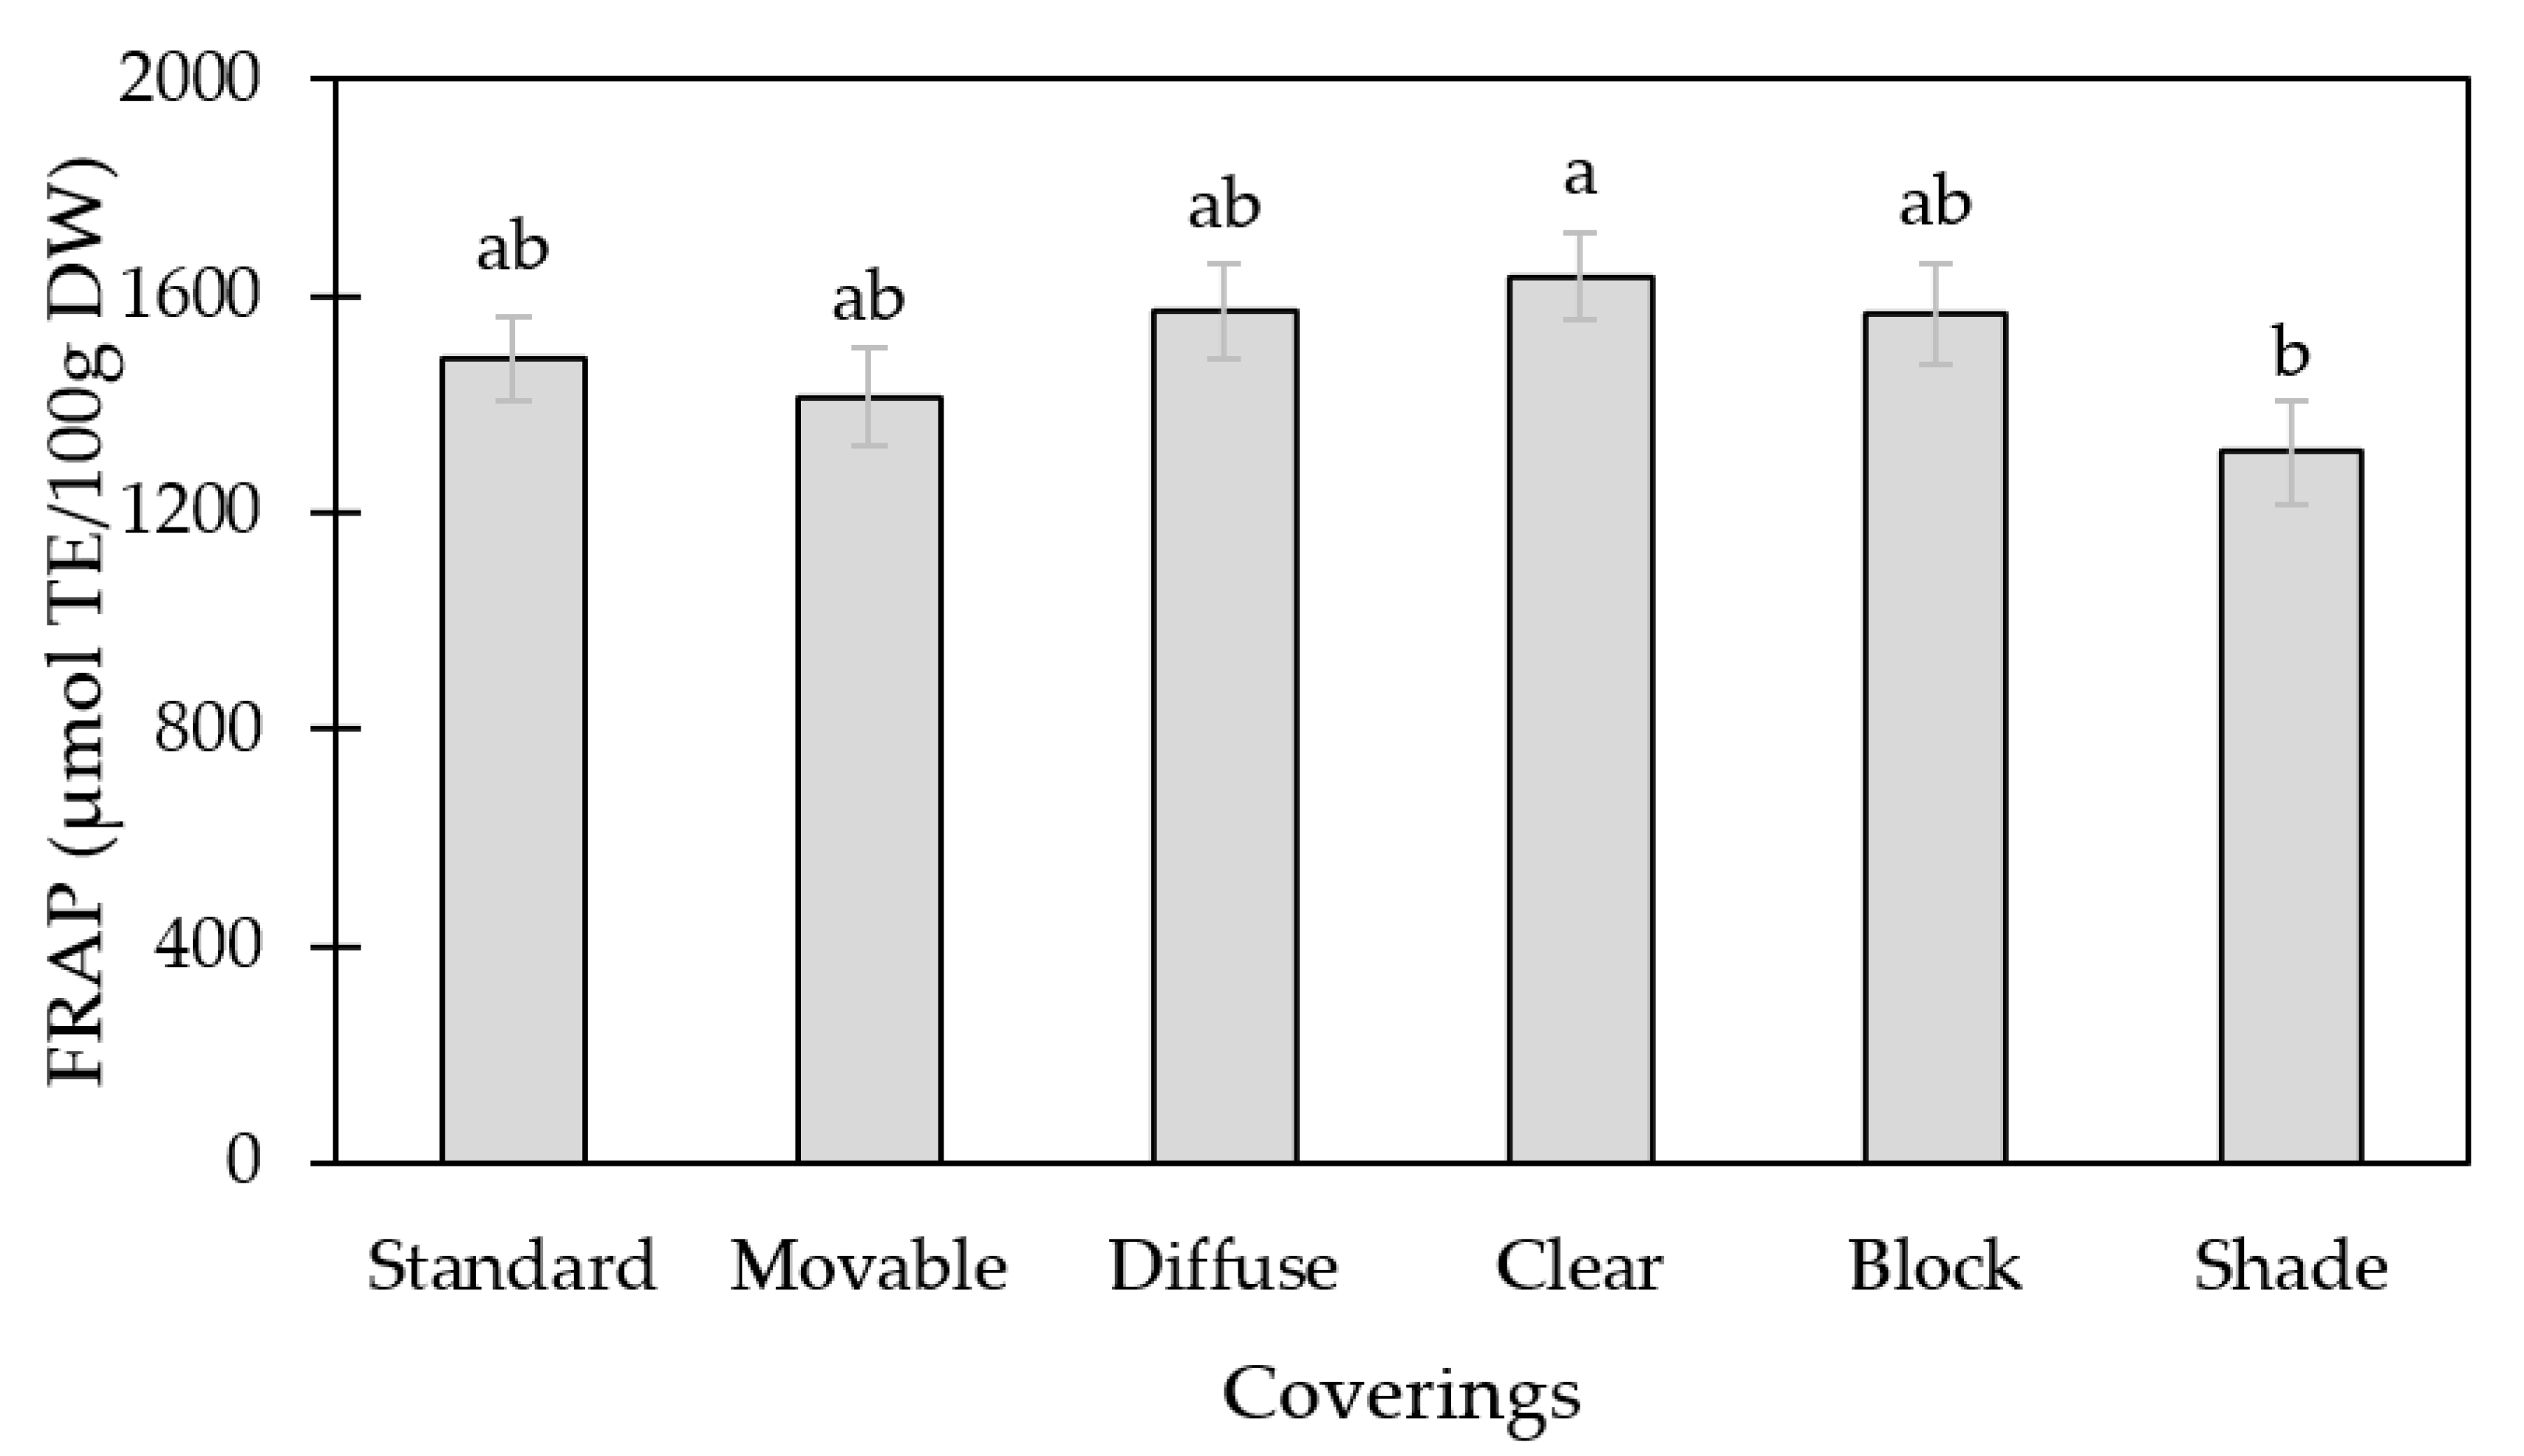
8]. The FRAP values were 1300 to 1600 µmol TE/100 g DW, which is consistent with values reported in the literature [62]. The FRAP values of fruit grown under the clear covering resulted in greater antioxidant activity, as compared to those grown under the shade covering. The clear covering had 70% PAR [63], 61% UV-A, and 65% UV-B transmission, while the shade had just 24% PAR [63] and <7% UV-A/B transmission, compared to the movable covering. The other studied coverings had similar PAR transmissions to the clear covering [63]; however, all other tested coverings had <25% UV-A/B transmission, as compared to the movable covering. Therefore, the FRAP values may have increased under the clear covering with higher UV-A/B transmission throughout the entire growing process.
Furthermore, we found that AsA was affected by maturity stage and active-light intensity, which is in agreement with previous studies on the effects of harvest maturity and growing environment [9,22,64,65]. Fruit grown under the shade covering had the least AsA accumulation of the coverings tested. Previous studies have shown that light intensity has the greatest influence on AsA accumulation in tomato [16]. By limiting light with shade, photosynthetic activity and synthesis of ascorbate and α-tocopherol reduces [66]. The movable covering received the most unobstructed light before harvest, but accumulated less AsA, as compared to the standard and clear covering, and fruit-cracking and cat facing were more prevalent due to several rain events [63]. It has been suggested that there is a threshold for environmental stress to benefit nutrient accumulation [67,68], and it is possible that environmental stress received by the fruit under the movable covering was above its threshold. With the exception of the movable trial, the block, standard, clear, and diffuse coverings were similar in PAR transmission (from 64 to 75%) [63], and they were statistically similar in AsA accumulation. There was no significant difference in AsA when comparing UV-A/B-excluding coverings (standard, diffuse, block) to the UV-A/B-transmitting covering (clear), as was found in past studies [38].
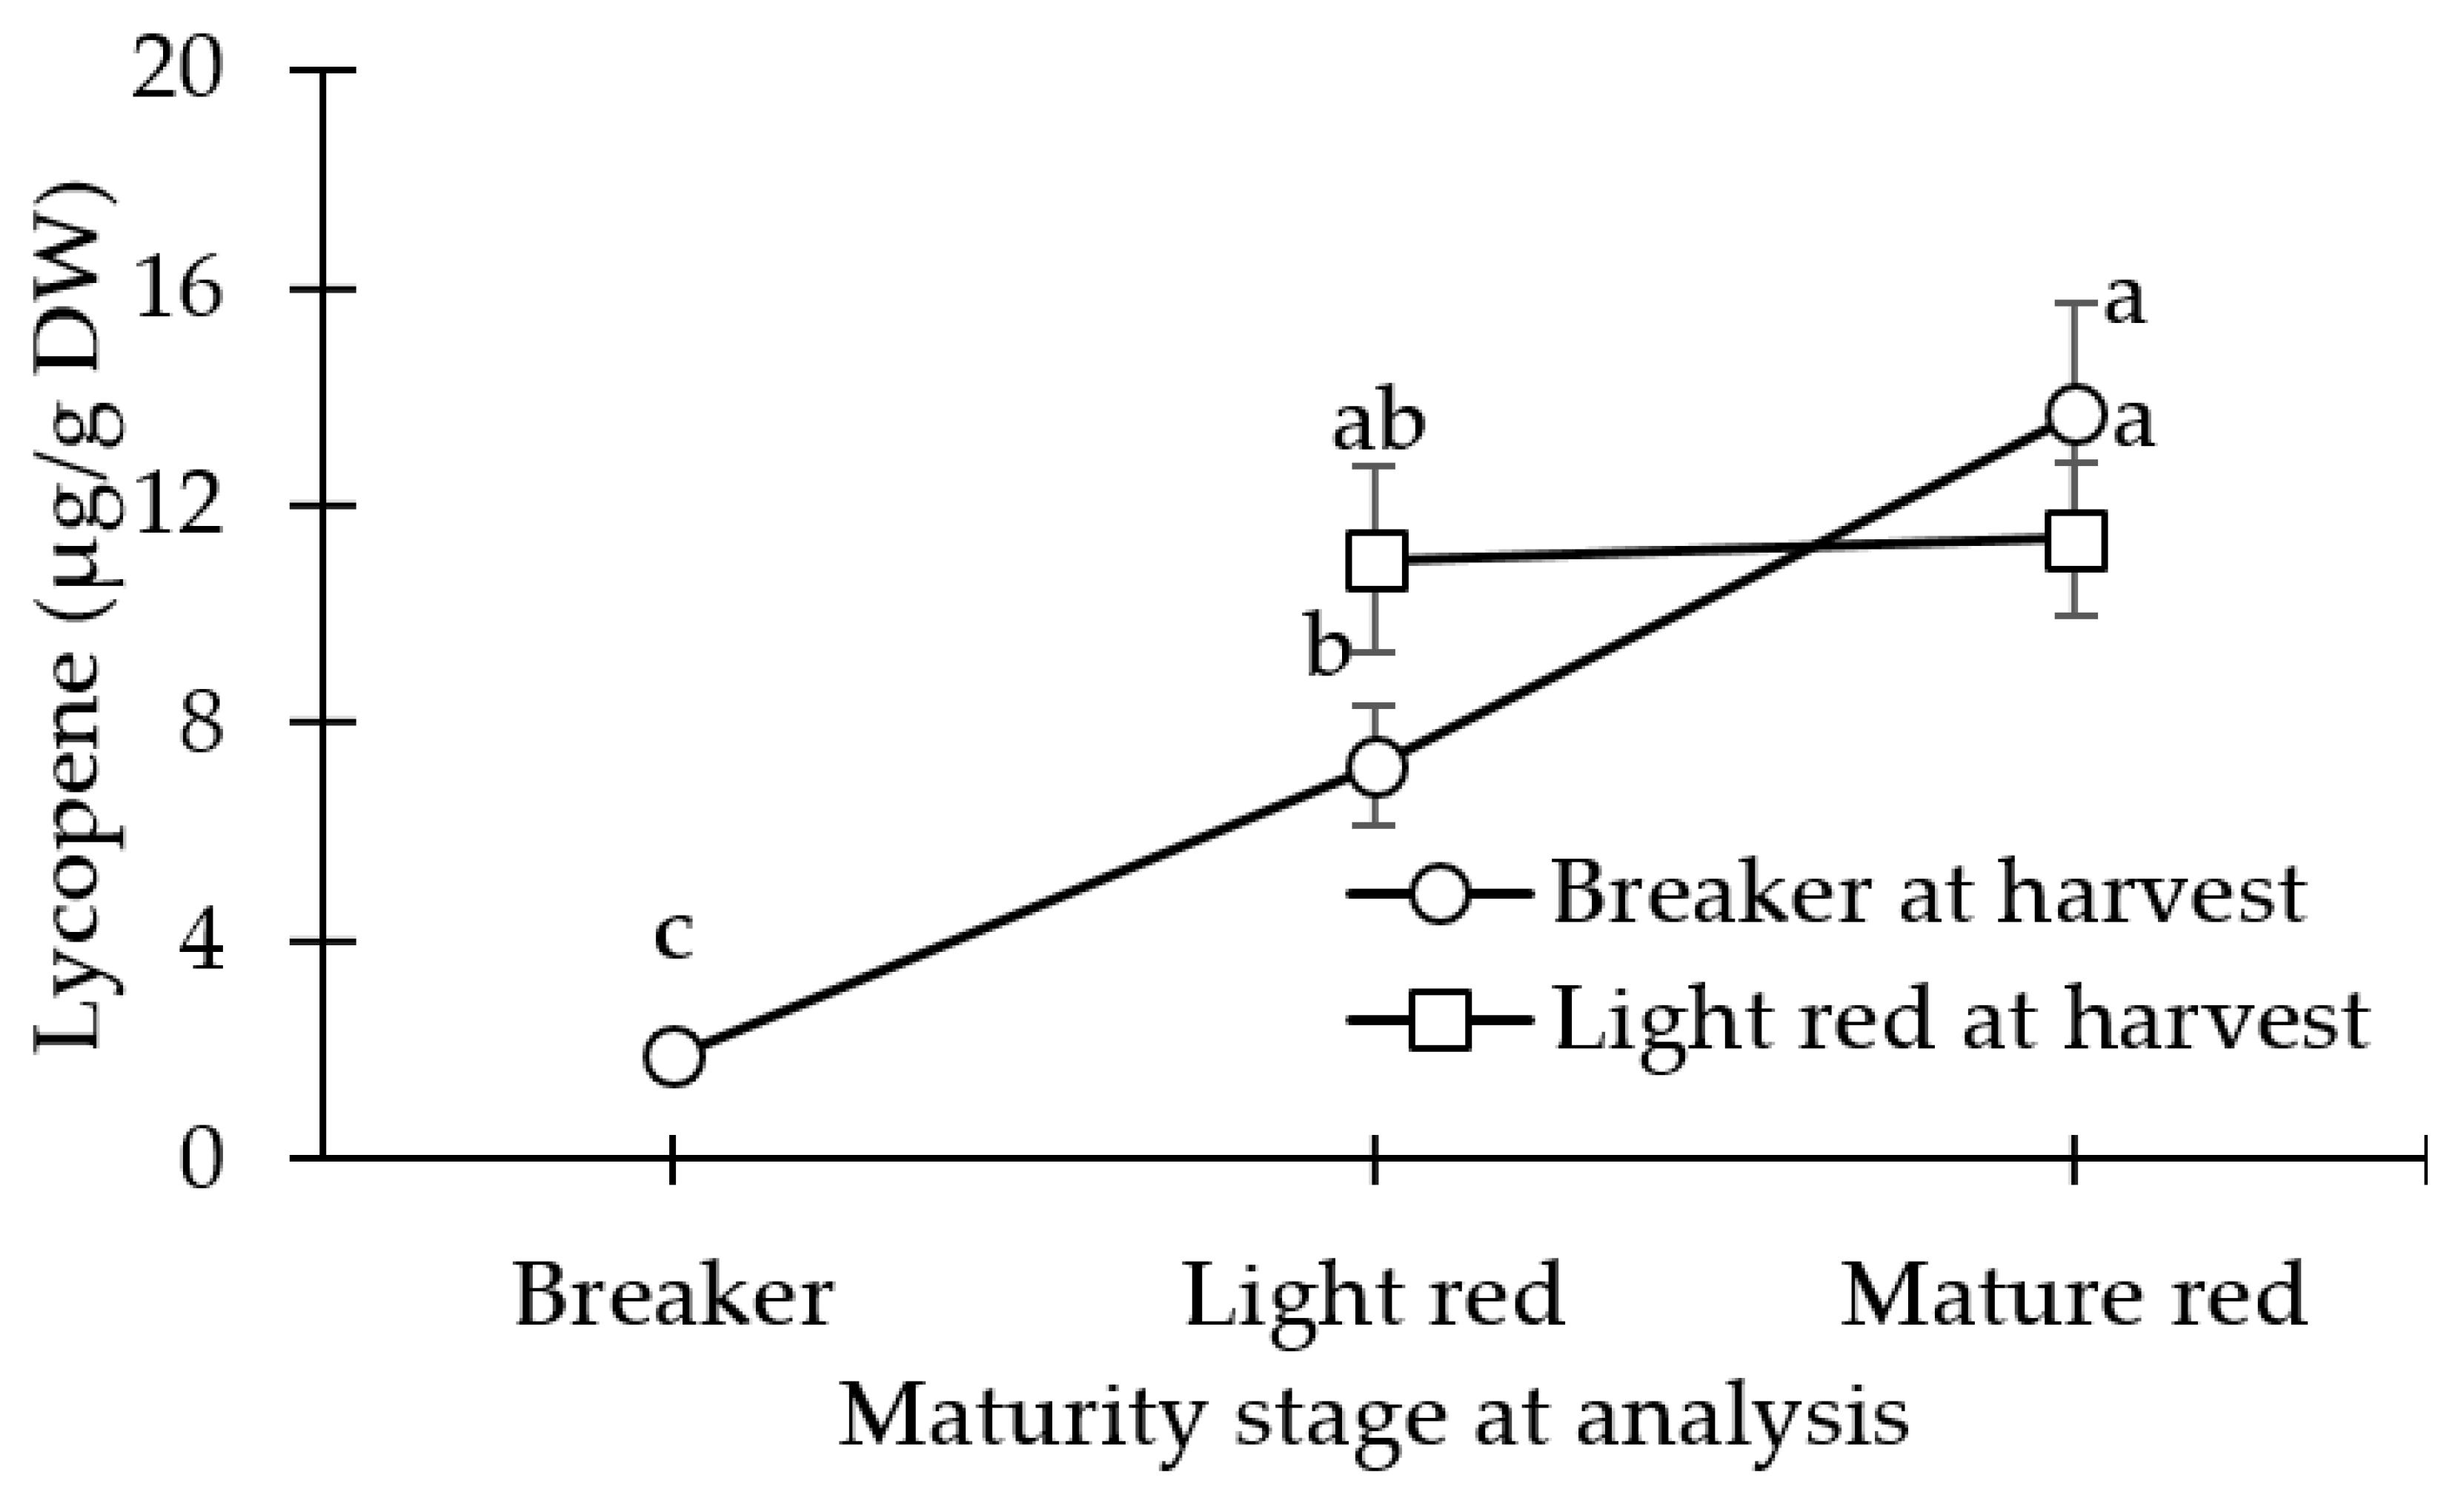
The β-carotene values were 41.7 to 48.1 μg/g DW, which is consistent with values reported in the literature [69]. The lycopene values were 12.7 to 16.2 μg/g DW, which is consistent with values reported in the literature [9,70]. However, neither compound differed between coverings. It has been shown that higher temperature, as opposed to PAR, is a better predictor of lycopene content in tomato fruit grown under various shade cloths [71]. Fruit surface temperature was not measured in the present study but canopy temperatures did not differ more than 1.5 °C between coverings [63]. To test the effect of temperature variation due to covering, each covering would need to span the entire individual high tunnel, which was not possible due to trial limitations.
No differences between coverings were detected for the three flavonol compounds that we studied; however, all three were found to be in the ranges as determined by previous tomato studies [56,72,73,74,75,76]. The aforementioned tomato studies did not specify the production system and it is possible that their samples came from the open-field. Quercetin was the highest accumulating flavonol in the tomato samples, as found previously [77]. The presence of the catechol group on the B ring indicate that the flavonols in question are highly active against ROS and provide a well-known protective mechanism against intense solar radiation [78]. However, UV-A/B sensitivity has been demonstrated to be crop and cultivar specific [27], so it is not clear if this mechanism is active in our cultivar. Furthermore, other studies have suggested that the UV-B threshold needed to induce flavonoids is not met from solar light alone, and a greater effect would be observed with the use of a supplemental UV light source [37].
Previous studies have found that the combined amount of the identified phenolic acids was 36% higher than the flavonoid concentration in conventionally grown, open-field tomatoes [76]. The antioxidant potential of field grown tomatoes in Italy was strongly correlated with phenolic acid concentration versus flavonoid concentration [74]. Chlorogenic acid was the highest accumulating phenolic compound in our trials, which was consistent with previous studies, although concentrations range widely from <10 to 805 mg/kg DW [56,72,73,74]. The large range could be explained by variable conditions such as cultivar, environmental conditions, and location, maturity, as well as storage conditions and duration. It was found that total phenolic and individual phenolic acid concentrations of tomato fruit at harvest increased by 20% when cultivated under a UV-transmitting (clear) covering, compared with UV-blocking covering [20]. Similarly, the chlorogenic acid concentration increased by 29% in BR, 50% in BR_MR, and 25% in LR_MR fruit under the clear covering (>60% UV-A/B transmission), as compared to the standard covering (16% UV-A/B transmission).
Ferulic acid and chlorogenic acid have been found to produce strong antioxidant activities by inhibiting lipid oxidation and scavenging ROS [79]. Ferulic acid concentration was lower than the other measured phenolic compounds in this study, but the amounts were 10-fold greater than previous findings from high tunnel tomatoes [20]. Within both the breaker and light red fruit, no consistent differences were observed between coverings. Few studies aimed to identify phenolic compound differentiation based on high tunnel covering, but no consistent differences in ferulic acid accumulation were found between high tunnel coverings that altered UV light [20]. Furthermore, the BR_MR fruit grown under the shade covering resulted in the greatest accumulation of ferulic acid, which contrasts previous tomato shade studies [80].
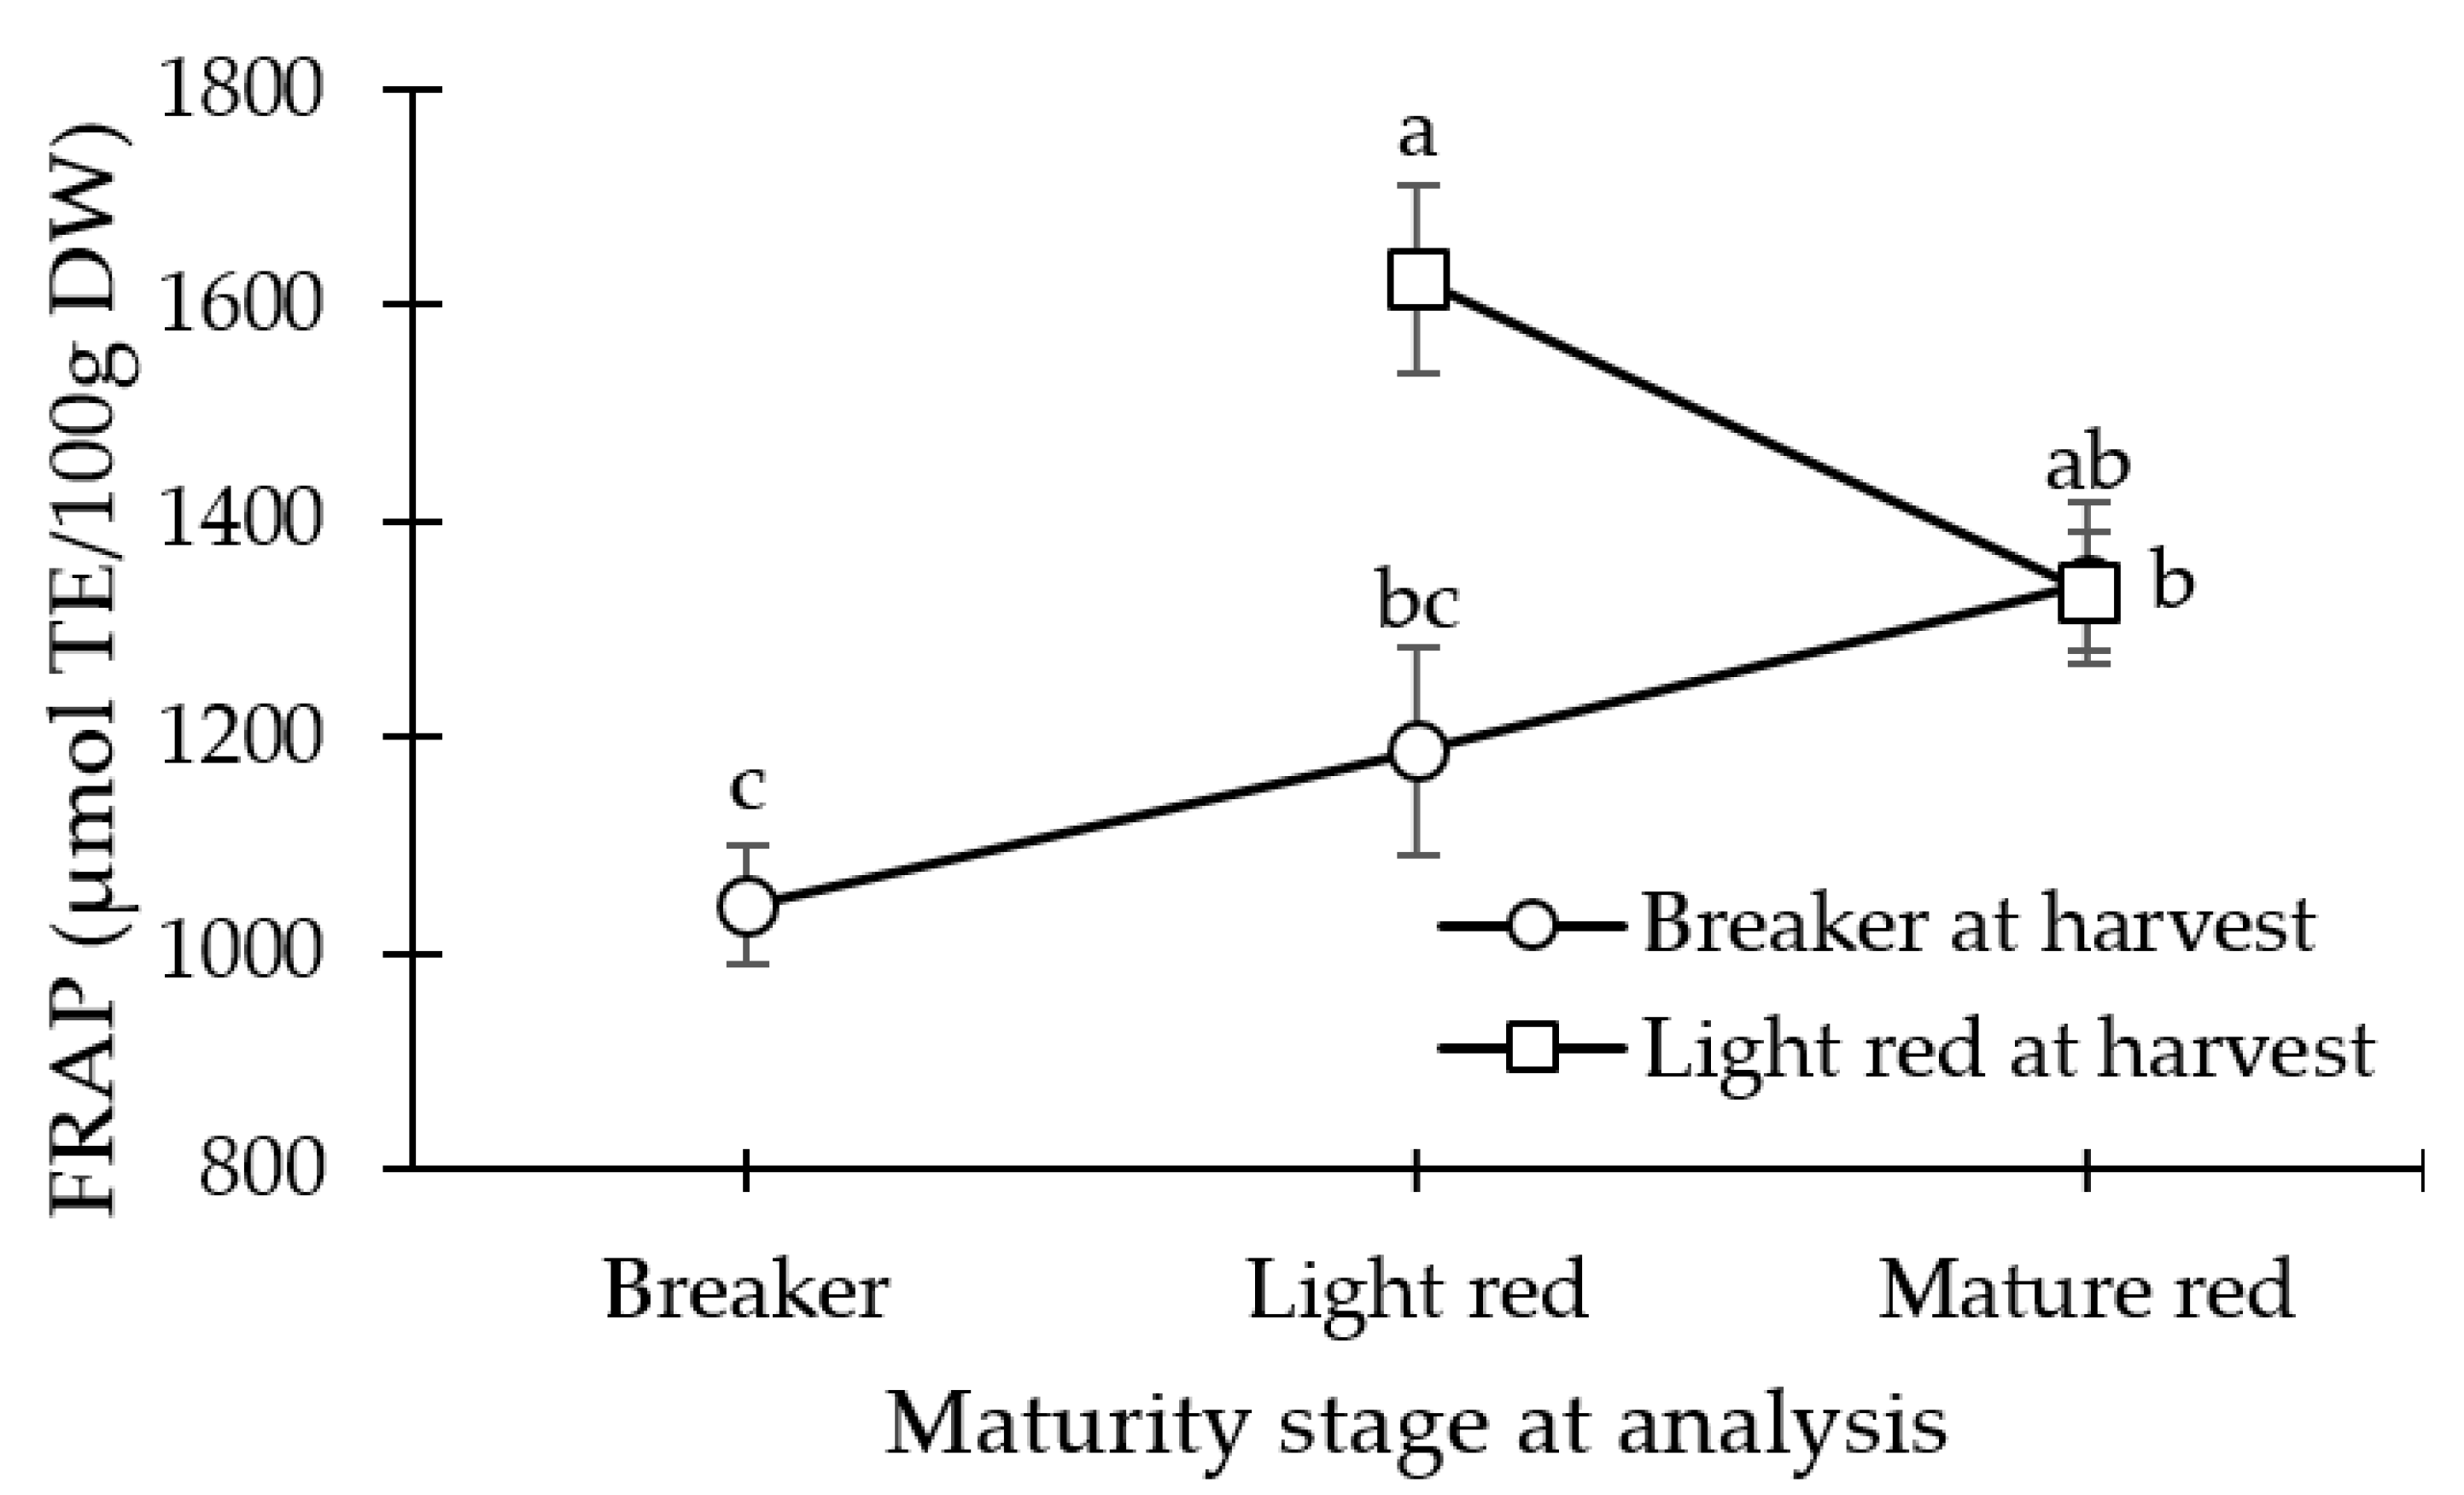
We investigated the effect of the maturity stage of the tomato fruit on antioxidant capacity and concentration (AsA, carotenoids, and phenolic compounds) at harvest and during ripening. The FRAP values in LR fruit were 44% greater than those of the BR fruit, as past studies show that antioxidant capacity at harvest increases with fruit maturity as determined by FRAP [81]. However, by the POC, the LR_MR and BR_MR fruits were similar in antioxidant capacity. Similar to our findings, FRAP values of LR fruit have shown to decrease throughout postharvest storage at 20 °C [81]. Since antioxidant capacity is related to the concentrations of lycopene and AsA, we observe similar trends throughout ripening for those compounds.
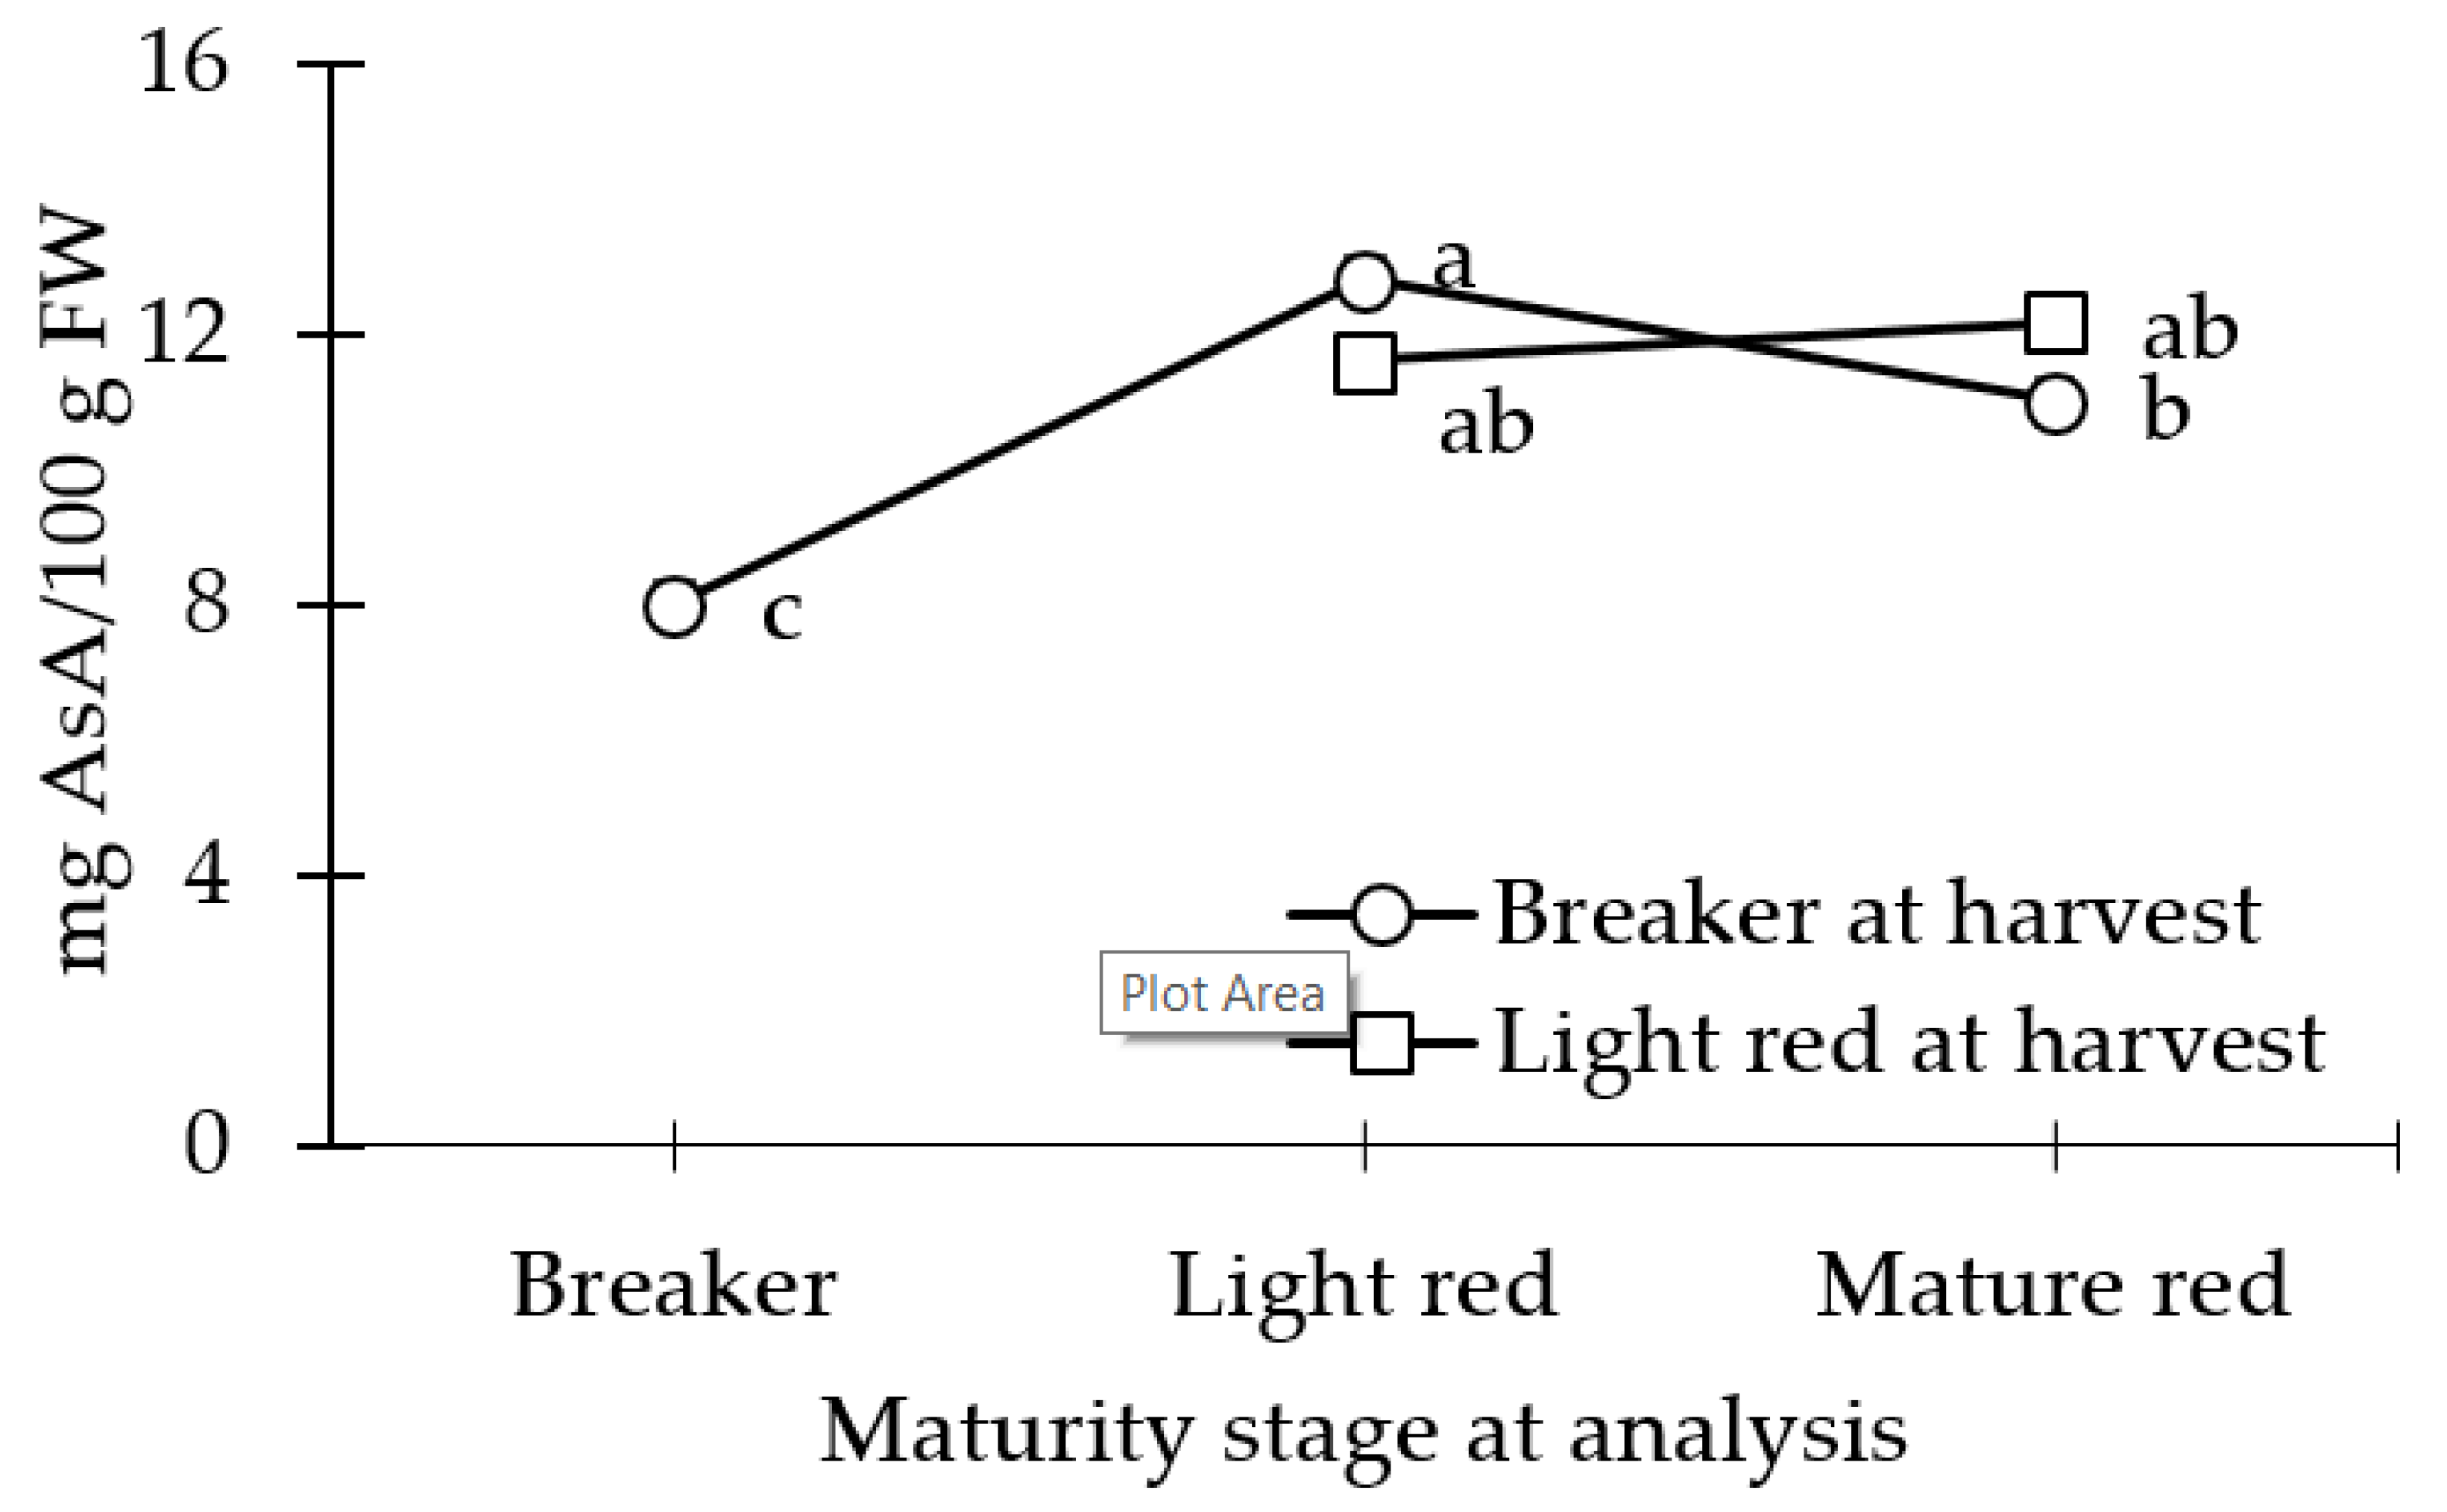
AsA increased with harvest maturity, which several studies have found to be true [9,46,81]. It was found that AsA increased by 31% in light red fruit at harvest, as compared to breaker fruit at harvest, similar to a previous greenhouse study [82]. Furthermore, past studies show fruit to accumulate AsA while ripening on or off the plant, but greater increases are noted for those with a later maturity at harvest [9,81]. The AsA for the fruit harvested at the breaker stage increased while ripening and peaked in BR_LR fruit. Research has shown enzymes responsible for AsA metabolism and biosynthesis in cherry tomatoes are upregulated in storage at 10 °C temperatures [83]. However, we noted a significant decrease in AsA between BR_LR to BR_MR fruit. Similar reports show that 21-day storage at 10 °C, followed by storage for 2 days, at 25 °C, resulted in significant AsA loss [16]. The authors suggested that ripening encourages ROS production, and that ascorbate-oxidase and peroxidase are released from the cell walls, due to water loss and tissue damage due to maturation and prolonged storage [64]. Furthermore, after prolonged storage, degradation of the AsA metabolite may happen at a faster rate than production, thus decreasing levels [84]. In comparing the two harvest maturities at the POC, the AsA concentration was 10% higher in the LR_MR fruit, but did not differ statistically from the BR_MR fruit.
The lycopene content of the fruit harvested at the breaker stage increased throughout storage, as past studies have shown with breaker fruit stored at 12 °C [70]. While the β-carotene did not alter significantly between maturity stages. Lycopene has been shown to accumulate after the breaker stage, with β-carotene to a lesser extent [9]. It is suggested that the increase of enzymatic genes, phytoene desaturase and phytoene synthase, and decrease in lycopene cyclases, trigger the accumulation of lycopene [85]. However, similar to FRAP and AsA, at the POC, the LR_MR and BR_MR fruit did not differ in lycopene concentration.
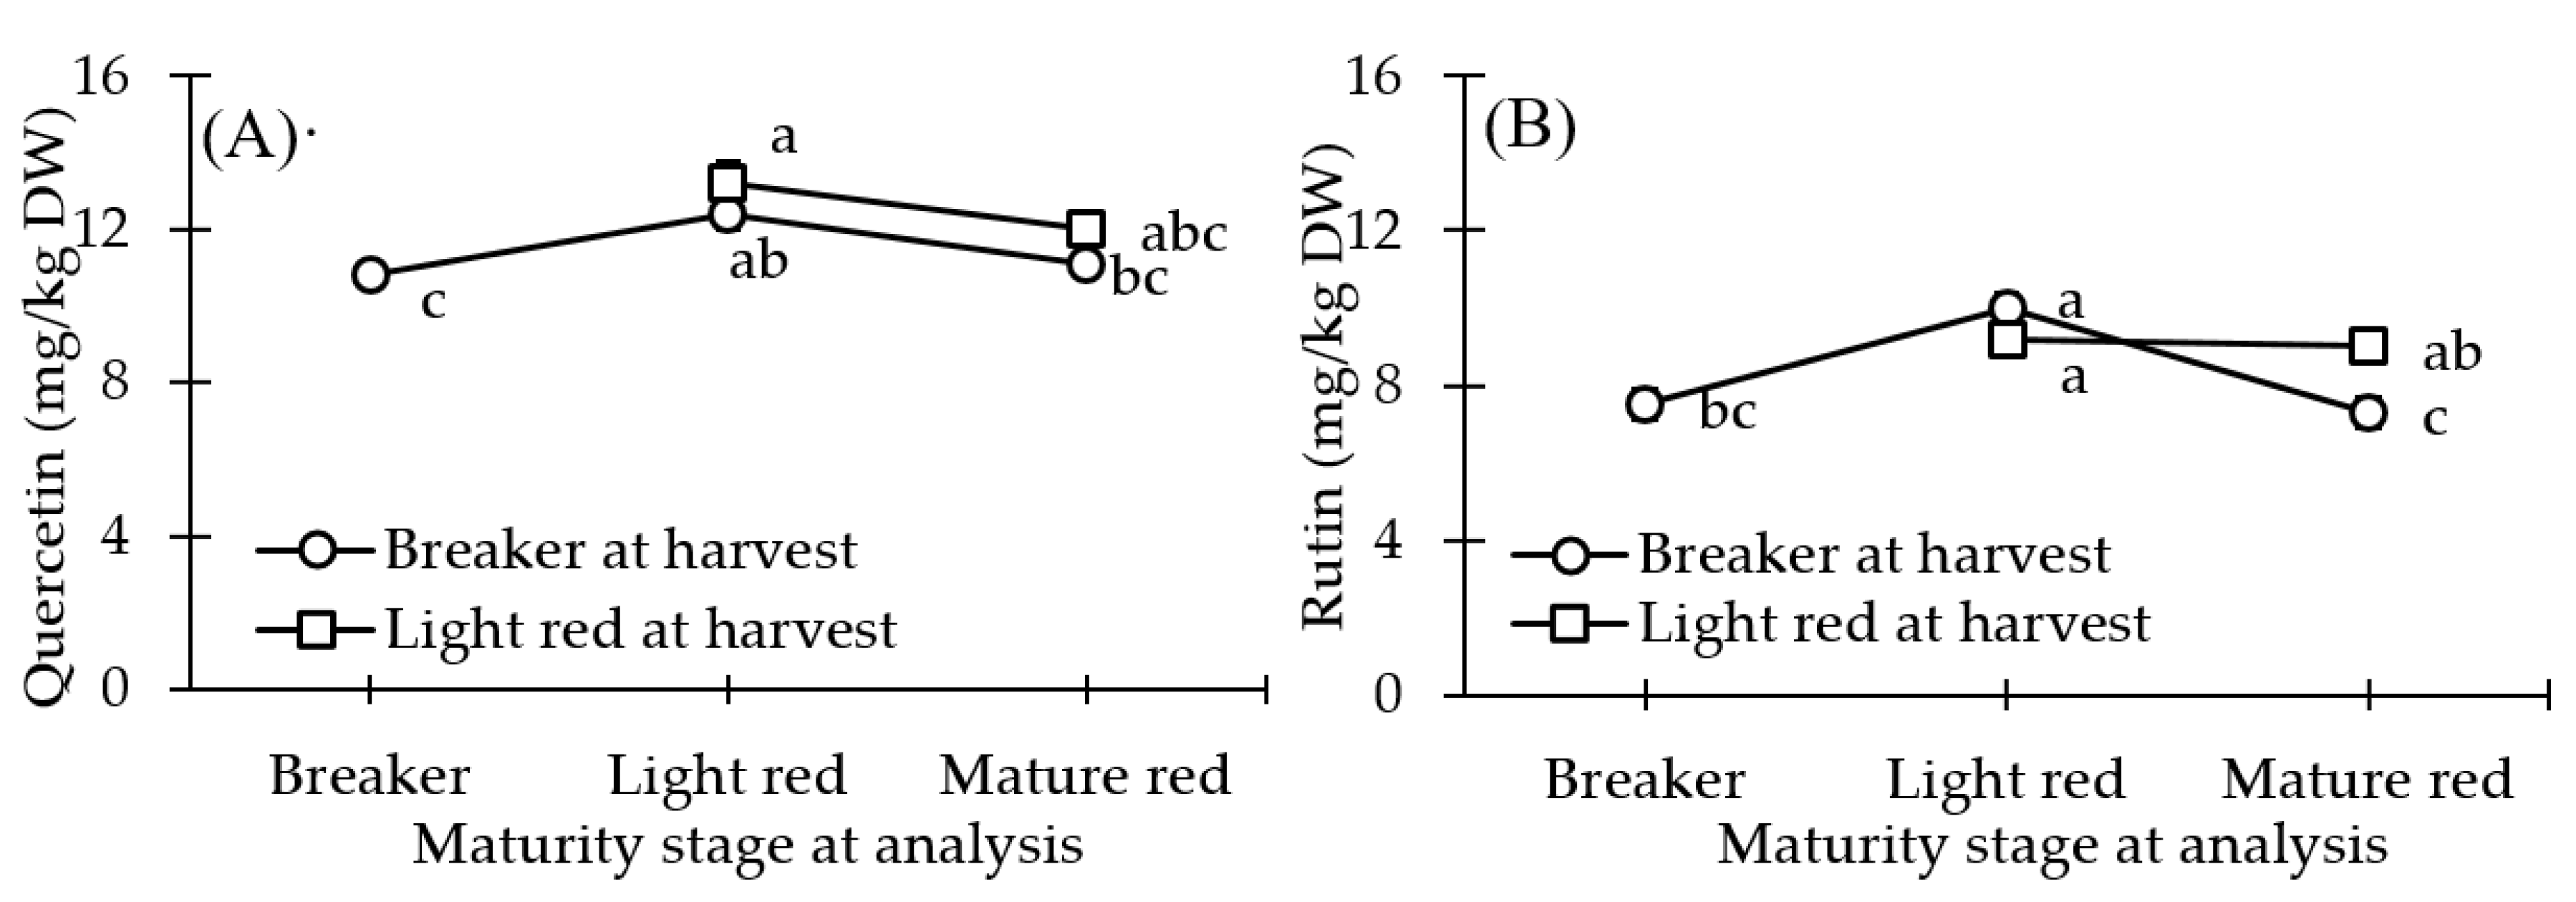
We found the flavonoids, quercetin and rutin, to vary by maturity stage at harvest and during ripening. At harvest, LR fruit contained significantly greater quercetin and rutin concentration, as compared to BR fruit. In addition, rutin and quercetin increased from BR to BR_LR stage and then decreased by the POC (BR_MR) to levels that were similar in BR fruit. In a previous greenhouse study, rutin in cherry tomatoes increased both with harvest maturity and storage temperature [9]. However, the storage temperatures in the aforementioned study were high when compared to the present study. The BR_MR fruit were stored at 12.5 °C for 10 days + 5 days of shelf life, at 21 °C. Although those storage and shelf life conditions are optimal for quality assurance [86], the change in temperature may have initiated the decrease in flavonoid concentration in the BR_MR stage fruit. At the POC, the rutin concentration in LR_MR fruit increased significantly, by 19%, compared to BR_MR fruit.
During ripening, the chlorogenic acid of the LR fruit did not differ from the BR fruit, as other studies have found [9]. Chlorogenic acid was the only measured phenolic compound to decrease throughout off-plant ripening, decreasing approximately two-fold from one maturity stage to the next in both breaker and light red harvest mature fruit. The results are similar to findings from a greenhouse study, where chlorogenic acid decreased to 60% of the concentration of mature green fruit by mature red stage [9]. They found that PAL is the key enzyme in phenolic acid biosynthesis and has been reported to decrease during fruit ripening, without being a limiting factor for synthesis of some phenolic compounds [9]. In agreement, a separate study suggested that chlorogenic acid is associated with auxin metabolism and decreases during ripening [87]. The study found that chlorogenic acid paralleled the decline in indole-3-acetic acid (IAA) levels in the pericarp of two tomato varieties during maturation. It has also been suggested that chlorogenic acid is further catabolized during ripening, to produce caffeic acid derivatives, like ferulic acid [9,20]. In this study, ferulic acid did increase throughout ripening for the breaker mature fruit, which was different from the other measured metabolites. At the POC, the ferulic acid concentration in the BR_MR fruit increased by 61% under the standard covering and 75% under the shade covering, as compared to the LR_MR fruit.

5. Conclusions

To our knowledge, this study is among the first to alter light with various poly coverings in a high tunnel system in order to determine tomato nutritional quality. The results of this study show that high tunnel covering and maturity stage significantly affect antioxidant capacity, as determined by FRAP, AsA, lycopene, and phenolic compounds in tomato fruit. The phenolic compounds included three flavonols and two phenolic acids (quercetin, rutin, isoquercetin, chlorogenic acid, and ferulic acid) that were quantified from tomatoes at breaker, light red, and mature red stages. Chlorogenic acid was the predominant phenolic compound measured throughout the two-year trial. The most consistent effect of high tunnel covering was observed under the clear covering with increased UV-A and UV-B transmission, and increased antioxidant capacity and AsA concentration in light red and breaker mature fruit, as well as chlorogenic acid concentration in breaker mature fruit. Throughout ripening, antioxidant capacity, AsA, lycopene, rutin, quercetin, and ferulic acid all increased. However, maturity at harvest did not affect the nutrient composition by the POC for antioxidant capacity, lycopene, β-carotene, AsA, and quercetin concentration. Only the rutin and chlorogenic acid concentration were significantly increased in LR_MR fruit, as compared to the BR_MR fruit. These results indicate that the accumulation of these antioxidants in tomato fruit is significantly affected by the spectral quality of ambient solar radiation and postharvest maturation. Since AsA, carotenoids, and phenolic compounds are important antioxidants for human nutrition, subtle differences in nutrient composition between the high tunnel coverings due to differences in the light transmission properties are important for tomato production.

Author Contributions

Data curation, K.M.G. and M.L.; formal analysis, K.M.G., Q.K., and B.C.; funding acquisition, C.B.R.; investigation, K.M.G.; methodology, K.M.G., C.L.R., and E.D.P.; project administration, K.M.G., E.D.P., and C.L.R.; resources, E.D.P.; supervision, C.B.R., E.D.P., and C.L.R.; visualization, K.M.G.; writing—original draft, K.M.G.; writing—review and editing, W.W., E.D.P., C.L.R., and C.B.R. All authors have read and agreed to the published version of the manuscript.

Funding

USDA-NIFA project KS00-0072-MS1836, “Characterizing and Managing Light Factors during Pre- and Postharvest Stages to Improve Nutritive Value for Vegetables Grown in High Tunnels”.

Acknowledgments

I would like to thank Paul Anderson and the OHREC staff for on-farm support during production; as well as Tricia Jenkins, Joseph Rundquist, Kostas Batziakas, and Jacob Freitag for support during postharvest analysis.

Conflicts of Interest

The authors declare no conflict of interest. The funders had no role in the design of the study; in the collection, analyses, or interpretation of data; in the writing of the manuscript; or in the decision to publish the results.

References

  1. Carey, E.E.; Jett, L.; Lamont, W.J.; Nennich, T.T.; Orzolek, M.D.; Williams, K.A. Horticultural Crop Production in High Tunnels in the United States: A Snapshot. HortTechnology 2009, 19, 37–43. [Google Scholar] [CrossRef]
  2. Ilić, Z.S.; Milenković, L.; Šunic, L.; Fallik, E. Effect of coloured shade-nets on plant leaf parameters and tomato fruit quality. J. Sci. Food Agric. 2014, 95, 2660–2667. [Google Scholar] [CrossRef] [PubMed]
  3. Cowan, J.S.; Miles, C.A.; Andrews, P.K.; Inglis, D.A. Biodegradable mulch performed comparably to polyethylene in high tunnel tomato (Solanum lycopersicum L.) production. J. Sci. Food Agric. 2014, 94, 1854–1864. [Google Scholar] [CrossRef] [PubMed]
  4. Flaishman, M.A.; Peles, Y.; Dahan, Y.; Milo-Cochavi, S.; Frieman, A.; Naor, A. Differential response of cell-cycle and cell-expansion regulators to heat stress in apple (Malus domestica) fruitlets. Plant Sci. 2015, 233, 82–94. [Google Scholar] [CrossRef] [PubMed]
  5. Wilkens, R.T.; Spoerke, J.M.; Stamp, N.E. Differential Responses of Growth and Two Soluble Phenolics of Tomato to Resource Availability. Ecology 1996, 77, 247–258. [Google Scholar] [CrossRef]
  6. Stamp, N. Out of The Quagmire of Plant Defense Hypotheses. Q. Rev. Biol. 2003, 78, 23–55. [Google Scholar] [CrossRef] [Green Version]
  7. Stewart, A.J.; Bozonnet, S.; Mullen, W.; Jenkins, G.I.; Lean, M.E.J.; Crozier, A. Occurrence of Flavonols in Tomatoes and Tomato-Based Products. J. Agric. Food Chem. 2000, 48, 2663–2669. [Google Scholar] [CrossRef]
  8. George, B.; Kaur, C.; Khurdiya, D.; Kapoor, H. Antioxidants in tomato (Lycopersium esculentum) as a function of genotype. Food Chem. 2004, 84, 45–51. [Google Scholar] [CrossRef]
  9. Gautier, H.; Diakou-Verdin, V.; Bénard, C.; Reich, M.; Buret, M.; Bourgaud, F.; Poëssel, J.L.; Caris-Veyrat, C.; Génard, M. How Does Tomato Quality (Sugar, Acid, and Nutritional Quality) Vary with Ripening Stage, Temperature, and Irradiance? J. Agric. Food Chem. 2008, 56, 1241–1250. [Google Scholar] [CrossRef]
  10. Oh, M.-M.; Carey, E.E.; Rajashekar, C.B. Antioxidant phytochemicals in lettuce grown in high tunnels and open field. Hortic. Environ. Biotechnol. 2011, 52, 133–139. [Google Scholar] [CrossRef]
  11. Romani, A.; Pinelli, P.; Galardi, C.; Sani, G.; Cimato, A.; Heimler, D. Polyphenols in greenhouse and open-air-grown lettuce. Food Chem. 2002, 79, 337–342. [Google Scholar] [CrossRef] [Green Version]
  12. Selahle, K.M.; Sivakumar, D.; Jifon, J.; Soundy, P. Postharvest responses of red and yellow sweet peppers grown under photo-selective nets. Food Chem. 2015, 173, 951–956. [Google Scholar] [CrossRef] [PubMed]
  13. Tsormpatsidis, E.; Henbest, R.; Davis, F.J.; Battey, N.; Hadley, P.; Wagstaffe, A. UV irradiance as a major influence on growth, development and secondary products of commercial importance in Lollo Rosso lettuce ‘Revolution’ grown under polyethylene films. Environ. Exp. Bot. 2008, 63, 232–239. [Google Scholar] [CrossRef]
  14. Zhao, X.; Carey, E.E.; Young, J.E.; Wang, W.; Iwamoto, T. Influences of Organic Fertilization, High Tunnel Environment, and Postharvest Storage on Phenolic Compounds in Lettuce. HortScience 2007, 42, 71–76. [Google Scholar] [CrossRef]
  15. Agati, G.; Tattini, M. Multiple functional roles of flavonoids in photoprotection. New Phytol. 2010, 186, 786–793. [Google Scholar] [CrossRef]
  16. Selahle, M.K.; Sivakumar, D.; Soundy, P. Effect of photo-selective nettings on post-harvest quality and bioactive compounds in selected tomato cultivars. J. Sci. Food Agric. 2014, 94, 2187–2195. [Google Scholar] [CrossRef] [PubMed]
  17. Petropoulos, S.; Fernandes, Â.; Katsoulas, N.; Barros, L.; Ferreira, I.C. The effect of covering material on the yield, quality and chemical composition of greenhouse grown tomato fruit. J. Sci. Food Agric. 2018, 99, 3057–3068. [Google Scholar] [CrossRef]
  18. Ahmad, P.; Jaleel, C.A.; Salem, M.A.; Nabi, G.; Sharma, S. Roles of enzymatic and nonenzymatic antioxidants in plants during abiotic stress. Crit. Rev. Biotechnol. 2010, 30, 161–175. [Google Scholar] [CrossRef]
  19. Antonious, G.F.; Bomford, M.; Vincelli, P. Screening Brassica species for glucosinolate content. J. Environ. Sci. Health Part B 2009, 44, 311–316. [Google Scholar] [CrossRef]
  20. Luthria, D.L.; Mukhopadhyay, S.; Krizek, D.T. Content of total phenolics and phenolic acids in tomato (Lycopersicon esculentum Mill.) fruits as influenced by cultivar and solar UV radiation. J. Food Compos. Anal. 2006, 19, 771–777. [Google Scholar] [CrossRef]
  21. Oh, M.-M.; Rajashekar, C.B. Antioxidant content of edible sprouts: Effects of environmental shocks. J. Sci. Food Agric. 2009, 89, 2221–2227. [Google Scholar] [CrossRef]
  22. Shalata, A.; Mittova, V.; Volokita, M.; Guy, M.; Tal, M. Response of the cultivated tomato and its wild salt-tolerant relative Lycopersiconpennellii to salt-dependent oxidative stress: The root antioxidative system. Physiol. Plant. 2001, 112, 487–494. [Google Scholar] [CrossRef] [PubMed]
  23. El-Gizawy, A.; Abdallah, M.; Gomaa, H.; Mohamed, S. Effect of different shading levels on tomato plants. 2. yield and fruit quality. Acta Hortic. 1993, 323, 349–354. [Google Scholar] [CrossRef]
  24. Giuntini, D.; Graziani, G.; Lercari, B.; Fogliano, V.; Soldatini, G.F.; Ranieri, A. Changes in Carotenoid and Ascorbic Acid Contents in Fruits of Different Tomato Genotypes Related to the Depletion of UV-B Radiation. J. Agric. Food Chem. 2005, 53, 3174–3181. [Google Scholar] [CrossRef] [PubMed]
  25. García-Valverde, V.; Navarro-González, I.; García-Alonso, J.; Periago, M.J. Antioxidant Bioactive Compounds in Selected Industrial Processing and Fresh Consumption Tomato Cultivars. Food Bioprocess Technol. 2011, 6, 391–402. [Google Scholar] [CrossRef]
  26. Gautier, H.; Rocci, A.; Buret, M.; Grasselly, D.; Dumas, Y.; Causse, M. Effect of photoselective filters on the physical and chemical traits of vine-ripened tomato fruits. Can. J. Plant Sci. 2005, 85, 439–446. [Google Scholar] [CrossRef]
  27. Krizek, D.T.; Kramer, G.F.; Upadhyaya, A.; Mirecki, R.M. UV-B response of cucumber seedlings grown under metal halide and high pressure sodium/deluxe lamps. Physiol. Plant. 1993, 88, 350–358. [Google Scholar] [CrossRef]
  28. Kubasek, W.L.; Shirley, B.W.; McKillop, A.; Goodman, H.M.; Briggs, W.; Ausubel, F.M. Regulation of flavonoid biosynthetic genes in germinating Arabidopsis seedlings. Plant Cell 1992, 4, 1229–1236. [Google Scholar] [CrossRef]
  29. Jones, D. Phenylalanine ammonia-lyase: Regulation of its induction, and its role in plant development. Phytochemistry 1984, 23, 1349–1359. [Google Scholar] [CrossRef]
  30. Yaginuma, S.; Shiraishi, T.; Ohya, H.; Igarashi, K. Polyphenol Increases in Safflower and Cucumber Seedlings Exposed to Strong Visible Light with Limited Water. Biosci. Biotechnol. Biochem. 2002, 66, 65–72. [Google Scholar] [CrossRef] [Green Version]
  31. Winkel-Shirley, B. Flavonoid Biosynthesis. A Colorful Model for Genetics, Biochemistry, Cell Biology, and Biotechnology. Plant Physiol. 2001, 126, 485–493. [Google Scholar] [CrossRef] [PubMed] [Green Version]
  32. Fuglevand, G.; Jackson, J.A.; Jenkins, G.I. UV-B, UV-A, and blue light signal transduction pathways interact synergistically to regulate chalcone synthase gene expression in Arabidopsis. Plant Cell 1996, 8, 2347–2357. [Google Scholar] [PubMed] [Green Version]
  33. Li, T.; Bi, G.; Lecompte, J.; Barickman, T.C.; Evans, B.B. Effect of Colored Shadecloth on the Quality and Yield of Lettuce and Snapdragon. HortTechnology 2017, 27, 860–867. [Google Scholar] [CrossRef]
  34. Sytar, O.; Zivcak, M.; Brückova, K.; Brestic, M.; Hemmerich, I.; Rauh, C.; Simko, I. Shift in accumulation of flavonoids and phenolic acids in lettuce attributable to changes in ultraviolet radiation and temperature. Sci. Hortic. 2018, 239, 193–204. [Google Scholar] [CrossRef]
  35. Woolley, A.; Sumpter, S.; Lee, M.; Xu, J.; Barry, S.; Wang, W.; Rajashekar, C.B. Accumulation of Mineral Nutrients and Phytochemicals in Lettuce and Tomato Grown in High Tunnel and Open Field. Am. J. Plant Sci. 2019, 10, 125–138. [Google Scholar] [CrossRef] [Green Version]
  36. Tomás-Barberán, A.F.; Espín, J.C. Phenolic compounds and related enzymes as determinants of quality in fruits and vegetables. J. Sci. Food Agric. 2001, 81, 853–876. [Google Scholar] [CrossRef]
  37. Krizek, D.T.; Mirecki, R.M.; Britz, S.J. Inhibitory effects of ambient levels of solar UV-A and UV-B radiation on growth of cucumber. Physiol. Plant. 1997, 100, 886–893. [Google Scholar] [CrossRef]
  38. Papaioannou, C.; Katsoulas, N.; Maletsika, P.; Siomos, A.; Kittas, C. Effects of a UV-absorbing greenhouse covering film on tomato yield and quality. Span. J. Agric. Res. 2012, 10, 959–966. [Google Scholar] [CrossRef] [Green Version]
  39. Dannehl, D.; Huber, C.; Rocksch, T.; Huyskens-Keil, S.; Schmidt, U. Interactions between changing climate conditions in a semi-closed greenhouse and plant development, fruit yield, and health-promoting plant compounds of tomatoes. Sci. Hortic. 2012, 138, 235–243. [Google Scholar] [CrossRef]
  40. Zhao, X.; Iwamoto, T.; Carey, E.E. Antioxidant capacity of leafy vegetables as affected by high tunnel environment, fertilisation and growth stage. J. Sci. Food Agric. 2007, 87, 2692–2699. [Google Scholar] [CrossRef]
  41. Becker, C.; Kläring, H.-P.; Kroh, L.W.; Krumbein, A. Temporary reduction of radiation does not permanently reduce flavonoid glycosides and phenolic acids in red lettuce. Plant Physiol. Biochem. 2013, 72, 154–160. [Google Scholar] [CrossRef] [Green Version]
  42. Hipol, R.L.B.; Dionisio-Sese, M.L. Impact of light variation on the antioxidant properties of red lettuce. Electron. J. Biol. 2014, 10, 28–34. [Google Scholar]
  43. Gierson, D.; Kader, A.A. Fruit Ripening and Quality. In The Tomato Crop; Atherton, J.G., Rudich, J., Eds.; Chapman and Hall: London, UK, 1986; pp. 241–280. [Google Scholar] [CrossRef]
  44. Dannehl, D.; Huyskens-Keil, S.; Eichholz, I.; Ulrichs, C.; Schmidt, U. Effects of direct-electric-current on secondary plant compounds and antioxidant activity in harvested tomato fruits (Solanum lycopersicon L.). Food Chem. 2011, 126, 157–165. [Google Scholar] [CrossRef]
  45. Poiroux-Gonord, F.; Bidel, L.P.R.; Fanciullino, A.-L.; Gautier, H.; Lauri-Lopez, F.; Urban, L. Health Benefits of Vitamins and Secondary Metabolites of Fruits and Vegetables and Prospects To Increase Their Concentrations by Agronomic Approaches. J. Agric. Food Chem. 2010, 58, 12065–12082. [Google Scholar] [CrossRef] [PubMed]
  46. Betancourt, L.A.; Stevens, M.A.; Kader, A.A. Accumulation and loss of sugars and reduced ascorbic. J. Am. Soc. Hort. Sci. 1977, 102, 721–723. [Google Scholar]
  47. Vinha, A.F.; Barreira, S.V.P.; Castro, A.; Costa, A.S.G.; Oliveira, M.B.P.P. Influence of the Storage Conditions on the Physicochemical Properties, Antioxidant Activity and Microbial Flora of Different Tomato (Lycopersicon esculentum L.) Cultivars. J. Agric. Sci. 2013, 5, 118. [Google Scholar] [CrossRef] [Green Version]
  48. Tyapkina, D.Y.; Kochieva, E.; Slugina, M.A. Vitamin C in fleshy fruits: Biosynthesis, recycling, genes, and enzymes. Vavilov J. Genet. Breed. 2019, 23, 270–280. [Google Scholar] [CrossRef]
  49. Pietta, P.-G. Flavonoids as Antioxidants. J. Nat. Prod. 2000, 63, 1035–1042. [Google Scholar] [CrossRef]
  50. Reimers, K.J.; Keast, D.R. Tomato Consumption in the United States and Its Relationship to the US Department of Agriculture Food Pattern. Nutr. Today 2016, 51, 198–205. [Google Scholar] [CrossRef]
  51. Institute of Medicine (US) Panel on Dietary Antioxidants and Related Compounds. Dietary Reference Intakes for Vitamin C, Vitamin E, Selenium, and Carotenoids; The National Academies Press: Washington, DC, USA, 2000; pp. 95–185. [Google Scholar]
  52. Andrés, F.L.C.; Perla, A.G. Comparison of color indexes for tomato ripening Comparação dos índices de cor para maturação do tomate. Hortic. Bras. 2004, 22, 534–537. [Google Scholar]
  53. U.S. Department of Agriculture. United States Standards for Grades of Fresh Tomatoes; Fresh Products Branch: Washington, DC, USA, 1997. [Google Scholar]
  54. Verheul, M.J.; Slimestad, R.; Tjøstheim, I.H. From Producer to Consumer: Greenhouse Tomato Quality As Affected by Variety, Maturity Stage at Harvest, Transport Conditions, and Supermarket Storage. J. Agric. Food Chem. 2015, 63, 5026–5034. [Google Scholar] [CrossRef]
  55. Nunes, N.; Emond, J.P.; Rauth, M.; Dea, S.; Chau, K.V. Environmental conditions encountered during typical consumer retail display affect fruit and vegetable quality and waste. Postharvest Biol. Technol. 2009, 51, 232–241. [Google Scholar] [CrossRef]
  56. Alarcón-Flores, M.I.; Romero-González, R.; Vidal, J.L.M.; Frenich, A.G. Multiclass determination of phytochemicals in vegetables and fruits by ultra high performance liquid chromatography coupled to tandem mass spectrometry. Food Chem. 2013, 141, 1120–1129. [Google Scholar] [CrossRef] [PubMed]
  57. Klimczak, I.; Gliszczyńska-Świgło, A. Comparison of UPLC and HPLC methods for determination of vitamin C. Food Chem. 2015, 175, 100–105. [Google Scholar] [CrossRef] [PubMed]
  58. Nagata, M.; Yamashita, I. Simple Method for Simultaneous Determination of Chlorophyll and Carotenoids in Tomato Fruit. Nippon. Shokuhin Kogyo Gakkaishi 1992, 39, 925–928. [Google Scholar] [CrossRef] [Green Version]
  59. Vallverdú-Queralt, A.; Oms-Oliu, G.; Odriozola-Serrano, I.; Lamuela-Raventós, R.M.; Martín-Belloso, O.; Elez-Martínez, P. Metabolite profiling of phenolic and carotenoid contents in tomatoes after moderate-intensity pulsed electric field treatments. Food Chem. 2013, 136, 199–205. [Google Scholar] [CrossRef]
  60. Benzie, I.F.; Strain, J. The Ferric Reducing Ability of Plasma (FRAP) as a Measure of “Antioxidant Power”: The FRAP Assay. Anal. Biochem. 1996, 239, 70–76. [Google Scholar] [CrossRef] [Green Version]
  61. Vallverdú-Queralt, A.; Oliu, G.O.; Odriozola-Serrano, I.; Lamuela-Raventós, R.M.; Martín-Belloso, O.; Elez-Martínez, P. Effects of Pulsed Electric Fields on the Bioactive Compound Content and Antioxidant Capacity of Tomato Fruit. J. Agric. Food Chem. 2012, 60, 3126–3134. [Google Scholar] [CrossRef] [PubMed]
  62. Choi, S.-H.; Kim, H.-R.; Kim, H.-J.; Lee, I.-S.; Kozukue, N.; Levin, C.E.; Friedman, M. Free Amino Acid and Phenolic Contents and Antioxidative and Cancer Cell-Inhibiting Activities of Extracts of 11 Greenhouse-Grown Tomato Varieties and 13 Tomato-Based Foods. J. Agric. Food Chem. 2011, 59, 12801–12814. [Google Scholar] [CrossRef]
  63. Gude, K. Altering Light with High Tunnel Coverings to Improve Health-Promoting Phytochemicals of Lettuce and Tomato. Ph.D. Thesis, Kansas State University, Manhattan, KS, USA, 2020. Available online: https://krex.k-state.edu/dspace/handle/2097/40741 (accessed on 16 October 2020).
  64. Lee, S.K.; Kader, A.A. Preharvest and postharvest factors influencing vitamin C content of horticultural crops. Postharvest Biol. Technol. 2000, 20, 207–220. [Google Scholar] [CrossRef] [Green Version]
  65. Boo, Y.C.; Jung, J. Water Deficit—Induced Oxidative Stress and Antioxidative Defenses in Rice Plants. J. Plant Physiol. 1999, 155, 255–261. [Google Scholar] [CrossRef]
  66. Yamamoto, H.Y.; Bassi, R. Carotenoids: Localization and Function. In Toxic Plant Proteins; Springer Science and Business Media LLC.: Berlin/Heidelberg, Germany, 2005; Volume 4, pp. 539–563. [Google Scholar]
  67. Loomis, W. Growth-differentiation balance vs. carbohydrate-nitrogen ratio. Proc. Am. Soc. Hortic. Sci. 1932, 29, 240–245. [Google Scholar]
  68. Loomis, W.E. Growth Correlation. In Growth and Differentiation in Plant; Loomis, W.E., Ed.; The Iowa State College Press: Ames, IA, USA, 1953; pp. 197–252. [Google Scholar]
  69. Becker, C.; Urlić, B.; Špika, M.J.; Kläring, H.-P.; Krumbein, A.; Baldermann, S.; Ban, S.G.; Perica, S.; Schwarz, D. Nitrogen Limited Red and Green Leaf Lettuce Accumulate Flavonoid Glycosides, Caffeic Acid Derivatives, and Sucrose while Losing Chlorophylls, Β-Carotene and Xanthophylls. PLoS ONE 2015, 10, e0142867. [Google Scholar] [CrossRef]
  70. Tilahun, S.; Park, D.S.; Solomon, T.; Choi, H.R.; Jeong, C.S. Maturity stages affect nutritional quality and storability of tomato cultivars. CyTA J. Food 2019, 17, 87–95. [Google Scholar] [CrossRef]
  71. Tinyane, P.P.; Sivakumar, D.; Soundy, P. Influence of photo-selective netting on fruit quality parameters and bioactive compounds in selected tomato cultivars. Sci. Hortic. 2013, 161, 340–349. [Google Scholar] [CrossRef]
  72. Alarcón-Flores, M.I.; Romero-González, R.; Vidal, J.L.M.; Frenich, A.G. Multiclass Determination of Phenolic Compounds in Different Varieties of Tomato and Lettuce by Ultra High Performance Liquid Chromatography Coupled to Tandem Mass Spectrometry. Int. J. Food Prop. 2015, 19, 494–507. [Google Scholar] [CrossRef]
  73. Vallverdú-Queralt, A.; Medina-Remón, A.; Martínez-Huélamo, M.; Jáuregui, O.; Andrés-Lacueva, C.; Lamuela-Raventós, R.M. Phenolic Profile and Hydrophilic Antioxidant Capacity as Chemotaxonomic Markers of Tomato Varieties. J. Agric. Food Chem. 2011, 59, 3994–4001. [Google Scholar] [CrossRef] [PubMed]
  74. Minoggio, M.; Bramati, L.; Simonetti, P.; Gardana, C.; Iemoli, L.; Santangelo, E.; Mauri, P.; Spigno, P.; Soressi, G.; Pietta, P. Polyphenol Pattern and Antioxidant Activity of Different Tomato Lines and Cultivars. Ann. Nutr. Metab. 2003, 47, 64–69. [Google Scholar] [CrossRef]
  75. Slimestad, R.; Verheul, M. Review of flavonoids and other phenolics from fruits of different tomato (Lycopersicon esculentum Mill.) cultivars. J. Sci. Food Agric. 2009, 89, 1255–1270. [Google Scholar] [CrossRef]
  76. Hallmann, E. The influence of organic and conventional cultivation systems on the nutritional value and content of bioactive compounds in selected tomato types. J. Sci. Food Agric. 2012, 92, 2840–2848. [Google Scholar] [CrossRef]
  77. Crozier, A.; Lean, M.E.; McDonald, M.S.; Black, C. Quantitative Analysis of the Flavonoid Content of Commercial Tomatoes, Onions, Lettuce, and Celery. J. Agric. Food Chem. 1997, 45, 590–595. [Google Scholar] [CrossRef]
  78. Takahashi, A.; Takeda, K.; Ohnishi, T. Light-Induced Anthocyanin Reduces the Extent of Damage to DNA in UV-Irradiated Centaurea cyanus Cells in Culture. Plant Cell Physiol. 1991, 32, 541–547. [Google Scholar] [CrossRef]
  79. Cheng, J.-C.; Dai, F.; Zhou, B.; Yang, L.; Liu, Z.-L. Antioxidant activity of hydroxycinnamic acid derivatives in human low density lipoprotein: Mechanism and structure–activity relationship. Food Chem. 2007, 104, 132–139. [Google Scholar] [CrossRef]
  80. Liu, W.; Ren, M.-L.; Liu, T.; Du, Y.-L.; Zhou, T.; Liu, X.-M.; Liu, J.; Hussain, S.; Yang, W. Effect of shade stress on lignin biosynthesis in soybean stems. J. Integr. Agric. 2018, 17, 1594–1604. [Google Scholar] [CrossRef]
  81. Slimestad, R.; Verheul, M.J. Content of Chalconaringenin and Chlorogenic Acid in Cherry Tomatoes Is Strongly Reduced during Postharvest Ripening. J. Agric. Food Chem. 2005, 53, 7251–7256. [Google Scholar] [CrossRef]
  82. Islam, S.; Matsui, T.; Yoshida, Y. Effect of carbon dioxide enrichment on physico-chemical and enzymatic changes in tomato fruits at various stages of maturity. Sci. Hortic. 1996, 65, 137–149. [Google Scholar] [CrossRef]
  83. Tsaniklidis, G.; Delis, C.; Nikoloudakis, N.; Katinakis, P.; Aivalakis, G. Low temperature storage affects the ascorbic acid metabolism of cherry tomato fruits. Plant Physiol. Biochem. 2014, 84, 149–157. [Google Scholar] [CrossRef]
  84. Fenech, M.; Amaya, I.; Valpuesta, V.; Botella, J.R. Vitamin C Content in Fruits: Biosynthesis and Regulation. Front. Plant Sci. 2019, 9, 2006. [Google Scholar] [CrossRef] [Green Version]
  85. Bramley, P.M. Regulation of carotenoid formation during tomato fruit ripening and development. J. Exp. Bot. 2002, 53, 2107–2113. [Google Scholar] [CrossRef] [PubMed] [Green Version]
  86. Kader, A. Maturity, ripening, and quality relationships of fruit-vegetables. Acta Hortic. 1996, 249–256. [Google Scholar] [CrossRef]
  87. Buta, J.G.; Spaulding, D.W. Endogenous Levels of Phenolics in Tomato Fruit during Growth and Maturation. J. Plant Growth Regul. 1997, 16, 43–46. [Google Scholar] [CrossRef]
Figure 1. Antioxidant capacity as determined by FRAP method of tomato fruit grown under the following six different high tunnel coverings: standard poly (standard), standard poly with removal two weeks prior to the first harvest (movable), diffuse poly (diffuse), clear poly (clear), UV-A/B blocking poly (block), and 55% shade cloth over standard poly (shade). Lsmeans (±SE) with same letter do not differ significantly at p < 0.05, Tukey’s HSD.
Agronomy 10 01639 g001
Figure 2. Antioxidant capacity as determined by FRAP method of tomato fruit harvested at breaker stage and analyzed at day 0, at light red stage (stored at 12.5 °C at 90% relative humidity (RH) until day 10 (or an a* value of 22)), and mature red stage (stored at 12.5 °C and 90% RH until day 10 (or an a* value of 22) + market shelf conditions of 21 °C and 65% RH 5 days (or an a* value of 28)). Light red mature fruit was analyzed at day 0, and at mature red stage (market shelf conditions of 21 °C and 65% RH for 5 days (or an a* value of 28)). Lsmeans (±SE) with same letter do not differ significantly at p < 0.05, Tukey’s HSD.
Agronomy 10 01639 g002
Figure 3. Ascorbic acid concentration (AsA) of tomato fruit grown under the following six different high tunnel coverings: standard poly (standard), standard poly with removal two weeks prior to the first harvest (movable), diffuse poly (diffuse), clear poly (clear), UV-A/B blocking poly (block), and 55% shade cloth over standard poly (shade). Lsmeans (±SE) with same letter do not differ significantly at p < 0.05, Tukey’s HSD.
Agronomy 10 01639 g003
Figure 4. Ascorbic acid concentration (AsA) of tomato fruit harvested at breaker stage and analyzed at day 0, at light red stage (stored at 12.5 °C at 90% relative humidity (RH) until day 10 (or an a* value of 22)), and mature red stage (stored at 12.5 °C and 90% RH until day 10 (or an a* value of 22) + market shelf conditions of 21 °C and 65% RH 5 days (or an a* value of 28)). Light red mature fruits were analyzed at day 0, and at mature red stage (market shelf conditions of 21 °C and 65% RH for 5 days (or an a* value of 28)). Lsmeans (±SE) with same letter do not differ significantly at p < 0.05, Tukey’s HSD.
Agronomy 10 01639 g004
Figure 5. Lycopene concentration of tomato fruit harvested at breaker stage and analyzed at day 0, at light red stage (stored at 12.5 °C at 90% relative humidity (RH) until day 10 (or an a* value of 22)), and mature red stage (stored at 12.5 °C and 90% RH until day 10 (or an a* value of 22) + market shelf conditions of 21 °C and 65% RH 5 days (or an a* value of 28)). Light red mature fruit was analyzed at day 0, and at mature red stage (market shelf conditions of 21 °C and 65% RH for 5 days (or an a* value of 28)). Lsmeans (±SE) with same letter do not differ significantly at p < 0.05, Tukey’s HSD.
Agronomy 10 01639 g005
Figure 6. The effect of maturity stage on quercetin (A) and rutin (B) concentration (mg/kg DW) of tomatoes grown in high tunnels in Olathe, KS, in 2017 and 2018. Fruit was harvested at breaker stage and analyzed at day 0, at light red stage (stored at 12.5 °C at 90% relative humidity (RH) until day 10 (or an a* value of 22)), and mature red stage (stored at 12.5 °C and 90% RH until day 10 (or an a* value of 22) + market shelf conditions of 21 °C and 65% RH 5 days (or an a* value of 28)). Fruit was also harvested at light red stage and analyzed at day 0, and at mature red stage (market shelf conditions of 21 °C and 65% RH for 5 days (or an a* value of 28)). Lsmeans (±SE) with same letter do not differ significantly at p < 0.05, Tukey’s HSD.
Agronomy 10 01639 g006
Table 1. Color determines maturity stage based on L* (-black to +white), a* (-greenness to +redness), b* (-blue to +yellow), Chroma (a*2 + b*2)0.5, and hue angle [tan−1 (b*/a*)].
MaturityL*a*b*ChromaHue°
Breaker61.10 (±1.5)−4.79 (±1.5)27.00 (±1.5)27.92 (±1.5)100.11 (±1.5)
Light Red47.78 (±1.5)22.34 (±1.5)32.68 (±1.5)39.75 (±1.5)55.87 (±1.5)
Mature Red44.84 (±1.5)27.94 (±1.5)31.17 (±1.5)40.79 (±1.5)48.98 (±1.5)
Table 2. Maturity stage at analysis based on redness a* (-greenness to +redness) with corresponding codes.
Maturity Stage at HarvestMaturity Stage at AnalysisCodeRedness at Analysis (*a)
BreakerBreakerBR−4.79 (± 1.5)
Light RedBR_LR22.34 (± 1.5)
Mature RedBR_MR27.94 (± 1.5)
Light RedLight RedLR22.34 (± 1.5)
Mature RedLR_MR27.94 (± 1.5)
Table 3. The effect of high tunnel covering treatment on percent transmission of UV-A and UV-B 1, compared to unobstructed light in Olathe, KS, in 2017.
CoveringUV-A (w/m2)UV-B (w/m2)
Movable28.81.9
Standard4.70.3
Block6.80.1
Clear17.51.2
Diffuse2.20.1
Shade2.00.1
1 UV-A and UV-B were measured three times prior to harvest, on cloudless days (10, 17, and 23 July 2017). Values are six measurements, to represent the rep as a whole (four reps per covering).
Table 4. Probability values 1 of high tunnel covering, maturity stage, and maturity stage × covering on the antioxidant parameters of tomato fruit grown in high tunnels in Olathe, KS, in 2017 and 2018.
AntioxidantCovering 2Maturity Stage 3Maturity Stage × Covering
FRAP (µmol TE/100 g DW)<0.05<0.001ns
Ascorbic Acid (mg AsA/100 g FW)<0.001<0.001ns
Lycopene (μg/g DW)ns<0.001ns
β-carotene (μg/g DW)nsnsns
Isoquercetin (mg/kg DW)nsnsns
Rutin (mg/kg DW)ns<0.001ns
Quercetin (mg/kg DW)ns<0.001ns
Chlorogenic acid(mg/kg DW)<0.01<0.001<0.01
Ferulic acid (mg/kg DW)<0.01<0.01<0.05
1 Linear mixed model was used to test if covering, maturity stage, or maturity stage × covering had significant effect on the examined parameter (p ≤ 0.05). 2 Covering includes the following six different high tunnel coverings: standard poly, a simulated movable covering, diffuse poly, clear poly, UV-A/B blocking poly, and 55% shade cloth over standard poly. 3 Maturity stage includes five analysis time points: breaker harvested fruit (BR), breaker harvested fruit at ‘light red’ maturity (BR_LR), breaker harvested fruit at ‘mature red’ maturity (BR_MR), light red harvested fruit (LR), and light red harvested fruit at ‘mature red’ maturity (LR_MR). DW = dry weight. FW = fresh weight. ns = not significant.
Table 5. The effect of high tunnel coverings and maturity stage on chlorogenic acid concentration (mg/kg DW) of tomato at analysis and comparing the point of consumption (POC) after grown in high tunnels in Olathe, KS, in 2017 and 2018.
Coverings 1BR 2BR_LRBR_MRLRLR_MRPOC (BR_MR and LR_MR)
Standard52 (5.4)37 (5.8)14 (2.8)42 (6.8)20 (2.3)ns 3
Movable45 (4.9)29 (4.2) 7 (1.4)52 (7.7)18 (2)**
Diffuse41 (4.2)23 (3.3)17 (3.2)64 (9.5)23 (2.5)ns
Clear67 (6.9)32 (4.7)21 (4.1)58 (7.7)25 (2.8)ns
Block56 (5.8)29 (4.7)18 (3.4)62 (8.2)32 (3.5)*
Shade60 (6.8)41 (6.3)15 (3.2)46 (6)27 (3.2)*
Mean5432155424
p-value<0.05ns<0.01ns<0.01
1 Coverings include: standard poly (standard), standard poly with removal two weeks prior to the first harvest (movable), diffuse poly (diffuse), clear poly (clear), UV-A/B blocking poly (block), and 55% shade cloth over standard poly (shade). 2 Maturity stage includes five analysis time points: breaker at harvest (BR), breaker harvested fruit at ‘light red’ maturity (BR_LR), breaker harvested fruit at the POC or ‘mature red’ stage (BR_MR), light red at harvest (LR), and light red harvested fruit at the POC or ‘mature red’ stage (LR_MR). To mimic commercial retail, BR_LR fruit was stored at optimum conditions of 12.5 °C at 90% RH for 10 days (or an a* value of 22). BR_MR fruit was stored at 12.5 °C and 90% relative humidity (RH) for 10 days (or an a* value of 22) + market shelf conditions of 21 °C and 65% RH for 5 days (or an a* value of 28). LR_MR fruit was held at market shelf conditions of 21 °C and 65% RH for 5 days (or an a* value of 28). 3 Significance between BR_MR and LR_MR for individual coverings; ns = not significant; * p ≤ 0.05, and ** p ≤ 0.01.
Table 6. The effect of high tunnel coverings and maturity stage on ferulic acid concentration (mg/kg DW) of tomato at analysis and comparing the point of consumption (POC) after grown in high tunnels in Olathe, KS, in 2017 and 2018.
Coverings 1BR 2BR_LR BR_MRLRLR_MRPOC (BR_MR and LR_MR)
Standard3.2 (0.7)2.3 (0.7)3.6 (2.8) 2.7 (0.7)1.4 (0.4)* 3
Movable2.2 (0.5)2.7 (0.8)1.7 (1.4)1 (0.3)1.1 (0.3)ns
Diffuse1.9 (0.4)2.4 (0.7)2.1 (3.2)1.8 (0.4)1.4 (0.4)ns
Clear1.1 (0.2)2.6 (0.8)3.5 (4.1)2.6 (0.6)3.3 (0.9)ns
Block1.4 (0.3)2.1 (0.7) 3.6 (0.9)2.9 (0.6)2.9 (0.8)ns
Shade1.6 (0.4)5 (1.5)6.3 (1.8)2.2 (0.5)1.6 (0.5)**
p-value<0.05ns<0.05<0.05<0.05
1 Coverings include: standard poly (standard), standard poly with removal two weeks prior to the first harvest (movable), diffuse poly (diffuse), clear poly (clear), UV-A/B blocking poly (block), and 55% shade cloth over standard poly (shade). 2 Maturity stage includes five analysis time points: breaker at harvest (BR), breaker harvested fruit at ‘light red’ maturity (BR_LR), breaker harvested fruit at the POC or ‘mature red’ stage (BR_MR), and light red at harvest (LR), light red harvested fruit at the POC or ‘mature red’ stage (LR_MR). To mimic commercial retail, BR_LR fruit was stored at optimum conditions of 12.5 °C at 90% RH for 10 days (or an a* value of 22). BR_MR fruit was stored at 12.5 °C and 90% relative humidity (RH) for 10 days (or an a* value of 22) + market shelf conditions of 21 °C and 65% RH for 5 days (or an a* value of 28). LR_MR fruit was held at market shelf conditions of 21 °C and 65% RH for 5 days (or an a* value of 28). 3 Significance between BR_MR and LR_MR for individual coverings; ns = not significant; * p ≤ 0.05, and ** p ≤ 0.01.
Publisher’s Note: MDPI stays neutral with regard to jurisdictional claims in published maps and institutional affiliations.

