Article

Evaluation of Water Stress Coefficient Ks in Different Olive Orchards

Department of Business Administration of Food & Agricultural Enterprises, University of Patras, Agrinio 30100, Greece
*
Author to whom correspondence should be addressed.
Agronomy 2020, 10(10), 1594; https://doi.org/10.3390/agronomy10101594
Submission received: 7 September 2020 / Revised: 4 October 2020 / Accepted: 16 October 2020 / Published: 17 October 2020
(This article belongs to the Special Issue Mediterranean Olive Trees and Olive Oil under Climate Change)

Abstract

:
The Mediterranean basin is characterized by hot and dry summers, which are aggravated by climate change, leading to water shortages for irrigation purposes. Olive trees (Olea europea L.) which are the most common cultivation in the area, while tolerant to drought conditions, are often irrigated due to the fact that they suffer from water deficits with negative impacts on yield. The knowledge of the onset and water stress intensity, essentially determines the accuracy of an irrigation schedule that avoids yield reduction and waste of water. Water stress can be quantified by stress coefficient Ks, as suggested by Food and Agriculture Organization (FAO). Combinations and adjustments of the FAO method with field measured data have been used to calculate Ks more precisely and apply it on single experimental fields. The FAO method and a validation method were compared and evaluated with in situ measurements in two different olive orchards in terms of tree age and irrigation system. The results indicate that the FAO method fails to distinguish the differences between cultivars, attributed mainly to the tree age and irrigation system, rendering almost a similar slope of Ks and calculating a nearly simultaneous onset of stress, which was not confirmed by pre-dawn water potential (ΨPD) measurements.

1. Introduction

Olive tree (Olea europaea L.) is one of the most widespread cultivated native species in the Mediterranean region [1]. Worldwide, more than 90% of olive trees are cultivated for oil production and the rest of them for table olives, with Greece being the third producer after Spain and Italy [2]. In these areas the Mediterranean climate is characterized by hot and dry summers, with high evaporative demand. Due to these conditions plants usually suffer from water deficits affecting plant production [3].
The olive tree is a drought-tolerant species. Its adaptability to such conditions is based on the synergy of two tactics; the avoidance of water stress onset and the capability to tolerate drought [4,5]. The mechanisms that contribute to the abovementioned concern leaf morphological characteristics [6], the efficient function of the water transport via xylem [7] and the regulation of transpiration through the effective control of stomata apparatus [8,9]. Furthermore, the ability to sustain metabolism through the antioxidant mechanisms [7,8,9,10] and the osmotic adjustment [11,12,13,14,15] contribute to the capacity to extract sufficient amount of soil water, even under severe drought conditions [12,13].
Despite their drought tolerance, olive trees are nowadays irrigated [1] as they seem to respond well to irrigation [14,15,16]. Due to the fact that water is already known to be a limiting factor [17] in agriculture, strategies that promote a more efficient manner of irrigation management are well established [18,19]. Moreover, irrigation scheduling in olive cultivars, meets a number of difficulties due to great crop variability in terms of biennial bearing, various tree ages (olive trees over 70 years old) and plant distances, making the consumption of water hard to monitor. In this way trees are usually exposed to prolonged water stress.
The quantification of crop water losses in the continuum soil-plant-air, is usually expressed via the estimation of evapotranspiration (ET), the calculation of which is based on microclimatic data derived from meteorological stations [20]. In order to plan an optimized irrigation schedule in commercial orchards, answering in this way to the questions of “how much” and “when” to irrigate, it is necessary to take into account the growth stage and the period of highest water consumption to achieve high yields and annual bearing.
When there is insufficient soil water content, trees cannot meet evaporation demand and are usually exposed to water stress conditions. Water consumption limitation is defined by the stress coefficient Ks (when Ks >1 no soil water deficits subsist, while when Ks <1 water stress is on). A simple and broadly used method is the one proposed by Food and Agricultural Organization—FAO [20]. In this method, the Ks coefficient is a dimensionless transpiration reduction factor, that depends on available soil water content. ET data along with water content that can be retained depending on soil texture are included in Ks. In numerous studies, Ks is not only estimated with FAO’s original formula but it is also coupled with hydrodynamic parameters such as predawn or midday water potential in order to confirm the water status of plants. Specifically, in peach orchards, Afonso do PaÇo et al. [21] estimated stress coefficients from transpiration data measured with sap flow sensors and correlated it with ΨPD measurements, similarly to Conceição et al. [22] in olive orchards and Ferreira et al. [23] in rainfed and drip irrigated vineyards. In citrus orchards Rallo et al. [24] calculated Ks values based on soil water content and water status (midday stem water potential) measurements, while Rallo et al. [25] calculated Ks using measured soil water content data combined with midday stem water potential, in correlation with actual transpiration fluxes in a 17 year-old table olive grove orchard. However, most of research has been conducted on single experimental fields and there is a significant lack of studies that compare Ks calculated with the two abovementioned methods in multiple experimental olive orchards that differ from each other.
The objective of this study is therefore to: (1) compare the two methods on the basis of water stress detection and its intensity and (2) validate FAO’s methodology by utilizing pre-dawn water potential (ΨPD) measurements, in two olive orchards with different tree ages and irrigation systems, combining in situ measurements of soil water content and plant water status coupled with microclimatic data from meteorological station and compare it with the FAO method [20].

2. Materials and Methods

2.1. Site Description and Cultivation Details

The area studied is located in Stamna (Aitoloakarnania prefecture, Western Greece, 38°29′N; 21°17′E), a region with a large production of table olives “Olea europaea cv. Kalamon”. The climate is Mediterranean, with mild-wet winter, and usually wet spring and autumn seasons. Summer is hot and dry, usually without rainfall events from May till late September. This study was conducted on two different commercial olive orchards (hereafter identified as M5 and M1), during the consecutive year 2019–2020, with the following characteristics:
M5 olive orchard: 25 years-old Olea europaea cv. Kalamon covering a total area of 0.25 ha. Tree spacing is 6 m within row and 8 m apart. In total 55 trees were irrigated with sprinklers (60 L/h) using one (1) sprinkler per tree, with a wetting radius of 1.5 m. Soil classification is deep sandy clay (SC) with typical drainage. The amount of water applied via irrigation is about 15 mm and in total 6–7 irrigation events take place from fruit set to the end of fruit development.
M1 olive orchard: 12 years-old Olea europaea cv. Kalamon covering a total area of 0.20 ha. The planting distances were the same as above and it contained 45 trees. In this orchard the irrigation is applied with drippers (2 L/h). Soil texture is clayey (C) and 2 m deep. The amount of irrigation applied was about 10 mm per irrigation event and in total 6–7 irrigations take place from fruit set to the end of fruit development. Due to the fact that the orchards are irrigated, crop load within years is observed to be more or less stable [2].

2.2. Methodological Approaches of the Estimation of Water Stress Coefficient (Ks)

Water stress coefficients (Ks) were estimated using two different methodological approaches in both experimental sites, the FAO method and a “validation method”. In the first case, data from micrometeorological stations located within each experimental orchard were used to calculate reference evapotranspiration (ETo) according to Allen et al. [20]. The Ks coefficient was calculated using the following equation:
K s =   T A W D r T A W R A W
where TAW is the total available water in the root zone (mm), RAW is the readily available water (mm) and Dr is the root zone depletion (mm). TAW was calculated by using soil water retaining capacity as determined by the USDA classification method by inputting soil texture data and root length. Then, RAW was calculated as a fraction of available depletion of TAW and the depletion of soil water was determined by the volume of water lost via ET, as suggested by FAO [20].
In the validation method TAW and RAW were estimated using the soil water content data collected from the installed multi-depth capacitance probes. In particular, the Ks coefficient was calculated using the following equation:
  K s =   T A W ( R A W + D r i ) T A W R A W
where Dri is the root zone depletion (mm) below the threshold value (θ*) in which water stress occurs. TAW and RAW were calculated using Equations (3) and (4), respectively:
T A W = ( θ F C θ m i n ) Z r   1000
R A W = ( θ F C θ * ) Z r   1000
where θFC is the soil water content in root zone at field capacity; θmin is the seasonally minimum value of soil water content observed in field [25,26]; Zr is the rooting depth and θ* is the threshold value of the soil water content below which water stress occurs [27]. Soil water capacity values (θFC) corresponds to the maximum value of volumetric water content in the rooting zone obtained from the soil moisture sensors after an irrigation or heavy rain, immediately after free drainage had ceased. The lack of significant differences of mean volumetric water content values at the root zone during the night was used for the determination of the cessation of free drainage. In the same way, the minimum soil water content (θmin) and the threshold (θ*) value estimations were based on the average values of soil water content at root zone which correspond to predawn leaf water potential values under severe drought stress and the onset of stress, respectively.
In both methodologies, Ks values range between 0 and 1 (0 ≤ Ks ≤ 1); when Ks values were greater than 1 no water stress occurred, and when values were less than 1, olive trees suffered from soil water limitations.

2.3. Environmental Variables—Measurements of Soil Water Status

Microclimatic variables (temperature, rainfall, air humidity, wind spread and solar radiation) were continuously recorded by a microclimatic weather station placed in each experimental site in order to estimate reference evapotranspiration (ETo) according to the Penman-Monteith equation [20]. Soil water content was measured by EnviroSCAN capacitance sensors (Sentek Sensor Technologies, Stepney, South Australia, Australia). Taking into account the importance of field capacity (FC) and permanent wilting point (PWP)—here indicated as θmin—as two thresholds that determine available soil water content [28] as well as the limitations of interpreting soil moisture data in woody crops [29], the installation of the probes was performed in order to correspond to the most root absorption area [25,30]. The volumetric soil water content was continuously measured at intervals of 60 min, using sensors every 10 cm from soil surface to a depth of 1 m, calibrated according to the manufacturer’s instructions.

2.4. Measurements of Plants Water Status

Predawn leaf water potential (ΨPD) was selected as an indicator to assess the water status of plants due to its reliability, as an indicator [31,32] that integrates short term changes in water status [29]. Measurements were conducted in nine fully expanded mature leaves using a Scholander pressure chamber (SKPM 1400/80, Skye Instruments, Powys, UK). These measurements were carried out every 2 to 4 days within stress cycle, during fruit development. Each presented value is the average of three measurements that were conducted at the same time and the deviation among them was within a bar [33].

3. Results and Discussion

The values of variables that were used are presented in Table 1.

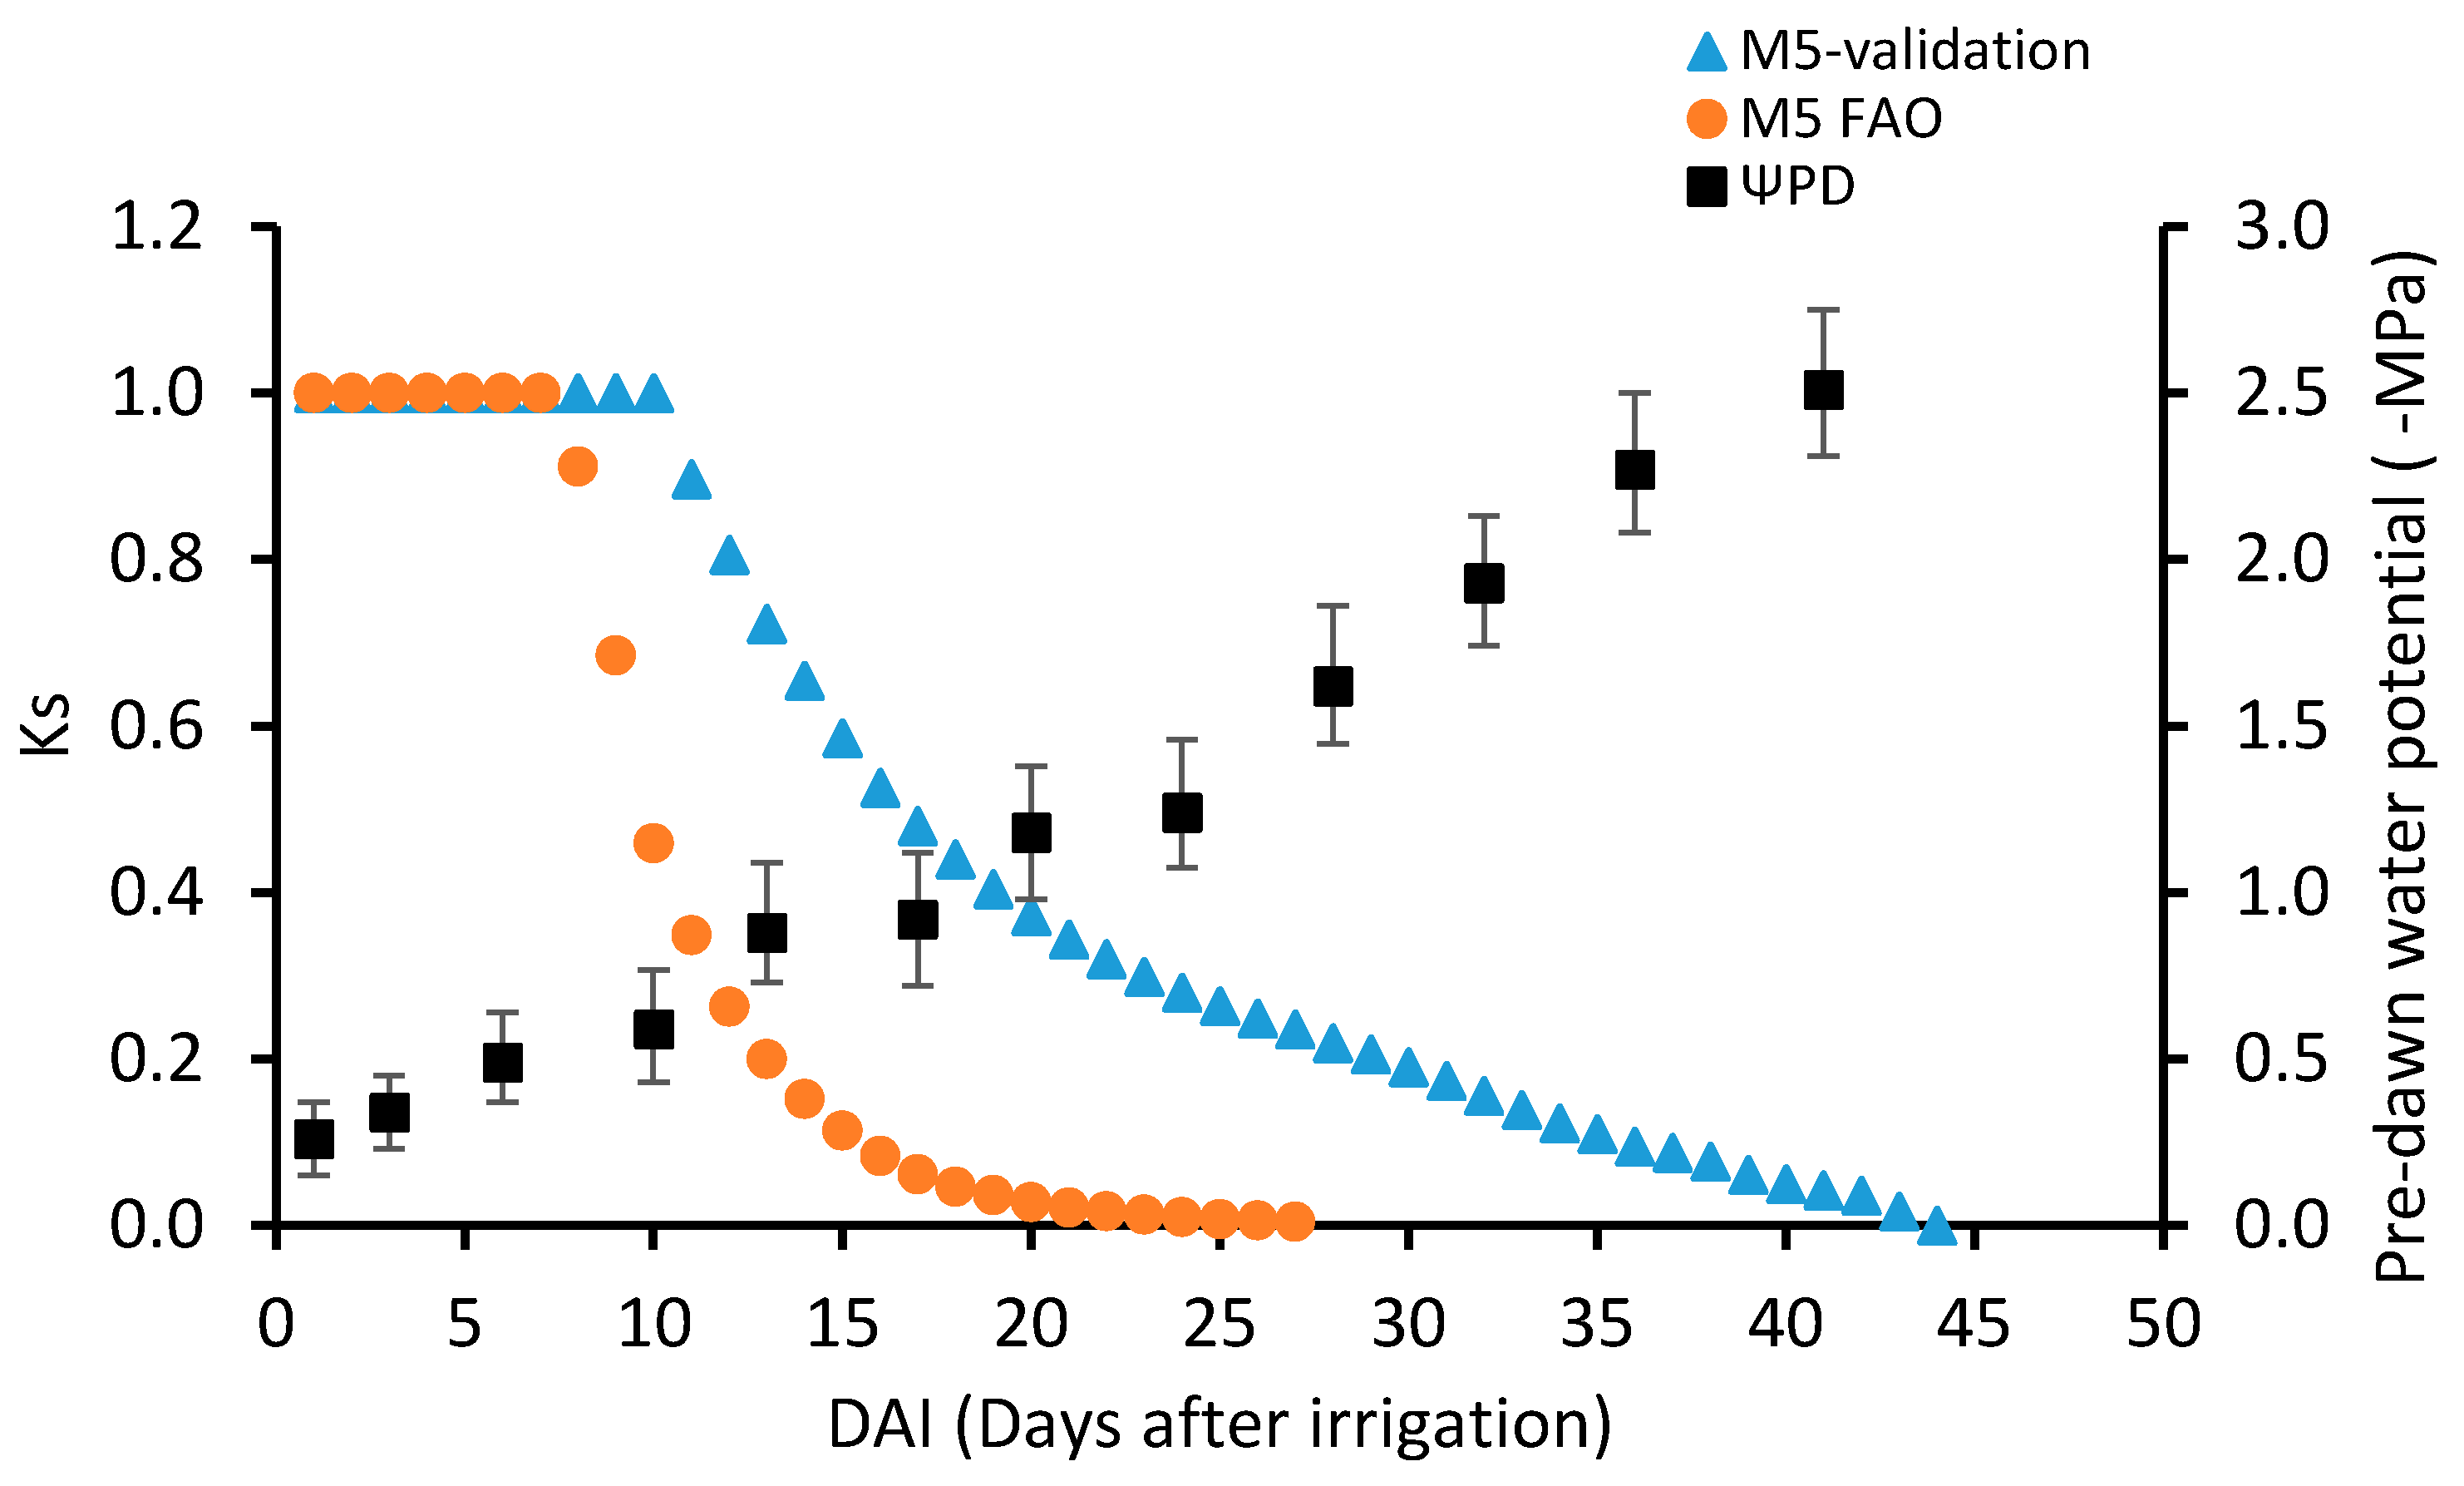
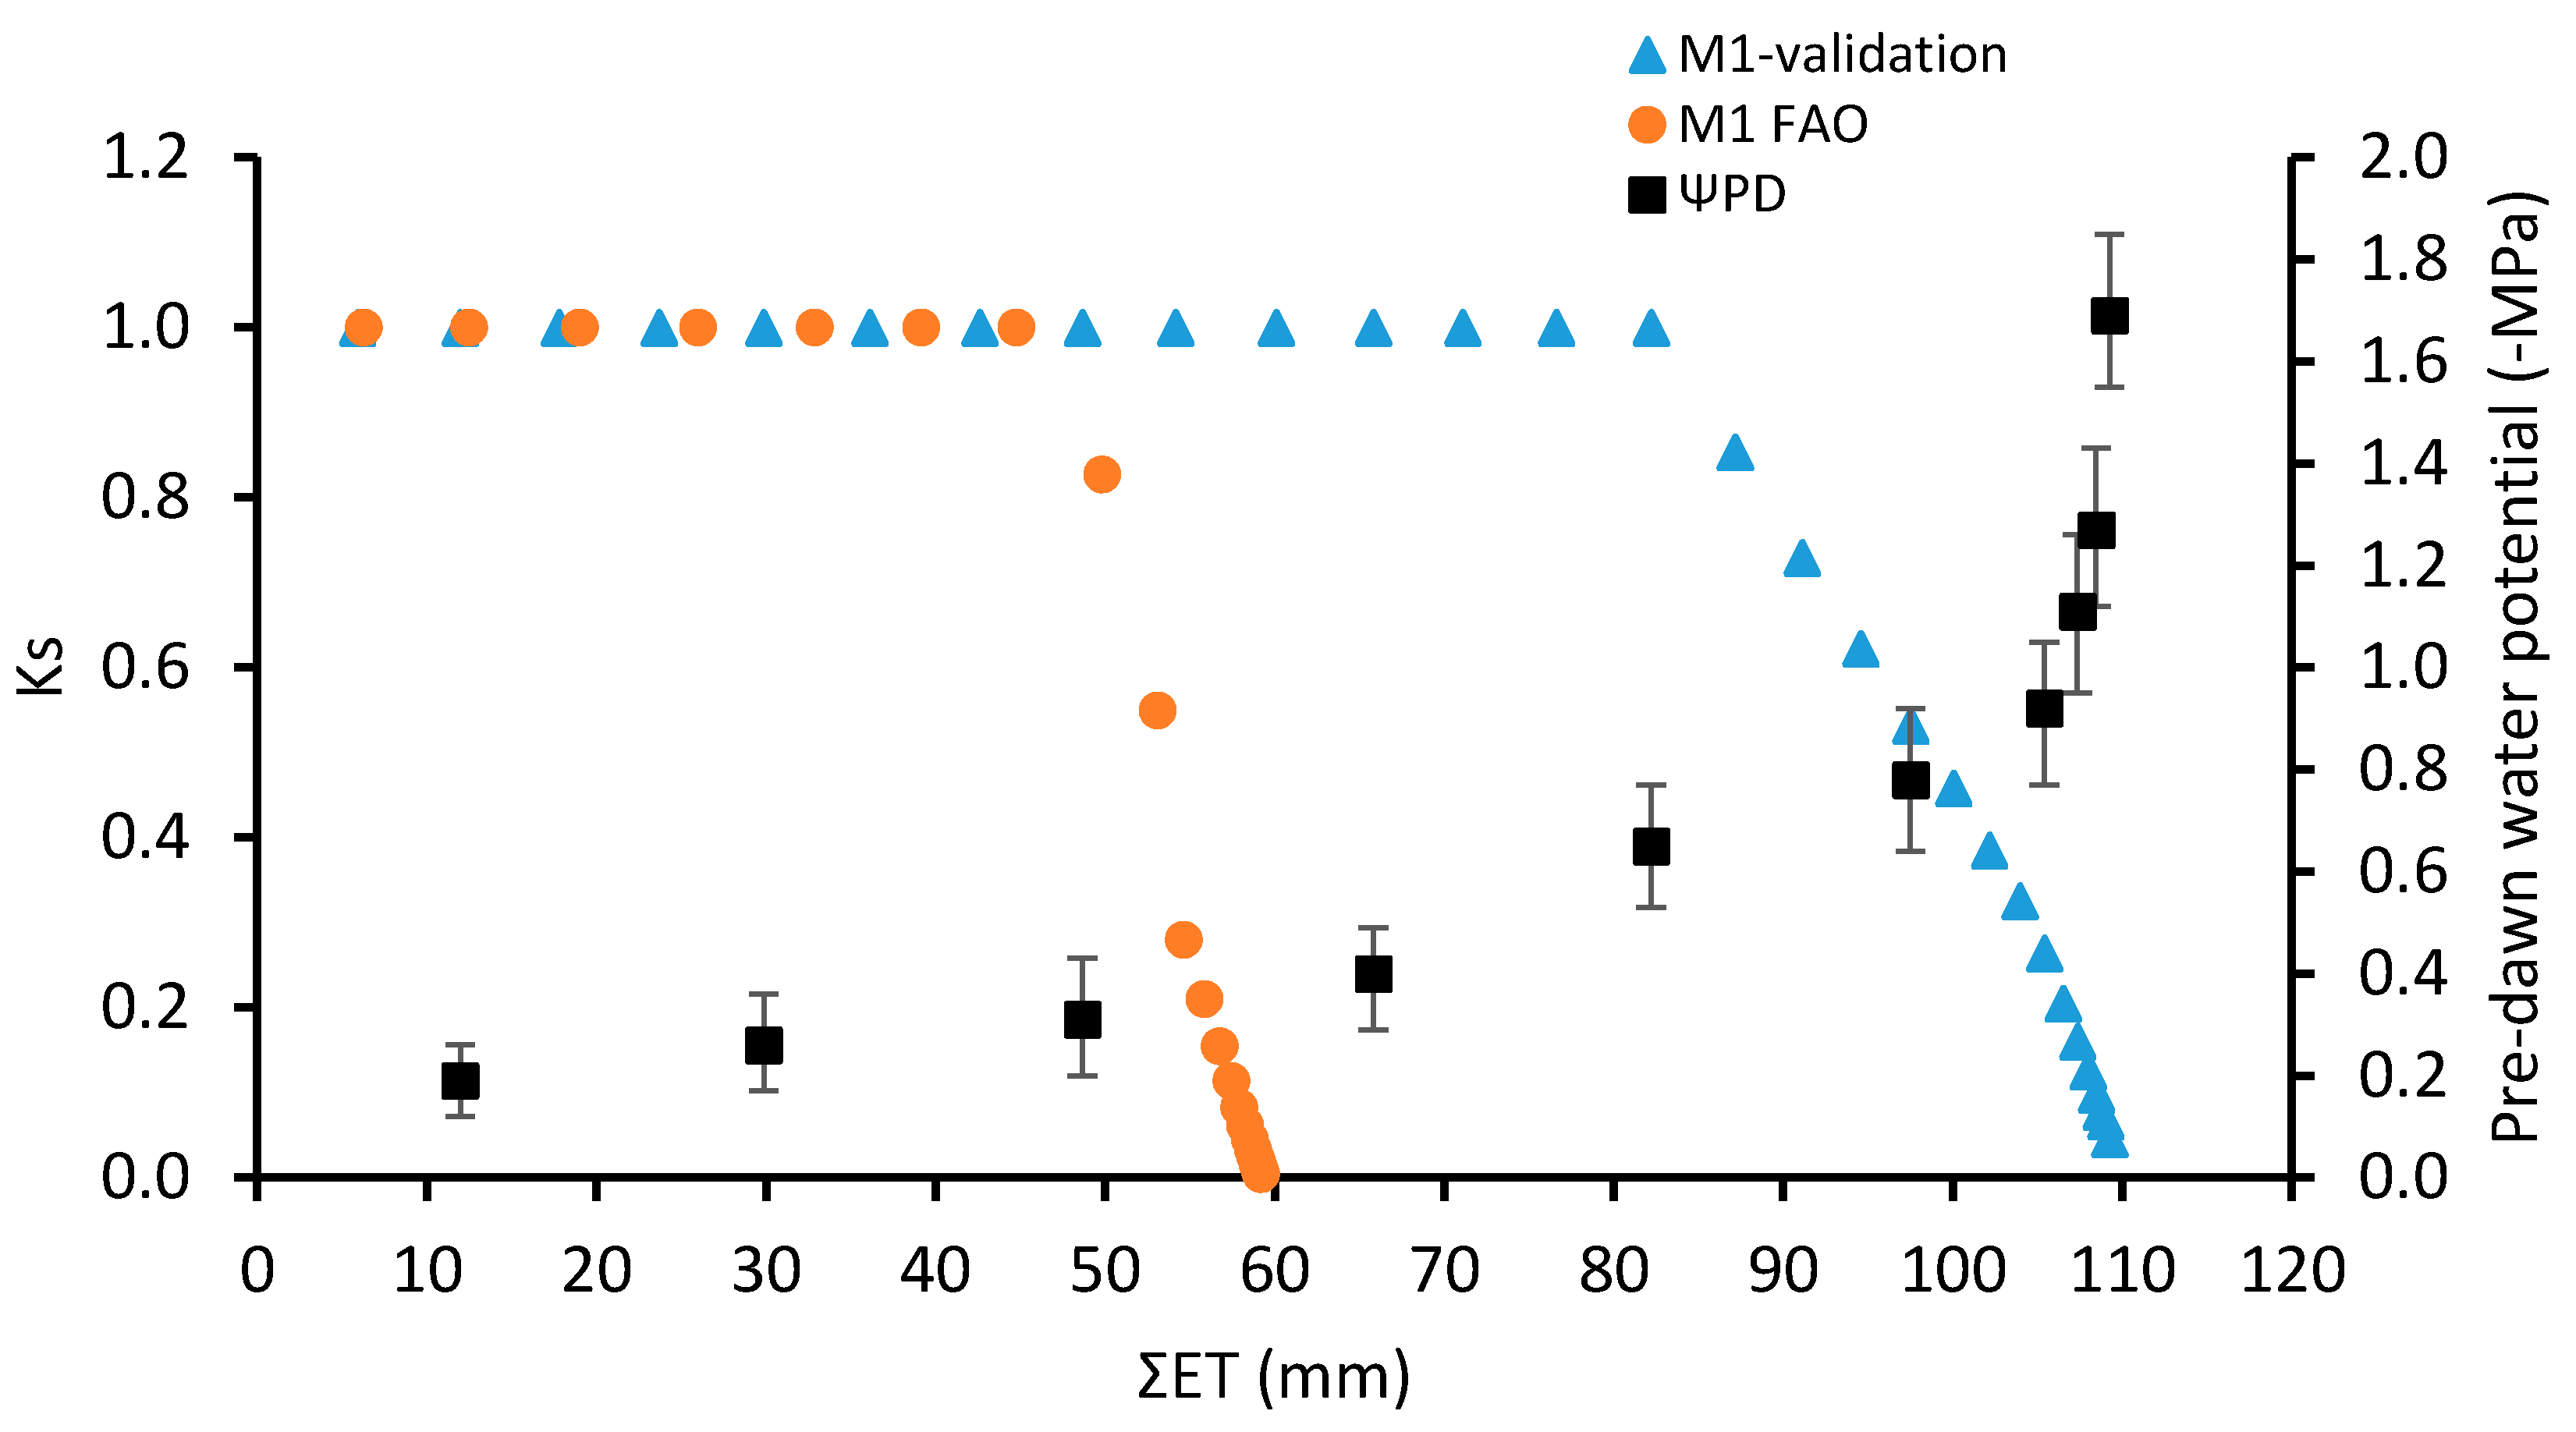
3.1. Comparing Methodologies

The comparative assessment of the two methodologies regarding their ability to accurately predict plant water status revealed significant differences in the two plots examined. In particular, in M5, both methodologies seem to be capable of indicating the onset of drought stress almost simultaneously. Indeed, FAO methodology and the “validation” method determined drought stress induction in plants at about 7 DAI and 10 DAI, respectively. These results are consistent with the concomitant measurements of predawn water potential which ranged from −0.52 MPa to −0.88 MPa. The abovementioned values of predawn water potential are considered as “critical” for the onset of drought stress in olive trees [2], suggesting that both methods could detect water stress occurrence accurately. As far as the prediction “wilting point” is concerned, a considerable discrepancy between the two methodologies was observed (Figure 1).
According to the FAO method the wilting point occurred 27 DAI while in the “validation” method it happened 44 DAI. Taking into consideration that ΨPD values which correspond to moderate stress condition range from −1.18 MPa to −1.62 MPa [2,27], it is obvious that the FAO method seems to be unable to accurately predict the development of severe stress in plants. On the contrary, the relationship between Ks and ΨPD revealed a greater efficacy of “validation” method to coincide with plant water status (Figure 1). As could probably be expected, similar differences between the two methodologies were evident when the amount of water lost as cumulative ET from last irrigation is considered (Figure 2) [34,35]. In fact, there is a gap of 17 mm regarding the onset of water stress between the two methodologies as well as a 45% difference in cumulative ET at “wilting point” (Figure 2).
The analysis of soil water dynamics in M1 site, indicate that the FAO methodology failed to indicate water status in plants not only during severe drought but also at the beginning of drought stress. According to predawn water potential measurements the onset of drought stress occurred 15 DAI. This is consistent with the results of the “validation” method while at that time the FAO method indicated that plants were under severe stress (Figure 3).
Additionally, significant differences between the two methodologies were observed regarding the cumulative ET from last irrigation (Figure 4). In particular, ΣET values which correspond to the onset of water stress and to the “wilting point” were 37.5 mm and 50.06 mm lower, respectively, in the FAO methodology. This discrepancy could be attributed to the differences observed between the two methods concerning the water availability values (RAW and TAW—Table 1). These differences—which are signficantly higher in M1 compared to M5—depicts the different approach used for their estimation. TAW and RAW values used in FAO methodology are derived from an equation and consequently are considerd rather “descriptive”. Thus, they are expected to be less accurate compared to those estimated from validation methdology which incorporates “in situ” realistic continuous data of soil water dynamics.

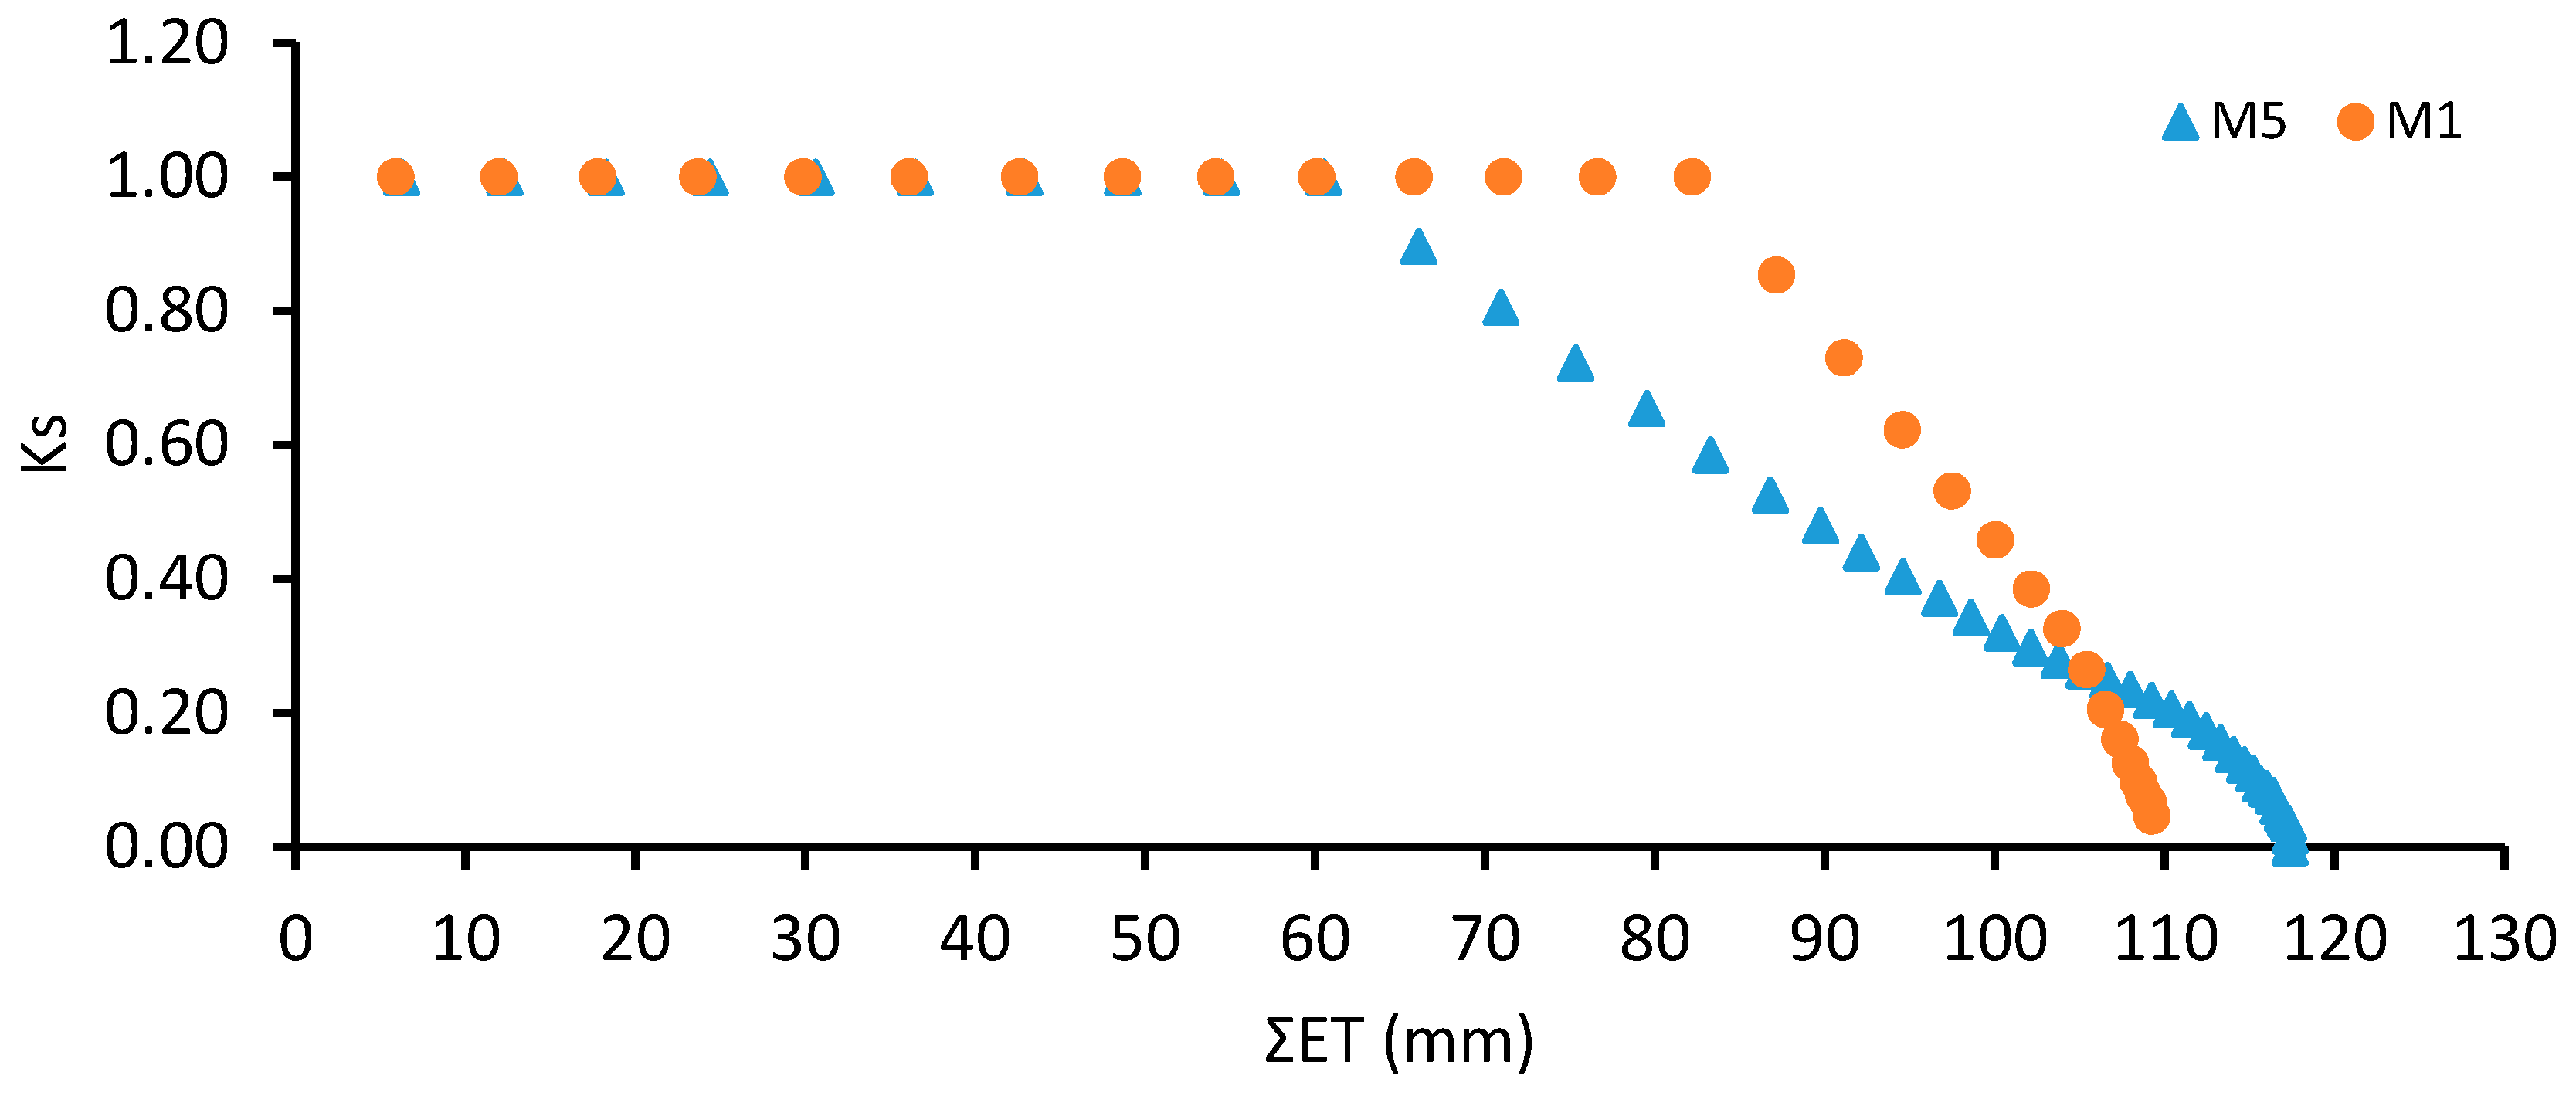
3.2. Comparison between Two Experimental Sites Based οn the Methodological Approach

The performance of the two methodologies gives interesting results when the two sites are compared. According to the FAO methodology, the onset of drought stress as well as the exposure of plants to severe stress occurred almost simultaneously in all plants, irrespective of the area in which they are cultivated (M1 or M5, Figure 5). Taking into consideration the significant differences in plant age, root zone distribution pattern and irrigation systems between the two areas studied, the abovementioned lack of differences in derived parameters raises additional questions regarding the accuracy of the FAO methodology.
On the contrary, the “validation” methodology, depicts a more realistic situation. In particular, drought stress induction in M5 plants occurred with water losses of 60 mm compared to 80 mm in M1 (Figure 6). This difference can be attributed mainly to differences in the tree age which is well known to affect crop response to water deficits, with younger trees being better able to withstand drought conditions [36]. Additionally, the slope of Ks reduction in relation to ΣET was sharper in M1 plants (Figure 7), resulting in lower ΣET values at “wilting point”. Sharper decline in Ks values in response to ΣET in M1 plants indicate lower ability to adapt to drought conditions. A possible explanation of the different adaptation ability could be based on the plants’ root architecture. Indeed, the root absorption dynamics revealed significant differences in root distribution pattern between the two treatments. In particular, M1 plants appeared to have a greater proportion of active root system concentrated near soil surface despite the fact that these plants are drip irrigated (Figure 8). In contrast, M5 plant’s root system appeared to have a deeper orientation (Figure 9). This root zone pattern might enable plants to extract more easily soil water from the deeper soil layers thus better withstanding drought conditions. This ability of deep-rooted plants to extract more soil water from deeper layers could also explain the significant higher values of TAW observed in M5 plant compared to those predicted for the same plants in Table 1. This is in agreement with Moriana et al., [12] who clearly demonstrated that olive trees are capable to extract a significant amount of soil water even under the “conventional permanent wilting point”.

4. Conclusions

The knowledge of the onset and the evolution of water stress is essential in order to design an optimal irrigation scheduling oriented to maximize water use efficiency. When the water stress coefficient Ks is combined with in situ measurements it can be a useful tool for irrigation management. Our data confirm that by using the validation methodology, the calculation of Ks seems to have a more realistic tendency compared to the FAO method, which is inefficient when used to calculate fairly smaller amounts of plant-available water. Significant differences between the two methodologies were also observed when Ks values were correlated with cumulative ET since last irrigation, mainly due to the different amount of TAW. The reliability of the “validation” method is ensured by the in-situ measurement of plant water status.

Author Contributions

Conceptualization, E.K., A.Z. and A.P.; methodology, E.K., A.Z.; data curation, E.K., A.Z.; writing—original draft preparation, E.K., A.Z.; writing—review and editing, E.K., A.Z., A.P.; All authors have read and agreed to the published version of the manuscript.

Funding

This research was funded by the European Union and Greek national funds through the Regional Operational Program “Western Greece 2014-2020” under the Call “Enhancing development and innovation research projects in the field of priority RIS3, AGRODIATROPHY”, project number (MIS): 5040466, entitled “Intelligent Agriculture Services using new technologies to support olive cultivation”.

Conflicts of Interest

The authors declare no conflict of interest.

References

  1. Connor, D.J.; Fereres, E. The Physiology of Adaptation and Yield Expression in Olive. In Horticultural Reviews; Wiley: Hoboken, NJ, USA, 2005; Volume 31, pp. 155–229. [Google Scholar] [CrossRef]
  2. Steduto, P.; Hsiao, T.C.; Fereres, E.; Raes, D. Crop Yield Response to Water; FAO: Rome, Italy, 2012. [Google Scholar]
  3. Chartzoulakis, K.; Psarras, G. Global Change Effects on Crop Photosynthesis and Production in Mediterranean: The Case of Crete, Greece. Agric. Ecosyst. Environ. 2005, 106, 147–157. [Google Scholar] [CrossRef]
  4. Connor, D.J. Adaptation of Olive (Olea Europaea L.) to Water-Limited Environments. Aust. J. Agric. Res. 2005, 56, 1181–1189. [Google Scholar] [CrossRef]
  5. Brito, C.; Dinis, L.T.; Moutinho-Pereira, J.; Correia, C.M. Drought Stress Effects and Olive Tree Acclimation under a Changing Climate. Plants 2019, 8, 232. [Google Scholar] [CrossRef] [Green Version]
  6. Sofo, A.; Manfreda, S.; Dichio, B.; Fiorentino, M.; Xiloyannis, C. The Olive Tree: A Paradigm for Drought Tolerance in Mediterranean Climates. Hydrol. Earth Syst. Sci. Discuss. 2007, 4, 2811–2835. [Google Scholar] [CrossRef] [Green Version]
  7. Bacelar, E.A.; Santos, D.L.; Moutinho-Pereira, J.M.; Lopes, J.I.; Gonçalves, B.C.; Ferreira, T.C.; Correia, C.M. Physiological Behaviour, Oxidative Damage and Antioxidative Protection of Olive Trees Grown under Different Irrigation Regimes. Plant Soil 2007, 292, 1–12. [Google Scholar] [CrossRef]
  8. Moreno, F.; Fernández, J.E.; Clothier, B.E.; Green, S.R. Transpiration and Root Water Uptake by Olive Trees. Plant Soil 1996, 184, 85–96. [Google Scholar] [CrossRef] [Green Version]
  9. Nogués, S.; Baker, N.R. Effects of Drought on Photosynthesis in Mediterranean Plants Grown under Enhanced UV-B Radiation. J. Exp. Bot. 2000, 51, 1309–1317. [Google Scholar] [CrossRef]
  10. Bacelar, E.A.; Moutinho-Pereira, J.M.; Gonçalves, B.C.; Lopes, J.I.; Correia, C.M. Physiological Responses of Different Olive Genotypes to Drought Conditions. Acta Physiol. Plant. 2009, 31, 611–621. [Google Scholar] [CrossRef]
  11. Chartzoulakis, K.; Patakas, A.; Bosabalidis, A.M. Changes in Water Relations, Photosynthesis and Leaf Anatomy Induced by Intermittent Drought in Two Olive Cultivars. Environ. Exp. Bot. 1999, 42, 113–120. [Google Scholar] [CrossRef]
  12. Moriana, A.; Orgaz, F.; Pastor, M.; Fereres, E. Yield Responses of a Mature Olive Orchard to Water Deficits. J. Am. Soc. Hortic. Sci. 2003, 128, 425–431. [Google Scholar] [CrossRef]
  13. Sofo, A. Drought Stress Tolerance and Photoprotection in Two Varieties of Olive Tree. Acta Agric. Scand. Sect. B Soil Plant Sci. 2011, 61, 711–720. [Google Scholar] [CrossRef]
  14. Carr, M.K.V. The Water Relations and Irrigation Requirements of Olive (Olea Europaea L.): A Review. Exp. Agric. 2013, 49, 597–639. [Google Scholar] [CrossRef]
  15. Martín-vertedor, A.I.; Pérez, J.M.; Prieto, H.; Fereres, E. Interactive Responses to Water Deficits and Crop Load in Olive (Olea Europaea L., cv. Morisca) I.—Growth and Water Relations. Agric. Water Manag. 2011, 98, 941–949. [Google Scholar] [CrossRef] [Green Version]
  16. Fernández, J.E.; Moreno, F. Water Use by the Olive Tree. J. Crop Prod. 2000, 2, 101–162. [Google Scholar] [CrossRef]
  17. Hsiao, T.C.; Steduto, P.; Fereres, E. A Systematic and Quantitative Approach to Improve Water Use Efficiency in Agriculture. Irrig. Sci. 2007, 25, 209–231. [Google Scholar] [CrossRef]
  18. Rousseaux, M.C.; Figuerola, P.I.; Correa-Tedesco, G.; Searles, P.S. Seasonal Variations in Sap Flow and Soil Evaporation in an Olive (Olea Europaea L.) Grove under Two Irrigation Regimes in an Arid Region of Argentina. Agric. Water Manag. 2009, 96, 1037–1044. [Google Scholar] [CrossRef]
  19. Fernández, J.E.; Díaz-Espejo, A.; Infante, J.M.; Durán, P.; Palomo, M.J.; Chamorro, V.; Girón, I.F.; Villagarcía, L. Water Relations and Gas Exchange in Olive Trees under Regulated Deficit Irrigation and Partial Root zone Drying. Plant Soil 2006, 284, 273–291. [Google Scholar] [CrossRef]
  20. Allen, R.G.; Pereira, L.S.; Raes, D.; Smith, M. FAO Irrigation and Drainage Paper No. 56—Crop Evapotranspiration; FAO: Rome, Italy, 1998. [Google Scholar]
  21. Afonso do PaÇo, T.; Isabel Ferreira, M.; Arruda Pacheco, C. Scheduling Peach Orchard Irrigation in Water Stress Conditions: Use of Relative Transpiration and Predawn Leaf Water Potential. Fruits 2013, 68, 147–158. [Google Scholar] [CrossRef] [Green Version]
  22. Conceição, N.; Tezza, L.; Häusler, M.; Lourenço, S.; Pacheco, C.A.; Ferreira, M.I. Three Years of Monitoring Evapotranspiration Components and Crop and Stress Coefficients in a Deficit Irrigated Intensive Olive Orchard. Agric. Water Manag. 2017, 191, 138–152. [Google Scholar] [CrossRef]
  23. Ferreira, M.I.; Silvestre, J.; Conceição, N.; Malheiro, A.C. Crop and Stress Coefficients in Rainfed and Deficit Irrigation Vineyards Using Sap Flow Techniques. Irrig. Sci. 2012, 30, 433–447. [Google Scholar] [CrossRef]
  24. Rallo, G.; González-Altozano, P.; Manzano-Juárez, J.; Provenzano, G. Using Field Measurements and FAO-56 Model to Assess the Eco-Physiological Response of Citrus Orchards under Regulated Deficit Irrigation. Agric. Water Manag. 2017, 180, 136–147. [Google Scholar] [CrossRef]
  25. Rallo, G.; Baiamonte, G.; Manzano Juárez, J.; Provenzano, G. Improvement of FAO-56 Model to Estimate Transpiration Fluxes of Drought Tolerant Crops under Soil Water Deficit: Application for Olive Groves. J. Irrig. Drain. Eng. 2014, 140. [Google Scholar] [CrossRef] [Green Version]
  26. Pellegrino, A.; Gozé, E.; Lebon, E.; Wery, J. A Model-Based Diagnosis Tool to Evaluate the Water Stress Experienced by Grapevine in Field Sites. Eur. J. Agron. 2006, 25, 49–59. [Google Scholar] [CrossRef]
  27. Gucci, R.; Lodolini, E.; Rapoport, H.F. Productivity of Olive Trees with Different Water Status and Crop Load. J. Hortic. Sci. Biotechnol. 2007, 82, 648–656. [Google Scholar] [CrossRef]
  28. Wang, Q.; Huo, Z.; Feng, S.; Yuan, C.; Wang, J. Comparison of Spring Maize Root Water Uptake Models Under Water and Salinity Stress Validated with Field Experiment Data. Irrig. Drain. 2015, 64, 669–682. [Google Scholar] [CrossRef]
  29. Jones, H.G. Monitoring Plant and Soil Water Status: Established and Novel Methods Revisited and Their Relevance to Studies of Drought Tolerance. J. Exp. Bot. 2007, 58, 119–130. [Google Scholar] [CrossRef] [PubMed] [Green Version]
  30. Xiloyannis, C.; Montanaro, G.; Dichio, B. Irrigation in Mediterranean Fruit Tree Orchards. In Irrigation Systems and Practices in Challenging Environments; Lee, T.S., Ed.; InTech: London, UK, 2012. [Google Scholar]
  31. Patakas, A.; Noitsakis, B.; Chouzouri, A. Optimization of Irrigation Water Use in Grapevines Using the Relationship between Transpiration and Plant Water Status. Agric. Ecosyst. Environ. 2005, 106, 253–259. [Google Scholar] [CrossRef]
  32. Blanco-Cipollone, F.; Lourenço, S.; Silvestre, J.; Conceição, N.; Moñino, M.J.; Vivas, A.; Ferreira, M.I. Plant Water Status Indicators for Irrigation Scheduling Associated with Iso-and Anisohydric Behavior: Vine and Plum Trees. Horticulturae 2017, 3, 47. [Google Scholar] [CrossRef]
  33. Hsiao, T.C. Plant Responses to Water Stress. Annu. Rev. Plant Physiol. 1973, 24, 519–570. [Google Scholar] [CrossRef]
  34. Ferreira, M.I.; Valancogne, C. Experimental Study of a Stress Coefficient: Application on a Simple Model for Irrigation Scheduling and Daily Evapotranspiration Estimation. IFAC Proc. Vol. 1997, 30, 33–38. [Google Scholar] [CrossRef]
  35. Ferreira, M.I. Stress Coefficients for Soil Water Balance Combined with Water Stress Indicators for Irrigation Scheduling of Woody Crops. Horticulturae 2017, 3, 38. [Google Scholar] [CrossRef] [Green Version]
  36. Gargouri, K.; Bentaher, H.; Rhouma, A. A Novel Method to Assess Drought Stress of Olive Tree. Agron. Sustain. Dev. 2012, 32, 735–745. [Google Scholar] [CrossRef] [Green Version]
Figure 1. Comparison of stress coefficient Ks calculated with both methodologies in the M5 olive orchard.
Agronomy 10 01594 g001
Figure 2. Comparison of Ks in the M5 orchard correlated with the amount of water lost via evapotranspiration in the stress cycle.
Agronomy 10 01594 g002
Figure 3. Comparison of stress coefficient Ks calculated with both methodologies in the M1 olive orchard.
Figure 4. Comparison of Ks in M1 orchard correlated with the amount of water lost via evapotranspiration in the stress cycle.
Agronomy 10 01594 g004
Figure 5. Comparison of stress coefficient Ks in the two orchards calculated with the FAO method correlated with days after irrigation.
Agronomy 10 01594 g005
Figure 6. Comparison of stress coefficient in the two orchards calculated with the “validation” method during stress cycle.
Agronomy 10 01594 g006
Figure 7. Comparison of stress coefficient in the two orchards calculated with the “validation” method from the onset of water stress (Ks < 1).
Agronomy 10 01594 g007
Figure 8. Root absorption dynamics at the M1 experimental site.
Agronomy 10 01594 g008
Figure 9. Root absorption dynamics at the M5 experimental site.
Agronomy 10 01594 g009
Table 1. Values of variables used in each methodology.
Original FAO Method“Validation“ Method
VariablesM1M5M1M5
Soil water at FC (m3/m3)0.420.350.450.31
Soil water at PWP (m3/m3)0.290.240.230.17
Threshold value (θ*) (m3/m3)--0.300.22
Depletion factor, p0.650.61--
Total available water (TAW)63.067.811084.0
Readily available water (RAW)40.941.775.054.0
Maximum rooting depth (m)0.500.600.500.60
Publisher’s Note: MDPI stays neutral with regard to jurisdictional claims in published maps and institutional affiliations.

