Article

10-Years Studies of the Soil Physical Condition after One-Time Biochar Application

1
Institute of Soil Science, Environment Engineering and Management, University of Life Sciences, Leszczyńskiego 7, 20-069 Lublin, Poland
2
Department of Herbology and Plant Cultivation Techniques, University of Life Sciences in Lublin, Akademicka 13, 20-950 Lublin, Poland
*
Author to whom correspondence should be addressed.
Agronomy 2020, 10(10), 1589; https://doi.org/10.3390/agronomy10101589
Submission received: 17 September 2020 / Revised: 8 October 2020 / Accepted: 13 October 2020 / Published: 16 October 2020
(This article belongs to the Special Issue Impact of Biochar and Compost on Soil Quality and Crop Yield)

Abstract

:
The ten-year experiment on the soil physical properties of biochar-amended Podzol was studied. Biochar was applied to the soil in the following rates: treatment BC10—10 Mg × ha−1, treatment BC20—20 Mg × ha−1, treatment BC30—30 Mg × ha−1 and treatment BC0—Control (soil without the addition of biochar). Biochar was mixed the soil arable layer (0–20 cm). Soil samples were collected ten times, once a year—after harvest rye. They were taken from layers: 0–10 cm and 10–20 cm, in six replicates, using 100 cm3 metal cylinders. The soil physical properties were determined: particle size distribution, particle density, bulk density, total porosity, air capacity and permeability (at −15.5 kPa), water content at sampling, field water capacity (at −15.5 kPa), available and unavailable water content, and the ratio of field water capacity and total porosity was calculated. It was found that biochar application causes changes in the soil physical condition. The soil density decreased, while the porosity, aeration and water retention increased; the ratio of field water capacity and total porosity was favorable. These changes cannot be considered as permanent. Most of the analyzed properties showed a durability of no more than 3–4 years. We found that biochar incorporation into soil is a good method for environmental management of waste biomass.

1. Introduction

The data on global soil resources show the continuous increase in the area of degraded soils [1,2,3,4]. Therefore, an important element in management of soils is to prevent their degradation. Taking preventive actions is considered to be a better approach than the subsequent implementation of soil remediation measures [5,6,7,8,9]. Soil is an irreplaceable element of the environment and it is subjected to the pressure of various degrading factors. Excessively compacted soils occur commonly. The studies by some authors, e.g., Jones [10], McQueen and Shepherd [11], Drewry et al. [12], Reynolds et al. [13,14], and Pranagal [15], indicate that high soil compaction may limit the growth of crop plants.
Soil is a complex medium that undergoes dynamic changes both in time and on its surface [16,17,18,19,20]. The properties of soil can be modified by incorporating diverse mineral and/or organic materials into it [6,7,15,21,22,23,24]. Waste materials originating from different industries, including agriculture, are used very frequently for this purpose. According to many authors, application of organic wastes to soil inhibits soil degradation, improves soil quality, and has a beneficial impact in the context of safe food. However, these authors also admit that most organic wastes decompose quickly and their next applications are required [8,9,21,22,25]. Management of waste by its application to soil allows two objectives to be achieved: (i) to dispose of waste, and (ii) to improve soil properties [6,8,9,15,21,22,25,26,27].
An interesting method for disposal of waste biomass is to convert it into biochar under pyrolysis conditions. The interest in application of biochar as an environmentally friendly material is growing. A number of environmental benefits arising from the use of biochar are mentioned, e.g.,: (i) soil remediation [7,8,15,28,29]; (ii) increased soil carbon sequestration [29,30,31]; (iii) enhanced soil productivity [27,30,31]; (iv) neutralization of soil acidity [32,33,34]; (v) wastewater treatment [35,36]; (vi) cleaning of air [30,37]; and (vii) reduction in greenhouse gas emissions [27,30,32,38]. The use of biochar is also considered to be an element of sustainable agricultural practice [27,30,31]. Biochar exhibits very good sorption properties and is also resistant to the action of chemicals and biochemical degradation [27,30,39]. Hence, the properties of biochar allow it to be used for soil phytostabilization [40,41].
An important aspect of biochar addition to soil is a change in its physical properties. The soil physical condition (e.g., compaction, air-water properties, distribution and openness of soil pores) plays an essential role in soil functioning. It determines conditions in which chemical reactions and biochemical and microbiological transformations take place as well as the availability of nutrients to plants [8,9,23,24]. Existing research regarding the effect of biochar application on soil physical properties has found that the addition of biochar most frequently resulted in: (i) reduced soil compaction—A decrease in bulk density and an increase in total porosity; (ii) an increase in available water content; and (iii) an increase in soil water-stable aggregates content [5,8,9,42,43,44,45,46].
The EU legal regulations [47] require: (i) disposal of waste at landfills to be avoided, and (ii) the amount of waste designated for recycling to increase. It is also an important fact that the amount of farmyard manure produced in Poland has decreased in recent years [48]. Such a situation forces us to seek other sources of organic fertilizers. Meeting the environmental safety requirements is also a condition for using waste for agricultural purposes [6,30,49,50].
An example of environment-oriented measures is the presented study which combines two environmental objectives: (i) to reduce the amount of waste disposed of at landfills, and (ii) to improve soil properties. This study was conducted as a multi-year field experiment in which biochar produced from waste winter wheat straw was used. The biochar was applied to a sandy soil—Podzol (PZ) [51]—at rates of 10, 20, and 30 Mg × ha−1, respectively. The aim of this research was to carry out 10-year measurements of changes in the soil physical condition resulting from one-time biochar application. The study results were used to verify a hypothesis that one-time biochar amendment contributes to an improvement in soil physical properties and that resultant changes in soil properties are persistent.

2. Materials and Methods

2.1. Study Area, Field Experiment and Sampling

This study was located in eastern Poland and was carried out at the Agricultural Experimental Farm in Bezek—51°12′ N; 23°17′ E. The study area is situated in the transitional temperate cool climate (Dfb), with a substantial influence of continental climate (https://pl.climate-data.org/info/sources). In the analyzed period (2010–2019), the average annual precipitation was 541.4 mm. The average temperature of the warmest month (July) over the fallow period was +18.1 °C, whereas the temperature of the coldest month (January) was −3.2 °C. The length of the growing period in the study area in question, which most frequently starts in the second or third 10 days of March and usually lasts until the end of October, is 210–215 days on average.
A ten-year (2010–2019) study was conducted on the physical properties of Podzol [51] originating from glaciofluvial fine-grained loamy sand (LS). The particle size distribution [52] of the arable layer of this soil is presented in the paper Pranagal et al. [8]. Total organic carbon content TOC = 5.3 g × kg−1; pHKCl = 4.9; CaCO3 trace amounts. In the field experiment biochar produced from waste biomass—winter wheat straw—was used. It was produced through pyrolysis conducted at a very low oxygen level (1–2%) and at a maximum combustion temperature of 650 °C. The characteristics of the biochar used in the research are presented in the paper Pranagal et al. [8].
The field experiment was set up in the second 10 days of August 2010 in a field where winter rye (Secale cereale L., cv. “Dańkowskie Diament”) was grown in monoculture. Monoculture cropping of winter rye continued for another 10 years (2010–2019). The maintenance of monoculture was intended to facilitate interpretation of results of determinations of soil physical properties. In this way, additional factors were avoided, which would have affected the soil physical condition, e.g., different agronomic practices and/or the effects of the root systems of crop plants. The experiment was set up in a randomized block design in three replicates. The area of each single plot was 18 m2. The spacing between plots fertilized with the different rates of biochar was 2 m. The biochar was applied according to the following experimental design: treatment BC10—10 Mg × ha−1; treatment BC20—20 Mg × ha−1; and treatment BC30—30 Mg × ha−1. No biochar was applied to the soil in one of the treatments and this was the control treatment (BC0). The biochar was initially spread over the soil surface, and subsequently ploughing was done at a depth of about 20 cm in order to mix it with the soil. Then, the soil surface was leveled with a power harrow. In the third 10 days of September, winter rye was sown using a cultivating seed drill. Winter rye was sown every year in the third 10-day period of September. Mineral fertilizers were applied every year of the experiment at the following rates: 70 kg ha−1 N (ammonium nitrate), 26 kg ha−1 P (triple superphosphate), 66 kg ha−1 K (muriate of potash, KCl). Phosphorus and potassium fertilizers as well as 20 kg ha−1 N were applied before sowing. In spring, the remaining portion of the nitrogen (N) rate was applied before plant growth began (30 kg ha−1) and at the stem elongation stage (20 kg ha−1).
Undisturbed soil samples were collected once during every growing season—after harvest of rye in the first 10 days of August (sampling dates: I, II, III, … IX). In order to determine the initial condition of the soil, samples were taken before biochar application—sampling date 0 (2010). Soil samples were collected from the layers of 0–10 cm and 10–20 cm to 100 cm3 metal cylinders in six replicates.

2.2. Analyses

Physical soil properties, such as particle size distribution (PSD), particle density (PD), bulk density (BD), total porosity (TP), air capacity (at −15.5 kPa) (FAC), air permeability (at −15.5 kPa) (FAP), water content at sampling (SM), field water capacity (FC), available water content (AWC), unavailable water content—permanent wilting point (UWC) and FC/TP ratio were studied. Soil water retention curve was determined with the use of a pressure plate apparatus (Soil-moisture Equipment Corp., Santa Barbara, California, USA). The level of field soil saturation with water was calculated for soil moisture level at a potential value of −15.5 kPa and permanent wilting point (UWC) of −1550.0 kPa. The content of organic carbon (TOC) was measured with the use of a Shimadzu TOC-VCSH analyzer with an SSM-5000A adapter for solid sample combustion.
The soil physical properties were determined according to the following procedures:
-
soil texture—particle size distributions (PSD)—with Casagrande method modified by Prószyński [53],
-
particle density (PD)—with the pycnometric method [54] (Mg × m−3),
-
bulk density (BD)—with the gravimetric method, from the ratio of the mass of soil dried at 105 °C to the initial soil volume of 100 cm3 [55] (Mg × m−3),
-
total porosity (TP) was calculated from the results of particle density (PD) and bulk density (BD), TP = 1 − BD/PD [56] (m3 × m−3),
-
air capacity at the potential of −15.5 kPa (FAC) was derived from the results of total porosity (TP) and field water capacity (FC) (−15.5 kPa), FAC = TP−FC [56] (m3 × m−3),
-
air permeability at the potential of −15.5 kPa (FAP) was measured using an apparatus for the measurement of permeability of molding sand, LPiR-2e [7,8,9]. The measurements were conducted at vertical (upward) airflow through the soil sample. The pressure head in the measurement chamber was 0.981 kPa (100 mm H2O), and the ambient temperature was stabilized (20 ± 1.0 °C). The relative air humidity was 40 ± 5%. The dynamic air viscosity (10−8 × m2 × Pa−1 × s−1) was not taken into account in the measurement results. The apparatus was produced by MULTISERW-Morek (Poland),
-
water content at sampling (SM) was calculated from the ratio of the mass of water contained in the soil during the sampling to the dry matter of soil dried at 105 °C [57] (kg × kg−1),
-
field water capacity (FC) was calculated from the ratio of the volume of water contained in the soil at the potential of −15.5 kPa to the soil volume [58,59] (m3 × m−3),
-
available water content (AWC) was obtained from FC (−15.5 kPa) and unavailable water content (−1550.0 kPa)—permanent wilting point (UWC), AWC = FC−UWC [59,60] (m3 × m−3),
-
unavailable water content (UWC) was calculated from the ratio of the volume of water contained in the soil at the potential of −1550.0 kPa to the soil volume [58,59] (m3 × m−3).
Air-water relations of the soil were analyzed by determining the values of FC/TP ratio [14,60,61].

2.3. Statistical Analysis

The results were statistically evaluated with analysis of variance (ANOVA). All pairs of means between treatments were compared with the Tukey’s test and the lowest significant difference test (LSD). The analysis (two-way ANOVA—biochar application rate (BC0, BC10, BC20, BC30) × soil layer and one-way ANOVA—soil from treatments BC0, BC10, BC20, BC30 and sampling dates 0-IX—Table 1) was performed for the results concerning the soil from the layer 0–10 cm, 10–20 cm (Table 2) and 0–20 cm (Table 3). In that manner mean values for each soil property under analysis were compared. The statistical evaluations (ANOVA—LSD) were conducted assuming the significance level of α = 0.05. Statistica 11 by Statsoft and ARSTAT by University of Life Sciences in Lublin were used to statistical analyses.

3. Results and Discussion

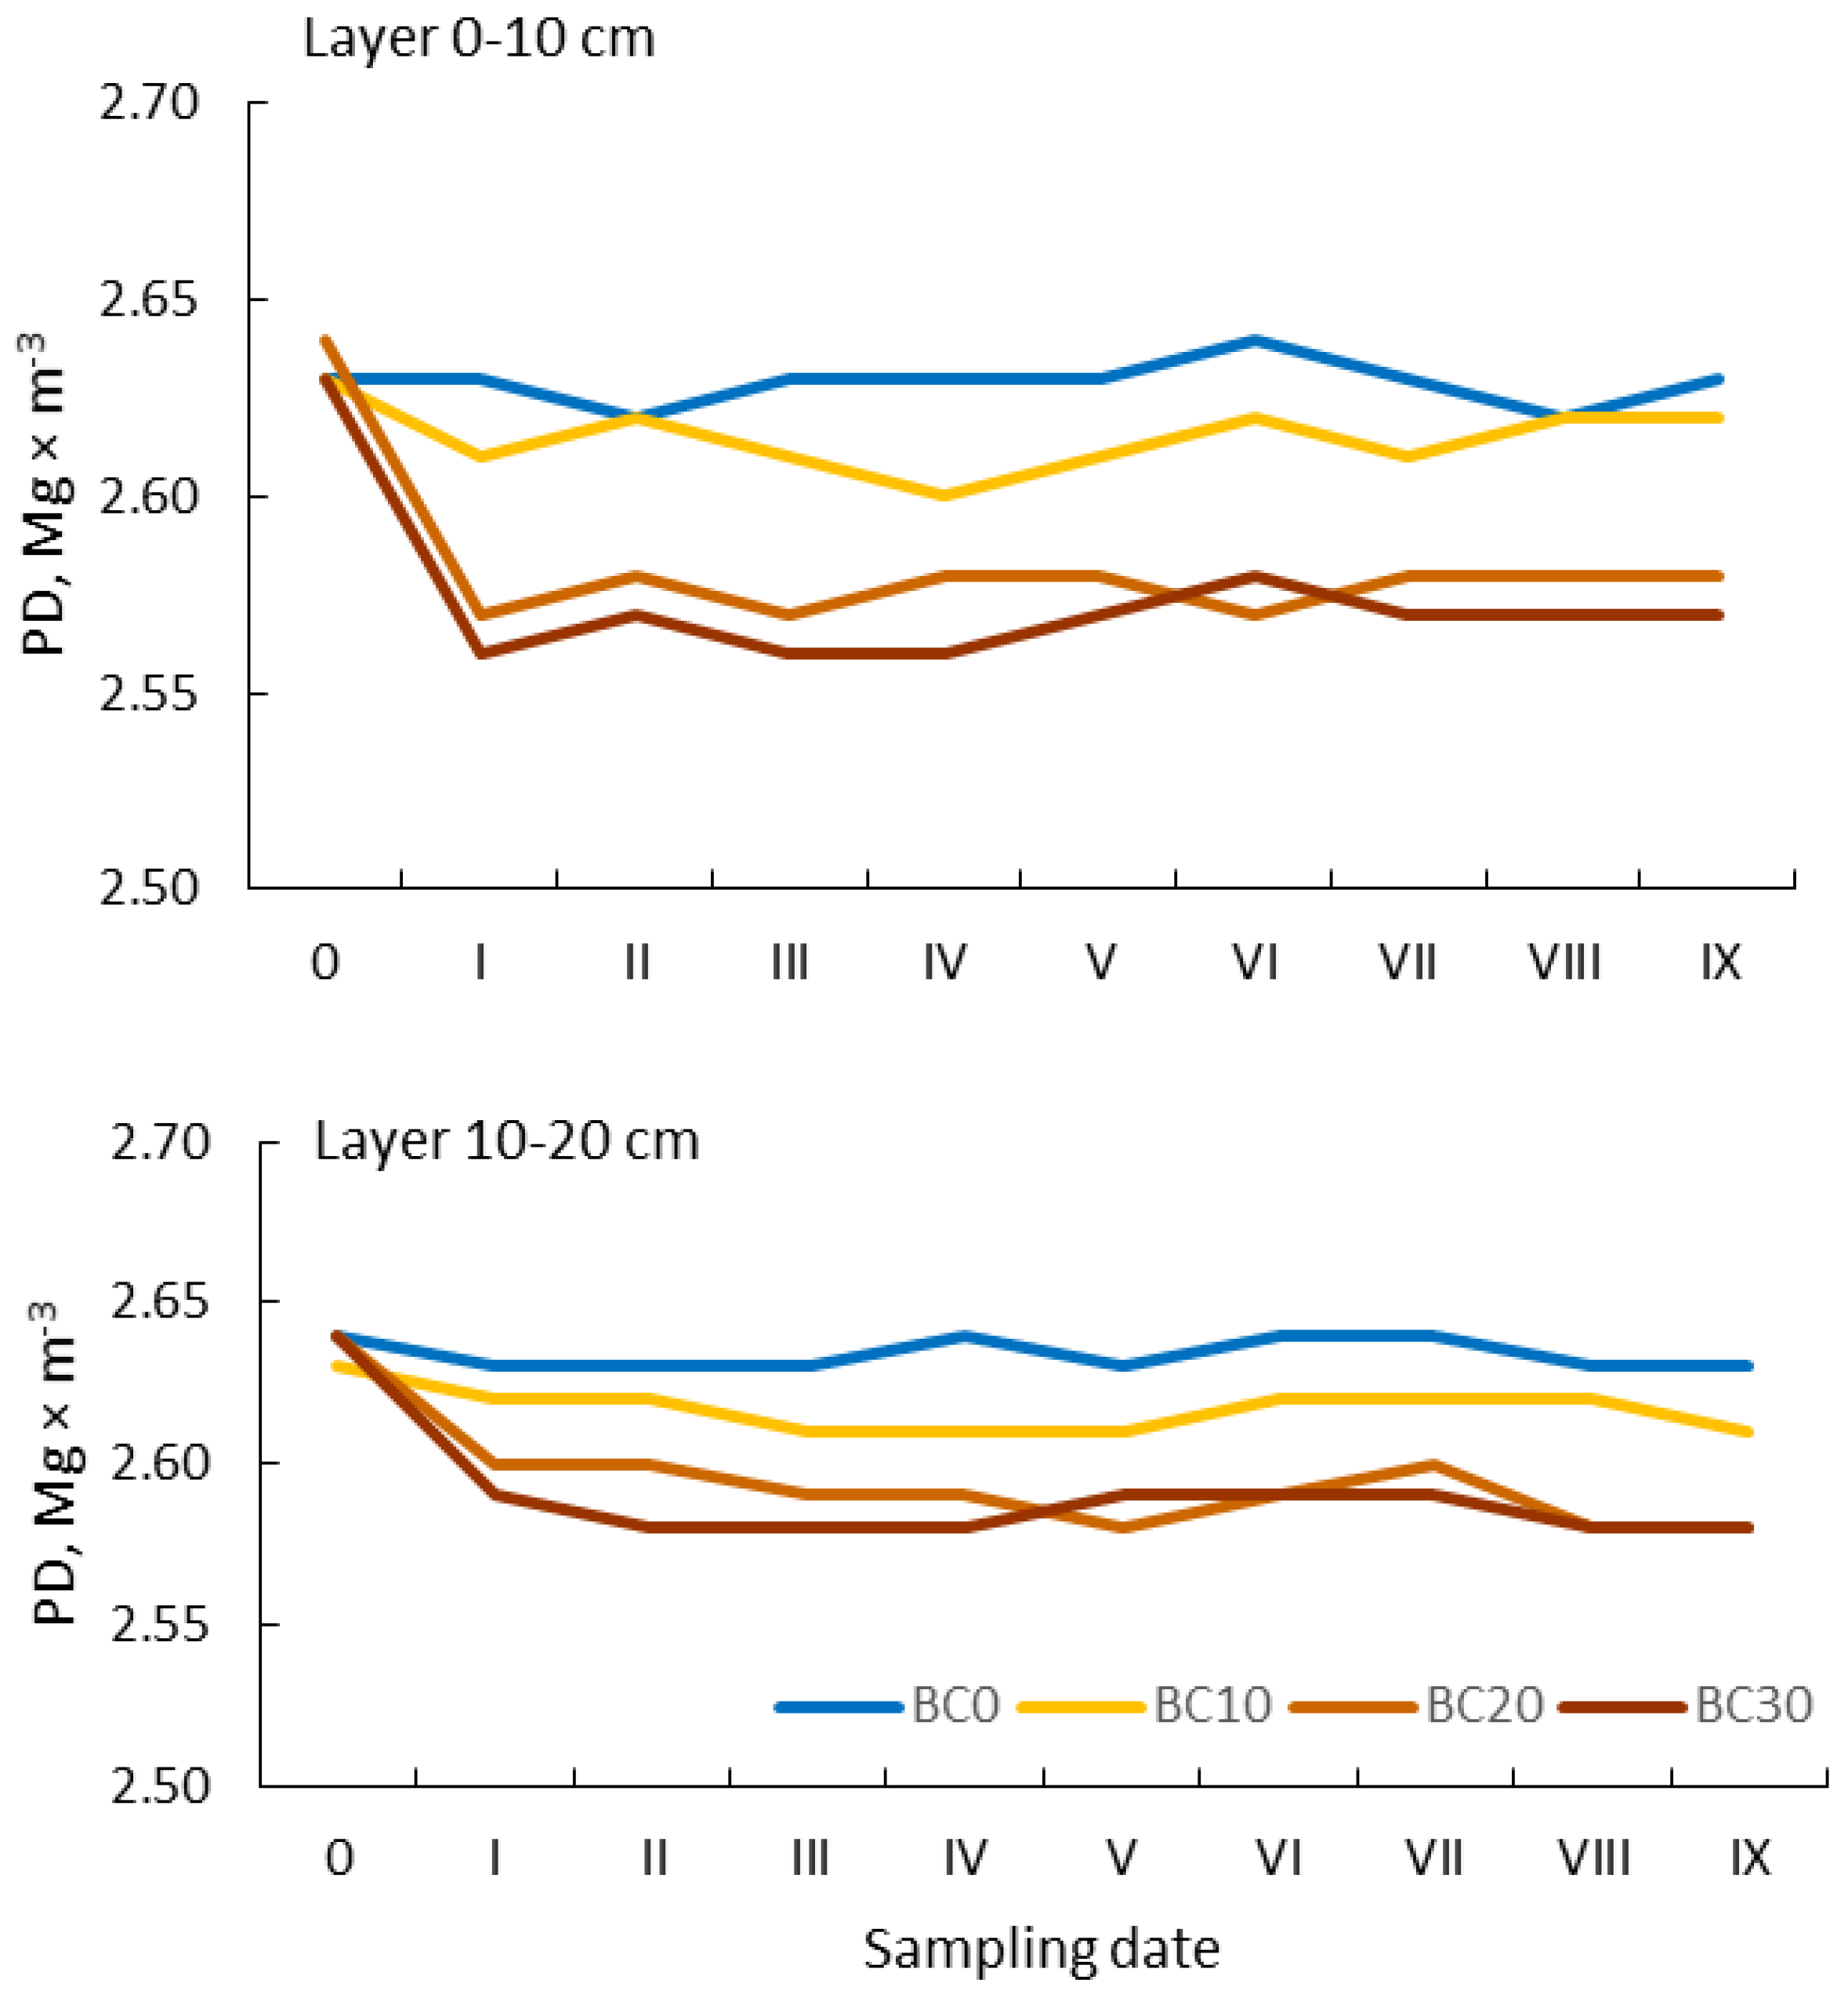
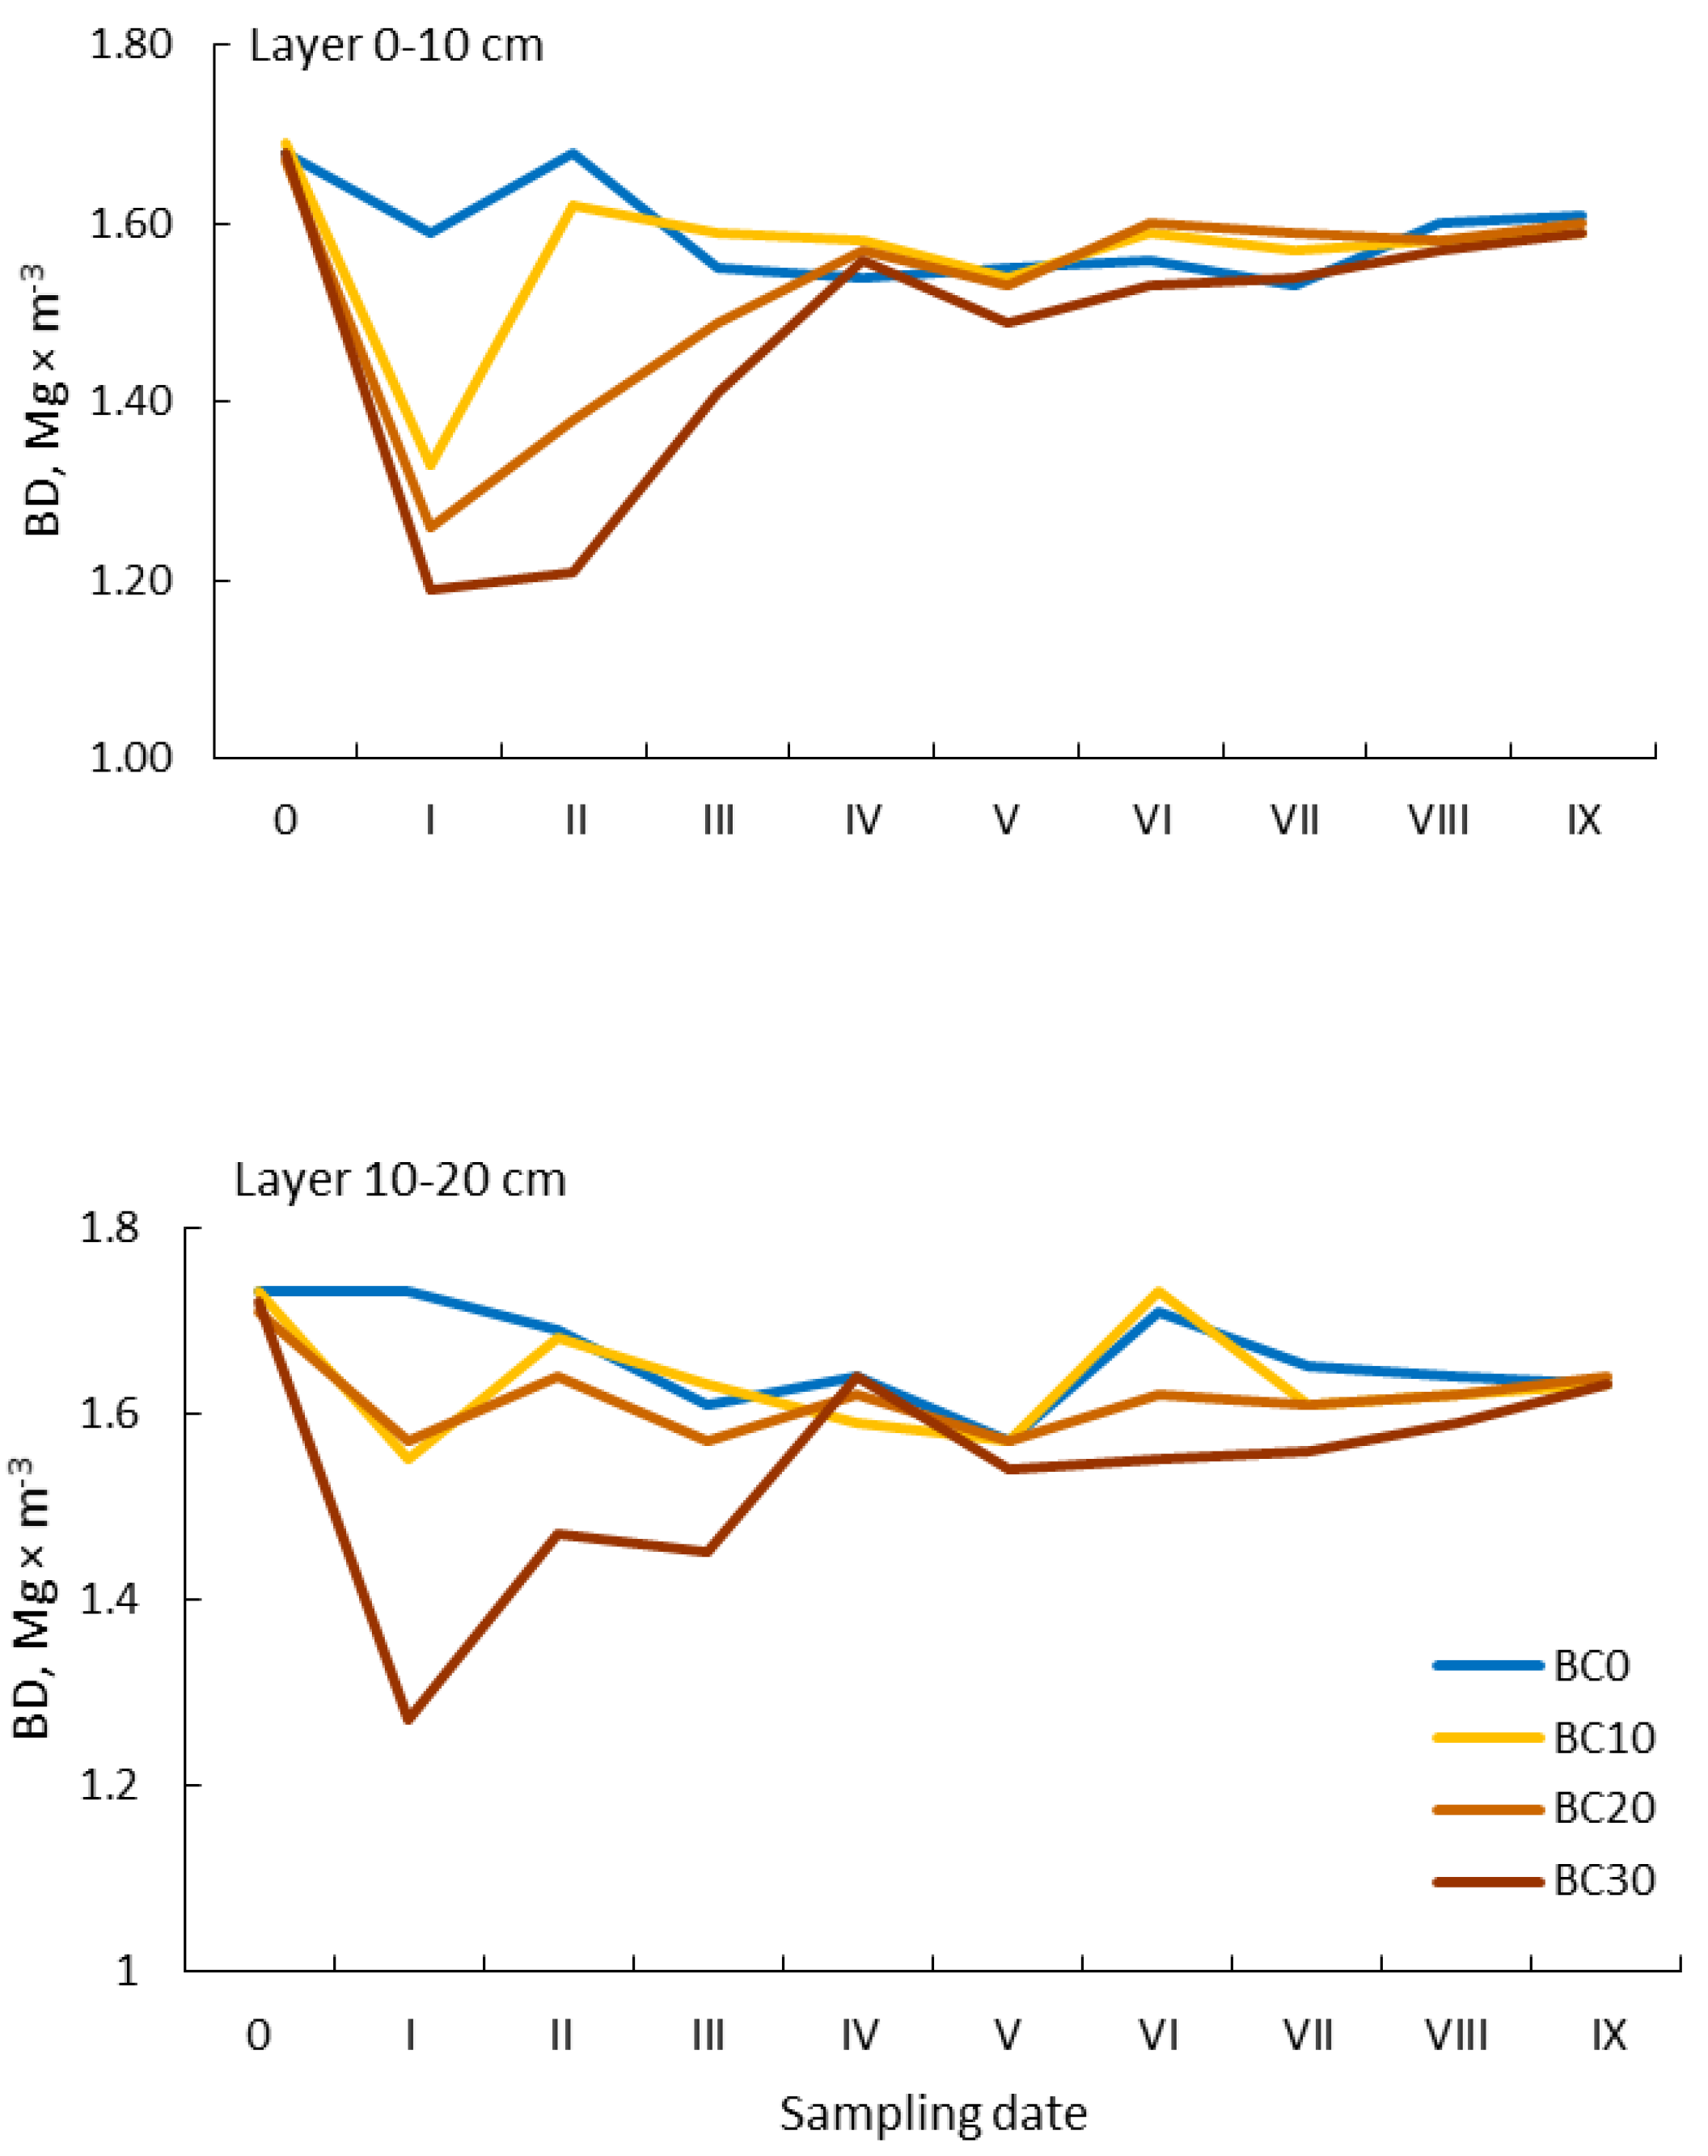
3.1. Soil Texture (PSD) and Density (PD and BD)

As a basic characteristic, soil texture (PSD) is considered to be very stable. Significant changes in soil particle size distribution occur very rarely. The studied soil was also characterized by stable PSD. The biochar incorporated into it at different rates (BC10, BC20, and BC30) did not cause any changes in soil texture. In the case of application of the higher biochar rates (BC20 and BC30), only minor changes, of about ±0.5%, in the content of the silt and clay fraction were recorded. Throughout the entire measurement period (2010–2019), the studied soil was classified as loamy sand (SL). As shown in the studies by Blott and Pye [53], Mikheeva [62] as well as Carter and Bentley [63], ±0.5% differences in PSD do not cause significant changes in soil functioning. Such changes can only marginally affect, e.g., soil compaction or/and air-water properties. The authors of some papers [5,7,8] have stressed that high rates of different soil-applied materials, both mineral and organic ones, result in a significant change in particle size distribution. The soil texture is then restructured towards the one that is determined by the type of the material applied to the soil [15,24,42].
Similarly to particle size distribution (PSD), particle density (PD) is a trait characterized by substantial stability [24,25,43,54]. In the present study, PD varied slightly from 2.56 Mg × m−3 (BC30; layer 0–10 cm; sampling date I) to 2.64 Mg × m−3 (BC0; layer 10–20 cm; sampling date 0) (Figure 1). Particle density of soil without biochar ranged from 2.62 Mg × m−3 to 2.64 Mg × m−3. PD in the 0–10 cm layer was higher than in the deeper layer of 10–20 cm almost in every case. Biochar application caused a distinct decrease in PD, which was proportional to the rate applied. The differences in PD results that were found immediately after biochar incorporation into the soil (sampling date I) between treatment BC0 and treatments BC10, BC20, and BC30 remained at a similar level until the end of the experiment (sampling date IX). It can therefore be concluded that biochar application caused persistent changes in PD (Figure 1, Table 1). These changes were found to be persistent in the case of both soil layers (0–10 cm and 10–20 cm) and each biochar rate. According to the arithmetic means, the biochar rates of 20 Mg × ha−1 (BC20) and 30 Mg × ha−1 (BC30) resulted in a significant decrease in PD in comparison with the control soil—BC0 (ANOVA-LSD) (Table 2 and Table 3). Similar changes in soil particle density (PD) have also been obtained by other authors, e.g., Pranagal [8], Meena et al. [23], and Githinji [64]. In their studies, these authors used very high biochar rates—25–100%, v/v. As a result, they found decrease to 40% PD. Nonetheless, these authors stressed that such a clear effect was short-lived (2–3 years). The relationships of PD with other soil properties, e.g., PSD, SOM, BD, FC, etc., are well known and have been frequently described by, among others, Jones [10], Reynolds et al. [24], Herath et al. [43], Blake and Hartge [54,55], Carter and Bentley [63], and Ball et al. [65].
Bulk density (BD) is an important physical parameter considered to be one of the soil compaction measures [10,11,12,13,14,15]. The BD results obtained in this research were within a very wide range from 1.19 Mg × m−3 (BC30; layer 0–10 cm; sampling date I) to 1.73 Mg × m−3 (BC0; layer 10–20 cm; sampling date 0) (Figure 2). As in the case of PD measurements, the topsoil layer (0–10 cm) was characterized by lower compaction than the 10–20 cm layer. The incorporated biochar definitely contributed to a decrease in BD. The higher the biochar rate, the more the BD decreased. The changes in bulk density related to both layers analyzed (0–10 cm and 10–20 cm). The differences between the soil in treatment BC0 and the soil in treatments BC10, BC20, and BC30, respectively, persisted only over three growing seasons (sampling dates I, II, and III). At sampling date IV, these differences disappeared completely (Table 1). In the next years (sampling dates V–IX), only differences that resulted rather from seasonal variation were observed (Figure 2). An analysis of variance (ANOVA-LSD) showed that only the differences in mean BD values between treatment BC0 and treatment BC30 could be considered significant (Table 2 and Table 3). The obtained BD results were similar to those found by other authors, e.g., Pranagal et al. [8,15], Drewry et al. [12], Reynolds et al. [13,14], Arshad and Martin [66], Logson and Karlen [67], and McQueen and Shepherd [11]. They indicated that the bulk density of soils with the particle size distribution of loamy sands most frequently ranges from 1.50 Mg × m−3 to 1.70 Mg × m−3. These researchers also emphasized that favorable conditions for the growth of crop plants occur when BD ≤ 1.60 Mg × m−3. Based on the classification by Paluszek [68], the investigated soil was most often classified in the following BD classes: “medium” and “high”. Therefore, one could expect excessive soil compaction and disturbances in soil—plant—atmosphere relations according to the specialists involved in research on the soil physical condition [8,9,10,11,12,13,14,15]. Such a situation occurred before the establishment of the experiment (sampling date 0) and also at successive sampling dates from the fifth year of the experiment (sampling date IV). Such soil condition was predominantly found in the deeper layer (10–20 cm) (Figure 2). The authors of similar studies [7,8,9,21,22,23,24,69] have also reported a deterioration in air-water conditions in the soil caused by a high BD. They underlined that the persistence of changes in the physical condition of the soil after its amendment with different additional materials was usually transient.

3.2. Soil Total Porosity (TP) and Air Properties (FAC and FAP)

Soil total porosity (TP) informs about the total volume of free spaces in the soil. It depends on the same factors that determine bulk density (BD). Their relationship is inversely proportional and many authors [8,9,10,14,15,68,69] report a correlation coefficient r ≈ −1.00. The obtained TP results ranged from 0.345 m3 × m−3 (BC0; layer 10–20 cm; sampling date 0) to 0.535 m3 × m−3 (BC30; layer 0–10 cm; sampling date I) (Figure 3).
The TP results exhibited the same trends in changes as in the case of bulk density (BD). The addition of biochar, particularly at its highest rate (treatment BC30), had a significant effect on increasing total porosity (TP). The changes in TP applied to the entire arable soil layer (0–20 cm) to a similar degree. The differences due to biochar application persisted until the fifth year of the experiment (sampling date IV). At sampling date IV, the TP values equalized, while at subsequent dates (sampling dates V-IX) only small fluctuations in them were recorded (Table 1). According to the mean values, the TP of the soil amended with biochar at a rate of 30 Mg × ha−1 (treatment BC30) was significantly highest (ANOVA-LSD) (Table 2 and Table 3). Numerous papers on soil porosity [9,13,14,15,63,68] have demonstrated that an ideal situation occurs in the soil when TP ≥ 0.500 m3 × m−3. According to the above cited authors, such TP should provide proper soil—plant—atmosphere relations. The studied soil was usually characterized by TP that was lower than its recommended optimum value (Figure 3). Other authors [42,43,44,45,46,68,69,70,71] have claimed that TP ≥ 0.500 m3 × m−3 is not sufficient to maintain optimal air-water conditions. They have also stressed that a favorable distribution of the network of soil pores and their patency are equally important as the total porosity (TP) of the soil.
Field air capacity (FAC) was calculated at a potential of −15.5 kPa. Such energy state of the soil (−15.5 kPa) was accepted as field water saturation of the soil. Then all pores with dimensions >20 μm—macropores are filled with air. Pores of this size perform an important role since they are responsible for gas exchange between the soil and the atmosphere. For this reason, they are often called aeration pores [56,68,69,70,71].
In our study, the FAC value was in the range from 0.092 m3 × m−3 (BCO; layer 10–20 cm; sampling date 0) to 0.245 m3 × m−3 (BC30; layer 0–10 cm; sampling date II) (Figure 4). The effect of biochar application was visible only in the two first years—sampling dates I and II. Subsequently, the above-mentioned differences continued to decrease (Table 1). In the control treatment (BC0), FAC was sometimes higher than in the biochar-amended soil (treatments BC10, BC20, and BC30). Such a situation occurred, for example, in: (i) layer 0–10 cm; sampling dates V and VI; and (ii) layer 10–20 cm; sampling dates III and V (Figure 4). It can be presumed that air capacity was more affected by the seasonal dynamics than biochar application. The analysis of variance (ANOVA-LSD) of the means revealed that significantly the lowest FAC was found in the soil in treatment BC20 (Table 2 and Table 3). Many authors [56,61,72,73] assume that FAC > 0.100 m3 × m−3 in order to provide proper soil aeration. On the other hand, some authors think that the threshold value of FAC should be higher, e.g., >0.110 m3 × m−3 [14,74,75]; >0.120 m3 × m−3 [70], and >0.140 m3 × m−3 [12,76,77]. The above indicated threshold values of FAC apply to full water saturation of the soil at a potential of −15.5 kPa (FC) [59,60]. Under natural conditions, such a state occurs only several times during a growing season and it is a quickly receding state [8,68,71,78]. In most measurements, the studied soil met the criterion of FAC >0.100 m3 × m−3 [56,61,72,73] as well as the minimum criterion proposed by Reynolds et al. [14,74] and Castellini et al. [75] (>0.110 m3 × m−3), Walczak et al. [70] (>0.120 m3 × m−3), Drewry et al. [12], Drewry [76], and Mueller et al. [77] (>0.140 m3 × m−3). When analyzing FAC results, one needs to remember that in the case of sandy soils a greater problem can be an excess of air, not its lack. After adding the biochar to the soil, the porosity (TP) increased (Figure 3), and its substantial part was occupied by macropores (>20 µm). This situation was unfavorable because this caused excessive aeration of the soil. As a consequence, the soil could have become dry and soil organic matter mineralization could have accelerated [1,4,8,63,66]. It should be emphasized that in the case of the investigated soil the unfavorable changes only applied to sampling dates I and II. At the other sampling dates, i.e., dates III-IX, biochar was not found to have any negative impact on field air capacity (FAC).
Field air permeability (FAP) at full water saturation (15.5 kPa) is an important parameter describing soil air properties. It characterizes the actual vertical gas flow in the soil and gas exchange between the soil and the atmosphere. FAP is a physical indicator of pore openness [79,80,81]. Measurements of FAP showed this parameter to vary significantly. Its value was within a wide range from 4.5 × 10⁻⁸ × m2 × Pa−1 × s−1 (BC0; layer 10–20 cm; sampling date 0) to 78.9 × 10⁻⁸ × m2 × Pa−1 × s−1 (BC30; layer 0–10 cm; sampling date V). As in the case of FAC, higher values were recorded in the topsoil layer (0–10 cm), while smaller ones in the lower layer of 10–20 cm. The biochar’s effect increasing the air permeability remained visible for eight years of the experiment (sampling dates I-VIII). In the last (tenth) year of the experiment (sampling date IX), the observed differences in FAP disappeared completely (Figure 5).
The greatest differences in FAP values between the control treatment BC0 and the biochar addition treatments (BC10, BC20 and BC30) were found in the 0–10 cm layer at sampling dates V and VI (Figure 5). Given the above, a question arises why the largest range of FAP occurred not at sampling date I but at sampling date V. A probable reason for such FAP results could have been the interaction of a number of soil physical characteristics, e.g., PD, BD, FAC, SM, FC, etc. The comparison of the mean FAP values in the analysis of variance and of significant differences (ANOVA-LSD) revealed that such differences occurred both between the layers (0–10 cm and 10–20 cm) and treatments (BC0, BC10, BC20 and BC30) (Table 1, Table 2 and Table 3). FAP is a sensitive parameter for changes in the physical condition of the soil environment. It quickly responds to, e.g.: (i) modifications in the composition of individual soil components; (ii) fluctuations in soil moisture; and (iii) soil compaction. FAP also exhibits significant variations both within a single growing season and between seasons [82,83,84]. The studies by Paluszek [68] and Pranagal [71] demonstrated that proper gas flow in soil occurs when the vertical air permeability is at least 35.0 × 10⁻⁸ × m2 × Pa−1 × s−1. This criterion was met by only 22/80 cases of means from the FAP measurements in the studied soil. Based on the division of soils into quality classes of permeability proposed by the above-mentioned authors [68,71], the studied soil was most frequently (53/80 cases) classified in the “medium” class (15—75 × 10−8 × m2 × Pa−1 × s−1), while only in 2/80 cases this was the “high” class (75—150 × 10−8 × m2 × Pa−1 × s−1). In the other cases, FAP was “low” (2.5—15.0 × 10⁻⁸ × m2 × Pa−1 × s−1). An increase in FAP resulting from biochar application proved to be quite persistent, unlike the parameters describing soil compaction (BD, TP and FAC), for which the changes showed lower persistence. Most probably, this was primarily attributable to the greater patency of soil pores than in the control treatment (BC0) and the presence of free interaggregate spaces and large intergrain pores. The authors of studies on soil air permeability [68,71,79,80,81,82,83,84] have often indicated such a finding. The above cited papers also stressed some risks arising from a substantial increase in air permeability. Conditions for excessive aeration of the soil, and thus its drying, can then be created.

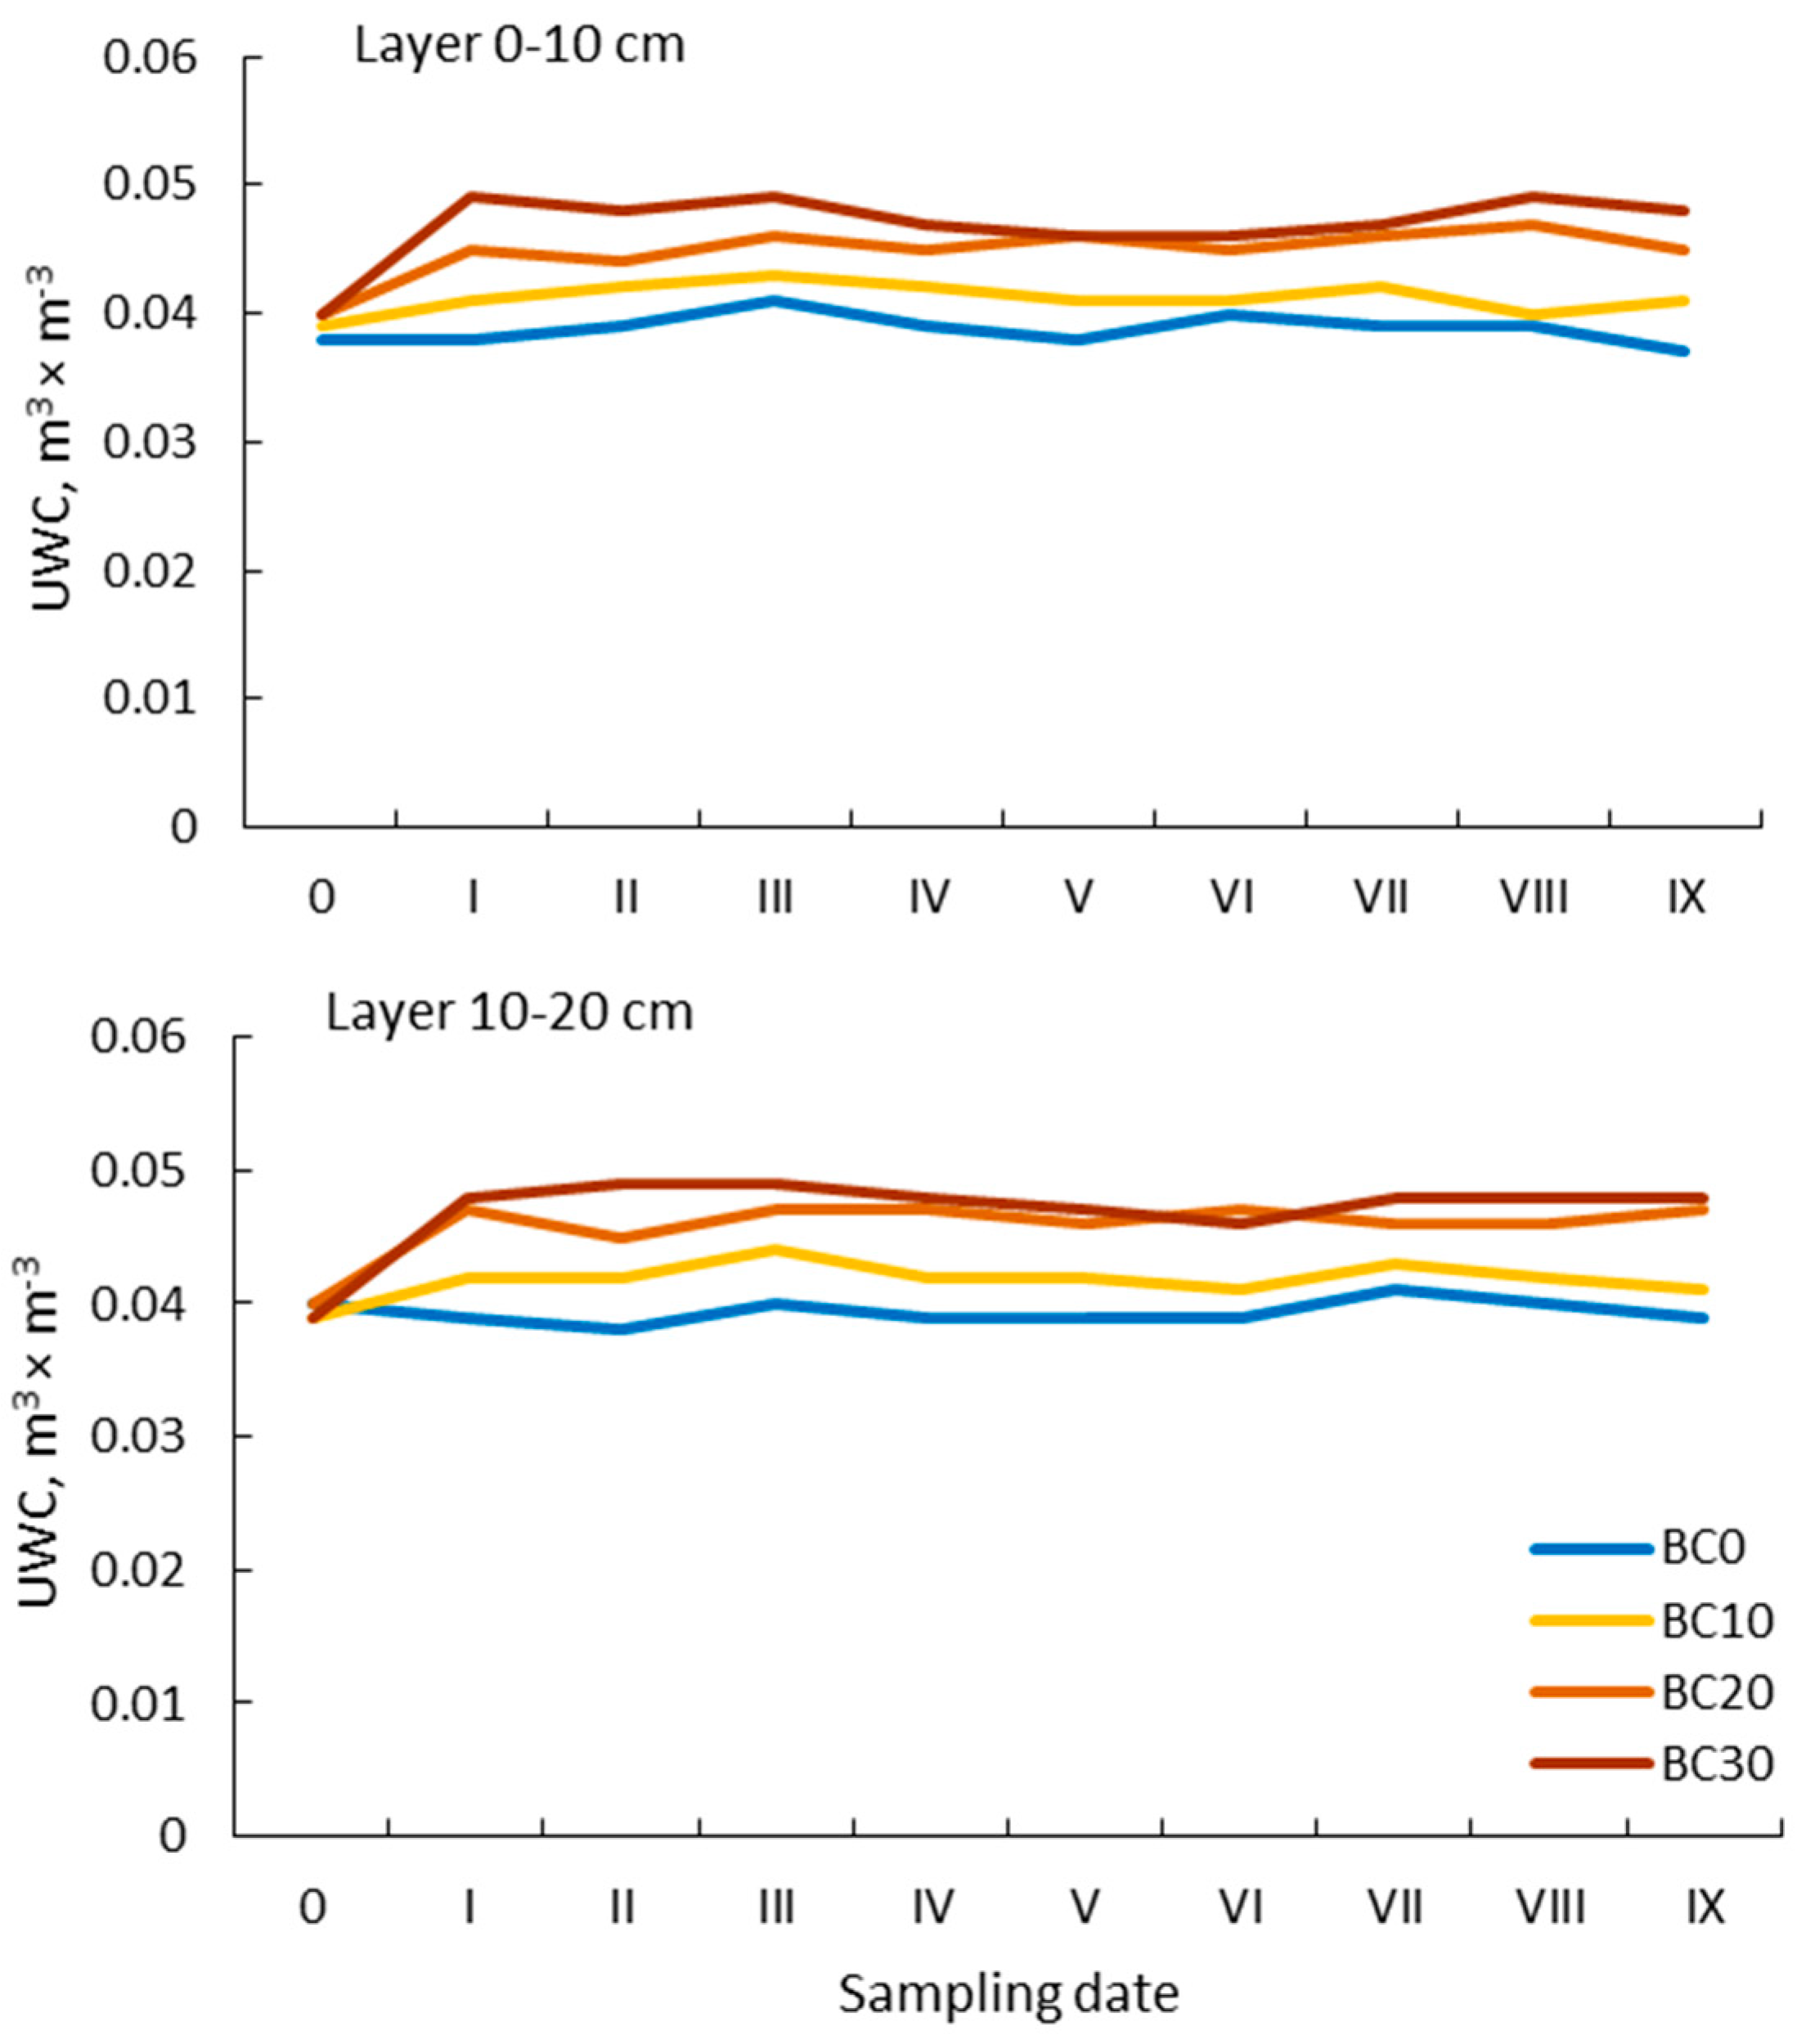
3.3. Soil Water Properties (SM, FC, AWC and UWC) and FC/TP Ratio

The actual soil moisture (SM) is a very dynamic property. It predominantly depends on the amount of precipitation, evapotranspiration, and agronomic practices. During drought periods, it also tends to be dependent on: (i) soil texture; (ii) structure; and (iii) compaction [68,69,70,71,85]. The soil moisture (SM) during the experiment (2010–2019) was characterized by very high interseasonal variability. The SM values ranged from 0.059 kg kg−1 (BC0; layer 0–10 cm; sampling date IV) to 0.149 kg kg−1 (BC20; layer 10–20 cm; sampling date V). The effect of applied biochar on SM was particularly visible at sampling dates II, V, and VIII in both layers analyzed (Figure 6).
A state can therefore be drawn that the effect of biochar application was only periodically positive (Table 1). The analysis of variance (ANOVA) and comparison of pairs of mean SM values (LSD) showed that significantly the least water was found in treatments BC0 and BC10 at sampling (Table 1, Table 2 and Table 3). Pandian et al. [86] informed that the effect of biochar incorporation into the soil was a 2.5% increase in its moisture. Recorded differences in SM can also be due to spatial variations that this characteristic is subject to. This applies to even small areas. It has been shown in papers by, among others, White [85], Kutílek [87], Leśny [88], Petrosyants et al. [89] as well as Usowicz and Usowicz [90]. It should be underlined that this experiment was conducted in an area with dominant rainfall-based water management. Hence, SM was primarily dependent on the amount and distribution of precipitation and air temperature [85,88,89]. These factors cause recurrent soil wetting and drying cycles, while during the winter period freeze and thaw cycles. The cyclicity of these processes promotes the formation of soil aggregates [68,71,91,92,93].
In the case of the determined field water capacity—FC (−15.5 kPa), the effect of adding the biomass processed through pyrolysis to the soil proved to be consistent with the soil compaction results (BD and TP) and the aeration properties (FAC and FAP). FC showed values characterized by quite large variations. They were in the range from 0.230 m3 × m−3 (BC0; layer 10–20 cm; sampling date III) to 0.329 m3 × m−3 (BC30; layer 10–20 cm; sampling date I) (Figure 7).
Small but visible variations in FC values were recorded from sampling date I to sampling date VII. However, they were usually greater in the deeper layer of 10–20 cm. This was also confirmed by the analysis of variance (ANOVA-LSD) which revealed significantly the highest FC values in the 10–20 cm layer. On the other hand, in the comparison of pairs of means in the treatments (BC0, BC10, BC20, and BC30), significantly the highest FC was found for the soil in treatment BC20 (Table 2 and Table 3). The differences in FC results due to biochar application persisted for seven years (sampling dates I-VII). Subsequently, they began to disappear definitely from sampling date VII (Figure 7, Table 1). When assessing the field water capacity (FC) of the studied soil, it can be classified in the “medium” class according to the classification by Walczak et al. [70]. Nonetheless, when we take into account the recommendations given by Reynolds et al. [14], the obtained results were close to the determined optimum FC (0.300–0.350 m3 × m−3) only in several situations. The obtained results confirmed the strong dependence of FC on soil compaction (Figure 2, Figure 3 and Figure 7) [63]. This dependence has also been described in experiments carried out in soils of other types [8,13,21,22,42,43].
In the context of ensuring stable yields, a very important parameter of the soil physical condition is available water content (AWC) [14,68,70,94,95]. Over the 10-year measurements (2010–2019), the AWC values were in a rather wide range from 0.181 m3 × m−3 (BC30; layer 10–20 cm; sampling date VII) to 0.290 m3 × m−3 (BC20; layer 0–10 cm; sampling date II). The nature of the changes was the same as in the case of FC (Figure 7 and Figure 8, Table 1).
The analysis of variance and comparison of pairs of AWC means (ANOVA-LSD) showed that the 10–20 cm soil layer in treatments BC20 and BC30 had significantly the best retention properties, while as regards the entire arable layer (0–20 cm), the soil in treatment BC20 retained most water (Table 2 and Table 3). Visible differences in AWC for the analyzed treatments were also observed during measurements at sampling date VII (Figure 8). In the subsequent years of the experiment (sampling dates VIII and IX), the previously observed differences disappeared. Similar observations regarding an increase in stocks of water and its availability to plants as a direct result of biochar incorporation into the soil have also been reported by Abel et al. [42]—sandy soil, Pranagal et al. [8]—loamy sand soil, Githinji [64]—sandy loam soil, Herath et al. [43]—loamy soils (Alfisol and Andisol), Lu et al. [96]—clayey soil (Vertisol) as well as by Omondi et al. in a meta-analysis [46]. Evaluation of the obtained AWC results allow us to state that the studied soil was characterized by good retention properties. According to Walczak et al. [70], in terms of AWC values the investigated soil could be classified in the “high” class (≥0.210 m3 × m−3—in 43/80 cases) and also in the “medium” class (0.120–0.210 m3 × m−3—37/80). In accordance with the proposals of Reynolds et al. [14] and Castellini et al. [75], on the other hand, the analyzed soil was assessed as “ideal” (≥0.200 m3 × m−3—in 49/80 cases), while in many cases also as “good” (0.150–0.200 m3 × m−3—31/80). The changes in AWC caused by biochar application were found over a period of seven years. They were most frequently beneficial, though small.
The unavailable water content (UWC) was typical of soils with the particle size distribution of loamy sand (LS) and with a low organic carbon content [8,63,68,69,70,71]. The biochar incorporated into the soil resulted in a visible and persistent increase in UWC in micropores (<0.2 μm). During the measurement period, UWC ranged from 0.037 m3 × m−3 (BC0; layer 0–10 cm; sampling date 0) to 0.049 m3 × m−3 (BC30; layer 0–10 cm; sampling date I). The range of UWC results of similar magnitude (0.06–0.010 m3 × m−3) persisted over the nine years of the experiment (sampling dates I-IX). The changes in the unavailable water content applied to both soil layers analyzed and were proportional to the amount of biochar applied (10, 20, and 30 Mg × ha−1) (Figure 9). This was confirmed by the analysis of variance (ANOVA-LSD) which revealed that significantly the highest UWC was in treatments BC20 and BC30 (Table 1, Table 2 and Table 3). The studied soil was characterized by a small percentage of UWC in FC. On average, this percentage did not exceed 20%. The comparison of the FC, AWC, and UWC results allowed finding that the biochar added to the soil had a positive effect. The increase in FC was primarily due to the increase in AWC arising from an increased content of mesopores (0.2–20.0 μm). It is worth stressing that the volume of micropores (<0.2 μm), in comparison with the volume of macropores (>20.0 μm) and mesopores (0.2–20.0 μm), showed much smaller variations. Similar observations have also been described by the authors of other experiments [5,8,22,24,25,46,78,88]. Nevertheless, the above-mentioned authors emphasized that the effect of biochar application was short-lived and most frequently limited to the topsoil layer (0–10 cm).
During the ten-year experiment (2010–2019), air-water conditions in the soil were also evaluated. To this end, the FC/TP ratio was determined, which underwent quite numerous changes. They applied to all treatments (BC0, BC10, BC20 and BC30). These changes resulted not only from the addition of biochar to the soil, but also from seasonal variation. The FC/TP value ranged from 0.53 (BC10; layer 0–10 cm; sampling date I) to 0.74 (BC20; layer 10–20 cm; sampling date III) (Figure 10). In the control treatment (BC0), air-water conditions were most stable—the FC/TP ratio value ranged from 0.56 to 0.73. The calculated mean FC/TP values for all treatments were within the optimum range, i.e., 0.60–0.70 [14,60,61,63,74,75]. The analysis of variance (ANOVA-LSD) showed that significantly the lowest FC/TP values were found for the soil in treatment BC10 (Table 1, Table 2 and Table 3). It should however be stressed that periods when the FC/TP ratio diverged from its optimum value (0.60–0.70) were found with regard to the soil in all experimental treatments. Both the appearance of aeration impairment conditions (FC/TP > 0.70) and the condition of the soil signifying its excessive aeration, and thus a periodic water deficit (FC/TP < 0.60), could be found.

4. Conclusions

The analysis of the obtained results allowed us to verify the hypothesis that one-time biochar amendment contributes to an improvement in soil physical properties and that resultant changes in soil properties are persistent. To this end, the range and persistence of changes in soil properties caused by agricultural use of biochar produced from waste winter wheat straw were evaluated in this study. A conclusion can be drawn that biochar application of BC10, BC20, and BC30 did improve soil physical properties, that is, the particle density (PD) and bulk density (BD) decreased, while the total porosity (TP) increased. The positive changes in PD, BD and TP also had an effect on increasing the following parameters: water content at sampling (SM), air capacity at −15.5 kPa (FAC), air permeability at −15.5 kPa (FAP), field water capacity at −15.5 kPa (FC), available water content (AWC), unavailable water content (UWC), and FC/TP ratio. It should however be remembered that an increase in soil air capacity and air permeability is not always positive. A large increase in the value of these traits can lead to unfavorable changes in air-water relations, i.e., to excessive aeration of the soil or even to its drying. Such a situation may apply in particular to poor quality soils with the sandy texture. The changes in the physical properties of soil described in this study, although visible, cannot be considered as permanent. Statistical analysis confirmed that only two soil properties has changed permanently: particle density (PD) and unavailable water content (UWC). Most of the analyzed properties showed a durability of no more than 3–4 years. We also found that biochar incorporation into soil is a good way for environmental management of waste biomass. The results presented by us and the observations collected during the experiment demonstrate that environmental management of biochar requires very great caution. When incorporating this type of waste into soil, one needs to remember not to disturb the balance in soil functions, i.e., the “container” and “filter” functions. To determine the timing for repeated agricultural, but safe use of waste, we propose to continue soil monitoring in subsequent years.

Author Contributions

J.P., P.K., conceptualized the research; P.K., J.P., designed the research; J.P., P.K., performed the experiments; J.P. analyzed the data; J.P., P.K., wrote the paper. All authors have read and agreed to the published version of the manuscript.

Funding

This research was funded by the Ministry of Science and Higher Education, Poland.

Conflicts of Interest

This research was funded by the Ministry of Science and Higher Education, Poland. The authors declare no conflict of interest. The funders had no role in the design of the study; in the collection, analyses or interpretation of data; in the writing of the manuscript, or in the decision to publish the results.

References

  1. Blum, W.E.H. Basic concepts: Degradation, resilience, and rehabilitation. In Methods for Assessment of Soil Degradation; CRC Press: Boca Raton, FL, USA, 1998. [Google Scholar]
  2. Lal, R. Soil and sustainability agriculture. A review. Agron. Sustain. Dev. 2008, 28, 57–65. [Google Scholar] [CrossRef]
  3. Lal, R. Soils and world food security. Soil Tillage Res. 2009, 102, 1–4. [Google Scholar] [CrossRef]
  4. Lorenz, K.; Lal, R.; Ehlers, K. Soil organic carbon stock as an indicator for monitoring land and soil degradation in relation to United Nations’ Sustainable Development Goals. Land Degrad. Dev. 2019, 30, 824–838. [Google Scholar] [CrossRef]
  5. Ajayi, A.E.; Holthusen, D.; Horn, R. Changes in microstructural behaviour and hydraulic functions of biochar amended soils. Soil Tillage Res. 2016, 155, 166–175. [Google Scholar] [CrossRef]
  6. Baran, S.; Pranagal, J.; Bik, M. Usefulness of mineral wool Grodan and sewage sludge in management of water properties in soils devastated during extraction of sulphur by Frash method. Miner. Resour. Manag. 2008, 24, 81–95. [Google Scholar]
  7. Pranagal, J.; Domżał, H.; Słowińska-Jurkiewicz, A.; Świca, M.; Zawiślak-Pranagal, M. Effect of popectin spent grains on soil filtration properties. Acta Agrophys. 2002, 70, 277–286. [Google Scholar]
  8. Pranagal, J.; Oleszczuk, P.; Tomaszewska-Krojańska, D.; Kraska, P.; Różyło, K. Effect of biochar application on the physical properties of Haplic Podzol. Soil Tillage Res. 2017, 174, 92–103. [Google Scholar] [CrossRef]
  9. Pranagal, J.; Ligęza, S.; Smal, H. Impact of Effective Microorganisms (EM) application on the physical condition of Haplic Luvisol. Agronomy 2020, 10, 1049. [Google Scholar] [CrossRef]
  10. Jones, C.A. Effect of soil texture on critical bulk densities for root growth. Soil Sci. Soc. Am. J. 1983, 47, 1208–1212. [Google Scholar] [CrossRef]
  11. McQueen, D.J.; Shepherd, T.G. Physical changes and compaction sensitivity of a fine textured, poorly drained soil (Typic endoaquept) under varying durations of cropping, Manawatu Region, New Zealand. Soil Tillage Res. 2002, 63, 93–107. [Google Scholar] [CrossRef]
  12. Drewry, J.J.; Cameron, K.C.; Buchan, G.D. Pasture yield and soil physical property responses to soil compaction from treading and grazing—A review. Aust. J. Soil Res. 2008, 46, 237–256. [Google Scholar] [CrossRef]
  13. Reynolds, W.D.; Bowman, B.T.; Drury, C.F.; Tan, C.S.; Lu, X. Indicators of good soil physical quality: Density and storage parameters. Geoderma 2002, 110, 131–146. [Google Scholar] [CrossRef]
  14. Reynolds, W.D.; Drury, C.F.; Yang, X.M.; Tan, C.S. Optimal soil physical quality inferred through structural regression and parameter interactions. Geoderma 2008, 146, 466–474. [Google Scholar] [CrossRef]
  15. Pranagal, J.; Tomaszewska-Krojańska, D.; Smal, H.; Ligęza, S. Impact of selected waste applications on soil compaction. Agron. Sci. 2019, 74, 19–32. [Google Scholar] [CrossRef]
  16. Edwards, C.A. Assessing the effects of environmental pollutants on soil organisms, communities, processes and ecosystems. Eur. J. Soil Biol. 2002, 38, 225–231. [Google Scholar] [CrossRef]
  17. Van-Camp, L.; Bujarrabal, B.; Gentile, A.R.; Jones, R.J.A.; Montanarella, L.; Olazabal, C.; Selvaradjou, S.K. Reports of the Technical Working Groups Established under the Thematic Strategy for Soil Protection; EUR 21319 EN/3; Office for Official Publications of the European Communities: Luxembourg, 2004; pp. 311–496. [Google Scholar]
  18. Angers, D.A.; Eriksen-Hamel, N.S. Full-inversion tillage and organic carbon distribution in soil profiles: A meta-analysis. Soil Sci. Soc. Am. J. 2008, 72, 1370–1374. [Google Scholar] [CrossRef]
  19. Hillel, D.; Rosenzweig, C. Conclusion: Agricultural solutions for climate change at global and regional scales. In Handbook of Climate Change and Agroecosystems: Global and Regional Aspects and Implications; ICP Series on Climate Change Impacts, Adaptation, and Mitigation 2; Hillel, D., Rosenzweig, C., Eds.; Imperial College Press: London, UK, 2012; pp. 281–292. [Google Scholar]
  20. Lal, R. Restoring Soil Quality to Mitigate Soil Degradation. Sustainability 2015, 7, 5875–5895. [Google Scholar] [CrossRef] [Green Version]
  21. Ojeda, G.; Mattana, S.; Bonmati, M.; Woche, S.K.; Bachmann, J. Soil wetting-drying and water-retention properties in a mine-soil treated with composted and thermally-dried sludges. Eur. J. Soil Sci. 2011, 62, 696–708. [Google Scholar] [CrossRef]
  22. Ojeda, G.; Mattana, S.; Àvila, A.; Alcañiz, J.M.; Volkmann, M.; Bachmann, J. Are soil–water functions affected by biochar application? Geoderma 2015, 249, 1–11. [Google Scholar] [CrossRef]
  23. Meena, R.S.; Lal, R.; Yadav, G.S. Long-term impacts of topsoil depth and amendments on soil physical and hydrological properties of an Alfisol in central Ohio, USA. Geoderma 2020, 363, 114164. [Google Scholar] [CrossRef]
  24. Reynolds, W.D.; Nurse, R.; Phillips, L.; Drury, C.F.; Yang, X.M.; Page, E.R. Characterizing mass-volume-density-porosity relationships in a sandy loam soil amended with compost. Can. J. Soil Sci. 2020, 100, 1–13. [Google Scholar] [CrossRef]
  25. Amoah-Antwi, C.; Kwiatkowska-Malina, J.; Thornton, S.F.; Fenton, O.; Malina, G.; Szara, E. Restoration of soil quality using biochar and brown coal waste: A review. Sci. Total Environ. 2020, 722, 137852. [Google Scholar] [CrossRef] [PubMed]
  26. Różyło, K.; Oleszczuk, P.; Jośko, I.; Kraska, P.; Kwiecińska-Poppe, E.; Andruszczak, S. An ecotoxicological evaluation of soil fertilized with biogas residues or mining waste. Environ. Sci. Poll. Res. 2015, 22, 7833–7842. [Google Scholar] [CrossRef] [PubMed] [Green Version]
  27. Różyło, K.; Gawlik-Dziki, U.; Świeca, M.; Różyło, R.; Pałys, E. Winter wheat fertilized with biogas residue and mining waste: Yielding and the quality of grain. J. Sci. Food Agric. 2016, 96, 3454–3461. [Google Scholar] [CrossRef]
  28. Bandara, T.; Franks, A.; Xu, J.; Bolan, N.; Wang, H.; Tang, C. Chemical and biological immobilization mechanisms of potentially toxic elements in biochar-amended soils. Crit. Rev. Environ. Sci. Technol. 2020, 50, 903–978. [Google Scholar] [CrossRef]
  29. Chen, H.; Yang, X.; Wang, H.; Sarkar, B.; Shaheen, S.M.; Gielen, G.; Bolan, N.; Guo, J.; Che, L.; Sun, H.; et al. Animal carcass- and wood-derived biochars improved nutrient bioavailability, enzyme activity, and plant growth in metal-phthalic acid ester co-contaminated soils: A trial for reclamation and improvement of degraded soils. J. Environ. Manag. 2020, 261, 110246. [Google Scholar] [CrossRef] [PubMed]
  30. Wang, H.; Baek, K.; Xue, J.; Li, Y.; Beiyuan, J. Preface—Biochar and agricultural sustainability. J. Soils Sediments 2020, 20, 3015–3016. [Google Scholar] [CrossRef]
  31. Wu, P.; Ata-Ul-Karim, S.T.; Singh, B.P.; Wang, H.; Wu, T.; Liu, C.; Fang, G.; Zhou, D.; Wang, Y.; Chen, W. A scientometric review of biochar research in the past 20 years (1998–2018). Biochar 2019, 1, 23–43. [Google Scholar] [CrossRef] [Green Version]
  32. Li, Y.F.; Hu, S.D.; Chen, J.H.; Muller, K.; Li, Y.C.; Fu, W.J.; Lin, Z.W.; Wang, H.L. Effects of biochar application in forest ecosystems on soil properties and greenhouse gas emissions: A review. J. Soils Sediments 2018, 18, 546–563. [Google Scholar] [CrossRef]
  33. Aydin, E.; Šimanský, V.; Horák, J.; Igaz, D. Potential of Biochar to Alternate Soil Properties and Crop Yields 3 and 4 Years after the Application. Agronomy 2020, 10, 889. [Google Scholar] [CrossRef]
  34. Seleiman, M.F.; Alotaibi, M.A.; Alhammad, B.A.; Alharbi, B.M.; Refay, Y.; Badawy, S.A. Effects of ZnO Nanoparticles and Biochar of Rice Straw and Cow Manure on Characteristics of Contaminated Soil and Sunflower Productivity, Oil Quality, and Heavy Metals Uptake. Agronomy 2020, 10, 790. [Google Scholar] [CrossRef]
  35. Fang, Z.; Gao, Y.; Bolan, N.; Shaheen, S.M.; Xu, S.; Wu, X.; Xu, X.; Hu, H.; Lin, J.; Zhang, F.; et al. Conversion of biological solid waste to graphene-containing biochar for water remediation: Acritical review. Chem. Eng. J. 2020, 390, 124611. [Google Scholar] [CrossRef]
  36. Lu, L.; Yu, W.; Wang, Y.; Zhang, K.; Zhu, X.; Zhang, Y.; Wu, Y.; Ullah, H.; Xiao, X.; Chen, B. Application of biochar—Based materials in environmental remediation: From multi-level structures to specific devices. Biochar 2020, 2, 1–31. [Google Scholar] [CrossRef] [Green Version]
  37. Zhang, X.; Gao, B.; Fang, J.; Zou, W.; Dong, L.; Cao, C.; Zhang, J.; Li, Y.; Wang, H. Chemically activated hydrochar as an effective adsorbent forvolatile organic compounds (VOCs). Chemosphere 2019, 218, 680–686. [Google Scholar] [CrossRef]
  38. Conte, P. Biochar, soil fertility, and environment. Biol. Fertil. Soils 2014, 50, 1175. [Google Scholar] [CrossRef] [Green Version]
  39. Morales, V.L.; Pérez-Reche, F.J.; Hapca, S.M.; Hanley, K.L.; Lehmann, J.; Zhang, W. Reverse engineering of biochar. Bioresour. Technol. 2015, 183, 163–174. [Google Scholar] [CrossRef] [PubMed] [Green Version]
  40. Edenborn, S.L.; Edenborn, H.M.; Krynock, R.M.; Zickefoose Haug, K.L. Influence of biochar application methods on the phytostabilization of a hydrophobic soil contaminated with lead and acid tar. J. Environ. Manag. 2015, 150, 226–234. [Google Scholar] [CrossRef]
  41. Inbar, A.; Ben-Hur, M.; Sternberg, M.; Lado, M. Using polyacrylamide to mitigate post-fire soil erosion. Geoderma 2015, 239, 107–114. [Google Scholar] [CrossRef]
  42. Abel, S.; Peters, A.; Trinks, S.; Schonsky, H.; Facklam, M.; Wessolek, G. Impact of Biochar and hydrochar addition on water retention and water repellency of sandy soil. Geoderma 2013, 202, 183–191. [Google Scholar] [CrossRef]
  43. Herath, H.; Camps-Arbestain, M.; Hedley, M. Effect of biochar on soil physical properties in two contrasting soils: An Alfisol and an Andisol. Geoderma 2013, 209, 188–197. [Google Scholar] [CrossRef]
  44. Laird, D.A.; Fleming, P.; Davis, D.D.; Horton, R.; Wang, B.; Karlen, D.L. Impact of biochar amendments on the quality of a typical Midwestern agricultural soil. Geoderma 2010, 158, 443–449. [Google Scholar] [CrossRef] [Green Version]
  45. Nelissen, V.; Ruysschaert, G.; Manka’Abusi, D.; D’Hose, T.; de Beuf, K.; Al-Barri, B.; Cornelis, W.; Boeckx, P. Impact of a woody biochar on properties of a sandy loam soil and spring barley during a two-year field experiment. Eur. J. Agron. 2015, 62, 65–78. [Google Scholar] [CrossRef]
  46. Omondi, M.O.; Xia, X.; Nahayo, A.; Liu, X.; Korai, P.K.; Pan, G. Quantification of biochar effects on soil hydrological properties using meta-analysis of literature data. Geoderma 2016, 274, 28–34. [Google Scholar] [CrossRef]
  47. Council Directive EC. 31/EC Directive on the landfill of waste, special edition in Polish: Chapter 15. Off. J. 1999, 4, 228–246. [Google Scholar]
  48. GUS—Statistics Poland. Means of production in agriculture in the 2018/19 farming year. Stat. Anal. 2020, 1, 116–185. [Google Scholar]
  49. Weber, J.; Karczewska, A.; Drozd, J.; Licznar, M.; Licznar, S.; Jamroz, E.; Kocowicz, A. Agricultural and ecological aspects of a sandy soil as affected by the application of municipal solid waste composts. Soil Biol. Biochem. 2007, 39, 1294–1302. [Google Scholar] [CrossRef]
  50. Minister of Agriculture and Rural Development. Regulation on the implementation of certain provisions of the Act on fertilizers and fertilization. J. Laws 2008, 765, 6515–6520. [Google Scholar]
  51. IUSS Working Group WRB. World Reference Base for Soil Resources 2014, International Soil Classification System for Naming Soils and Creating Legends for Soil Maps; Update 2015; World Soil Resources Reports No. 106; Food and Agriculture Organization of the United Nations: Rome, Italy, 2015. [Google Scholar]
  52. Polish Society of Soil Science. Particle size distribution and textural classes of soils and mineral materials—Classification of Polish Society of Soil Science 2008. Soil Sci. Ann. 2009, 60, 5–16. [Google Scholar]
  53. Blott, S.J.; Pye, K. Particle size scales and classification of sediment types based on particle size distributions: Review and recommended procedures. Sedimentology 2012, 59, 2071–2096. [Google Scholar] [CrossRef]
  54. Blake, G.R.; Hartge, K.H. Particle density. In Methods of Soil Analysis 1, Physical and Mineralogical Methods; Klute, A., Ed.; ASA-SSSA Inc.: Madison, WI, USA, 1986; pp. 377–382. [Google Scholar]
  55. Blake, G.R.; Hartge, K.H. Bulk density. In Methods of Soil Analysis 1, Physical and Mineralogical Methods; Klute, A., Ed.; ASA-SSSA Inc.: Madison, WI, USA, 1986; pp. 363–375. [Google Scholar]
  56. Danielson, R.E.; Sutherland, P.L. Porosity. In Methods of Soil Analysis 1, Physical and Mineralogical Methods; Klute, A., Ed.; ASA-SSSA Inc.: Madison, WI, USA, 1986; pp. 443–460. [Google Scholar]
  57. Gardner, W.H. Water content. In Methods of Soil Analysis 1, Physical and Mineralogical Methods; Klute, A., Ed.; ASA-SSSA Inc.: Madison, WI, USA, 1986; pp. 493–541. [Google Scholar]
  58. Cassel, D.K.; Nielsen, D.R. Field capacity and available water capacity. In Methods of Soil Analysis 1, Physical and Mineralogical Methods; Klute, A., Ed.; ASA-SSSA Inc.: Madison, WI, USA, 1986; pp. 901–924. [Google Scholar]
  59. Canarache, A.; Vintila, I.; Munteanu, I. Elsevier’s Dictionary of Soil Science: Definitions in English with French, German, and Spanish Word Translations; Elsevier BV: Amsterdam, The Netherlands, 2006. [Google Scholar]
  60. Olness, A.; Clapp, C.E.; Liu, R.; Palazzo, A.J. Biosoilds and their effect on soil properties. In Handbook of Soil Conditioners; Wallace, A., Terry, R.E., Eds.; Marcel Dekker: New York, NY, USA, 1998; pp. 141–165. [Google Scholar]
  61. Skopp, J.; Janson, M.D.; Doran, J.W. Steady—State aerobic microbial activity as a function of soil water content. Soil Sci. Soc. Am. J. 1990, 54, 1619–1625. [Google Scholar] [CrossRef] [Green Version]
  62. Mikheeva, I.V. Changes in the probability distributions of particle size fractions in chestnut soil of the Kulunda Steppe under the effect of natural and anthropogenic factors. Eurasian Soil Sci. 2010, 43, 1351–1361. [Google Scholar] [CrossRef]
  63. Carter, M.; Bentley, S.P. Soil Properties and Their Correlations, 2nd ed.; Wiley: Hoboken, NJ, USA, 2016. [Google Scholar]
  64. Githinji, L. Effect of biochar application rate on soil physical and hydraulic properties of a sandy loam. Arch. Agron. Soil Sci. 2014, 60, 457–470. [Google Scholar] [CrossRef]
  65. Ball, B.C.; Campbell, D.J.; Hunter, E.A. Soil compactibility in relation to physical and organic properties at 156 sites in UK. Soil Tillage Res. 2000, 57, 83–91. [Google Scholar] [CrossRef]
  66. Arshad, M.A.; Martin, S. Identifying critical limits for soil quality indicators in agro ecosystems. Agric. Ecosyst. Environ. 2002, 88, 153–160. [Google Scholar] [CrossRef]
  67. Logsdon, S.D.; Karlen, D.L. Bulk density as a soil quality indicator during conversion to no-tillage. Soil Tillage Res. 2004, 78, 143–149. [Google Scholar] [CrossRef]
  68. Paluszek, J. Criteria of evaluation of physical quality of Polish arable soils. Acta Agrophys. 2011, 191, 1–139. [Google Scholar]
  69. Pranagal, J.; Podstawka-Chmielewska, E.; Słowińska-Jurkiewicz, A. Influence on selected physical properties of a Haplic Podzol during a ten-year fallow period. Pol. J. Environ. Stud. 2007, 16, 875–880. [Google Scholar]
  70. Walczak, R.; Ostrowski, J.; Witkowska-Walczak, B.; Sławiński, C. Hydrophysical characteristics of Polish mineral arable soils. Acta Agrophys. 2002, 79, 1–64. [Google Scholar]
  71. Pranagal, J. The Physical State of Selected Silty Soils of on the Lublin Region. Ph.D. Thesis, University of Life Sciences in Lublin, Lublin, Poland, 2011. [Google Scholar]
  72. Mayers, W.S.; Barrs, H.D. Roots in irrigated clay soil: Measurement techniques and responses to root zone conditions. Irrig. Sci. 1991, 12, 125–134. [Google Scholar]
  73. Cockroft, B.; Olsson, K.A. Case study of soil quality in south-eastern Australia: Management of structure for roots in duplex soils. In Soil Quality for Crop Production and Ecosystem Health; Gregorich, E.G., Carter, M.R., Eds.; Elsevier: Amsterdam, The Netherlands, 1997; pp. 339–350. [Google Scholar]
  74. Reynolds, W.D.; Drury, C.F.; Tan, C.S.; Fox, C.A.; Yang, X.M. Use of indicators and volume-function characteristics to quantify soil physical quality. Geoderma 2009, 152, 252–263. [Google Scholar] [CrossRef]
  75. Castellini, M.; Fornaro, F.; Garofalo, P.; Giglio, L.; Rinaldi, M.; Ventrella, D.; Vitti, C.; Vonell, A.V. Effect of no-tillage and conventional tillage on physical and hydraulic properties of fine textured soils under winter wheat. Water 2019, 11, 1–24. [Google Scholar] [CrossRef] [Green Version]
  76. Drewry, J.J. Natural recovery of soil physical properties from treading damage of pastoral soils in New Zealand and Australia: A review. Agric. Ecosyst. Environ. 2006, 114, 159–169. [Google Scholar] [CrossRef]
  77. Mueller, L.; Kay, B.D.; Been, B.; Hu, C.; Zhang, Y.; Wolff, M.; Eulenstein, F.; Schindler, U. Visual assessment of soil structure: Part II. Implications of tillage, rotation and traffic on sites in Canada, China and Germany. Soil Tillage Res. 2008, 103, 188–196. [Google Scholar] [CrossRef]
  78. Pranagal, J.; Woźniak, A. 30 years of wheat monoculture and reduced tillage and physical condition of Rendzic Phaeozem. Agric. Water Manag. 2021, 243, 106408. [Google Scholar] [CrossRef]
  79. Iversen, B.V.; Schjønning, P.; Poulsen, T.G.; Moldrup, P. In-situ, on-situ and laboratory measurements of soil air permeability: Boundary conditions a measurement scale. Soil Sci. 2001, 166, 97–106. [Google Scholar] [CrossRef]
  80. Shukla, M.K.; Lal, R. Air permeability of soil. In Encyclopedia of Soil Science; Lal, R., Ed.; Taylor and Francis: New York, NY, USA, 2006. [Google Scholar]
  81. Mentges, M.I.; Reichert, J.M.; Rodrigues, M.F.; Awe, G.O.; Mentges, L.R. Capacity and intensity soil aeration properties affected by granulometry, moisture, and structure in no-tillage soils. Geoderma 2016, 263, 47–59. [Google Scholar] [CrossRef]
  82. Kuncoro, P.H.; Koga, K.; Satta, N.; Muto, Y. A study on the effect of compaction on transport properties of soil gas and water I: Relative gas diffusivity, air permeability, and saturated hydraulic conductivity. Soil Tillage Res. 2014, 143, 172–179. [Google Scholar] [CrossRef]
  83. Wang, W.; Li, J.; Su, L.; Wang, Q. Soil air permeability model based on soil physical basic parameters. Nongye Jixie Xuebao/Trans. Chin. Soc. Agric. Mach. 2015, 46, 125–130. [Google Scholar] [CrossRef]
  84. Poulsen, T.G.; Iversen, B.V.; Yamaguchi, T.; Moldrup, P.; Schjønning, P. Spatial and temporal dynamics of air permeability in a construction field. Soil Sci. 2001, 166, 153–162. [Google Scholar] [CrossRef]
  85. White, R.E. Principles and Practice of Soil Science, 4th ed.; Blackwell Publishing: Oxford, UK, 2006. [Google Scholar]
  86. Pandian, K.; Subramaniayan, P.; Gnasekaran, P.; Chitraputhirapillai, S. Effect of biochar amendment on soil physical, chemical and biological properties and groundnut yield in rainfed Alfisol of semi-arid tropics. Arch. Agron. Soil Sci. 2016, 62, 1293–1310. [Google Scholar] [CrossRef]
  87. Kutílek, M. Soil hydraulic properties as related to soil structure. Soil Tillage Res. 2004, 79, 175–184. [Google Scholar] [CrossRef]
  88. Leśny, J. Meteorology and Climatology Research. Acta Agrophys. 2010, 184, 1–263. [Google Scholar]
  89. Petrosyants, M.A.; Kislov, A.V.; Semenov, E.K. Principal concepts in meteorology and climatology. Vestnik Moskovskogo Universiteta S 5 Geografiya 2005, 1, 83–91. [Google Scholar]
  90. Usowicz, B.; Usowicz, Ł. Point measurements of soil water content and its spatial distribution in cultivated fields. Acta Agrophys. 2004, 4, 573–588. [Google Scholar]
  91. Amézketa, E. Soil aggregate stability: A review. J. Sustain. Agric. 1999, 14, 82–151. [Google Scholar] [CrossRef]
  92. Bronick, C.J.; Lal, R. Soil structure and management: A review. Geoderma 2005, 124, 3–22. [Google Scholar] [CrossRef]
  93. Staricka, J.A.; Benoit, G.R. Freeze-drying effects on wet and dry soil aggregate stability. Soil Sci. Soc. Am. J. 1995, 59, 218–223. [Google Scholar] [CrossRef]
  94. Asgarzadeh, H.; Mosaddeghi, M.R.; Dexter, A.R.; Mahboubi, A.A.; Neyshabouri, M.R. Determination of soil available water for plants: Consistency between laboratory and field measurements. Geoderma 2014, 226, 8–20. [Google Scholar] [CrossRef]
  95. Olness, A.; Archer, D. Effect of organic carbon on available water in soil. Soil Sci. 2005, 170, 90–101. [Google Scholar] [CrossRef]
  96. Lu, S.G.; Sun, F.F.; Zong, Y.T. Effect of rice husk biochar and coal fly ash on some physical properties of expansive clayey soil (Vertisol). Catena 2014, 114, 37–44. [Google Scholar] [CrossRef]
Figure 1. Particle density (PD). Explanations: BC0—control: soil without application biochar; BC10—soil with application biochar in the dose 10 Mg × ha−1; BC20—soil with application biochar in the dose 20 Mg × ha−1; BC30—soil with application biochar in the dose 30 Mg × ha−1; 0, I, III, …, IX—sampling date (2010–2019).
Agronomy 10 01589 g001
Figure 2. Bulk density (BD). Explanations as for Figure 1.
Agronomy 10 01589 g002
Figure 3. Total porosity (TP). Explanations as for Figure 1.
Agronomy 10 01589 g003
Figure 4. Air capacity at the potential −15.5 kPa (FAC). Explanations as for Figure 1.
Agronomy 10 01589 g004
Figure 5. Air permeability at the potential −15.5 kPa (FAP). Explanations as for Figure 1.
Agronomy 10 01589 g005
Figure 6. Soil moisture at sampling (SM). Explanations as for Figure 1.
Agronomy 10 01589 g006
Figure 7. Field water capacity at the potential −15.5 kPa (FC). Explanations as for Figure 1.
Agronomy 10 01589 g007
Figure 8. Available water content (AWC). Explanations as for Figure 1.
Agronomy 10 01589 g008
Figure 9. Unavailable water content (UWC). Explanations as for Figure 1.
Agronomy 10 01589 g009
Figure 10. Ratio of field water capacity and total porosity (FC/TP). Explanations as for Figure 1.
Agronomy 10 01589 g010
Table 1. The lowest significant differences (LSD0.05) between treatments (BC0, BC10, BC20 and BC30) for dates sampling (0-IX) and studied layers (0–10 cm and 10–20 cm).
Sampling
Date
Soil Layer
(cm)
Soil Physical Properties
PDBDTPFACFAPSMFCAWCUWCFC/TP
00–10
10–20
NS
NS
NS
NS
NS
NS
NS
NS
NS
NS
NS
NS
NS
NS
NS
NS
NS
NS
NS
NS
I0–10
10–20
0.047
0.039
0.137
0.158
0.1273
0.1582
0.1382
0.0831
26.32
NS
NS
NS
0.0447
0.0714
0.0683
0.0735
0.0096
0.0081
0.143
0.123
II0–10
10–20
0.048
0.037
0.283
0.191
0.1574
0.0071
0.1284
0.0634
31.86
NS
0.0438
0.0381
NS
NS
NS
NS
0.0083
0.0098
0.139
0.117
III0–10
10–20
0.053
0.036
0.139
0.153
NS
NS
NS
NS
19.23
NS
NS
NS
NS
NS
0.0617
0.0513
0.0078
0.0076
NS
0.108
IV 0–10
10–20
0.058
0.043
NS
NS
NS
NS
NS
NS
18.11
NS
NS
NS
NS
0.0491
NS
NS
0.0073
0.0086
NS
NS
V0–10
10–20
0.049
0.042
NS
NS
NS
NS
NS
NS
33.64
30.94
0.0362
0.0413
0.0432
NS
NS
NS
0.0076
0.0073
0.105
NS
VI0–10
10–20
0.051
0.042
NS
0.153
NS

NS
0.0452
NS
34.11
16.29
NS
NS
NS
NS
NS
NS
NS
0.0066
0.128
NS
VII0–10
10–20
0.041
0.043
NS
NS
NS
NS
NS
NS
26.31
NS
NS
NS
NS
NS
NS
NS
0.0074
0.0068
NS
NS
VIII0–10
10–20
0.043
0.041
NS
NS
NS
NS
NS
NS
19.14
NS
NS
NS
NS
NS
NS
NS
0.0094
0.0073
NS
NS
IX0–10
10–20
0.049
0.044
NS
NS
NS
NS
NS
NS
NS
NS
NS
NS
NS
NS
NS
NS
0.0098
0.0084
NS
NS
Explanations: 0-IX—sampling date; PD—particle density (Mg × m−3); BD—bulk density (Mg × m−3); TP—total porosity (m3 × m−3); FAC–air capacity at the potential −15.5 kPa (m3 × m−3); FAP—air permeability at the potential −15.5 kPa (10−8 × m2 × Pa−1 × s−1); SM—soil moisture at sampling (kg × kg−1); FC—field water capacity at the potential −15.5 kPa (m3 × m−3); AWC—available water content (m3 × m−3); UWC—unavailable water content (m3 × m−3); the FC/TP ratio; NS—no significant differences.
Table 2. Mean values of soil physical properties for layers (0–10 cm and 10–20 cm) in the 2010–2019 years.
TreatmentsLayers
(cm)
Soil Physical Properties
PDBDTPFACFAPSMFCAWCUWCFC/TP
BC00–10
10–20
2.63b
2.63b
1.59ab
1.66b
0.394ab
0.370a
0.143ab
0.120a
19.1ab
7.7a
0.083a
0.087a
0.252ab
0.250ab
0.213abc
0.211abc
0.039a
0.040ab
0.64a
0.68bc
BC100–10
10–20
2.62b
2.62b
1.57ab
1.63ab
0.399ab
0.375a
0.161ab
0.133ab
30.1b
14.1a
0.087a
0.089ab
0.238a
0.242a
0.197a
0.201a
0.041abc
0.042abc
0.60a
0.64a
BC200–10
10–20
2.58a
2.59ab
1.53ab
1.62ab
0.408ab
0.377a
0.142ab
0.108a
30.2b
21.9ab
0.104bc
0.108c
0.266ab
0.269b
0.221abc
0.223c
0.045abc
0.046abc
0.65b
0.71c
BC300–10
10–20
2.57a
2.59ab
1.48a
1.54ab
0.426b
0.405ab
0.171b
0.133ab
46.5c
22.1ab
0.103ab
0.113c
0.254ab
0.272b
0.207ab
0.225c
0.047c
0.047c
0.60a
0.66bc
LSD0.050.04710.1490.04930.049715.430.02070.02950.02110.00630.048
Explanations: BC0—control: soil without application biochar; BC10; BC20; BC30—soil with application biochar in the dose 10, 20, 30 Mg × ha−1; PD—particle density (Mg × m−3); BD—bulk density (Mg × m−3); TP—total porosity (m3 × m−3); FAC—air capacity at the potential −15.5 kPa (m3 × m−3); FAP—air permeability at the potential −15.5 kPa (10−8 × m2 × Pa−1 × s−1); SM—soil moisture at sampling (kg × kg−1); FC—field water capacity at the potential −15.5 kPa (m3 × m−3); AWC—available water content (m3 × m−3); UWC—unavailable water content (m3 × m−3); the FC/TP ratio. Each letter (a, b, c) means a significant difference (treatment × layer) according to Tukey’s the lowest significant difference (LSD0.05) and see Table 1.
Table 3. Mean values of soil physical properties for treatments in the 2010–2019 years.
PropertiesTreatmentsLSD0.05
BC0BC10BC20BC30
PD (Mg × m−3)2.63b2.62ab2.59a2.58a0.043
BD (Mg × m−3)1.63b1.60b1.57ab1.51a0.114
TP (m3 × m−3)0.382a0.387a0.393ab0.416b0.0242
FAC (m3 × m−3)0.131ab0.147ab0.125a0.152b0.0253
FAP (10−8 × m2 × Pa−1 × s−1)13.4a17.1ab26.1bc34.3c15.43
SM (kg × kg−1)0.085a0.088a0.106b0.108b0.0163
FC (m3 × m−3)0.251ab0.240a0.268b0.263ab0.0246
AWC (m3 × m−3)0.212ab0.199a0.222b0.216ab0.0203
UWC (m3 × m−3)0.040a0.042a0.046b0.047b0.0032
FC/TP0.66b0.62a0.68b0.63a0.0241
Explanations as for Table 1 and Table 2.
Publisher’s Note: MDPI stays neutral with regard to jurisdictional claims in published maps and institutional affiliations.

