Article

Simulating the Impact of Long-Term Fertilization on Basic Soil Productivity in a Rainfed Winter Wheat System

1
College of Agronomy, Gansu Agricultural University, Lanzhou 730000, China
2
Gansu Provincial Key Laboratory of Aridland Crop Science, Gansu Agricultural University, Lanzhou 730000, China
3
Pingliang Academy of Agricultural Sciences, Pingliang 744000, China
4
School of Environmental and Municipal Engineering, Lanzhou Jiaotong University, Lanzhou 730070, China
*
Author to whom correspondence should be addressed.
Agronomy 2020, 10(10), 1544; https://doi.org/10.3390/agronomy10101544
Submission received: 8 September 2020 / Revised: 4 October 2020 / Accepted: 8 October 2020 / Published: 11 October 2020
(This article belongs to the Special Issue Soil Healthy in Agro-ecosystems)

Abstract

:
Basic soil productivity (BSP) is the ability of a soil, in its normal environment to support plant growth. However, the assessment of BSP remains controversial. The aim of this study is to quantify and analyze the trends of BSP in winter wheat seasons using the decision support system for agrotechnologie transfer (DSSAT) model under a long-term fertilization experiment in the dark loessal soil region of the Loess Plateau of China. In addition, we evaluated the contribution percentage of BSP to yield and its influencing factors. A long-term fertilization experiment with a winter wheat/spring maize rotation was established in 1979 in a field of the Gaoping Agronomy Farm, Pingliang, Gansu, China, including six treatments: (1) no fertilizer as a control (CK), (2) chemical nitrogen fertilizer input annually (N), (3) chemical nitrogen and phosphorus fertilizer input annually (NP), (4) straw return and chemical nitrogen fertilizer input annually plus phosphorus fertilizer added every second year (SNP), (5) manure input annually (M), and (6) M plus N and P fertilizers added annually (MNP). The application of the DSSAT-CERES-Wheat model showed a satisfactory performance with good Wilmott d-index (0.78~0.95) and normalized root mean square error (NRMSE) (7.03%~18.72%) values for the tested genetic parameters of winter wheat. After the 26-years experiment, the yield by BSP of winter wheat under the M and MNP treatment significantly increased, at the rate of 2.7% and 3.82% a year, respectively, whereas that of CK and N treatments significantly decreased, at the rate of 0.23% and 3.03%. Moreover, the average contribution percentage of BSP to yield was 47.0%, 39.4%, 56.3%, 50.0%, and 61.9% in N, NP, SNP, M, and MNP treatments, respectively. In addition, soil organic carbon contents were the main controls of BSP under the different fertilization conditions in the dark loessial soil area. As a result, the combined application of organic fertilizer or straw and chemical fertilizer can be an effective form of fertilization management to greatly enrich basic soil productivity, continually promote the contribution percentage of BSP, and ultimately increase crop yield.

1. Introduction

Fertilization is an important measure used to increase crop yields and improve soil fertility. In order to meet the needs of crop growth for obtaining high yields and quality, essential nutrients come not only from the natural supply of the soil, but must also be provided through fertilization [1,2]. Fertilizer nutrient input is responsible for at least 30 to 50 percent of the crop yield [3,4]. This is mainly due to the fact that fertilization can improve the physical, chemical, and biological properties of soil [5,6,7], and further enhance soil quality [8,9]. However, many studies have shown that improper fertilization regimes cannot only contribute little to no increases in the crop yield and quality [10], but can also introduce a series of soil quality degradation and environmental pollution problems [11,12].
The Longdong Loess Plateau, which is the most typical natural geographical regions in the Loess Plateau of China, is a typical rainfed farming region, in which the cropping systems are characterized by the rotation cropping system of winter wheat/spring maize. In this system, three or more years of continuous wheat are commonly grown and then rotated to two or more years of continuous corn [13]. Water shortages and low soil fertility are the main factors restricting the development of dryland agriculture in this region. The region is in the transition zone from a semi-arid to a semi-humid region, with average annual precipitation ranging from 350 to 600 mm. The precipitation from July to September accounts for about 60% of the annual precipitation and is mismatched with the critical water demand period of wheat or corn [14,15]. Interannually, high temporal and spatial variation in precipitation results in large fluctuations in grain yields [16,17]. Because of drought, soil erosion, and sandstorm damage, the soil quality is seriously degraded, with an average organic matter content of about 1% [18]. Moreover, over-fertilization has caused a decline in the economic benefits of production in this region [19], although fertilization for increasing yield and improving soil quality has been reported [20,21,22]. In order to ensure the stability of rainfed crop production, the further exploration of the productivity potential of dryland, while improving its soil fertility, is urgently needed.
Basic soil productivity (BSP) is defined as the production capacity of a farmland soil without water and fertilizer input for dryland or nutrient input for a paddy field in the current crop season, and under specific conditions relating to the site, physical and chemical properties of the soil profile, and the level of infrastructure of farmland. It is applied to farmland, which has been cultivated with water and fertilizer input for many years [23]. The BSP, which varies with different long-term fertilizations, reflects the basic quality and inherent land elements of the farmland, and is obviously different from soil productivity (SP), soil quality, soil fertility, and soil health, although these concepts are all closely related [24]. At present, many studies have focused on the contribution percentage of SP (the ratio of crop yields under no-fertilization conditions versus under conventional fertilization with the same field management) of cultivated land [8,25,26]. For example, Wang, et al. [27] reported that the average contribution percentage of inherent soil productivity (ISP) value for three crops (wheat, rice, and maize) was 53.8% in China. Generally, upland crops in double-cropping systems consume the most SP, whereas paddy fields are favorable for maintaining a high level of contribution percentage of SP. However, studies on the BSP change of different crops in different soils under long-term fertilization are lacking, because there have been no measured yields by BSP under different fertilization conditions in most long-term fertilizer experiments.
The decision support system for agrotechnology transfer (DSSAT) [28] is an extensively adopted cropping systems model worldwide [29,30], which has been used for analysis of crop growth process and nutritional quality [31,32,33,34,35], irrigation scheduling [36,37], yield forecasting [38,39,40], climate change analysis [41], and fertilization management [42,43]. The change in BSP in fluvo-aquic soil [23,44] and black soil [24] in China has been measured using the DSSAT model under different fertilization regimes. However, the effect of long-term fertilization on BSP and associated trends are still poorly understood in relation to a rainfed winter wheat system in the Loess Plateau of China. Moreover, calibration and validation are an essential step for all crop modeling studies, when applied under different management practices and various climatic conditions [45]. For instance, the performance of simulated BSP depends on the accuracy of the calibration and validation of crop genetic parameters, which are used to describe the characteristics of varieties and control crop growth, development, plant morphology, and yield formation in the DSSAT-CERES-Wheat model [28,30]. Therefore, the main objectives of this study were to: (1) Build a DSSAT model in this study area and evaluate its accuracy; (2) simulate the yield by BSP of winter wheat and analyze the change characteristics of BSP after long-term fertilizations in the dark loessial soil region of the Loess Plateau of China; and (3) explore the relationship between the contribution percentage of BSP to yield and soil nutrients.

2. Materials and Methods

2.1. Site Description and Experimental Design

This study was conducted at the Gaoping Agronomy Farm, Pingliang, Gansu, China (35°16′ N, 107°30′ E, 1254 m altitude). This site has a semiarid drought-prone climate, with a mean annual temperature of 8.6 °C and a mean annual precipitation of 526 mm (1979–2018), and about 60% of the rainfall occurs between July and September [21]. The initial soil properties were analyzed at the 0–15 cm depth in October 1978. The soil is a silty loam (sand 231 g kg−1, silt 432 g kg−1, and clay 336 g kg−1) classified as dark loessial soil according to the Chinese soil classification system (Calcarid Regosols according to the FAO–UNESCO system). There was a bulk density of 1.3 g cm−3, pH 8.2, 0.95 g kg−1 total N, 0.57 g kg−1 total P, 10.75 g kg−1 organic matter, 65.9 mg kg−1 available N, 6.77 mg kg−1 Olsen-P, and 163 mg kg−1 available K.
The long-term fertilization trial was conducted in 1979, and the experimental design is fully described by Fan et al. [13]. Briefly, the long-term experiment had a completely randomized block design with three replicates. The six treatments included in this study were as follows: (i) no fertilizer as a control (CK), (ii) chemical nitrogen fertilizer input annually (N), (iii) chemical nitrogen and phosphorus fertilizer input annually (NP), (iv) straw return and chemical nitrogen fertilizer input annually plus phosphorus fertilizer added every second year (SNP), (v) manure input annually (M), and (vi) M plus N and P fertilizers added annually (MNP). Granular urea (N, 46%) and superphosphate (P2O5, 12.5%) were broadcast and mixed into soil by rotary tillage (about 15 cm depth of the soil) before seeding to supply 90 kg N ha−1 and 75 kg P ha−1, respectively. Straw from crop residue in experimental plots and farmyard manure were added at rates of 3.75 t·ha−1 and 75 t·ha−1 (wet weight). As per Fan et al. [13] and E. et al. [46], we estimated that an application of 75 t ha−1 (wet weight) supplied roughly 200~330 kg C·ha−1 and 36~51 kg N·ha−1 in manure annually to crops, as well as 1687 kg·C·ha−1, 30 kg·N·ha−1, and 20 kg·N·ha−1 from corn and wheat straw application of 3.75 kg·ha−1, respectively. For the SNP treatment, the total N input was 120 kg N·ha−1 in the corn growing season and 110 kg N·ha−1 in the wheat growing season, respectively. For the MNP treatment, the total N input was 126~141 kg·N·ha−1, as well as the total C input 200~330 kg·C·ha−1. The 2-year spring maize and 4-year winter wheat were planted in rotation from 1979 to 1996 and from 2001 to 2018. The continuous winter wheat was grown from 1997 to 1998, and sorghum and soybean were grown in 1999 and 2000, respectively. There were many varieties of winter wheat during the planting periods, mainly including 80Ping8 (1981–1984 and 1987–1990), 15-0-36 (1993–1998), 85-108 (2001–2004), PL44 (2007–2010), and C6387 (2013–2016). Data for the 26 years of winter wheat are presented in this paper.

2.2. Brief Description of the DSSAT Model

2.2.1. DSSAT-CERES-Wheat Model

The DSSAT model mainly consists of five parts: databases, models, applications, support software, and the DSSAT user interface [28]. The databases are composed of weather, soil, crop genetic characteristics, pests and diseases, field management and economic benefits. The DSSAT v4.7 package provides models of 42 crops with new tools that facilitate the creation and management of experiment, soil, and weather data files. CERES-Wheat is one of the sub-models in the DSSAT model series, which was specially developed for wheat crops. Weather, soil, crop variety, and field management data are required for CERES-Wheat simulation.

2.2.2. Meteorological Data

The DSSAT model simulates the daily physiological and ecological changes of crops at a daily time step by ingoing daily solar radiation amount (SRAD), maximum temperature (Tmax), minimum temperature (Tmin), and precipitation (RAIN). These data from 1979 to 2016 were obtained from the Jinchuan meteorological station, part of China’s meteorological data service sharing network, which was 15.6 km away from the experiment site. SRAD was calculated using an empirical model based on the daily sunshine hours and related astronomical parameters of the study area [47].

2.2.3. Soil Data

Soil parameters for DSSAT model simulation mainly included: (i) The soil’s physical properties, such as soil bulk density and soil texture; (ii) the soil’s chemical properties, such as organic carbon content, soil nutrient content (N, P), cation exchange capacity, pH, etc.; (iii) the soil’s hydraulic properties, such as saturated water conductivity, saturated water content, and initial water content, etc., and (iv) others, such as the root growth factor and aspect and slope of the farmland. Considering the changes in the soil parameters during the long simulating period, the soil parameters required for the DSSAT model in 1979 and 2000 were used. Details of all soil data are shown in Table 1.

2.2.4. Crop Variety and Field Management Data

Crop cultivars, sowing date, sowing density, tillage method, time, type, rate and place of fertilization, proportion and depth of straw return, and harvest time, etc., were obtained from years of experiment records from the Gaoping dark loessial soil fertility monitoring station.

2.3. Model Building and Simulation

A weather data file (1979–2016), soil profile data file (1979 and 2000), cultivar-specific file (1981–2016 for winter wheat), winter wheat management data file, and an experimental observation data file were created. The continuous simulation period began in 1981, covering a period of 26 years, including the continuous winter wheat from 1997 to 1998, although sorghum and soybean in 1999 and 2000 were not included in the simulation.

2.4. Model Calibration and Evaluation

Based on field observations of grain yield of winter wheat in the SNP treatment, crop genetic parameters (P1V, P1D, P5, G1, G2, G3, and PHINT) of winter wheat were estimated using the DSSAT-GLUE package [48,49], combined with traditional trial-and-error methods [50]. After the genetic parameters of winter wheat varieties were finally determined, they were used to simulate and validate the yield of CK, N, NP, M, and MNP treatments.
The normalized root mean square error (NRMSE) [51] and the Wilmot d-index [52] were used to test the performance of the model. The values of the NRMSE and the d-index determine the ability of the model to accurately predict the experimental data. The equations for the NRMSE and the d index are as follows:
N R M S E = i = 1 n ( S i Q i ) 2 n × 100 Q ¯
d = 1 [ i = 1 n ( S i Q i ) 2 i = 1 n ( | S i | + | Q i | ) 2 ]
where n is the number of observations, Si is the predicted observation, Qi is a measured observation, and Si′ = Si Q ¯ , Qi′ = Qi Q ¯ ( Q ¯ is the mean of the observed variable). The model simulations are considered excellent, good, fair, and poor, based on the NRMSE values of <10%, 10–20%, 20–30%, and >30% proposed by Loague and Green [53]. A d index is between 0 and 1 and a higher d index indicates good agreement between simulated and observed values [54].

2.5. Simulation Method of BSP

Based on the calibrated genetic parameters of winter wheat, the yield by BSP was simulated by setting the special year without fertilization. For example, the continuous simulation period began in 1981, covering a period of 26 years in our study. When the yield by BSP in 2010 is simulated, the meteorological, soil, crop variety, and field management data, etc., from 1981 to 2009 remain unchanged, but fertilization in 2010 is set to be zero [44].

2.6. Contribution Percentage of BSP

The contribution percentage of BSP was calculated using the following Equation [23]:
C o n t r i b u t i o n   p e r c e n t a g e   o f   B S P   ( % ) = S i m u l a t e d   y i e l d   b y   B S P M e a s u r e d   y i e l d   i n   c o r r e s p o n d i n g   f e r t i l i z a t i o n × 100

2.7. Statistical Analysis

The statistical analysis was conducted using SPSS 19.0 (SPSS software, Beijing, China). The contribution percentage of BSP between treatments was compared with the least significant difference (LSD) (p < 0.05) using one-way analysis of variance. The rates of changes in BSP of different fertilization treatments with years are presented by the slope of the linear regression equation. R-squared represents the coefficient of determination. Pearson correlation analysis was used to investigate the correlations between the contribution percentage of BSP and soil fertility factors.

3. Results

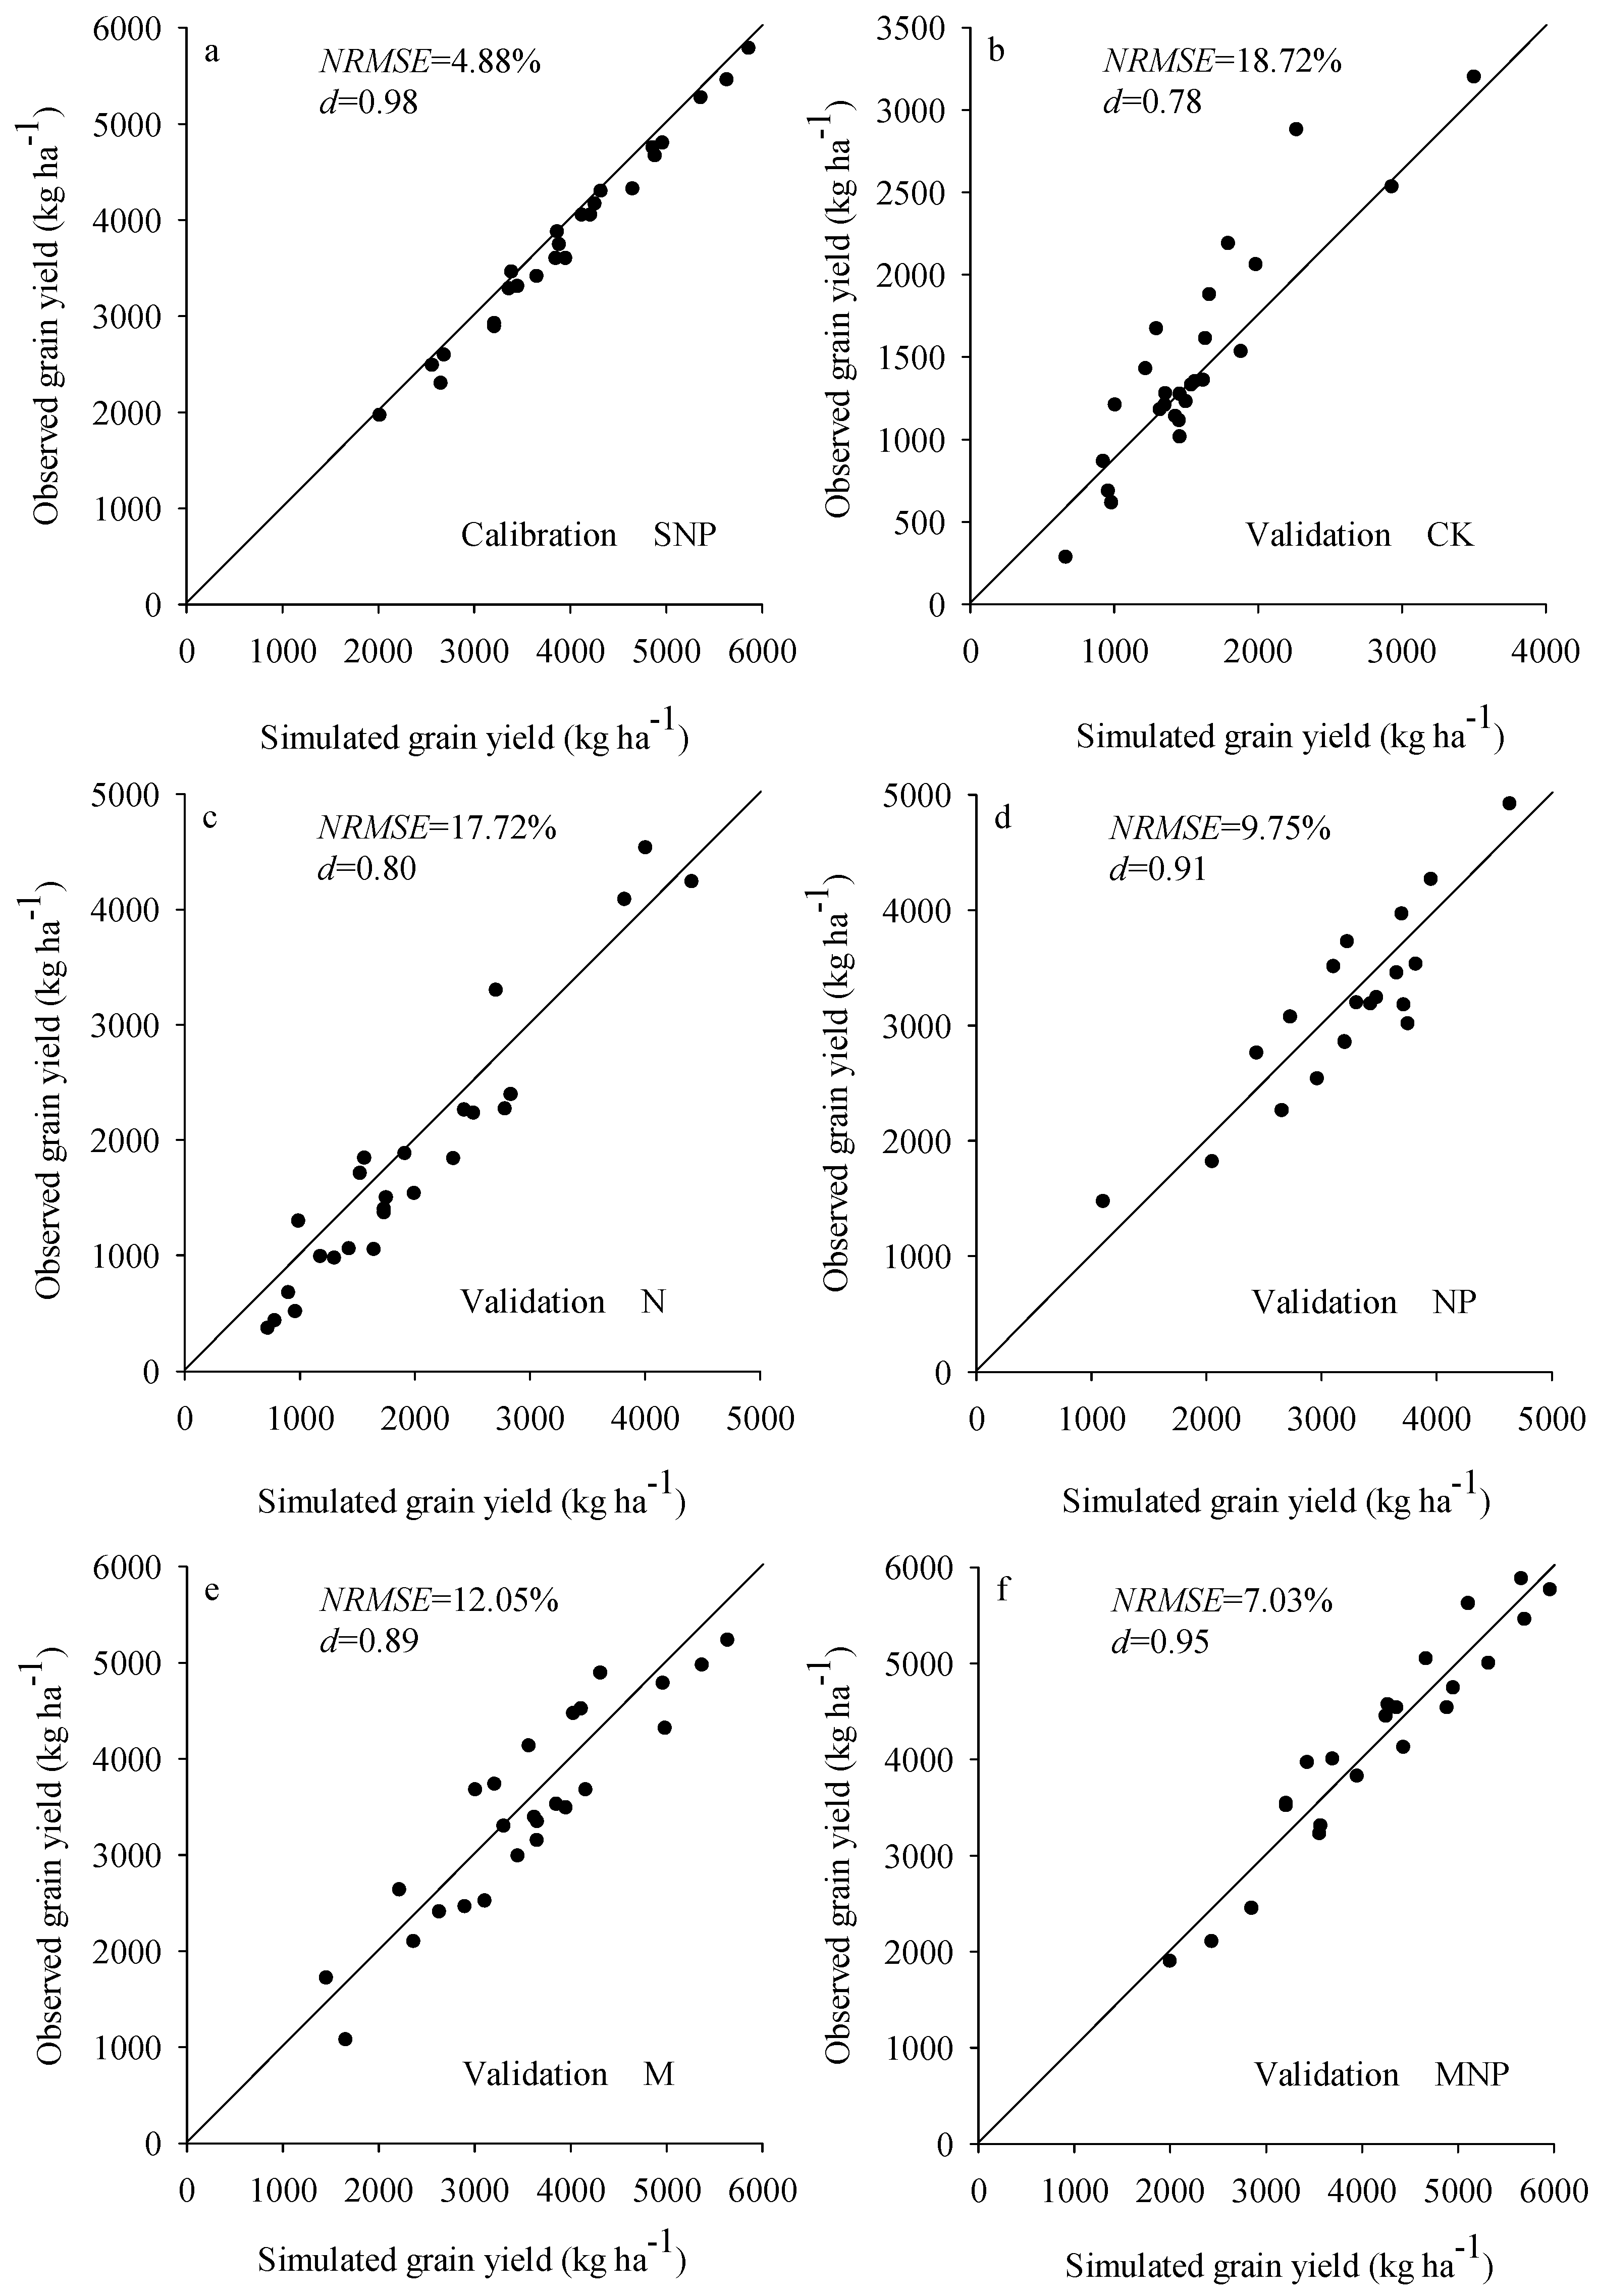
3.1. Calibration and Validation of Crop Genetic Parameters

Calibration results showed that the model performance was considered good according to an NRMSE of 4.88% and a d-value of 0.98 (Figure 1a), although the model overestimated the grain yield in SNP treatment and the averages of the observed and simulated grain yields were 3887 and 4046 kg ha−1, respectively. The genetic parameters of the different winter wheat cultivars are listed in Table 2. P1V, P5, and G3 varied remarkably under different cultivars of winter wheat, with coefficients of variation of 18.87%, 11.09%, and 14.24%, respectively. P1D, G1, G2, and PHINT were relatively independent of winter wheat cultivars since the coefficients of variation were all less than 10%.
Validation results indicate a good agreement between simulated and observed winter wheat grain yield of the different treatments, with a range of NRMSE and d-values of 7.03%~18.72% and 0.78~0.95, respectively (Figure 1b–f). Compared with N, NP, M, and MNP treatment, the simulated performance for CK was the lowest with an NRMSE of 18.72% and a d-value of 0.78, respectively, followed by N, M, and NP treatment with NRMSE values of 17.72%, 12.05%, and 9.75% and d-values of 0.80, 0.89, 0.91, respectively. The simulated performance for MNP was the best, with the lowest NRMSE of 7.03% and the highest d-value of 0.95, relative to the other treatments. These results indicated that the CERES-Wheat model could be reliably used for predicting wheat grain yield and basic soil productivity, supported by the obtained statistics in our study.

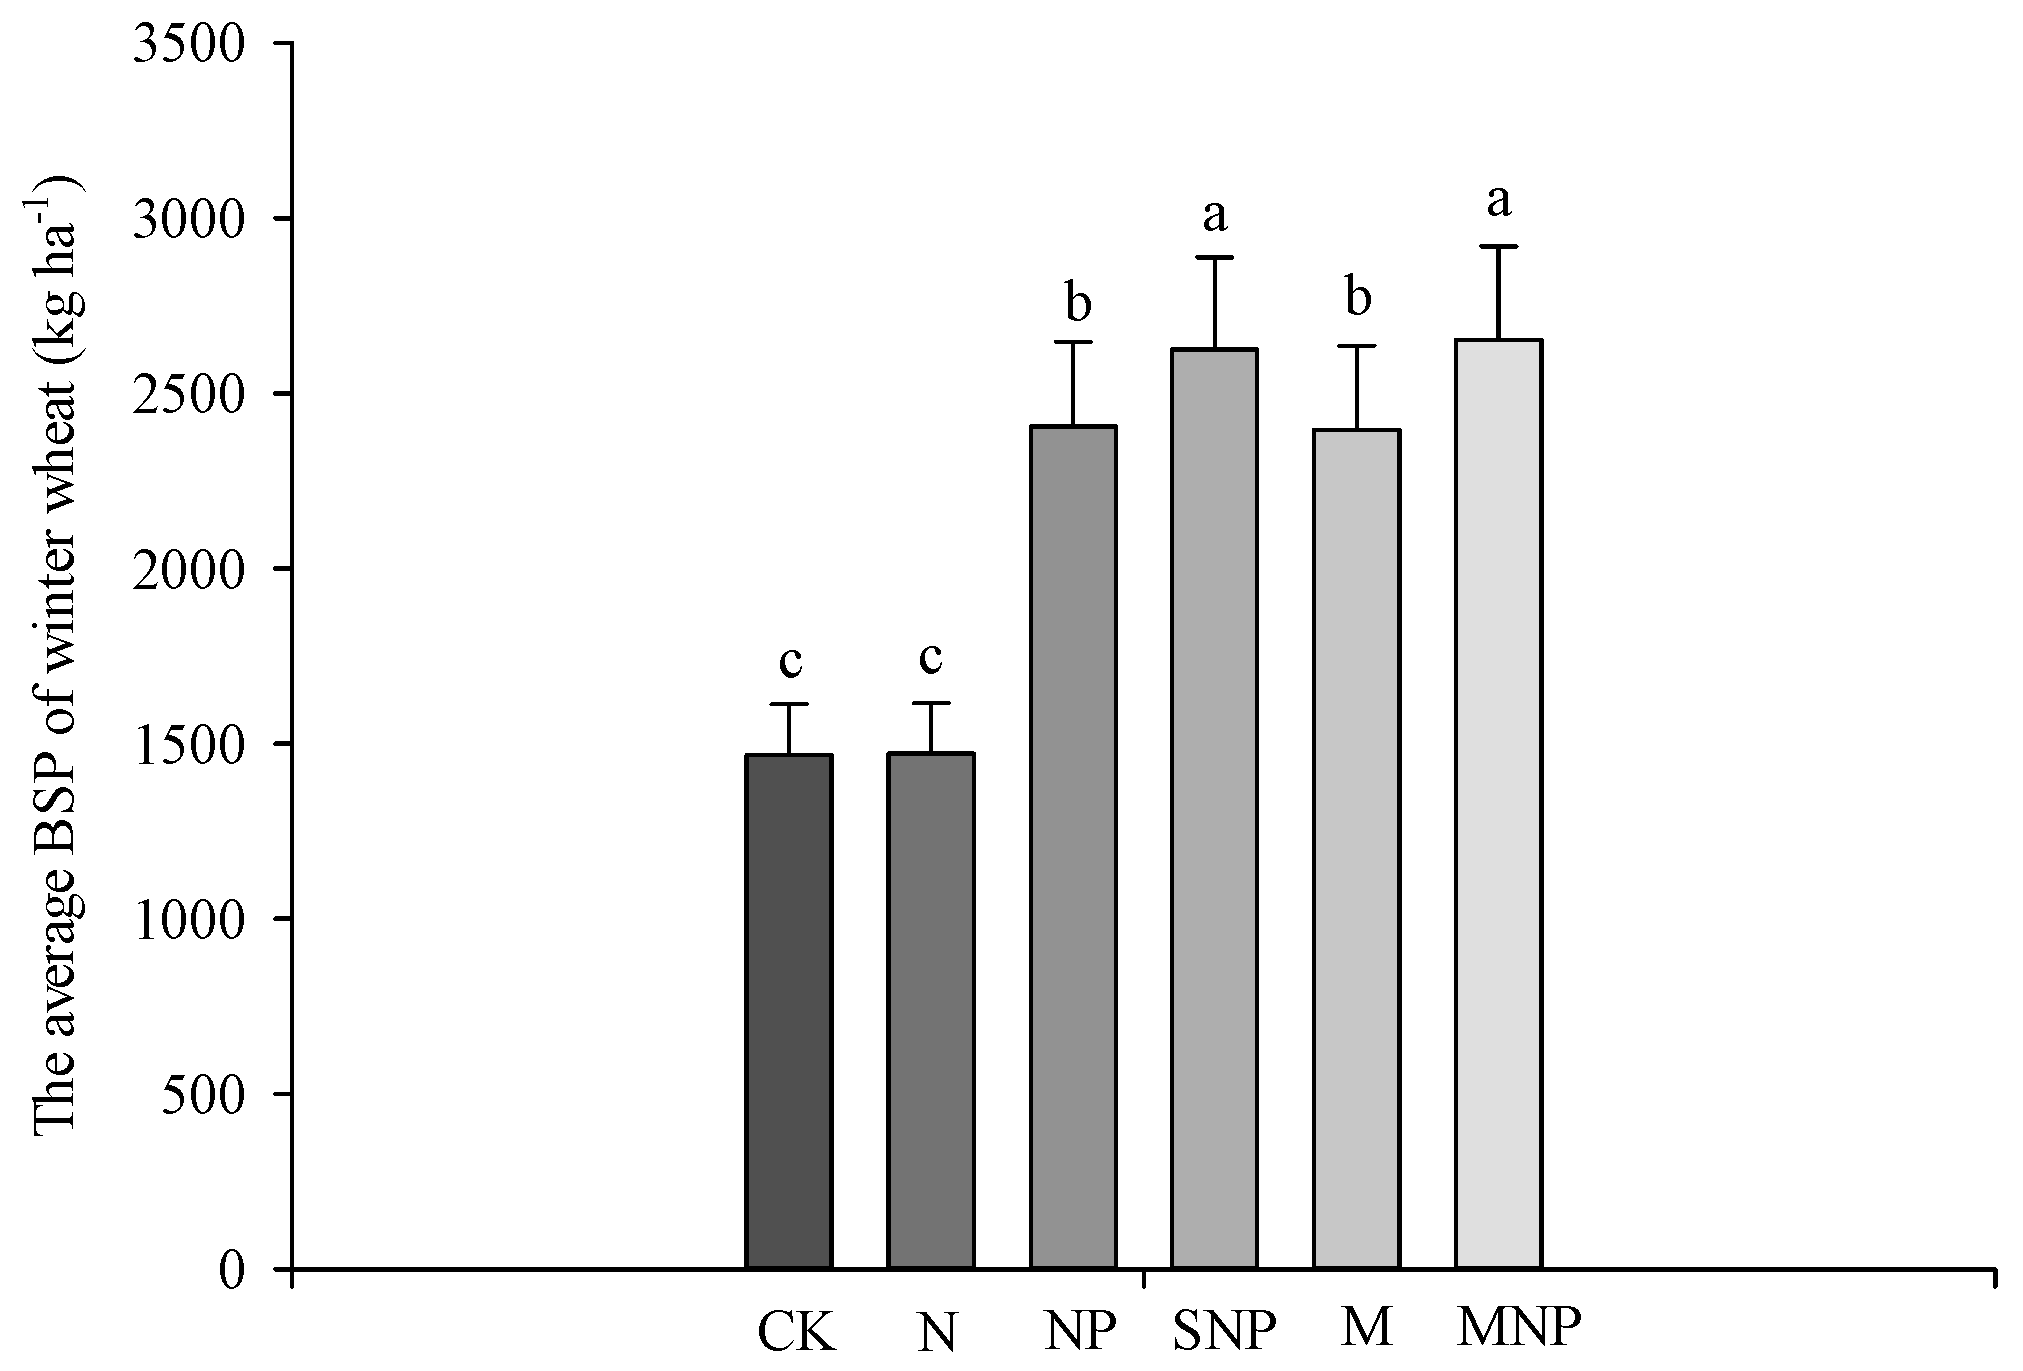
3.2. Basic Soil Productivity

The BSP of winter wheat under the different fertilization treatment fluctuated generally in a six year cycle, with an increasing trend in the first four years (the winter wheat season) and then a decreasing trend in the last two years (the maize season) (Figure 2), which indicated that the nutrients required for maize growth were provided more by BSP than that for winter wheat growth. During the 26-year period, the yield by BSP of CK and N treatment significantly decreased, at the rate of 0.23% (R2 = 0.168, p < 0.05) and 3.03% (R2 = 0.234, p < 0.05) per year, and declined by 5.7% and 53.7% in 2016 from that of the initial experiment (1981), respectively. The yield by BSP of M and MNP treatment significantly increased, by 2.7% (R2 = 0.224, p < 0.05) and 3.82% (R2 = 0.349, p < 0.01) per year, respectively. However, that of NP and SNP increased at a rate of 3.17% (R2 = 0.065, p > 0.05) and 3.74% (R2 = 0.113, p > 0.05) per year, respectively (Table 3), although this was not statistically significant. Compared to that of the initial experiment, the yield by BSP of NP, SNP, M, and MNP treatment increased by 117.98%, 150.33%, 94.71%, and 155.14% in 2016, respectively.
The average yield of BSP with either organic manure or straw combined with chemical fertilizer or mixed fertilizer, was significantly higher than that of no-fertilization or single fertilizer (Figure 3). The average yield of BSP under the SNP and MNP treatment was significantly higher than that of the CK, N, NP, and M treatments (p < 0.05). There was no significant difference in the average yield of BSP between SNP and MNP or between NP and M (p > 0.05).

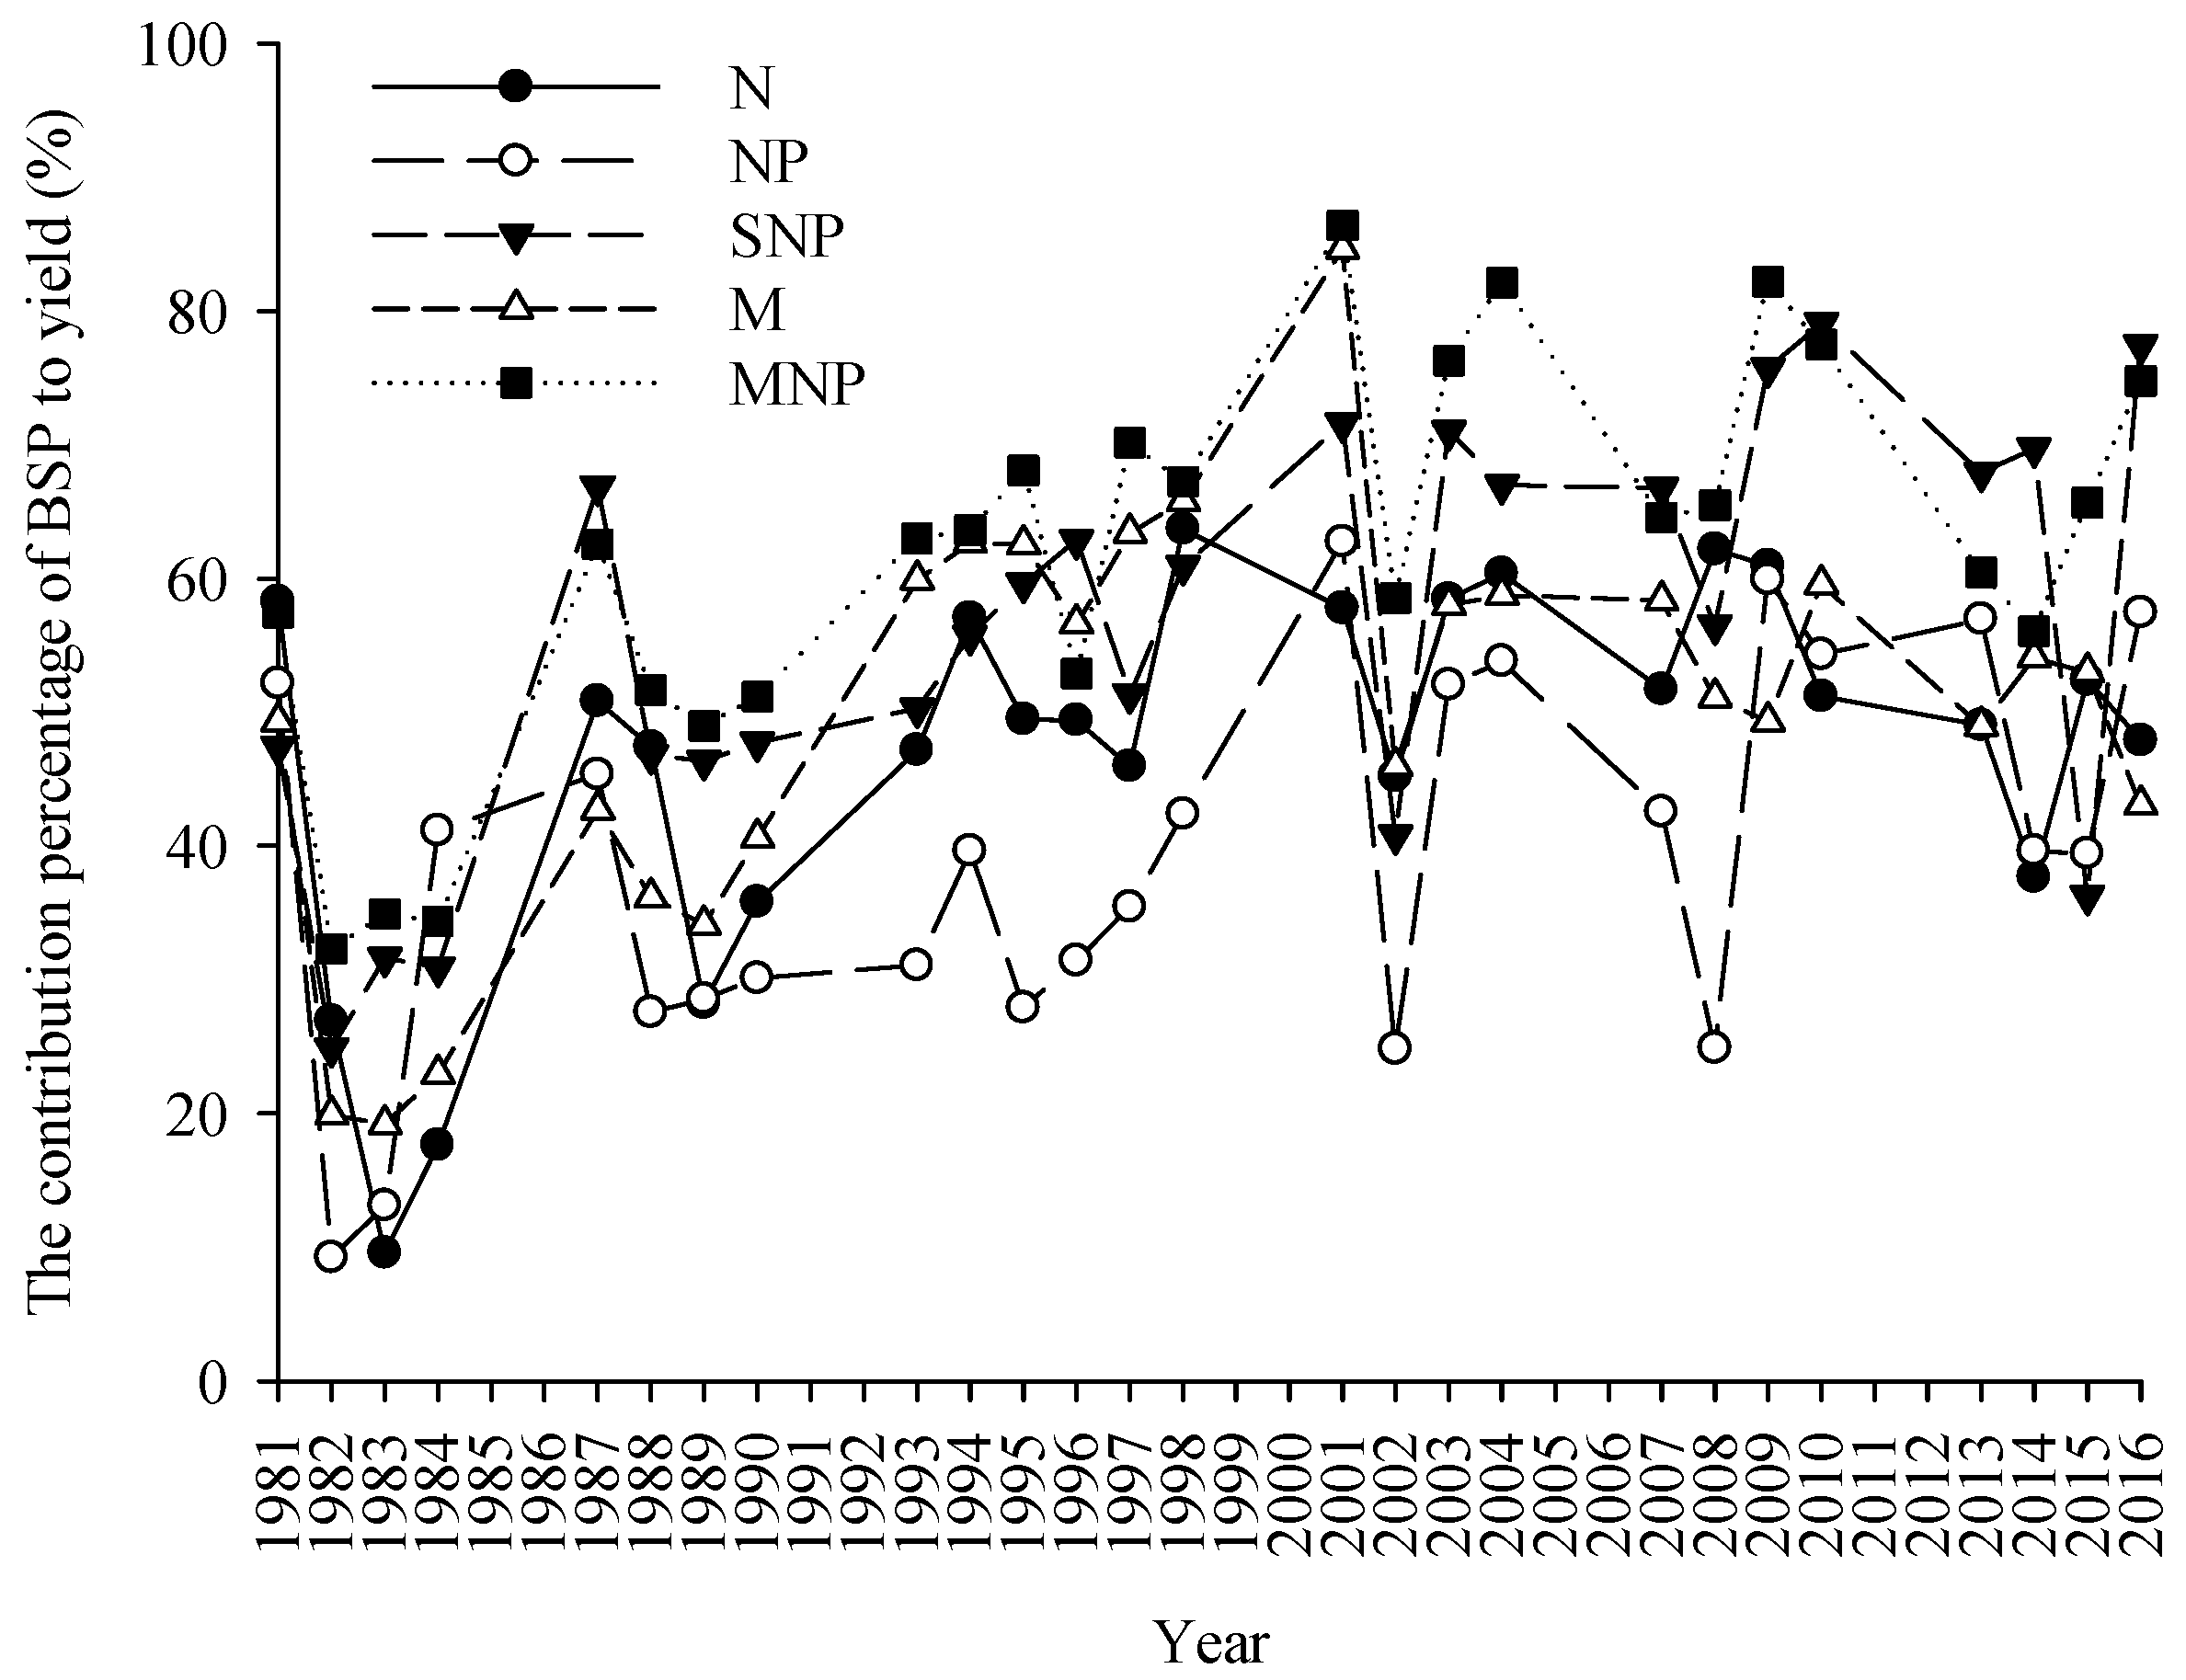
3.3. The Contribution Percentage of BSP

From 1981 to 2016, the contribution percentage of BSP to yield under the different fertilization treatments fluctuated with time and generally showed an increasing trend, except for some special years (Figure 4). The contribution percentage of BSP to yield under the N, NP, SNP, M and MNP treatments was in the range of 26.9%~63.7%, 9.2%~62.8%, 24.9%~77.5%, 19.2%~62.7%, and 32.3%~77.5%, respectively. There was a significant difference in the contribution percentage of BSP among different fertilization treatments, with mean values of 47.02% ± 10.28%, 39.37% ± 16.31%, 56.3% ± 16.84%, 50.04% ± 12.71%, and 61.88% ± 14.36% in N, NP, SNP, M, and MNP treatment (Table 4). The highest average contribution percentage of BSP occurred in MNP treatment, compared to N, NP, SNP, and M treatment (p < 0.05). Similarly, that of SNP was higher than N, NP, and M treatment p < 0.05). No significant difference was found between N and M treatment (p > 0.05).

3.4. The Relationship between the Contribution Percentage of BSP and Soil Nutrients

Except for available nitrogen (R2 = 0.080, p > 0.05), the contribution percentage of BSP was positively correlated with soil organic carbon (R2 = 0.319, p < 0.01), total nitrogen (R2 = 0.080, p < 0.01), total potassium (R2 = 0.049, p < 0.05), available phosphorus (R2 = 0.228, p < 0.01), and available potassium (R2 = 0.092, p < 0.01) (Figure 5). The relationship between the contribution percentage of BSP and soil nutrients under the different fertilization treatment were further analyzed (Table 5). There were significant positive correlations between the contribution percentage of BSP and soil organic carbon under the NP (r = 0.469, p < 0.05), SNP (r = 0.560, p < 0.01), M (r = 0.539, p < 0.01), and MNP (r = 0.693, p < 0.01) treatments, as well as available potassium under the SNP (r = 0.430, p < 0.05), M (r = 0.471, p < 0.05), and MNP (r = 0.647, p < 0.01) treatments and available potassium under the MNP (r = 0.594, p < 0.01) treatment, whereas negative correlations were observed between the contribution percentage of BSP and available nitrogen under the N (r = −0.484, p < 0.05) and M (r = −0.439, p < 0.05) treatment, as well as available potassium under the N (r = −0.460, p < 0.05) treatment. No correlation was found between the contribution percentage of BSP and the rest of the soil nutrients under the different treatments, such as total nitrogen and total potassium.

4. Discussion

4.1. Accuracy of Simulated BSP by DSSAT

In this study, frequent changes in winter wheat varieties during the 26-year period were taken into account when calibrating crop genetic parameters. P1V, P1D, P5, G1, G2, G3, and PHINT of different varieties of winter wheat were in the ranges of 42.87~73.34 d, 90.24~98.45%, 584.5~756.4 °C d, 15.01~18.78 no·g−1, 38.77~47.54 mg, 1.426~1.929 g, and 85~99 °C d, respectively, which were in line with those reported in this region [32]. These values are in the range of other published works, such as that of Yao et al. [55] who obtained ranges of 5~65 d, 0~95%, 300~800 °C d, 15~30 no·g−1, 20~65 mg, 1~2 g, and 60~100 °C d in the Loess Plateau of northwestern China, respectively. However, the range of our values were inconsistent with other studies that have reported in a range of 9.1~19.6 d, 38.8~79%, 557~685.3 °C d, 15.4~30 no·g−1, 43.8~65 mg, 1~2 g, and 95 °C d in the Huang-Huai- Hai Plain of China [41], as well as ranges of 8.9~62.3 d, 19.1~94.5%, 539.8~690.7 °C·d, 17.1~21.8 no·g−1, 25.4~37.6 mg, 1~2 g, and 60~95 °C d in the middle and lower reaches of the Yangtze River of China [56]. Further analysis found that the variation coefficients of P1V (CV = 18.87%), P5 (CV = 11.09%), and G3 (CV = 14.24%) were higher than those of P1D (CV = 3.25%), G1 (CV = 9.63%), G2 (CV = 9.27%), and PHINT (CV = 6.11%). The reason is that the values of P1V, P5, and G3 were affected by genotype-environment interaction effects [55], which involve the varieties of winter wheat, different hydrological years, and high temperature in the grain filling stage during the 26-year period.
Although the current study showed that the CERES-Wheat model predicted values of grain yield that were slightly higher to the observed ones, the outputs of the crop model indicated a satisfactory performance with good values of the d-index (0.78~0.95) and the NRMSE (7.03~18.72%) for the tested parameters, showing that the CERES-Wheat cultivars were successfully calibrated in the study area with a reliable result. Yao et al. [55] reported that the overall error was about 15%~18% for the CERES-Wheat model to simulate winter wheat growth and yield under different water stress scenarios in arid and semi-arid areas in China. Previous studies found that the low accuracy of the model occurred in water stress at different growth stages [57], mainly because the CERES-Wheat model could not correctly simulate the phenological discrepancies caused by different water stress scenarios [58] and evapotranspiration estimated by static crop coefficient value [59]. Therefore, it is necessary to further calibrate the model parameters under different water stress conditions because of the differing hydrological conditions in different years in this region, in order to improve the universality and accuracy of the CERES-Wheat model.

4.2. The Effect of Long-Term Fertilization on Basic Soil Productivity

To date, the assessment of BSP remains controversial. Many studies have reported that the yield in the no-fertilization (CK) conditions of the long-term fertilization experiment was usually used to reflect BSP and calculate the contribution percentage of BSP [8,26,27]. Gu et al. [60] quantitatively evaluated soil productivity in China’s black soil region using a soil productivity index model. In this study, according to the concept of BSP defined by experts from the National 973 Program of China (2011CB100501) [23], we simulated the yield of winter wheat in no-fertilization conditions in the special crop season using the DSSAT-CERES-Wheat model to evaluate BSP, rather than the yield in long-term no-fertilization (CK). In this way, the obtained value can comprehensively reflect the level and change of BSP with different fertilization treatments.
Throughout the 26-year experiment, the yield by BSP of winter wheat under NP, SNP, M, and MNP treatment significantly increased at the rate of 3.17%, 3.74%, 2.7%, and 3.82% a year, respectively, whereas that of CK and N treatment decreased at the rate of 0.23% and 3.03%. Similarly, Gong et al. [23] reported that the yields by BSP of NPK, NPKM, 1.5NPKM, and NPKS treatments increased with average annual increasing rates of 1.6%, 2.4%, 4.8%, and 3.0% throughout the 18-year fertilization management in fluvo-aquic soil of China, respectively. Our results prove that the rational long-term fertilization management did improve BSP. On the contrary, the BSP of the long-term no-fertilization (CK) and single N fertilizer treatment resulted in the continuous depletion of soil nutrients. Therefore, it would be inaccurate to calculate the contribution percentage of BSP by using the yield of no-fertilizer treatment in a long-term fertilization experiment. In addition, the average contribution percentage of BSP to yield was 47.0%, 39.4%, 56.3%, 50.0%, and 61.9% in N, NP, SNP, M, and MNP treatments, respectively, results which are analogous to those of Gong et al. [23] and Tang et al. [61]. This result indicates that compared to single chemical fertilizer, manure or straw residue combined with inorganic fertilizers significantly improved the BSP contribution to the yield of winter wheat in dark loessial soil.

4.3. The Effect of Soil Nutrients on the Contribution Percentage of BSP

In this study, the contribution percentage of BSP was positively correlated with soil organic carbon, total nitrogen, total potassium, available phosphorus, and available potassium. Gong et al. [23] reported that soil organic carbon and total nitrogen content were the main controller of BSP in the fluvo-aquic soil area in Northern China. Zha et al. [24] found that the contribution percentage of BSP was significantly correlated with the soil organic matter, total nitrogen, total phosphorus, or available phosphorus, but not with available nitrogen, total potassium, and available potassium in black soil in Northeastern China. However, Tang et al. [61] pointed that the contribution percentage of BSP to wheat was affected by the ability to supply potassium to the soil in North China. In fact, the contribution percentage of BSP was comprehensively affected by climate, soil and cultivation management [62]. In our study, climate and cultivation management were relatively constant; the contribution percentage of BSP under the treatments was mainly affected by fertilization. Obviously, C and N supplementation in MNP and SNP treatment was more than that in N, NP, and M treatment. Nitrogen and organic carbon in organic fertilizers can be divided into unstable and stable components. The former can be decomposed quickly to release mineral nutrients in the growing season, whereas the latter can be mineralized slowly and have a longer holding time in the soil. Therefore, the long-term continuous application of organic fertilizers had a cumulative effect of improving soil fertility [63]. The increased contribution percentage of BSP in the SNP and MNP treatment were affected by the type and rate of organic and inorganic fertilizer application. For example, the increased contribution percentage of BSP was found in the MNP treatment because of a larger amount of manure applied, combined with N and P fertilizer, whereas in SNP treatment, this was due to a larger amount of straw applied with N and P fertilizer. The difference in the average contribution rate of BSP under the SNP and MNP treatments in this study showed the performance of manure or straw combined with N and P fertilizer in relation to BSP was better than that of N, NP, and M fertilizer. Thus, the combined application of organic fertilizer and chemical fertilizer can be the most reasonable fertilization option, which can improve the soil nutrients, especially soil organic carbon, and promote the contribution of BSP to yield.

5. Conclusions

This study evaluated the trends and factors influencing basic soil productivity in winter wheat seasons under different long-term fertilization conditions using the DSSAT model, based on long-term soil fertility monitoring experiments in the Longdong Loess Plateau, China. The application of the DSSAT-CERES-Wheat model showed a satisfactory performance with good values of d-index (0.78~0.95), and NRMSE (7.03~18.72%) values for the tested genetic parameters of winter wheat cultivars. Furthermore, the calibrated and validated CERES-Wheat model well simulated yields by BSP of winter wheat and calculated the contribution percentage of BSP. The results showed that the yield by BSP of winter wheat under the NP, SNP, M, and MNP treatments increased during the 26-years of the experiment, although CK and N treatment did not. Moreover, the contribution percentage of BSP to yield under the SNP and MNP treatments was higher than that of the N, NP, and M treatments. Soil organic carbon content was the main controller of BSP under the different fertilization conditions in the dark loessial soil area. Therefore, the combined application of manure or straw and chemical fertilizer can be an effective method of fertilization management, and can be used to greatly enrich the basic soil productivity, continually promoting the contribution percentage of BSP and ultimately increasing crop yield.

Author Contributions

Conceptualization, writing—original draft preparation T.W.; supervision, Q.C., X.D.; data curation, N.D., L.L.; software, X.L. All authors have read and agreed to the published version of the manuscript.

Funding

This research was funded by the National Natural Science Foundation of China (31560584) And The APC was funded by Agricultural Science and Technology Innovation Special Programs of Gansu Academy of Agricultural Sciences (2017GAAS26).

Acknowledgments

The work was supported by the National Natural Science Foundation of China (31560584). We are grateful to the staff of the Pingliang Experimental Station for their technical assistance.

Conflicts of Interest

The authors declare no conflict of interest.

References

  1. van der Bom, F.; Magid, J.; Jensen, L.S. Long-term P and K fertilisation strategies and balances affect soil availability indices, crop yield depression risk and N use. Eur. J. Agron. 2017, 86, 12–23. [Google Scholar] [CrossRef]
  2. Wang, Z.-H.; Li, S.-X.; Malhi, S. Effects of fertilization and other agronomic measures on nutritional quality of crops. J. Sci. Food Agric. 2008, 88, 7–23. [Google Scholar] [CrossRef]
  3. Erisman, J.W.; Sutton, M.A.; Galloway, J.; Klimont, Z.; Winiwarter, W. How a century of ammonia synthesis changed the world. Nat. Geosci. 2008, 1, 636–639. [Google Scholar] [CrossRef]
  4. Shang, Q.; Ling, N.; Feng, X.; Yang, X.; Wu, P.; Zou, J.; Shen, Q.; Guo, S. Soil fertility and its significance to crop productivity and sustainability in typical agroecosystem: A summary of long-term fertilizer experiments in China. Plant Soil 2014, 381, 13–23. [Google Scholar] [CrossRef]
  5. Geisseler, D.; Scow, K.M. Long-term effects of mineral fertilizers on soil microorganisms—A review. Soil Biol. Biochem. 2014, 75, 54–63. [Google Scholar] [CrossRef]
  6. Cai, A.; Xu, H.; Duan, Y.; Zhang, X.; Ashraf, M.N.; Zhang, W.; Xu, M. Changes in mineral-associated carbon and nitrogen by long-term fertilization and sequestration potential with various cropping across China dry croplands. Soil Tillage Res. 2021, 205, 104725. [Google Scholar] [CrossRef]
  7. Edmeades, D.C. The long-term effects of manures and fertilisers on soil productivity and quality: A review. Nutr. Cycl. Agroecosyst. 2003, 66, 165–180. [Google Scholar] [CrossRef]
  8. Yan, J.; Han, X.; Chen, X.; Lu, X.; Chen, W.; Wang, E.; Zou, W.; Zhang, Z. Effects of Long-Term Fertilization Strategies on Soil Productivity and Soybean Rhizobial Diversity in a Chinese Mollisol. Pedosphere 2019, 29, 784–793. [Google Scholar] [CrossRef]
  9. Wachter, J.M.; Painter, K.M.; Carpenter-Boggs, L.A.; Huggins, D.R.; Reganold, J.P. Productivity, economic performance, and soil quality of conventional, mixed, and organic dryland farming systems in eastern Washington State. Agric. Ecosyst. Environ. 2019, 286, 106665. [Google Scholar] [CrossRef]
  10. Albornoz, F. Crop responses to nitrogen overfertilization: A review. Sci. Hortic. 2016, 205, 79–83. [Google Scholar] [CrossRef]
  11. Norse, D.; Ju, X. Environmental costs of China’s food security. Agric. Ecosyst. Environ. 2015, 209, 5–14. [Google Scholar] [CrossRef]
  12. Guo, J.H.; Liu, X.J.; Zhang, Y.; Shen, J.L.; Han, W.X.; Zhang, W.F.; Christie, P.; Goulding, K.W.T.; Vitousek, P.M.; Zhang, F.S. Significant Acidification in Major Chinese Croplands. Science 2010, 327, 1008. [Google Scholar] [CrossRef] [PubMed] [Green Version]
  13. Fan, T.; Stewart, B.A.; Yong, W.; Junjie, L.; Guangye, Z. Long-term fertilization effects on grain yield, water-use efficiency and soil fertility in the dryland of Loess Plateau in China. Agric. Ecosyst. Environ. 2005, 106, 313–329. [Google Scholar] [CrossRef]
  14. Deng, H.; Zhang, H.; Xiao, R.; Zhang, Y.; Tian, J.; Li, F.; Wang, Y.; Zhou, H.; Li, X. Effects of different covering planting patterns on soil moisture, temperature characteristics and Maize yield in semi-arid region of the Loess Plateau. Sci. Agric. Sin. 2020, 53, 273–287. [Google Scholar] [CrossRef]
  15. Li, X.; Ni, S.; Wang, L. Relationship between rainfall variation with yield and growth of winter wheat in Loess Plateau of east Gansu Province. Agric. Res. Arid Areas 2013, 31, 28–31. [Google Scholar]
  16. Guo, S.; Zhu, H.; Dang, T.; Wu, J.; Liu, W.; Hao, M.; Li, Y.; Syers, J.K. Winter wheat grain yield associated with precipitation distribution under long-term nitrogen fertilization in the semiarid Loess Plateau in China. Geoderma 2012, 189, 442–450. [Google Scholar] [CrossRef]
  17. Fan, T.; Wang, S.; Xiaoming, T.; Luo, J.; Stewart, B.A.; Gao, Y. Grain yield and water use in a long-term fertilization trial in Northwest China. Agric. Water Manag. 2005, 76, 36–52. [Google Scholar] [CrossRef]
  18. E, S.; Ding, N.; Li, L.; Yuan, J.; Che, Z.; Zhou, H.; Shang, L. Contribution of fertilization to accumulative crop yield and soil fertility in Heilu Soil region of the Loess Plateau. ACTA Pedol. Sin. 2019, 56, 195–206. [Google Scholar]
  19. Guo, S.; Wu, J.; Dang, T.; Liu, W.; Li, Y.; Wei, W.; Keith Syers, J. Impacts of fertilizer practices on environmental risk of nitrate in semiarid farmlands in the Loess Plateau of China. Plant Soil 2010, 330, 1–13. [Google Scholar] [CrossRef]
  20. Zhang, Y.; Wang, R.; Wang, H.; Wang, S.; Wang, X.; Li, J. Soil water use and crop yield increase under different long-term fertilization practices incorporated with two-year tillage rotations. Agric. Water Manag. 2019, 221, 362–370. [Google Scholar] [CrossRef]
  21. Wang, T.; Ding, N.; Li, L.; Zhou, H.; Shang, L. Combining chemical fertilizer with organic manure or straw increase the yield stability and sustainability of maize and wheat in Loess Plateau of east Gansu Province. J. Plant Nutr. Fertil. 2019, 25, 1817–1826. [Google Scholar]
  22. Johnston, A.E.; Poulton, P.R. The importance of long-term experiments in agriculture: Their management to ensure continued crop production and soil fertility; the Rothamsted experience. Eur. J. Soil. Sci. 2018, 69, 113–125. [Google Scholar] [CrossRef] [PubMed] [Green Version]
  23. Gong, F.; Zha, Y.; Wu, X.; Huang, S.; Xu, M.; Zhang, H.; Liu, H.; Jiang, Z.; Wang, X.; Cai, D. Analysis on basic soil productivity change of winter wheat in fluvo-aquic soil under long-term fertilization. Trans. Chin. Soc. Agric. Eng. 2013, 29, 120–129. [Google Scholar]
  24. Zha, Y.; Wu, X.; He, X.; Zhang, H.; Gong, F.; Cai, D.; Zhu, P.; Gao, H. Basic Soil Productivity of Spring Maize in Black Soil Under Long-Term Fertilization Based on DSSAT Model. J. Integr. Agric. 2014, 13, 577–587. [Google Scholar] [CrossRef]
  25. Wang, J.-Y.; Yan, X.-Y.; Gong, W. Effect of Long-Term Fertilization on Soil Productivity on the North China Plain. Pedosphere 2015, 25, 450–458. [Google Scholar] [CrossRef]
  26. Liu, K.; Han, T.; Huang, J.; Zhang, S.; Gao, H.; Zhang, L.; Shah, A.; Huang, S.; Zhu, P.; Gao, S.; et al. Change of soil productivity in three different soils after long-term field fertilization treatments. J. Integr. Agric. 2020, 19, 848–858. [Google Scholar] [CrossRef]
  27. Wang, S.; Wang, J.; Zhao, Y.; Ren, Y.; Xu, M.; Zhang, S.; Lu, C. Assessment of the contribution percentage of inherent soil productivity of cultivated land in China. J. Integr. Agric. 2019, 18, 2619–2627. [Google Scholar] [CrossRef]
  28. Jones, J.W.; Hoogenboom, G.; Porter, C.H.; Boote, K.J.; Batchelor, W.D.; Hunt, L.A.; Wilkens, P.W.; Singh, U.; Gijsman, A.J.; Ritchie, J.T. The DSSAT cropping system model. Eur. J. Agron. 2003, 18, 235–265. [Google Scholar] [CrossRef]
  29. Hoogenboom, G.; Porter, C.H.; Shelia, V.; Boote, K.J.; Singh, U.; White, J.W.; Hunt, L.A.; Ogoshi, R.; Lizaso, J.I.; Koo, J.; et al. Decision Support System for Agrotechnology Transfer (DSSAT) Version 4.7 (www.DSSAT.net); DSSAT Foundation: Gainesville, FL, USA, 2017. [Google Scholar]
  30. Hoogenboom, G.; Porter, C.H.; Boote, K.J.; Shelia, V.; Wilkens, P.W.; Singh, U.; White, J.W.; Asseng, S.; Lizaso, J.I.; Moreno, L.P.; et al. The DSSAT crop modeling ecosystem. In Advances in Crop Modeling for a Sustainable Agriculture; Boote, K.J., Ed.; Burleigh Dodds Science Publishing: Cambridge, UK, 2019. [Google Scholar]
  31. Jiang, T.; Liu, J.; Gao, Y.; Sun, Z.; Chen, S.; Yao, N.; Ma, H.; Feng, H.; Yu, Q.; He, J. Simulation of plant height of winter wheat under soil Water stress using modified growth functions. Agric. Water Manag. 2020, 232, 106066. [Google Scholar] [CrossRef]
  32. Jiang, T.; Dou, Z.; Liu, J.; Gao, Y.; Malone, R.W.; Chen, S.; Feng, H.; Yu, Q.; Xue, G.; He, J. Simulating the Influences of Soil Water Stress on Leaf Expansion and Senescence of Winter Wheat. Agric. For. Meteorol. 2020, 291, 108061. [Google Scholar] [CrossRef]
  33. Gao, Y.; Wallach, D.; Liu, B.; Dingkuhn, M.; Boote, K.J.; Singh, U.; Asseng, S.; Kahveci, T.; He, J.; Zhang, R.; et al. Comparison of three calibration methods for modeling rice phenology. Agric. For. Meteorol. 2020, 280, 107785. [Google Scholar] [CrossRef]
  34. Liu, J.; Feng, H.; He, J.; Chen, H.; Ding, D.; Luo, X.; Dong, Q. Modeling wheat nutritional quality with a modified CERES-wheat model. Eur. J. Agron. 2019, 109, 125901. [Google Scholar] [CrossRef]
  35. Saddique, Q.; Cai, H.; Ishaque, W.; Chen, H.; Chau, H.; Chattha, M.; Hassan, M.; Khan, M.; He, J. Optimizing the Sowing Date and Irrigation Strategy to Improve Maize Yield by Using CERES (Crop Estimation through Resource and Environment Synthesis)-Maize Model. Agronomy 2019, 9, 109. [Google Scholar] [CrossRef] [Green Version]
  36. Chen, S.; Jiang, T.; Ma, H.; He, C.; Xu, F.; Malone, R.W.; Feng, H.; Yu, Q.; Siddique, K.H.M.; Dong, Q.; et al. Dynamic within-season irrigation scheduling for maize production in Northwest China: A Method Based on Weather Data Fusion and yield prediction by DSSAT. Agric. For. Meteorol. 2020, 285–286, 107928. [Google Scholar] [CrossRef]
  37. Lobell, D.B.; Ortiz-Monasterio, J.I. Evaluating strategies for improved water use in spring wheat with CERES. Agric. Water Manag. 2006, 84, 249–258. [Google Scholar] [CrossRef]
  38. Li, Z.; Jin, X.; Liu, H.; Xu, X.; Wang, J. Global sensitivity analysis of wheat grain yield and quality and the related process variables from the DSSAT-CERES model based on the extended Fourier Amplitude Sensitivity Test method. J. Integr. Agric. 2019, 18, 1547–1561. [Google Scholar] [CrossRef]
  39. Boote, K.J.; Prasad, V.; Allen, L.H.; Singh, P.; Jones, J.W. Modeling sensitivity of grain yield to elevated temperature in the DSSAT crop models for peanut, soybean, dry bean, chickpea, sorghum, and millet. Eur. J. Agron. 2018, 100, 99–109. [Google Scholar] [CrossRef]
  40. Timsina, J.; Humphreys, E. Performance of CERES-Rice and CERES-Wheat models in rice–wheat systems: A review. Agric. Syst. 2006, 90, 5–31. [Google Scholar] [CrossRef]
  41. Qu, C.; Li, X.; Ju, H.; Liu, Q. The impacts of climate change on wheat yield in the Huang-Huai-Hai Plain of China using DSSAT-CERES-Wheat model under different climate scenarios. J. Integr. Agric. 2019, 18, 1379–1391. [Google Scholar] [CrossRef]
  42. Malik, W.; Dechmi, F. DSSAT modelling for best irrigation management practices assessment under Mediterranean conditions. Agric. Water Manag. 2019, 216, 27–43. [Google Scholar] [CrossRef]
  43. Zhou, L.; Zhao, W.; He, J.; Flerchinger, G.N.; Feng, H. Simulating soil surface temperature under plastic film mulching during seedling emergence of spring maize with the RZ–SHAW and DNDC models. Soil Tillage Res. 2020, 197, 104517. [Google Scholar] [CrossRef]
  44. Zha, Y.; Wu, X.; Gong, F.; Xu, M.; Zhang, H.; Chen, L.; Huang, S.; Cai, D. Long-term organic and inorganic fertilizations enhanced basic soil productivity in a fluvo-aquic soil. J. Integr. Agric. 2015, 14, 2477–2489. [Google Scholar] [CrossRef] [Green Version]
  45. Li, Z.; He, J.; Xu, X.; Jin, X.; Huang, W.; Clark, B.; Yang, G.; Li, Z. Estimating genetic parameters of DSSAT-CERES model with the GLUE method for winter wheat (Triticum aestivum L.) production. Comput. Electron. Agric. 2018, 154, 213–221. [Google Scholar] [CrossRef] [Green Version]
  46. E, S.; Ding, N.; Li, L.; Yuan, J.; Che, Z.; Zhou, H.; Shang, L. Relationship of crop yield and soil organic carbon and nitrogen under long-term fertilization in black loessial soil region on the Loess Plateau in China. Chin. J. Appl. Ecol. 2018, 29, 4047–4055. [Google Scholar] [CrossRef]
  47. Angstrom, A. Solar and terrestrial radiation. Report to the international commission for solar research on actinometric investigations of solar and atmospheric radiation. Q. J. R. Meteorol. Soc. 1924, 50, 121–126. [Google Scholar] [CrossRef]
  48. He, J.; Dukes, M.D.; Jones, J.W.; Graham, W.D.; Judge, J. Applying GLUE for Estimating CERES-Maize Genetic and Soil Parameters for Sweet Corn Production. Trans. ASABE 2009, 52, 1907–1921. [Google Scholar] [CrossRef]
  49. Jones, J.W.; He, J.; Boote, K.J.; Wilkens, P.; Porter, C.H.; Hu, Z. Estimating DSSAT croping system cultivar-Specific Parameters Using Bayesian Techniques. In Methods of Introducing System Models into Agricultural Research; Ahuja, L.R., Ma, L., Eds.; John Wiley & Sons: Paris, France, 2011; pp. 365–393. [Google Scholar] [CrossRef]
  50. Kumar, S.; Niwas, R.; Khichar, M.L.; Singh, A.; Badal, P.; Kumar, Y.; Chauthan, A.S. Genetic Coefficient and Validation of DSSAT Model for Cotton under Different Growing Environments. Int. J. Curr. Microbiol. Appl. Sci. 2017, 6, 1031–1041. [Google Scholar]
  51. Janssen, P.H.M.; Heuberger, P.S.C. Calibration of process-oriented models. Ecol. Model. 1995, 83, 55–66. [Google Scholar] [CrossRef]
  52. Willmott, C.J.; Ackleson, S.G.; Davis, R.E.; Feddema, J.J.; Klink, K.M.; Legates, D.R.; O’Donnell, J.; Rowe, C.M. Statistics for the evaluation and comparison of models. J. Geophys. Res. 1985, 90, 8995–9005. [Google Scholar] [CrossRef] [Green Version]
  53. Loague, K.; Green, R.E. Statistical and graphical methods for evaluating solute transport models: Overview and application. J. Contam. Hydrol. 1991, 7, 51–73. [Google Scholar] [CrossRef]
  54. Kadiyala, M.D.M.; Jones, J.W.; Mylavarapu, R.S.; Li, Y.C.; Reddy, M.D. Identifying irrigation and nitrogen best management practices for aerobic rice–maize cropping system for semi-arid tropics using CERES-rice and maize models. Agric. Water Manag. 2015, 149, 23–32. [Google Scholar] [CrossRef] [Green Version]
  55. Yao, N.; Zhou, Y.; Song, L.; Liu, J.; Li, Y.; Wu, S.; Feng, H.; He, J. Parameter estimation and verification of DSSAT-CERES-Wheat model for simulation of growth and development of winter wheat under water stresses at different growth stages. Trans. Chin. Soc. Agric. Eng. 2015, 31, 138–150. [Google Scholar]
  56. Liu, W.; Chen, G.; Liu, E.; Ju, H.; Liu, Q. The variations in winter wheat potential yields in the middle and lower reaches of the Yangtze River under the RCP scenarios. Acta Ecol. Sin. 2018, 38, 3219–3229. [Google Scholar]
  57. Yao, N.; Li, Y.; Xu, F.; Liu, J.; Chen, S.; Ma, H.; Wai Chau, H.; Liu, D.L.; Li, M.; Feng, H.; et al. Permanent wilting point plays an important role in simulating winter wheat growth under water deficit conditions. Agric. Water Manag. 2020, 229, 105954. [Google Scholar] [CrossRef]
  58. Nouna, B.B.; Katerji, N.; Mastrorilli, M. Using the CERES-Maize model in a semi-arid Mediterranean environment. New modelling of leaf area and water stress functions. Eur. J. Agron. 2003, 19, 115–123. [Google Scholar] [CrossRef]
  59. DeJonge, K.C.; Ascough, J.C.; Andales, A.A.; Hansen, N.C.; Garcia, L.A.; Arabi, M. Improving evapotranspiration simulations in the CERES-Maize model under limited irrigation. Agric. Water Manag. 2012, 115, 92–103. [Google Scholar] [CrossRef] [Green Version]
  60. Gu, Z.; Xie, Y.; Gao, Y.; Ren, X.; Cheng, C.; Wang, S. Quantitative assessment of soil productivity and predicted impacts of water erosion in the black soil region of northeastern China. Sci. Total Environ. 2018, 637–638, 706–716. [Google Scholar] [CrossRef]
  61. Tang, Y.; Huang, Y. Statistical Analysis of the Percentage of Soil Fertility Contribution to Grain Crop Yield and Driving Factors in Mainland China. J. Agro-Environ. Sci. 2008, 27, 1283–1289. [Google Scholar]
  62. Huang, S.; Jia, L.; Yang, Y.; Liu, K. Analysis on soil nutrient influencing factors of winter wheat yield gaps of basic soil productivity by boundary line method in central and southern Hebei Province. Trans. Chin. Soc. Agric. Eng. 2019, 35, 141–148. [Google Scholar]
  63. Zhu, Z. Research on nitrogen in China. Acta Pedol. Sin. 2008, 45, 778–783. [Google Scholar]
Figure 1. Relationship between measured and simulated yields of winter wheat under different fertilizations, 1981–2016. The solid line is 1:1.
Agronomy 10 01544 g001
Figure 2. The trend of basic soil productivity of winter wheat under different fertilizations from 1981–2016.
Agronomy 10 01544 g002
Figure 3. The average basic soil productivity of winter wheat under different fertilizations, 1981–2016. The different lowercase letters indicate significant differences between treatments by LSD (at p < 0.05).
Agronomy 10 01544 g003
Figure 4. The trend of the contribution percentage of basic soil productivity to yield under different fertilizations, 1981–2016.
Agronomy 10 01544 g004
Figure 5. Relationship between contribution percentage of basic soil productivity of winter wheat and soil nutrient contents. ** and * are significance at the 0.01 and 0.05 level, respectively.
Agronomy 10 01544 g005
Table 1. The soil parameters required for the decision support system for agrotechnology transfer (DSSAT) model in 1979 and 2000.
Soil Depth
(cm)
Bulk Density
(g cm−3)
Organic Carbon
(%)
Total Nitrogen
(g kg−1)
pHSand
(%)
Silt
(%)
Clay
(%)
Saturated Water Conductivity
(cm h−1)
Saturated Water Content
(%)
Root Growth Factor
1979
201.300.560.958.223.143.233.61.3231.51
401.470.450.88.221.644.234.21.3227.40.549
601.360.550.88.311.843.544.21.3231.50.368
801.340.400.68.419.742.837.51.3231.90.247
1001.300.180.58.324.34134.22.5931.90.165
2000
201.210.900.988.219.947.432.71.3231.51
401.400.510.568.213.849.436.81.3227.40.549
601.380.530.608.311.745.243.11.3231.50.368
801.350.330.428.515.846.337.91.3231.90.247
1001.330.270.318.417.945.336.82.5931.90.165
Table 2. Genetic parameter definition and calibrated values for wheat in this study.
CultivarsP1V 1P1D 2P5 3G1 4G2 5G3 6PHINT 7
Wheat 80Ping873.3490.24598.718.7845.671.86595
Wheat 15-0-3642.8798.45678.916.6738.771.76588
Wheat 8510863.3392.45584.515.3439.371.43194
Wheat PL4455.6194.91610.915.3447.541.92999
Wheat Chang638761.1993.8756.415.0140.831.42685
Mean59.2793.97645.8816.2342.441.6892.20
Standard deviation11.193.0571.631.563.930.245.63
Coefficient of variation, %18.873.2511.099.639.2714.246.11
1 P1V, days, optimum vernalizing temperature, required for vernalization (d); 2 P1D, photoperiod response (% reduction in rate/10 h drop in pp) (%); 3 P5, grain filling (excluding lag) phase duration (°C·d); 4 G1, Kernel number per unit canopy weight at anthesis (# g−1); 5 G2, standard kernel size under optimum conditions (mg); 6 G3, standard, non-stressed mature tiller weight (incl grain) (g); 7 PHINT, interval between successive leaf tip appearances (°C d).
Table 3. The trend of basic soil productivity of winter wheat.
Fertilization TreatmentsRegression EquationAnnual Increasing Yield, kg hm−2Annual Increasing Rate, %
CKY = −24.9x − 51291.6, R2 = 0.168, p < 0.05 1−24.9−0.23
NY = −32.8x − 67093.4, R2 = 0.234, p < 0.05−32.8−3.03
NPY = 12.3x − 22080.1, R2 = 0.065, p > 0.0512.33.17
SNPY = 16.3x − 29877.4, R2 = 0.113, p > 0.0516.33.74
MY = 25.7x − 48964.1, R2 = 0.224, p < 0.0525.72.70
MNPY = 31.6x − 60491.4, R2 = 0.349, p < 0.0131.63.82
1 Y and x represent the basic soil productivity of winter wheat and year, respectively.
Table 4. The effect of fertilization on basic soil yield and contribution rate.
TreatmentContribution Rate of Basic Soil Productivity, %Average Contribution Rate of Basic Soil Productivity, %
N26.92~63.7347.02 ± 10.28 c 1
NP9.23~62.7639.37 ± 16.31 d
SNP24.88~77.4656.30 ± 16.84 b
M19.19~62.7150.04 ± 12.71 c
MNP32.31~77.4861.88 ± 14.36 a
1 Data are means ± standard error (n = 4), different lowercase letters indicate significant differences between treatments by least significant difference (LSD) (at p < 0.05).
Table 5. The correlation coefficients between the contribution percentage of basic soil productivity (BSP) and soil nutrients.
TreatmentSOCTNTPANAPAK
N0.244−0.068−0.166−0.484 *−0.331−0.460 * 1
NP0.469 *−0.0980.260−0.1360.379−0.075
SNP0.560 **−0.147−0.340−0.2630.430 *−0.342
M0.539 **0.2430.085−0.439 *0.471 *0.363
MNP0.693 **0.3510.279−0.3900.647 **0.594 **
1 ** and * are significance at the 0.01 and 0.05 level, respectively.

