Article

Ultraviolet Index (UVI) inside an Almería-Type Greenhouse (Southeastern Spain)

by
Rubén A. García-Ruiz
1,*,†,
Javier López-Martínez
2,†,
José L. Blanco-Claraco
3,†,
José Pérez-Alonso
1,† and
Ángel J. Callejón-Ferre
1,4,†
1
Department of Engineering, University of Almería, Research Center CIMEDES, Agrifood Campus of International Excellence (ceiA3), Ctra. de Sacramento s/n, 04120 Almería, Spain
2
CIAIMBITAL Research Centre, University of Almería, Ctra. de Sacramento s/n, 04120 Almería, Spain
3
Department of Engineering, University of Almería, Centro Mixto CIESOL, Agrifood Campus of International Excellence (ceiA3), Ctra. de Sacramento s/n, 04120 Almería, Spain
4
Laboratory-Observatory Andalusian Working Conditions in the Agricultural Sector (LASA). C/ Albert Einstein s/n. 2ªplanta. Isla de la Cartuja, 41092 Sevilla, Spain
*
Author to whom correspondence should be addressed.
These authors contributed equally to this work.
Agronomy 2020, 10(1), 145; https://doi.org/10.3390/agronomy10010145
Submission received: 30 December 2019 / Revised: 12 January 2020 / Accepted: 13 January 2020 / Published: 19 January 2020
(This article belongs to the Special Issue Greenhouse Technology)

Abstract

:
Greenhouse workers, despite being in a space beneath a plastic cover, may be susceptible to risks associated to ultraviolet (UV) radiation in skin and eyes. The present work focuses on experimentally analysing this risk throughout a complete year. For this purpose, a network of sensors has been designed, comprising 12 UV radiation measuring stations inside the greenhouse and one outside. It is shown that the UVI risk limit established by World Health Organization (WHO) is exceeded for some particular dates and times, thus there exist risk of damage caused by UV radiation for greenhouse workers. The results allow to identify the UV risk periods for the location studied. A diagram called “UVIgram” has been created which offers weather and UV radiation information for a particular location, for each month, and also in general for the whole year. Finally, a series of recommendations and protection measures are given, highlighting the whitening of the plastic cover of the greenhouse and an alarm system which has been designed to alert workers when UV risk exists.

1. Introduction

Ultraviolet (UV) radiation is a part of the optical radiation that covers the wavelengths between 100 and 400 nm. At the same time, UV radiation is divided into three different bands: UVA (315–400 nm), UVB (280–315 nm), and UVC (100–280 nm). The intensity of the UV radiation increases with the sun elevation, lower latitude, higher altitude and ground reflection, and it decreases with the presence of clouds and certain gases in the atmosphere as ozone, oxygen, and carbon dioxide. Precisely these gases absorb all the UVC radiation and 90% of UVB radiation [1]. Thus, only UVA radiation and a small amount of UVB radiation coming from the sun reaches the surface of the Earth.
The UV Index (UVI henceforth) was introduced in Canada in 1992 by Kerr et al. [2] to inform about the increasing of UV levels because of the ozone depletion. Latter, it was adopted and recommended as a global standard by the World Health Organisation et al. [3], as in addition to quantify the UV irradiance, it indicates its potential effect over humans. UVI is based on the reference action spectrum for UV-induced erythema on the human skin [4], and is mathematically defined as:
U V I = K e r 250   nm 400   nm E λ S e r ( λ ) d λ
where E λ is the solar irradiance at wavelength λ (expressed in W/m−2nm), S e r ( λ ) is the erythema reference action spectrum and K e r is a constant equal to 40 m2W−1. The term S e r ( λ ) quantifies the spectral dependence of UV radiation to produce erythema in human skin and is defined as:
S e r ( λ ) = 1 , f o r   250 λ 298   nm S e r ( λ ) = 10 0 . 094 ( 298 λ ) , f o r   298 < λ 328   nm S e r ( λ ) = 10 0 . 015 ( 140 λ ) , f o r   328 < λ 400   nm
UVI is a non-dimensional index with values from zero upward and indicates the potential damage of UV over humans so that while UVI is higher, higher potential damage and less time to produce it. To a better understanding and public awareness, World Health Organisation et al. [3] recommend using colour codes depending on the exposure category (Figure 1) and establishes a UVI equal to 3 as the threshold from which there exists risk of damage caused by UV radiation and, therefore, sun protection is necessary. Each colour is standardised by the Pantone Matching System (PMS). However, according [5], there is also risk for people with clear skin (skin type I and II, according to Fitzpatrick [6,7] and defined later in Table 1) when they are exposed to a UVI between 2 and 3 during more than 1.5 h.
Although UV radiation represents only around 5% of the overall solar radiation [8,9], it has considerable harmful effects on humans, depending on the intensity of their UV exposure. In the short term, UV produces erythema (or sunburn) that could worsen resulting in oedema, pain, blistering, and finally peeling [8]. In the long term, UV produces skin ageing (as consequence of degenerative changes in cells, fibrous tissue and blood vessels) [3], skin cancer (cutaneous malignant melanoma and non-melanoma skin cancer) [10], eye injuries (cataracts, pterigyum, photokeratitis, retinal damage and deterioration) [11], and damage to the immune system [3]. Skin ageing produces skin dryness, sagging, loss of elasticity, wrinkles, skin furrows, mottled pigmentation, and telangiectasia [8]. Incidence and mortality of skin cancer have both increased in the last years [12,13,14]. Specially, cutaneous malignant melanoma (CMM), which represents 5–10% of all skin cancers [15,16] but has a much higher mortality rate than non-melanoma skin cancer (NMSC), since the latter progresses slower and is located in sun-exposed body parts facilitating early detection [16]. It must be highlighted that UV also has benefits for health. 90% of vitamin D needed by humans comes from UV radiation [17], although a daily exposure of 10–15 min in the face, arms and hands at low intensity radiation could be enough to obtain it [18]. However, depending on the recommended daily dose of vitamin D and other factors as clouds, air pollution, intensive skin pigmentation, advanced age or excessive usage of sun protection cosmetics [19], it may be necessary to increase the time or intensity of exposure, always taking preventive measures and precautions to avoid taking a risk. However, in some countries at medium or high latitudes there is not enough UV radiation during winter [20], causing deficiency of vitamin D and consequently skin pigmentation problems [21]. Besides, several diseases as rickets, psoriasis and eczema, are treated with UV radiation, always under medical supervision and considering the potential risk [3].
The effects of UV is greater in people with lighter colours of skin, hair and eyes, and also with the presence of freckles [8]. Respect to skin colour, Fitzpatrick defined different skin types [6,7]. The characteristics of each skin type are summarised in Table 1. Although most skin cancers are produced in people with skin type I or II, dark-skinned people are also sensible to UV effects, specially those that affect to the eyes and the immune system. In addition, when skin cancers affect them, they are usually detected in more advanced and dangerous stages. On the other hand, the dose of UV radiation [22,23] and sunburn susceptibility [8] is equal between sexes. However, incidence and mortality of skin cancer is greater in males [13,14]. This could be due to the fact that females might be more careful regarding sun protection [24,25] and they are more aware of UV risk [26] in comparison with males.
Outdoor workers receive between 2 and 8 times the UV exposure of indoor workers according different authors [27,28]. This fact makes to outdoor workers more vulnerable to the negative effects of UV over health. Several works have reported health risk for prolonged UV exposure in outdoor workers all around the world: Serrano et al. in Spain [29], Milon et al. in Switzerland [16], Gies et al. in Australia [30], Thieden et al. in Denmark [22], Stepanski et al. in the United States [23] and Hammond et al. in New Zealand [31], among others. These health risk also exists in cloudy days because, although clouds reduce the intensity of the UV radiation, intensity of infrared radiation is reduced even more. This reduces the heat sensation (which usually helps to warn about the UV risk) and increases the risk of sun overexposure [8]. In addition, the greatest eye damage occurs when UVI is higher and light clouds cover the sky, as UV radiation is scattered and strikes the eyes at different angles where natural defenses of the eye as eyebrows, eyelids and eye sockets do not offer protection [32].
In recent times, the depletion of the ozone layer [15,33] has been causing an increase of UVI levels. In addition, UVI in rural areas is higher than in cities because of the clearness of the atmosphere and less air pollution (which blocks a part of UV radiation) [15,34]. In Almería, around 55,000 people work in greenhouses [35], which are agricultural buildings destined to maintain adequate climate conditions for crops. Greenhouses are composed of transparent plastic covers supported by light metal structures, with ventilation through windows in the ceiling and walls, and diffuse solar radiation [36]. Greenhouse workers can be considered as outdoor workers, since are exposed to wind and UV radiation. The main working period in greenhouses lasts since the end of July until the middle of June; however, it extends to almost the complete year as maintenance tasks are also carried out in non-crop periods [37,38,39,40]. Although only diffuse solar radiation reaches the interior of a greenhouse, UV radiation also can be high [17]. In addition, the soil of greenhouses is covered of sand, which reflect until 15% of UV radiation and increases UVI. However, in spite of all this factors, UV radiation usually is not measured in greenhouses and workers are not aware of the very possibility of UV risk existing inside of the greenhouses.
In the present work, a UV sensor network has been designed and deployed to measure UVI at different points inside a greenhouse and also outdoors during an annual period. The data recorded in this period allows us to learn about the conditions of greenhouse workers regarding UV radiation and to determinate whether UVI exceeds the WHO risk threshold. To the best of our knowledge, this work is the first one to study UV radiation on workers inside a greenhouse. This study is particularly interesting for greenhouses located in areas with low latitude, such as the south of Spain. Besides, some recommendations and prevention measures are proposed to reduce at maximum the negative effects of UV radiation in greenhouse workers.
This paper is organized as follows. First, the material and methods are detailed in Section 2. The experimental results and their discussion are presented in Section 3. Finally, some conclusions are outlined in Section 4.

2. Materials and Methods

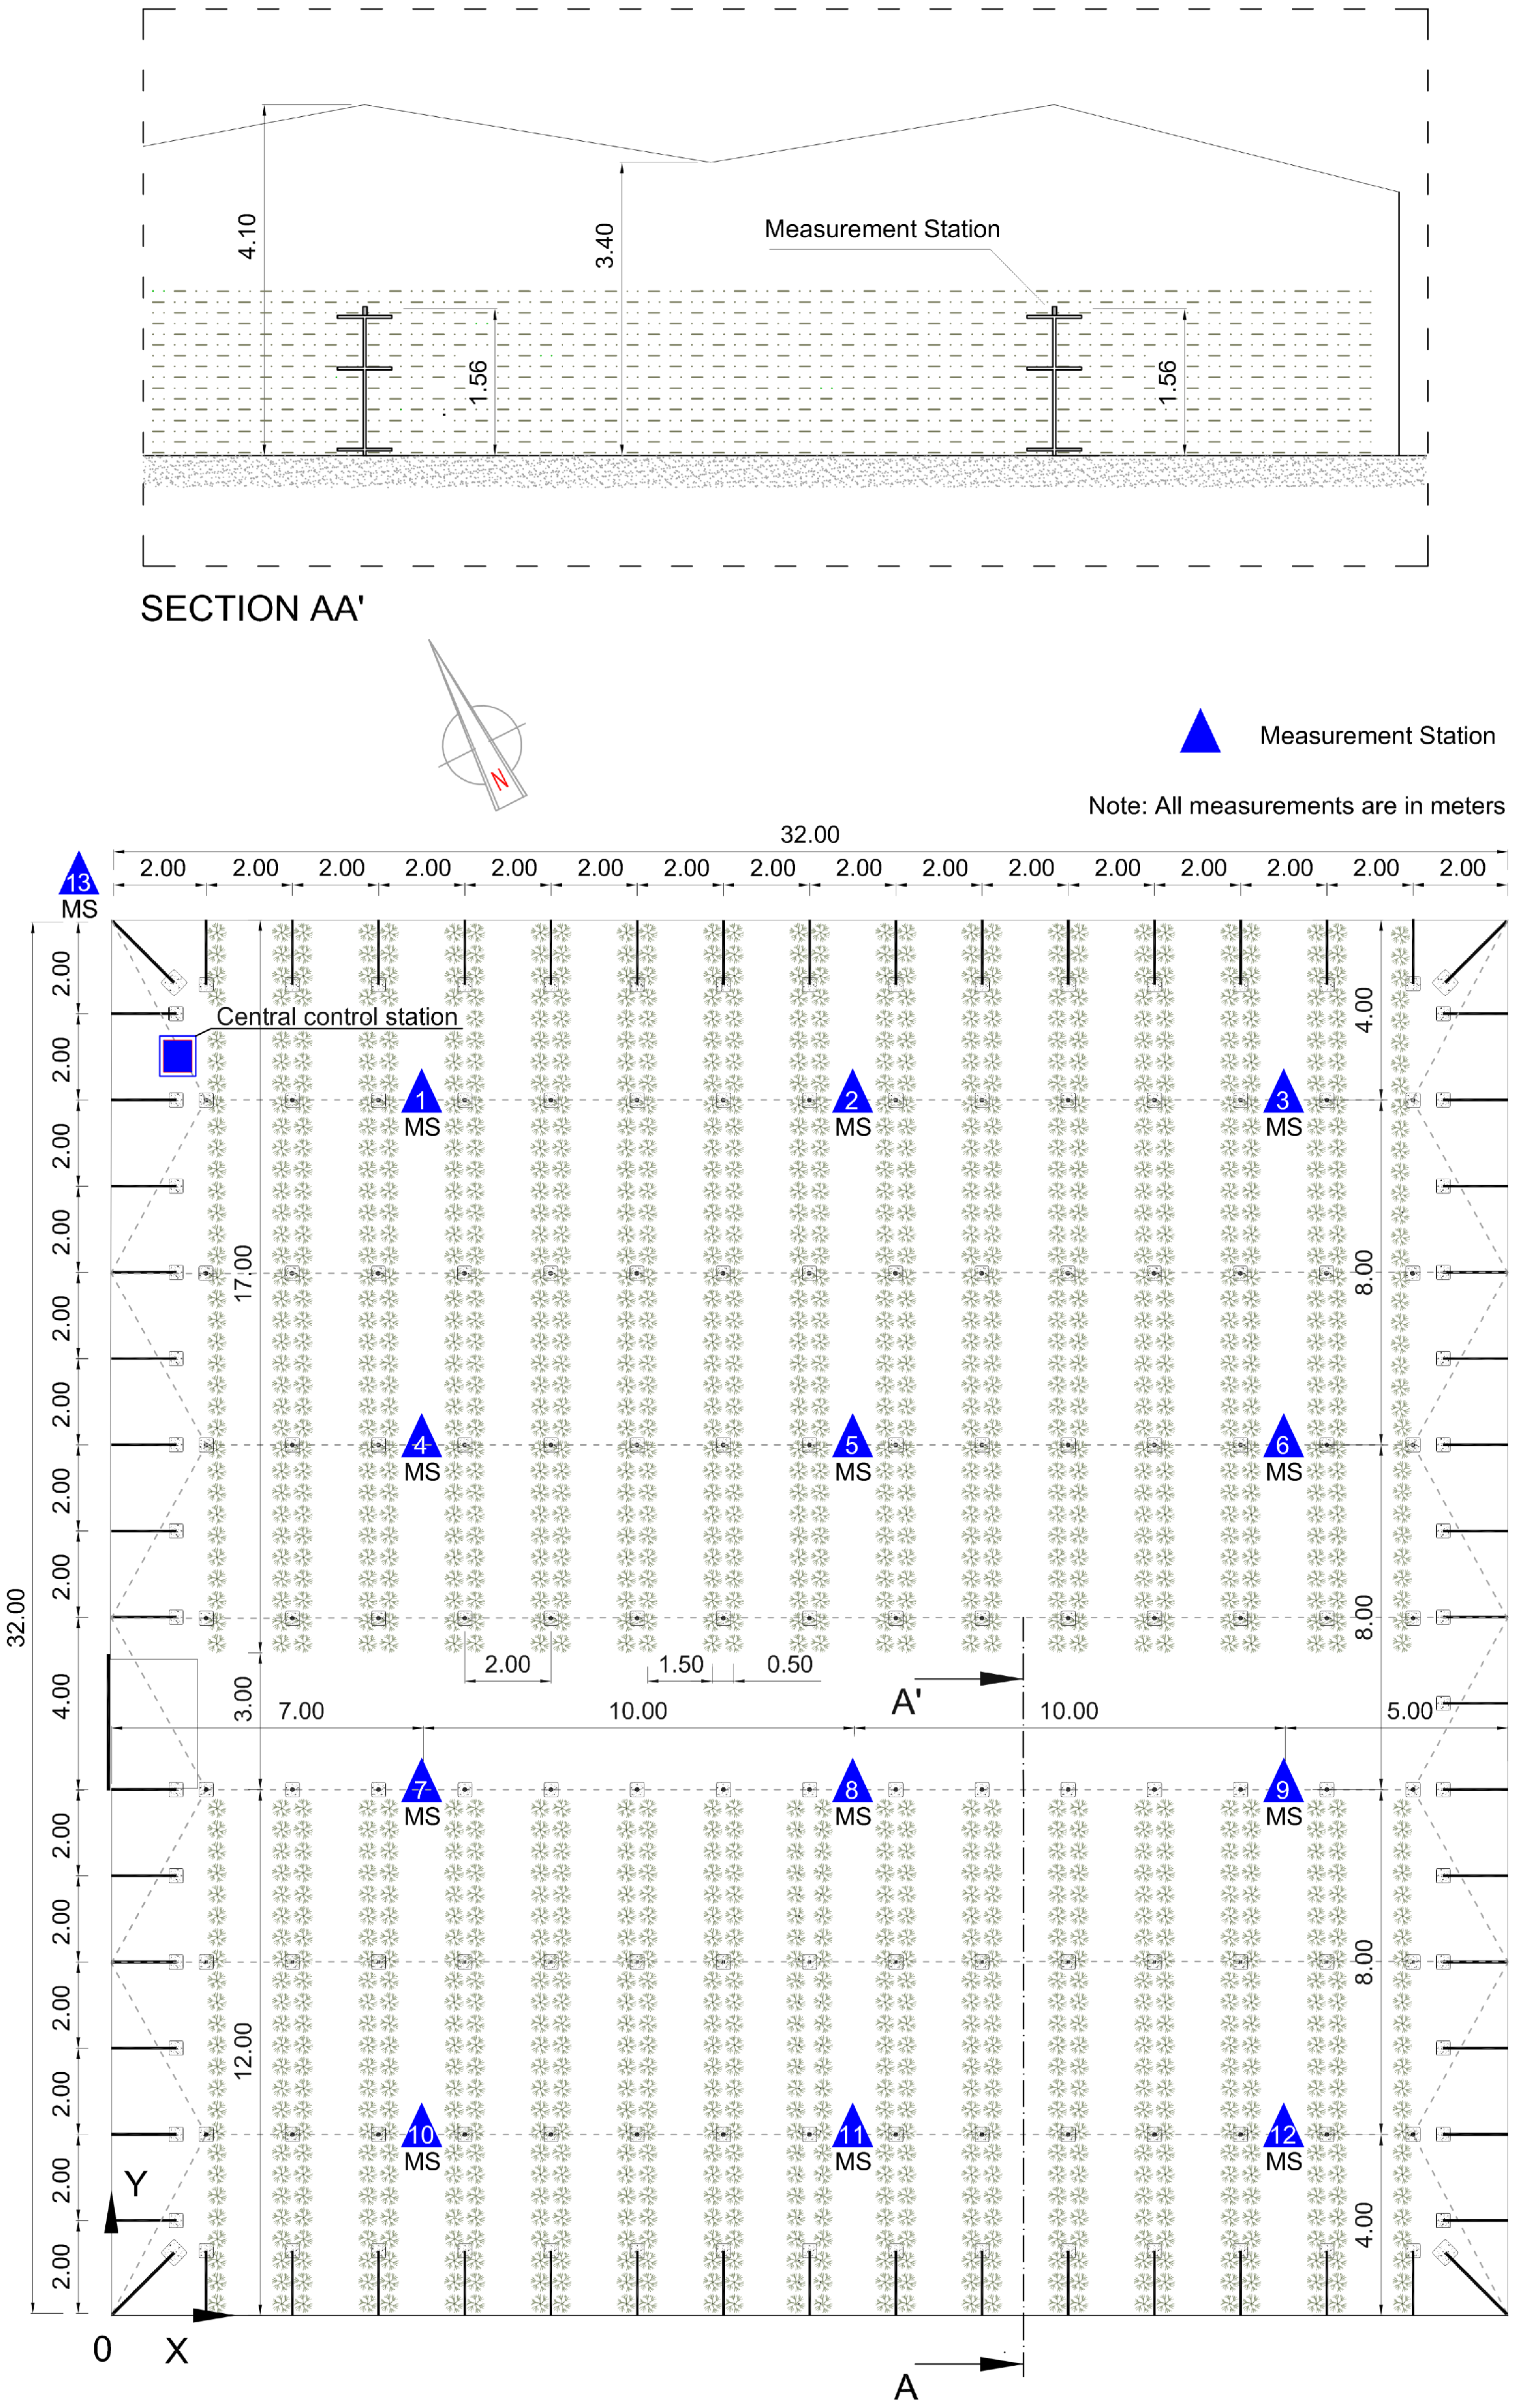
2.1. Experimental Setup

The study was performed in a greenhouse located at 15 km east of Almería (36°51′54″ N–2°17′02″ W and 98 m above sea level), in Spain. The type of greenhouse is the most common in the province of Almería: “raspa y amagado”, as it can be observed in Figure 2. The greenhouse has an area of 1024 m2 (32 × 32 m), with a height of 3.4 m and 4.1 m in the gutter and ridge, respectively. It has three polyethylene layers with a 200 μm thickness, with visible light transmittance of 81% and diffuse light transmittance of 29% at the beginning of its useful life, supported by a structure made of steel and with automatic lateral and roof windows that allow natural ventilation. The soil of the greenhouse is covered of gravel and sand and the air temperature inside the greenhouse ranges from around 0 °C in winter to 55 °C in summer [41]. It is worth noting that the greenhouse plastic cover was installed in July 2016 and will have a useful life of 3 campaigns (2016-17, 2017-18 and 2018-19) due to its wear and loss of transmittance. Therefore, the data obtained in this study start from the end of the second campaign of the plastic cover and extend until almost the end of the third campaign.
The sensors used to measure UV radiation (Figure 2) have a spectral response curve and a field of view that meet the requirements defined in ISO/CIE 17166 [4]. The rest of the characteristics of the sensors are detailed in Table 2. Each sensor has been calibrated to measure the UV index in accordance with ISO/CIE 17166, and subsequently it has been checked by comparing it with the data offered by the State Meteorological Agency (AEMet, “Agencia Estatal de Meteorología” in Spanish), specifically with the station located at the Almeria airport. In addition, these sensors can measure air temperature, and in this work these data are also used in Section 3.4.
Figure 3 shows a plan of the greenhouse and the distribution of the measurement stations. Twelve measuring stations are evenly distributed inside the greenhouse and another one is located outside. The infrastructure of existing stations has been reused, as reported in past works [42], adding new sensors and software. This infrastructure consists of a vertical pole and three horizontal bars at different heights, using the uppermost one for the installation of the UVI sensors. This upper height is 1.56 m above the ground which correspond to the head (equivalent to eye height) according to the 50th percentile of the Spanish population [43]. In this way, the UV radiation that affects the parts of the body where there may be greater risk to health is analysed, such as the eyes, and the face and neck (which are normally uncovered and exposed to radiation).
The experimental campaign was carried out in the greenhouse described above during a complete year, since 1 July 2018 to 31 June 2019. The crop from the beginning of this study is melon, until its harvest between 21 and 23 June 2018. Then, on 14 July 2018, the crop was removed and on 16 August 2018, the plastic cover of the greenhouse was whitewashed. Whitewashing is usually performed at the beginning of each crop (transplant) and its main objective is to reduce the amount of solar radiation entering the greenhouse and thus lower the inside air temperature, avoiding stress on the seedling. The product used was “Blanco España” (a compound product based on calcium carbonate), with doses of 50 kg of Blanco España per 1000 m2 of plastic cover. Subsequently, on 21 August 2018, pear tomato was cultivated for a long cycle. On 6 March 2019, a new bleaching of the plastic cover was carried out with similar doses of the previous. The tomato crop was removed on 25 April 2019 and since then, maintenance tasks and preparation of the next crop cycle were carried out until the end of the study.
During the time that this study was carried out, the farmers have conducted its labours in the greenhouse, especially for the tomato crop, as the melon crop only coincided for a short period at the beginning of the study. These labours are: transplanting, formative pruning, ridging up (cover the lower part of the plant with sand), hoeing (stir the earth with a hoe), weeding, trellising (tying the stem of the plant by means of a thread, in such way that one end of the thread is located in the basal part of the plant and the other end is attached to a horizontal fabric of wires located inside the greenhouse at a certain heigh above the ground), fertigation, application of phytosanitary products, bee pollination, shoot thinning (remove the axillary buds to improve the development of the main stem), leaf thinning (remove senescent and infected leaves), inflorescences and fruit thinning (remove deformed, damaged, small sized and bad positioned fruits), harvesting and plant removal. Therefore, farmers have worked inside the greenhouse performing these tasks during the study, being susceptible to damage by the effects of UV radiation.

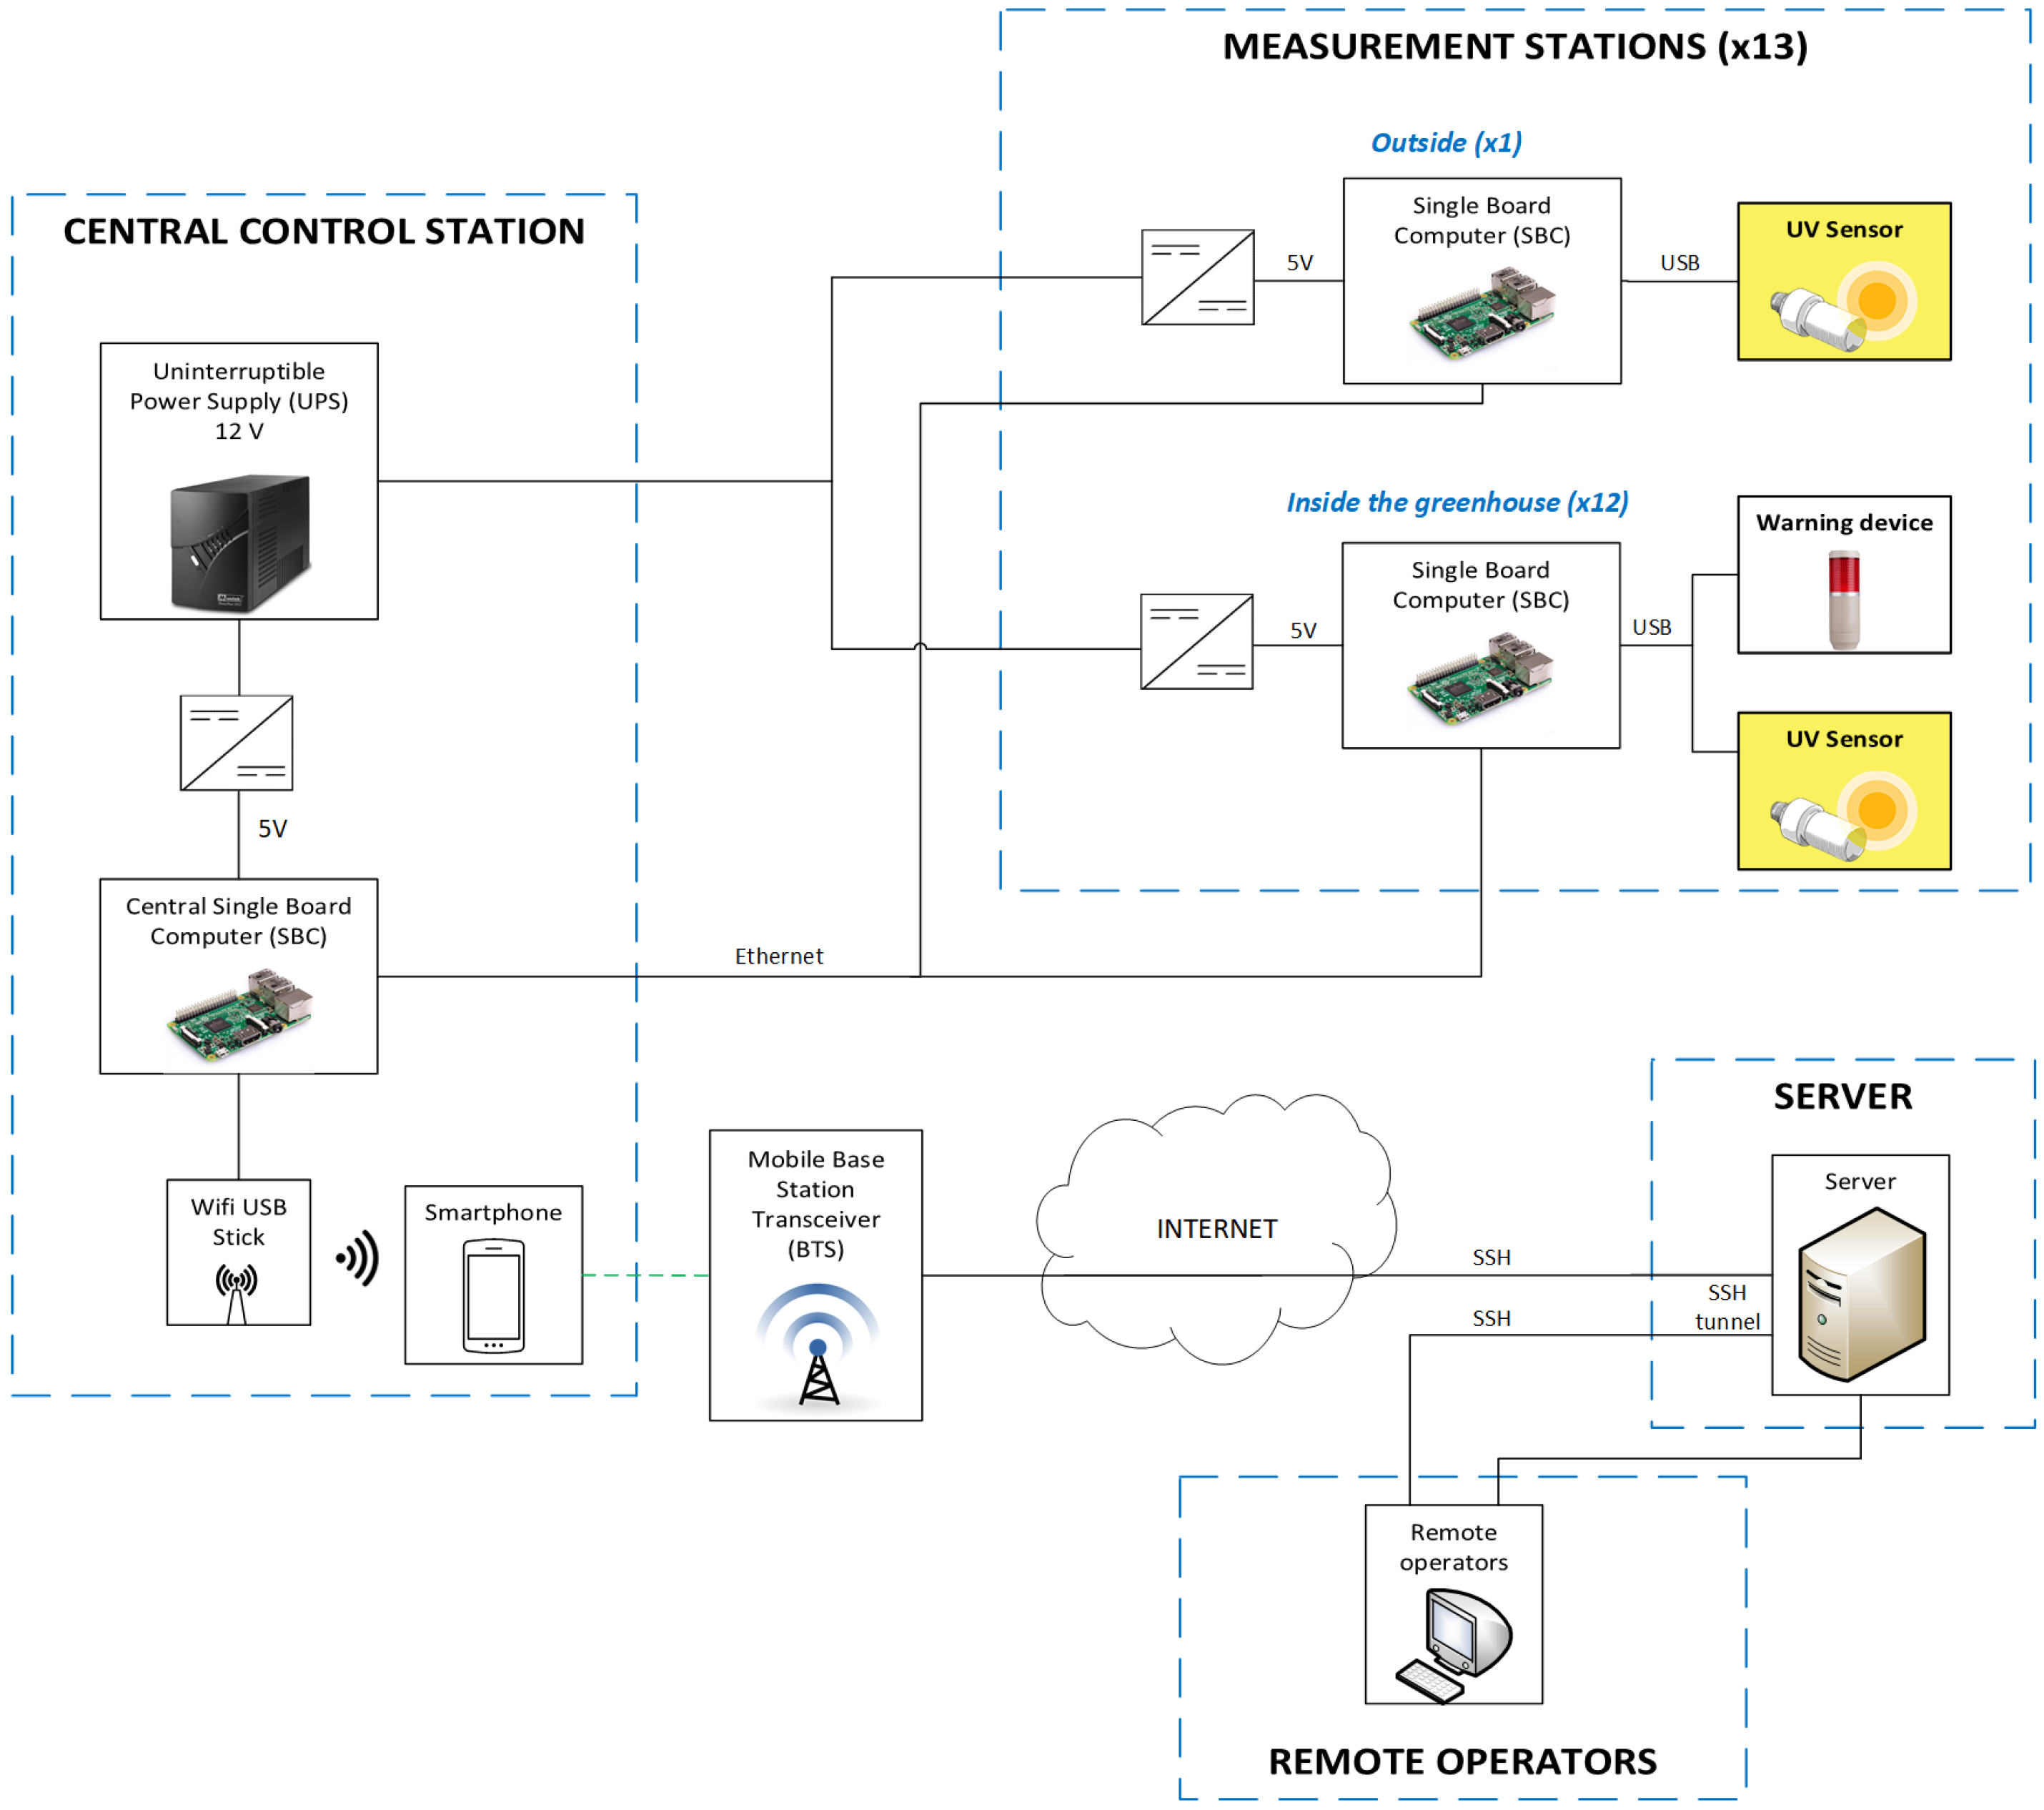
2.2. Network Architecture

The diagram of the designed data network architecture is shown in Figure 4. As it can be observed, there are four types of entities:
  • Measurement stations: there are 13 of them, 12 evenly distributed inside the greenhouse and another one outside. Each measurement station consists of an single board computer (SBC), a UV sensor and an audible and luminous warning device to alert workers when the measured UVI is close to the threshold from which there is risk of damage by UV radiation.
  • Central control station: it is installed in a register box inside the greenhouse and is responsible for sending the data to the server.
  • Server: it is installed in the Data Processing Centre of the University of Almería (CPD-UAL).
  • Remote operators: this type of entity is optional, since the system works regardless of whether remote operators are connected or not.
The core of the system has fully autonomous operational capacity without external intervention and is composed of the central control station and the measurement stations. The external elements (server and remote operators) are added with the aim of improving the usability of the system, since they allow access to data and system status in real time from anywhere via Internet. In addition, the server is also used to store backups of data collected during the day, as long as good mobile connectivity exists in the greenhouse area.
The core of the system is powered by a 12V uninterruptible power supply (UPS). DC to DC converters are used to obtain 5V to power the SBCs. The SBCs located in the measurement stations are responsible for powering the UV sensors and warning devices, while the SBC located in the central station provides power to both, a smartphone, and a USB WiFi adapter.
To receive and store the data from the UV sensor and activate the warning device, a script has been programmed in Python. This script receives the data and saves it with a periodicity of 30 s and activates the warning device when UVI is close to 3. The data is stored in a memory card in the SBC of each measurement station, distributed in daily files. At the end of the day, these daily files from each measurement station are sent via Ethernet cable to the SBC of the central control station. In turn, the SBC of the central control station stores the data received from all the sensors in a memory card. Then, also once a day, at the end of the day, it proceeds to send it to the server located in the CPD-UAL. This requires Internet connectivity, achieved through a 4G Smartphone and shared by wifi to the SBC.
The operators (the researchers in this project) can access the data on the server by means of two protocols: a simple web interface (HTTP), or via Secure Shell (SSH). Likewise, the system has been configured in such a way that connections can be made from any place provided with Internet access, to the central computer of the greenhouse. This is not trivial, as the latter is behind a NAT (Network Address Translation) of the mobile operator that prevents direct connection from the outside. To solve this problem, a reverse SSH connection was created from the central control station of the greenhouse to the server in the CPD-UAL, opened 24 h a day waiting to be requested by an external operator.

2.3. Data Analysis

First, the results of the UVI measurement campaign inside and outside the greenhouse and its spatial distribution are presented, together with a 3D representation of the UVI data in video for every instant of time. It is also included a figure that shows the UVI ratio between inside and outside. Next, a seasonal analysis of UVI is performed.
Then, a new term is then established to study the average monthly temperature and maximum monthly UVI within a greenhouse, denominated “UVIgram”. This has been created based on the Péguy climogram [44], which relates average monthly air temperatures on the “x” axis and precipitation on the “y” axis. To draw it, first, a triangle with vertices (A, B, C) and coordinates (0 °C, 0mm), (23 °C, 45 mm) and (16 °C, 200 mm), respectively, is projected. This triangle divides the Cartesian space into four climatological regions: temperate (points within the ABC triangle), arid (points under the AB segment), tropical or warm-dry (points to the right of the BC segment) and cold (points to the left of the CA segment). Next, the data of all the months are introduced during a year (or the average of the data of several years), so that each month is framed in a category, and therefore climatological information is obtained for each month for a given location, as well as a global overview of the entire year.
Finally, from the results obtained, some recommendations and prevention measures are exposed to reduce the risk of UV radiation damage in greenhouse workers.

2.4. Considerations and Study Limitations

It is worth to point that UTC (Coordinated Universal Time) have been used to analyse the data and must be taken into account for the interpretation of the results. Local time in Almería is CET (Central European Time) with daylight saving time in summer.
On the other hand, measurement stations have been exposed to a peculiar environment such as that of a greenhouse, with diffuse solar radiation, low wind speed and high humidity. In addition, plastic covers are not fully waterproof and are whitewashed. Therefore, the measurement stations have also been exposed to small droplets of water, dust and calcium carbonate.

3. Results and Discussion

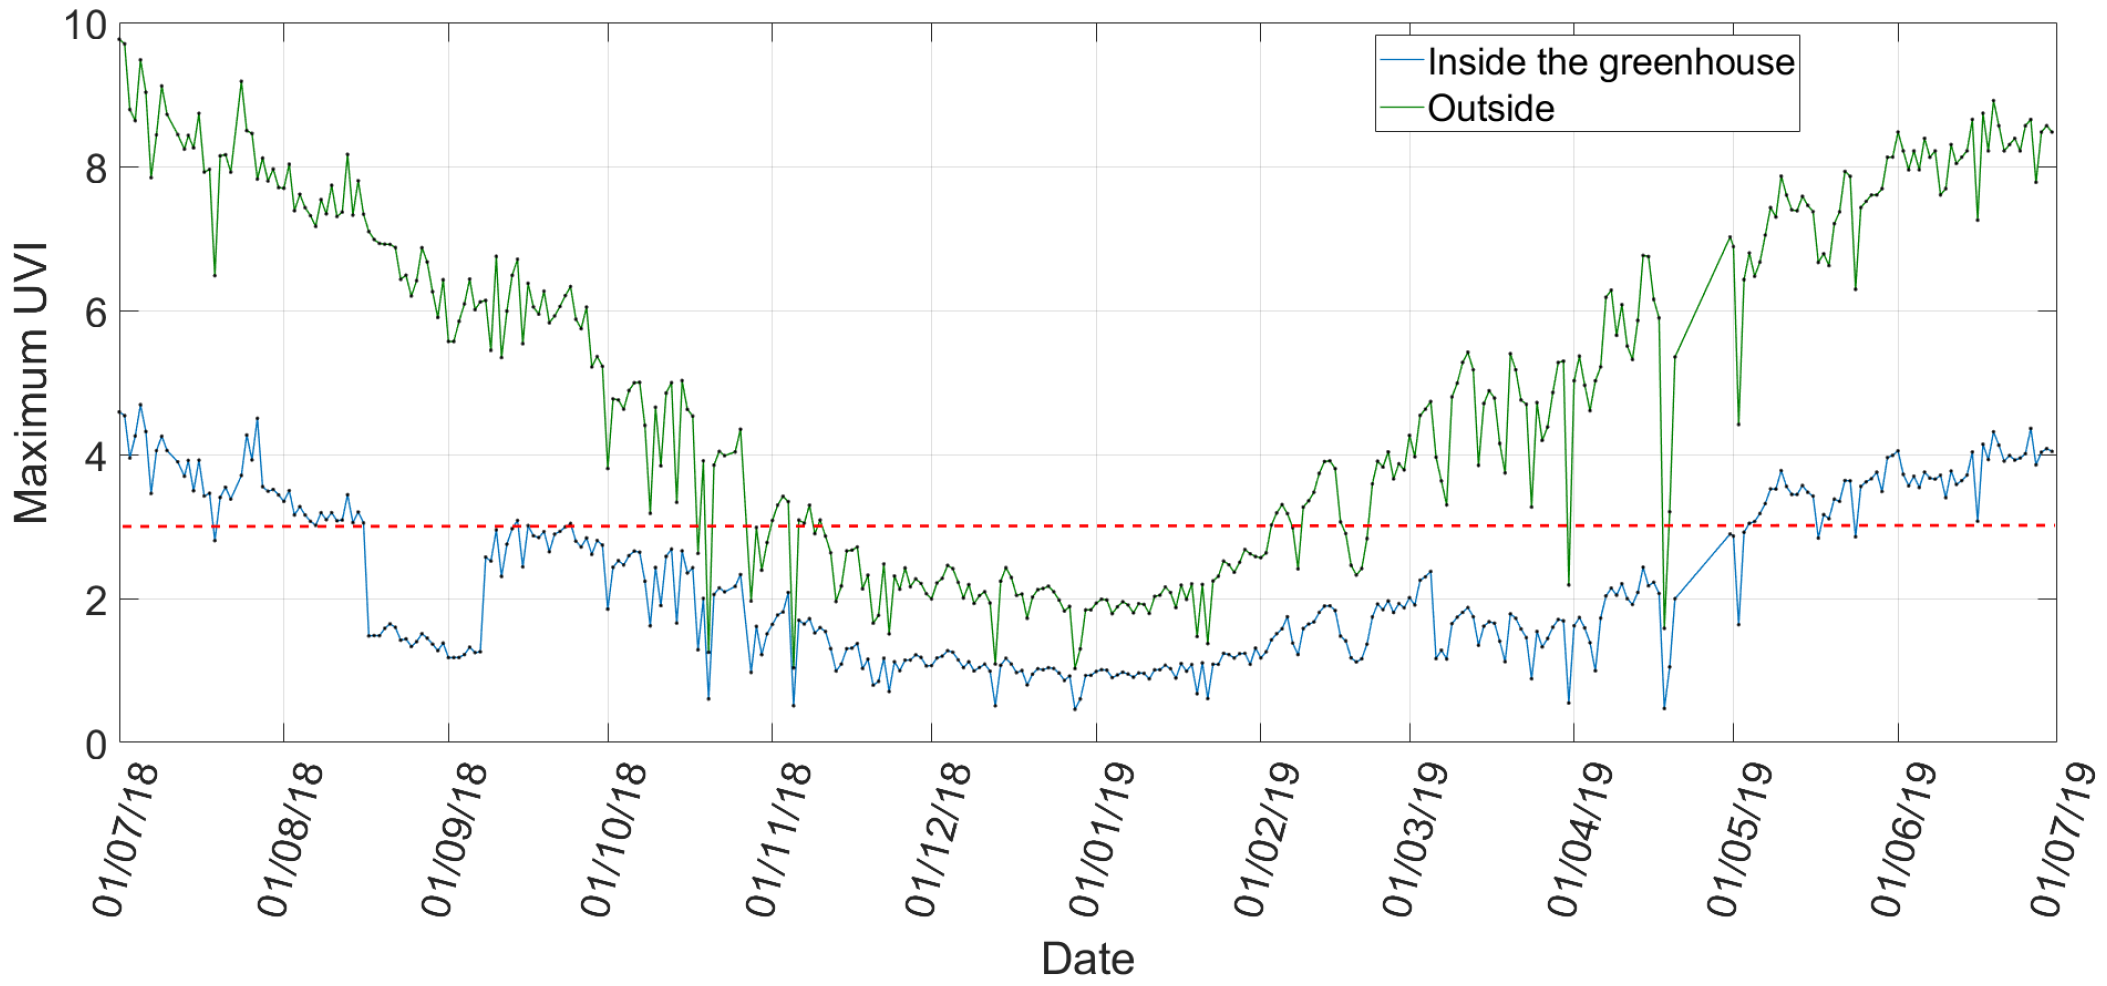
3.1. Annual UVI Variation

First, the UVI data of a random day for the 13 measurement stations is shown by way of example in Figure 5. In this case, the day shown is a sunny day due to the perfect bell shape of the graphic and it is observed that the risk limit (UVI = 3) is not exceeded at any of the measurement stations inside the greenhouse, although it is exceeded outside.
This work also includes a video produced with a 3D representation of the UVI data obtained during the period in which the study has been carried out (See: https://www.youtube.com/watch?v=W6B5GWTYLtA). It shows the variation of UVI for each measurement station at every moment and throughout the year. The four images show different perspectives of the greenhouse and represent the UVI values of the 12 measurement stations inside the greenhouse. For the two images on the left, a fixed UVI colour scale is set (between 0 and 6), while for the two images on the right, the UVI colour scale is variable to show greater sensitivity to changes. A blue marker represents the measure of each station, along with its numerical value at the top. The UVI colour scale is displayed at the bottom of the z-axis, using Markov Random Fields (MRF) to interpolate the rest of the points on the greenhouse colour scale. In the lower right part the date and time represented at each moment are shown. In the lower right part, it can be observed the minimum UVI, the maximum and the maximum difference between the measurement stations. Figure 6 shows an instant capture of this video.
In Figure 7 the daily maximum values for UVI both inside and outside the greenhouse during the experimental campaign are gathered. In the case of the interior of the greenhouse, the maximum UVI value shown corresponds to the maximum daily value measured between the 12 measurement stations located inside the greenhouse. The dashed red line represents the limit defined by the World Health Organization from which exists risk of damage to people for UV radiation, as it was explained in Section 1. The maximum UVI value was 4.69 and was measured on 5 July 2019 at 12:44 a.m. by the measurement station 5, while outside the maximum UVI of that same day was 9.48 and was measured at 12:16 a.m.. It can be observed that UVI surpass the risk limit up to in five months: July, August, September, May and June. It has been observed that most of the UVI maximums are recorded by the measure stations 7, 10, 11 and 12, i.e., most of the UVI maximums are recorded in the southwest corner of the greenhouse. It is noticeable a significant drop in UVI between 16 August and 8 September, which results in the risk limit not being exceeded in this period. This is because the plastic cover of the greenhouse was whitewashed on 16 August, which caused part of the UV radiation to be blocked while the effect lasted. This effect usually lasts until the arrival of the first rains.
It is worth mentioning that from November 2018 and until its removal on 25 April 2019, the tomato crop reached around 2.20 m high, as it can be observed in Figure 8. This has been able to produce shade, reducing UV radiation and the potential risk of damage to workers by UV radiation. However, this only occurs in high crops (long cycle tomato, cucumber and aubergine, among others).
Figure 9 shows the ratio between the maximum UVI value inside the greenhouse ( U V I i n s i d e ) and the maximum UVI outside ( U V I o u t s i d e ) in dB, expressed as:
U V I R a t i o ( d B ) = 10 log 10 ( U V I i n s i d e / U V I o u t s i d e )
This ratio is equivalent to the capacity of the plastic cover of the greenhouse to block UV radiation. It can be clearly seen when the cover of the greenhouse was whitewashed (16 August 2018 and 6 March 2019), since from those days there is a great decrease in the ratio until the effect lasts. Greenhouse whitewashing is usually performed in periods of high radiation or temperature to avoid stress in the crop, mainly in its initial stage. However, it has been shown that the UV radiation reaching the interior of the greenhouse is considerably reduced, so it can be used not only for the crop, but also as an effective method to protect workers against UV radiation. It could be applied both in the summer months, where maintenance work is carried out, and in some spring periods (from February or March). In certain spring crops it would not be possible, since it would be harmful for them (especially for melon and watermelon, although it is not disposable). On the other hand, it also can be observed small drops in UVI mainly in November 2018 and February 2019, that could be caused by crop shadows, as mentioned in the previous paragraph.

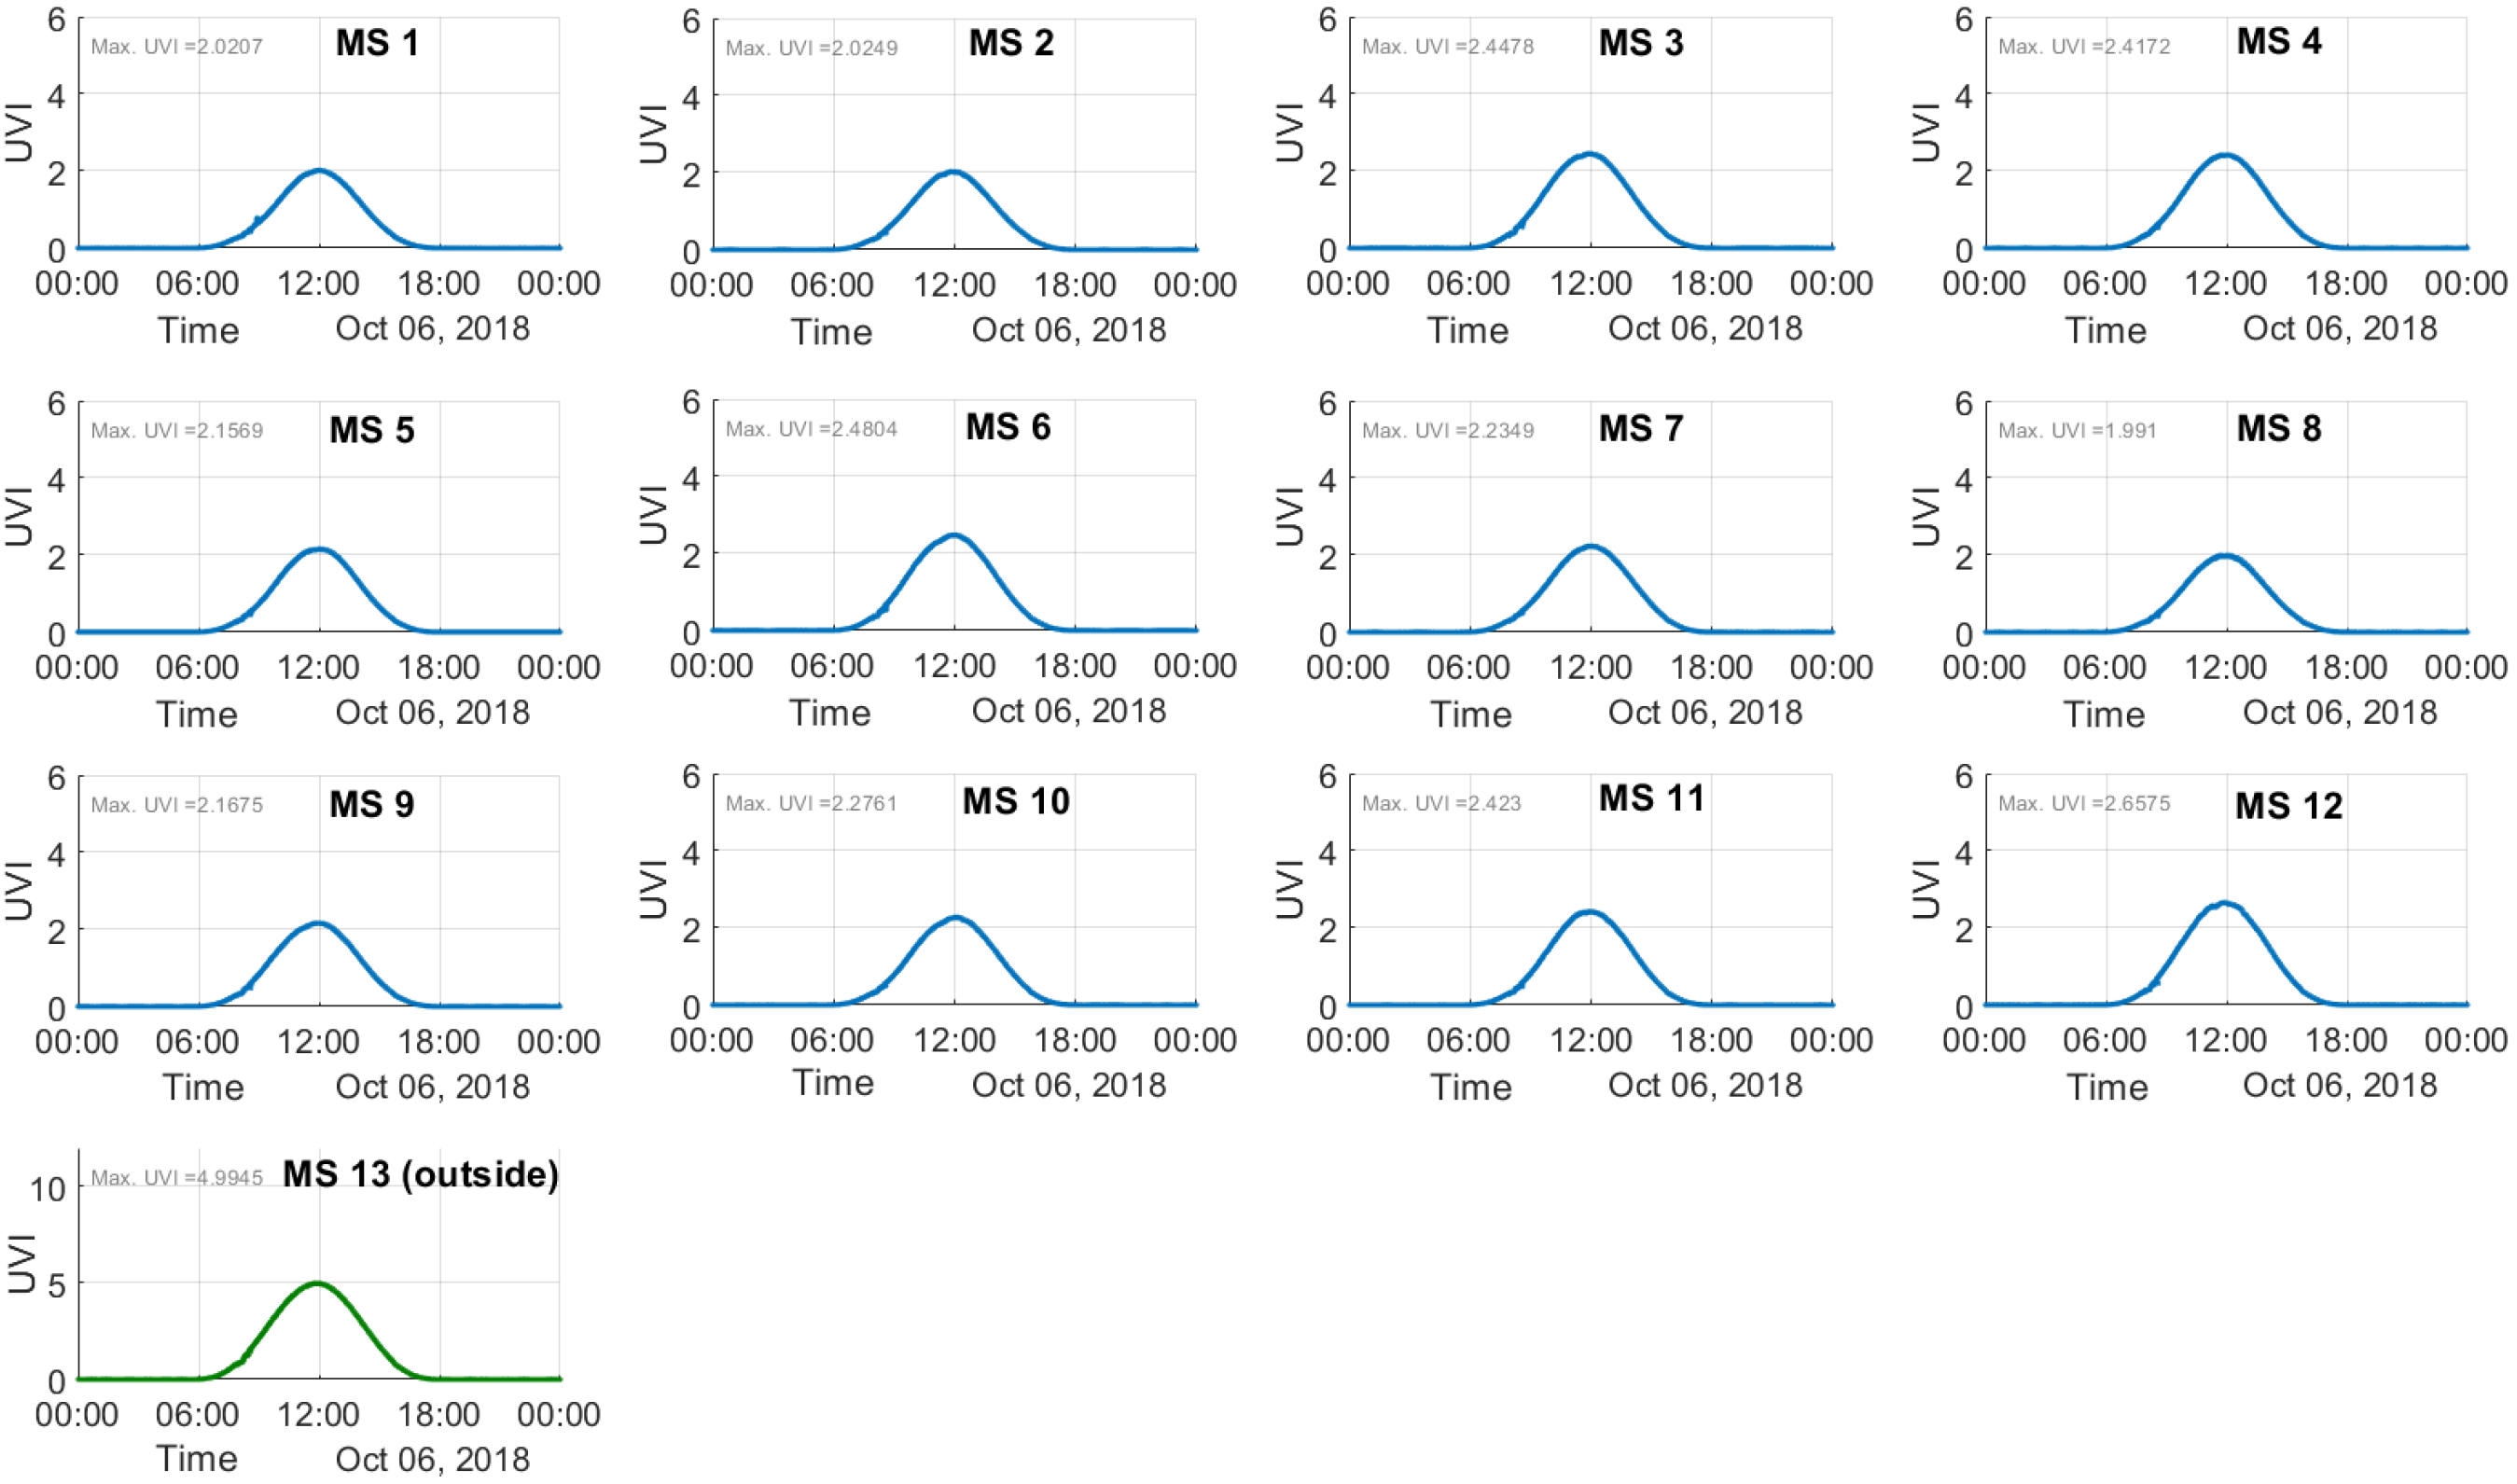
3.2. UVI Variation inside the Greenhouse

The UVI measured among the 12 measurement stations of the interior of the greenhouse has been compared for the year studied. The maximum monthly differences of UVI inside the greenhouse are gathered in Table 3. The maximum differences take place in periods where the UVI is greater, as summer and spring, being 2.54 the maximum UVI difference measured, obtained in July 2018.
These UVI differences may be due to the heterogeneity of the whitewashing, the wear of the plastic cover and the accumulation of dirt in said plastic cover.
In Figure 10 two consecutive days of summer are plotted. The particularity of these days is the application of whitewash on the plastic cover. The whitewashing occurred early in the second day, so we can observe one day without whitewashing and then another day with the effect of it. It can be observed what has been commented in the previous paragraph, that the heterogeneity of whitewashing is one of the causes of the greatest differences in UVI inside the greenhouse. In addition, it is demonstrated that the whitewashing of the plastic cover of the greenhouse is an effective method of reducing UV radiation and thus avoiding the risk of damage to workers.

3.3. Seasonal UVI Analysis

The average daily UVI values for each season of the year in each instant has been calculated for the inside and outside of the greenhouse, obtaining an average day per season. In the case of the interior of the greenhouse, this average day corresponds to the average between the 12 measurement stations during the considered seasonal period. This is shown in Figure 11, together with its standard deviation, which is high due to the cloudiness.
For the interior of the greenhouse, the risk limit is not exceeded by the average day of any season, although it does exceed the standard deviation in summer. However, as can be seen in Figure 7, on many days of spring and summer the risk limit is exceeded, and it must also be borne in mind that whitewashing of the greenhouse cover has contributed to the reduction of the average UVI. For that reason, in Figure 11 summer also has been added without taking into account the whitewashing period. In this case, it can be observed how the mean is very close to the risk limit and also the typical deviation is reduced. In addition, it is observed that most of the UV radiation is logically concentrated between 10 and 14 h, obtaining the maximum UVI around 12 h. Standard deviation logically is higher in the middle of the day than at night where is null. In addition, standard deviation also seems to increase with UVI. These behaviors also occurs for the UVI measured outside the greenhouse.
For outside the greenhouse, the average day of all the seasons except winter surpass the risk limit. Certain tasks such as whitewashing of the cover or construction of greenhouses are carried out outdoors. Therefore, and based on the data obtained, it is clear the need to take extreme precautions against UV radiation.

3.4. “UVIgram”

Similarly to the Péguy climogram, we think that it is possible to relate monthly average temperatures and maximum value of the UV index, being able to establish different categories in the Cartesian space that allow to explain the behaviour of the UV radiation and temperature of each month and of the whole year for a determined location. For this, 3 limits have been defined to divide the Cartesian space,: a horizontal line for UVI equal to 3 that defines the risk limit for UV radiation, a vertical line for 20 °C of average temperature that is the limit from cold to temperate and another vertical line for 35 °C of average temperature that is the limit from temperate to hot. The temperature limits has been defined taking into account the climate study carried out by Callejon-Ferre et al. [45]. In this way, 6 categories are established: cold without UV risk, cold with UV risk, temperate without UV risk, temperate with UV risk, hot without UV risk and hot with UV risk, allowing to frame each month in a category and obtaining information of temperature and UV relevant for the interior of a greenhouse, especially useful for the prevention of risks in workers. This has been called “UVIgram” and Figure 12 shows the UVIgram of this study.
In Figure 12 can be observed that cold months do not always produce lower UVI, since the factors explained in Section 1 also influence, such as the rise of the sun (depending on the season) and the presence of clouds, among others. On the other hand, logically the highest UVI are registered in summer (June and July), while the lowest UVI are registered in winter (December and January). Figure 12 also shows that autumn has lower UVI than those registered in spring.

3.5. UVI Risk Periods. Recommendations and Prevention Measures to Reduce the Risk of UV Radiation Damage in Greenhouse Workers

According to the results obtained in Section 3.1 and Section 3.3, the UVI risk periods for this location are distributed in spring and summer (from May to September) and concentrated between 10 and 14 h, obtaining the maximum UVI value very close to 12:00 a.m..
In view of these results obtained, it is observed that there is a risk of damage to people due to UV radiation since an UVI greater than the risk threshold defined in 3 is exceeded, and therefore the following recommendations for protective measures are proposed:
  • Analogous to the sun protection factor of sunscreens (SPF), it was developed a protection factor for clothing (UPF) according to its protection against radiation UV [46]. Factors of 15–24 offer good protection, 25–39 very good and greater than 40 excellent protection. Garments with a UPF factor of 30 or higher must be used. Garments must completely cover the legs and use long sleeves as much as possible, always adapted to the working environment and to the acceptance of the workers so that they are respected and allow the accomplishment of the tasks with comfort.
  • Wide-brimmed hats are recommended, as they provide shade to a large part of the head and neck, protecting them from UV radiation. If wide-brimmed hats are not available or are uncomfortable for any of the tasks to be carried out, it would be advisable to use sunglasses with high protection against UV radiation and wrap-around design or with side panels [9].
  • For areas of difficult protection against the sun, it is recommended to use sunscreen with SPF factor of 30 or higher, similar to UPF. The sunscreen should be applied 15 min before sun exposure and renewed every two hours. The sunscreen may be useless if perspiration is high, and the application should be renewed more frequently. The amount of cream used should be around 2 mg/cm2, as it is under these conditions that the sunscreen protects according to its specified SPF protection factor [47].
  • Work times must be managed to avoid the central hours of the day. Shadows should also be used when possible, especially during breaks. Although the presence of shadows is not usual in greenhouses, small awnings or tents with UV protection could be installed.
  • It is recommended that the worker examine his/her skin regularly. If a new spot, freckle, or a change in the shape, size, or colour of any of his/her moles are observed, he/she should see a dermatologist for a skin examination as soon as possible.
  • Alternatively to the previous individual protection measures, it is recommended as a collective protection measure, to perform greenhouse whitewashing in periods of higher UV radiation. This will be done whenever possible and does not harm the crop.
  • Finally, as it was explained in Section 2.2, an alarm system has been designed to alert workers to the risk of damage by UV radiation inside the greenhouse. This system consists of a device connected to the SBC of the measurement station and which alerts workers by means of a audible and luminous signal when values close to the risk threshold are reached.

4. Conclusions

This work has been focused on analysing the greenhouse workers risk of being exposed to UV radiation through a complete year, in a “raspa and amagado” greenhouse located in Almería. Although it can be thought that there is no risk due to being under the plastic cover of the greenhouse, it is shown that the limit established by [3] is exceeded existing risk of damage for UV radiation. This has been evaluated by means of a network of ultraviolet radiation sensors located inside and outside the greenhouse.
UVI surpass the risk limit up to in five months in the greenhouse studied, being the UVI risk periods distributed in spring and summer and concentrated between 10 a 14 h, obtaining the maximum UVI values very close to 12:00 a.m.. Outside, logically, the risk is even greater, the risk limit is exceeded practically the whole year except the winter months. Greenhouse workers also perform certain tasks outside, so it is necessary to take even more precautions.
Inside the greenhouse it has been shown that there are UVI differences due to various factors as the heterogeneity of the whitewashing, the wear of the plastic cover and the accumulation of dirt in said plastic cover. These UVI differences are greater in periods where the UVI is greater, as summer and spring. In addition, it is observed that the highest UVI values are usually located in the south-west corner of the greenhouse.
On the other hand, a diagram called “UVIgram” has been created which offers climatological and UV radiation information about of a location for each month and global of the whole year. It relates monthly average temperatures and maximum value of the UV index.
Finally, some recommendations and prevention measures to reduce the risk of UV radiation damage in greenhouse workers are given. One of them is especially interesting and its effectiveness has been observed in this study. It is about the whitening of the plastic cover of the greenhouse, being recommended whenever possible and has no negative effects on the harvest. In addition, an alarm system has been designed to alert workers by means of a audible and luminous signal when UVI values close to the risk limit are reached.

Author Contributions

Conceptualization, R.A.G.-R., J.L.-M., J.L.B.-C., J.P.-A. and Á.J.C.-F.; methodology, R.A.G.-R., J.L.-M., J.L.B.-C., J.P.-A. and Á.J.C.-F.; software, R.A.G.-R., and J.L.B.-C.; validation, R.A.G.-R., J.L.-M., J.L.B.-C., J.P.-A. and Á.J.C.-F.; formal analysis, R.A.G.-R., J.L.-M., J.L.B.-C., J.P.-A. and Á.J.C.-F.; investigation, R.A.G.-R., J.L.-M., J.L.B.-C., J.P.-A. and Á.J.C.-F.; resources, J.L.-M., J.L.B.-C., J.P.-A. and Á.J.C.-F.; data curation, R.A.G.-R., and J.L.B.-C.; writing—original draft preparation, R.A.G.-R.; writing–review and editing, R.A.G.-R., J.L.-M., J.L.B.-C., J.P.-A. and Á.J.C.-F.; visualization, R.A.G.-R., J.L.-M., J.L.B.-C., J.P.-A. and Á.J.C.-F.; supervision, J.L.-M., J.L.B.-C., J.P.-A. and Á.J.C.-F.; project administration, J.L.-M., J.L.B.-C., J.P.-A. and Á.J.C.-F.; funding acquisition, Á.J.C.-F. All authors have read and agreed to the published version of the manuscript.

Funding

This research was funded by Research Contract CG 401370 of University of Almería and by Laboratory-Observatory Andalusian Working Conditions in the Agricultural Sector (LASA).

Conflicts of Interest

The authors declare no conflict of interest. The funders had no role in the design of the study; in the collection, analyses, or interpretation of data; in the writing of the manuscript, or in the decision to publish the results.

Abbreviations

The following abbreviations are used in this manuscript:
CETCentral European Time
CMMCutaneous Malignant Melanoma
CPD-UALData Processing Centre of the University of Almería
HTTPHypertext Transfer Protocol
NMSCNon-Melanoma Skin Cancer
MRFMarkov Random Fields
NATNetwork Address Translation
OSHOccupational Safety and Health
PMSPantone Matching System
SBCSingle Board Computer
SPFSun Protection Factor of sunscreens
SSHSecure SHell
UPFUltraviolet Protection Factor for clothing
UPSUninterruptible Power Supply
UTCCoordinated Universal Time
UVUltraviolet
UVIUltraviolet Index
WHOWorld Health Organization

References

  1. Amar, S.K.; Goyal, S.; Srivastav, A.K.; Chopra, D.; Ray, R.S. Combined effect of Benzophenone-2 and ultraviolet radiation promote photogenotoxicity and photocytotoxicity in human keratinocytes. Regul. Toxicol. Pharmacol. 2018, 95, 298–306. [Google Scholar] [CrossRef]
  2. Kerr, J.; McElroy, C.; Tarasick, D.; Wardle, D. The Canadian ozone watch and UV-B advisory programs. Ozone Trop. Stratos. NASA Conf. Publ. 1994, 3266, 794–797. [Google Scholar]
  3. World Health Organization(WHO); World Meteorological Organization (WMO); United Nations Environment Programme (UNEP); International Commission on Non-Ionizing Radiation Protection (ICNIRP). Global Solar UV Index: A Practical Guide; WHO: Geneva, Switzerland, 2002. [Google Scholar]
  4. ISO/CIE 17166:2019. Erythema Reference Action Spectrum and Standard Erythema Dose; Standard, International Organization for Standardization: Geneva, Switzerland, 2019. [Google Scholar]
  5. Lehmann, M.; Pfahlberg, A.B.; Sandmann, H.; Uter, W.; Gefeller, O. Public Health Messages Associated with Low UV Index Values Need Reconsideration. Int. J. Environ. Res. Public Health 2019, 16, 2067. [Google Scholar] [CrossRef] [PubMed] [Green Version]
  6. Fitzpatrick, T.B. The validity and practicality of sun-reactive skin types I through VI. Arch. Dermatol. 1988, 124, 869–871. [Google Scholar] [CrossRef] [PubMed]
  7. Fitzpatrick, T.B. Soleil et peau. J. Med. Aesthet. 1992, 2, 33–34. [Google Scholar]
  8. Diffey, B.L. Ultraviolet radiation and human health. Clin. Dermatol. 1998, 16, 83–89. [Google Scholar] [CrossRef]
  9. Vecchia, P.; Hietanen, M.; Stuck, B.E.; Van Deventer, E.; Niu, S. Protecting Workers from Ultraviolet Radiation; International Commission on Non-Ionizing Radiation Protection: Oberschleißheim, Germany, 2007; Volume 14. [Google Scholar]
  10. International Agency for Research on Cancer. Solar and ultraviolet radiation. In Monographs on the Evaluation of Carcinogenic Risks to Humans; International Agency for Research on Cancer: Lyon, France, 1992; Volume 55. [Google Scholar]
  11. Young, R.W. The family of sunlight-related eye diseases. Optom. Vis. Sci. Off. Publ. Am. Acad. Optom. 1994, 71, 125–144. [Google Scholar] [CrossRef]
  12. Jemal, A.; Bray, F.; Center, M.M.; Ferlay, J.; Ward, E.; Forman, D. Global cancer statistics. CA Cancer J. Clin. 2011, 61, 69–90. [Google Scholar] [CrossRef] [Green Version]
  13. Torre, L.A.; Bray, F.; Siegel, R.L.; Ferlay, J.; Lortet-Tieulent, J.; Jemal, A. Global cancer statistics, 2012. CA Cancer J. Clin. 2015, 65, 87–108. [Google Scholar] [CrossRef] [Green Version]
  14. Radespiel-Tröger, M.; Meyer, M.; Pfahlberg, A.; Lausen, B.; Uter, W.; Gefeller, O. Outdoor work and skin cancer incidence: A registry-based study in Bavaria. Int. Arch. Occup. Environ. Health 2009, 82, 357. [Google Scholar] [CrossRef]
  15. Coldiron, B.M. The UV index: A weather report for skin. Clin. Dermatol. 1998, 16, 441–446. [Google Scholar] [CrossRef]
  16. Milon, A.; Sottas, P.E.; Bulliard, J.L.; Vernez, D. Effective exposure to solar UV in building workers: Influence of local and individual factors. J. Expo. Sci. Environ. Epidemiol. 2007, 17, 58. [Google Scholar] [CrossRef] [PubMed] [Green Version]
  17. Silva, A.A. The diffuse component of erythemal ultraviolet radiation. Photochem. Photobiol. Sci. 2015, 14, 1941–1951. [Google Scholar] [CrossRef] [PubMed]
  18. Cañada, J.; Esteve, A.; Marin, M.; Utrillas, M.; Tena, F.; Martínez-Lozano, J. Study of erythemal, UV (A+B) and global solar radiation in Valencia (Spain). Int. J. Climatol. 2008, 28, 693–702. [Google Scholar] [CrossRef]
  19. Rusińska, A.; Pludowski, P.; Walczak, M.; Borszewska-Kornacka, M.K.; Bossowski, A.; Chlebna-Sokół, D.; Czech-Kowalska, J.; Dobrzańska, A.; Franek, E.; Helwich, E.; et al. Vitamin D supplementation guidelines for general population and groups at risk of vitamin D deficiency in Poland–recommendations of the Polish Society of Pediatric Endocrinology and Diabetes and the Expert Panel with participation of National Specialist Consultants and Representatives of Scientific Societies—2018 update. Front. Endocrinol. 2018, 9, 246. [Google Scholar] [CrossRef]
  20. Krzyścin, J.W.; Lesiak, A.; Narbutt, J.; Sobolewski, P.; Guzikowski, J. Perspectives of UV nowcasting to monitor personal pro-health outdoor activities. J. Photochem. Photobiol. B Biol. 2018, 184, 27–33. [Google Scholar] [CrossRef]
  21. Webb, A.R.; Holick, M.F. The role of sunlight in the cutaneous production of vitamin D3. Annu. Rev. Nutr. 1988, 8, 375–399. [Google Scholar] [CrossRef]
  22. Thieden, E.; Philipsen, P.A.; Heydenreich, J.; Wulf, H.C. UV radiation exposure related to age, sex, occupation, and sun behavior based on time-stamped personal dosimeter readings. Arch. Dermatol. 2004, 140, 197–203. [Google Scholar] [CrossRef] [Green Version]
  23. Stepanski, B.M.; Mayer, J.A. Solar protection behaviors among outdoor workers. J. Occup. Environ. Med. 1998, 40, 43–48. [Google Scholar] [CrossRef]
  24. Kasparian, N.A.; McLoone, J.K.; Meiser, B. Skin cancer-related prevention and screening behaviors: A review of the literature. J. Behav. Med. 2009, 32, 406–428. [Google Scholar] [CrossRef]
  25. Buller, D.B.; Cokkinides, V.; Hall, H.I.; Hartman, A.M.; Saraiya, M.; Miller, E.; Paddock, L.; Glanz, K. Prevalence of sunburn, sun protection, and indoor tanning behaviors among Americans: Review from national surveys and case studies of 3 states. J. Am. Acad. Dermatol. 2011, 65, S114.e1–S114.e11. [Google Scholar] [CrossRef]
  26. Hault, K.; Rönsch, H.; Beissert, S.; Knuschke, P.; Bauer, A. Knowledge of outdoor workers on the effects of natural UV radiation and methods of protection against exposure. J. Eur. Acad. Dermatol. Venereol. 2016, 30, 34–37. [Google Scholar] [CrossRef] [PubMed] [Green Version]
  27. Larkö, O.; Diffey, B.L. Natural UV-B radiation received by people with outdoor, indoor, and mixed occupations and UV-B treatment of psoriasis. Clin. Exp. Dermatol. 1983, 8, 279–285. [Google Scholar] [CrossRef] [PubMed]
  28. Holman, C.D.J.; Gibson, I.M.; Stephenson, M.; Armstrong, B.K. Ultraviolet irradiation of human body sites in relation to occupation and outdoor activity: Field studies using personal UVR dosimeters. Clin. Exp. Dermatol. 1983, 8, 269–277. [Google Scholar] [CrossRef] [PubMed]
  29. Serrano, M.A.; Cañada, J.; Moreno, J.C. Erythemal Ultraviolet exposure in two groups of outdoor workers in Valencia, Spain. Photochem. Photobiol. 2009, 85, 1468–1473. [Google Scholar] [CrossRef] [Green Version]
  30. Gies, P.; Wright, J. Measured solar ultraviolet radiation exposures of outdoor workers in Queensland in the building and construction industry. Photochem. Photobiol. 2003, 78, 342–348. [Google Scholar] [CrossRef]
  31. Hammond, V.; Reeder, A.; Gray, A. Patterns of real-time occupational ultraviolet radiation exposure among a sample of outdoor workers in New Zealand. Public Health 2009, 123, 182–187. [Google Scholar] [CrossRef]
  32. Sliney, D.H. UV radiation ocular exposure dosimetry. J. Photochem. Photobiol. B Biol. 1995, 31, 69–77. [Google Scholar] [CrossRef]
  33. World Meteorological Organization (WMO). Scientific Assessment of Ozone Depletion: 2014, Global Ozone Research and Monitoring Project—Report; WMO: Geneva, Switzerland, 2014; Volume 55, p. 416. [Google Scholar]
  34. Robaa, S. A study of ultraviolet solar radiation at Cairo urban area, Egypt. Sol. Energy 2004, 77, 251–259. [Google Scholar] [CrossRef]
  35. Cabrera, A.; Uclés, D.; Agüera, T. Informes y Monografías / Análisis de la Campaña Hortofrutícola de Almería 2015/2016 [Reports and Monographs/ Analysis of the Fruit and Vegetable Sector of Almería 2015/2016]; Fundación Cajamar: Almería, España, 2016. [Google Scholar]
  36. Statuto, D.; Picuno, P.; Abdel-Ghany, A.M. Shading methods for crop protection under greenhouse in Mediterranean areas. In Proceedings of the 47th International Symposium, Actual Tasks on Agricultural Engineering, Opatija, Croatia, 5–7 March 2019; University of Zagreb, Faculty of Agriculture: Zagreb, Croatia, 2019; pp. 297–306. [Google Scholar]
  37. Callejón-Ferre, A.J.; Pérez-Alonso, J.; Sánchez-Hermosilla, J.; Carreño-Ortega, A. Ergonomics and psycho-sociological quality indexes in greenhouses, Almería (Spain). Span. J. Agric. Res. 2009, 7, 50–58. [Google Scholar] [CrossRef] [Green Version]
  38. Pérez-Alonso, J.; Callejón-Ferre, A.J.; Carreño-Ortega, A.; Sánchez-Hermosilla, J. Approach to the evaluation of the thermal work environment in the greenhouse-construction industry of SE Spain. Build. Environ. 2011, 46, 1725–1734. [Google Scholar] [CrossRef]
  39. Gómez-Galán, M.; Pérez-Alonso, J.; Callejón-Ferre, Á.J.; Sánchez-Hermosilla-López, J. Assessment of postural load during melon cultivation in Mediterranean greenhouses. Sustainability 2018, 10, 2729. [Google Scholar] [CrossRef] [Green Version]
  40. Gómez-Galán, M.; González-Parra, J.M.; Pérez-Alonso, J.; Golasi, I.; Callejón-Ferre, Á.J. Forced Postures in Courgette Greenhouse Workers. Agronomy 2019, 9, 253. [Google Scholar] [CrossRef] [Green Version]
  41. García-Ruiz, R.A.; López-Martínez, J.; Blanco-Claraco, J.L.; Pérez-Alonso, J.; Callejón-Ferre, Á.J. On air temperature distribution and ISO 7726-defined heterogeneity inside a typical greenhouse in Almería. Comput. Electron. Agric. 2018, 151, 264–275. [Google Scholar] [CrossRef]
  42. López-Martínez, J.; Blanco-Claraco, J.L.; Pérez-Alonso, J.; Callejón-Ferre, A.J. Distributed network for measuring climatic parameters in heterogeneous environments: Application in a greenhouse. Comput. Electron. Agric. 2018, 145, 105–121. [Google Scholar] [CrossRef]
  43. Carmona-Benjumea, A. Datos antropométricos de la población laboral española. In Prevención, Trabajo y Salud; Revista del Instituto Nacional de Seguridad e Higiene en el Trabajo: Madrid, Spain, 2001; Volume 14, pp. 22–35. [Google Scholar]
  44. Scordo, A.; Maltese, A.; Ciraolo, G.; La Loggia, G. Estimation of the time lag occurring between vegetation indices and aridity indices in a Sicilian semi-arid catchment. Ital. J. Remote Sens. 2009, 41, 33–46. [Google Scholar] [CrossRef]
  45. Callejon-Ferre, A.J.; Manzano-Agugliaro, F.; Diaz-Perez, M.; Carreno-Sanchez, J. Improving the climate safety of workers in Almería-type greenhouses in Spain by predicting the periods when they are most likely to suffer thermal stress. Appl. Ergon. 2011, 42, 391–396. [Google Scholar] [CrossRef]
  46. Gambichler, T.; Laperre, J.; Hoffmann, K. The European standard for sun-protective clothing: EN 13758. J. Eur. Acad. Dermatol. Venereol. 2006, 20, 125–130. [Google Scholar] [CrossRef]
  47. CIE. Sunscreen Testing (UVB); Report cie 90; CIE: Vienna, Austria, 1991; ISBN 3900734275. [Google Scholar]
Figure 1. UV radiation exposure categories and International colour codes. Figure extracted from [3].
Agronomy 10 00145 g001
Figure 2. Interior of the greenhouse studied and detail of one of the sensors installed for the measurement of UV radiation.
Agronomy 10 00145 g002
Figure 3. Drawing of the greenhouse, where are indicated the locations of the measurement stations.
Agronomy 10 00145 g003
Figure 4. Diagram of the designed data network architecture.
Agronomy 10 00145 g004
Figure 5. UVI measured by all measurement stations during 6 October 2018.
Agronomy 10 00145 g005
Figure 6. Image capture of the 3D video of the UVI measurements inside the greenhouse at 12:25 a.m., 21st July 2018.
Agronomy 10 00145 g006
Figure 7. Maximum daily UVI outside and inside the greenhouse.
Agronomy 10 00145 g007
Figure 8. Image of the greenhouse on November 2018, when the tomato crop reached around 2.20 m high.
Agronomy 10 00145 g008
Figure 9. UVI ratio (UVI inside the greenhouse / UVI outside) in dB.
Agronomy 10 00145 g009
Figure 10. UVI measured by the 12 measurement stations of inside the greenhouse for two consecutive days (without and with whitewashing, respectively).
Agronomy 10 00145 g010
Figure 11. Average day and standard deviation ( ± 1 σ ) of UVI per season:
Agronomy 10 00145 g011
Figure 12. UVIgram that relates the average monthly temperature and the maximum monthly UVI inside the greenhouse; the maximum monthly UVI were measured on 5 July 2018 at 12:44 a.m. by MS (Measure Station) 5, 2 August 2018 at 12:27 a.m. by MS 4, 14 September 2018 at 12:21 a.m. by MS 12, 13 October 2018 at 11:59 a.m. by MS 12, 4 November 2018 at 11:59 a.m. by MS 12, 4 December 2018 at 11:58 a.m. by MS 12, 31 January 2019 at 12:40 a.m. by MS 10, 25 February 2019 at 12:14 a.m. by MS 11, 5 March 2019 at 12:42 a.m. by MS 11, 30 April 2019 at 12:47 a.m. by MS 11, 31 May 2019 at 12:16 a.m. by MS 12 and 26 June 2019 at 12:12 a.m. by MS 12.
Agronomy 10 00145 g012
Table 1. Skin types defined by Fitzpatrick and its characteristics [6,7].
Skin TypeSkin ColourSkin PhotoypeSunburn after Sun ExposureTan after Sun Exposure
IVery white, with light eyes and hairDeficient in melaninAlwaysNever
IIWhite, with light eyes and hairDeficient in melaninUsuallySometimes
IIIWhite, with intermediate eyes and hairWith enough melaninSometimesUsually
IVTanned, with dark eyes and hairWith enough melaninOccasionallyAlways
VDark, with dark eyes and hairWith melanic protectionSeldomIntense tanning
VIBlack, with black eyes and hairWith melanic protectionNeverMaximum tanning
Table 2. Characteristics of the sensors for the measurement of UV radiation.
ManufacturerModelMeasurement RangeAccuracyOperating TemperatureDegree of Protection Against Dust and Water
Sglux GmbHUV-Cosine-UVI0–30 UVI± 1.3%−25 a 80 °CIP 68
Table 3. Maximum monthly differences of UVI inside the greenhouse.
MonthMaximum UVI Differences
July 20182.54
August 20181.11
September 20181.23
October 20181.51
November 20180.70
December 20180.38
January 20190.51
February 20191.42
March 20191.15
April 20191.26
May 20192.34
June 20192.37

