Article

Identifying the Critical Stage Near Anthesis for Waterlogging on Wheat Yield and Its Components in the Yangtze River Basin, China

1
Jiangsu Key Laboratory of Crop Genetics and Physiology, Agricultural College of Yangzhou University, Yangzhou 225009, China
2
Jiangsu Key Laboratory of Crop Cultivation and Physiology, Agricultural College of Yangzhou University, Yangzhou 225009, China
3
Co-Innovation Center for Modern Production Technology of Grain Crops, Yangzhou University, Yangzhou 225009, China
*
Authors to whom correspondence should be addressed.
Agronomy 2020, 10(1), 130; https://doi.org/10.3390/agronomy10010130
Submission received: 19 December 2019 / Revised: 13 January 2020 / Accepted: 14 January 2020 / Published: 16 January 2020
(This article belongs to the Special Issue Impacts of Climate Change on Sustainable Agricultural Development)

Abstract

:
Frequent waterlogging near anthesis is a primary constraint for wheat production in the Yangtze River Basin, China. This study aimed to identify the critical stage for waterlogging on wheat yield and its components and identify the possible factors determining this stage. In the first experiment (E1), we evaluated three varieties and initiated a 10-day waterlogging starting at the stem elongation (S1), booting (S2), and anthesis (S3) stages. In the second experiment (E2), waterlogging was applied at the stem elongation (S1) and anthesis (S3) stages and for three durations (five, 10, and 15 days). In E1, waterlogging at S1 and S2 resulted in a lower grain yield than at S3. In the second year of E1, grain yield under waterlogging at S1 and S3 was similar but significantly lower than under waterlogging conditions at S2. Waterlogging at S1 and S2 greatly decreased the kernel number per spike and 1000-kernel weight, but waterlogging at S3 only decreased the 1000-kernel weight. Moreover, different varieties did not change the stages mostly reducing grain yield and yield components. In E2, grain yield decreased with prolonged exposure to waterlogging and was significantly lower under 15-day conditions than the five-day conditions. There was no significant interaction between the stage and duration of waterlogging. Finally, our results indicate that in yield formation, a greater reliance on kernel weight instead of the kernel number per spike can contribute to a reduction in yield loss for waterlogging at S1 and S2. This study, therefore, indicates that the stem elongation stage is the most affected by waterlogging.

1. Introduction

Waterlogging is a major abiotic stress constraining wheat production and is likely to become severe in humid areas where increased rainfall is expected with global climate change [1]. According to earlier studies, soil waterlogging frequently occurs on 12% of the arable land worldwide, resulting in a yield reduction of about 20% [2]. In China, waterlogging events are concentrated in the Yangtze River Basin (YR), which is one of two main areas of wheat production in the country (the other is the Huang-Huai-Hai Plain region). Regularly occurring waterlogging is partially attributed to the high rainfall that exceeds requirements for wheat. Additionally, the continuous long-term rice-wheat rotation, mostly conducted in the YR area, results in poorly aerated soil as a result of no-tillage or minimal tillage farming, further exacerbating waterlogging stress. These factors are believed to cause a 10% wheat yield loss every two years, and 20% every five years [3].
Waterlogging influences wheat yield by multiple mechanisms, including phenology, morphology, anatomy, nutrition, and metabolism [2]. Most literature has reported that waterlogging significantly decreases grain yield due to an inhibition of photosynthesis, respiration, and transpiration, resulting in an accumulation and remobilization of assimilate in vegetative organs and yield components [4,5,6,7,8,9]. However, these responses have varied among wheat varieties, growing environments, and crop management [2,10,11,12]. Hence, studying the effects of waterlogging on wheat growth across regions and using local varieties appear necessary.
Except for the above-mentioned limiting factors, the stages when waterlogging occurs have attracted significant attention across plant species, including in wheat [13,14], maize [15,16], oilseeds rap [17], and cotton [18]. Identification of the critical stage when waterlogging causes damage that reaches an economic threshold will allow for damages to be more accurately measured. This type of information will also allow for the breeding of waterlogging-tolerant varieties and for the application of yield losses reduction technology to alleviate waterlogging.
Currently, there are some discrepancies among existing reports for what are the critical plant development stage and the critical duration of time in which waterlogging can negatively affect plants. Wu et al. [19] reported that waterlogging at the seedling stage more negatively affected wheat yield compared with the late growth stages, but Dickin et al. [10] observed that the stress at this stage did not significantly affect wheat yield. Most previous studies identify the most sensitive time of exposure to waterlogging stress for wheat was the period near anthesis [2,4,13]. However, the exact stage is still disputed. Reasonable explanations for the differences that have been observed are ecology and cultivation conditions, variety, plant type (e.g., large-spike and multi-spike), methodology, and stress level [2,20,21,22].
The weather conditions during and after waterlogging are likely to also impact damage and subsequent recovery. However, there are fewer reports on these conditions, possibly due to the complexity of combining experiments with multiple stressors in a natural environment. Trought and Drew [23] noted that waterlogging damage was greater in plants at a higher soil temperature, and Liu et al. [24] reported that during the grain-filling phase, the combination of waterlogging and shading stress more negatively affected wheat yield than waterlogging alone. Moreover, Dickin et al. [10] considered that vigorous growth after waterlogging conducted at the seedling stage eliminated the damages and that the final yield was not negatively affected. However, it has also been suggested that a full recovery is not possible, due to a reduction in the establishment of large-spikes [25,26]. These results suggest that the degree of recovery after waterlogging profoundly affected the potential of yield loss. According to Marti et al. [27], waterlogging at stem elongation significantly decreases the number of kernels per spike but just marginally reduces kernel weight, implying that kernel weight can partly compensate the losses of the kernel number. Therefore, understanding the changes in yield under waterlogging at different growth stages can help to identify appropriate remedial measures for strengthening certain yield components.
In this study, a two-year experiment was conducted from 2014 to 2015 and 2015 to 2016 in a typical growing environment in the YR area, where approximately 60% of rainfall during the growing season occurs from stem elongation to grain-filling. Therefore, in order to identify the critical stage mostly affecting grain yield and its components, the stages of plant development that were investigated were stem elongation, booting, and anthesis. Furthermore, the first experiment included three varieties (Yangmai 1, Yangmai 158, and Yangfumai 4). The second experiment investigated the waterlogging duration (five-, 10-, and 15-day) applied at two stages: stem elongation and anthesis. Weather data were recorded to allow us to infer whether it affects the identification of the critical stage.

2. Materials and Methods

2.1. Growth Conditions

The experiment was conducted during wheat-growing seasons of 2014–2015 (2015) and 2015–2016 (2016) at the Agricultural Experiment Station locating in the Agricultural College of Yangzhou University (32°23′29.3″ N, 119°25′10.9″ E), China. This station is located in a humid north subtropical monsoon climate zone. All the tests used a PVC pot with a top diameter of 26 cm, a bottom diameter of 18 cm, and a depth of 26 cm. There were eight drainage holes at the base. The upper 0–20 cm of topsoil was excavated from a local field, dried naturally, and sieved through the 5 mm mesh. The sieved soil was weighed to 11 kg and mixed with a pre-prepared 0.83 g urea (containing 46% N) and 3.6 g compound fertilizer (containing 15% N, 15% P2O5, and 15% K2O using urea, ammonium phosphate, and potassium chloride as the main raw materials). The pots were filled with the soil mixture, watered with 5 L of water, and left for 2–3 days for the soil to settle and water to drain. On 3 November in 2014 and 2015, 11 seeds were uniformly placed on the soil surface and covered using 1 kg of the original sieved soil. Eight seedlings (2015) or six seedlings (2016) with similar plant sizes were retained at the three-leaf stage (Zadoks growth stage [28], GS13).
At the four-leaf stage (GS14), each pot was top-dressed with 0.42 g of urea dissolved in water, and 0.83 g of urea and 3.6 g of compound fertilizer were applied at the jointing stage (GS31). Insecticides and fungicides were used to control pests and diseases, but weeds were removed by hand to prevent biotic stresses. The soil was a loamy clay, which for the 2015 experiments, contained 9.62 g kg−1 organic C, 79.95 mg kg−1 available N, 38.52 mg kg−1 available P, and 85.37 mg kg−1 available K. The equivalent values for the 2016 experiment were 10.61 g kg−1 organic C, 52.35 mg kg−1 available N, 37.35 mg kg−1 available P, and 96.51 mg kg−1 available K. The tests were performed outdoors. Weather data for the experiments are shown in Figure 1.

2.2. Waterlogging Treatments and Water Drainage Condition

Following methods outlined by de San Celedonio et al. [13], all the pots were placed on flat ground and regularly moved to facilitate drainage. A pool (4 m × 1.2 m × 0.3 m) was used for the waterlogging. Once the pots used for waterlogging treatment were moved into the pool, a 1–2 cm layer of water was maintained above the soil surface for the entirety of the waterlogging phase. Following treatment, pots were removed from the water and allowed to drain freely before irrigating again, which did not occur for 3–5 days following waterlogging treatment. Pots in the water drainage scenario (from sowing to harvest) and the waterlogged pots (before and after the treatments) were irrigated as necessary to maintain 15%–20% volumetric soil moisture (approximately 80% of field capacity). The volumetric soil moisture was measured using a moisture meter (TZS-1, TOP, Hangzhou, China).

2.3. Experimental Design

2.3.1. Experiment 1

This experiment was conducted in 2015 and 2016 using a split-plot design with winter wheat varieties (Triticum aestivum L.) as the main plot, and the soil water treatments were used as the subplot. There were five pots (replicates) per treatment combination. The varieties included Yangmai 1, Yangmai 158, and Yangfumai 4 that contained different sized spikes and were widely planted in the 1970s, 1990s, and 2010s in the YR area. The information on these varieties, including the year of release, genealogy, and sown area, have been reported by Ding et al. [29]. Soil water treatments included the water drainage condition as the control treatment (CK), and waterlogging was conducted for 10 days beginning at stem elongation (GS33, S1), booting (GS45, S2), and anthesis (GS65, S3).

2.3.2. Experiment 2

In 2016, another split-plot design experiment was conducted using “Yangfumai 4”, because it has been widely planted in the YR area in recent years. The main plot was used to assess the effects of timing of waterlogging by growth stage (stem elongation (GS33, S1) and anthesis (GS65, S3)), and the subplot was used to assess the effects of the duration of waterlogging (5, 10, and 15 days, separately). The pots under the water drainage condition served as the control treatment (CK).

2.4. Measurements

At maturity (GS92), the number of spikes per plant was recorded, harvested, and threshed. The number of kernels per pot was counted and weighed to calculate the kernel number per spike and 1000-kernel weight. A Grain Analyzer (Infratec™ 1241, Foss, Denmark) was used to measure the grain moisture, and 1000-kernel weight and grain yield were corrected to 13% moisture. The percent reduction in grain yield (%RGY) was calculated as:
% RGY   = ( ( GYc     GYw ) / GYc )   ×   100 ,
where GYc and GYw refer to grain yield under the control condition and under the waterlogging treatment, respectively.

2.5. Statistical Analyses

All statistical analyses were conducted using the DPS 7.05 statistical package. An analysis of variance was used to determine the significance of the main effects and the interactions of treatments on grain yield and yield components. A split-plot model was used in the analysis of variance (ANOVA). When the F value was significant, the least significant difference (LSD) test was used to compare the differences with a significance level of 0.05. The degree of correlation between different variables was determined using linear regression models.
The path analysis was adopted to estimate the effects of yield components on grain yield [30], separately for each variety in each experiment. For determining the standard partial-regression coefficient, known as a path coefficient, a single multiple linear regression model was established:
Y   =   β 0 + β 1 X 1 + β 2 X 2 + β 3 X 3 + ε ,
where Y, X1, X2, and X3 are the grain yield, spike number per plant, kernel number per spike, and 1000-kernel weight, respectively. β0 represents the Y-intercept. β1, β2, and β3 represent the slope. ε is a residual. A stepwise procedure is used to select final model parameters.
The path coefficients, including the direct and indirect effects of a correlation coefficient for each yield component on grain yield, as well as the residual on grain yield, were obtained using the model. Squaring the path coefficient as the determination coefficient indicates the degree to which the independent variable or residual can explain the total variation of the dependent variable. Therefore, the sum of determination coefficients for all independent variables and residual are equal to 2:
D 10 + D 20 + D 30 + D t + D e = 1 ,
D 10 = P 10 2 ,
D 20 = P 20 2 ,
D 30 = P 30 2 ,
D e = P e 2 ,
where D10, D20, D30, and De are the determination coefficient for the direct effect of spike number per plant, number of kernels per spike, 1000-kernel weight, and residual on grain yield, respectively. P10, P20, P30, and Pe are their path coefficients. Dt is the determination coefficient for other variables (i.e., all indirect effects of yield components on yield).
The results showed that the final parameters of all models only included the number of kernels per spike and the 1000-kernel weight (except for Experiment 2, which had one more parameter of spike number per plant). To use uniform parameters in order to compare, we did not consider D10:
D 20 + D 30 + D t + D e =   1 ,
where Dt′ consists of the determination coefficients for all variable effects on grain yield except for D20, D30, and De.

3. Results

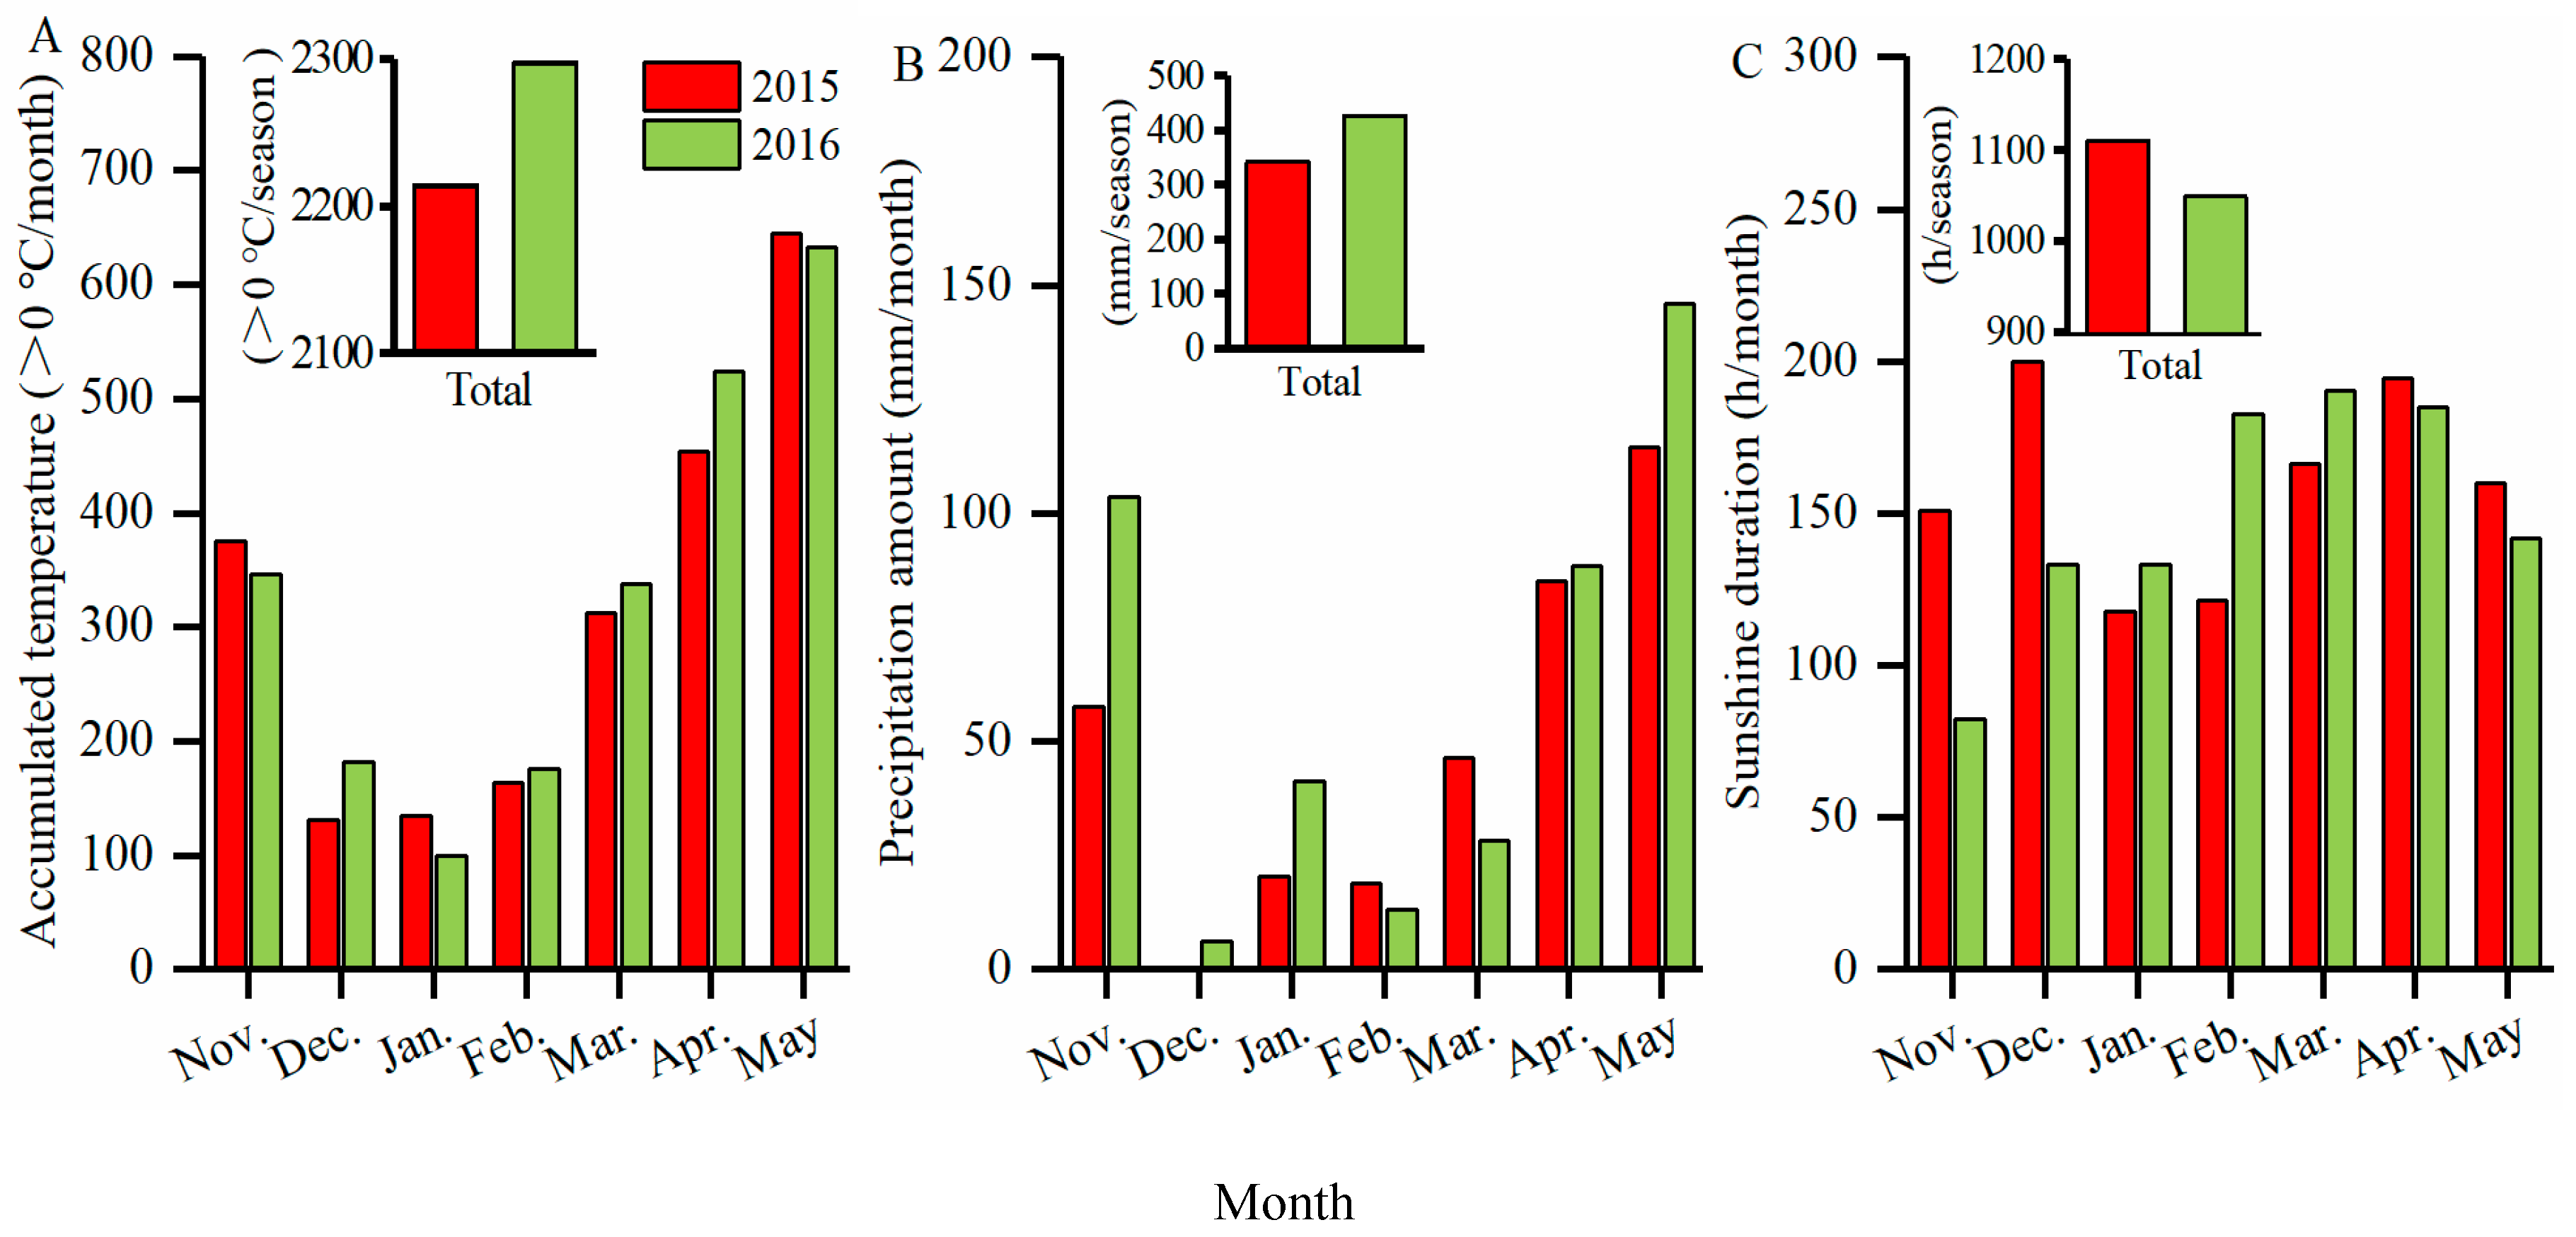
3.1. Meteorological Conditions and Phenology

As shown in Figure 1, a large amount of precipitation occurred from March to May, especially in May when the environment was hot, humid, and had a short sunshine duration. Relative to 2015, in 2016 there was a higher total accumulation of temperature and precipitation but a lower total sunshine duration, especially from April to May.
Between 2015 and 2016, the differences in the daily mean temperature during waterlogging were slight, but the daily mean temperature during waterlogging was higher at S3 than S1 and S2, ranging from 12 °C at S1 to 20 °C at S3 (Figure 2). The daily mean sunshine duration during waterlogging at S1, S2, and S3 was 3.7, 3.7, and 8.6 h in 2015 and 6.0, 5.4, and 6.4 h in 2016, respectively.
Observations indicated that the waterlogging treatments did not change the plant phenology. The dates of stem elongation and anthesis for “Yangmai 1” were earlier by 1–2 days than for “Yangmai 158” and “Yangfumai 4”. There was a similar date of S1 (11 Macrch 2015 and 13 March 2016) and S2 (29 March 2015 and 30 March 2016) between the two years. However, the initial date of waterlogging at S3 in 2016 (13 April 2016) was earlier by nine days than in 2015 (22 May 2015), likely due to high temperatures during early April, which promoted growth (Figure 1A and Figure 2B). Additionally, the period of maturity in 2016 (28 May 2016) was eight days earlier than in 2015 (5 June 2015).

3.2. Grain Yield

In Experiment 1, there were significant effects of varieties and soil water treatments on grain yield, but a significant interaction was only found in 2015 (Table 1). The average grain yield of “Yangfumai 4” and “Yangmai 158” was significantly higher than “Yangmai 1” in 2015, but in 2016, only “Yangfumai 4” was significantly greater (Table 2). Waterlogging decreased grain yield by an average of 20% in 2015 and by 15% in 2016, while grain yield was similar between the two years (Table 3 and Table 4). In 2015, waterlogging at S1 and S2 caused significantly more yield loss compared with S3 with no difference between S1 and S2. In 2016, waterlogging at S1 and S3 had the most negative effect on grain yield with no difference between S1 and S3. It should be noted that compared with “Yangmai 158” and “Yangfumai 4,” “Yangmai 1” was relatively insensitive to waterlogging in 2015 and exhibited the lowest average %RGY in both years.
In Experiment 2, waterlogging duration significantly affected grain yield, but the growth stages during which waterlogging was applied did not (Table 5), and there was no significant interaction between growth stages and waterlogging durations. The results showed that grain yield decreased with prolonged exposure to waterlogging (Table 6). Grain yield for the 15-day waterlogging was significantly lower than the five-day waterlogging for the S1 stage, and grain yield for the 15-day waterlogging was significantly lower than both five- and 10-day waterlogging when applied at the S3 stage.

3.3. Yield Components

In Experiment 1, there was a similar spike number per plant between the varieties Yangmai 1, Yangmai 158, and Yangfumai 4 in both years, except that Yangfumai 4 was significantly lower than other varieties in 2015 (Table 1 and Table 2). In both years, the kernel number per spike and 1000-kernel weight of “Yangfumai 4” were significantly higher than “Yangmai 158,” which was significantly higher than “Yangmai 1”. Soil water treatments did not affect the spike number per plant but significantly affected the kernel number per spike and 1000-kernel weight (Table 1). Following the growth stage when waterlogging was imposed from stem elongation to post-anthesis, the influence of waterlogging on the kernel number per spike declined but increased on 1000-kernel weight. This pattern was consistent for all the varieties in both years (Table 3 and Table 4), although there was a significant interaction between varieties and the growth stage in which waterlogging was imposed in 2015. Additionally, waterlogging at the S3 stage did not affect the kernel number per spike but dramatically decreased the 1000-kernel weight in the two seasons, while waterlogging implemented at the S1 and S2 stages significantly reduced both the kernel number per spike and 1000-kernel weight.
In Experiment 2, the stage when waterlogging was initiated and the waterlogging duration did not change the spike number per plant but did significantly affect the kernel number per spike and 1000-kernel weight (Table 5). Additionally, there was a significant interaction in the 1000-kernel weight. Compared with waterlogging at S3, waterlogging at S1 caused a further reduction in the kernel number per spike but had less of an effect on the 1000-kernel weight. The reductions increased with a prolonged exposure duration (Table 6). Further analysis showed that between the five- and 10-day waterlogging applications, there were no significant differences in the kernel number per spike or 1000-kernel weight, except for the 1000-kernel weight for waterlogging at S3. Conversely, the 15-day waterlogging further caused a reduction in the kernel number per spike and kernel weight.

3.4. Relationships between the Determination Coefficients of Yield Components and %RGY

As shown in Table 7, the kernel number per spike and kernel weight explained 82%–99% of the variation in grain yield among the wheat varieties. Other factors, including spike number per plant and the associative effects between yield components, determined only 1%–28%. Although the negative value of the coefficients of determination indicated that the antagonism between yield components partially affected grain yield, their influence was limited.
In order to investigate whether %RGY could be alleviated by changing the determining factors of grain yield, the linear regression models were used separately to analyze the relationships of the coefficients of determination of the kernel number per spike, 1000-kernel weight, and other variables on grain yield with %RGY (Figure 3). Results showed that the coefficients of determination for the kernel number per spike on grain yield were significantly and positively correlated with %RGY caused by waterlogging at S1 and S2, but they were negatively correlated with the coefficients of determination of the 1000-kernel weight. However, the coefficients of determination for the kernel number per spike, 1000-kernel weight, and other variables on grain yield were not significantly correlated with %RGY caused by waterlogging at S3.

4. Discussion

Many studies have attempted to identify the critical stage for waterlogging on wheat, but great differences exist in the conclusions. Setter and Waters [2] reviewed several studies on the effects of waterlogging on wheat and barley and proposed that the reproductive period is more adversely affected than the vegetative period. However, this period is still too broad and not specific enough to be used for diagnosing damages in field production. Some studies identified the critical stage of sensitivity to waterlogging, including stem elongation [8], anthesis [13], and grain-filling [4], but the results are quite varied. The key reasons for these differences are likely environments, varieties, and waterlogging methods. Thus, we carried out an experiment using widely planted local varieties according to the features of the short-term waterlogging events in the YR area. The present results demonstrated that 10-day waterlogging beginning at stem elongation resulted in greater yield losses than waterlogging initiated during the anthesis stage in 2015 or initiated during the booting stage in 2016, indicating stem elongation is the stage most critically affected by waterlogging (Table 2).
Furthermore, the results showed that waterlogging beginning at the stem elongation and booting stages caused more yield losses among the waterlogging treatments in 2015, but in 2016, waterlogging initiated at the anthesis stage resulted in greater yield losses than at the booting stage. These years had a similar temperature regime (Figure 1A). However, there were more sunshine hours in 2016 than 2015 when waterlogging was imposed at stem elongation and booting, but 57% fewer sunshine hours in the post-anthesis period. This finding is consistent with Liu et al. [24], who reported that a combination of shading and waterlogging caused a greater reduction in wheat yield during grain-fill than at stem elongation. Therefore, low radiation during waterlogging during the grain-fill period is likely to increase the adverse effects on wheat yield.
In this study, grain yield was similar between years, but yield reductions were less in 2016 than in 2015. Although the planting density was less in 2016 than in 2015, there was a similar spike number per plant between years, suggesting a vigorous growth in the wheat plant in 2016 (Table 3 and Table 4). Dickin and Wright [31] indicated that the number of shoots per plant determined the number of nodal roots per plant. Hayashi et al. [32] found that maintenance of root length density contributes to waterlogging tolerance in wheat by maintaining water uptake and photosynthate production under waterlogged conditions. Moreover, root length and density are closely related to nitrogen absorption from soil and fertilizer [33], indicating that an improved shoot nitrogen status could alleviate some of the adverse effects of waterlogging [34]. Therefore, improving plant growth in advance may contribute to the stabilization in wheat production in the face of the frequent waterlogging events during the late stages of growth.
In our study, yield reductions caused by waterlogging between stem elongation and anthesis were primarily due to a decrease in the kernel number per spike and kernel weight (Table 2). These results were consistent with the report of Ding et al. [29], but they differed to those reported by de San Celedonio et al. [13], who reported that waterlogging during stem elongation reduced not only single-spike yield but also spike number. Additionally, Marti et al. [27] reported that waterlogging during stem elongation only marginally reduced the kernel weight, though still significantly decreased the kernel number per spike. Araki et al. [4] proposed that yield loss was due to smaller grain weights, rather than decreases in spike number or the number of kernels per spike. These divergences suggest that the response of yield components to the same stages for waterlogging varies. However, the literature mostly shows that reductions in grain yield caused by waterlogging during post-anthesis result from lower grain weights [4,13,35]. Our results were in agreement with previously reported studies, showing that waterlogging implemented after anthesis only resulted in a decrease of the kernel weight. Additionally, this study indicated that when the implementing stage was changed from stem elongation to post-anthesis, the influence of waterlogging on the number of kernels per spike gradually declined, but the 1000-kernel weight increased (Table 2). Several publications have reported that waterlogging greatly affected leaf and tillering dynamics [36], photosynthetic system response [8,12], nitrogen absorption dynamics [15], and grain-filling process [4], but vary between the growth stages at which waterlogging occurs. Therefore, further experiments investigating the influence of waterlogging at various growth and subsequent physiology can help to develop accurately timed remediation measures.
A few studies have focused on the interaction of variety × the growth stage for waterlogging but did not find a significant effect [19,35]. However, many reports show different levels of waterlogging tolerance exist among varieties grown in the same region [5,10,37]. It is believed this may be due to the differences in yield components determining grain yield [21,22]. In the YR area, a genetic improvement on grain yield in wheat was primarily associated with improvements in single-spike yield [38]. In our study, three varieties had a greater kernel number per spike and kernel weight with the improvement of variety but did not differ in the spike number per plant (Table 3 and Table 4), which corresponds with the characters of wheat varieties in the YR area. Although our results showed a significant variety × the growth stage for waterlogging interaction for the kernel number per spike, 1000-kernel weight, and grain yield in 2015 (Table 2), the critical stages on these parameters were irrespective of variety (Table 3). Moreover, “Yangmai 1” exhibited the lowest %RGY compared with “Yangmai 158” and “Yangfumai 4,” suggesting “Yangmai 1” is the most waterlogging-tolerant variety among those tested (Table 3 and Table 4). However, “Yangmai 1” reached the lowest grain yield among all varieties under all the growing conditions. A similar result was reported by Ding et al. [29], who demonstrated that grain yield increased with wheat genetic improvement but waterlogging tolerance declined due to more reduction of single-spike yield by waterlogging.
Marti et al. [27] reported that at stem elongation, grain yield was reduced linearly with an increase in the duration of waterlogging. The reduction was estimated to be 2% per day [27]. Through our rough estimate, waterlogging applied at stem elongation and post-anthesis reduced grain yield by 1.5%–3.0% per day (Table 6). Furthermore, our study also shows that grain yield, the kernel number per spike, and 1000-kernel weight gradually decreased with the duration of waterlogging. Wang et al. [18] found that for cotton, the critical duration of waterlogging at the seedling, squaring, and flowering stages was 6, 4, and 2 d, respectively. Waterlogging lasting more than the critical amount could stagnate plant development and significantly reduce yield [18]. Our results showed that five-day waterlogging caused approximately 13% yield losses (Table 6), indicating that irreversible damages have occurred, caused by a short-term waterlogging for wheat. The present study investigating the effects of the duration of waterlogging was conducted in a single year with Yangfumai 4 as the material. However, whether the adverse effects are also serious for the varieties with better waterlogging tolerance needs to be further investigated.
Due to long-term breeding efforts, wheat yield improvement depends more on single-spike yield, particularly the number of kernels per spike in the YR area [38]. Additionally, a boosted kernel number per spike is also the goal for yield improvement by crop management [39]. However, our results show that when waterlogging occurs, this overdependence on the kernel number per spike can result in a greater yield loss at the stem elongation to anthesis stages but not post-anthesis (Figure 3). A greater reliance on 1000-kernel weight will not only facilitate the alleviation of yield reduction under waterlogging conditions for the stages of stem elongation to anthesis but also not result in increased yield reductions if waterlogging occurs post-anthesis. This implies that the recovery after waterlogging can partially compensate for yield losses. Regrettably, our study does not find evidence on how to compensate yield losses under waterlogging conditions post-anthesis.

5. Conclusions

Waterlogging beginning at stem elongation resulted in greater yield loss compared with the booting and anthesis stages. Waterlogging applied between stem elongation and anthesis primarily decreased the kernel number per spike and kernel weight, while waterlogging implemented after anthesis only reduced kernel weight. Prolonged stress caused further reductions in the kernel number per spike, 1000-kernel weight, and grain yield. The growth stages during which waterlogging was imposed affected grain yield and yield components were irrespective of variety and waterlogging duration. However, low radiation that is accompanied by continuous heavy rainfall due to climate change is likely to increase the adverse effects of waterlogging on wheat growth and yield. Finally, our results suggest that improving single-plant growth in advance of waterlogging, decreasing the dependence on the kernel number per spike, and increasing the reliance on kernel weight for grain yield will assist in the reduction of yield losses under waterlogging conditions during the stages from stem elongation to anthesis.

Author Contributions

Methodology, J.D.; formal analysis, J.D.; investigation, P.L. and P.W.; resources, C.L.; writing—original draft preparation, J.D.; writing—review and editing, M.Z. and X.Z.; supervision, W.G.; project administration, W.G. All authors have read and agreed to the published version of the manuscript.

Funding

This work was supported by the National Natural Science Foundation of China (31401317, 31771711); the National Key Research and Development Program of China (2016YFD0300405); Jiangsu Modern Agricultural (Wheat) Industry Technology System; the Priority Academic Program Development of Jiangsu Higher Education Institutions; Jiangsu Overseas Visiting Scholar Program for University Prominent Yong and Middle-Aged Teachers; and Science and Technology Innovation Team of Yangzhou University.

Acknowledgments

We thank the editor and three anonymous reviewers for their constructive comments.

Conflicts of Interest

The authors declare no conflicts of interest.

References

  1. Liu, C.; Allan, R.P. Observed and simulated precipitation responses in wet and dry regions 1850–2100. Environ. Res. Lett. 2013, 8, 034002. [Google Scholar] [CrossRef]
  2. Setter, T.; Waters, I. Review of prospects for germplasm improvement for waterlogging tolerance in wheat, barley and oats. Plant Soil 2003, 253, 1–34. [Google Scholar] [CrossRef]
  3. Cheng, S.; Guo, W.; Wang, L. Wheat in South China; Jiangsu Science and Technology Press: Nanjing, China, 2012. [Google Scholar]
  4. Araki, H.; Hamada, A.; Hossain, A.; Takahashi, T. Waterlogging at jointing and/or after anthesis in wheat induces early leaf senescence and impairs grain filling. Field Crops Res. 2012, 137, 27–36. [Google Scholar] [CrossRef]
  5. Arguello, M.N.; Mason, R.E.; Roberts, T.L.; Subramanian, N.; Acuña, A.; Addison, C.K.; Lozada, D.N.; Miller, R.G.; Gbur, E. Performance of soft red winter wheat subjected to field soil waterlogging: Grain yield and yield components. Field Crops Res. 2016, 194, 57–64. [Google Scholar] [CrossRef] [Green Version]
  6. Hossain, M.A.; Uddin, S.N. Mechanisms of waterlogging tolerance in wheat: Morphological and metabolic adaptations under hypoxia or anoxia. Aust. J. Crop Sci. 2011, 5, 1094–1101. [Google Scholar]
  7. Ma, J.; Huang, G.B.; Yang, D.L.; Chai, Q. Dry Matter Remobilization and Compensatory Effects in Various Internodes of Spring Wheat under Water Stress. Crop Sci. 2014, 54, 331–339. [Google Scholar] [CrossRef]
  8. Shao, G.C.; Lan, J.J.; Yu, S.E.; Liu, N.; Guo, R.Q.; She, D.L. Photosynthesis and growth of winter wheat in response to waterlogging at different growth stages. Photosynthetica 2013, 51, 429–437. [Google Scholar] [CrossRef]
  9. Tan, W.; Liu, J.; Dai, T.; Jing, Q.; Cao, W.; Jiang, D. Alterations in photosynthesis and antioxidant enzyme activity in winter wheat subjected to post-anthesis water-logging. Photosynthetica 2008, 46, 21–27. [Google Scholar] [CrossRef]
  10. Dickin, E.; Bennett, S.; Wright, D. Growth and yield responses of UK wheat cultivars to winter waterlogging. J. Agric. Sci. 2009, 147, 127–140. [Google Scholar] [CrossRef]
  11. Haque, E.; Oyanagi, A.; Kawaguchi, K. Aerenchyma Formation in the Seminal Roots of Japanese Wheat Cultivars in Relation to Growth under Waterlogged Conditions. Plant Prod. Sci. 2012, 15, 164–173. [Google Scholar] [CrossRef] [Green Version]
  12. Wu, J.D.; Li, J.C.; Wei, F.Z.; Wang, C.Y.; Zhang, Y.; Sun, G. Effects of nitrogen spraying on the post-anthesis stage of winter wheat under waterlogging stress. Acta Physiol. Plant. 2014, 36, 207–216. [Google Scholar] [CrossRef]
  13. de San Celedonio, R.P.; Abeledo, L.G.; Miralles, D.J. Identifying the critical period for waterlogging on yield and its components in wheat and barley. Plant Soil 2014, 378, 265–277. [Google Scholar] [CrossRef]
  14. Ploschuk, R.A.; Miralles, D.J.; Colmer, T.D.; Ploschuk, E.L.; Striker, G.G. Waterlogging of Winter Crops at Early and Late Stages: Impacts on Leaf Physiology, Growth and Yield. Front. Plant Sci. 2018, 9, 1863. [Google Scholar] [CrossRef] [PubMed] [Green Version]
  15. Ren, B.Z.; Dong, S.T.; Zhao, B.; Liu, P.; Zhang, J.W. Responses of Nitrogen Metabolism, Uptake and Translocation of Maize to Waterlogging at Different Growth Stages. Front. Plant Sci. 2017, 8, 1216. [Google Scholar] [CrossRef] [PubMed] [Green Version]
  16. Tian, L.; Li, J.; Bi, W.; Zuo, S.; Li, L.; Li, W.; Sun, L. Effects of waterlogging stress at different growth stages on the photosynthetic characteristics and grain yield of spring maize (Zea mays L.) Under field conditions. Agric. Water Manag. 2019, 218, 250–258. [Google Scholar] [CrossRef]
  17. Wollmer, A.C.; Pitann, B.; Mühling, K.H. Waterlogging events during stem elongation or flowering affect yield of oilseed rape (Brassica napus L.) but not seed quality. J. Agron. Crop Sci. 2018, 204, 165–174. [Google Scholar] [CrossRef]
  18. Wang, X.S.; Deng, Z.; Zhang, W.Z.; Meng, Z.J.; Chang, X.; Lv, M.C. Effect of Waterlogging Duration at Different Growth Stages on the Growth, Yield and Quality of Cotton. PLoS ONE 2017, 12, e0169029. [Google Scholar] [CrossRef] [Green Version]
  19. Wu, X.L.; Tang, Y.L.; Li, C.S.; Wu, C.; Huang, G. Chlorophyll Fluorescence and Yield Responses of Winter Wheat to Waterlogging at Different Growth Stages. Plant Prod. Sci. 2015, 18, 284–294. [Google Scholar] [CrossRef] [Green Version]
  20. Araki, H.; Hossain, M.A.; Takahashi, T. Waterlogging and Hypoxia have Permanent Effects on Wheat Root Growth and Respiration. J. Agron. Crop Sci. 2012, 198, 264–275. [Google Scholar] [CrossRef]
  21. Condon, A.G.; Giunta, F. Yield response of restricted-tillering wheat to transient waterlogging on duplex soils. Aust. J. Agric. Res. 2003, 54, 957–967. [Google Scholar] [CrossRef]
  22. Zhang, H.; Turner, N.C.; Poole, M.L.; Asseng, S. High ear number is key to achieving high wheat yields in the high-rainfall zone of south-western Australia. Aust. J. Agric. Res. 2007, 58, 21–27. [Google Scholar] [CrossRef]
  23. Trought, M.C.T.; Drew, M.C. Effects of waterlogging on young wheat plants (Triticum aestivum L.) and on soil solutes at different soil temperatures. Plant Soil 1982, 69, 311–326. [Google Scholar] [CrossRef]
  24. Liu, Y.; Shi, C.; Xuan, S.; Wei, X.; Shi, Y.; Luo, Z. Effects of Waterlogging and Shading at Jointing and Grain-Filling Stages on Yield Components of Winter Wheat. In IFIP International Federation for Information Processing; Springer Science and Business Media LLC: Berlin/Heidelberg, Germany, 2016; Volume 479, pp. 1–14. [Google Scholar]
  25. Arduini, I.; Orlandi, C.; Pampana, S.; Masoni, A. Waterlogging at tillering affects spike and spikelet formation in wheat. Crop Pasture Sci. 2016, 67, 703–711. [Google Scholar] [CrossRef]
  26. Malik, A.I.; Setter, T.L.; Schortemeyer, M.; Colmer, T.D.; Lambers, H. Short-term waterlogging has long-term effects on the growth and physiology of wheat. New Phytol. 2002, 153, 225–236. [Google Scholar] [CrossRef]
  27. Martí, J.; Savin, R.; Slafer, G.A. Wheat Yield as Affected by Length of Exposure to Waterlogging During Stem Elongation. J. Agron. Crop Sci. 2015, 201, 473–486. [Google Scholar] [CrossRef]
  28. Zadoks, J.C.; Chang, T.T.; Konzak, C.F. A decimal code for the growth stages of cereals. Weed Res. 1974, 14, 415–421. [Google Scholar] [CrossRef]
  29. Ding, J.F.; Liang, P.; Wu, P.; Zhu, M.; Li, C.Y.; Zhu, X.K.; Gao, D.R.; Chen, Y.L.; Guo, W.S. Effects of waterlogging on grain yield and associated traits of historic wheat cultivars in the middle and lower reaches of the Yangtze River, China. Field Crops Res. 2020, 246, 107695. [Google Scholar] [CrossRef]
  30. Dewey, D.R.; Lu, K.H. A correlation and path coefficient analysis of components of crested wheat grass seed production. Agron. J. 1959, 51, 515–518. [Google Scholar] [CrossRef]
  31. Dickin, E.; Wright, D. The effects of winter waterlogging and summer drought on the growth and yield of winter wheat (Triticum aestivum L.). Eur. J. Agron. 2008, 28, 234–244. [Google Scholar] [CrossRef]
  32. Hayashi, T.; Yoshida, T.; Fujii, K.; Mitsuya, S.; Tsuji, T.; Okada, Y.; Hayashi, E.; Yamauchi, A. Maintained root length density contributes to the waterlogging tolerance in common wheat (Triticum aestivum L.). Field Crops Res. 2013, 152, 27–35. [Google Scholar] [CrossRef]
  33. Dai, X.L.; Zhou, X.H.; Jia, D.Y.; Xiao, L.L.; Kong, H.B.; He, M.R. Managing the seeding rate to improve nitrogen-use efficiency of winter wheat. Field Crops Res. 2013, 154, 100–109. [Google Scholar] [CrossRef]
  34. Huang, B.; Johnson, J.W.; Nesmith, S.; Bridges, D.C. Growth, physiological and anatomical responses of two wheat genotypes to waterlogging and nutrient supply. J. Exp. Bot. 1994, 45, 193–202. [Google Scholar] [CrossRef]
  35. Hossain, A.; Araki, H.; Takahashi, T. Poor grain filling induced by waterlogging is similar to that in abnormal early ripening in wheat in Western Japan. Field Crops Res. 2011, 123, 100–108. [Google Scholar] [CrossRef]
  36. de San Celedonio, R.P.; Abeledo, L.G.; Brihet, J.M.; Miralles, D.J. Waterlogging affects leaf and tillering dynamics in wheat and barley. J. Agron. Crop Sci. 2016, 202, 409–420. [Google Scholar] [CrossRef]
  37. Collaku, A.; Harrison, S.A. Losses in wheat due to waterlogging. Crop Sci. 2002, 42, 444–450. [Google Scholar] [CrossRef]
  38. Tian, Z.; Jing, Q.; Dai, T.; Jiang, N.; Cao, W. Effects of genetic improvements on grain yield and agronomic traits of winter wheat in the Yangtze River Basin of China. Field Crops Res. 2011, 124, 417–425. [Google Scholar] [CrossRef]
  39. Ding, J.F.; Zi, Y.; Li, C.Y.; Peng, Y.X.; Zhu, X.K.; Guo, W.S. Dry Matter Accumulation, Partitioning, and Remobilization in High-Yielding Wheat under Rice-Wheat Rotation in China. Agron. J. 2016, 108, 604–614. [Google Scholar] [CrossRef]
Figure 1. (A) Accumulated temperature, (B) precipitation amount, and (C) sunshine duration at the experimental site for each month during the wheat-growing season of 2015 and 2016.
Agronomy 10 00130 g001
Figure 2. (AC) Mean daily temperature and (DF) sunshine duration at the experimental site during the waterlogging event starting at (A,D) stem elongation (S1), (B,E) booting (S2), and (C,F) anthesis (S3) stages in 2015 and 2016.
Agronomy 10 00130 g002
Figure 3. Relationships between the coefficients of determination of (A) the number of kernels per spike, (B) 1000-kernel weight, and (C) other variables on grain yield, and the percent reduction in grain yield by waterlogging during the stem elongation, booting, and anthesis stages. The data used for simple correlations analysis exclude the negative value of the coefficient of determination.
Agronomy 10 00130 g003
Table 1. ANOVA (p-value) for the effects of variety and soil water treatment and their interaction on grain yield and yield components in Experiment 1 in 2015 and 2016.
Sources20152016
Spikes Plant−1Kernels Spike−11000-Kernel WeightGrain YieldSpikes Plant−1Kernels Spike−11000-Kernel WeightGrain Yield
Variety (V)<0.001<0.001<0.001<0.0010.780<0.001<0.0010.015
S 10.633<0.001<0.001<0.0010.758<0.001<0.001<0.001
V × S0.982<0.001<0.001<0.0010.9920.9130.3430.867
1 S indicates soil water treatment. Significant at the 0.05 probability level.
Table 2. Variety and soil water treatment effect on grain yield and yield components in Experiment 1 in 2015 and 2016.
Treatments20152016
Spikes Plant−1Kernels Spike−11000-Kernel Weight (g)Grain Yield (g plant−1)Kernels Spike−11000-Kernel Weight (g)Grain Yield (g plant−1)
Variety
Yangmai 13.8 a 133.8 c33.8 c4.3 b37.3 c36.3 c5.6 b
Yangmai 1583.9 a37.1 b38.0 b5.5 a38.4 b38.2 b5.9 ab
Yangfumai 43.2 b39.2 a43.2 a5.4 a39.0 a39.4 a6.3 a
Soil water treatment
Control3.6 a39.4 a41.9 a6.0 a39.9 a40.8 a6.7 a
Waterlogging at S13.6 a32.5 c39.0 b4.6 c35.8 c38.8 b5.6 c
Waterlogging at S23.6 a35.6 b36.6 c4.6 c38.1 b37.4 c5.9 b
Waterlogging at S33.6 a39.4 a35.8 d5.1 b39.3 a34.9 d5.5 c
1 Mean values marked followed by different letters indicate a significance level of 0.05 or 0.01.
Table 3. Soil water treatment effects on grain yield, yield components, and the percent reduction in grain yield (%RGY) among wheat varieties in Experiment 1 in 2015.
VarietiesSoil Water TreatmentsSpikes Plant−1Kernels Spike−11000-Kernel Weight (g)Grain Yield (g plant−1)%RGY
Yangmai 1Control3.8 a 135.3 d36.4 f4.9 c
Waterlogging at S13.8 a31.3 g34.1 g4.0 d18.6
Waterlogging at S23.7 a33.6 ef33.0 g4.1 d16.3
Waterlogging at S33.8 a35.1 de31.7 h4.2 d14.2
Yangmai 158Control3.9 a40.1 b42.2 c6.5 a
Waterlogging at S13.9 a32.6 fg38.4 e4.9 c25.7
Waterlogging at S23.8 a35.5 d36.0 f4.9 c25.0
Waterlogging at S33.9 a40.3 b35.6 f5.6 b15.0
Yangfumai 4Control3.2 b42.9 a47.3 a6.5 a
Waterlogging at S13.2 b33.6 ef44.5 b4.8 c26.2
Waterlogging at S23.2 b37.6 c40.7 d4.8 c25.5
Waterlogging at S33.2 b42.8 a40.2 d5.4 b16.4
Mean3.636.738.35.120.3
1 Mean value marked followed by different letters indicate a significance level of 0.05 or 0.01.
Table 4. Soil water treatment effects on grain yield, yield components, and the percent reduction in grain yield (%RGY) among wheat varieties in Experiment 1 in 2016.
VarietiesSoil Water TreatmentsSpikes Plant−1Kernels Spike−11000-Kernel Weight (g)Grain Yield (g plant−1)%RGY
Yangmai 1Control4.2 a 138.6 bcd38.8 de6.3 bc
Waterlogging at S14.2 a35.3 f37.3 f5.4 de12.1
Waterlogging at S24.1 a37.2 de35.6 gh5.5 de12.2
Waterlogging at S34.0 a38.0 acd33.7 i5.1 e17.6
Yangmai 158Control4.0 a40.0 ab41.0 b6.5 b
Waterlogging at S14.0 a36.0 ef39.2 cd5.6 cde13.4
Waterlogging at S24.1 a38.2 cd37.9 ef5.9 bcd9.4
Waterlogging at S34.0 a39.6 abc34.9 h5.5 de15.3
Yangfumai 4Control4.1 a40.8 a42.7 a7.2 a
Waterlogging at S14.1 a36.0 ef40.0 bc5.8 cd18.6
Waterlogging at S24.1 a38.8 bcd38.6 de6.2 bc13.8
Waterlogging at S34.0 a40.4 ab36.1 g5.8 cd19.4
Mean4.138.338.05.914.6
1 Mean value marked followed by different letters indicate a significance level of 0.05 or 0.01.
Table 5. ANOVA (p-value) for the effects of growth stage when waterlogging as applied, waterlogging duration, and their interaction on grain yield and yield components in Experiment 2.
SourcesSpikes Plant−1Kernels Spike−11000-Kernel WeightGrain Yield
Growth Stage (S)0.1650.029<0.0010.128
Waterlogging Duration (D)0.959<0.001<0.0010.003
S × D0.9780.536<0.0010.409
Significant at the 0.05 probability level.
Table 6. Durations of waterlogging conducted at different growth stages effects on grain yield, yield components, the percent reduction in grain yield (%RGY) in Experiment 2.
Growth Stages at WaterloggingWaterlogging DurationsSpikes Plant−1Kernels Spike−11000-Kernel Weight (g)Grain Yield (g plant−1)%RGY
Waterlogging at S15-day4.0 a 138.0 bc40.8 a6.3 a12.4
10-day4.1 a36.0 c40.0 a5.8 ab18.6
15-day4.2 a33.7 d38.3 b5.5 bc23.7
Mean4.1 35.939.75.9
Waterlogging at S35-day3.9 a40.7 a38.2 b6.1 ab14.8
10-day4.0 a40.3 ab36.1 c5.8 ab19.3
15-day4.0 a37.4 c32.1 d4.8 c33.4
Mean4.039.535.55.6
1 Mean value marked followed by different alphabets indicate a significance level of 0.05 or 0.01.
Table 7. Correlation coefficients between yield components and grain yield, and direct path coefficients and the coefficients of determination of yield components on grain yield in different datasets.
VariablesExperiment 1 (2015)Experiment 1 (2016)Experiment 2
(n = 7)
YM1 1
(n = 4)
YM158
(n = 4)
YFM4
(n = 4)
YM1
(n = 4)
YM158
(n = 4)
YFM4
(n = 4)
Correlation coefficient
Spikes per plant0.6720.4800.3720.719−0.3320.6870.264
Kernels per spike0.6980.8100.7930.4210.4980.5500.552
1000-kernel weight0.7380.7220.6270.9100.7950.8320.891 ** 2
Direct path coefficient
Spikes per plant 0.248
Kernels per spike0.6720.7030.7790.4090.5930.5420.601
1000-kernel weight0.7120.5960.6080.9040.8600.8270.676
Coefficient of determination
Spikes per plant 0.062
Kernels per spike0.4510.4940.6070.1670.3520.2940.361
1000-kernel weight0.5070.3550.3700.8180.7400.6840.457
Other variables0.0350.1490.0220.011−0.1130.0080.182
Total0.9940.9990.9990.9960.9790.9860.999
Residual0.00560.00010.00080.00500.02130.01370.0006
1 YM1, YM158, and YFM4 refer to wheat varieties Yangmai 1, Yangmai 158, and Yangfumai 4. 2 ** indicates significant at the 0.01 probability level.

