
Quasi-Static Behavior of Palm-Based Elastomeric Polyurethane: For Strengthening Application of Structures under Impulsive Loadings


 ,
, 
Abstract
:
1. Introduction
2. Materials and Methods
2.1. Materials
2.2. Synthesis of the Palm-Based PU Elastomer
2.3. Fourier Transform Infrared (FT-IR) Spectroscopy Analysis
2.4. Density Determination
2.5. Shore D Hardness Test
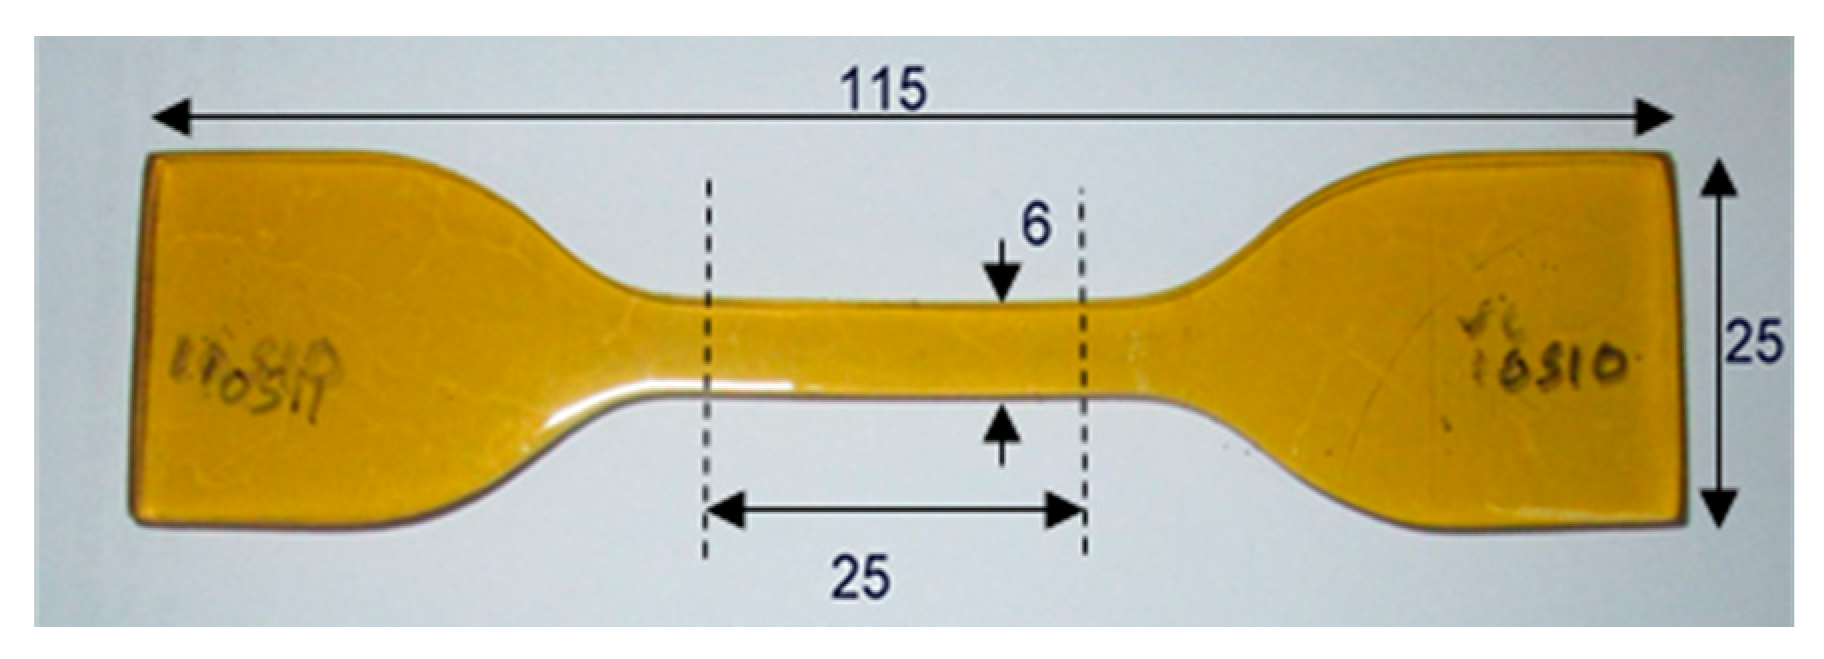
2.6. Tensile Test
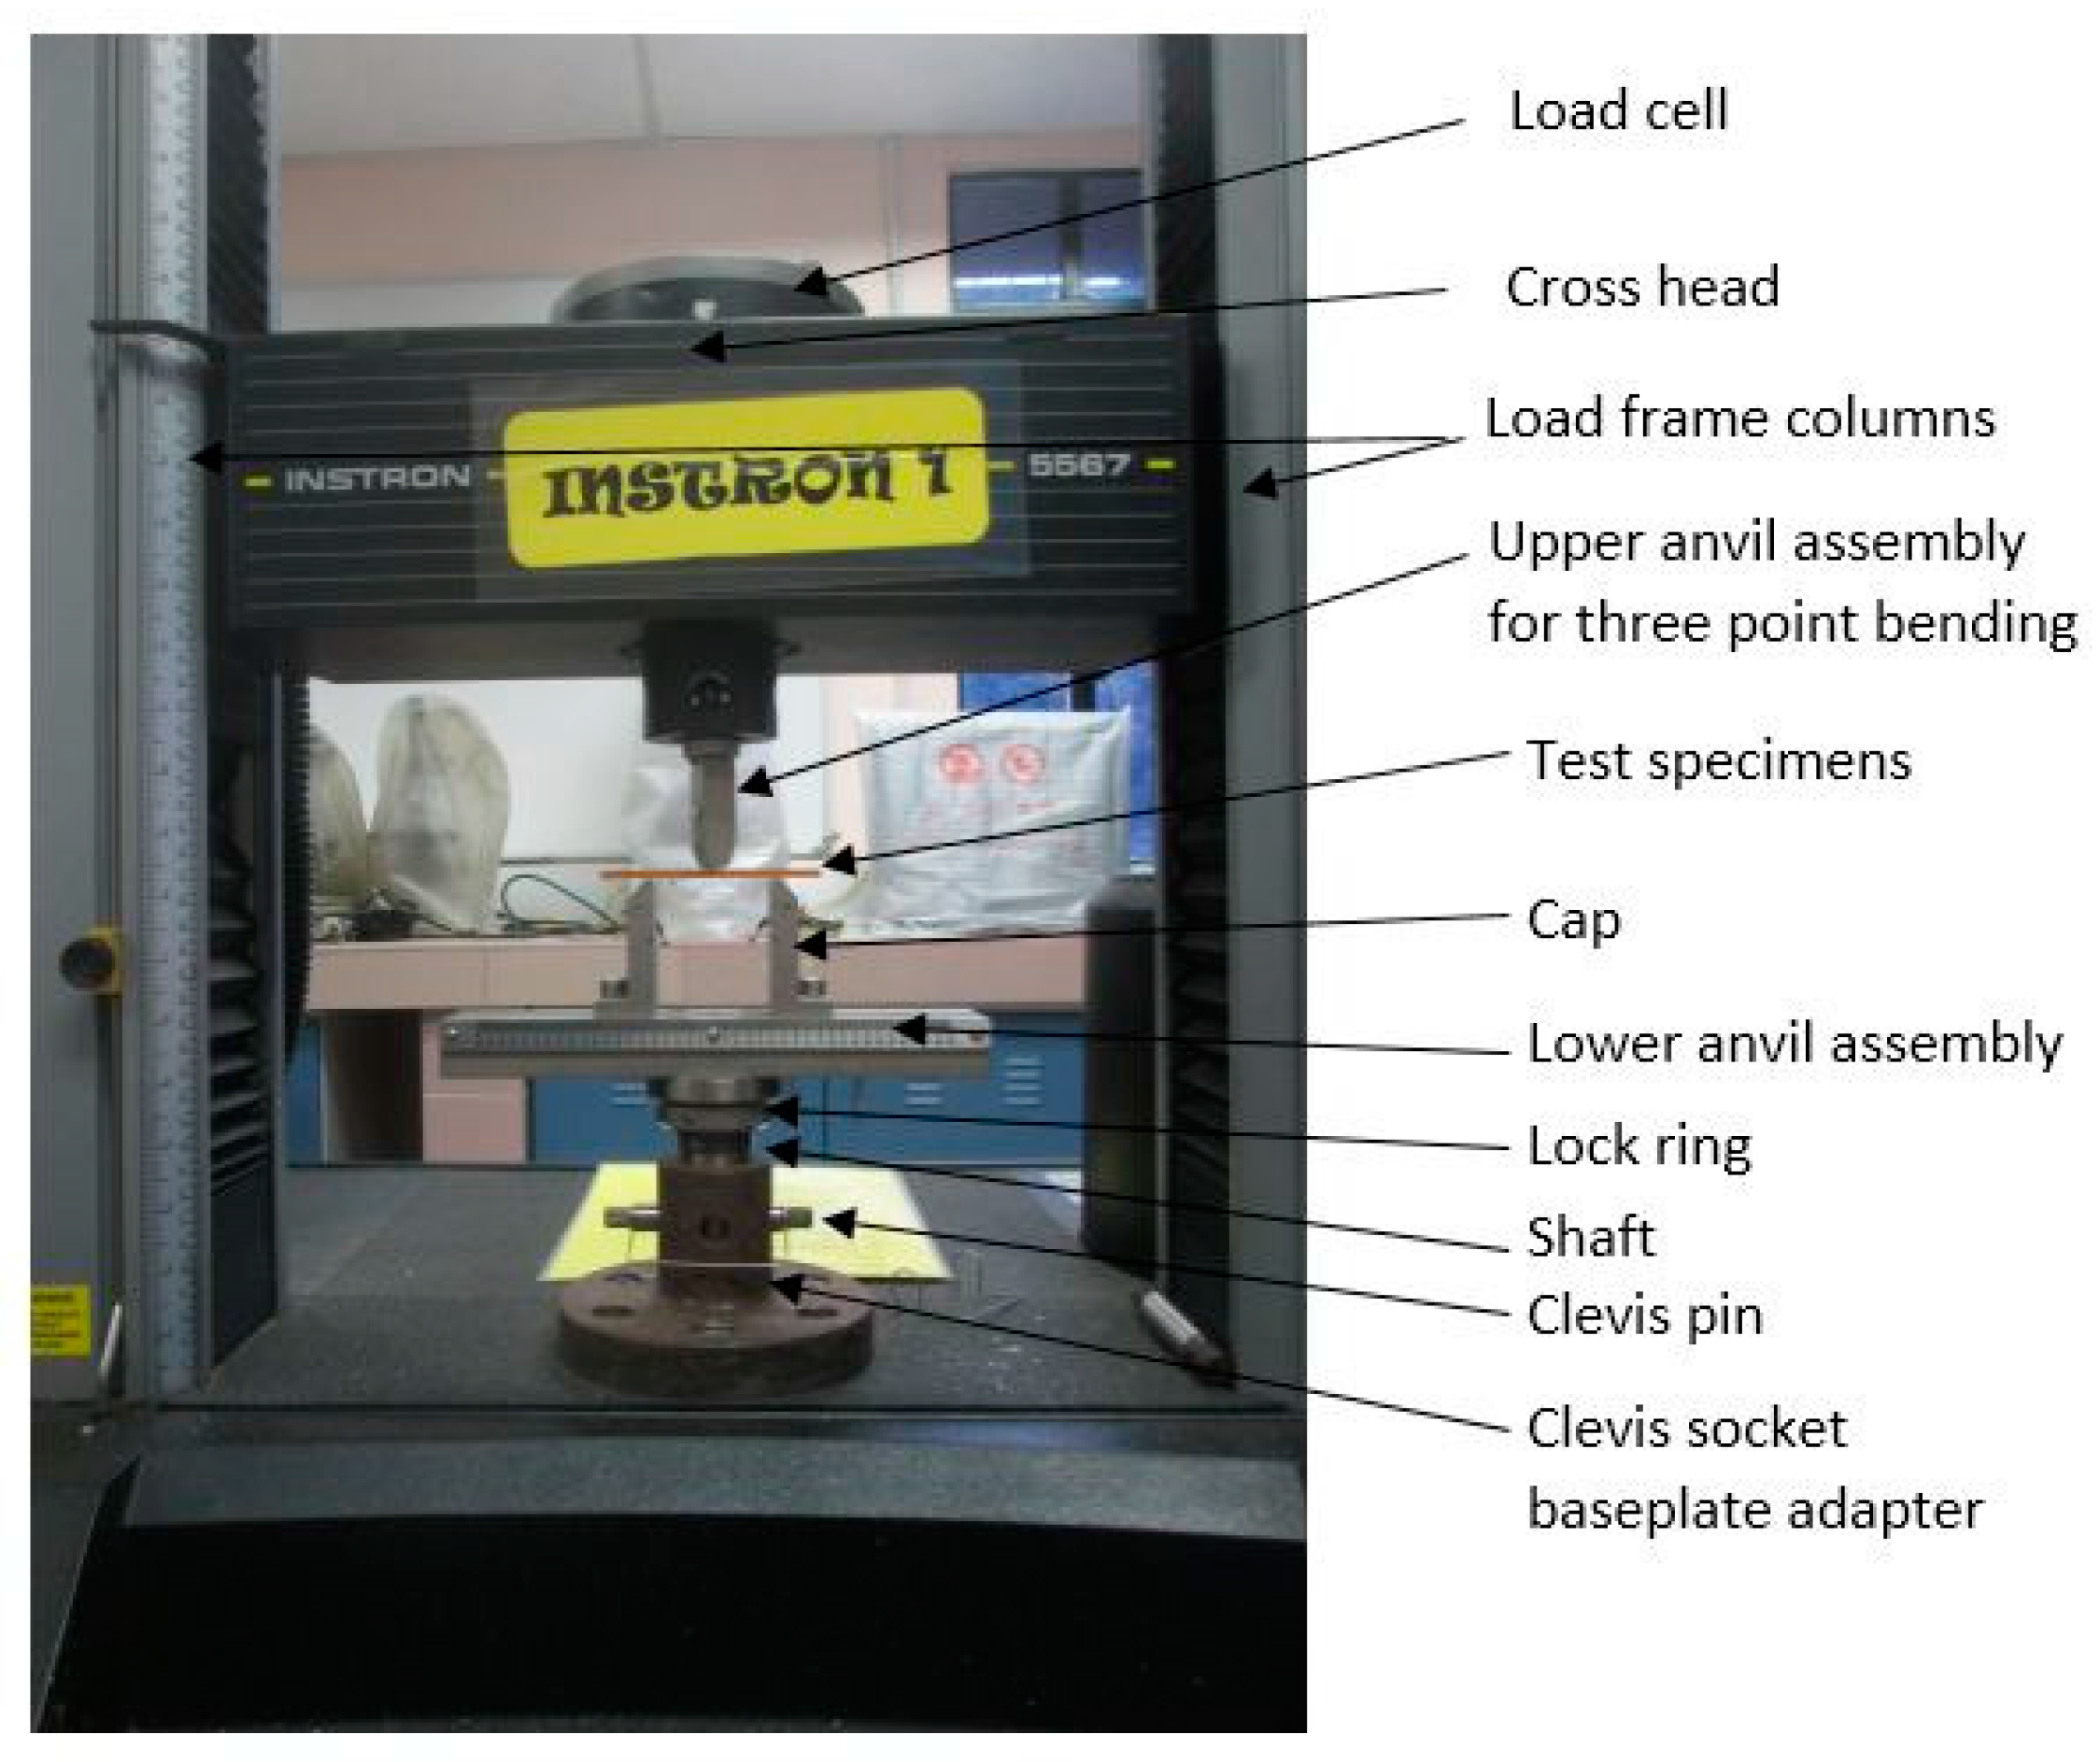
2.7. Flexural Test
2.8. Izod Impact Test
2.9. Differential Scanning Calorimetry (DSC) Analysis
3. Results and Discussion
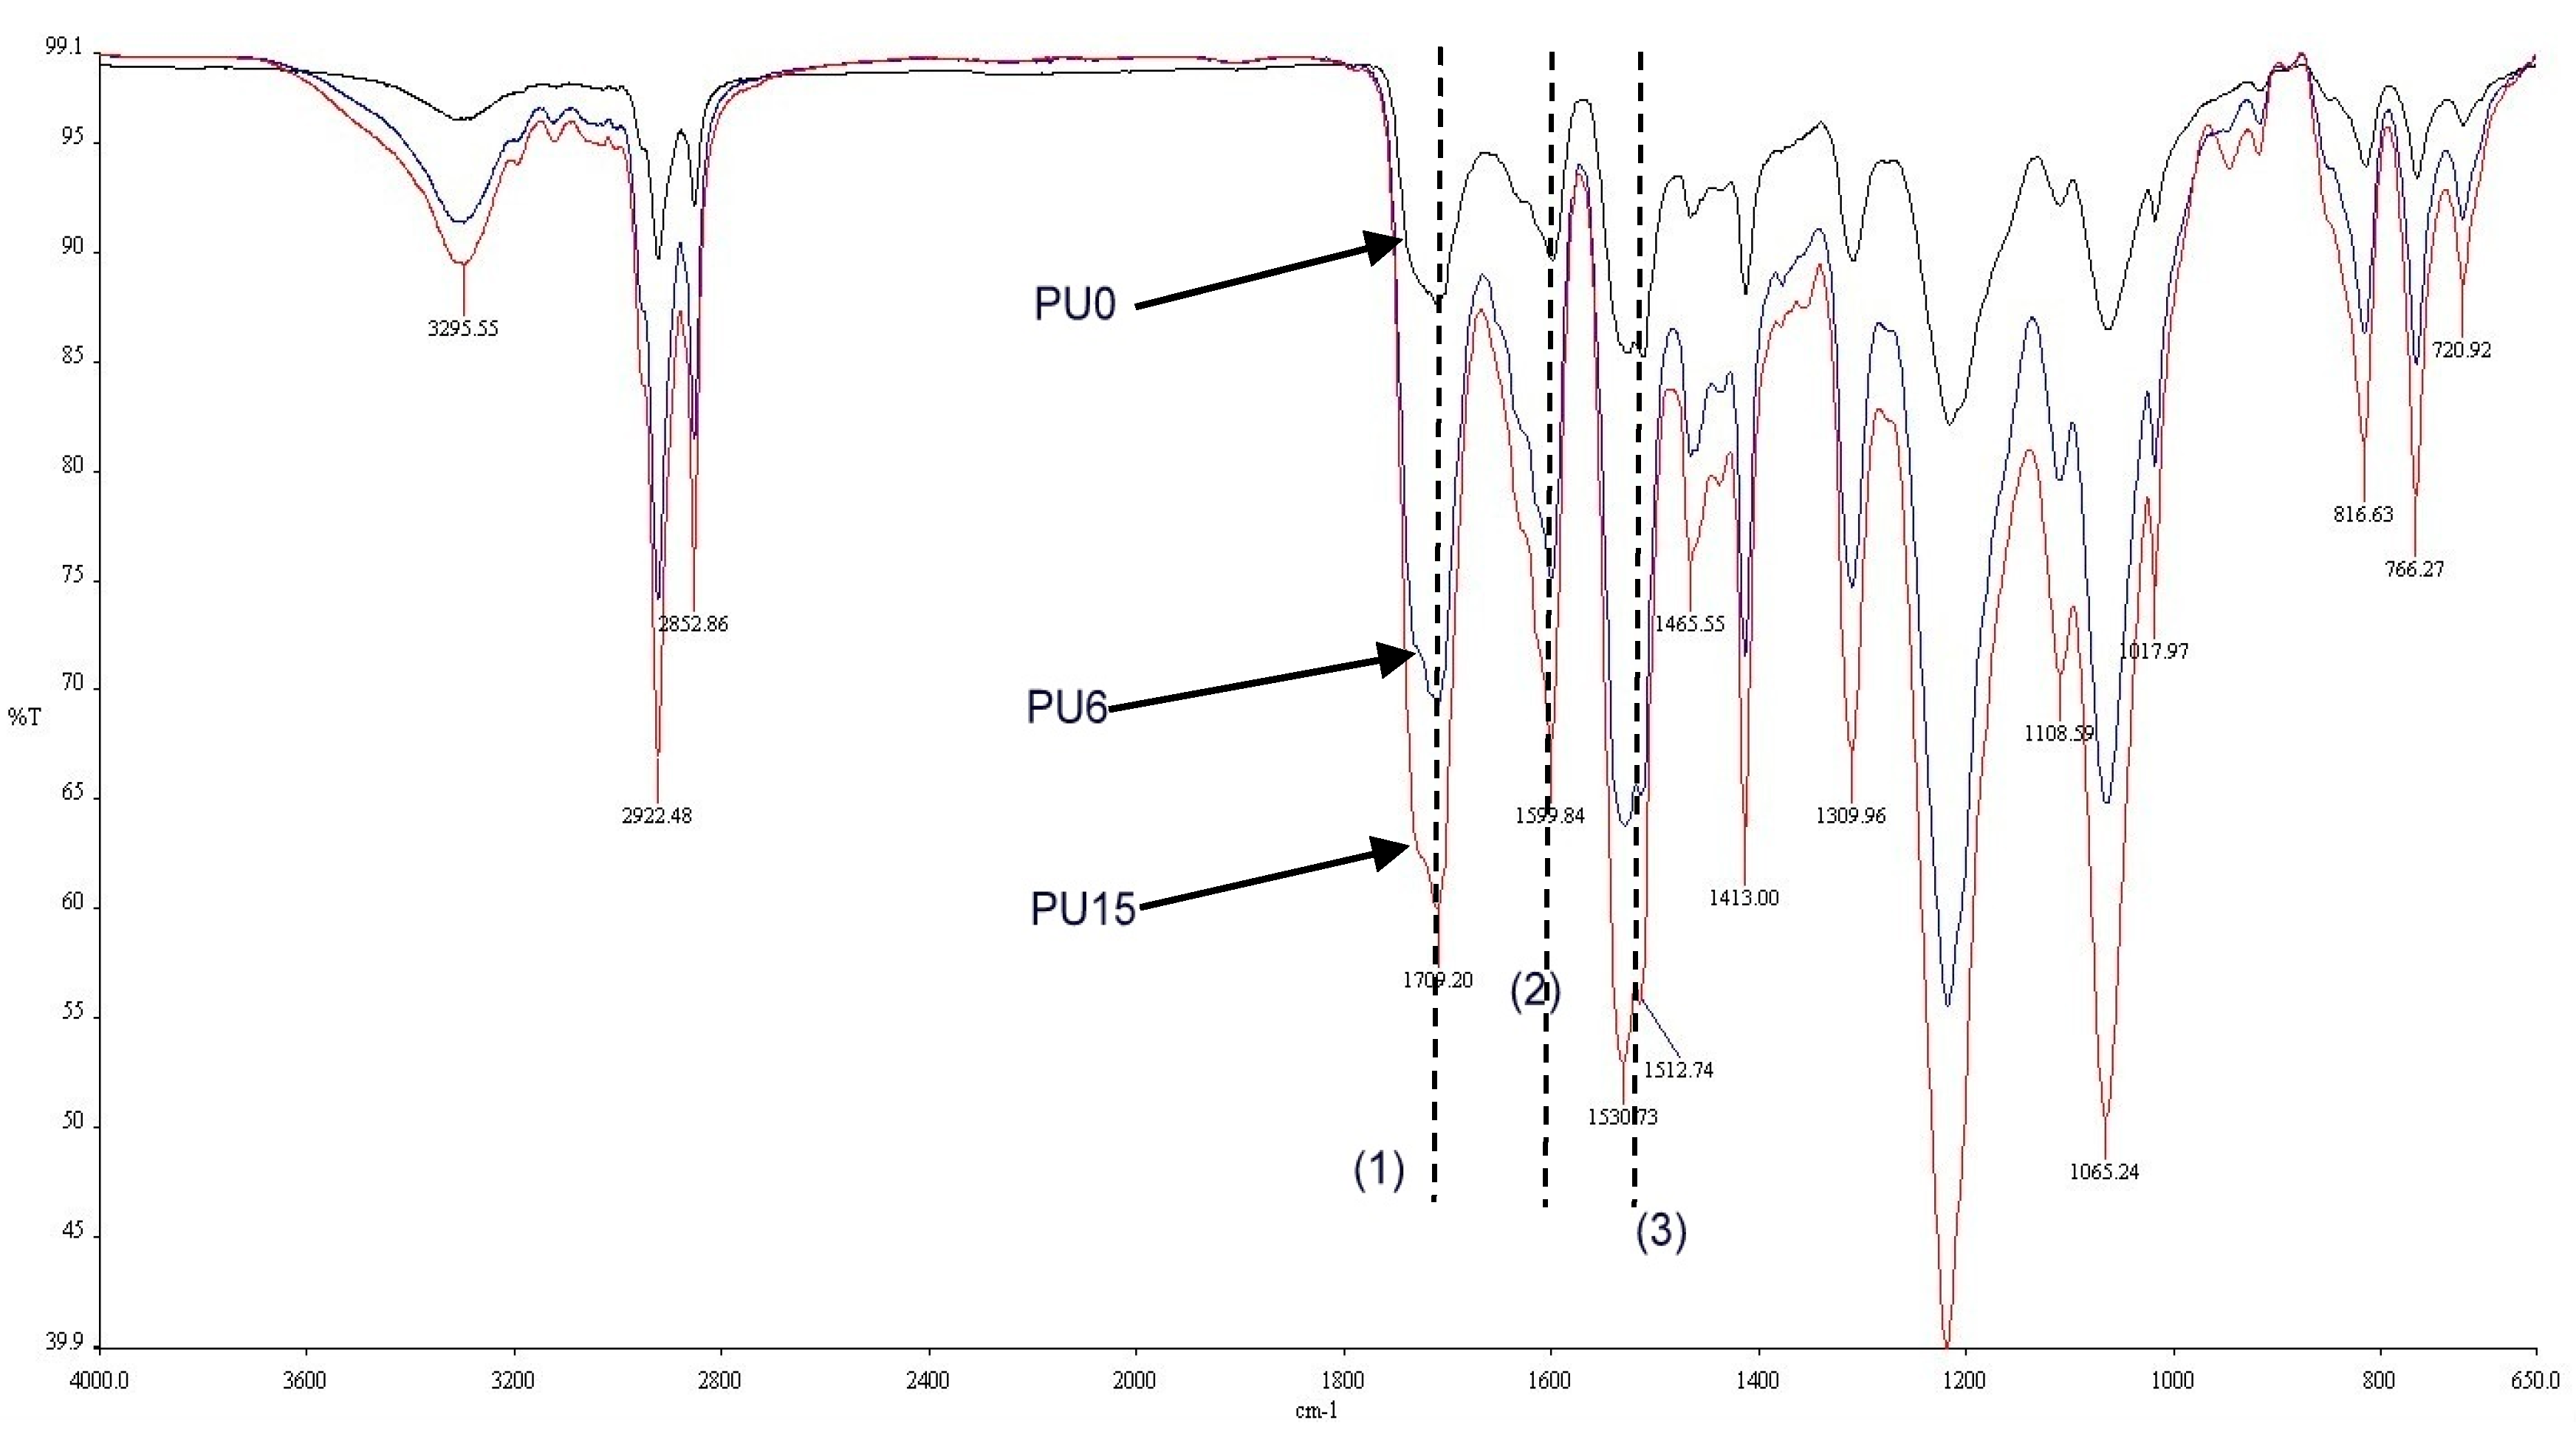
3.1. FT-IR Analysis
3.2. Density
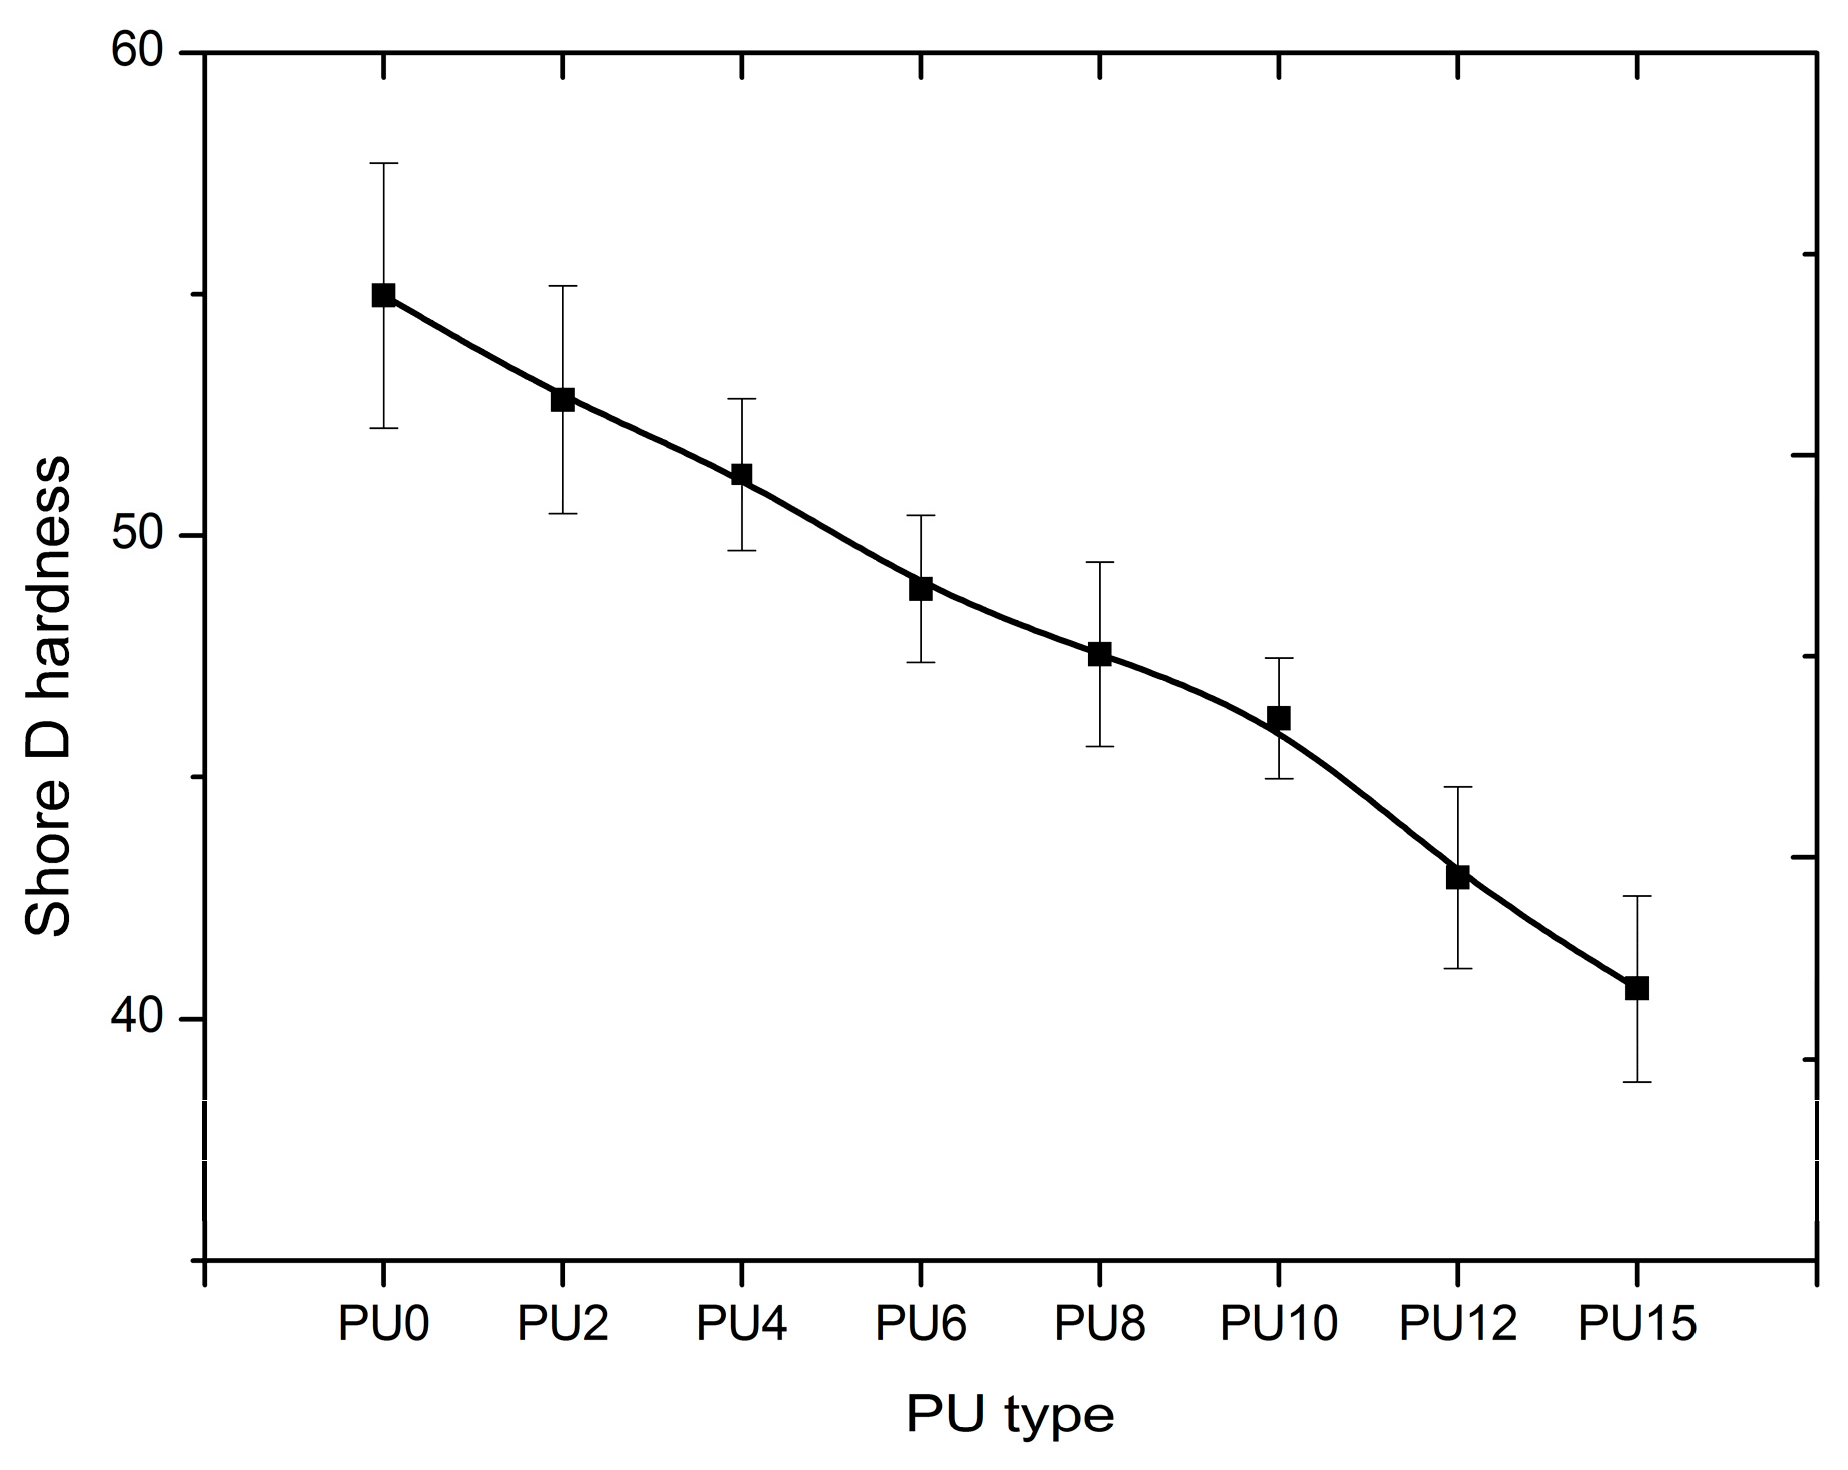
3.3. Shore D Hardness Test
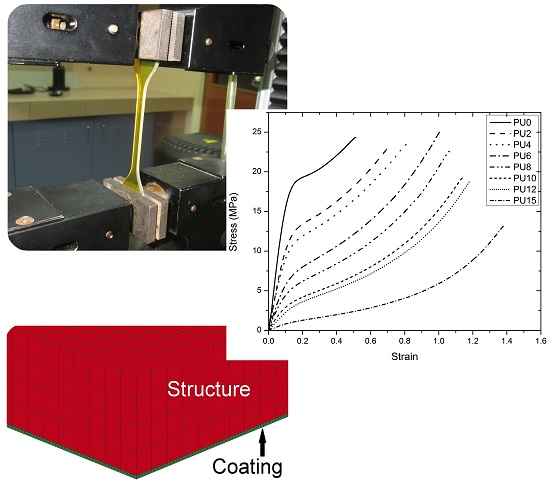
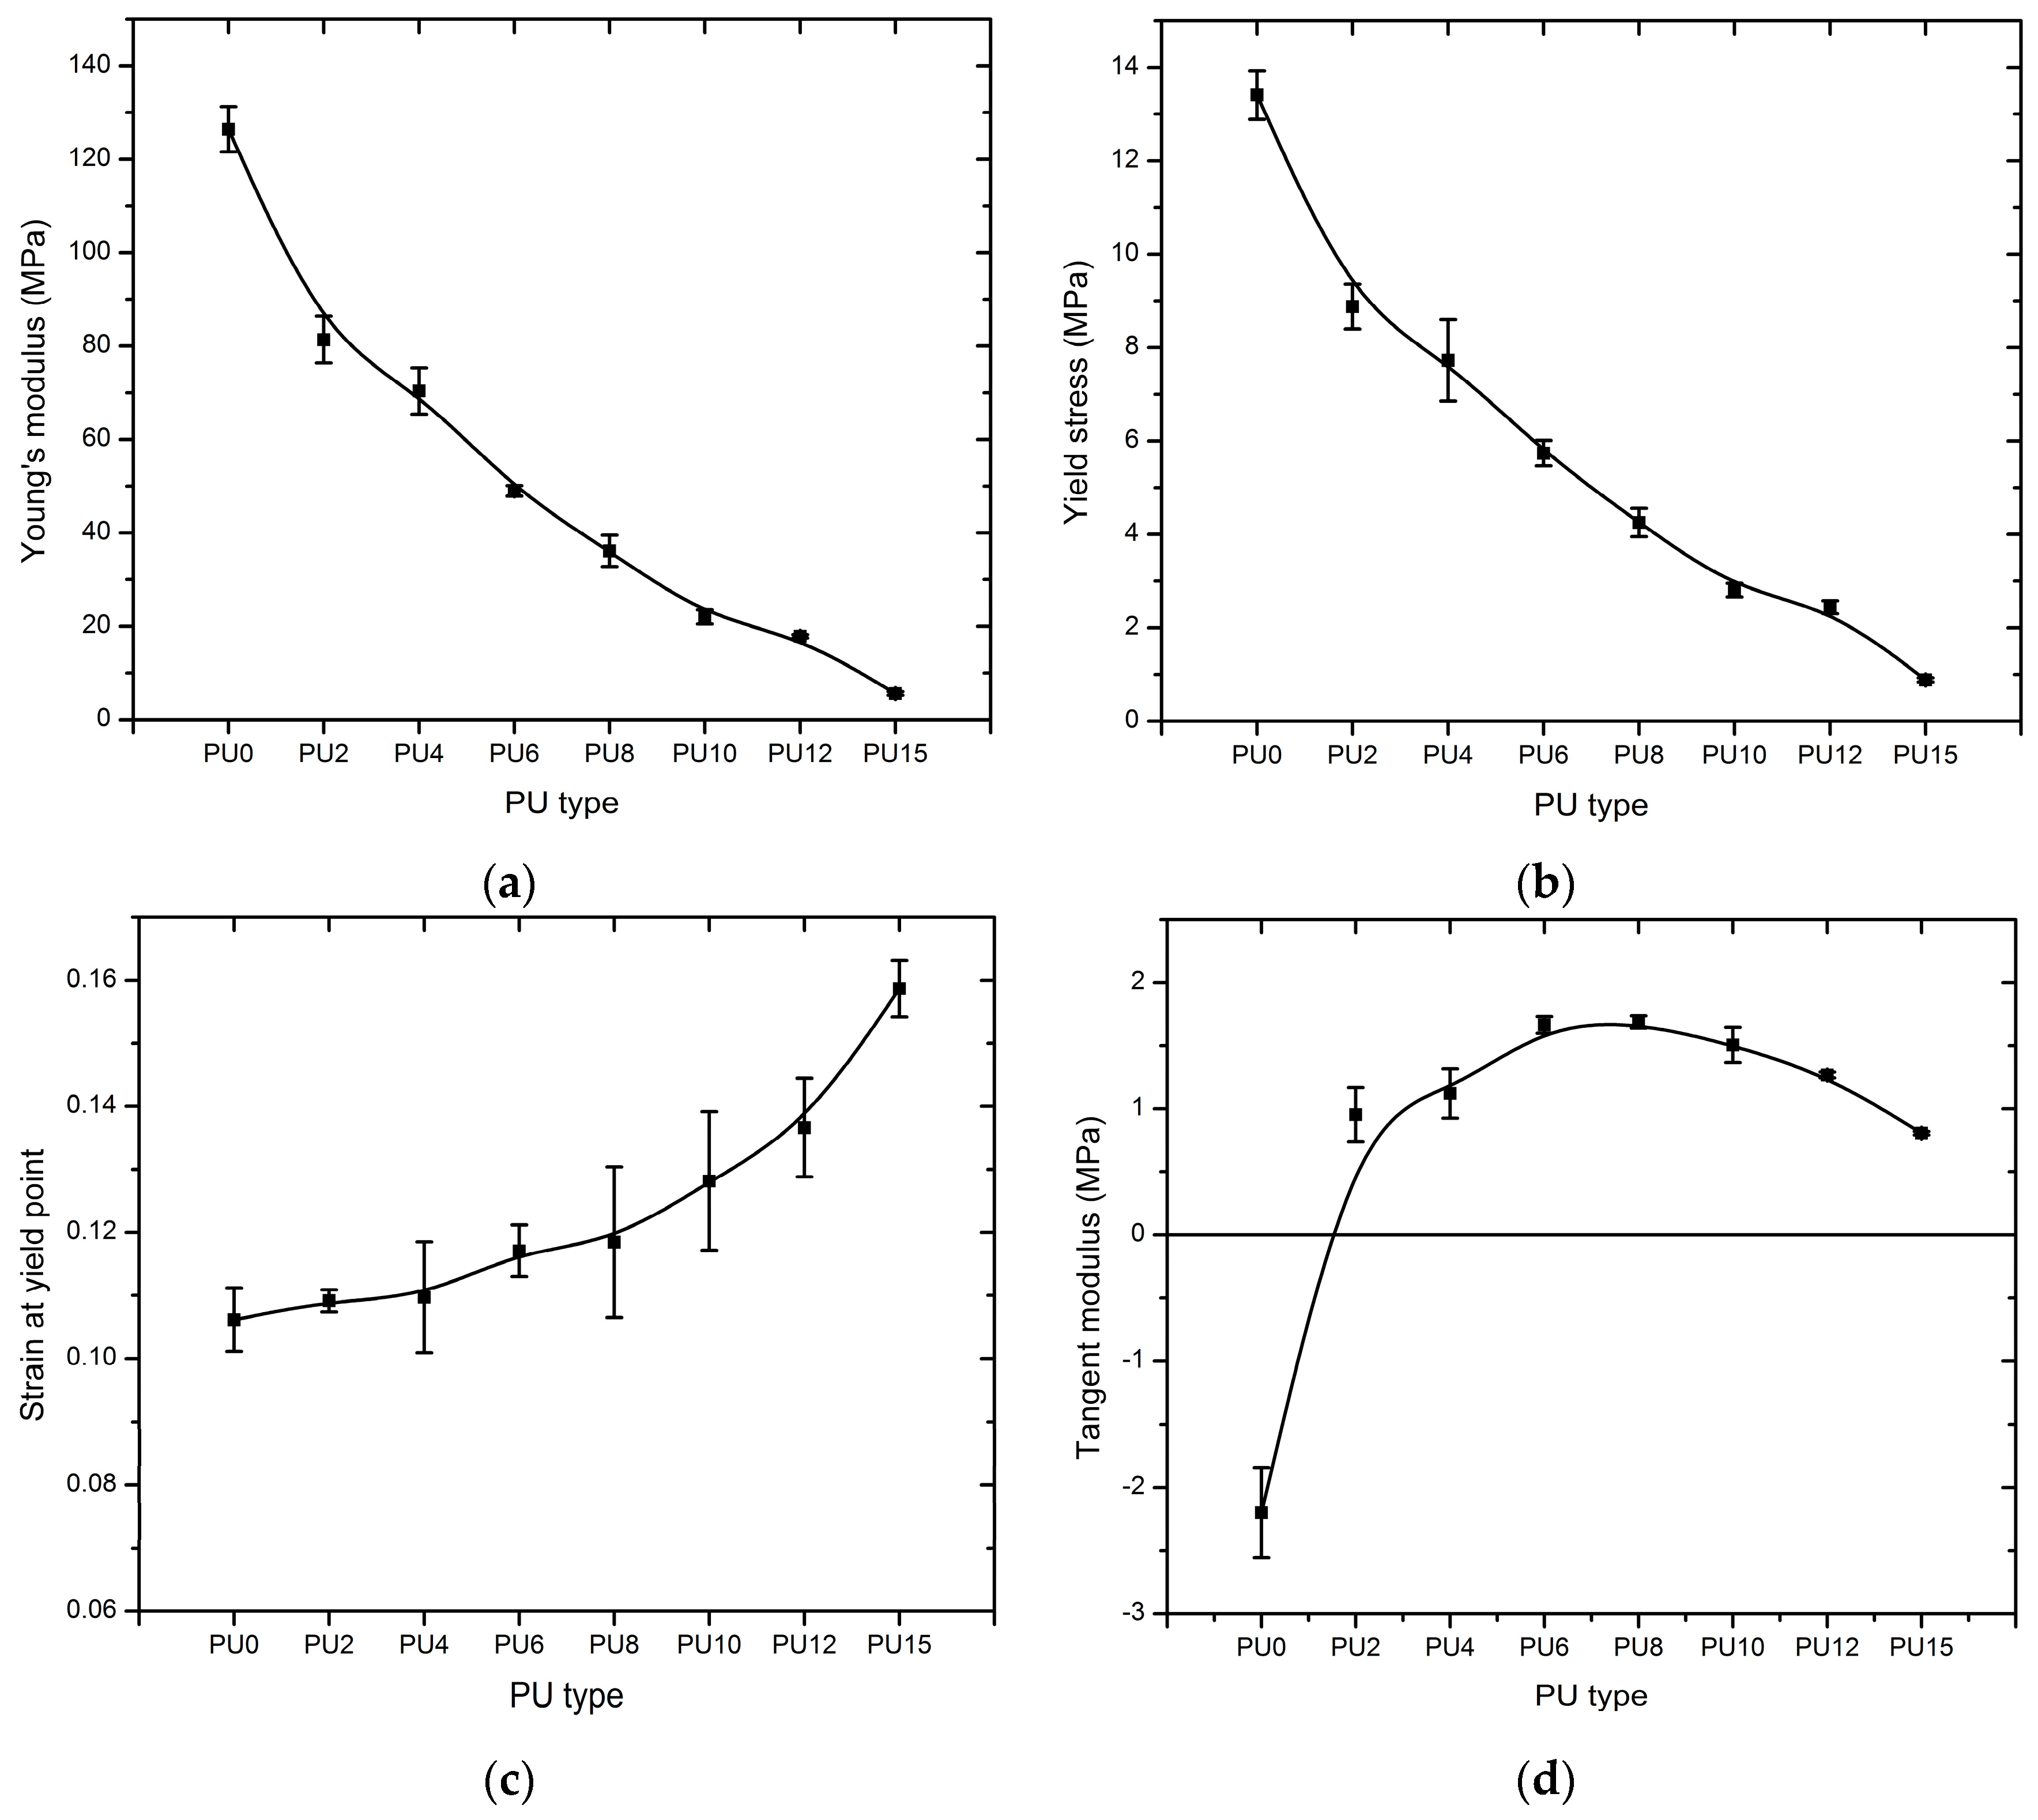
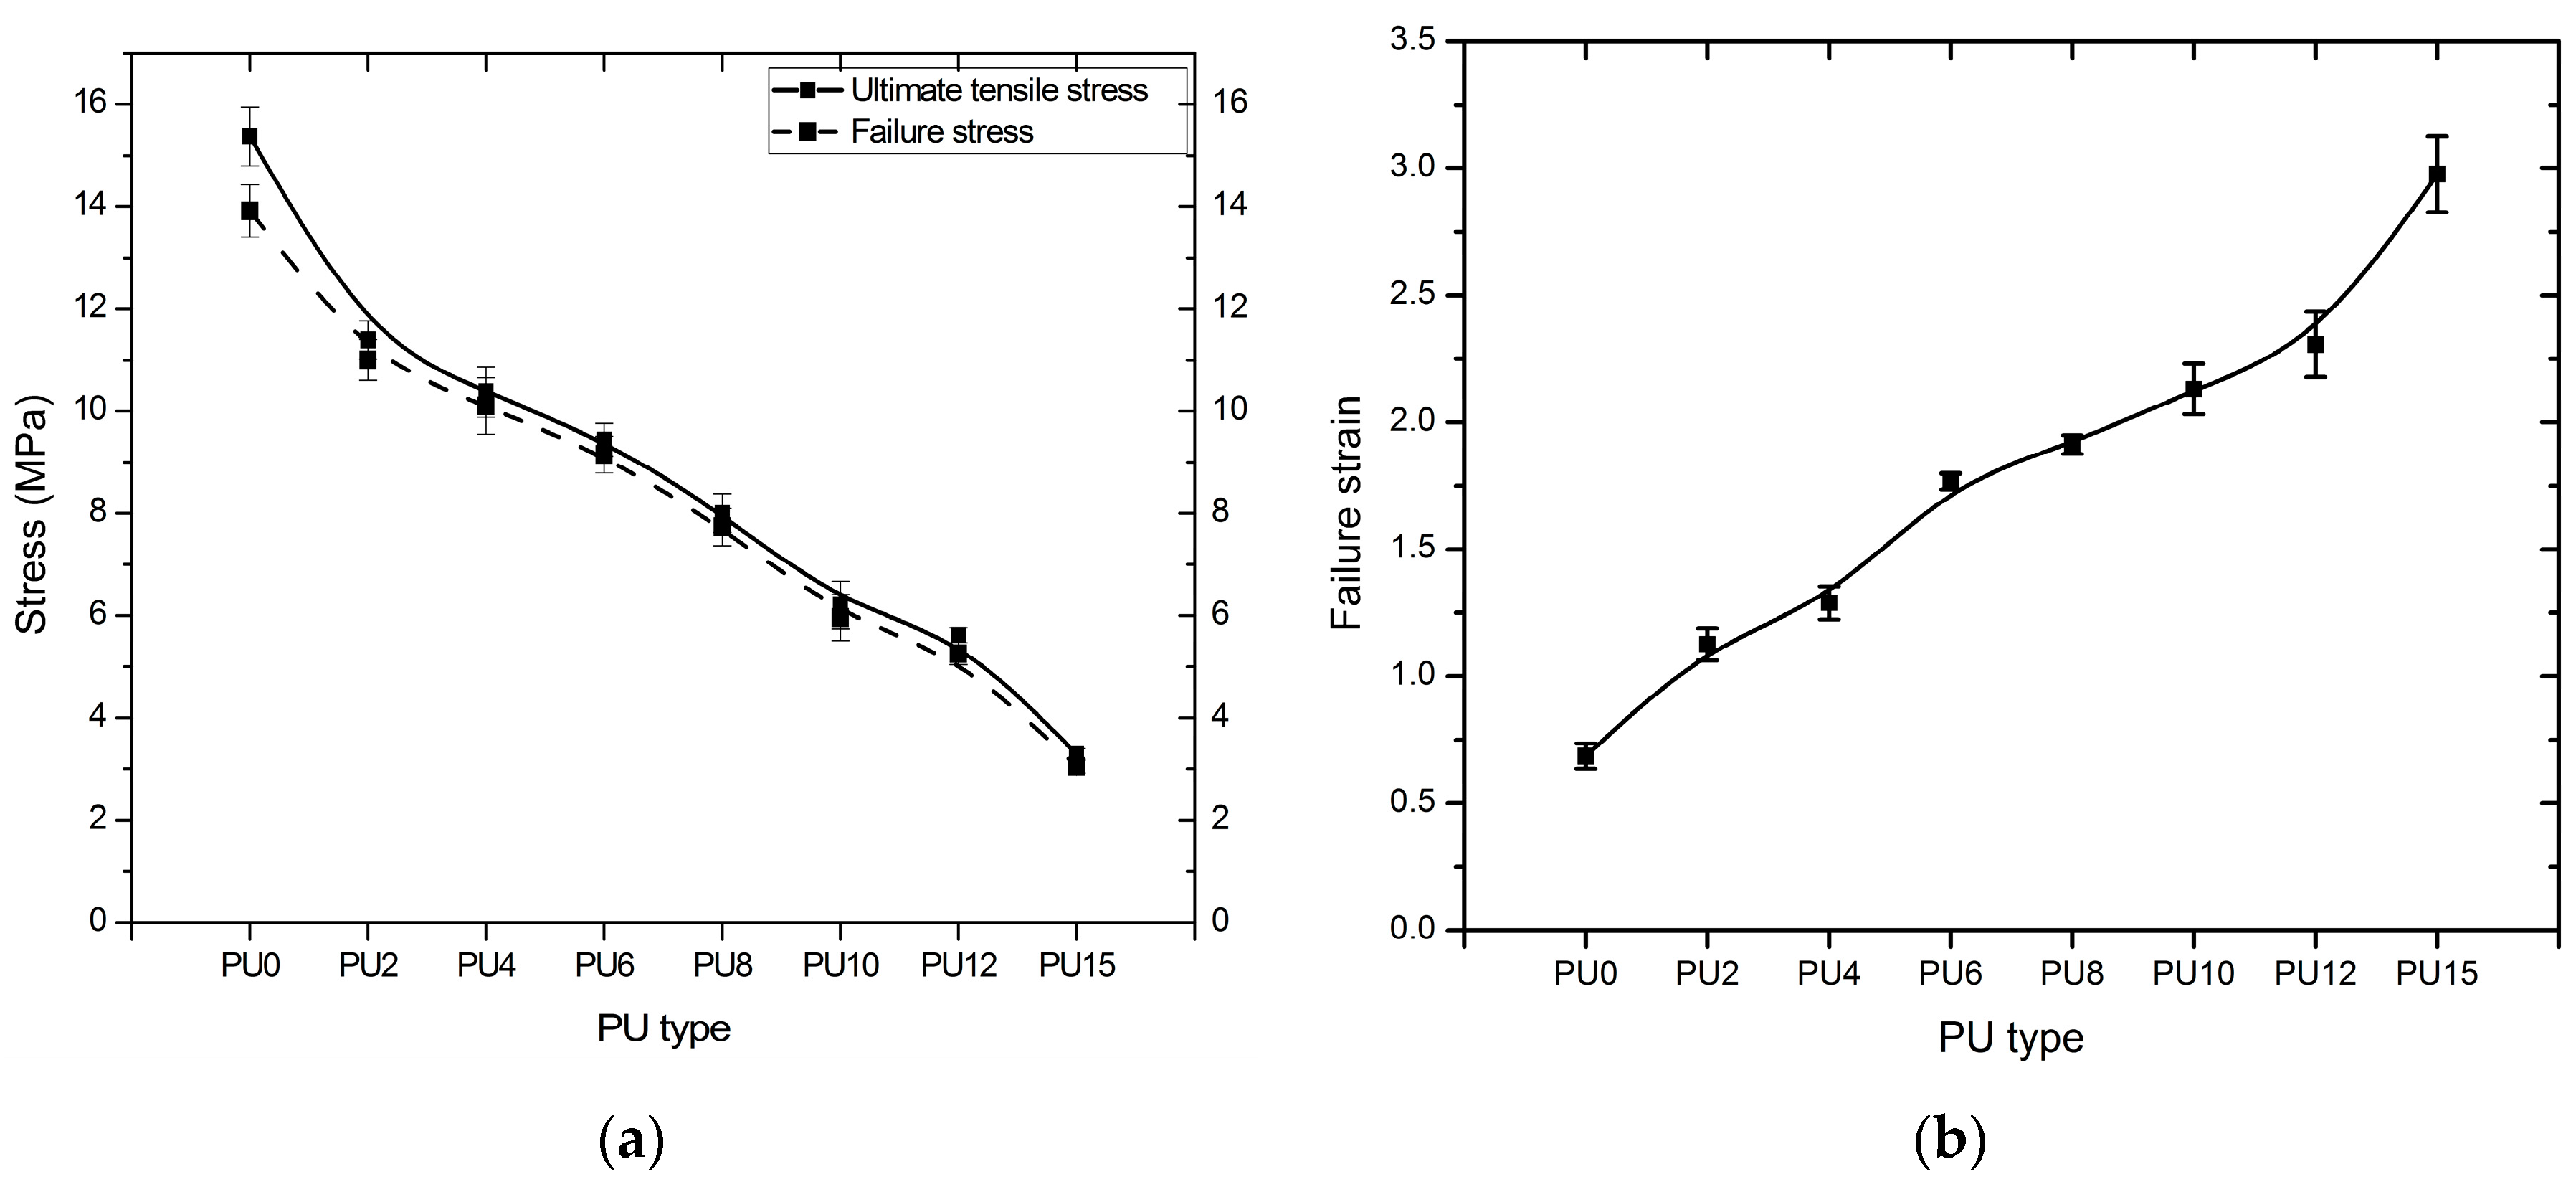
3.4. Tensile Test
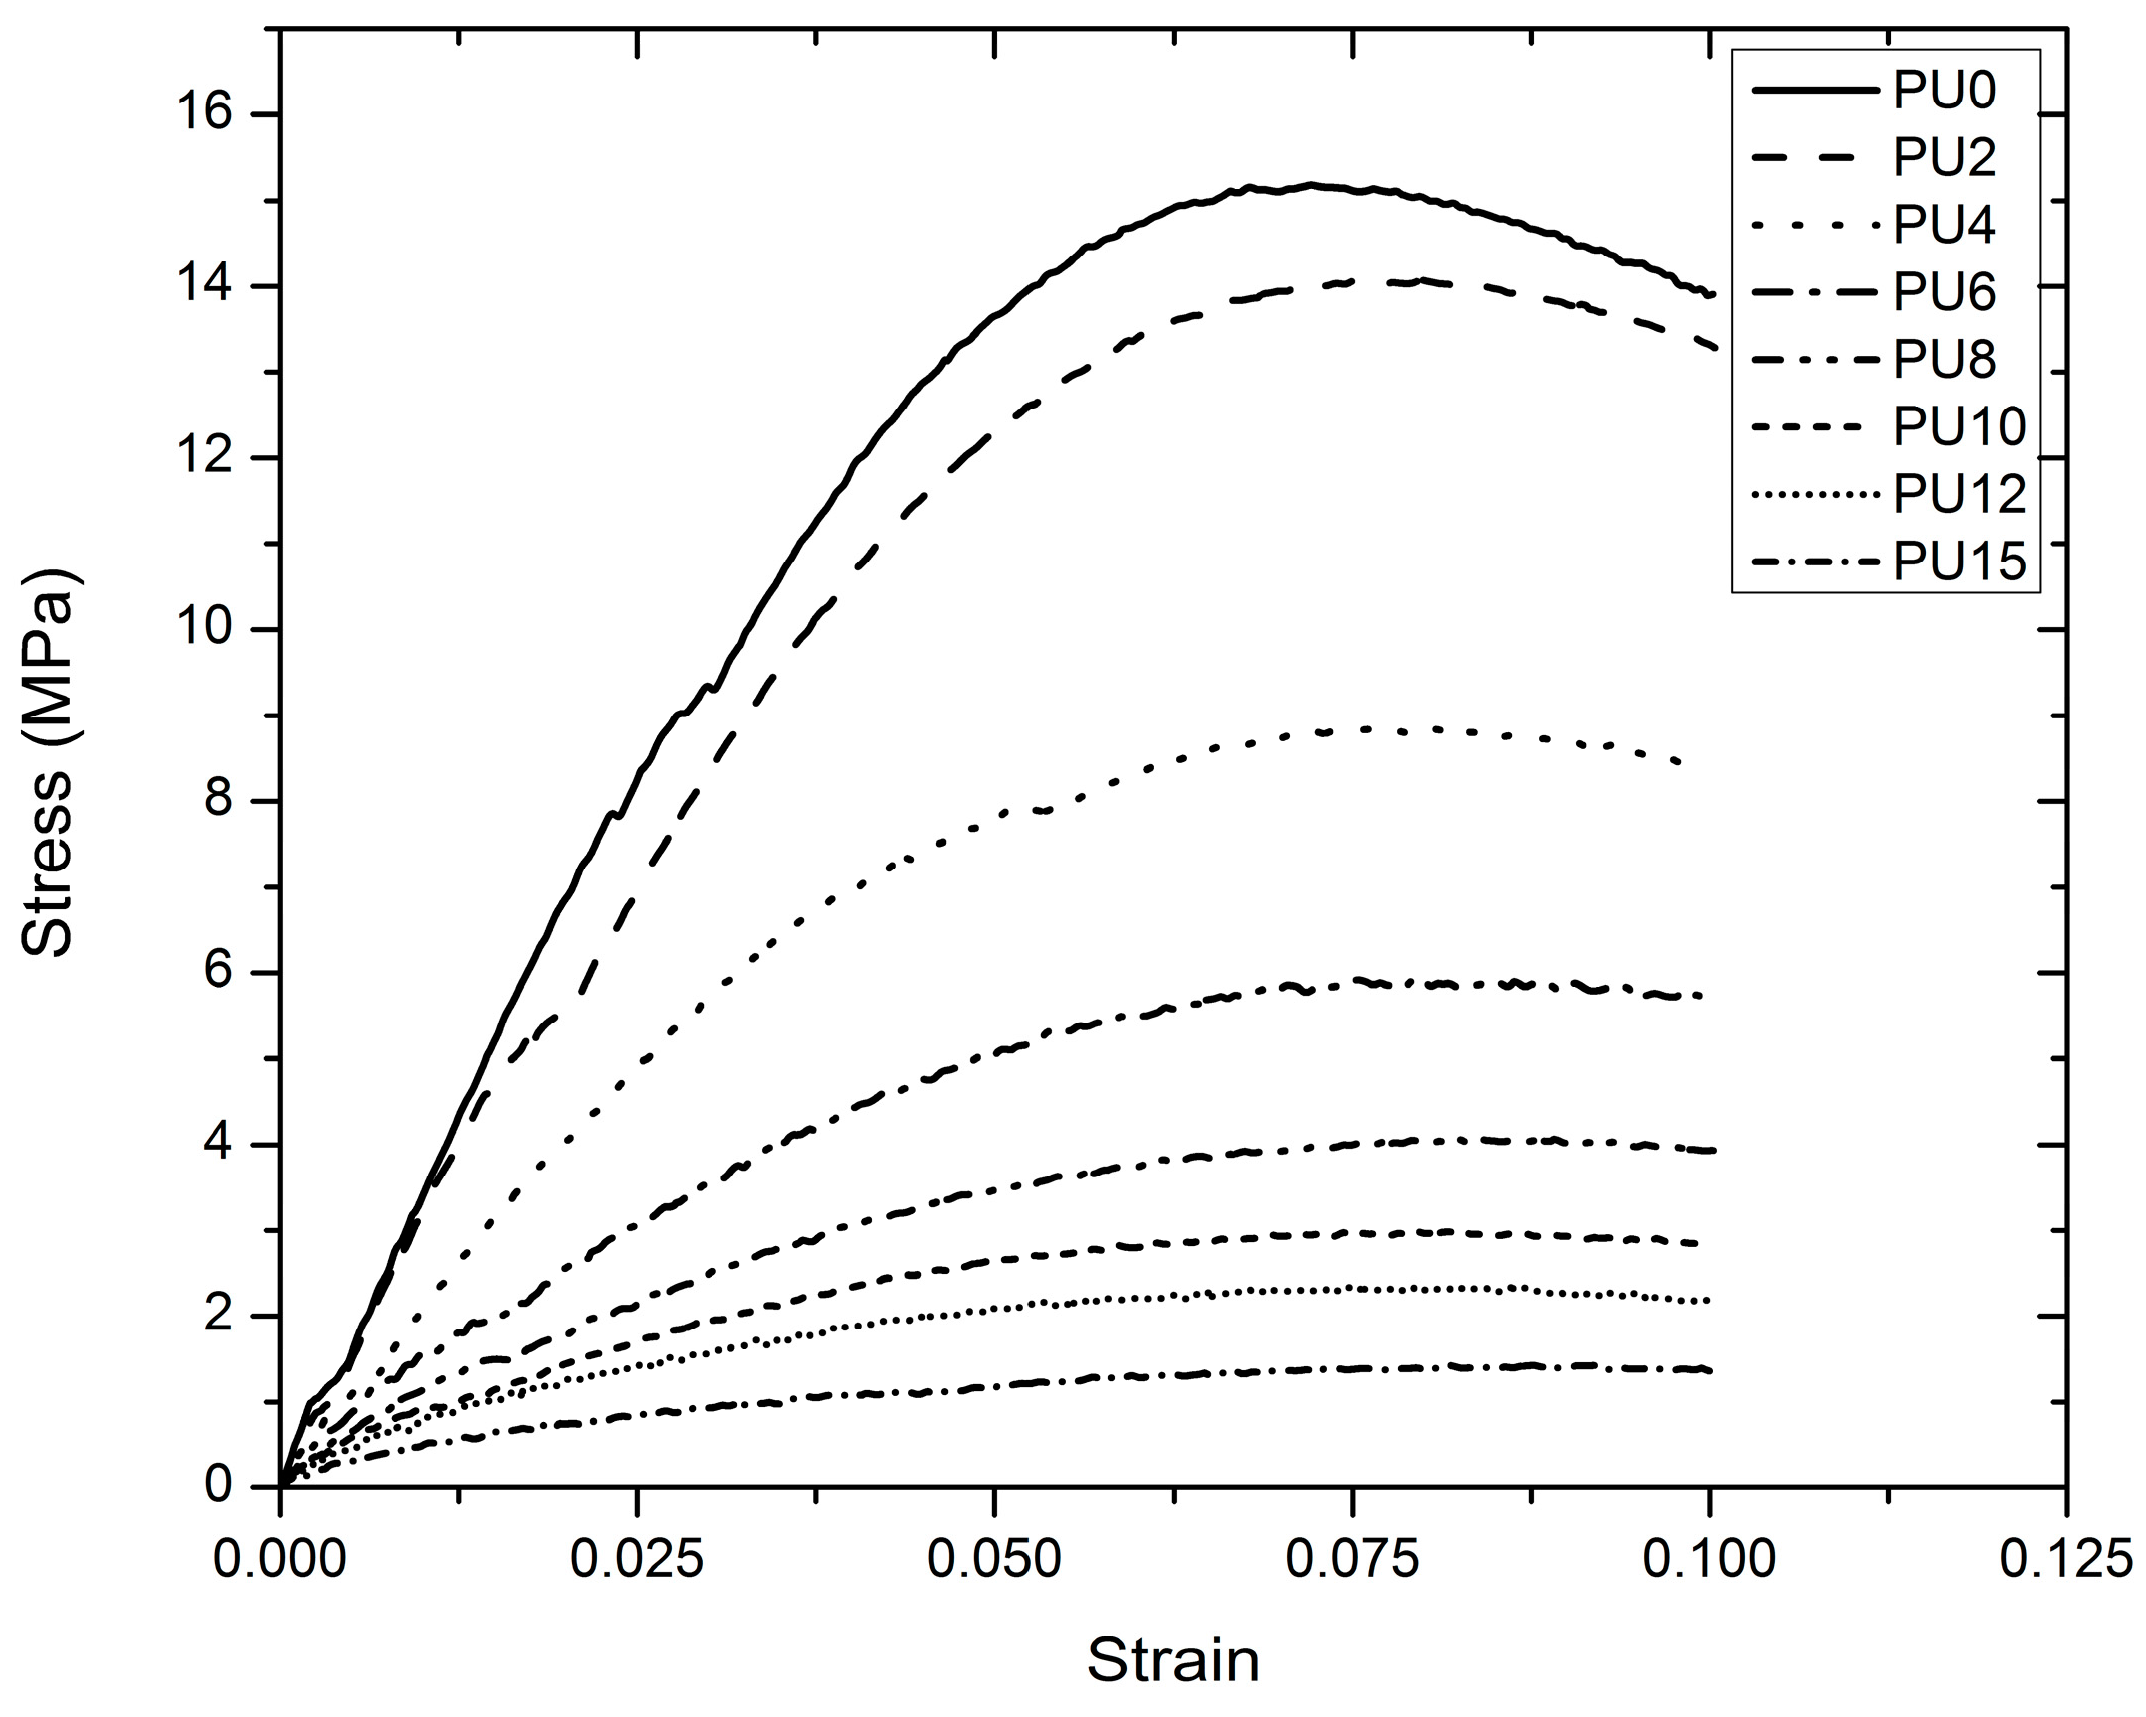
3.4.1. Tensile Characteristics
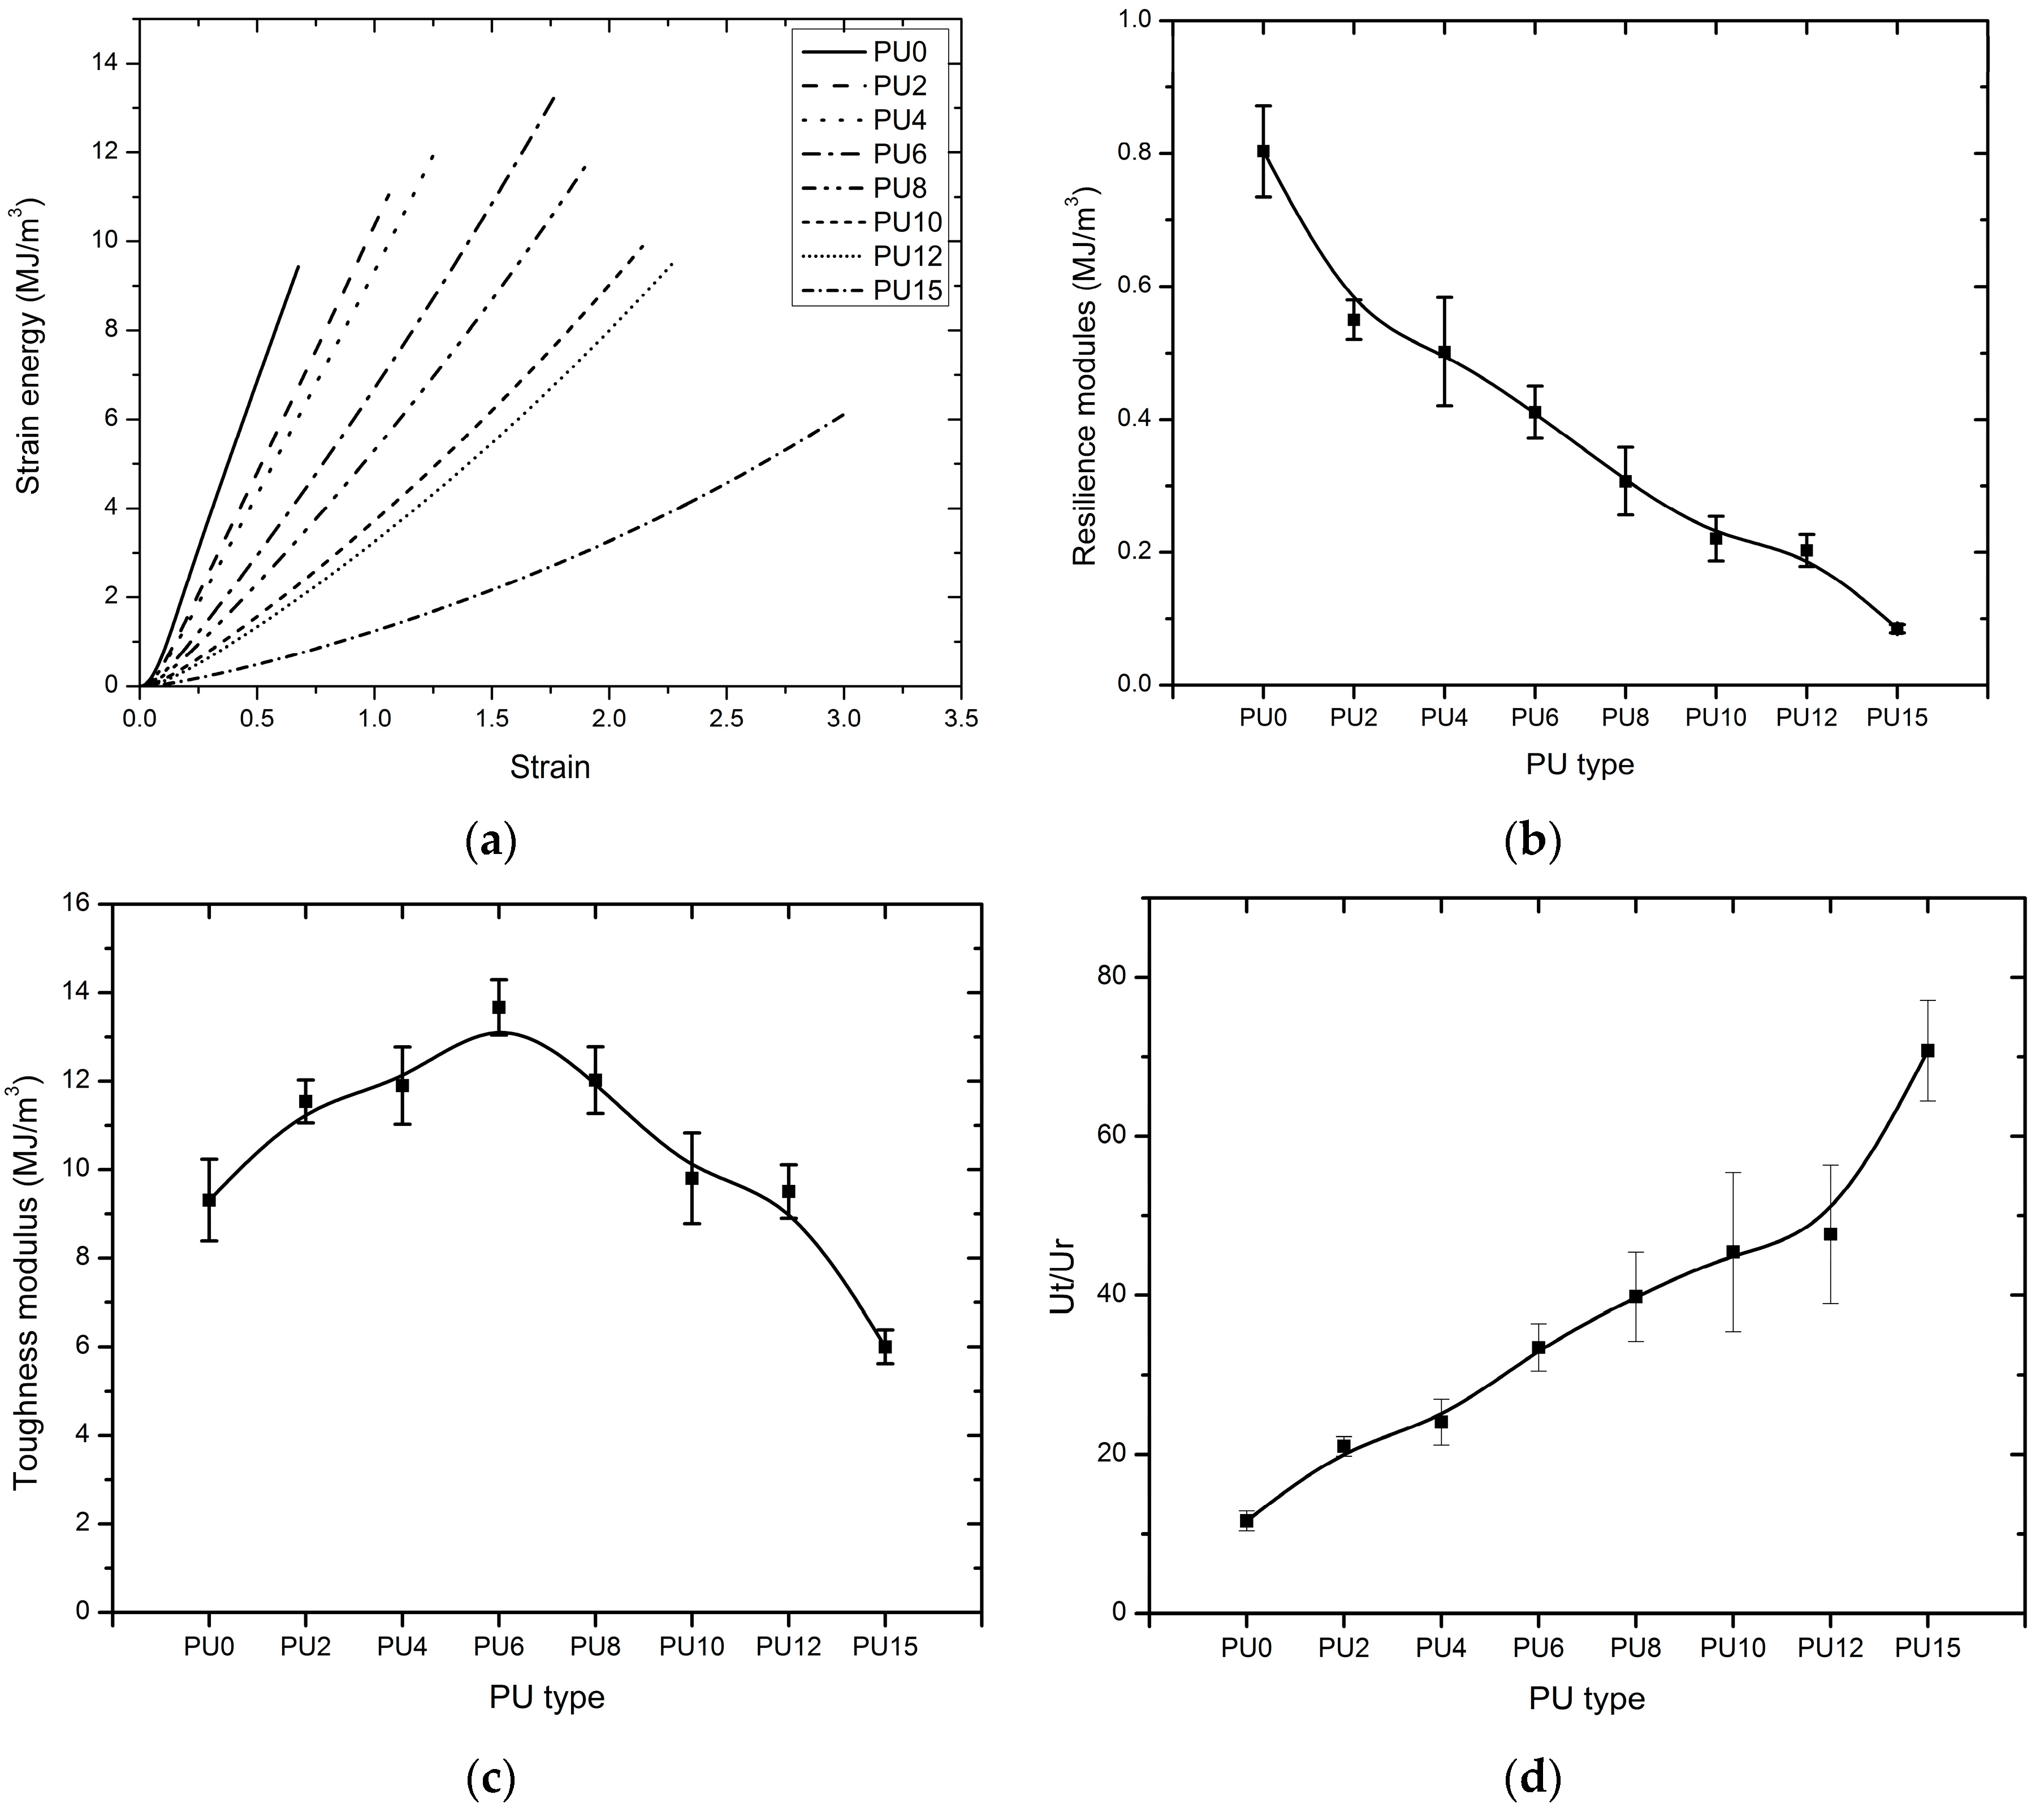
3.4.2. Strain Energy
3.5. Flexural Test
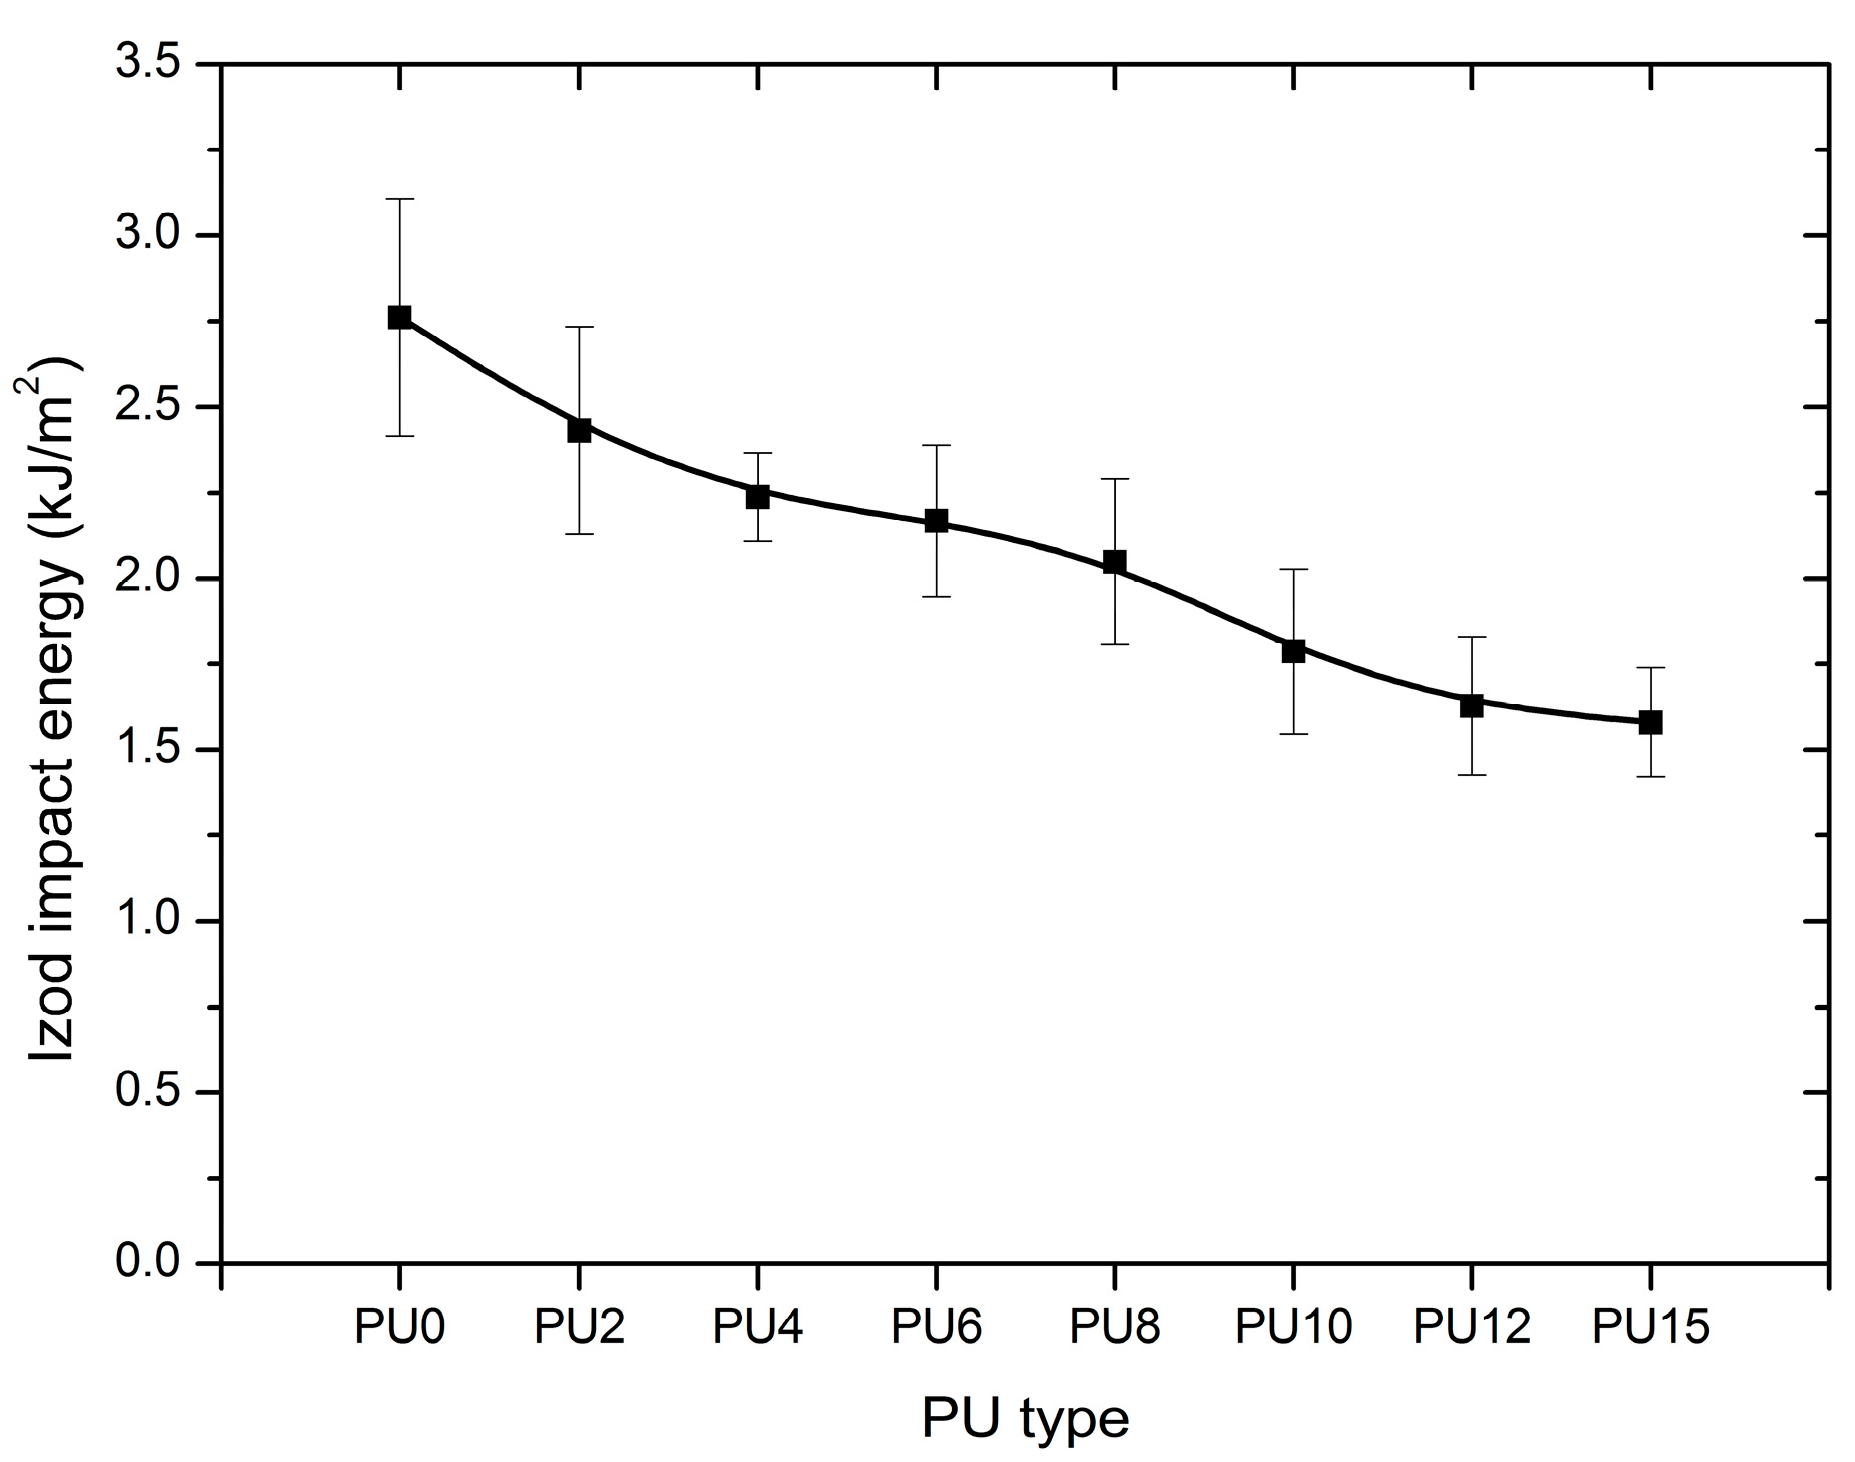
3.6. Izod Impact Test
3.7. DSC Analysis
5. Conclusions
Acknowledgments
Author Contributions
Conflicts of Interest
Abbreviations
| ATR | Attenuated total reflectance |
| Da | Dalton |
| DSC | Differential scanning calorimetry |
Change in enthalpy | |
Heat flow | |
| FT-IR | Fourier transform infrared |
| MDI | 4,4-diphenylmethane diisocyanate |
| Mw | Molecular weight |
| PKO-p | Palm kernel oil-based monoester polyol |
| PEG | Polyethylene glycol |
| PU | Polyurethane |
| PU0, PU2, PU4, PU6, PU8, PU10, PU12, and PU15 | PU8 indicates the PU that contained 8% w/w of PEG |
| Tg | Glass transition temperature |
| Ur | modulus of resilience |
| Ut | modulus of toughness |
| w/w | Weight/Weight |
References
- Malvar, L.J.; Crawford, J.E.; Morrill, K.B. The use of composites to resist blast. ASCE J. Compos. Constr. 2007, 11, 601–610. [Google Scholar] [CrossRef]
- Buchan, P.A.; Chen, J.F. Blast resistance of FRP composites and polymer strengthened concrete and masonry structures—A state-of-the-art review. Compos. Part B Eng. 2007, 38, 509–522. [Google Scholar] [CrossRef]
- Crawford, J.E.; Malvar, L.J.; Wesevich, J.E.; Valancius, J.; Reynolds, A.D. Retrofit of reinforced concrete structures to resist blast effects. ACI Struct. J. 1997, 94, 371–377. [Google Scholar]
- Pichandi, S.; Rana, S.; Oliveira, D.; Fangueiro, R. Fibrous and composite materials for blast protection of structural element—A state-of-the-art review. J. Reinf. Plast. Comp. 2013, 32, 1477–1500. [Google Scholar] [CrossRef]
- Ngo, T.; Mendis, P.; Krauthammer, T. Behaviour of ultrahigh-strength prestressed concrete panels subjected to blast loading. ASCE J. Struct. Eng. 2007, 133, 1582–1590. [Google Scholar] [CrossRef]
- Remennikov, A.; Carolan, D. Blast effects and vulnerability of building structures from terrorist attacks. Aust. J. Struct. Eng. 2006, 7, 1–11. [Google Scholar]
- Somarathna, H.M.C.C.; Raman, S.N.; Mutalib, A.A.; Badri, K.H. Elastomeric polymers for blast and ballistic retrofitting of structures. J. Teknol. 2015, 76, 1–13. [Google Scholar] [CrossRef]
- Knox, K.J.; Hammons, M.I.; Lewis, T.T.; Porter, J.R. Polymer Materials for Structural Retrofit. Report; Force Protection Branch, Air Expeditionary Forces Technology Division, Air Force Research Laboratory, Tyndall AFB: Panama City, FL, USA, 2000. [Google Scholar]
- Davidson, J.S.; Porter, J.R.; Dinan, R.J.; Hammons, M.I.; Connell, J.D. Explosive testing of polymer retrofit masonry walls. ASCE J. Perform. Constr. Facil. 2004, 18, 100–106. [Google Scholar] [CrossRef]
- Davidson, J.S.; Fisher, J.W.; Hammons, M.I.; Porter, J.R.; Dinan, R.J. Failure mechanisms of polymer-reinforced concrete masonry walls subjected to blast. ASCE J. Struct. Eng. 2005, 131, 1194–1205. [Google Scholar] [CrossRef]
- Hoo Fatt, M.S.; Ouyang, X.; Dinan, R.J. Blast response of walls retrofitted with elastomer coatings, structures under shock and impact VIII. In Proceedings of the 8th International Conference on Structures under Shock and Impact, Crete, Greece, 29–31 March 2004; pp. 129–138.
- Baylot, J.T.; Bullock, B.; Slawson, T.R.; Woodson, S.C. Blast response of lightly attached concrete masonry Units wall. ASCE J. Struct. Eng. 2005, 131, 1186–1193. [Google Scholar] [CrossRef]
- Hrynyk, T.D.; Myers, J.J. Out-of-Plane behavior of URM arching walls with modern blast retrofits: Experimental results and analytical model. ASCE J. Struct. Eng. 2008, 134, 1589–1597. [Google Scholar] [CrossRef]
- Amini, M.R.; Isaacs, J.B.; Nemat-Nasser, S. Effect of polyurea on the dynamic response of steel plates. In Proceedings of the 2006 SEM Annual Conference and Exposition on Experimental and Applied Mechanics, St. Louis, MO, USA, 4–7 June 2006.
- Amini, M.R.; Isaacs, J.B.; Nemat-Nasser, S. Experimental investigation of response of monolithic and bilayer plates to impulsive loads. Int. J. Impact Eng. 2010, 37, 82–89. [Google Scholar] [CrossRef]
- Amini, M.R.; Isaacs, J.; Nemat-Nasser, S. Investigation of effect of polyurea on response of steel plates to impulsive loads in direct pressure-pulse experiments. Mech. Mater. 2010, 42, 628–639. [Google Scholar] [CrossRef]
- Amini, M.R.; Amirkhizi, A.V.; Nemat-Nasser, S. Numerical modeling of response of monolithic and bilayer plates to impulsive loads. Int. J. Impact Eng. 2010, 37, 90–102. [Google Scholar] [CrossRef]
- Amini, M.R.; Simon, J.; Nemat-Nasser, S. Numerical modeling of effect of polyurea on response of steel plates to impulsive loads in direct pressure-pulse experiments. Mech. Mater. 2010, 42, 615–627. [Google Scholar] [CrossRef]
- Sayed, T.E.; Mock, W., Jr.; Mota, A.; Fraternali, F.; Ortiz, M. Computational assessment of ballistic impact on a high strength structural steel/polyurea composite plate. Comput. Mech. 2009, 43, 525–534. [Google Scholar] [CrossRef]
- Ackland, K.; Anderson, C.; St John, N. Polymeric Coatings for Enhanced Protection of Structures from the Explosive Effect of Blast. In Proceedings of the 2007 RNSA Security Technology Conference, Melbourne, Australia, 28 September 2007; pp. 90–96.
- Ackland, K.; Anderson, C.; Ngo, T.D. Deformation of polyurea-coated steel plates under localised blast loading. Int. J. Impact Eng. 2013, 51, 13–22. [Google Scholar] [CrossRef]
- Chen, C.; Linzell, D.G.; Alpman, E.; Long, L.N. Effectiveness of advanced coating systems for mitigating blast effects of steel components, structures under shock and impact X. In Proceedings of the 10th International Conference on Structures under Shock and Impact, Algarve, Portugal, 14–16 May 2008; pp. 85–94.
- Mohotti, D.; Ali, M.; Ngo, T.; Lu, J.; Mendis, P.; Ruan, D. Out-of-Plane impact resistance of aluminium plates subjected to low velocity impact. Mater. Des. 2013, 50, 413–426. [Google Scholar] [CrossRef]
- Mohotti, D.; Ngo, T.; Raman, S.N.; Ali, M.; Mendis, P. Plastic deformation of polyurea coated composite aluminium plates subjected to low velocity impact. Mater. Des. 2014, 56, 696–713. [Google Scholar] [CrossRef]
- Mohotti, D.; Ngo, T.; Mendis, P.; Raman, S.N. Polyurea coated composite aluminium plates subjected to high velocity projectile impact. Mater. Des. 2013, 52, 1–16. [Google Scholar] [CrossRef]
- Mohotti, D.; Ali, M.; Lu, J.; Mendis, P. Strain rate dependent constitutive model for predicting the material behaviour of polyurea under high strain rate tensile loading. Mater. Des. 2014, 53, 830–837. [Google Scholar] [CrossRef]
- Roland, C.M.; Fragiadakis, D.; Gamache, R.M. Elastomer steel laminate armor. Compos. Struct. 2010, 92, 1059–1064. [Google Scholar] [CrossRef]
- Xue, L.; Mock, W., Jr.; Belytschko, T. Penetration of DH-36 steel plates with and without polyurea coating. Mech. Mater. 2010, 42, 981–1003. [Google Scholar] [CrossRef]
- Bahei-El-Din, Y.A.; Dvorak, G.J. Behavior of sandwich plates reinforced with polyurethane/polyurea interlayers under blast loads. J. Sandw. Struct. Mater. 2007, 9, 261–281. [Google Scholar] [CrossRef]
- Bahei-El-Din, Y.A.; Dvorak, G.J. Wave propagation and dispersion in sandwich plates subjected to blast loads. Mech. Adv. Mater. Struct. 2007, 14, 465–475. [Google Scholar] [CrossRef]
- Bahei-El-Din, Y.A.; Dvorak, G.J. Enhancement of blast resistance of sandwich panels. Compos. Part B Eng. 2008, 39, 120–127. [Google Scholar] [CrossRef]
- Bahei-El-Din, Y.A.; Dvorak, G.J.; Fredricksen, O.J. A blast-tolerant sandwich plate design with a polyurea interlayer. Int. J. Solids Struct. 2006, 43, 7644–7658. [Google Scholar] [CrossRef]
- Tekalur, S.A.; Shukla, A.; Shivakumar, K. Blast resistance of polyurea based layered composite materials. Compos. Struct. 2008, 84, 271–281. [Google Scholar] [CrossRef]
- Grujicic, M.; Pandurangan, B.; d’Entremont, B. The role of adhesive in the ballistic/structural performance of ceramic/polymer-matrix composite hybrid armor. Mater. Des. 2012, 41, 380–393. [Google Scholar] [CrossRef]
- Grujicic, M.; Bell, W.C.; Pandurangan, B. Design and material selection guidelines and strategies for transparent armor systems. Mater. Des. 2012, 34, 808–819. [Google Scholar] [CrossRef]
- Grujicic, M.; Pandurangan, B.; He, T.; Cheeseman, B.A.; Yen, C.F.; Randow, C.L. Computational investigation of impact energy absorption capability of polyurea coatings via deformation-induced glass transition. Mater. Sci. Eng. 2010, 527, 7741–7751. [Google Scholar] [CrossRef]
- Raman, S.N. Polymeric Coatings for Enhanced Protection of Reinforced Concrete Structures from the Effects of Blast. PhD Thesis, Department of Infrastructure Engineering, The University of Melbourne, Australia, November 2011; p. 308. [Google Scholar]
- Raman, S.N.; Pham, T.; Ngo, T.; Mendis, P. Experimental investigation on the behaviour of RC panels retrofitted with polymer coatings under blast effects. In Proceedings of the 2nd International Conference on Sustainable Built Environment (ICSBE2012), Kandy, Sri Lanka, 14–16 December 2012; p. 14.
- Raman, S.N.; Ngo, T.; Mendis, P. A review on the use of polymeric coatings for retrofitting of structural elements against blast effects. Electron. J. Struct. Eng. 2011, 11, 69–80. [Google Scholar]
- Raman, S.N.; Ngo, T.; Mendis, P.; Pham, T. Elastomeric polymers for retrofitting of reinforced concrete structures against the explosive effects of blast. Adv. Mater. Sci. Eng. 2012, 2012, 754142. [Google Scholar] [CrossRef]
- Sharmin, E.; Zafar, F. Chapter 1, Polyurethane: An Introduction. In Polyurethane; Zafar, F., Sharmin, E., Eds.; INTECH: Rijeka, Croatia, 2012; pp. 3–6. [Google Scholar]
- Chattopadhyay, D.K.; Raju, K.V.S.N. Structural engineering of polyurethane coating for high performance applications. Prog. Polym. Sci. 2007, 32, 352–418. [Google Scholar] [CrossRef]
- Hussain, H.K.; Zhang, L.Z.; Liu, G.W. An experimental study on strengthening reinforced concrete t-beams using new material Poly-Urethane-Cement (PCU). Constr. Build. Mater. 2013, 40, 104–117. [Google Scholar] [CrossRef]
- Fam, A.; Sharaf, T. Flexural performance of sandwich panels comprising polyurethane core and GFRP and ribs of various configurations. Compos. Struct. 2010, 92, 2927–2935. [Google Scholar] [CrossRef]
- Gutierrez-Gonzalez, S.; Gadea, J.; Rodriguez, A.; Junco, C.; Calderron, V. Light weight plaster materials with enhanced thermal properties made with polyurethane foam. Constr. Build. Mater. 2012, 28, 635–658. [Google Scholar] [CrossRef]
- Chian, K.S.; Gan, L.H. Development of a rigid polyurethane foam from palm oil. J. Appl. Polym. Sci. 1998, 68, 509–515. [Google Scholar] [CrossRef]
- Fuest, R.W. Chapter 9, Polyurethane Elastomer. In Rubber Technology: Compounding and Testing Performance; Dick, J.S., Ed.; Chemtura: Middlebury, CT, USA, 2001; pp. 238–263. [Google Scholar]
- Ashida, K. Polyurethane and Related Foams; Taylor & Francis, CRC Press: Baco Ratan, FL, USA, 2007. [Google Scholar]
- Velayutham, T.S.; Maji, W.H.; Ahamad, A.B.; Kang, G.Y.; Gan, S.N. Synthesis and characterization of polyurethane coatings derived from polyols synthesized with glycerol, phthalic anhydride and oleic Acid. Prog. Org. Coat. 2009, 66, 367–371. [Google Scholar] [CrossRef]
- Fridrihsone, A.; Stirna, U.; Lazdina, B.; Misa-ne, M.; Vilsone, D. Characterization of polyurethane networks structure and properties based on rapeseed oil derived polyol. Eur. Polym. J. 2013, 49, 1204–1214. [Google Scholar] [CrossRef]
- Yi, J.; Boyce, M.C.; Lee, G.F.; Balizer, E. Large deformation rate-dependent stress–strain behavior of polyurea and polyurethanes. Polymer 2006, 4, 319–329. [Google Scholar] [CrossRef]
- Pztrovic, Z.S.; Ferguson, J. Polyurethane elastomers. Prog. Polym. Sci. 1991, 16, 695–836. [Google Scholar] [CrossRef]
- Prisacariu, C.; Olley, R.H.; Caraculacu, A.A.; Bassett, D.C.; Martin, C. The effect of hard segment ordering in copolyurethane elastomers obtained by using simultaneously two types of diisocyanates. Polymer 2003, 44, 5407–5421. [Google Scholar] [CrossRef]
- Prisacariu, C.; Buckley, C.P.; Caraculacu, A.A. Mechanical response of dibenzyl-based polyurethanes with diol chain extension. Polymer 2005, 46, 3884–3894. [Google Scholar] [CrossRef]
- Qi, H.J.; Boyce, M.C. Stress–strain behavior of thermoplastic polyurethanes. Mech. Mater. 2005, 37, 817–839. [Google Scholar] [CrossRef]
- Furukawa, M.; Mitsui, Y.; Fukumaru, T.; Kojio, K. Microphase-separated structure and mechanical properties of novel polyurethane elastomers prepared with ether based diisocyanate. Polymer 2005, 46, 10817–10822. [Google Scholar] [CrossRef]
- Buckley, C.P.; Prisacariu, C.; Martin, C. Elasticity and inelasticity of thermoplastic polyurethane elastomers: Sensitivity to chemical and physical structure. Polymer 2010, 51, 3213–3224. [Google Scholar] [CrossRef]
- Kojio, K.; Furukawa, M.; Nonaka, Y.; Nakamura, S. Control of mechanical properties of thermoplastic polyurethane elastomers by restriction of crystallization of soft segment. Materials 2010, 3, 5097–5110. [Google Scholar] [CrossRef]
- Sonnenschein, M.F.; Ginzburg, V.V.; Schiller, K.S.; Wendt, B.L. Design, polymerization, and properties of high performance thermoplastic polyurethane elastomers from seed-oil derived soft segments. Polymer 2013, 54, 1350–1360. [Google Scholar] [CrossRef]
- Somarathna, H.M.C.C.; Raman, S.N.; Mutalib, A.A.; Badri, K.H. Mechanical characterization of polyurethane elastomers: For retrofitting application against blast effects. In Proceedings of the Third Conference on Smart Monitoring, Assessment and Rehabilitation of Structures (SMAR2015), Antalya, Turkey, 7–9 September 2015; pp. 82–89.
- Sarva, S.S.; Hsieh, A.J. The effect of microstructure on the rate-dependent stress-strain behavior of poly(urethane urea) elastomers. Polymer 2009, 50, 3007–3015. [Google Scholar] [CrossRef]
- Russo, R.; Thomas, E. Phase separation in linear and cross-linked polyurethanes. J. Macromol. Sci. B 1983, 22, 553–575. [Google Scholar] [CrossRef]
- O’Sickely, M.J.; Lawrey, B.D.; Wilkes, G.L. Structural property relationships of poly(urethane urea)s with ultra-low monol content poly(propylene glycol) soft segment molecular weight and hard segment content. J. Appl. Polym. Sci. 2002, 84, 229–243. [Google Scholar]
- Shim, J.; Mohr, D. Using split Hopkinson pressure bars to perform large strain compression tests on polyurea at low, intermediate and high strain rates. Int. J. Impact Eng. 2009, 36, 1116–1127. [Google Scholar] [CrossRef]
- Badri, K.H. Chapter 20, Biobased Polyurethane from Palm Kernel Oil-Based Polyol. In Polyurethane; Zafar, F., Sharmin, E., Eds.; INTECH: Rijeka, Croatia, 2012; pp. 447–470. [Google Scholar]
- Badri, K.H.; Ahmad, S.H.; Zakaria, S. The production of a high functionality RBD palm kernel oil-based polyester polyol. J. Appl. Polym. Sci. 2001, 81, 384–389. [Google Scholar] [CrossRef]
- Domínguez, C.; Aroca, M.; Rodríguez, J. Izod impact tests of polypropylenes: The clamping pressure influence. Polym. Test. 2006, 25, 49–55. [Google Scholar] [CrossRef]
- Manahan Sr, M.P., Jr.; Cruz, C.A.; Yohn, H.E. Instrumented Impact Testing of Plastics, Limitation of testing Method of Plastics, ASTM STP 1369; Peraro, J.S., Ed.; American Society for Testing and Materials: West Conshohocken, PA, USA, 2000. [Google Scholar]
- Meredith, N.; Silberstein, M.N. Mechanics of Notched Izod Impact Testing of Polycarbonate; Massachusetts Institute of Technology: Cambridge, MA, USA, 2005. [Google Scholar]
- Posts Tagged “Shore Durometer Scales”, Polytek Development Corp. Available online: http://blog.polytek.com/tag/shore-durometer-scales/ (accessed on 15 April 2003).
- Tsou, C.H.; Lee, H.T.; Tsai, H.A.; Cheng, H.J.; Sueng, M.C. Synthesis and properties of biodegradable polycaprolactone/polyurethanes by using 2,6-pyridinedimethanol as a chain extender. Polym. Degrad. Stab. 2013, 98, 643–650. [Google Scholar] [CrossRef]
- Bonart, R. Thermoplastic elastomers. Polymer 1979, 20, 1389–1403. [Google Scholar] [CrossRef]
- Enderle, H.F.; Kilian, H.G.; Heise, B.; Mayer, J.; Hespe, H. Irreversible deformation of semicrystalline pur-elastomers—A novel concept. Colloid Polym. Sci. 1986, 264, 305–322. [Google Scholar] [CrossRef]
- Delpech, M.C.; Coutinho, F.M.B. Waterborne anionic polyurethanes and poly(urethane-urea)s: Influence of the chain extender on mechanical and adhesive properties. Polym. Test. 2000, 19, 939–952. [Google Scholar] [CrossRef]
- Hibbeler, R.C. Mechanics of Materials, 8th ed.; Pearson-Prentice Hall: Singapore, 2011. [Google Scholar]


| Parameters | Davidson et al. (2004) [9] | Bahei-El-Din and Dvorak (2007a; 2007b) [29,30] | Tekalur et al. (2008) [33] | Shim & Mohr (2009) [64] | Raman et al. (2011) [37] | Yi et al. (2006) [51] | Sayed et al. (2009) [19] | Grujicic et al. (2010, 2012b) [35,36] | Mohotti et al. (2014) [25] | |
|---|---|---|---|---|---|---|---|---|---|---|
| Polymer type | Polyurea | Polyurea | PU | Polyurea | Polyurea | Polyurea | PU | Polyurea | PU | Polyurea |
| Modulus of elasticity, E (MPa) | 234 | 2,520 | 1,500 | 11.16 | 100 | 49.5 | – | – | 689 | – |
| Tangent modulus, Etan (MPa) | 23 | 11 | 10 | – | – | 1.9 | – | – | – | – |
| Yield stress (MPa) | 11 | 11 | 10 | – | – | 5.5 | – | – | – | – |
| Strain at rupture | 0.89 | – | – | 3.5 | – | – | – | – | – | – |
| Stress at rupture, σ (MPa) | 14 | – | – | – | – | – | – | – | – | – |
| Poisson‘s ratio, ν | 0.4 | 0.465 | 0.463 | – | 0.448 | – | – | 0.495 | – | – |
| Modulus of rigidity, G (MPa) | 83.6 | 860 | 513 | – | 34.5 | – | – | – | – | – |
| Bulk modulus, k (MPa) | 390 | – | – | – | 320.5 | – | – | – | – | – |
| Tensile strength (MPa) | 14 | – | – | 20.34 | – | 10.7 | – | – | 62 | – |
| Mass density, ρ (MPa) | 1,442 | 1,070 | 1,200 | – | 1,000 | 950 | 1,100 | 1,070 | 1,140 | 1,065 |
| Flexural Strength (MPa) | – | – | – | – | – | – | – | – | 89 | – |
| Flexural Modulus (MPa) | – | – | – | – | – | – | – | – | 2,020 | – |
| PU Type | Tg (°C) |
|---|---|
| PU0 | 79.7 |
| PU2 | 68.9 |
| PU4 | 59.6 |
| PU6 | 59.0 |
| PU8 | 58.5 |
| PU10 | 56.2 |
| PU12 | 55.0 |
| PU15 | 52.7 |
© 2016 by the authors. Licensee MDPI, Basel, Switzerland. This article is an open access article distributed under the terms and conditions of the Creative Commons Attribution (CC-BY) license ( http://creativecommons.org/licenses/by/4.0/).
Share and Cite
Somarathna, H.M.C.C.; Raman, S.N.; Badri, K.H.; Mutalib, A.A.; Mohotti, D.; Ravana, S.D. Quasi-Static Behavior of Palm-Based Elastomeric Polyurethane: For Strengthening Application of Structures under Impulsive Loadings. Polymers 2016, 8, 202. https://doi.org/10.3390/polym8050202
Somarathna HMCC, Raman SN, Badri KH, Mutalib AA, Mohotti D, Ravana SD. Quasi-Static Behavior of Palm-Based Elastomeric Polyurethane: For Strengthening Application of Structures under Impulsive Loadings. Polymers. 2016; 8(5):202. https://doi.org/10.3390/polym8050202
Chicago/Turabian StyleSomarathna, H. M. Chandima Chathuranga, Sudharshan N. Raman, Khairiah Haji Badri, Azrul A. Mutalib, Damith Mohotti, and Sri Devi Ravana. 2016. "Quasi-Static Behavior of Palm-Based Elastomeric Polyurethane: For Strengthening Application of Structures under Impulsive Loadings" Polymers 8, no. 5: 202. https://doi.org/10.3390/polym8050202