
Mechanical Characterization of the Tensile Properties of Glass Fiber and Its Reinforced Polymer (GFRP) Composite under Varying Strain Rates and Temperatures


 ,
,
Abstract
:
1. Introduction
2. Experimental Program
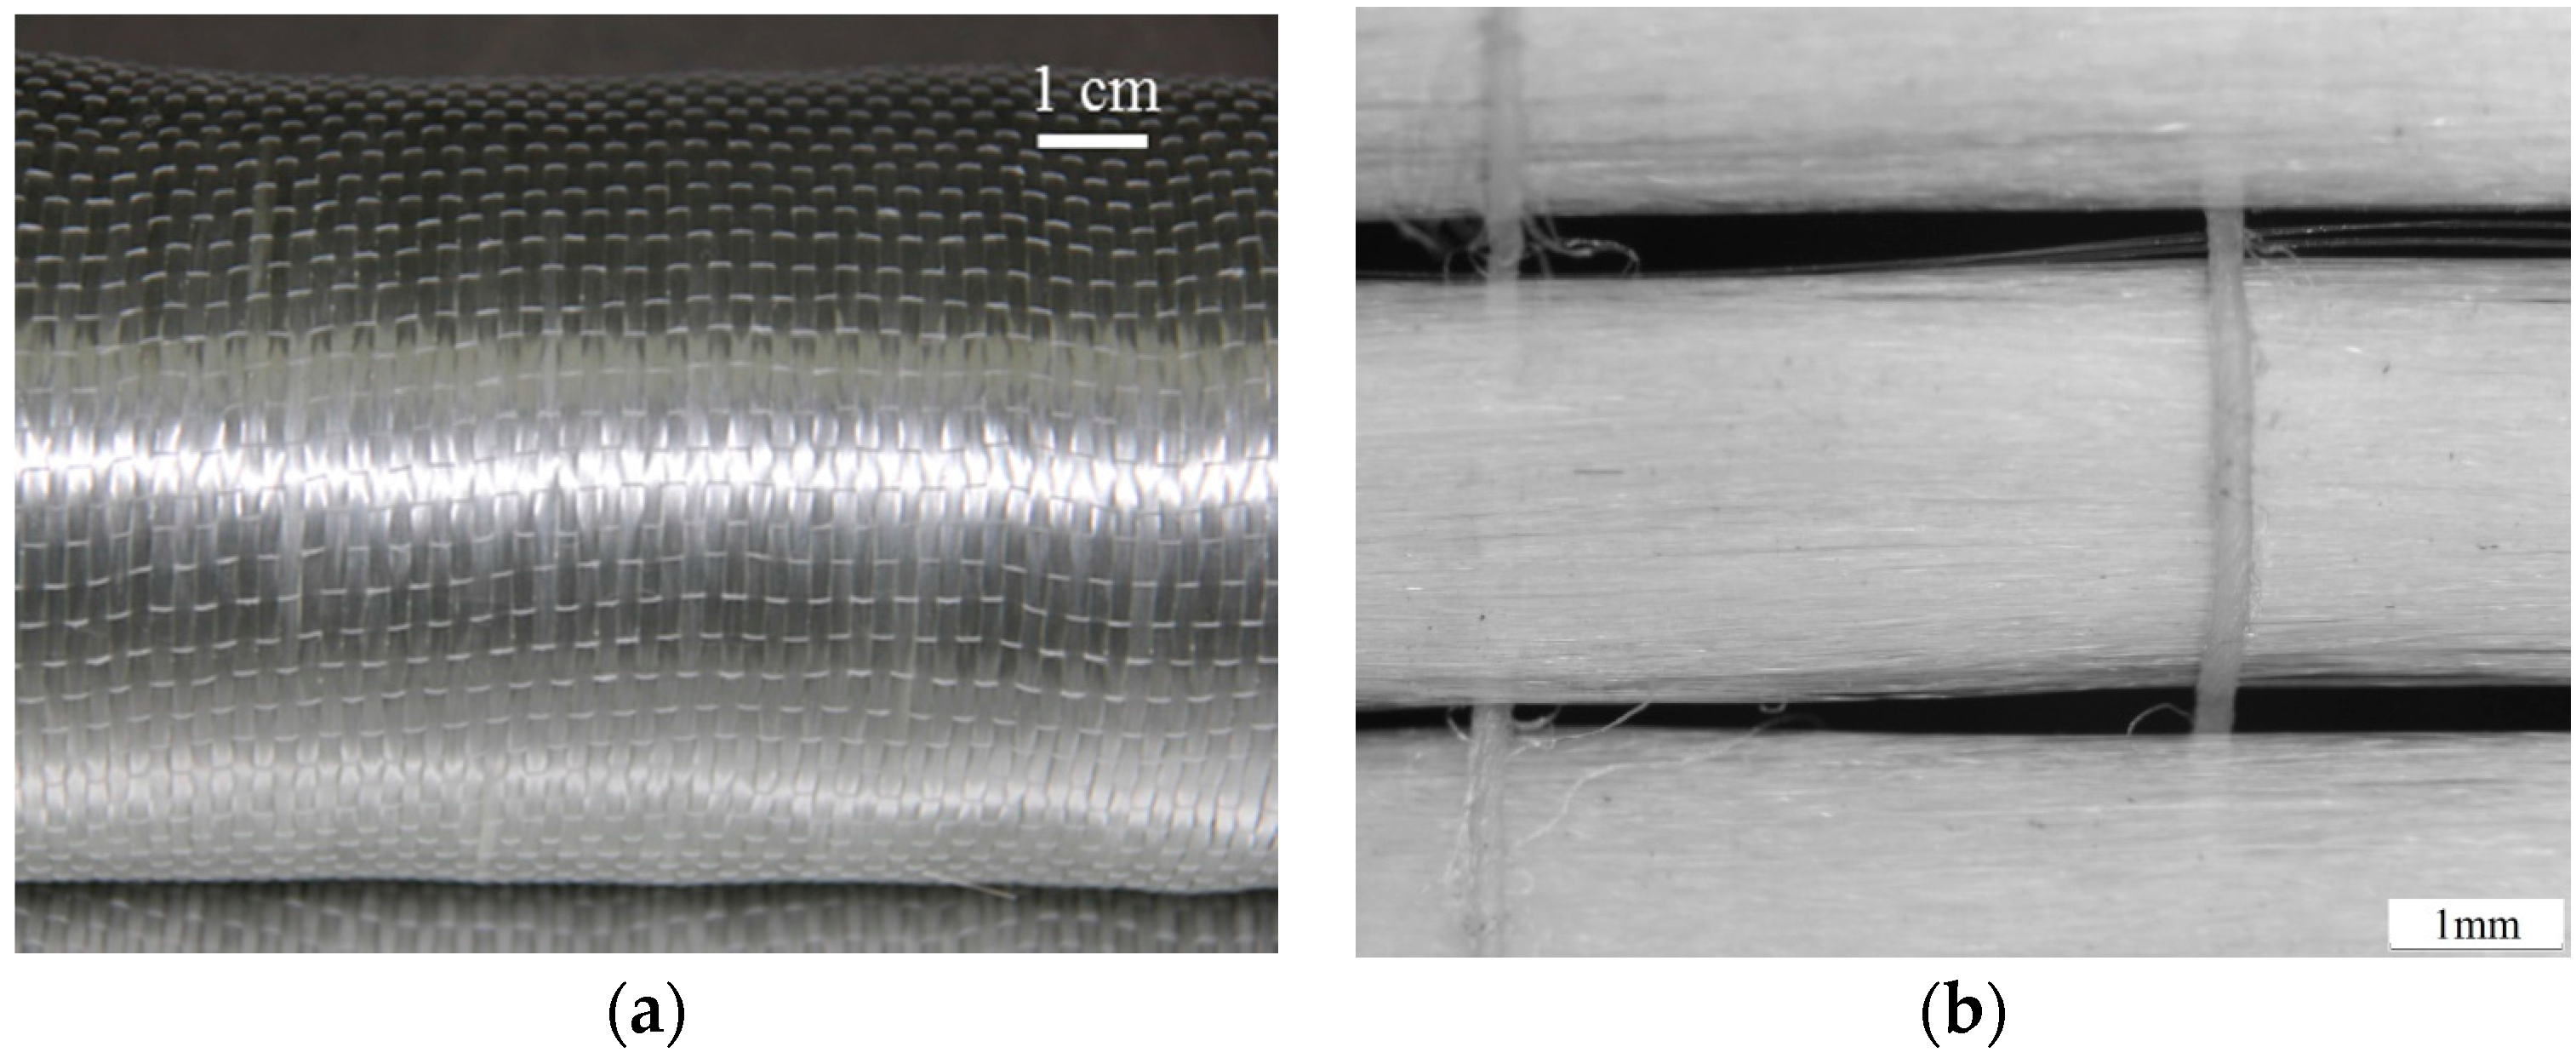
2.1. Testing Materials
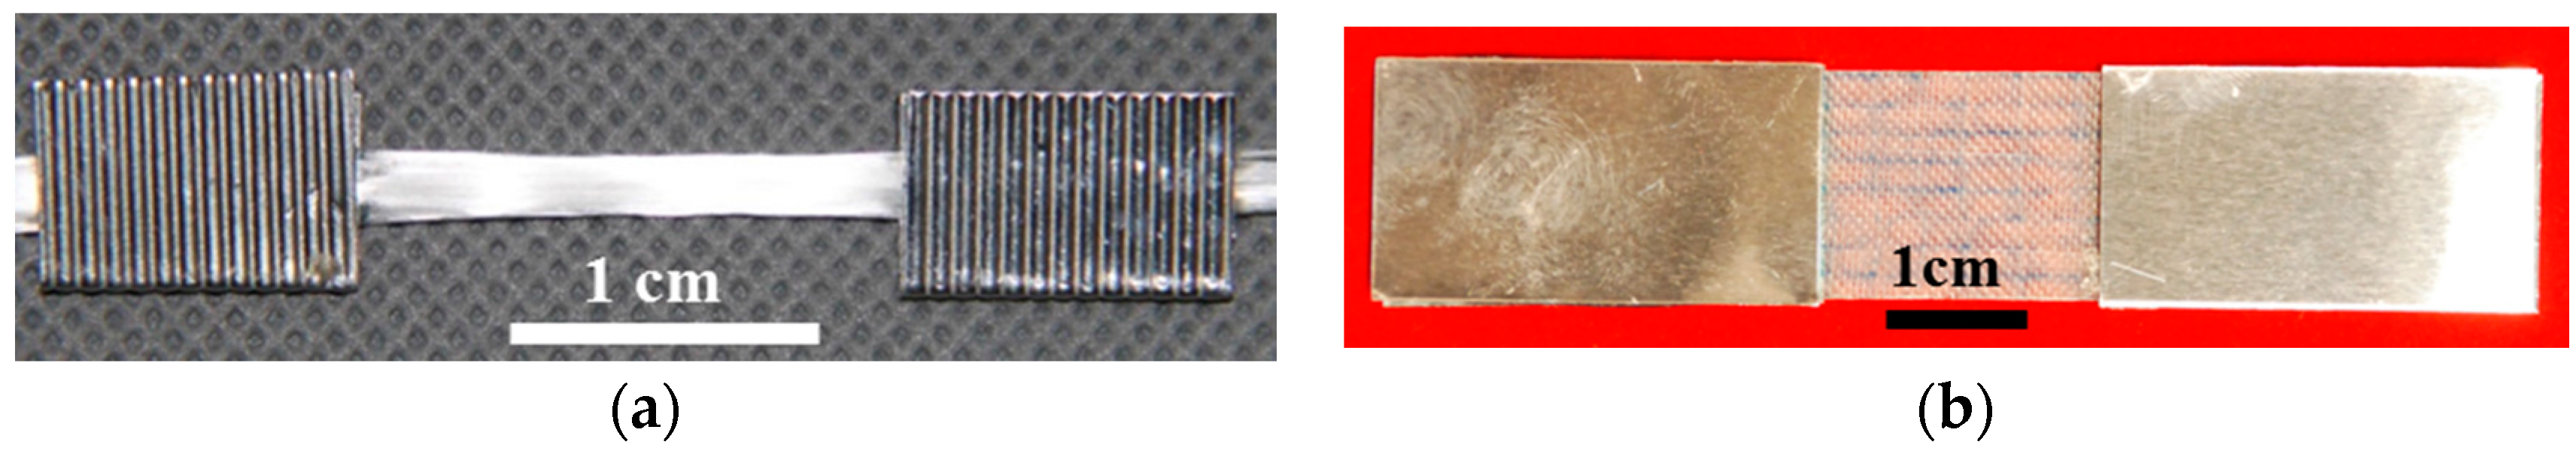
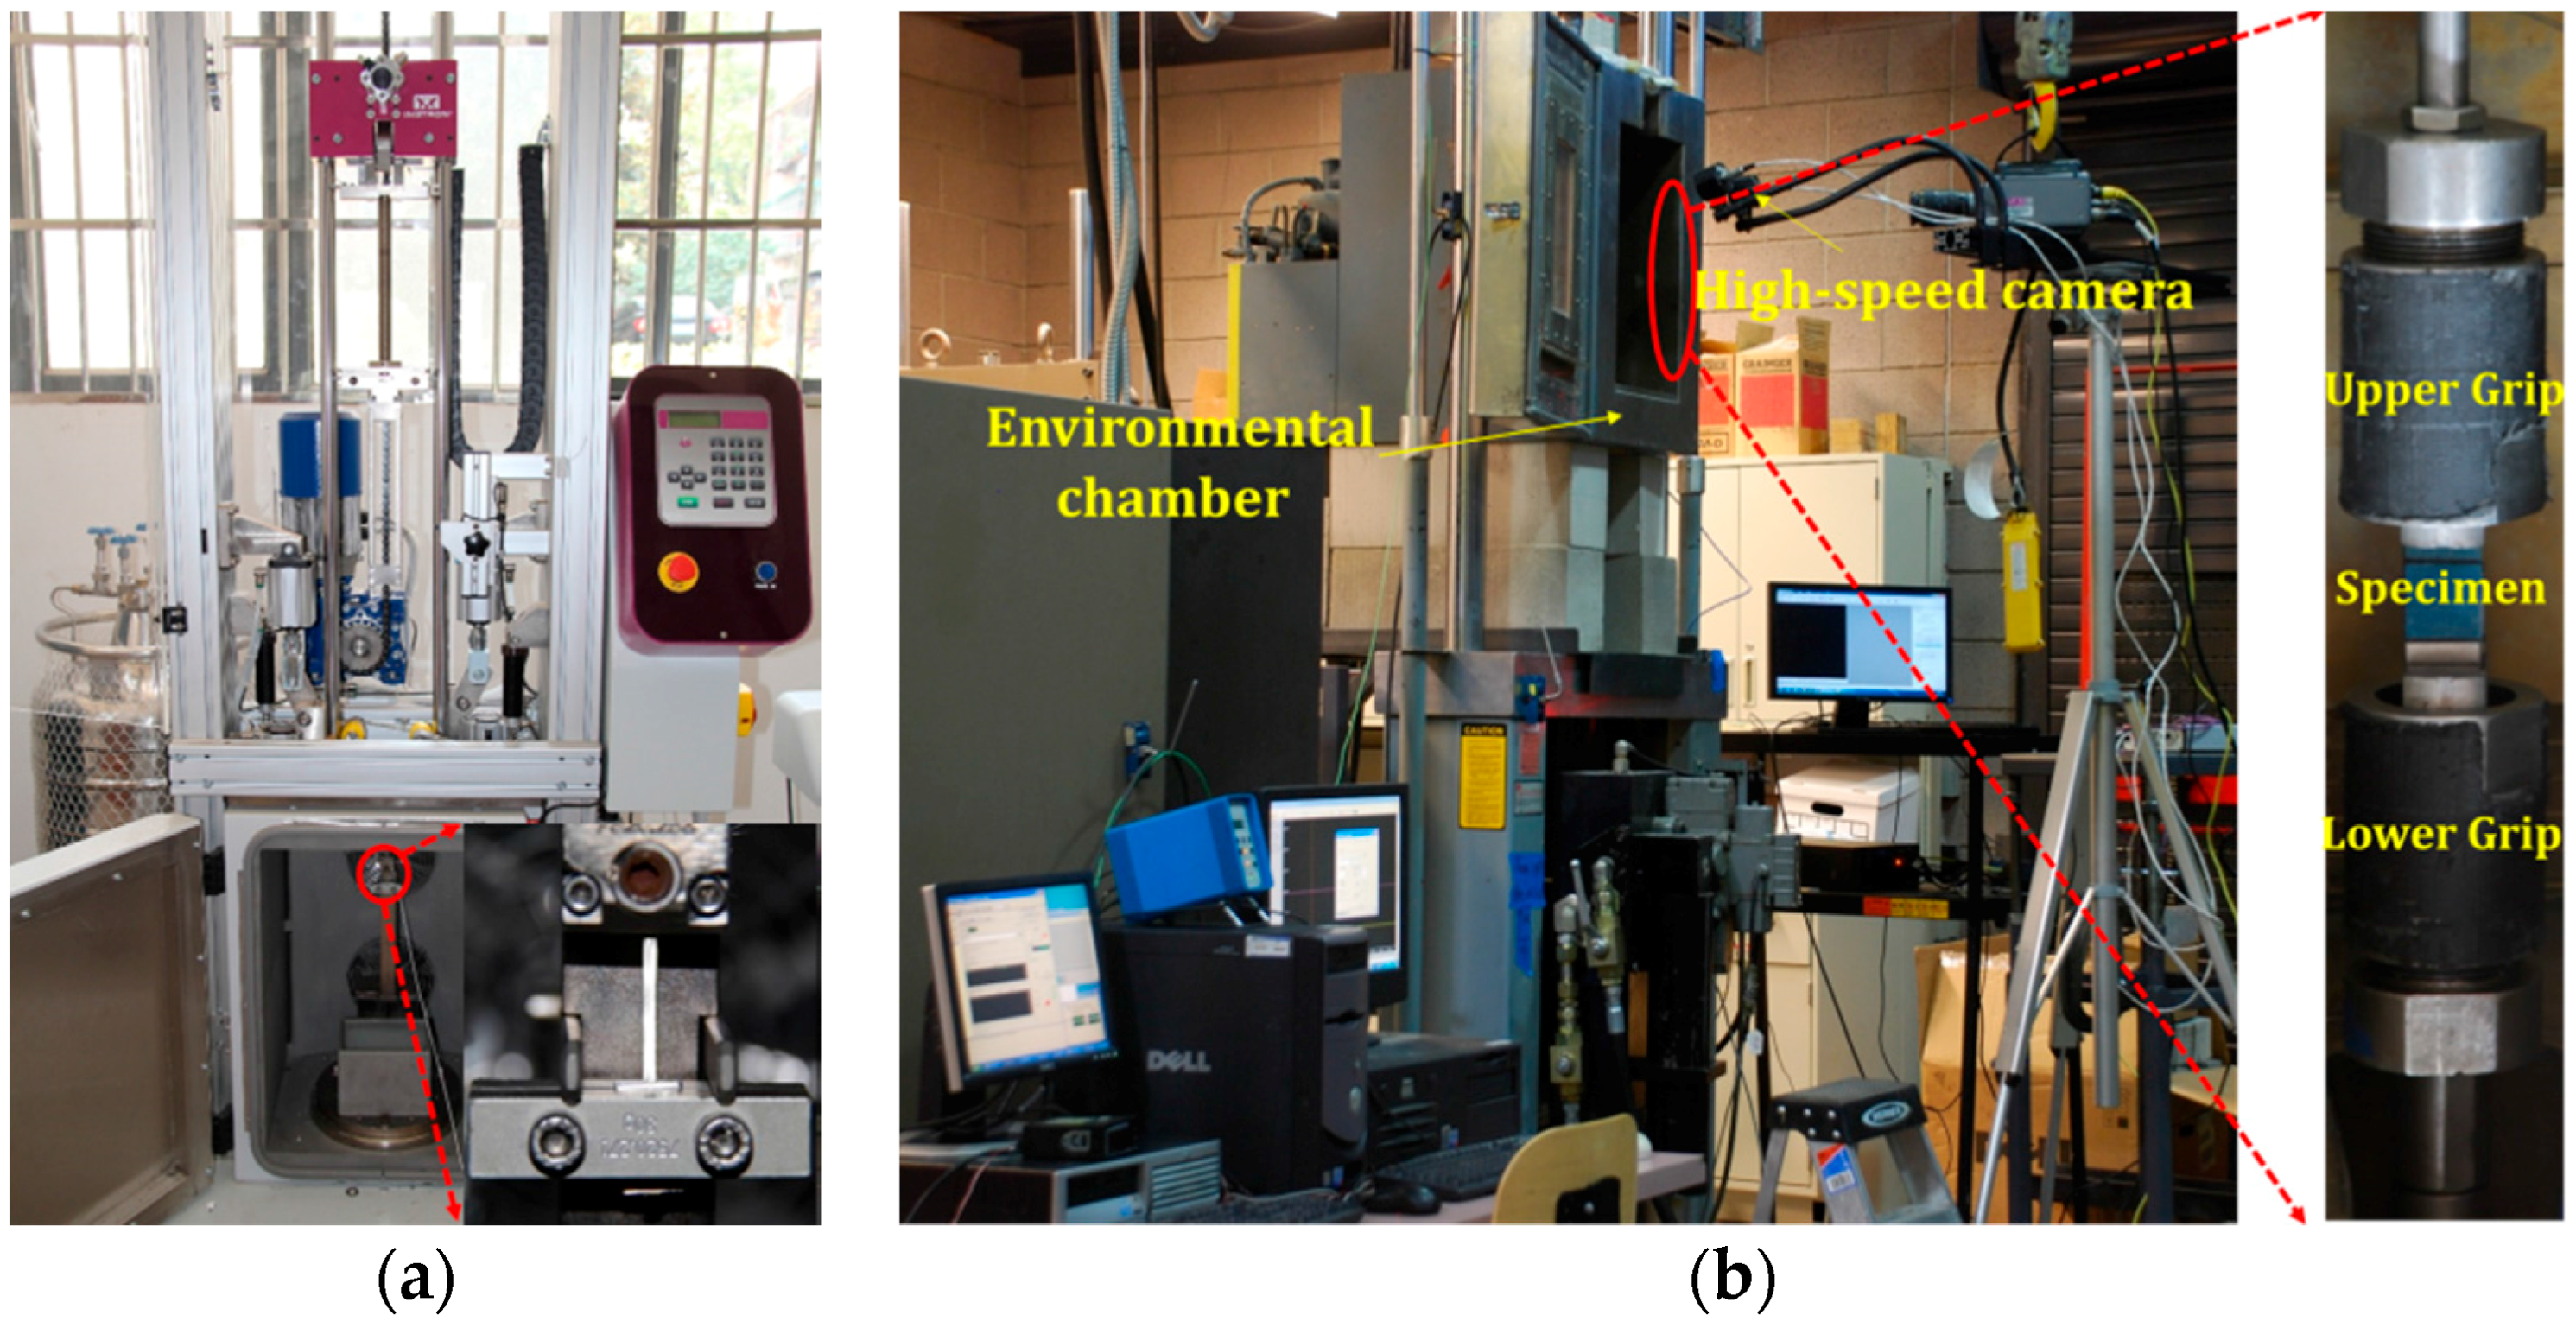
2.2. Specimen Fabrication and Test Procedures
3. Results and Discussion
3.1. Strain Rate Effect on Tensile Properties
3.2. Temperature Effect on Tensile Properties
4. Comparison with Literature
4.1. Strain Rate Data
4.2. Temperature Data
5. Weibull Analysis
6. Conclusions
- (1)
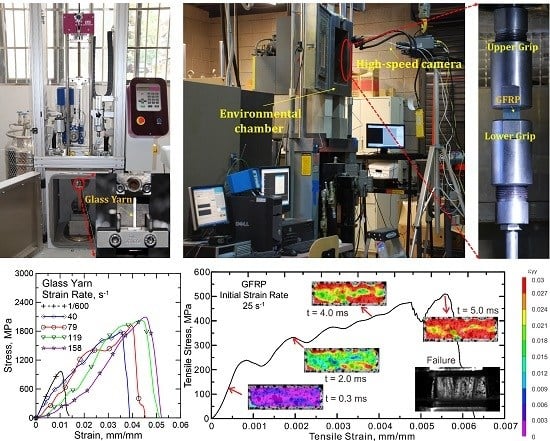
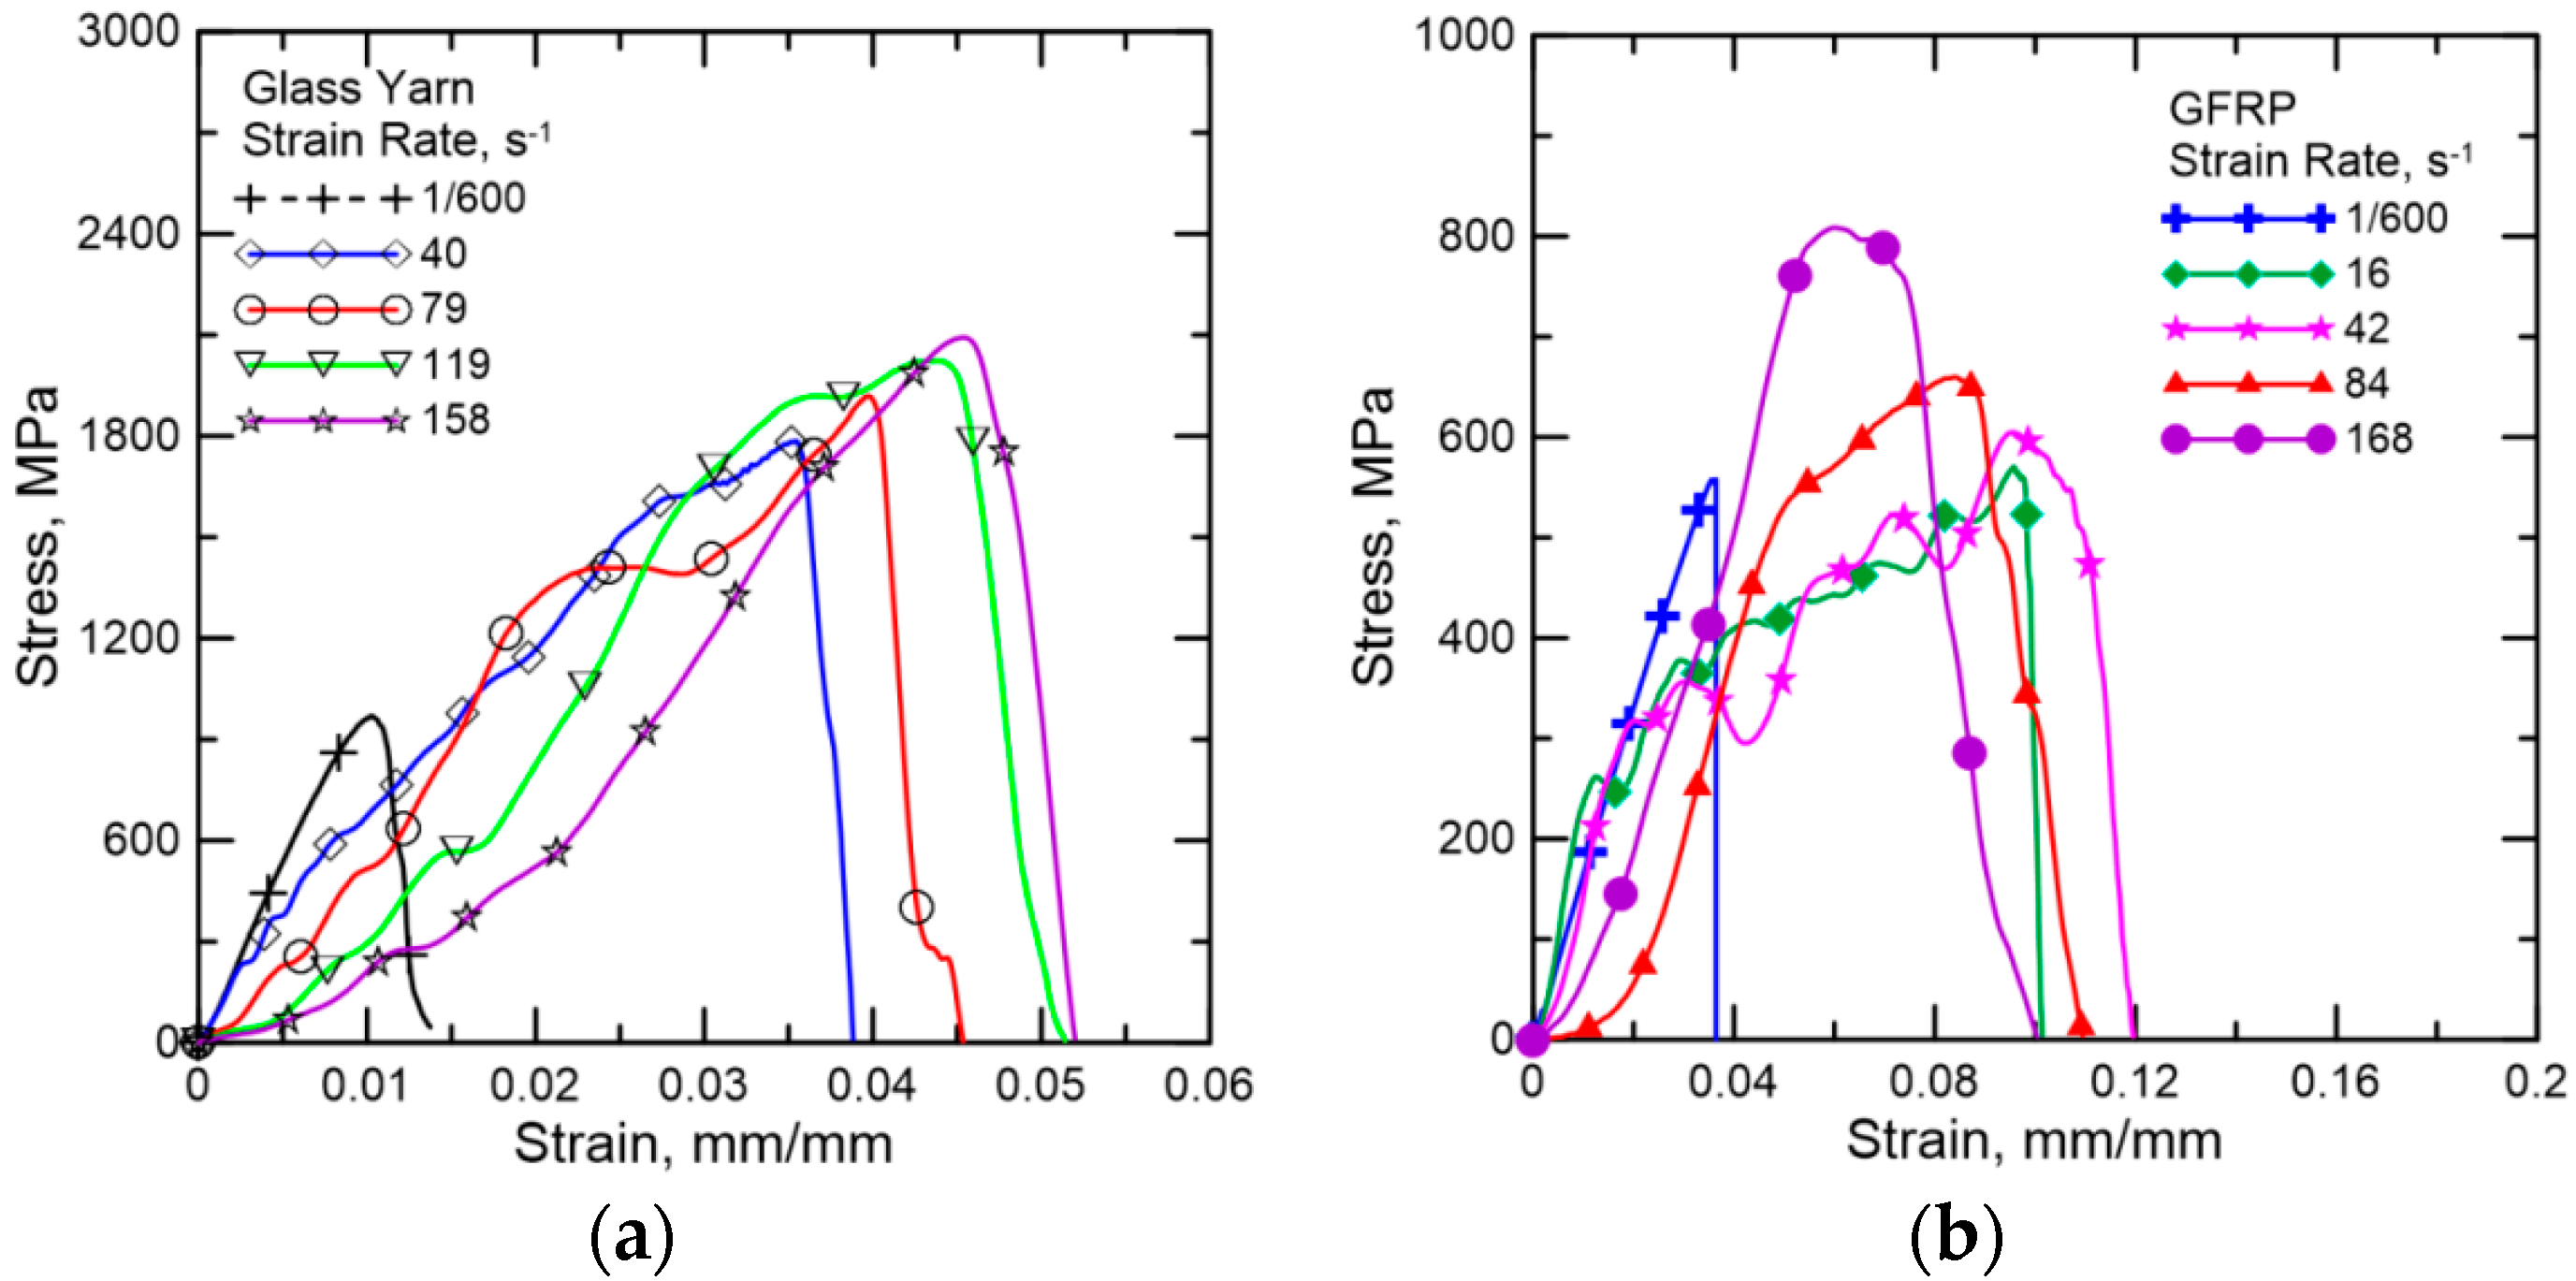
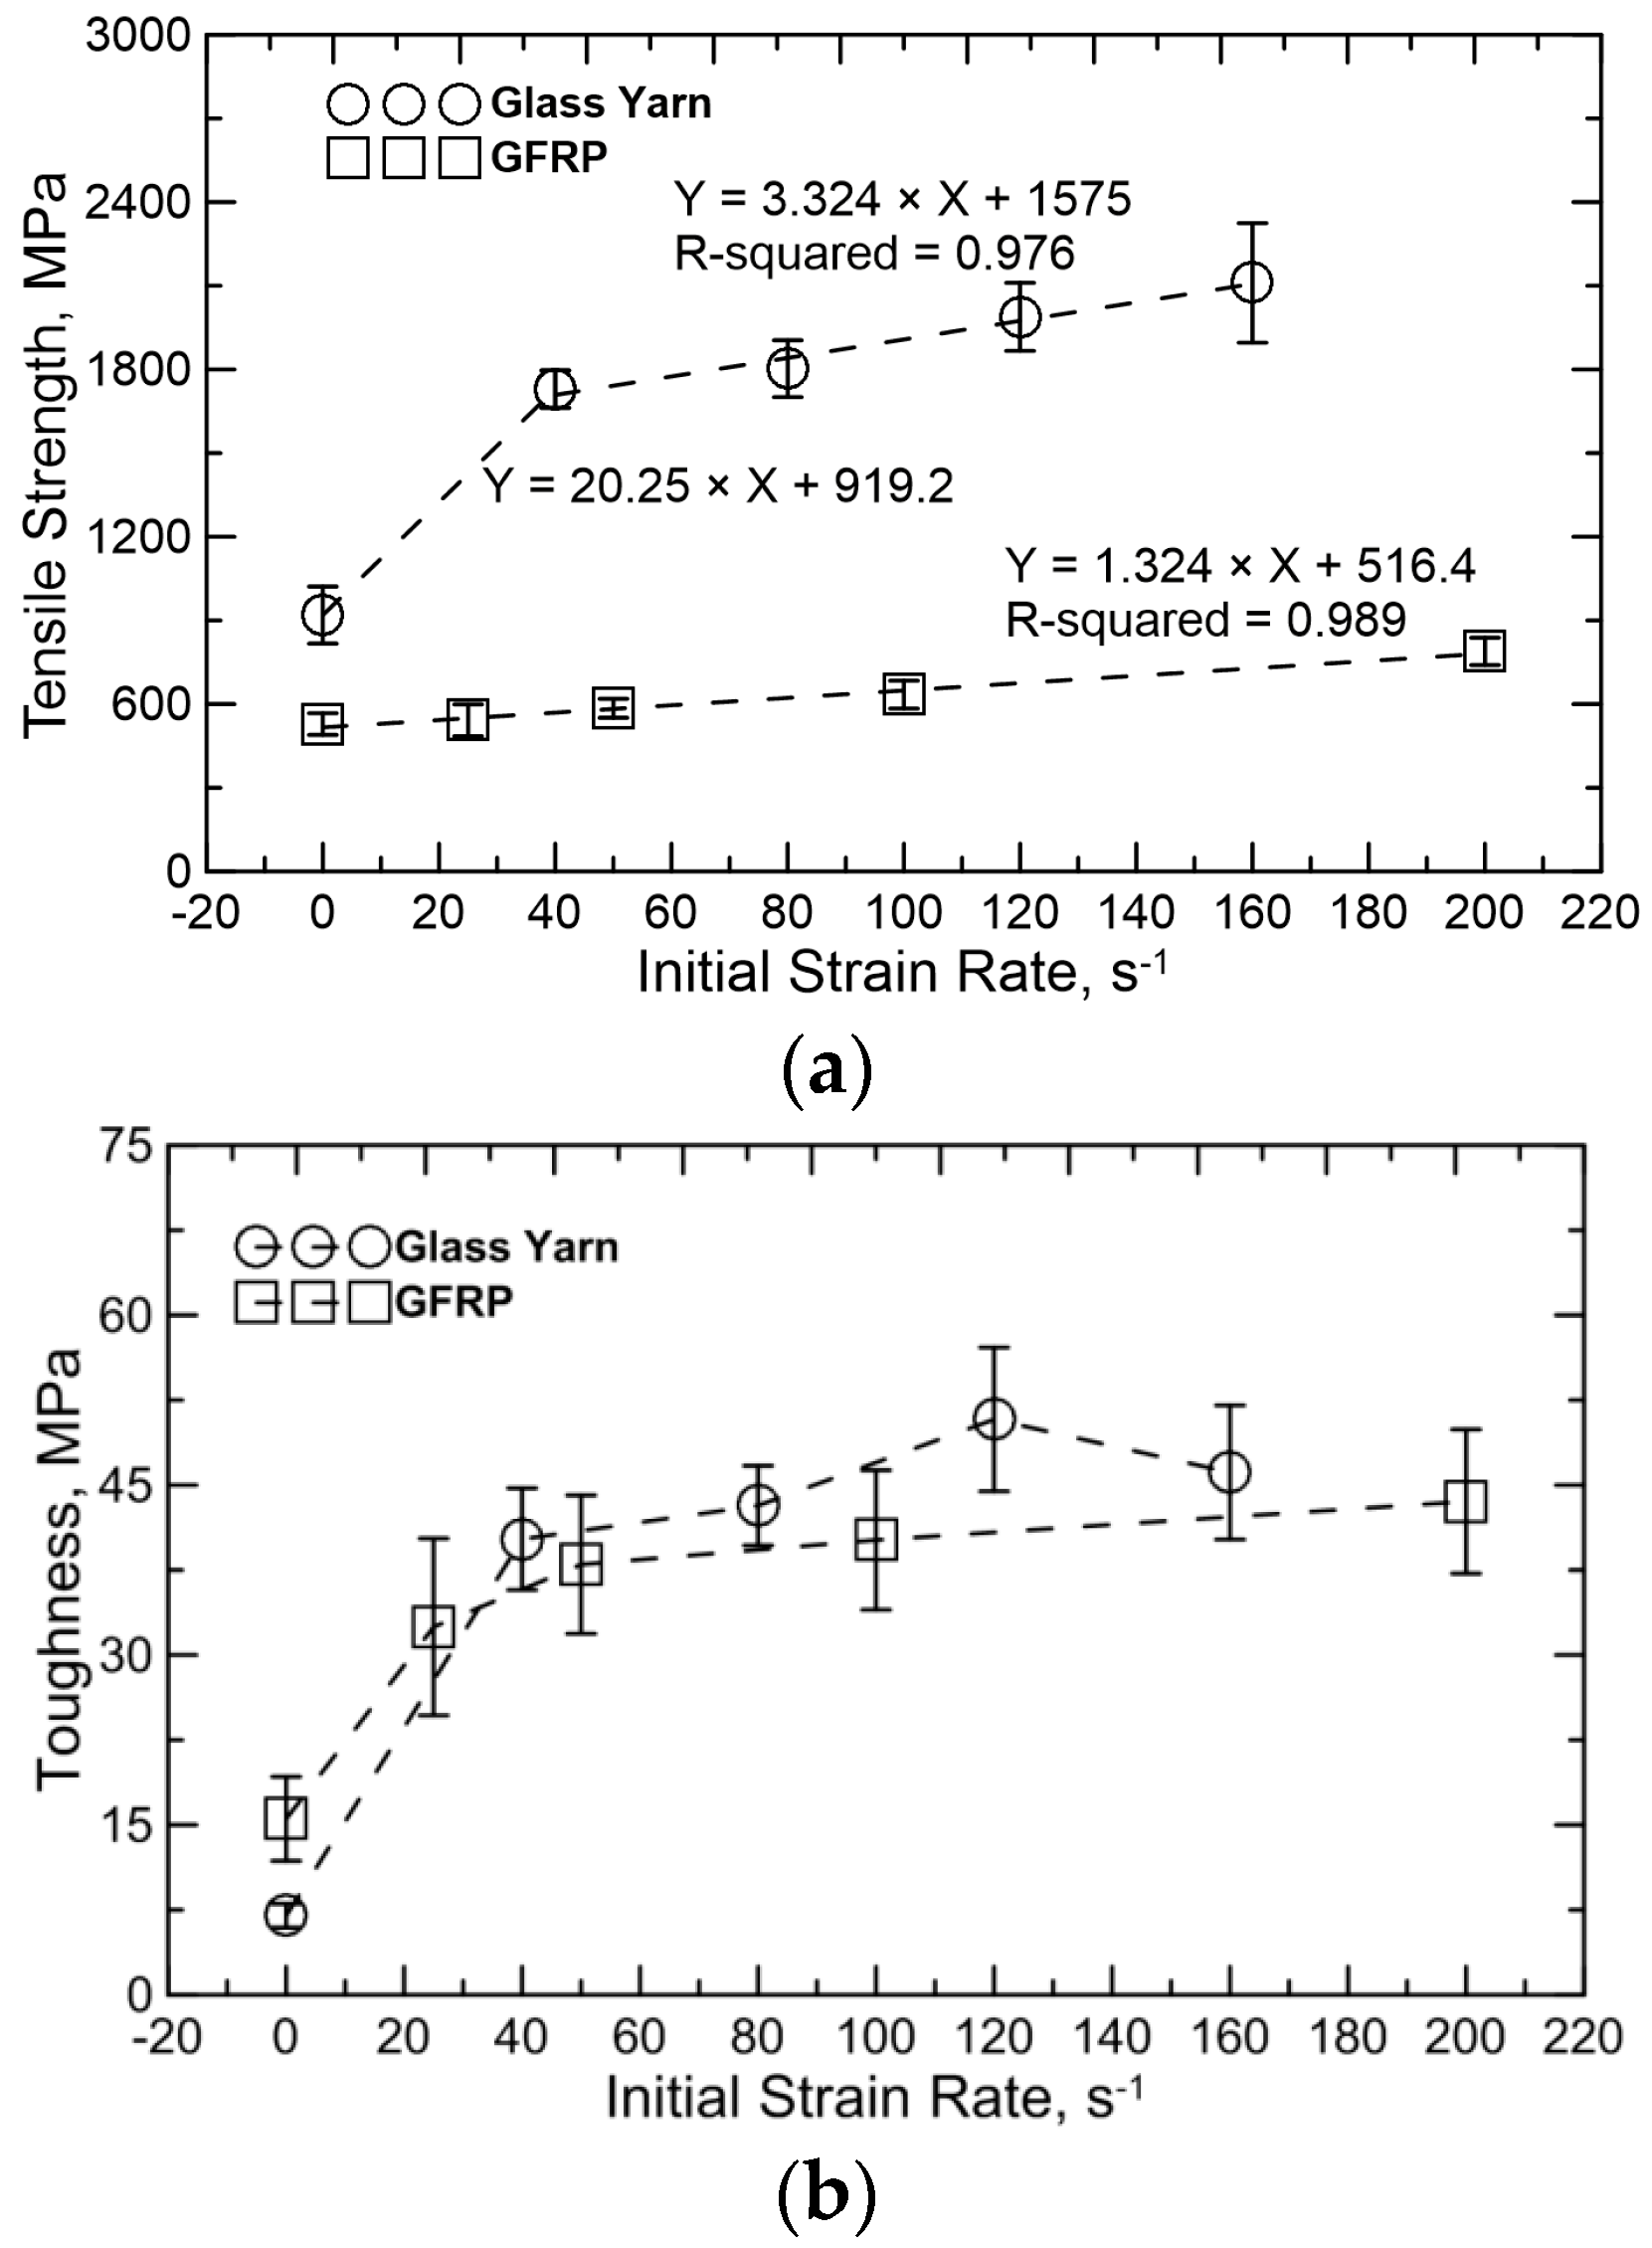
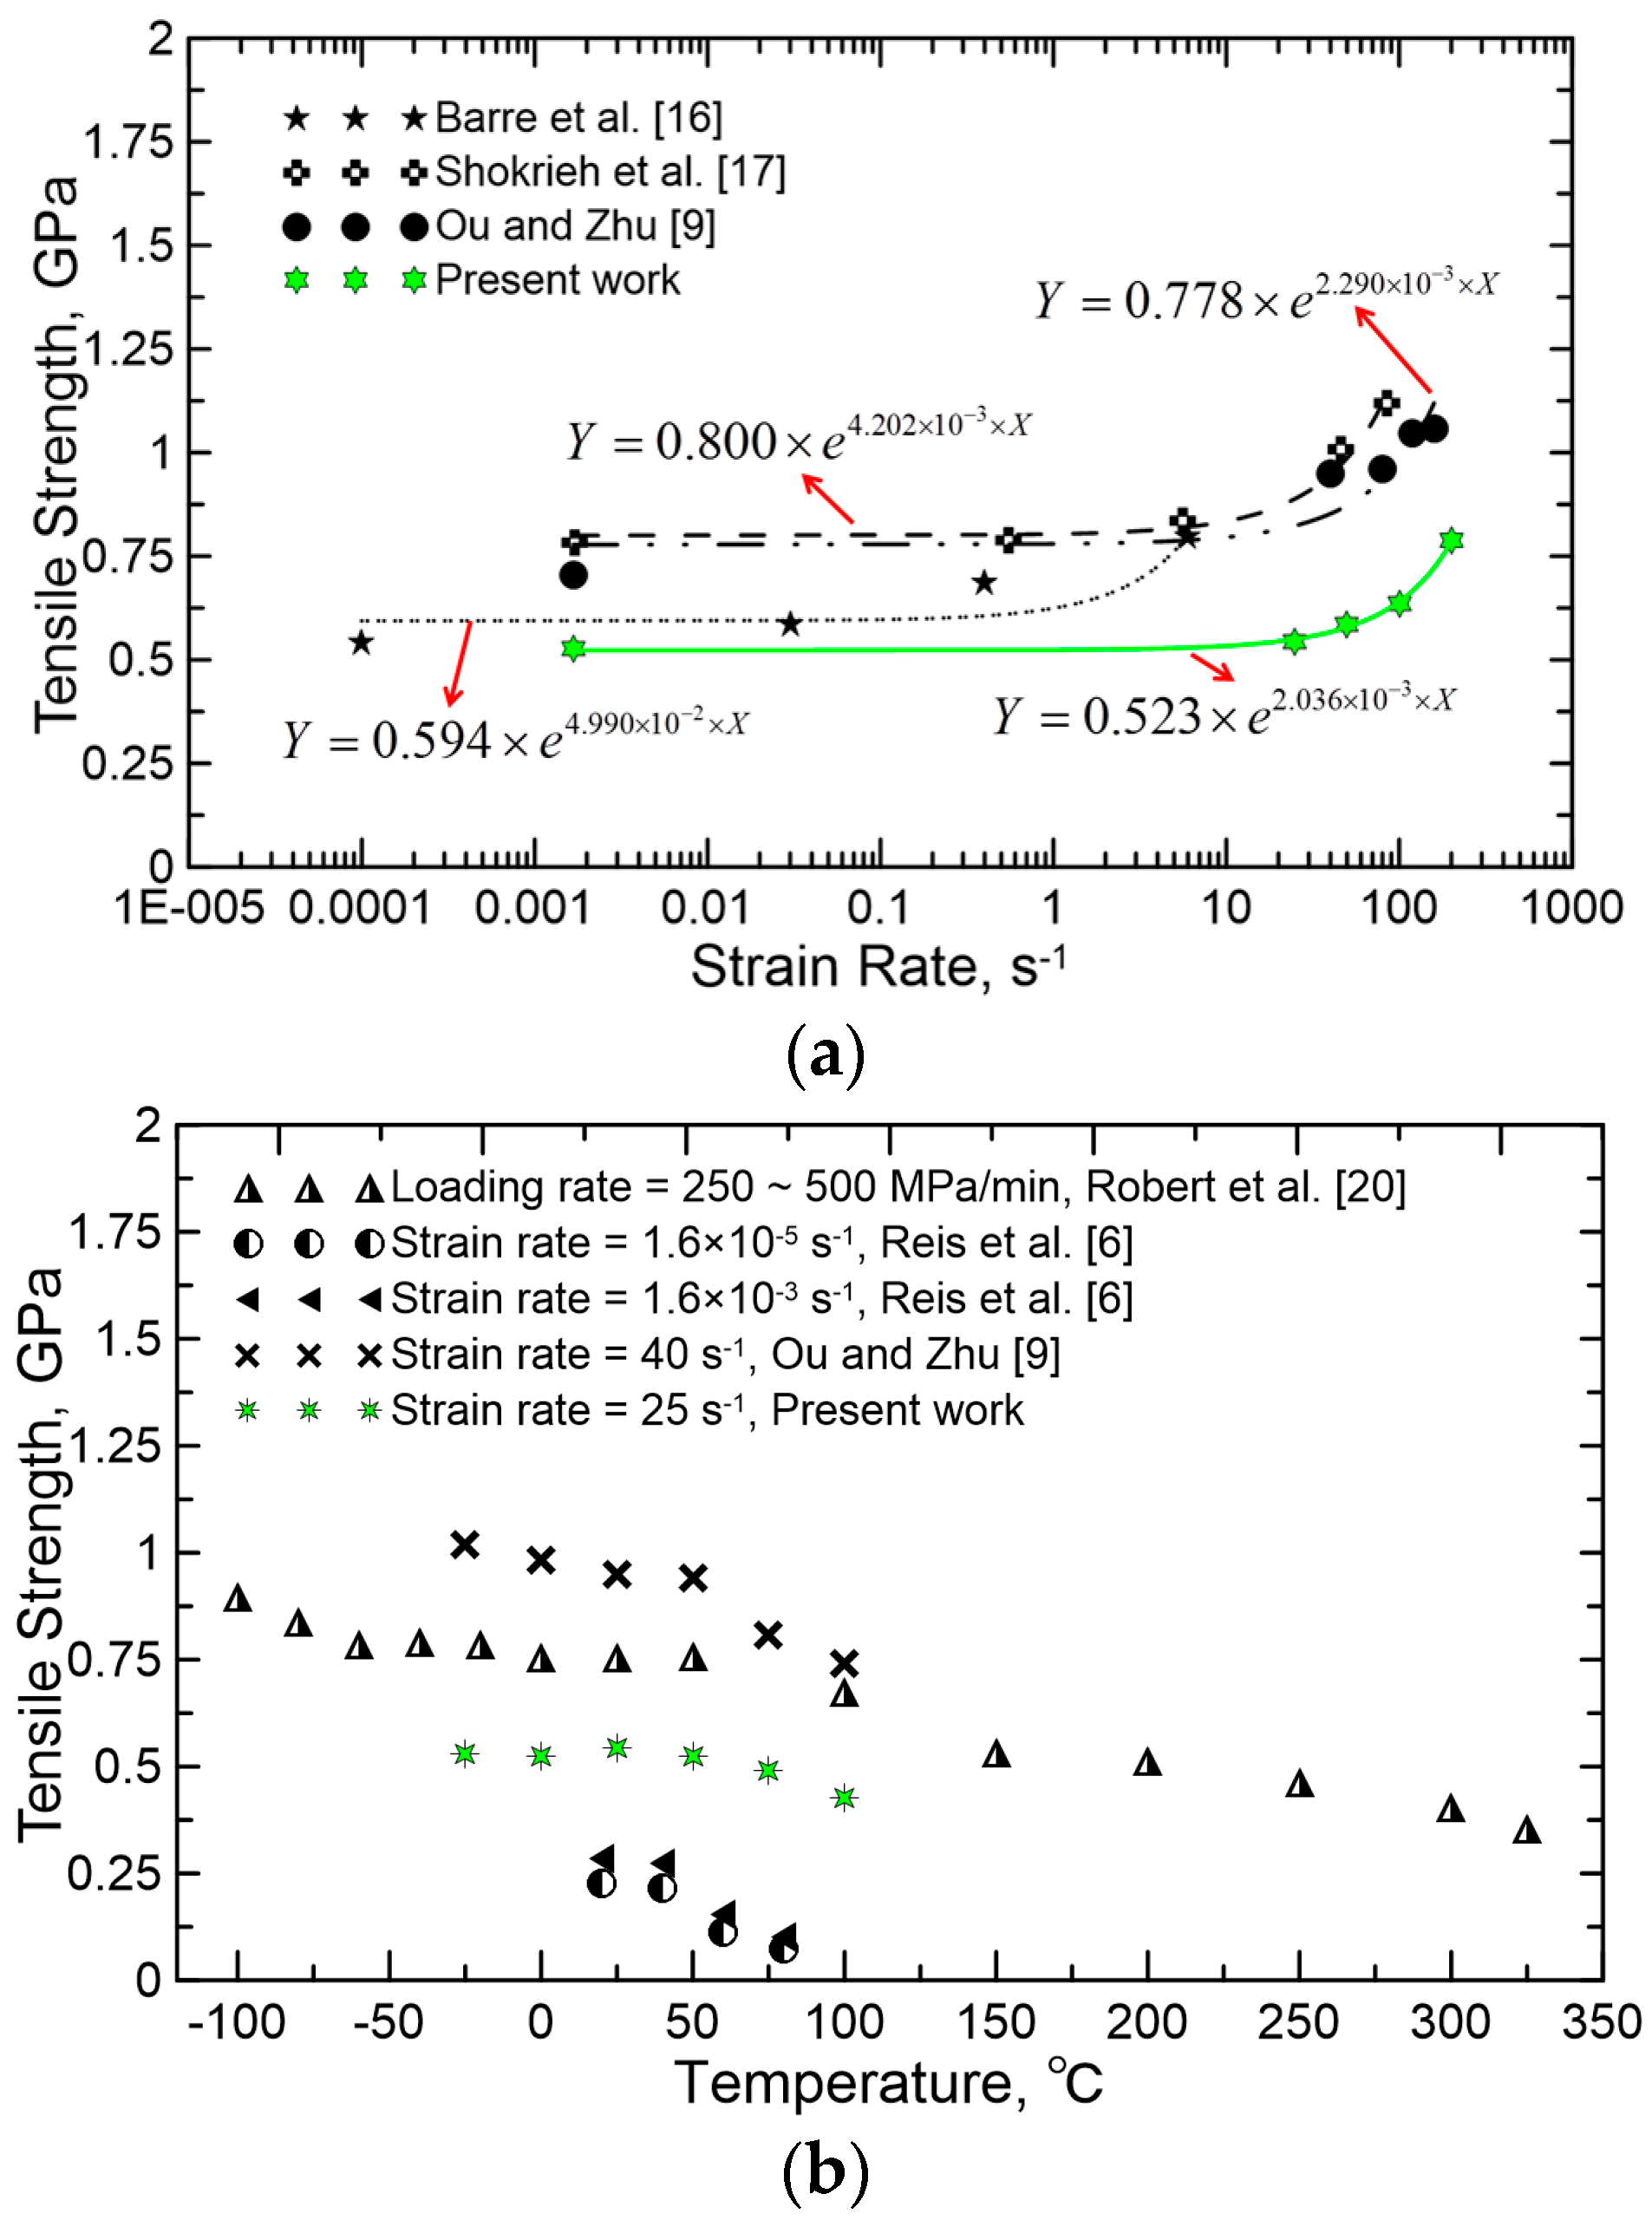
- There is an apparent dependence of the dynamics tensile properties of glass yarn and GFRP on the strain rate. For the glass yarn, tensile strength and toughness increase as much as 88.0% and 474.3% during a transition from quasi-static loading (1/600 s−1) to dynamic loading (40 s−1), but toughness decreases about 10.2% when the strain rate changes from 120 to 160 s−1 due to the diminution of strain. For GFRP, the tensile strength linearly increases nearly 49.1% over the strain rate range of 1/600–200 s−1, and toughness increases remarkably (about 109.7%) during a transition from quasi-static loading (1/600 s−1) to dynamic loading (25 s−1).
- (2)
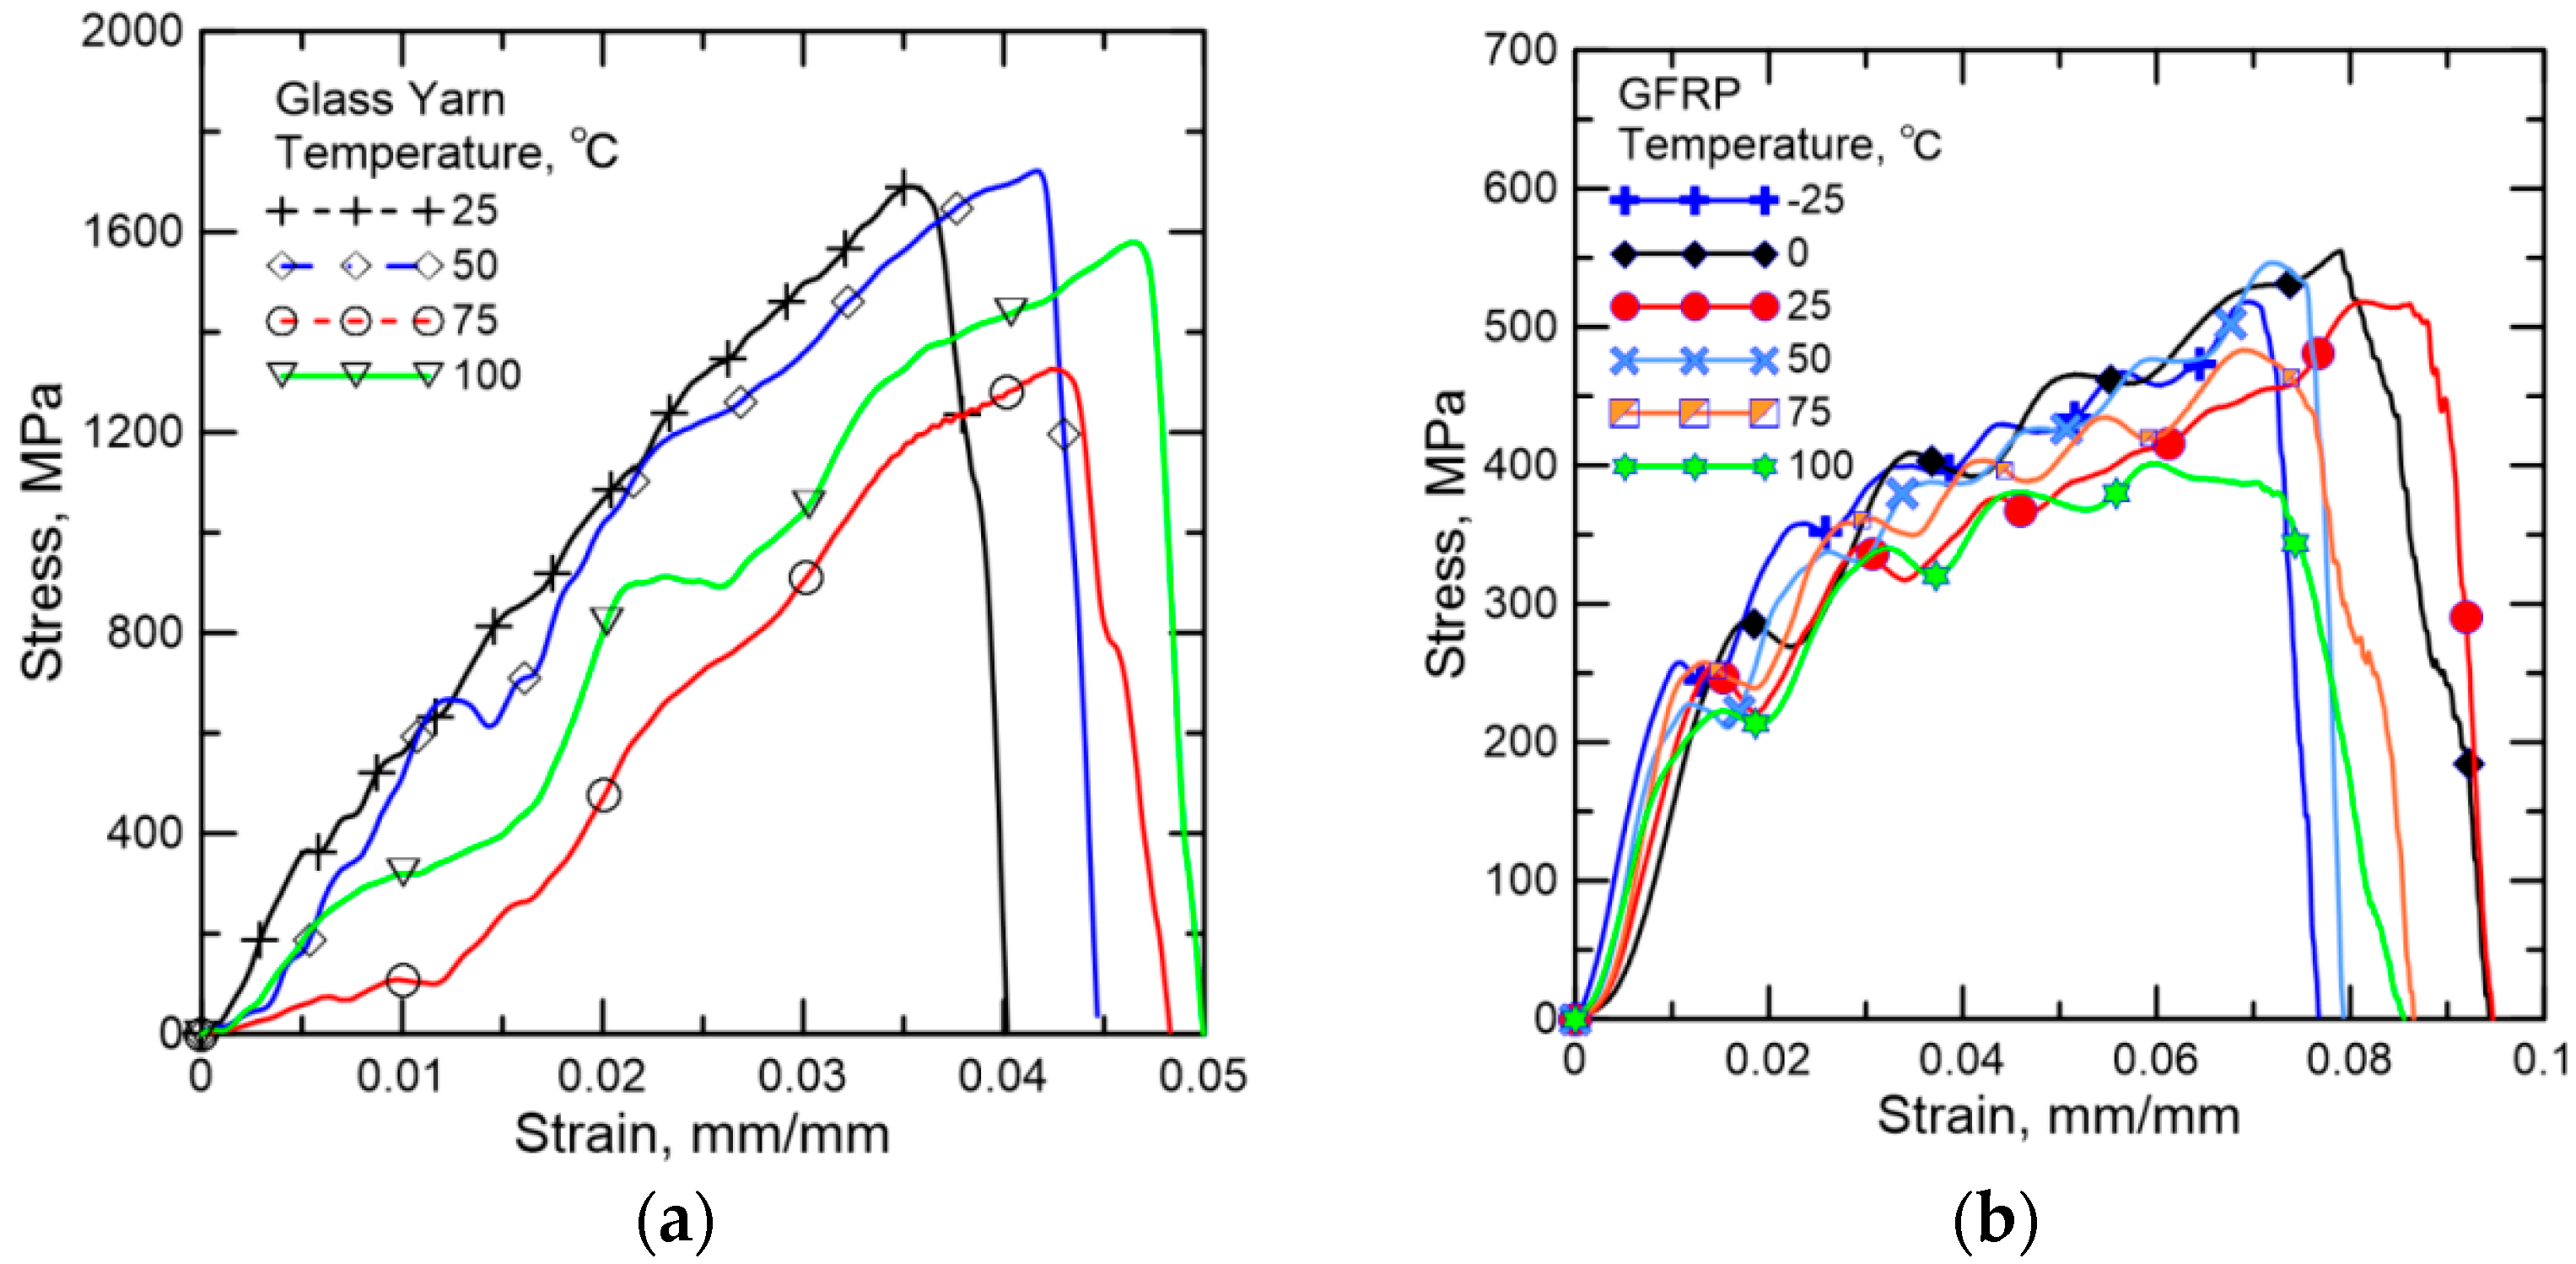
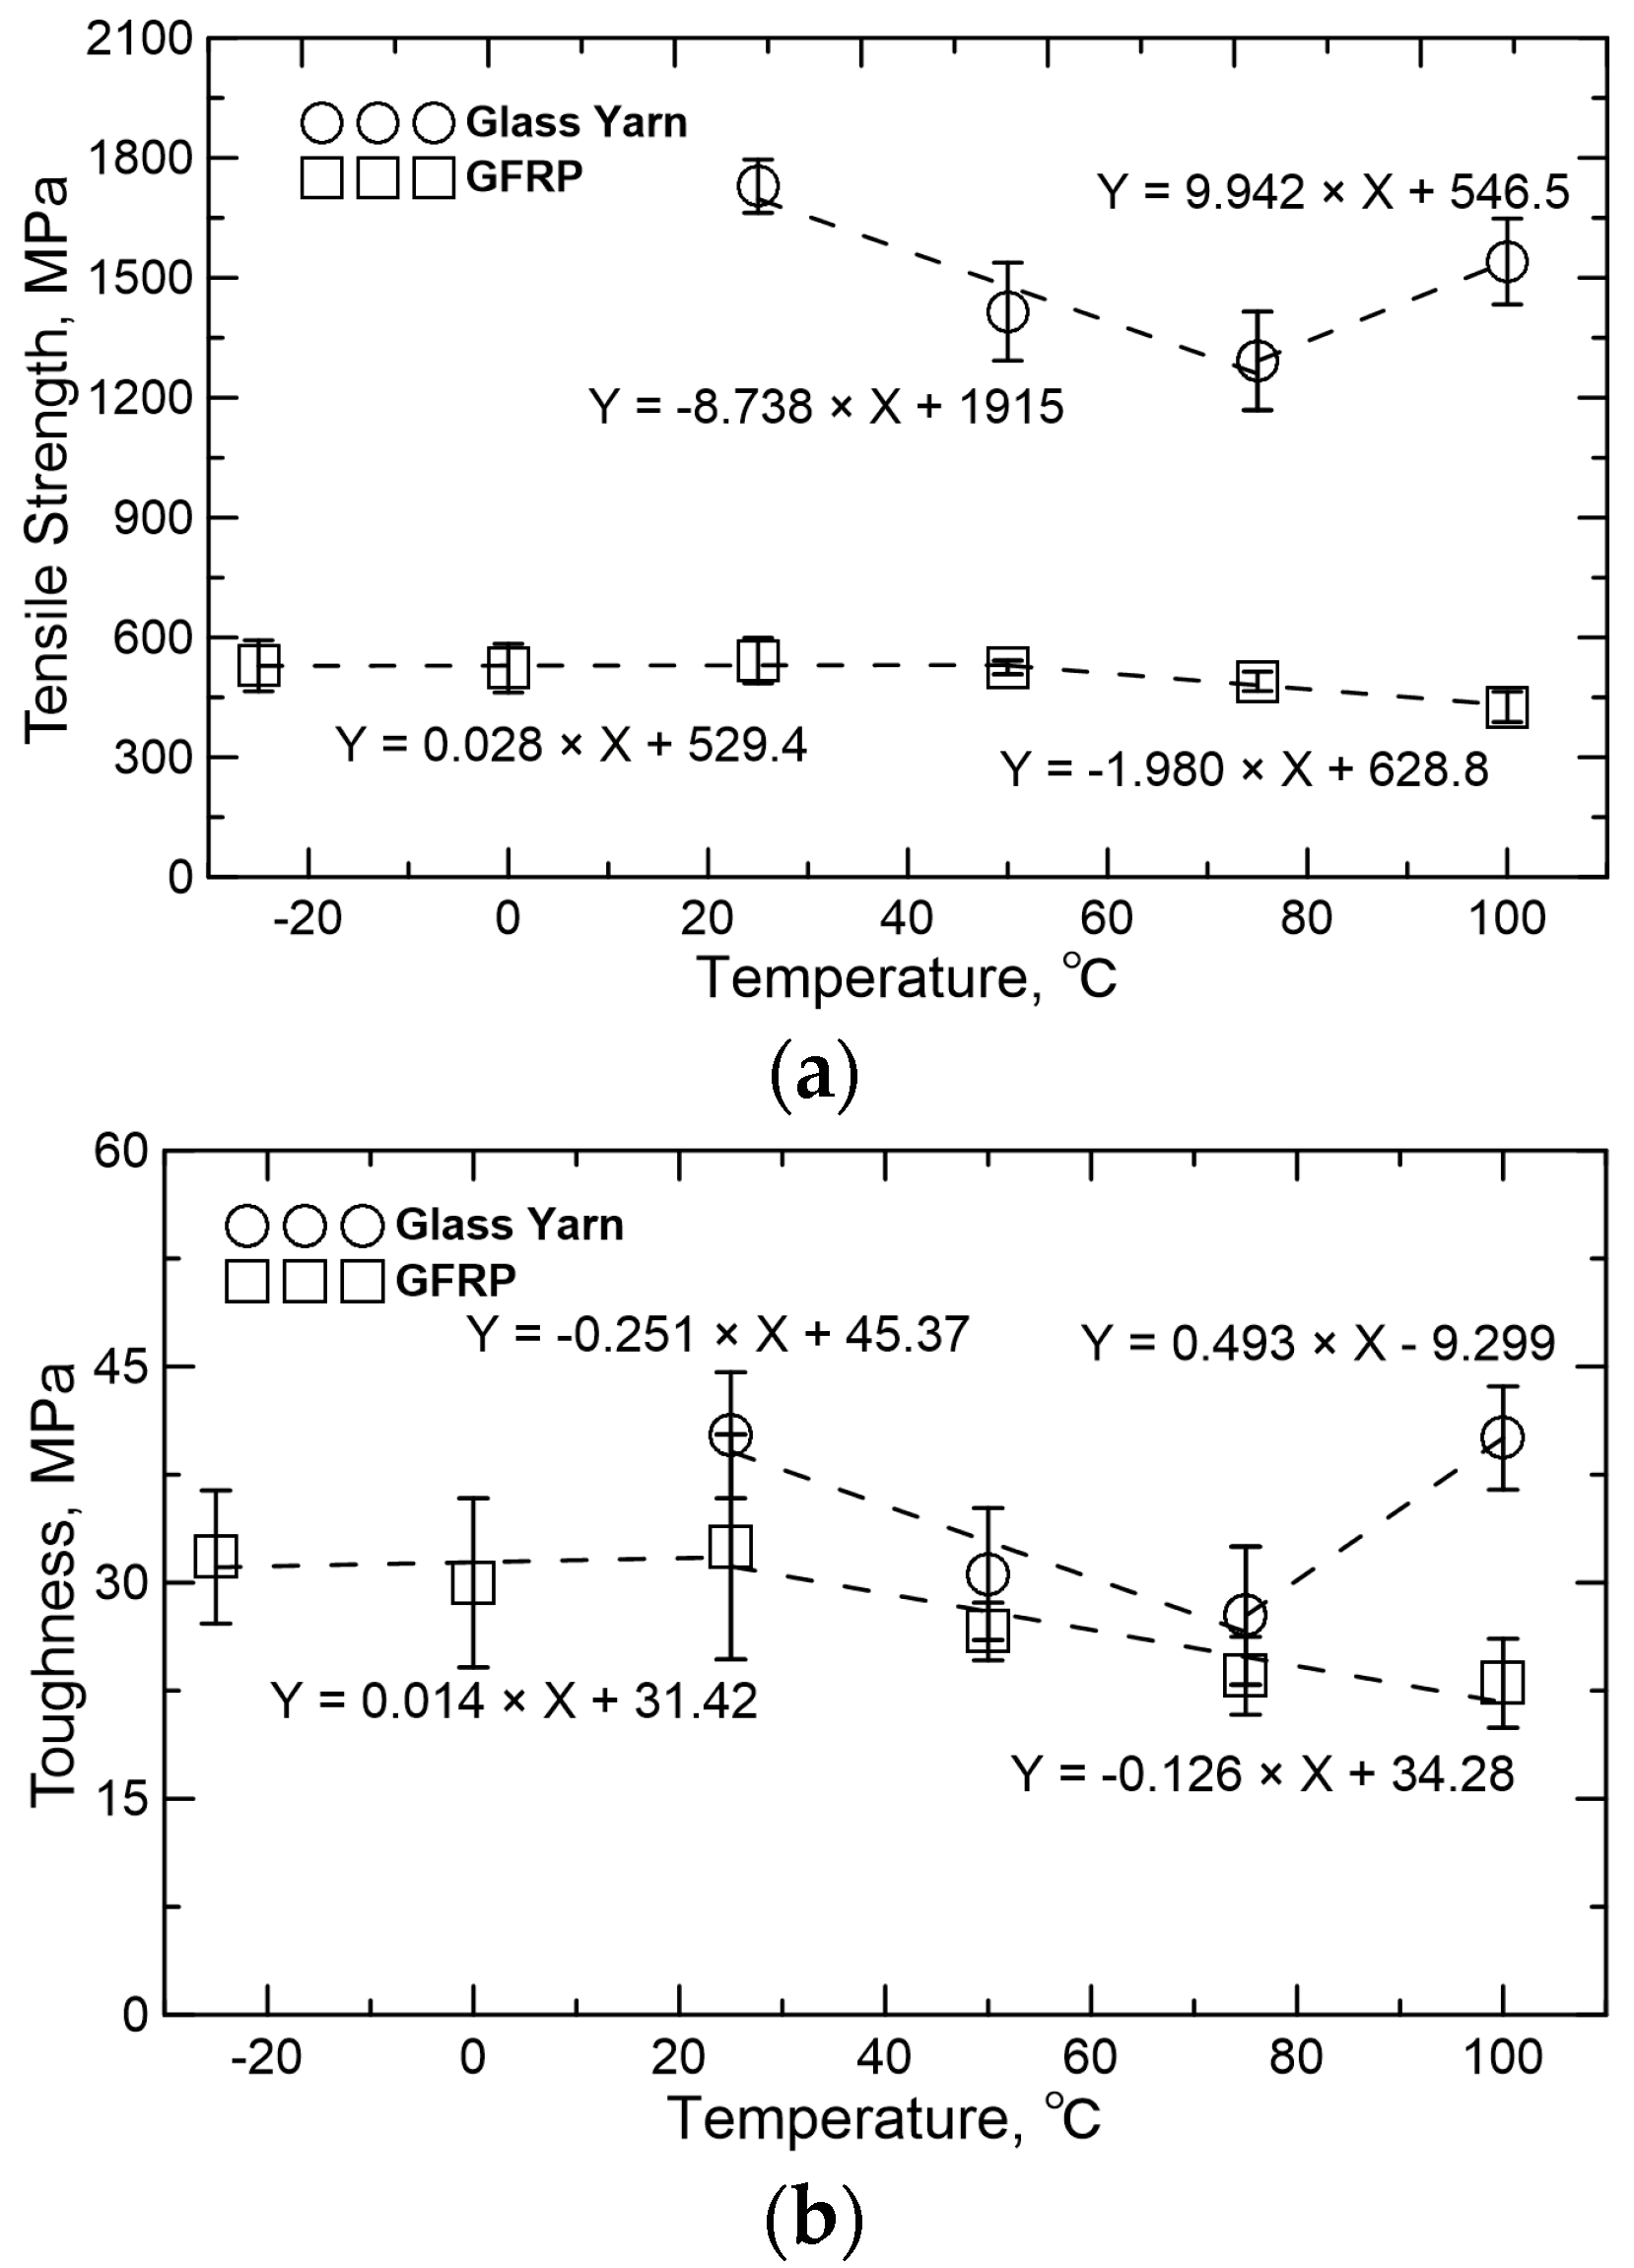
- The mechanical properties of glass yarn and GFRP are also dependent on the temperature. For glass yarn, tensile strength and toughness decrease nearly 25.3% and 31.1% when temperature increases from 25 to 75 °C. However, when heated to 100 °C, tensile strength and toughness of glass yarn rebound due to the augment of frictional force between fibers. For GFRP, tensile strength shows almost no change (within 3%) when temperature increases from −25 to 50 ° C, but decreases sharply (about 18.9%) over the temperature range of 50–100 °C because of the softening of the resin matrix when Tg of epoxy resin is reached.
- (3)
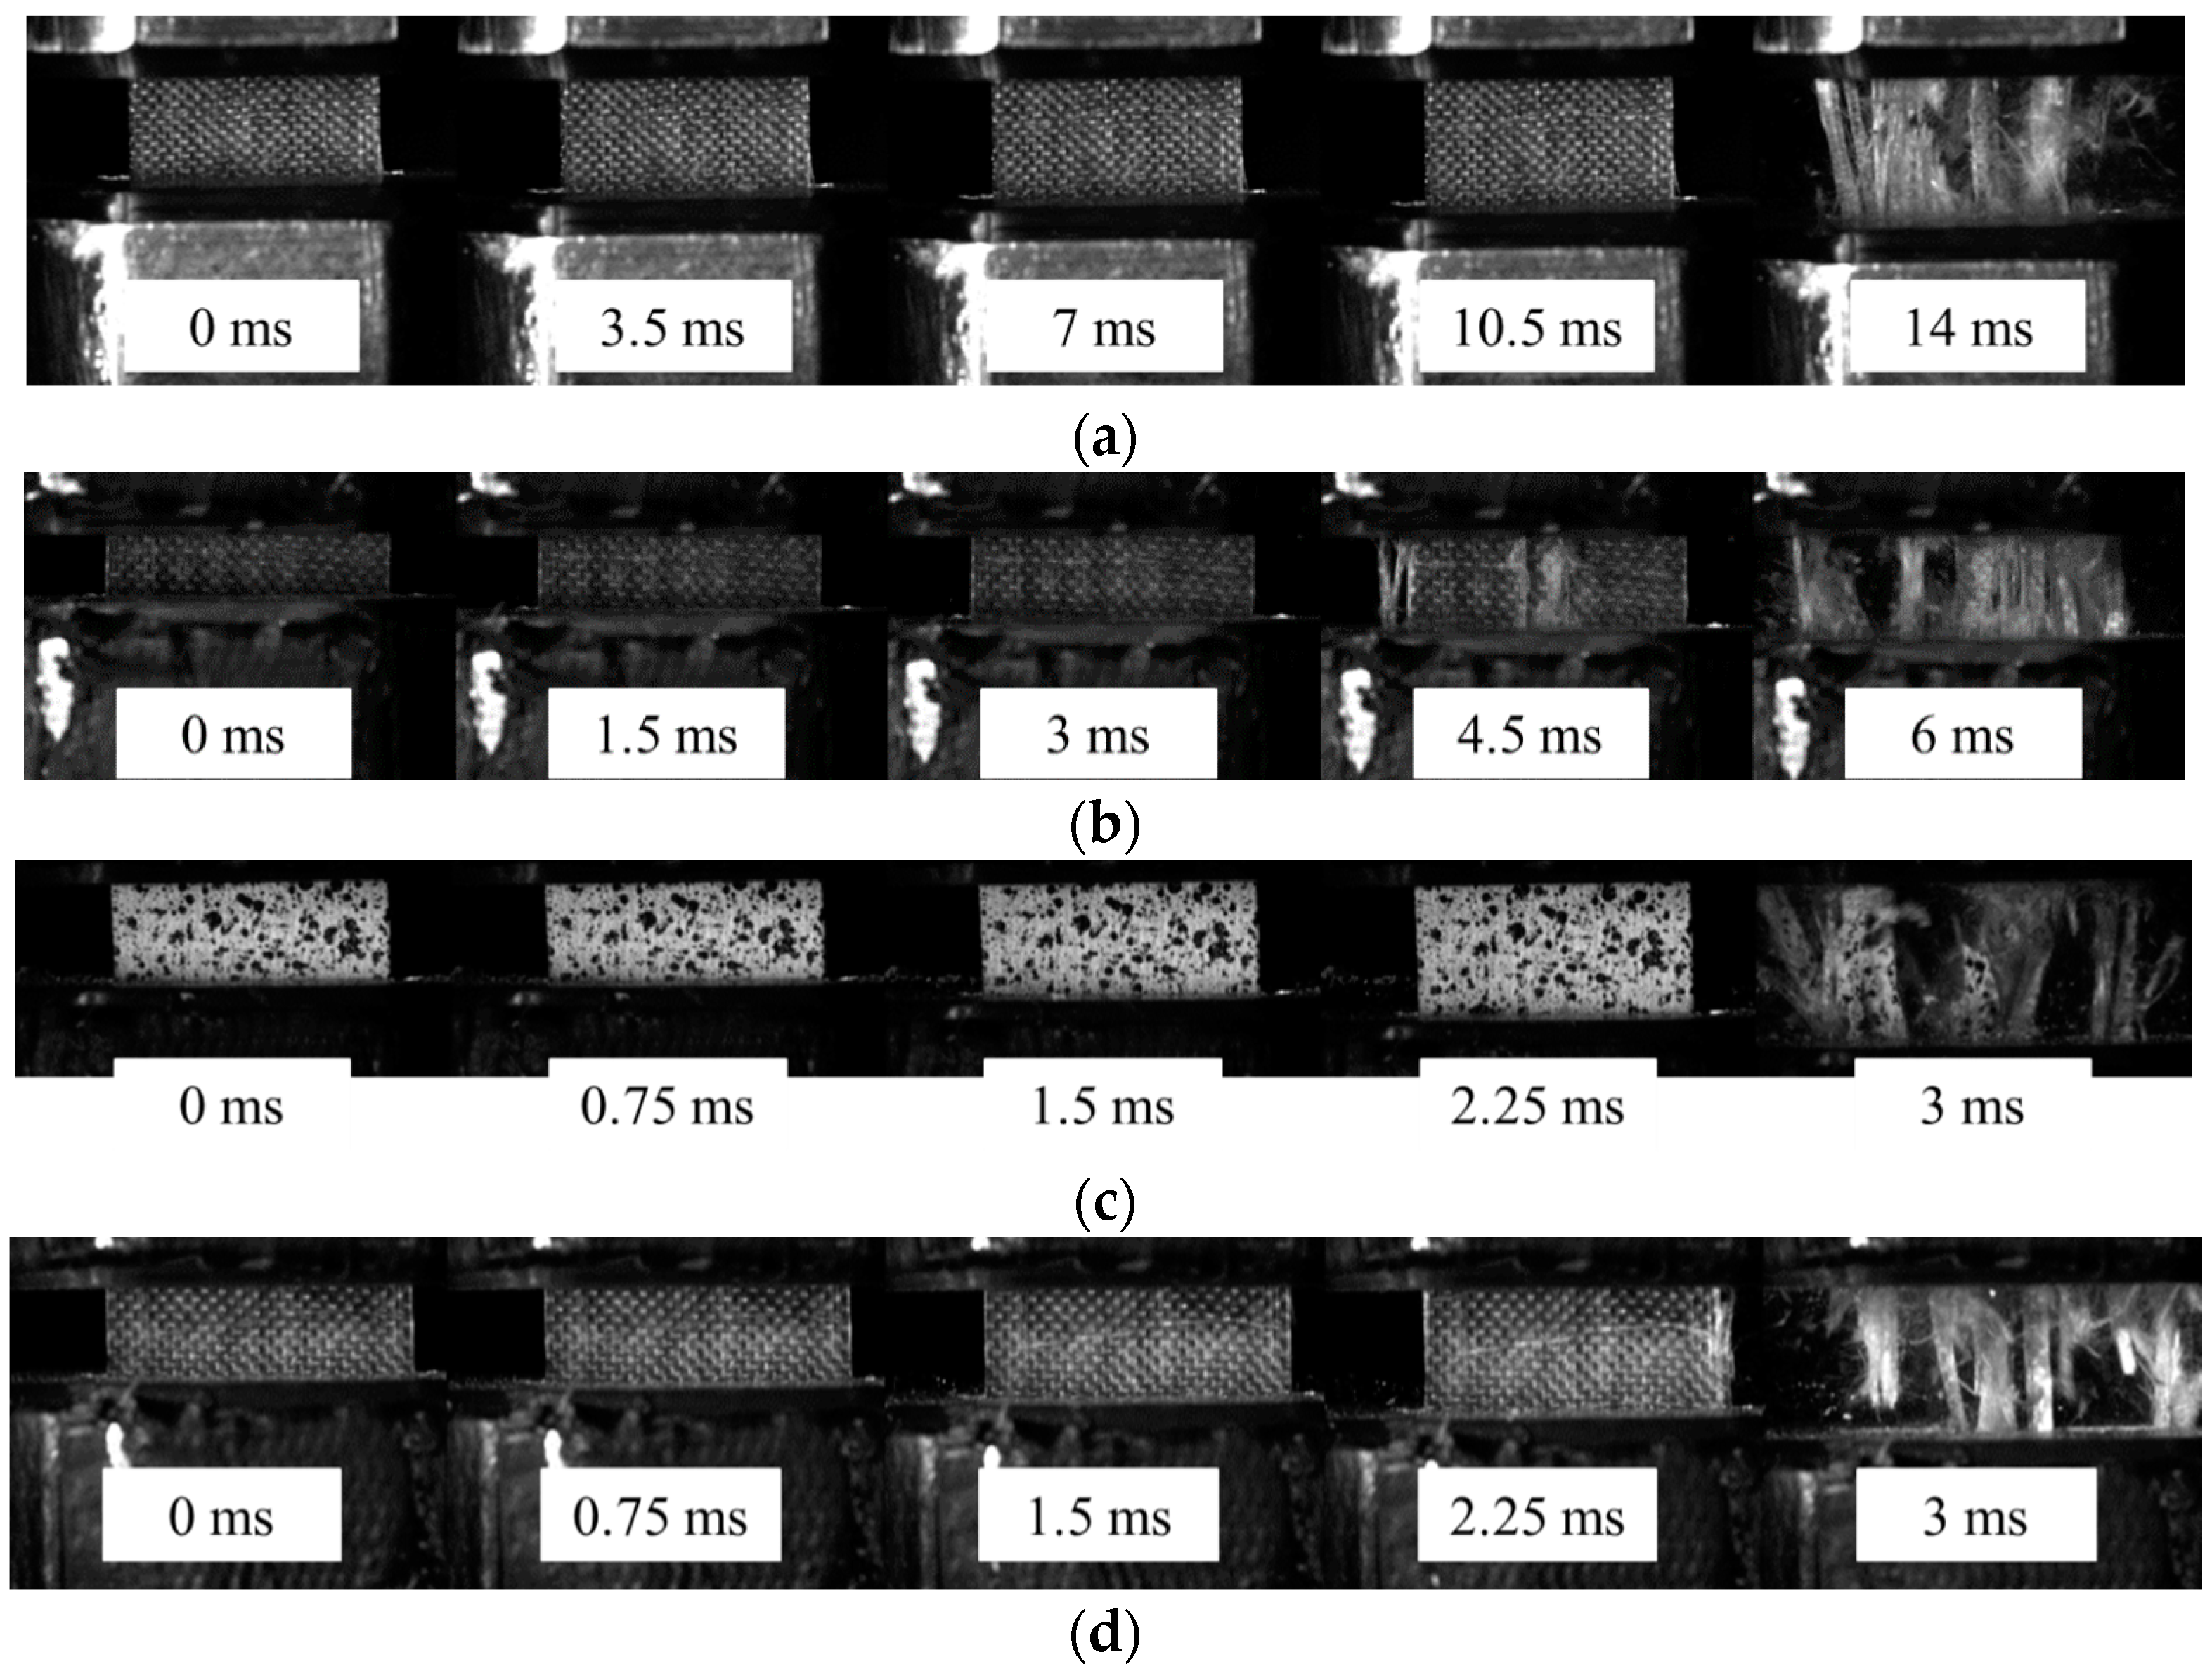
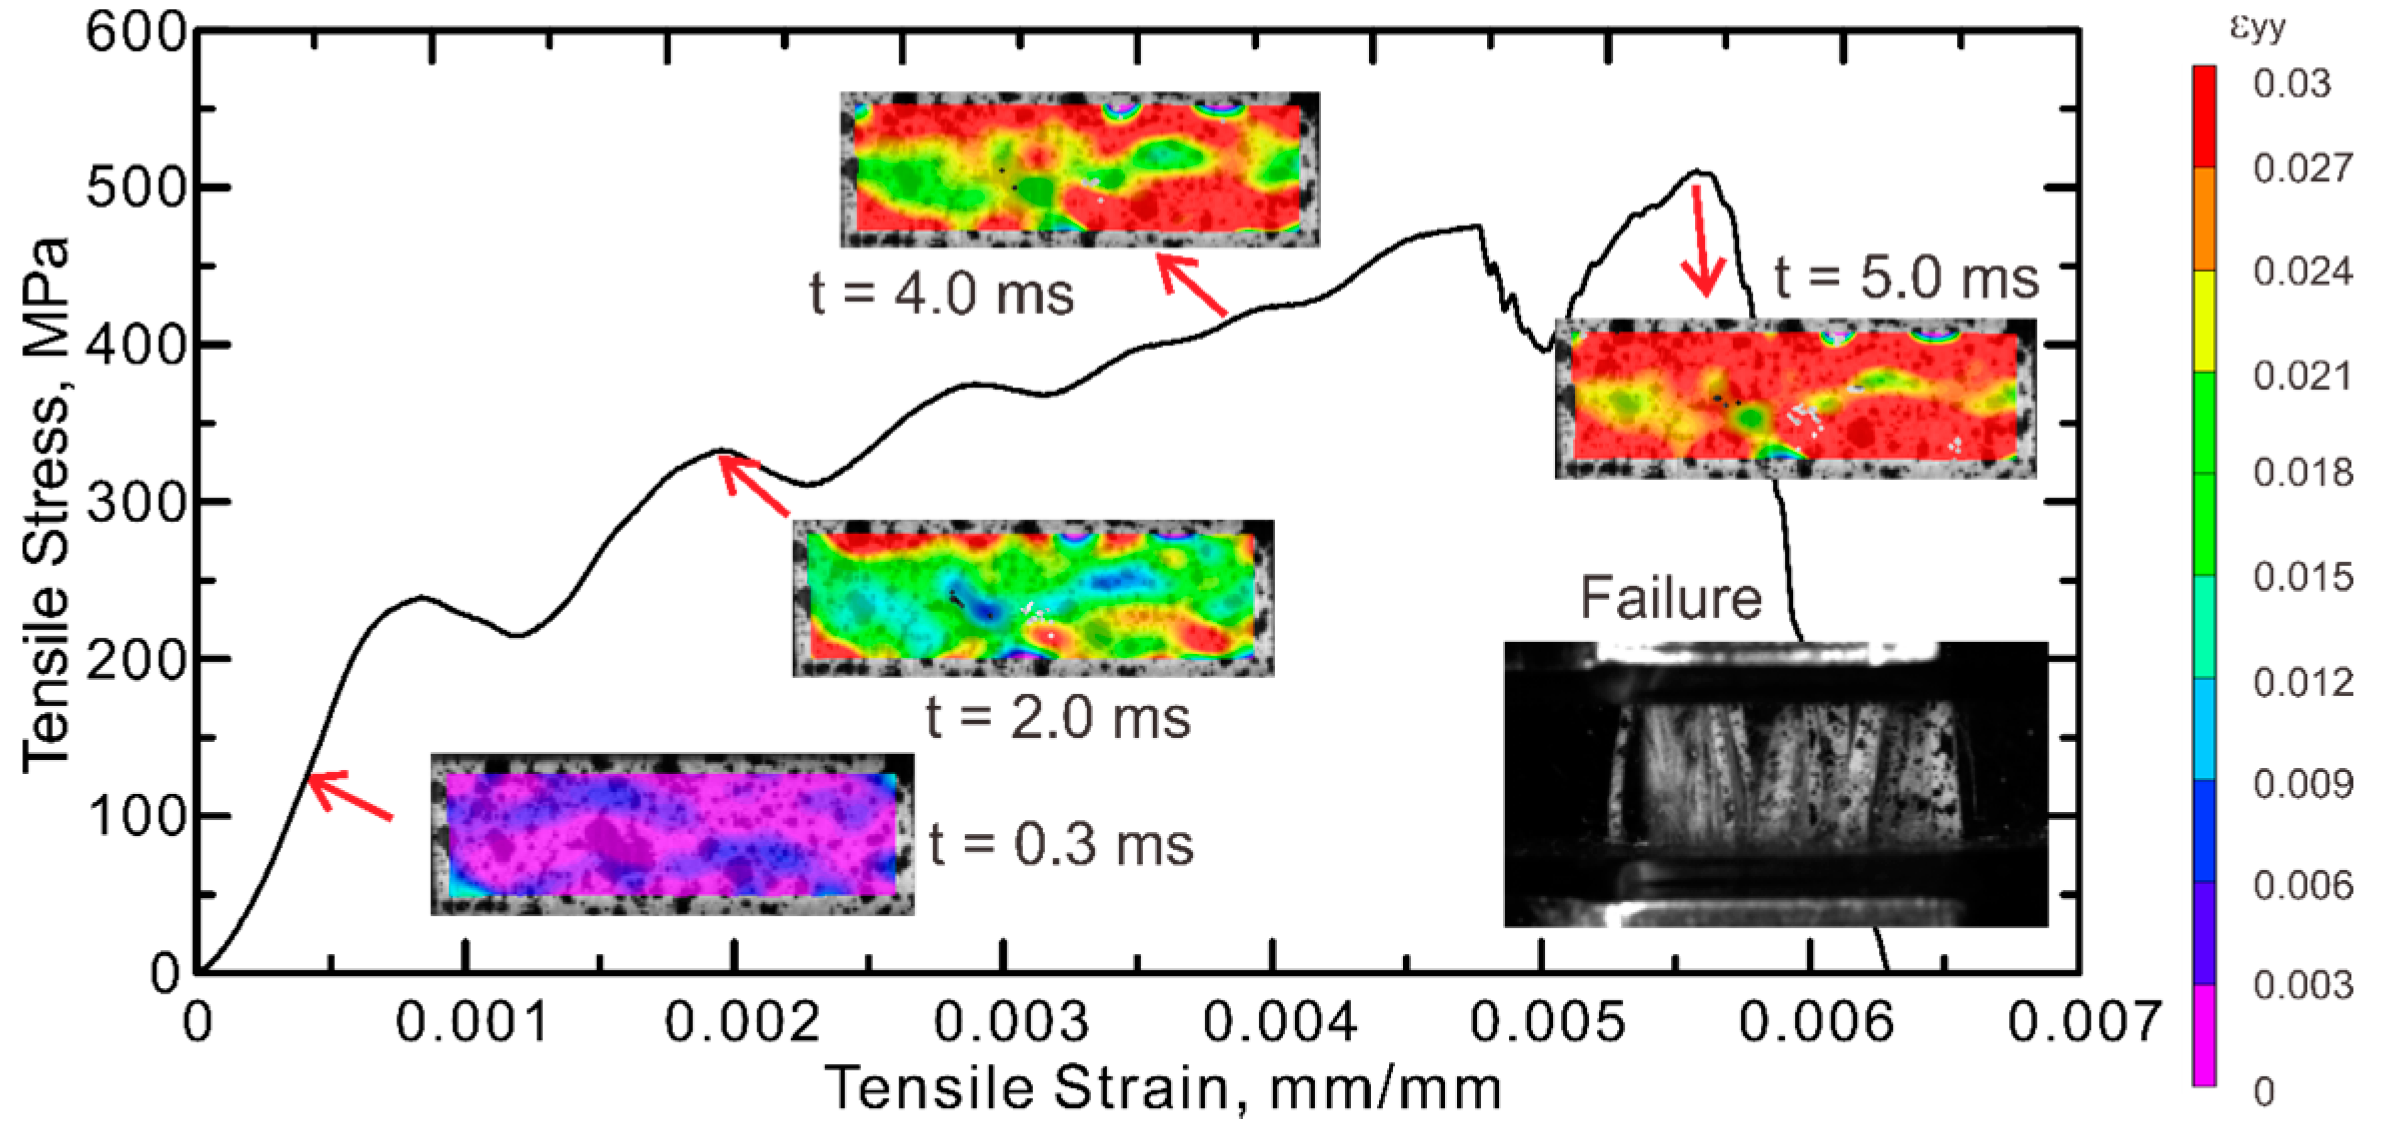
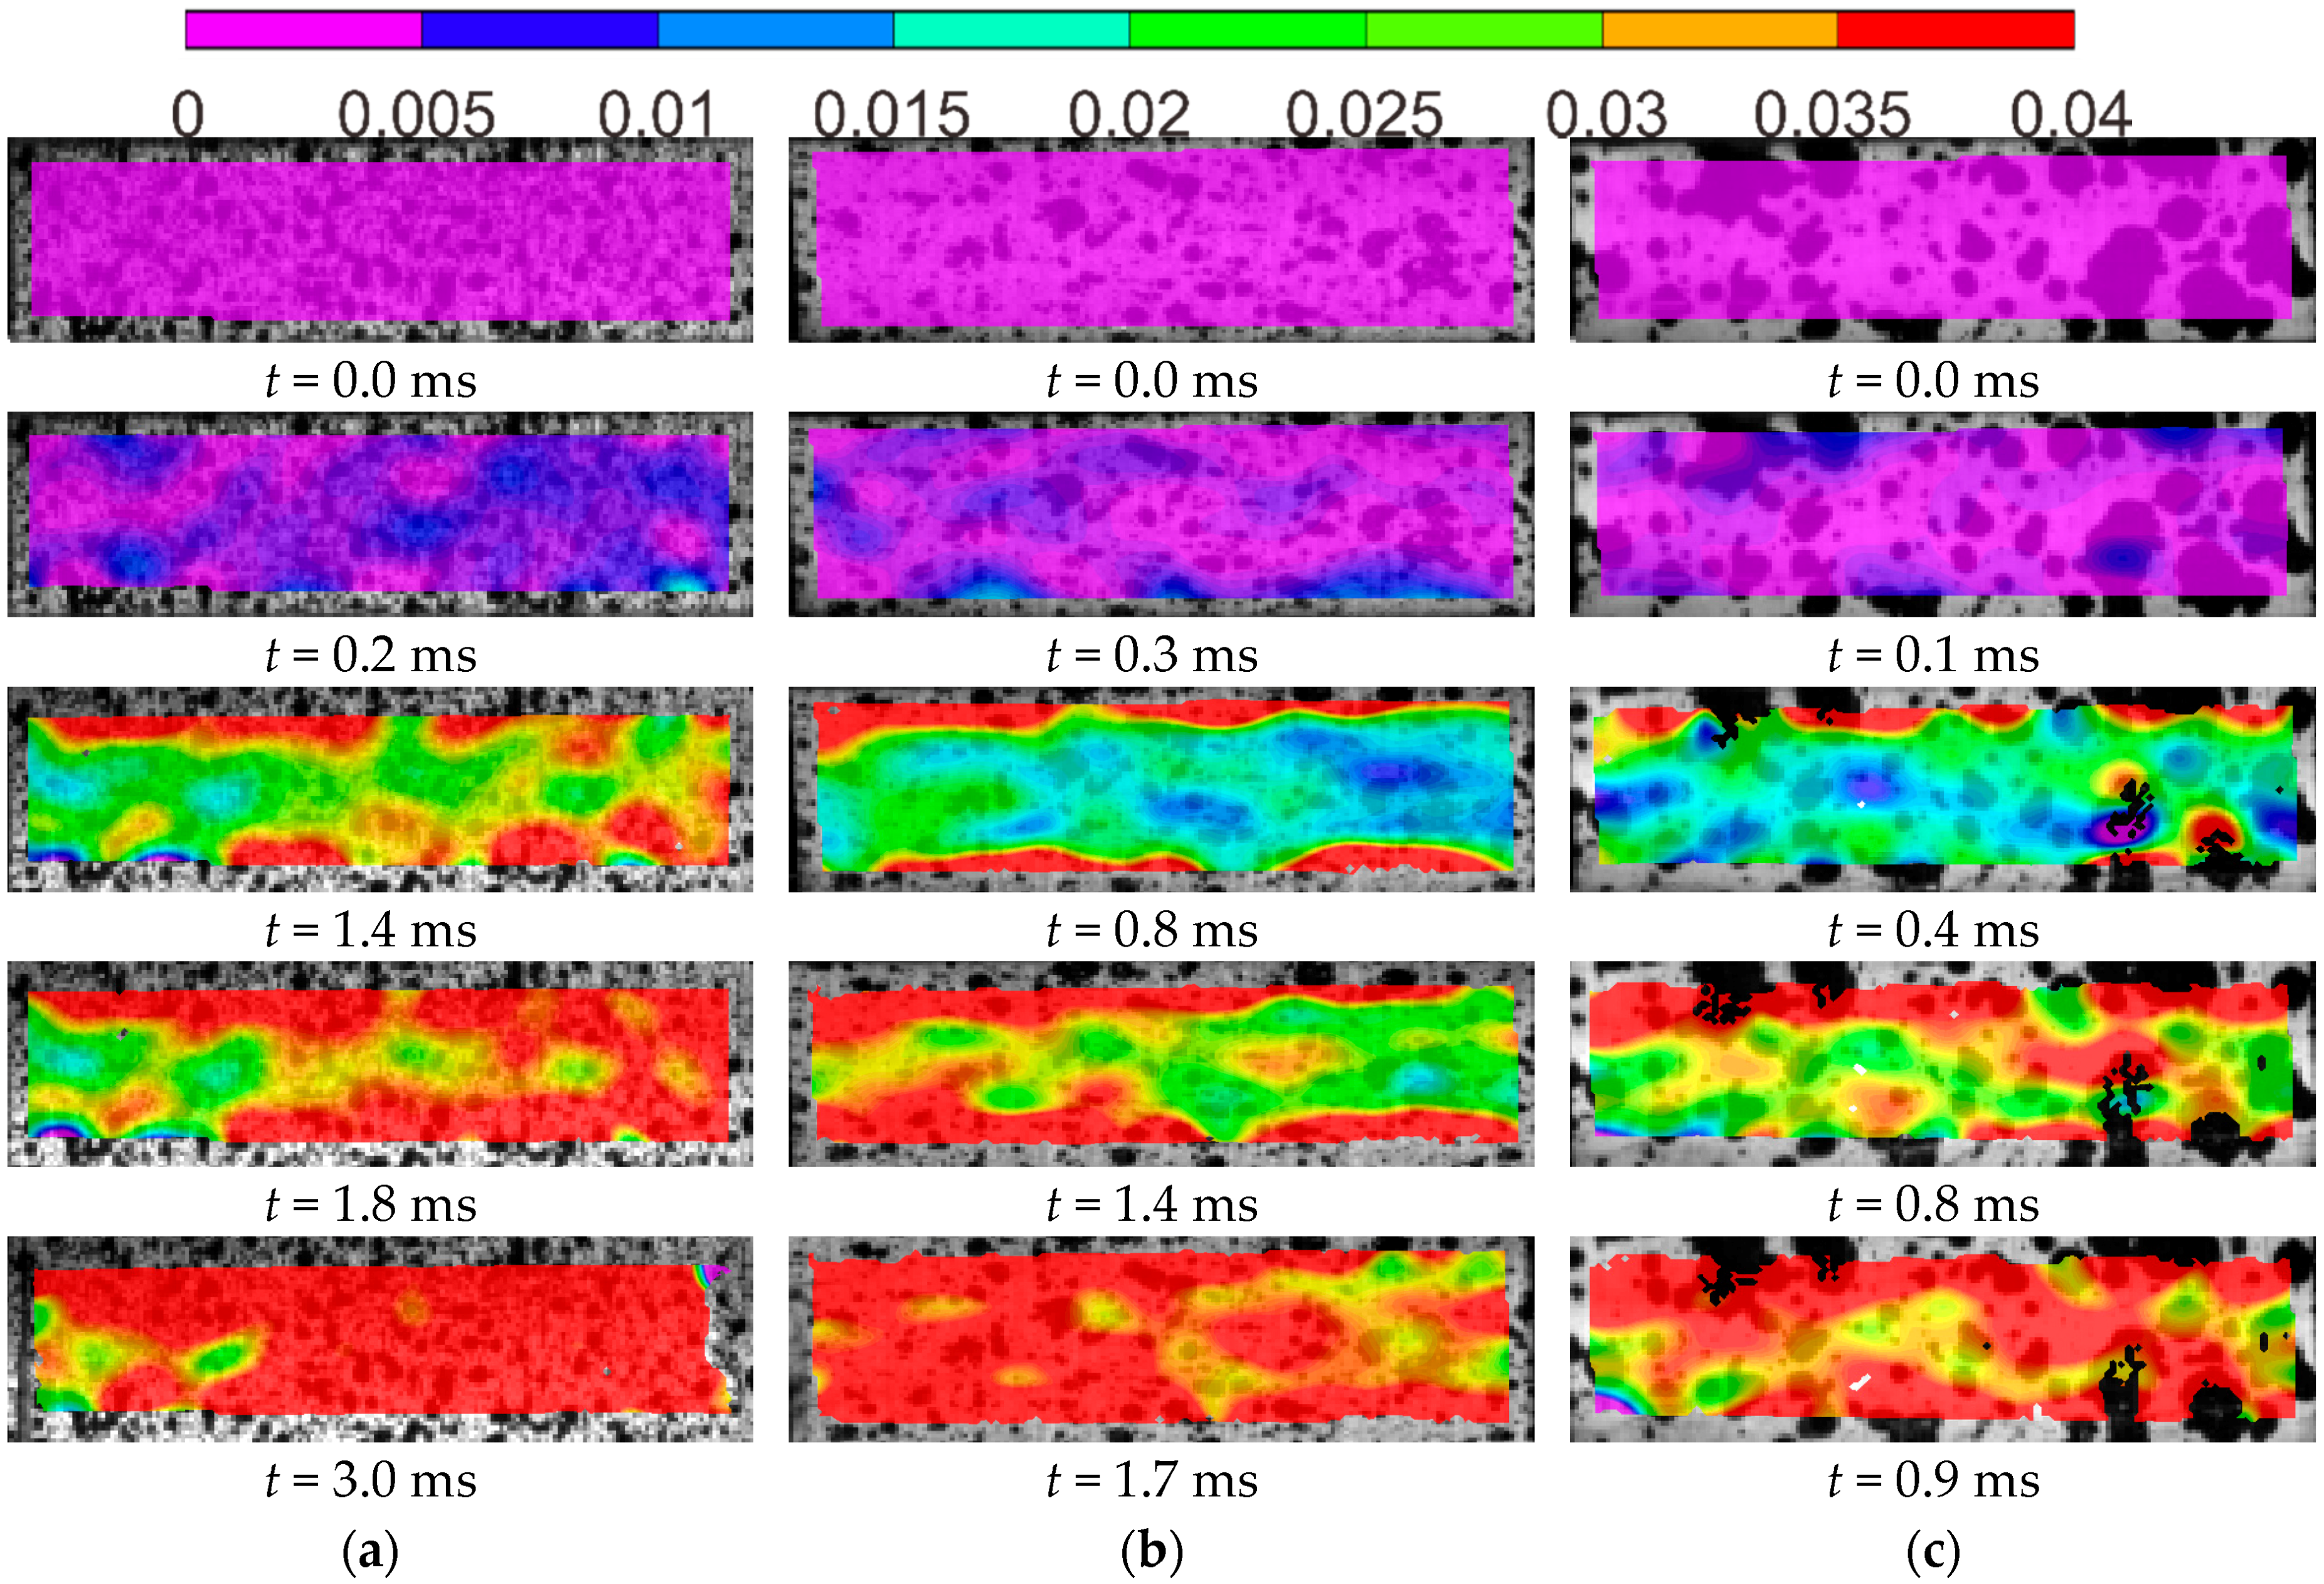
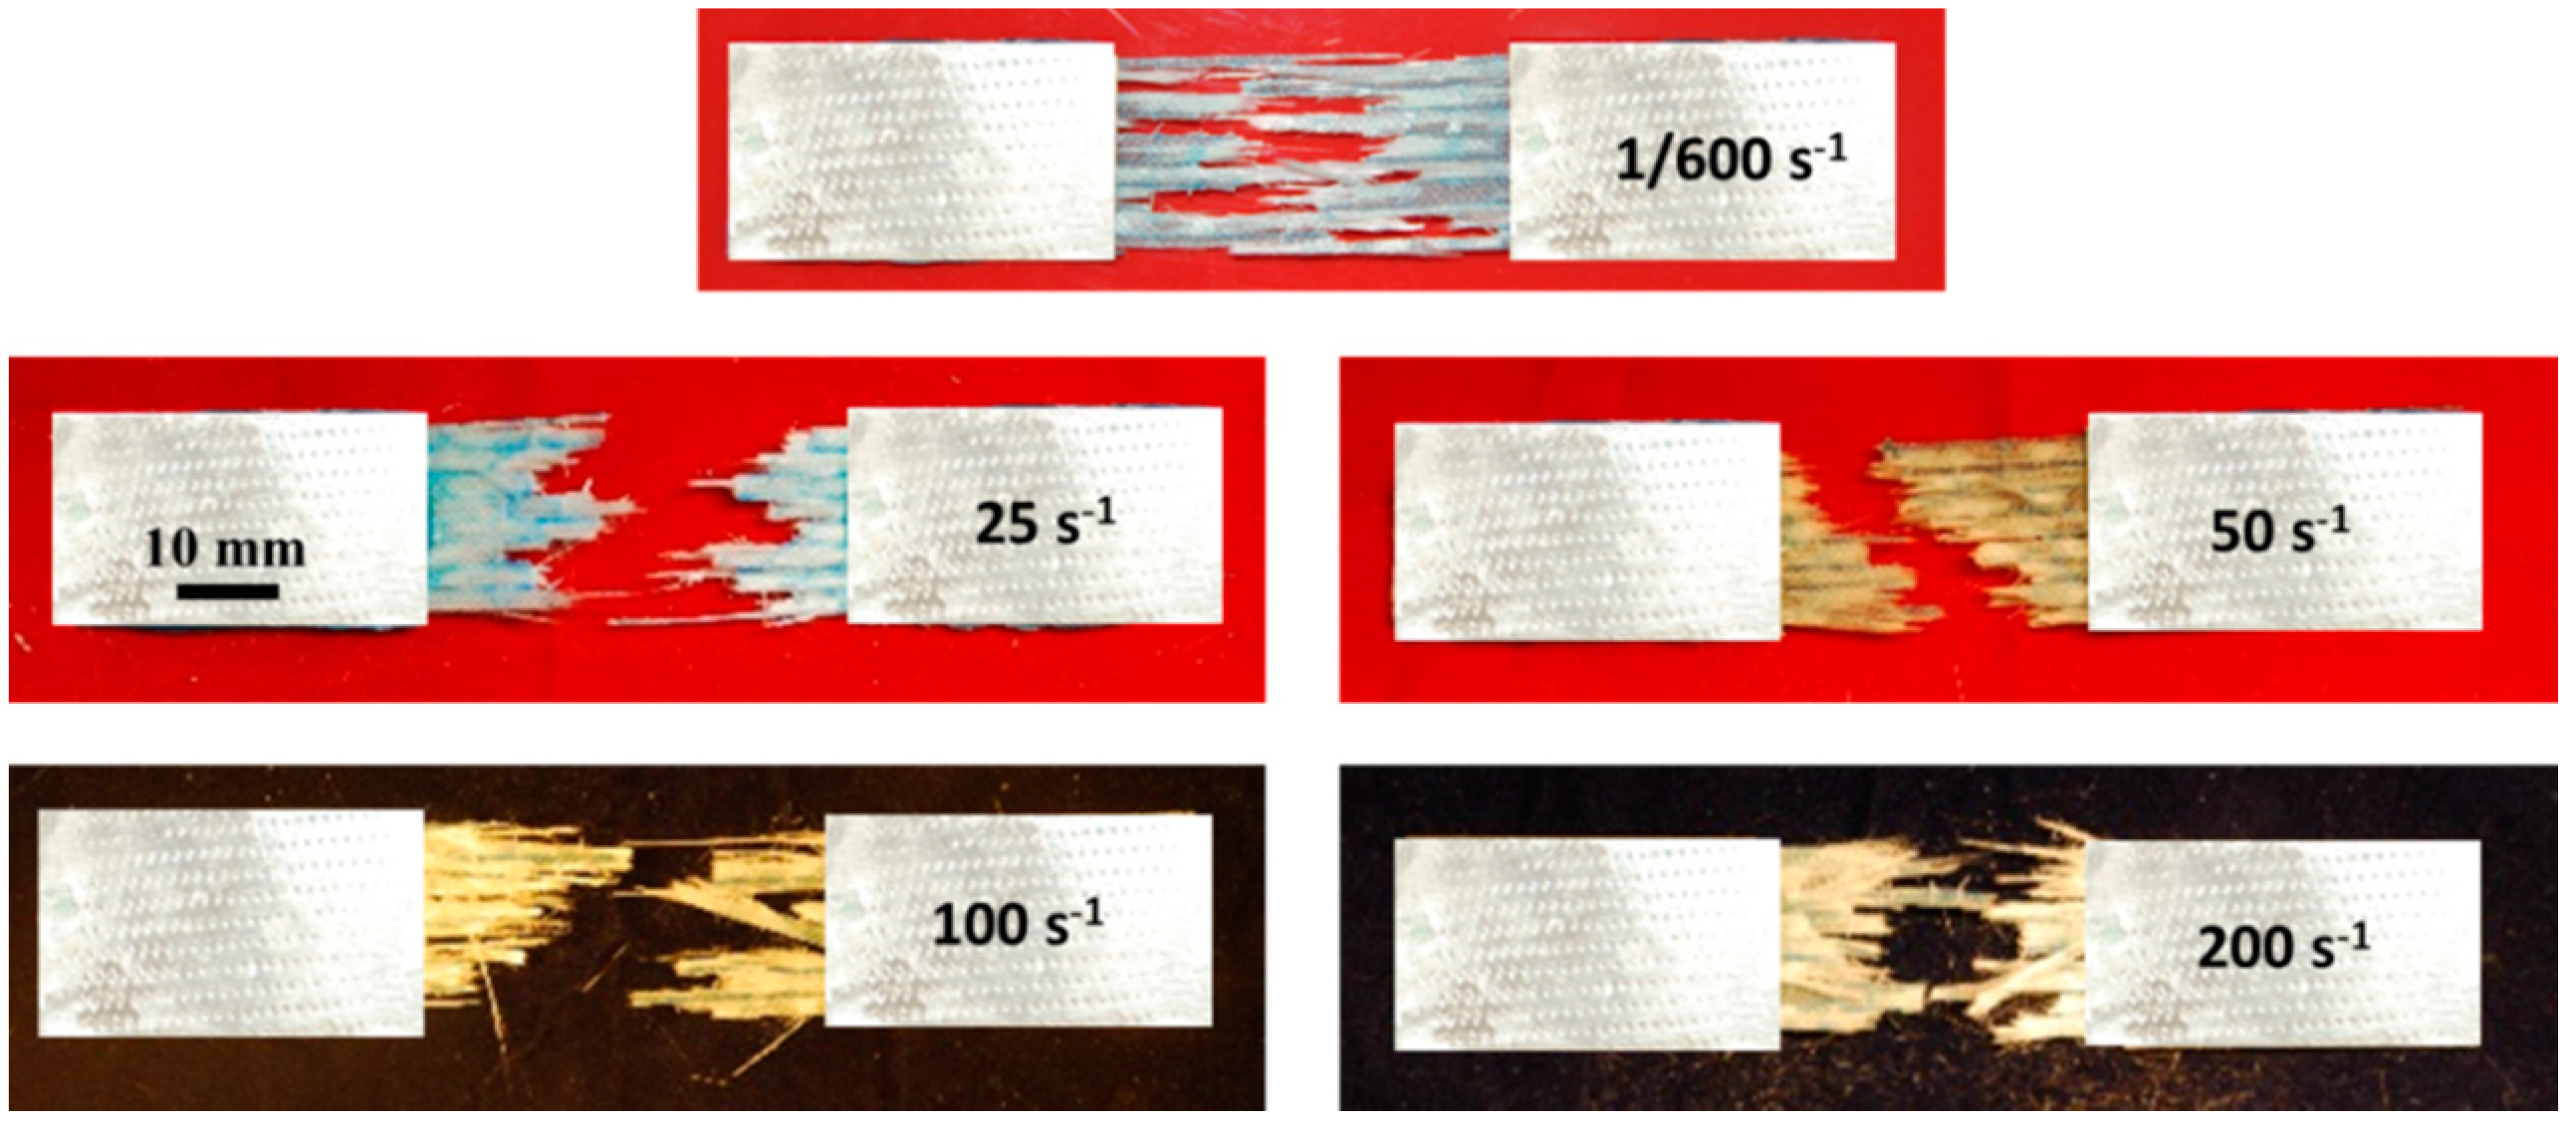
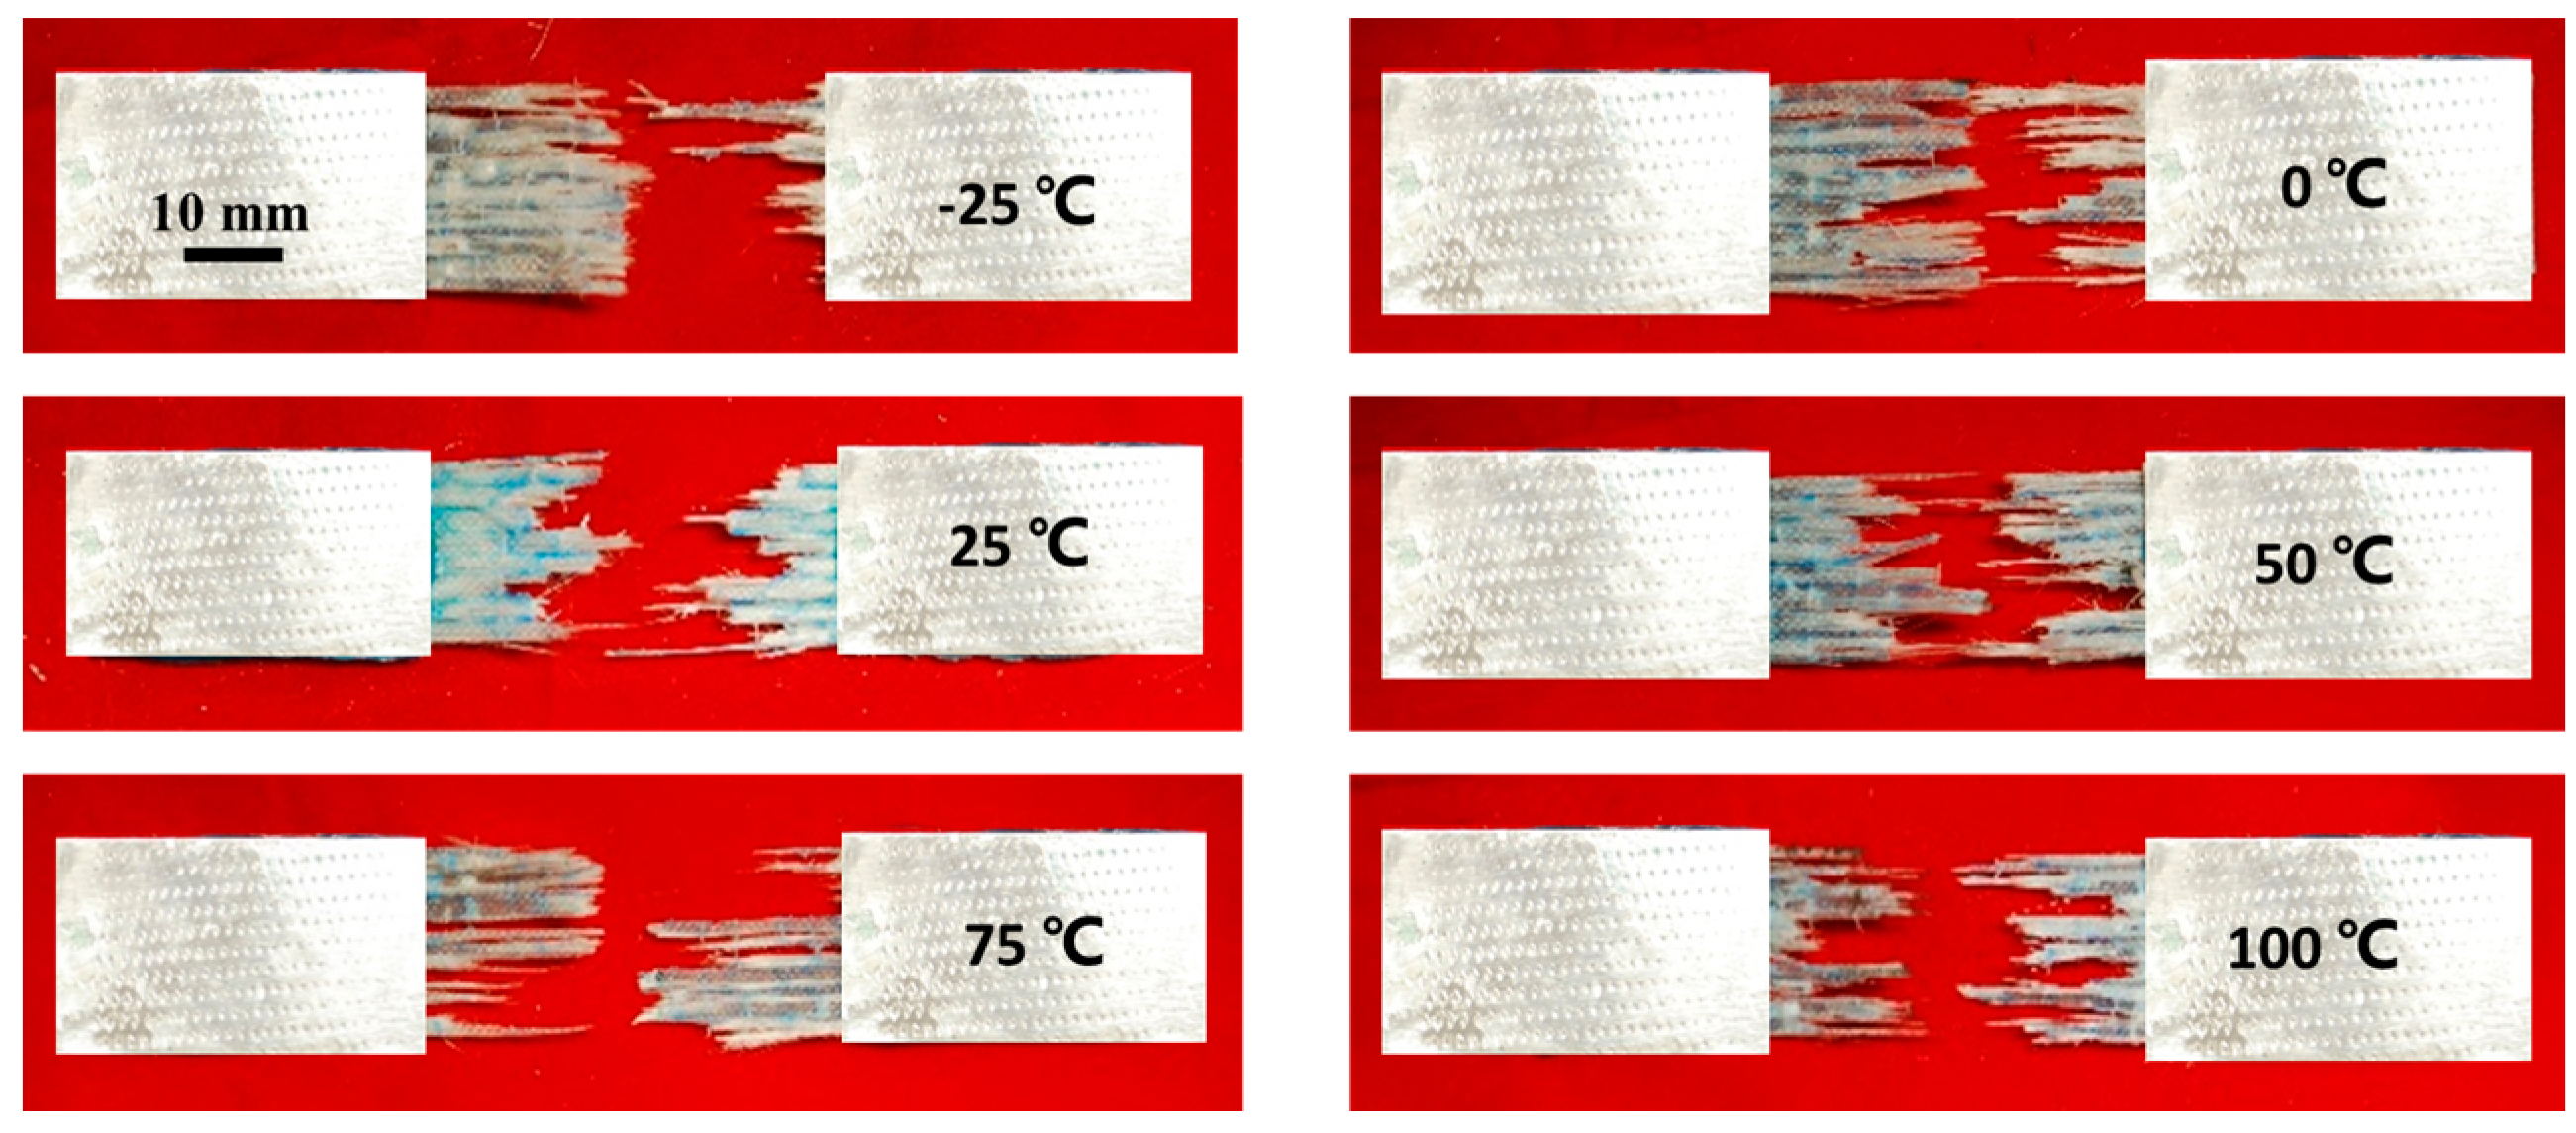
- The failure patterns of the GFRP specimens are closely related to the loading conditions. At low strain rates, the fracture surface is limited in a small region, while, with increasing strain rate, the damage path covers the entire gauge section where extensive debonding between fibers and matrix was also observed, which leads to an increase in tensile strength and energy absorption. In addition, the components of GFRP specimen are more separated after failure at higher temperatures.
- (4)
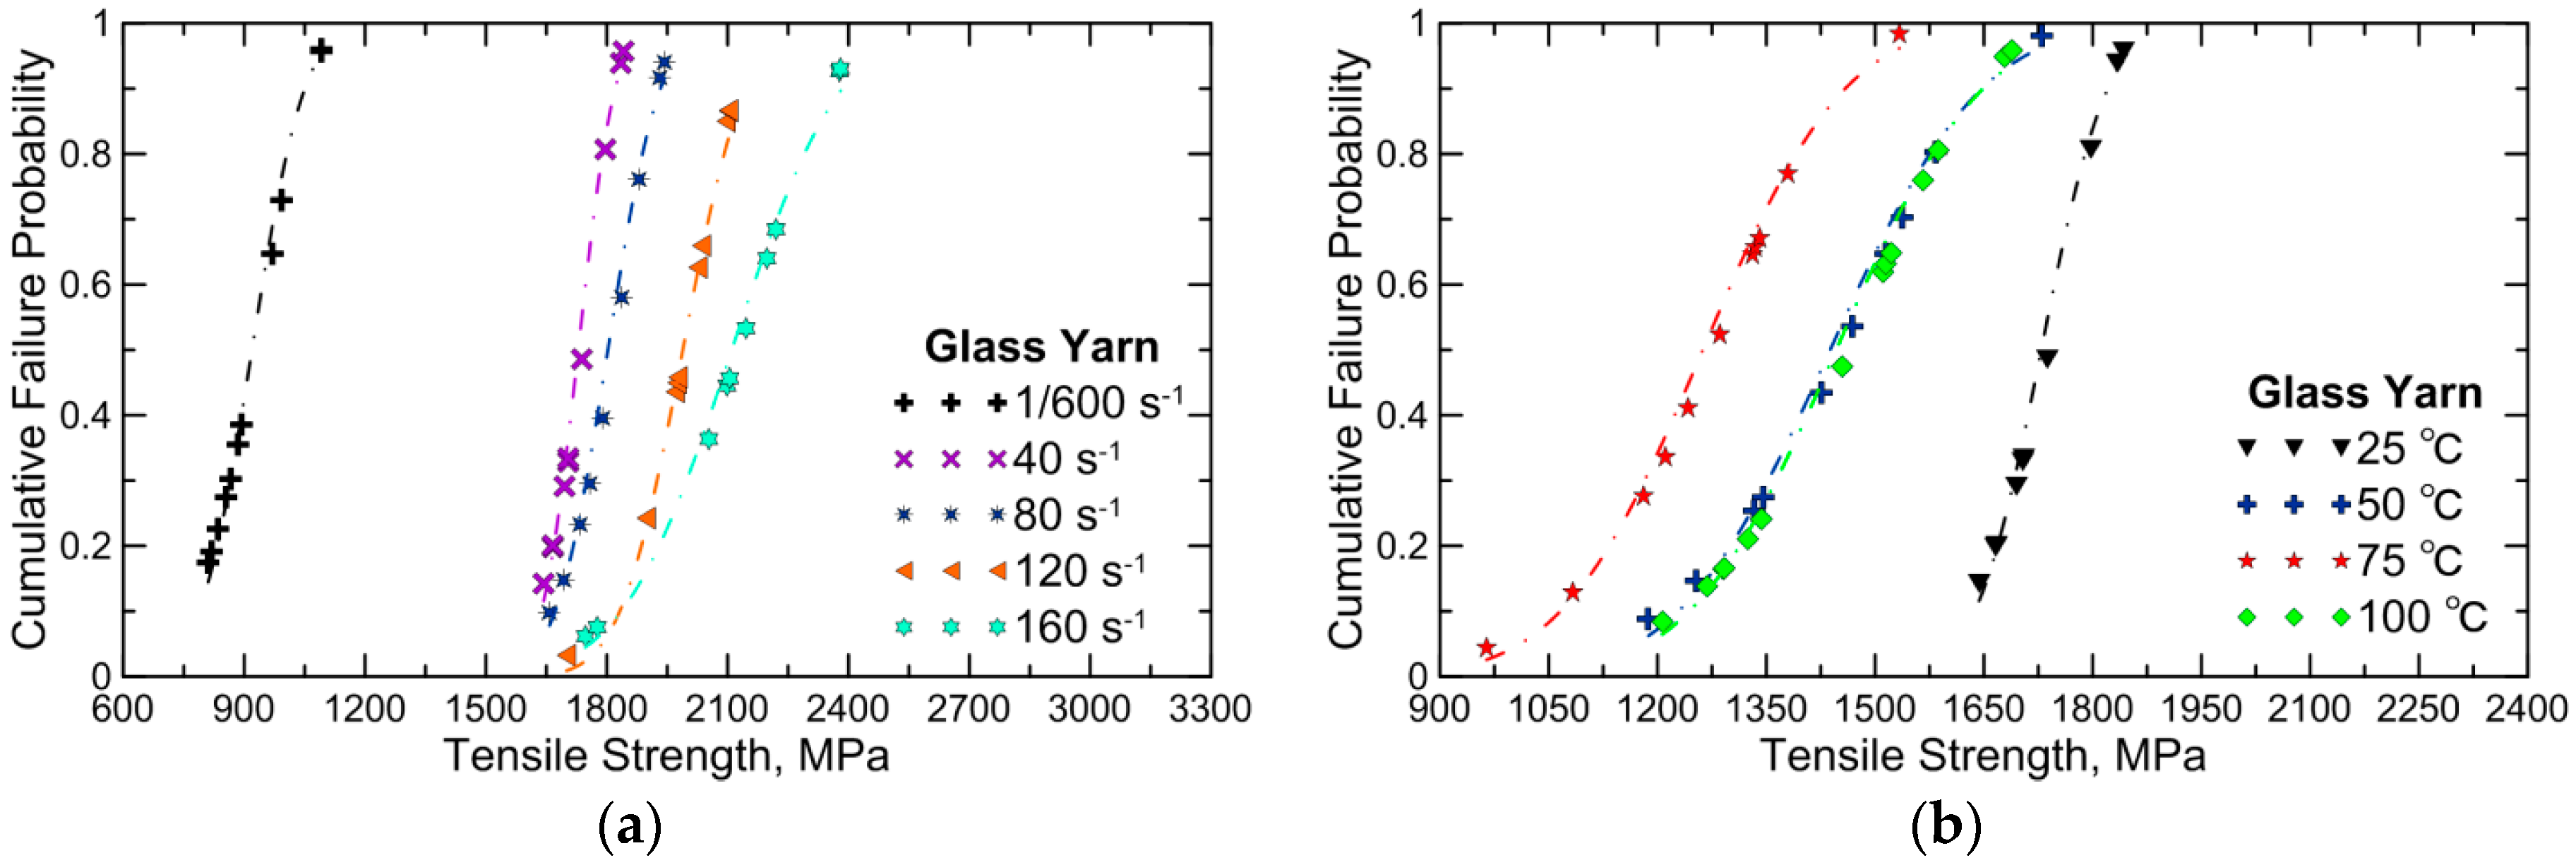
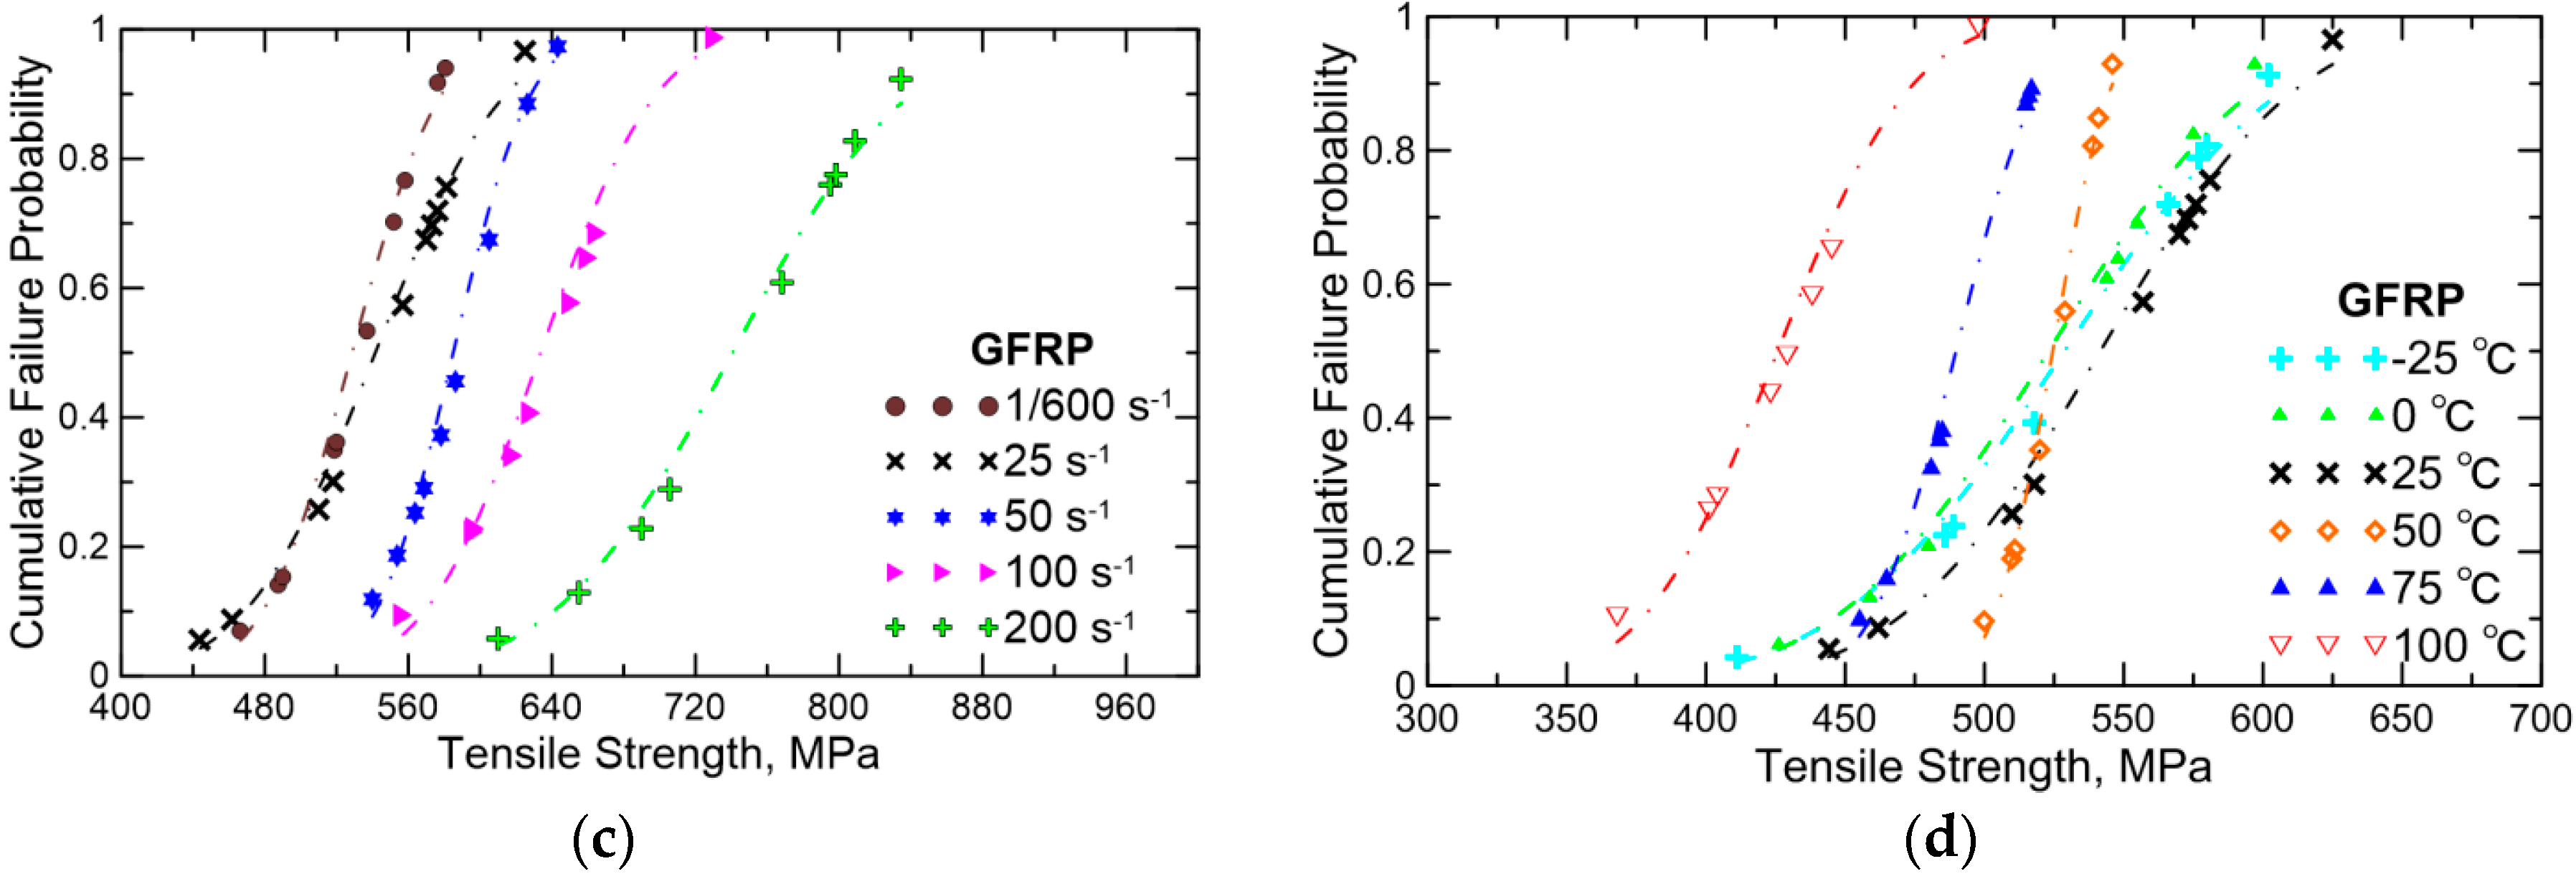
- The scale parameter () values are highly dependent on the strain rates and temperatures investigated. For glass yarn, the results acquired from higher strain rate have a lower shape parameter than the counterpart. This manifests that yarn subjected to higher strain rate is usually characterized by a more random breakage process.
Acknowledgments
Author Contributions
Conflicts of Interest
References
- Bakis, C.; Bank, L.C.; Brown, V.; Cosenza, E.; Davalos, J.; Lesko, J.; Machida, A.; Rizkalla, S.; Triantafillou, T. Fiber-reinforced polymer composites for construction-state-of-the-art review. J. Compos. Constr. 2002, 6, 73–87. [Google Scholar] [CrossRef]
- Bai, Y.; Keller, T.; Vallée, T. Modeling of stiffness of FRP composites under elevated and high temperatures. Compos. Sci. Technol. 2008, 68, 3099–3106. [Google Scholar] [CrossRef]
- Bai, Y.; Vallée, T.; Keller, T. Modeling of thermo-physical properties for FRP composites under elevated and high temperature. Compos. Sci. Technol. 2007, 67, 3098–3109. [Google Scholar]
- Cantwell, W.J.; Morton, J. The impact resistance of composite materials—A review. Composites 1991, 22, 347–362. [Google Scholar] [CrossRef]
- Kim, M.; Kang, S.; Kim, C.; Kong, C. Tensile response of graphite/epoxy composites at low temperatures. Compos. Struct. 2007, 79, 84–89. [Google Scholar] [CrossRef]
- Reis, J.; Coelho, J.; Monteiro, A.; da Costa Mattos, H. Tensile behavior of glass/epoxy laminates at varying strain rates and temperatures. Compos. Part B 2012, 43, 2041–2046. [Google Scholar] [CrossRef]
- Sánchez-Sáez, S.; Gómez-del Rıo, T.; Barbero, E.; Zaera, R.; Navarro, C. Static behavior of CFRPs at low temperatures. Compos. Part B 2002, 33, 383–390. [Google Scholar] [CrossRef]
- Zhu, D.; Rajan, S.; Mobasher, B.; Peled, A.; Mignolet, M. Modal analysis of a servo-hydraulic high speed machine and its application to dynamic tensile testing at an intermediate strain rate. Exp. Mech. 2011, 51, 1347–1363. [Google Scholar] [CrossRef]
- Ou, Y.; Zhu, D. Tensile behavior of glass fiber reinforced composite at different strain rates and temperatures. Constr. Build. Mater. 2015, 96, 648–656. [Google Scholar] [CrossRef]
- Kolsky, H. An investigation of the mechanical properties of materials at very high rates of loading. Proc. Phys. Soc. Lond. Sect. B 1949, 62, 676. [Google Scholar] [CrossRef]
- Wang, K.; Young, B.; Smith, S.T. Mechanical properties of pultruded carbon fibre-reinforced polymer (CFRP) plates at elevated temperatures. Eng. Struct. 2011, 33, 2154–2161. [Google Scholar] [CrossRef]
- Melin, L.; Asp, L. Effects of strain rate on transverse tension properties of a carbon/epoxy composite: Studied by moiré photography. Compos. Part A 1999, 30, 305–316. [Google Scholar] [CrossRef]
- Al-Zubaidy, H.; Zhao, X.; Al-Mahaidi, R. Mechanical characterisation of the dynamic tensile properties of CFRP sheet and adhesive at medium strain rates. Compos. Struct. 2013, 96, 153–164. [Google Scholar] [CrossRef]
- Koerber, H.; Xavier, J.; Camanho, P.P. High strain rate characterisation of unidirectional carbon-epoxy im7-8552 in transverse compression and in-plane shear using digital image correlation. Mech. Mater. 2010, 42, 1004–1019. [Google Scholar] [CrossRef]
- Zhou, Y.; Wang, Y.; Mallick, P. An experimental study on the tensile behavior of kevlar fiber reinforced aluminum laminates at high strain rates. Mater. Sci. Eng. A 2004, 381, 355–362. [Google Scholar] [CrossRef]
- Barre, S.; Chotard, T.; Benzeggagh, M. Comparative study of strain rate effects on mechanical properties of glass fibre-reinforced thermoset matrix composite. Compos. Part A 1996, 27, 1169–1181. [Google Scholar] [CrossRef]
- Shokrieh, M.M.; Omidi, M.J. Tension behavior of unidirectional glass/epoxy composites under different strain rates. Compos. Struct. 2009, 88, 595–601. [Google Scholar] [CrossRef]
- Ochola, R.O.; Marcus, K.; Nurick, G.N.; Franz, T. Mechanical behavior of glass and carbon fibre reinforced composites at varying strain rates. Compos. Struct. 2004, 63, 455–467. [Google Scholar] [CrossRef]
- Hawileh, R.A.; Abu-Obeidah, A.; Abdalla, J.A.; Al-Tamimi, A. Temperature effect on the mechanical properties of carbon, glass and carbon–glass FRP laminates. Constr. Build. Mater. 2015, 75, 342–348. [Google Scholar] [CrossRef]
- Robert, M.; Benmokrane, B. Behavior of GFRP reinforcing bars subjected to extreme temperatures. J. Compos. Constr. 2009, 14, 353–360. [Google Scholar] [CrossRef]
- Zhu, D.; Mobasher, B.; Rajan, S.D. Dynamic tensile testing of kevlar 49 fabrics. J. Mater. Civ. Eng. 2011, 23, 230–239. [Google Scholar] [CrossRef]
- Kuentzer, N.; Simacek, P.; Advani, S.G.; Walsh, S. Correlation of void distribution to vartm manufacturing techniques. Compos. Part A 2007, 38, 802–813. [Google Scholar] [CrossRef]
- Zhu, D.; Peled, A.; Mobasher, B. Dynamic tensile testing of fabric–cement composites. Constr. Build. Mater. 2011, 25, 385–395. [Google Scholar] [CrossRef]
- Ou, Y.; Zhu, D.; Huang, M.; Li, H. Gage length and strain rate effects on tensile behavior of kevlar 29 single filament and yarn. J. Compos. Mater. 2016, 0, 1–15. [Google Scholar] [CrossRef]
- Zhu, D.; Gencoglu, M.; Mobasher, B. Low velocity flexural impact behavior of ar glass fabric reinforced cement composites. Cem. Concr. Compos. 2009, 31, 379–387. [Google Scholar] [CrossRef]
- Xiao, X. Dynamic tensile testing of plastic materials. Polym. Test. 2008, 27, 164–178. [Google Scholar] [CrossRef]
- Reed, R.; Golda, M. Cryogenic properties of unidirectional composites. Cryogenics 1994, 34, 909–928. [Google Scholar] [CrossRef]
- Ditlevsen, O. Uncertainty Modeling with Applications to Multidimensional Civil Engineering Systems; McGraw-Hill International Book Co.: New York, NY, USA, 1981. [Google Scholar]
- Weibull, W. A statistical distribution function of wide applicability. J. Appl. Mech. 1951, 13, 293–297. [Google Scholar]
- Padgett, W.; Durham, S.; Mason, A. Weibull analysis of the strength of carbon fibers using linear and power law models for the length effect. J. Compos. Mater. 1995, 29, 1873–1884. [Google Scholar] [CrossRef]
- Hui, C.; Phoenix, S.; Shia, D. The single-filament-composite test: A new statistical theory for estimating the interfacial shear strength and weibull parameters for fiber strength. Compos. Sci. Technol. 1998, 57, 1707–1725. [Google Scholar] [CrossRef]
- Alqam, M.; Bennett, R.M.; Zureick, A.-H. Three-parameter vs. Two-parameter weibull distribution for pultruded composite material properties. Compos. Struct. 2002, 58, 497–503. [Google Scholar] [CrossRef]
- Sriramula, S.; Chryssanthopoulos, M.K. Quantification of uncertainty modelling in stochastic analysis of frp composites. Compos. Part A 2009, 40, 1673–1684. [Google Scholar] [CrossRef]
- Lekou, D.; Philippidis, T. Mechanical property variability in frp laminates and its effect on failure prediction. Compos. Part B 2008, 39, 1247–1256. [Google Scholar] [CrossRef]


| Components | Tensile Strength, MPa | Young’s Modulus, GPa | Elongation, % | Density, g/cm3 | C/S Area of Single Yarn, mm2 |
|---|---|---|---|---|---|
| Glass yarn | 919 | 113 | 1.5 | 2.54 | 0.473 |
| Epoxy resin | 36 | 6.1 | 1.8 | 1.7 | – |
| Strain Rate (s−1) | 1/600 | 40 | 80 | 120 | 160 |
|---|---|---|---|---|---|
| N | 10 | 8 | 8 | 8 | 8 |
| (MPa) | 932 | 1744 | 1836 | 2027 | 2177 |
| m | 26.1 | 20.2 | 16.2 | 15.4 | 10.9 |
| Temperature (°C) | 25 | 50 | 75 | 100 |
|---|---|---|---|---|
| N | 8 | 8 | 8 | 8 |
| (MPa) | 1744 | 1479 | 1312 | 1497 |
| m | 20.2 | 10.3 | 9.3 | 8.1 |
| Strain Rate (s−1) | 1/600 | 25 | 50 | 100 | 200 |
|---|---|---|---|---|---|
| N | 10 | 10 | 9 | 9 | 9 |
| (MPa) | 542 | 560 | 592 | 638 | 766 |
| m | 12.5 | 10.1 | 16.2 | 15.7 | 9.2 |
| Temperature (°C) | −25 | 0 | 25 | 50 | 75 | 100 |
|---|---|---|---|---|---|---|
| N | 8 | 8 | 10 | 8 | 8 | 8 |
| /MPa | 550 | 541 | 560 | 530 | 496 | 426 |
| m | 9.1 | 8.7 | 10.1 | 25.4 | 18.3 | 16.0 |
© 2016 by the authors. Licensee MDPI, Basel, Switzerland. This article is an open access article distributed under the terms and conditions of the Creative Commons Attribution (CC-BY) license ( http://creativecommons.org/licenses/by/4.0/).
Share and Cite
Ou, Y.; Zhu, D.; Zhang, H.; Huang, L.; Yao, Y.; Li, G.; Mobasher, B. Mechanical Characterization of the Tensile Properties of Glass Fiber and Its Reinforced Polymer (GFRP) Composite under Varying Strain Rates and Temperatures. Polymers 2016, 8, 196. https://doi.org/10.3390/polym8050196
Ou Y, Zhu D, Zhang H, Huang L, Yao Y, Li G, Mobasher B. Mechanical Characterization of the Tensile Properties of Glass Fiber and Its Reinforced Polymer (GFRP) Composite under Varying Strain Rates and Temperatures. Polymers. 2016; 8(5):196. https://doi.org/10.3390/polym8050196
Chicago/Turabian StyleOu, Yunfu, Deju Zhu, Huaian Zhang, Liang Huang, Yiming Yao, Gaosheng Li, and Barzin Mobasher. 2016. "Mechanical Characterization of the Tensile Properties of Glass Fiber and Its Reinforced Polymer (GFRP) Composite under Varying Strain Rates and Temperatures" Polymers 8, no. 5: 196. https://doi.org/10.3390/polym8050196