Article

Stable Failure-Inducing Micro-Silica Aqua Epoxy Bonding Material for Floating Concrete Module Connection

1
School of Civil and Environmental Engineering, Yonsei University, Concrete Structural Engineering Laboratory, Seoul 03722, Korea
2
Korea Institute of Civil Engineering and Building Technology Structural Engineering Research Institute, Goyang-Si, Gyeonggi-Do 10223, Korea
*
Author to whom correspondence should be addressed.
Polymers 2015, 7(11), 2389-2409; https://doi.org/10.3390/polym7111520
Submission received: 1 June 2015 / Revised: 22 September 2015 / Accepted: 29 October 2015 / Published: 24 November 2015
(This article belongs to the Collection Silicon-Containing Polymeric Materials)

Abstract

:
Many recent studies in the development of floating concrete structures focused on a connection system made of modules. In the connection system, the modules are designed to be attached by pre-stressing (PS) while floating on the water, which exposes them to loads on the surface of the water. Therefore, the development of a pre-connection material becomes critical to ensure successful bonding of floating concrete modules. Micro-silica mixed aqua-epoxy (MSAE) was developed for this task. To find the proper MSAE mix proportion, 0% to 4% micro-silica was mixed in a standard mixture of aqua-epoxy for material testing. Also, the effect of micro-silica on the viscosity of the aqua epoxy was evaluated by controlling the epoxy silane at proportions of 0%, ±5%, and ±10%. After completion of the performance tests of the MSAE, we evaluated the effect of MSAE in a connected structure. The plain unreinforced concrete module joint specimens applied with MSAE at thicknesses of 5, 10, and 20 mm were prepared to be tested. Finally, we evaluated the performance of MSAE-applied reinforced concrete (RC) module specimens connected by PS tendons, and these were compared with those of continuous RC and non-MSAE-applied beams. The results showed that the mix of micro-silica in the aqua-epoxy changed the performance of the aqua-epoxy and the mix ratio of 2% micro-silica gave a stable failure behavior. The flexural capacity of concrete blocks bonded with MSAE changed according to the bond thickness and was better than that of concrete blocks bonded with aqua-epoxy without micro-silica. Even though MSAE insignificantly increases the load-carrying capacity of the attached concrete module structure, the stress concentration reduction effect stabilized the failure of the structure.

Graphical Abstract

1. Introduction

Great efforts to utilize the vast space occupied by the ocean have been attempted in many countries. These efforts have resulted in the construction of production and storage off-loading floating structures such as oil storage tanks. Recently, efforts have focused on securing huge usable areas on the sea (e.g., a floating airport [1], an artificial island, a floating container terminal, and a moving offshore basement). Even though the main construction material of these offshore structures is steel, concrete has been actively used due to its advantages in terms of cost, durability, and stability. The huge concrete structures associated with these applications are ideally made as modules that can be connected on the water. Therefore, the connected interface should be able to handle external forces and transfer internal stresses. The present method for connecting concrete modules involves the application of a plastering bonding material between the modules before pre-stressing (PS). Therefore, the bonding material must be able to protect PS tendons from corrosion and must have sufficient strength to bear the PS stress; therefore, the bonding material requires high durability and high strength [2]. Researchers have also tried to develop new bonding materials such as aqua-epoxy. Kim et al. [3] verified the performance of structural filler epoxy and primer aqua-epoxy (AE) and tested their connecting performance in concrete members. They showed that the highly viscous primer aqua-epoxy, which was a mixture of epoxy silane and amine hardener, adequately bonded fiber-reinforced polymer (FRP) sheets to concrete structure surfaces. AE usually has a high viscosity, so pores are created during the mixing of the epoxy silane and hardener, which degrades the interface performance. Pores in the epoxy reduce bond strength at the interface due to a reduced attached surface area. Also, the epoxy matrix was degraded by the freezing and thawing of the water trapped in the pores. Surface treatment could be one method to achieve pore reduction. Woo [4] suggested a method of roughening the surfaces of concrete members before bonding to increase the bonding area of the epoxy-concrete interface. However, this method was unsuccessful because aqua-epoxy has a high viscosity, which resulted in surface irregularities. Since the presence of pores in an aqua-epoxy will create a surface barrier leading to interfacial failure, modification of the AE must include pore reduction and bond capacity improvement. One proposed solution to the problem is to mix micro-silica powder with the AE. The micro-powders fill the pores and increase the bonding surface area [5]. Since the chemical durability and the filling effect are controlled by the powder type, the selection of the powder is critical in the floating structure interface applications due to the wet working conditions. Cement powder that is generally used as epoxy filler is weak when used in seawater. The selected powder should be able to resist chloride penetration and other chemical reactions that might occur in seawater.
This study is to enhance the performance of the bonding material and verification of its role in a concrete structure. A series of micro-silica (SiO2) with high chemical stability was selected for enhancing the performance of the bonding material. Various mix proportions of micro-silica were added to the aqua-epoxy to obtain the optimal mix proportion for increasing bond performance. All of the mix proportions were evaluated by performing material tests. Then, an additional evaluation was performed to investigate the capacity change as a function of the mix ratio of epoxy silane. Two unreinforced concrete modules with dimensions of 100 mm × 100 mm × 190 mm were attached using micro-silica aqua-epoxy (MSAE) developed from the selected mix proportion. The specimens were tested by 3-point load bending up to failure. Finally, in order to evaluate the performance of MSAE in real concrete structures, reinforced concrete beam modules were constructed for attachment under wet conditions using MSAE and PS. The beam specimens were also tested using a 3-point bending test.

2. Materials and Methods

2.1. Bonding Material Selection for Floating Concrete Structure

Adhesives for concrete bonding can be generally classified into epoxy resins, conventional and new concrete adhesives, polyurethane elastic adhesives, and polymer cement mortar depending on how the materials are used. Up to now, epoxy resins have been the most widely used material for bonding precast concrete modular blocks [6,7,8]. The epoxy resins used for bonding concrete can be classified into seven types based on the usage, form, grade, color, and performance according to American Society for Testing and Materials (ASTM) 881 as shown in Table 1. The concrete floating structure bonded by PS (as specified in this study) is consistent with Type VI. The highly viscous aqua-epoxy used in this study was originally developed by Kim et al. [9] with the goal of enhancing workability as a repair-retrofit material for FRP attachments. In the previous study, the aqua-epoxy was used only as an adhesive material and it showed sufficient durability, workability, and chemical resistance in wet conditions including seawater. Detailed chemical compositions of the aqua-epoxy can be found in [9]. The viscosity of the material was increased from 30,000 cps to 54,000 cps due to micro-silica filling in the pores.
Table 1. Type of epoxy for bonding (ASTM C 881).
TypeCharacteristics
IFor use in non-load-bearing applications for bonding hardened concrete to hardened concrete and other materials, and as a binder in epoxy mortars or epoxy concretes.
IIFor use in non-load-bearing applications for bonding freshly mixed concrete to hardened concrete.
IIIFor use in bonding skid-resistant materials to hardened concrete, and as a binder in epoxy mortars or epoxy concretes, used on traffic bearing surfaces.
IVFor use in load-bearing applications for bonding hardened concrete to hardened concrete and other materials and as a binder for epoxy mortars and concretes.
VFor use in load-bearing applications for bonding freshly mixed concrete to hardened concrete.
VIFor bonding and sealing segmental precast elements with internal tendons and for span-by-span erection when temporary post-tensioning is applied.
VIIFor use as a non-stress-carrying sealer for segmental precast elements when temporary post-tensioning is not applied in span-by-span erection.

2.2. Development of Optimum MSAE

Many researchers have focused on the possibility of using micro-fillers in epoxy matrices [10,11,12,13]. Epoxy is usually mixed with micro-fillers, such as silica or alumina. Micro-silica particles were used in this study. A silica solution was produced by adding liquid silicic acid to induce dehydration condensation reactions, which resulted in a three-dimensional (3D) Si–O–Si mesh structure. The product was then ground to a micro-powder, which was the micro-silica used in this study. The schematic drawing of the production procedure of micro-silica (silica fume) used in this study is shown in Figure 1. The production procedure shown in Figure 1 is an ordinary production procedure used to produce silica fume all over the world.
Figure 1. Preparation procedure of micro-silica [14].
Polymers 07 01520 g001
Most micro-silica particles are less than 1.0 micron (0.00004 in) in diameter, generally 50 to 100 times finer than an average particle diameter of ordinary Portland cement or fly ash [15]. SEM micrograph of micro-silica with spherical appearance of the individual particles is shown in Figure 2. Generally, micro-silica consists of spherical particles with an average particle size of 150 nm and a typical specific surface area of 20 m2/g [16].
Figure 2. SEM micrograph of micro-silica with spherical appearance of the individual particles.
Polymers 07 01520 g002
As shown in Table 2, the micro-silica had a higher SiO2 proportion than silica fume, which is commonly used to produce high-strength concrete [17]. The pozzolanic effect that usually occurs in concrete with silica fume does not occur in the micro-silica, because the micro-filler effect mainly occurs in epoxies and at the concrete-epoxy interface [18]. Just before the application of MSAE on the surface of the concrete for bonding, an allotted volume percentage of micro-silica is mixed with aqua-epoxy and stirred thoroughly for full mixing of MSAE.
Table 2. Chemical analysis of micro-silica.
ElementCompound (%)ElementCompound (%)
SiO298.4K2O0.20
C0.50Na2O0.15
Fe2O30.01P2O50.03
Al2O30.20SO30.10
CaO0.20Cl0.11
MgO0.10
Material properties were evaluated for various mechanical characteristics. A total of five material properties were tested in accordance with the Korea Standard (KS). However, when KS test standards were not available, ASTM regulations were adopted. Test standards used in the study are tabulated in Table 3.
Table 3. Material properties and test methods.
Test TypeNotationStandard
Tensile strengthTKS M 3006
Compressive strengthCKS M 3015
Shear strength by tensile loadingSTKS M 3734
Bond strength by slant shearBSASTM C 882-91
Bond strengthBKS F 4923

2.3. Tensile and Slant Shear Capacity Evaluation of MSAE

The performance of MSAE-based materials as a function of the micro-silica mix ratio was experimentally evaluated. Since concrete modules usually are connected using shear key integrated interfaces, slant shear bonds and tensile strength tests were performed. The AE mix proportion suggested by the manufacturer with micro-silica mix ratio variations of 1%, 2%, 3%, and 4% were mixed to cast the specimens. The test results are summarized in Table 4 and plotted in Figure 3. Coefficients of variation (COV) of the test results were less than 5% except for one datum, indicating that these data were consistent and reliable. Figure 3a is a plot of the average values from Table 4, indicating that there was only a slight change in slant shear bond strength when the micro-silica mix ratio was increased to approximately 2%, and it was difficult to clearly differentiate the effect of micro-silica in the AE. Therefore, an evaluation method based on a guaranteed value, which is equivalent to the average strength minus three times the standard deviation (σ) was used.
Table 4. Test results for MSAE as a function of the micro-silica mix ratio.
Micro-silica ratioNumberTensile strength (MPa)Bond shear strength (MPa)
MeasuredIncreased ratioMeasuredIncreased ratio
0%146.33.9
240.94.0
343.63.9
444.03.8
542.9
Mean (COV)43.5 (4.5%)3.9 (1.6%)
Mean-3σ37.73.7
1%146.73.9
245.24.1
340.93.9
440.43.7
540.3
Mean (COV)42.7 (7.1%)−1.9%3.9 (4.0%)0.0%
Mean-3σ33.6−10.8%3.4−7.6%
2%144.34.0
247.24.0
345.23.9
442.33.9
542.3
Mean (COV)44.3 (4.7%)1.7%3.9 (1.5%)1.1%
Mean-3σ38.00.9%3.81.7%
3%142.74.0
245.24.0
343.44.0
442.73.9
540.0
Mean (COV)42.8 (4.4%)−1.7%4.0 (1.5%)1.9%
Mean-3σ37.2−1.3%3.82.2%
4%144.03.8
244.63.7
345.93.8
439.93.9
540.3
Mean (COV)42.9 (6.3%)−1.4%3.8 (1.5%)−2.3%
Mean-3σ34.9−7.4%3.6−2.0%
MSAE, Micro-Silica mixed Aqua-Epoxy; COV, Coefficients of Variation.
Figure 3b is a plot of the calculated guaranteed strengths using the test results from Table 4. When AE was mixed with various amounts of micro-silica, tensile strength and slant shear bond strengths changed by −11% to −2%. These data demonstrated that micro-silica plays a significant role in increasing the bond performance of the AE because (i) only a minute amount of micro-silica was added to the AE and (ii) the data had a reliability of 99.5%. More specifically, when 2% micro-silica was added to the AE, the tensile and slant shear bond strengths all increased by a statistically significant amount.
Figure 3. Test results of MSAE on mix ratios of micro-silica; (a) strength variation; and (b) ratio of strength increase.
Polymers 07 01520 g003
The AE used in this process had a viscosity of 33,000 cps, which is 33,000 times higher than water, so the mixing of the epoxy silane and hardener can be difficult. During bonding of concrete modules at sea, the rapid application and curing of the bond epoxy are necessary to overcome the wet working conditions. Since there is no available test method to quantitatively measure the applicable workability of bond epoxy, a qualitative evaluation was performed. For a micro-silica mixing ratio of over 3%, MSAE was impossible to plaster on a concrete surface based on the trial-and-error experience; we decided that the maximum micro-silica mix ratio was 2%.

2.4. Mixing Ratio Effect of Primer in Epoxy Silane

Based on the selected 2% MSAE, the effect of the primer amount on the mechanical properties was studied. AE was controlled by changing the main compound ratio by ±5% and ±10%, which deviated from the basic mixing ratio recommended by the manufacturer (0%). All cases were tested for tensile strength (T), compressive strength (C), tensile shear-bond strength (ST), bond shear strength (BS), bond strength (B), and maximum failure load. Five specimens were prepared for T, C, and ST tests, while four specimens were prepared for B and BS tests. Therefore, a total of 115 specimens were tested.
The mean of the measured values and coefficient of variation (COV) values are tabulated in Table 5. Figure 4 shows a comparison between mean values relative to the values of the specimens with epoxy silane of 0% and no micro-silica for all test methods. We concluded that test results are reliable based on the low COV shown in Table 5. As shown in Figure 4, all of the mechanical properties obtained from the tests where we varied the epoxy silane amount were lower than those using a mixing ratio recommended by the manufacturer. Therefore, we concluded that the mix ratio for epoxy silane in AE with 2% micro-silica should be 0%, which is the ratio recommend by the manufacturer.

2.5. Plain Unreinforced Concrete MSAE Joint Specimen Evaluation

To evaluate the contribution of MSAE in the attached concrete members, unreinforced concrete blocks were manufactured and bonded with MSAE. The design concrete compressive strength was 30 MPa. The 28-day compressive strength test results showed an average strength of 31.2 MPa. The concrete mix design is shown in Table 6. The specimen dimensions were selected based on the logic that the specimen length-to-height ratio would apply both flexure and shear stresses on the interface section. Therefore, the length-to-height ratio exceeding 3 (precisely 3.6) was selected.
Table 5. Test results for mix ratio of epoxy silane and micro-silica (unit: MPa).
Epoxy SilaneNumberTCSTBBS
MS 0%MS 2%MS 0%MS 2%MS 0%MS 2%MS 0%MS 2%MS 0%MS 2%
−10%132.733.565.469.09.09.22.63.53.02.9
230.335.372.559.68.19.23.03.32.93.0
332.135.458.866.08.49.02.63.62.83.1
431.332.963.166.58.89.13.13.42.93.0
533.232.268.470.29.08.9
Mean31.933.965.666.38.79.12.83.52.93.0
COV3.6%4.2%7.9%6.2%4.6%1.4%8.9%3.1%2.5%2.8%
−5%135.434.672.078.010.410.33.34.23.43.5
233.837.774.378.011.510.83.73.63.33.3
335.637.776.178.710.99.73.53.83.33.7
435.340.076.573.110.910.64.04.03.23.4
538.138.075.577.110.29.6
Mean35.637.674.977.010.810.23.63.93.33.5
COV4.3%5.1%2.4%2.9%4.7%5.2%8.3%7.2%2.6%5.2%
0%141.942.081.084.412.211.83.54.63.73.9
240.044.787.285.711.311.64.74.73.54.0
342.943.584.786.111.812.84.55.23.73.9
439.441.384.888.312.511.84.64.63.83.8
542.144.384.682.712.112.3
Mean41.343.284.585.412.012.14.34.83.73.9
COV3.6%3.4%2.6%2.4%3.8%4.0%12.6%5.5%2.9%2.5%
+5%137.536.375.679.111.212.03.74.23.73.6
236.235.576.880.011.211.03.84.33.53.5
336.936.682.569.811.811.44.14.03.23.6
437.734.483.582.911.111.23.74.13.63.7
536.236.382.075.011.312.5
Mean36.935.880.177.411.311.63.84.23.53.6
COV1.9%2.5%4.5%6.6%2.5%5.3%5.7%3.5%6.1%2.7%
+10%136.035.974.477.510.611.03.14.42.93.7
235.234.775.281.511.110.72.94.23.03.8
335.037.276.480.510.911.03.24.03.13.7
433.938.273.783.610.112.03.13.82.93.7
538.436.475.977.811.111.2
Mean35.736.575.180.210.811.23.14.13.03.7
COV4.7%3.6%1.5%3.2%3.9%4.4%4.5%7.1%2.8%1.4%
Figure 4. Comparison of mean values: (a) tensile strength; (b) compressive strength; (c) shear strength by tensile loading; (d) bond strength; and (e) bond strength by slant shear.
Polymers 07 01520 g004
Table 6. Concrete mix proportion.
Design compressive strength (MPa)Water-cement ratio (%)Sand-aggregate ratio (%)Unit weight (kgf/m3)
WaterCementGravelSand
305544.75486.67339.4958.12746.75
The structural capacity of MSAE-bonded concrete blocks was evaluated by using a 3-point bending test. As shown in Figure 5, two 100 mm × 100 mm × 190 mm plain unreinforced concrete blocks bonded with MSAE were prepared. The blocks were attached using bond thicknesses of 5, 10, and 20 mm. The application of MSAE was performed by plastering MSAE on the blocks in air or underwater. Specimens were prepared and cured in the air or underwater for 24 h; these samples are referred to as ”dry” and “wet” in Table 7, respectively. A total of 36 specimens were prepared (three specimens for each case). A 3-point bending test set-up is shown in Figure 6 where the loading point was at the one-third point of the span of 360 mm from the left support. The loading point was chosen such that the largest flexure and shear combined stresses were applied at the interface. The test cases are tabulated in Table 7.
Figure 5. Dimensions of attached block specimen.
Polymers 07 01520 g005
Figure 6. Eccentric 3-point bending test.
Polymers 07 01520 g006
Table 7. Test case notations.
Bond thicknessPlastering and curing condition
DryWet
5 mmAE 5AE 5(w)
MSAE 5MSAE 5(w)
10 mmAE 10AE 10(w)
MSAE 10MSAE 10(w)
20 mmAE 20AE 20(w)
MSAE 20MSAE 20(w)
MSAE, Micro-Silica mixed Aqua Epoxy; AE, Aqua-Epoxy.

2.6. Structural Bond Performance Evaluation of MSAE Applied in Pre-stressed Concrete (PSC) Modules

2.6.1. Specimen Dimensions and Details

In earlier sections, the basic MSAE material bond performance was investigated. In the actual construction of modular concrete structures, modules have shear keys to transfer forces to adjacent modules that are connected by PS. In order to investigate the performance of MSAE in real construction conditions, concrete beams bonded with MSAE and connected by PS were tested. Three types of specimens comprised of a continuous RC beam specimen as a control specimen (G), a spliced pre-stressed concrete (PSC) beam specimen without bonding material (P), and a spliced PSC beam specimen bonded with MSAE (EP) were manufactured as shown in Figure 7.
Figure 7. Specimen dimensions (unit: mm): (a) RC beam (G); (b) P-series; and (c) EP-series.
Polymers 07 01520 g007
The length of the specimens was 3000 mm, and the concrete modules used for the P and EP series were designed as one shear key. Two SWPR7A PS tendons were placed at 80 mm below the neutral axis, and the post-tensioning PS was applied until zero strain occurred on the upper surface of the specimen. The MSAE thickness of the EP series was 20 mm. D19 rebars with yield strength of 400 MPa were used as both compressive and tensile longitudinal rebars. D13 rebars with yield strength of 400 MPa were used as transverse rebars at 100 mm spacing. The height and width of the section were 370 mm and 340 mm, respectively. The details of the rebar layout are shown in Figure 8. The details of G, P, and EP specimens are shown in Figure 8a–c, respectively. The shear key was designed to be one-way by using the design of Hällmark et al. [19] as shown in Figure 9a. However, Hällmark’s design took the overly protruded shear key, which can cause brittle failure when the upper cover opening occurs. Therefore, the protrusion rate was controlled to be 2:1 (height:protrusion) as shown in Figure 9b. A total of five beams (one of G, two of P, and two of EP) were fabricated. An eccentric 3-point bending test was performed to measure the maximum load, initial interfacial cracking or debonding load, and crack propagation.
Figure 8. Rebar layout (unit: mm): (a) cross-section view; and (b) plan view.
Polymers 07 01520 g008
Figure 9. Layout of shear key (unit: mm): (a) Hällmark’s shear key example; and (b) specimen shear key dimensions.
Polymers 07 01520 g009

2.6.2. Material Properties

Concrete used in this study was required to be water-tight for marine environments. Therefore, 10% of the binder was replaced with fly ash to improve water-tightness [20]. The specimens were fabricated under dry conditions to eliminate the uncertainty of micro-structural change at the interface face due to fly ash usage. The 28-day concrete compressive strength was 60 MPa and the measured 28-day strength was 64.2 MPa. The concrete mix proportion design is shown in Table 8. Material tests were performed to measure material properties for aqua-epoxy of C Corporation with a 2% micro-silica-to-epoxy mass ratio. Tensile strength, compressive strength, and bond strength dry and wet condition) complying with KS and ASTM were measured. The test results are tabulated in Table 9.
Table 8. Concrete mix proportion.
Water–cement ratio (%)Sand–aggregate ratio (%)Unit weight (kgf/m3)
WaterBinderSandGravelSuper plasticizer
CementFly-ash
6045158450507459135
Table 9. Material test results for epoxy.
TestCapacity (MPa)Standard
Tensile strength43.2ASTM D 638
Compressive strength85.4KS M 3015
Pull-off bond strengthAir3.9ASTM C 882-91
Water3.8
Bond strengthAir4.6KS F 4923
Water4.1
Elastic Modulus7630KS F 2438

2.6.3. Specimen Construction

The construction process for the specimens was as follows. Two sheath tubes with a diameter of 50 mm were placed in a straight profile before performing match casting to guarantee the connectivity of two sides of the shear key using a steel formwork as shown in Figure 10. The formworks were removed three days after casting and MSAE was injected in the interface for EP specimens. Photos of the shear key and interface of P and EP series are shown in Figure 11a,b, respectively.
Figure 10. Match casting.
Polymers 07 01520 g010
Figure 11. Shear key connection; (a) P-series; and (b) EP-series.
Polymers 07 01520 g011

2.6.4. Test Set-Up

For the evaluation of the interfacial performance of spliced PSC beam specimens, an eccentric 3-point bending test was performed as shown in Figure 12. The eccentric load was applied at the one-third point of the span on the protruded module (left module) to produce maximum flexure and shear stresses in the interfacial section.
Figure 12. Eccentric 3-point loading test.
Polymers 07 01520 g012

3. Result

3.1. Plain Concrete MSAE Bond Performance Results.

The results of a 3-point bending test to verify the structural capacity of MSAE-attached plain concrete block specimens are shown in Table 10 and Figure 13. As shown in Figure 13a, the specimens attached using MSAE had higher peak loads than those attached by AE. Specimens bonded with MSAE and cured in air showed a capacity increase of 71%, 64%, and 30% compared to that of specimens with AE for bond thicknesses of 5, 10, and 20 mm, respectively. The load-carrying capacity of the specimens that were plastered and cured underwater for 24 h increased by 77%, 64%, and 26% relative to that of specimens with AE for bond thicknesses of 5, 10, and 20 mm, respectively. Both dry and wet cured specimens with a bond thickness of 10 mm showed the maximum load-carrying capacity.
Table 10. Peak loads of three-point bending test.
SpecimenNumberConditionSpecimenNumberCondition
Dry (kN)Wet (kN)Dry (kN)Wet (kN)
AE 5112.611.7MSAE 5120.123.0
213.312.6221.321.1
312.412.2324.020.1
Mean12.712.1Mean21.821.4
COV3%3%COV8%6%
AE 10114.714.5MSAE 10124.122.7
213.714.3222.122.0
314.012.9323.223.6
Mean14.113.9Mean23.222.8
COV3%5%COV4%3%
AE 20110.79.5MSAE 20114.512.0
211.89.9213.012.8
310.311.5315.314.1
Mean10.910.3Mean14.213.0
COV6%8%COV7%7%
Figure 13. Peak loads for AE and MSAE specimens fabricated and cured in; (a) air; and (b) underwater.
Polymers 07 01520 g013

3.2. PSC Structural MSAE Bond Performance Results

The results obtained from the bending test are shown in Figure 14, Figure 15, Figure 16, Figure 17 and Table 11. In the case of a continuous RC specimen (G), a flexural crack occurred under the loading point when the load reached 170 kN. Rebar yielded at 200 kN and concrete crushing under the load occurred at 235 kN. The failure mode was flexural failure as shown in Figure 15.
Figure 14. Load-deflection curves; (a) G; (b) P series; and (c) EP series.
Polymers 07 01520 g014
Figure 15. Crack pattern (G).
Polymers 07 01520 g015
Figure 16. Crack pattern (P): (1) Initial crack formation on left at 140 kN; (2) Crack propagation on left bottom at 160 kN; (3) Crack formation and propagation to right side at 205 kN.
Polymers 07 01520 g016
Figure 17. Crack pattern (EP): (1) Initial crack formation on the interface at 100 kN; (2) Crack propagation on left side at 140 kN; (3) Crack propagation on interface bottom at 165 kN.
Polymers 07 01520 g017
Table 11. Structural bond performance test results of MSAE.
SpecimenInitial crack load (kN)Maximum load (kN)Maximum displacement (mm)
G170231.417.0
P1141224.432.3
P2137214.936.3
EP1138220.134.1
EP2144225.135.2
As shown in Figure 14b, the maximum load and displacement of the P series were 221 kN and 37 mm, on average, respectively. In the P series, the initial cracks occurred just below the apex and propagated to the loading point. Cracks propagated in both directions at the end of the test as shown in Figure 16. The crack propagation procedure was as follows. An initial crack was observed in direction (1) at approximately 140 kN, and crack (2) started growing at 160 kN as notated in Figure 16. Even though flexural rigidity decreased, the specimen resisted an applied load due to the interlocking of the inclined interface section. Following the crack propagation of (2) at 160 kN, the width of the crack (1) increased and propagated, and then the crack (3) occurred to the right side at 205 kN. At the maximum load of 220 kN, the width of the crack (1) drastically increased and the applied load abruptly decreased. The load-displacement behavior of the EP series was similar to that of the P series with nearly equivalent maximum load and displacement as shown in Figure 14c, but the cracking procedure was different, as shown in Figure 17. The maximum load and displacement of EP and P series were similar at 222.6 kN–34.6 mm and 219.76 kN–34.3 mm on average, respectively. The initial debonding crack (1) occurred at the interface at 100 kN, and then the crack (2) occurred at approximately 140 kN from the middle of the inclined part of the interface. Afterward, the crack (3) started at 165 kN and propagated. The test results are summarized in Table 11.

4. Discussion

4.1. Plain Concrete MSAE Bond Performance Discussion

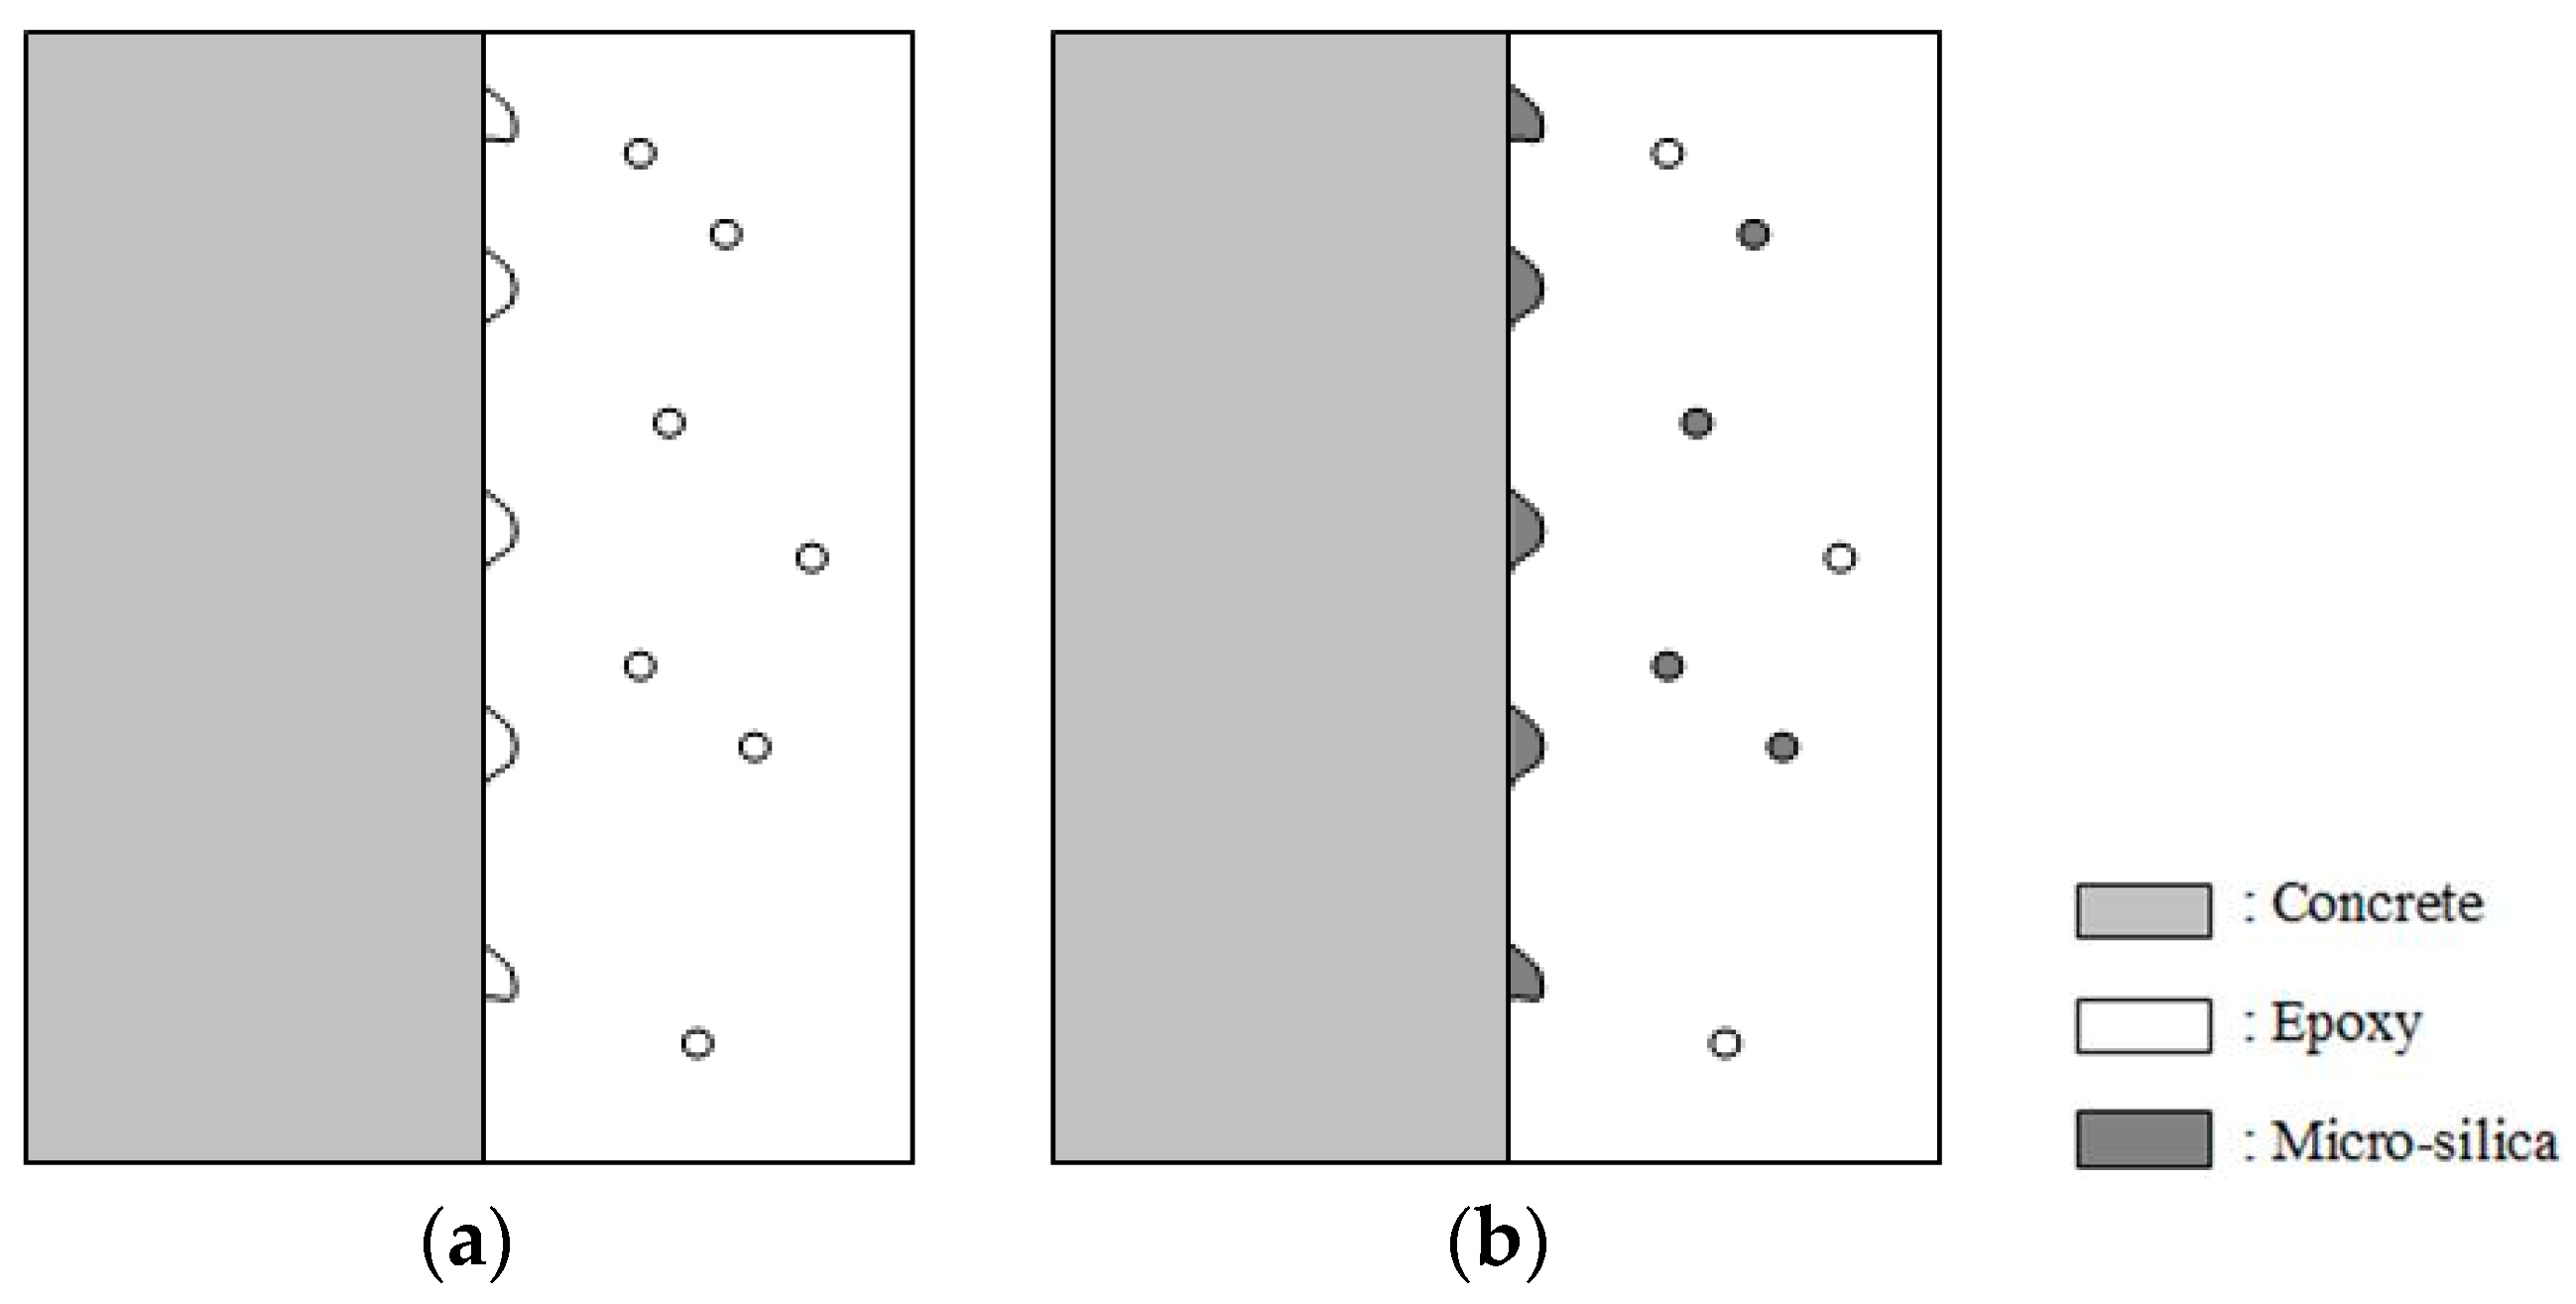
When the load-carrying capacity of the specimens with MSAE was compared to those with AE, the peak loads of the MSAE specimens were greater than the AE specimens. The increased peak loads can be attributed to the addition of micro-silica in increasing the bonding surface area of the interface. Since the AE is a highly viscous material, it is hard to consistently apply the AE to the concrete interfacial surface because this application inherently creates micro-pores at the concrete-epoxy interface as shown in Figure 18. These micro-pores are the main reason for the decrease in bond strength because the net bond strength at the interface is dictated by the surface area of the bonded interface. Therefore, if no surface treatment is performed on the concrete surface, the pores decrease the bond capacity of the member. Also, the pores would decrease homogeneity of the bonded interface, so the peak load of the member should decrease. However, the addition of micro-silica would fill the existing pores in an epoxy matrix and at the interface, which would maintain the integrity of the bonded region.
Figure 18. Pore reduction by MSAE; (a) non-MS; and (b) MSAE.
Polymers 07 01520 g018
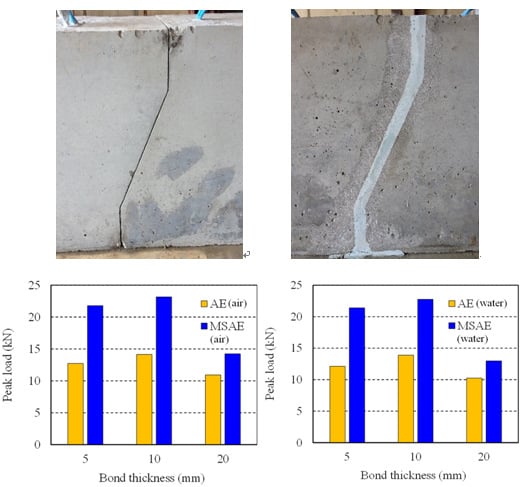
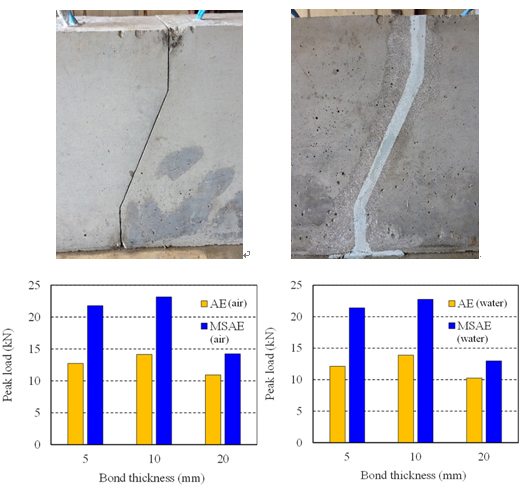
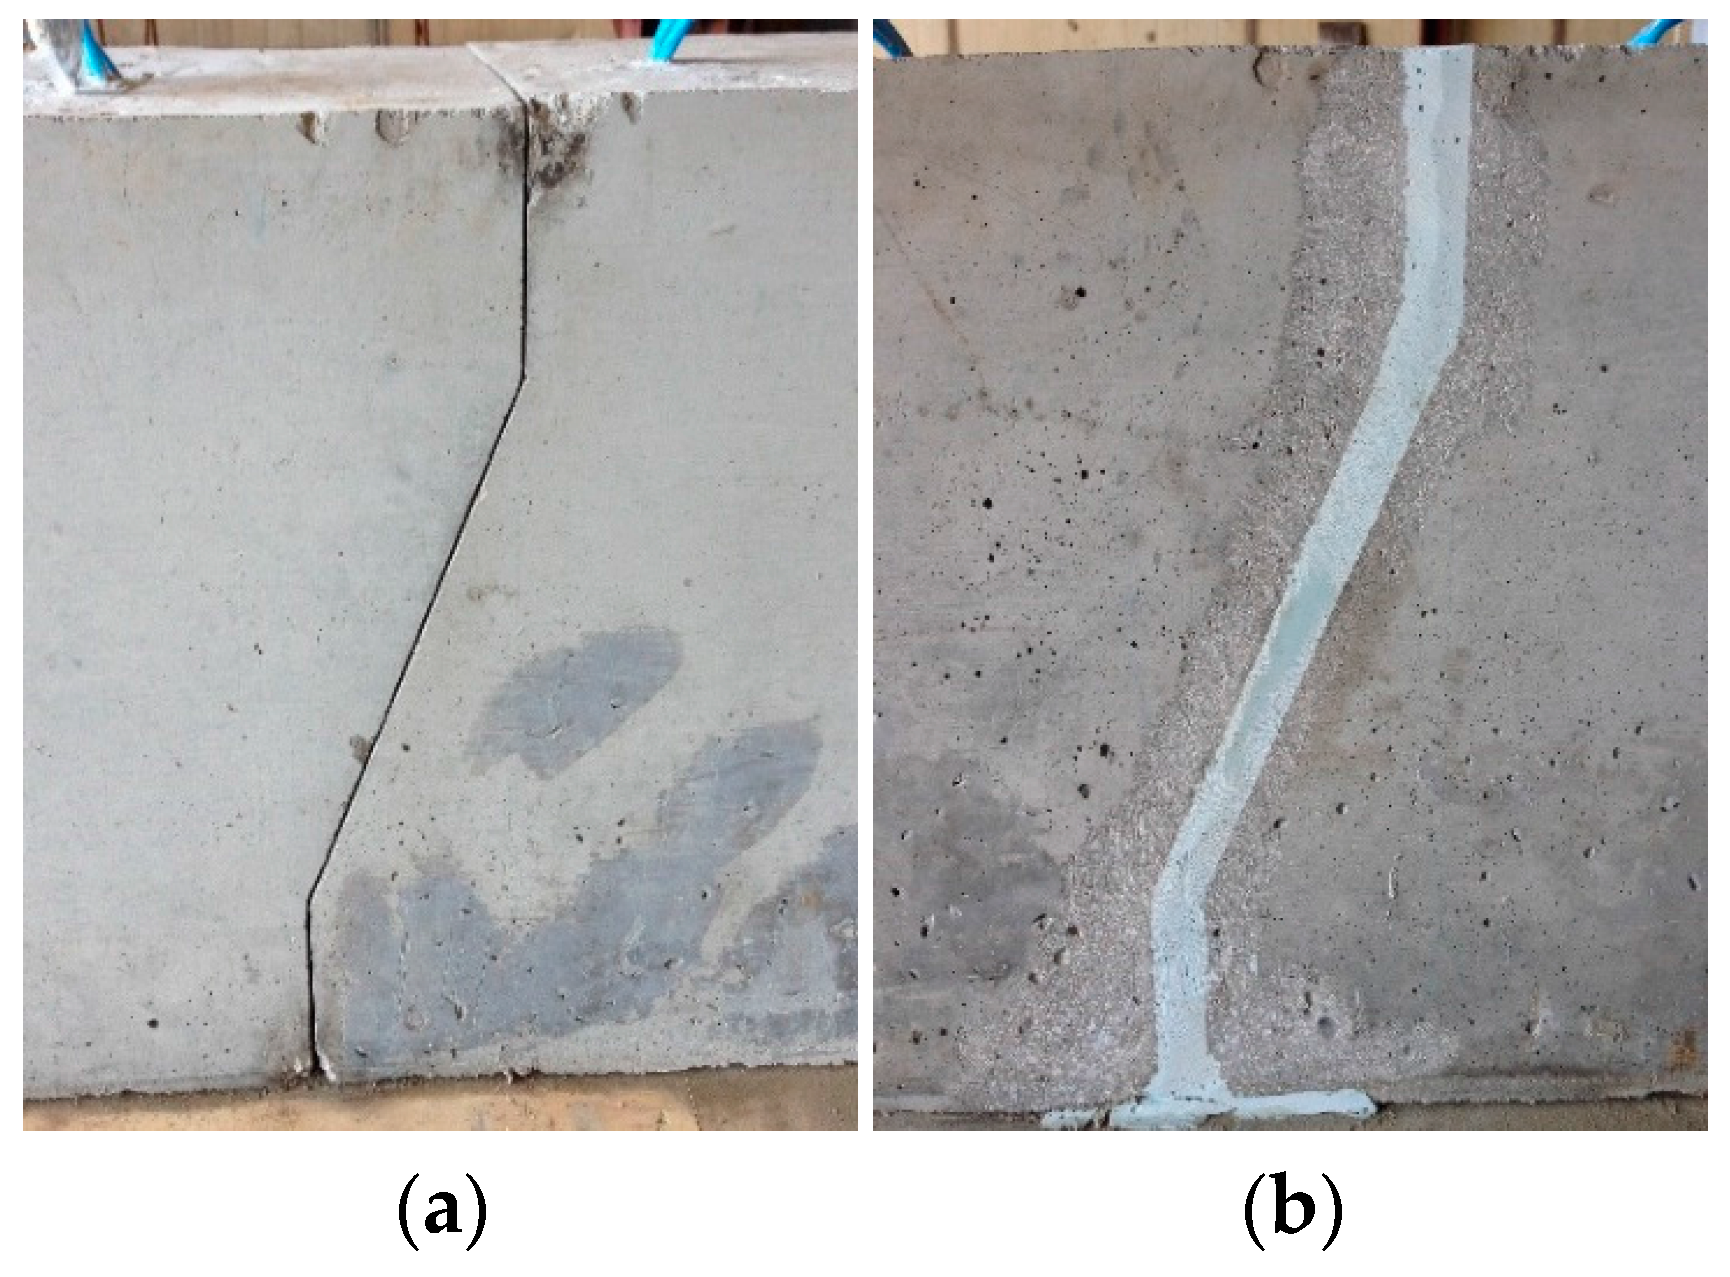
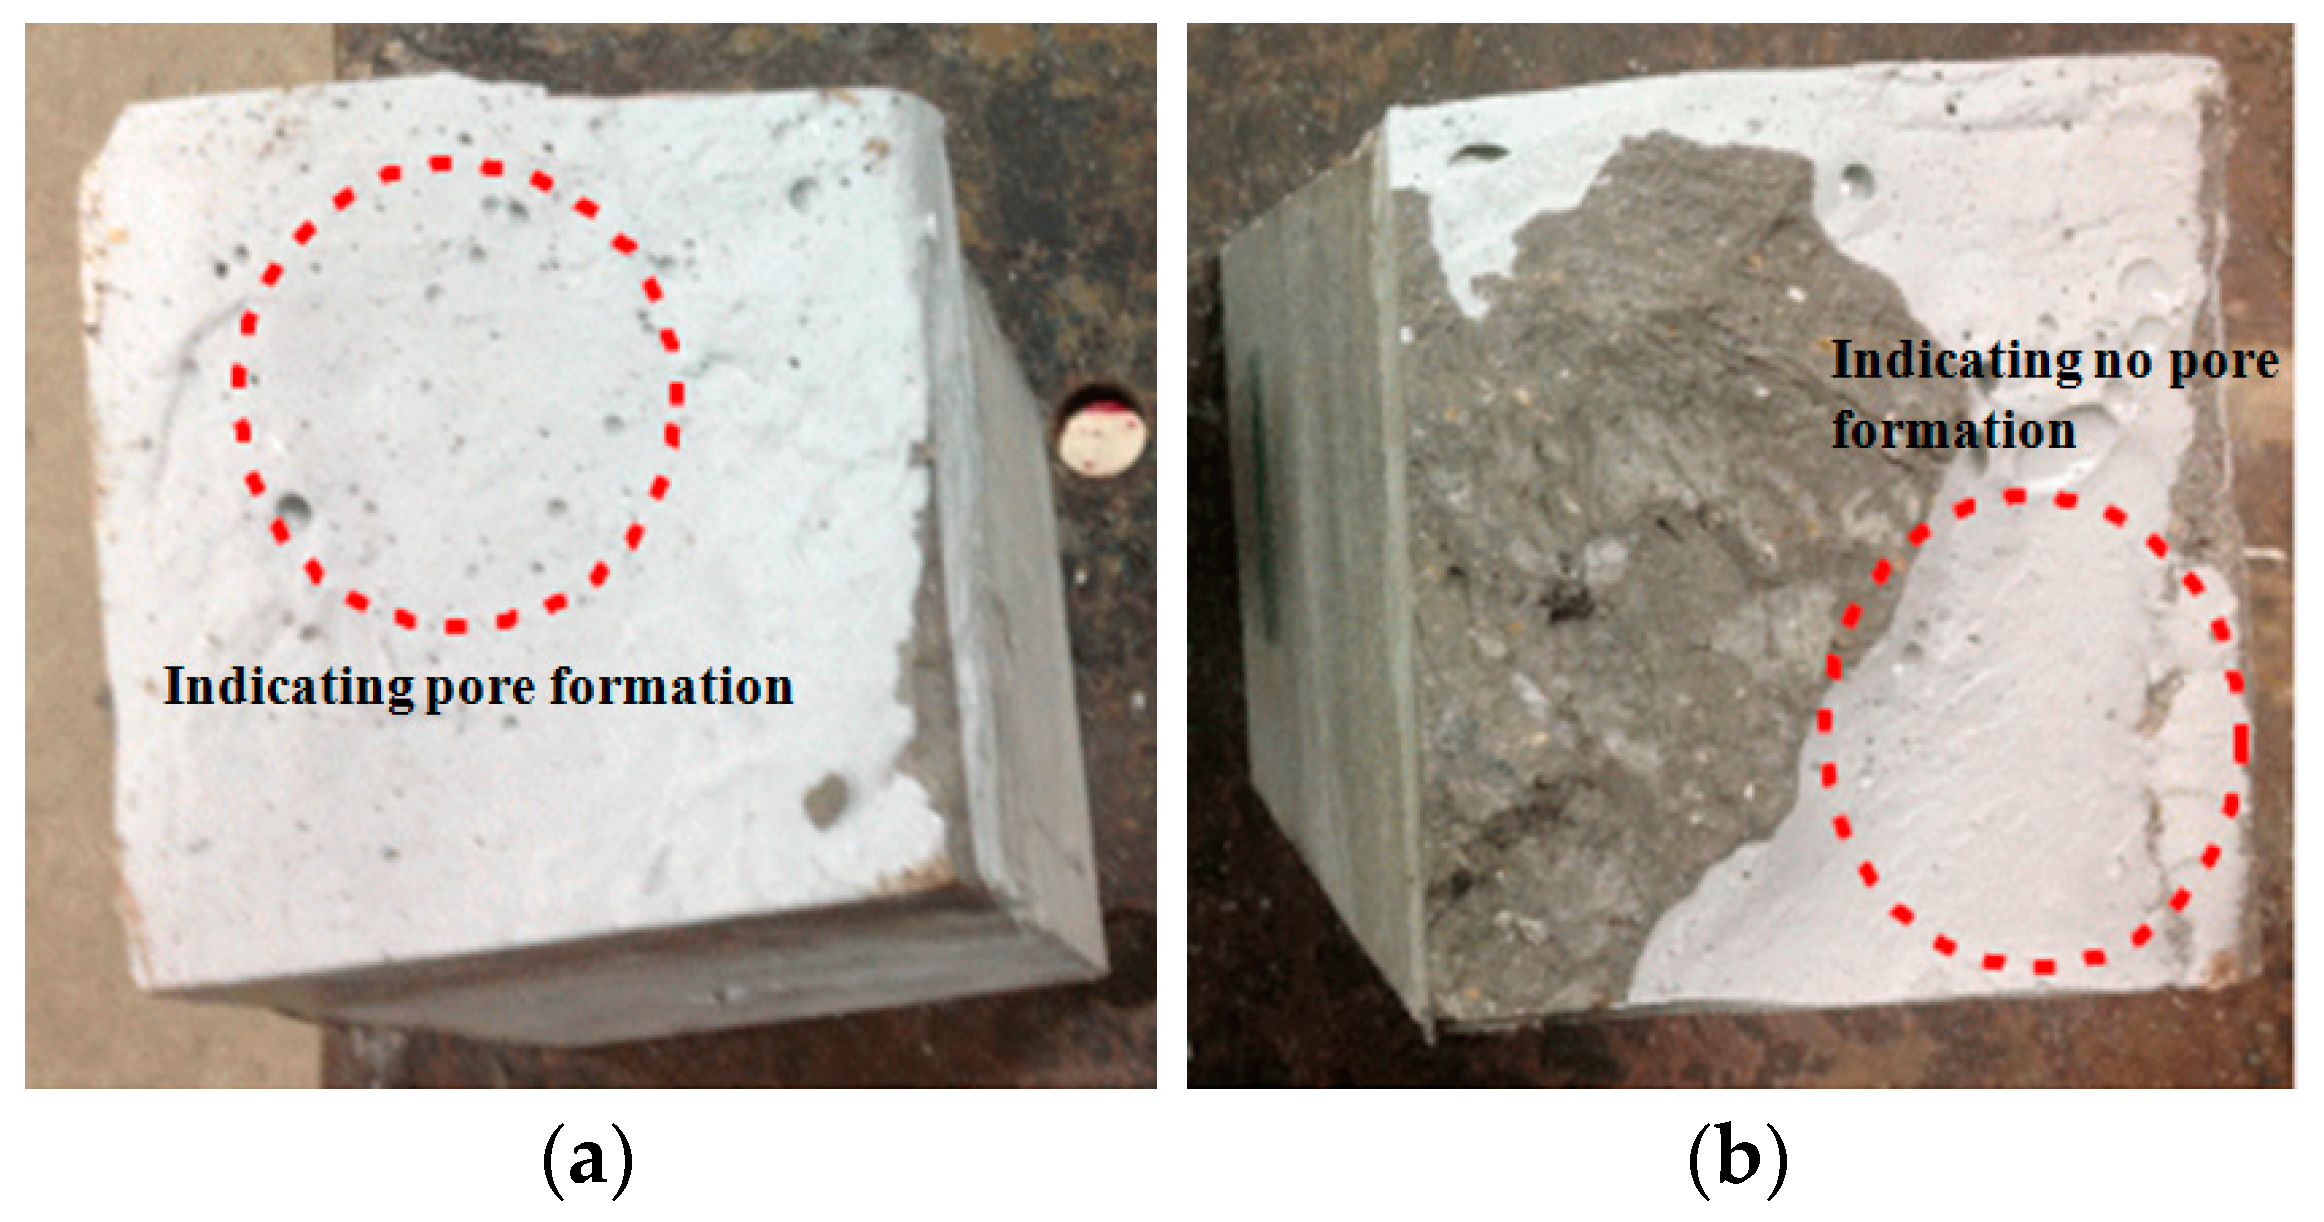
The proofs to the hypothesis of micro-silica filling of pores can be partly observed in the failure surface as shown in Figure 19. The failure section shown in Figure 19a,b show the existence of pores in AE without micro-silica and the reduction of pores with micro-silica, respectively. Of course, since the micro-pores are formed irregularly and inconsistently for each specimen, the reduction of micro-pores shown in Figure 19b may not be a direct visible proof of filling of pores by micro-silica. A more trustworthy proof might be obtained from the failure surface. As shown in Figure 19b, a portion of the concrete surface is visible due to MSAE spalling off (left gray part in Figure 19b) while the module attached with AE shows a full AE surface. This means that specimens connected with AE failed by detachment while specimens connected with MSAE failed by partial concrete spalling, resulting in an increased bonding capacity by 64% irrespective of the curing condition.
Figure 19. Interfacial fracture section and pore reduction (10 mm thickness); (a) non-MS; and (b) MSAE.
Polymers 07 01520 g019
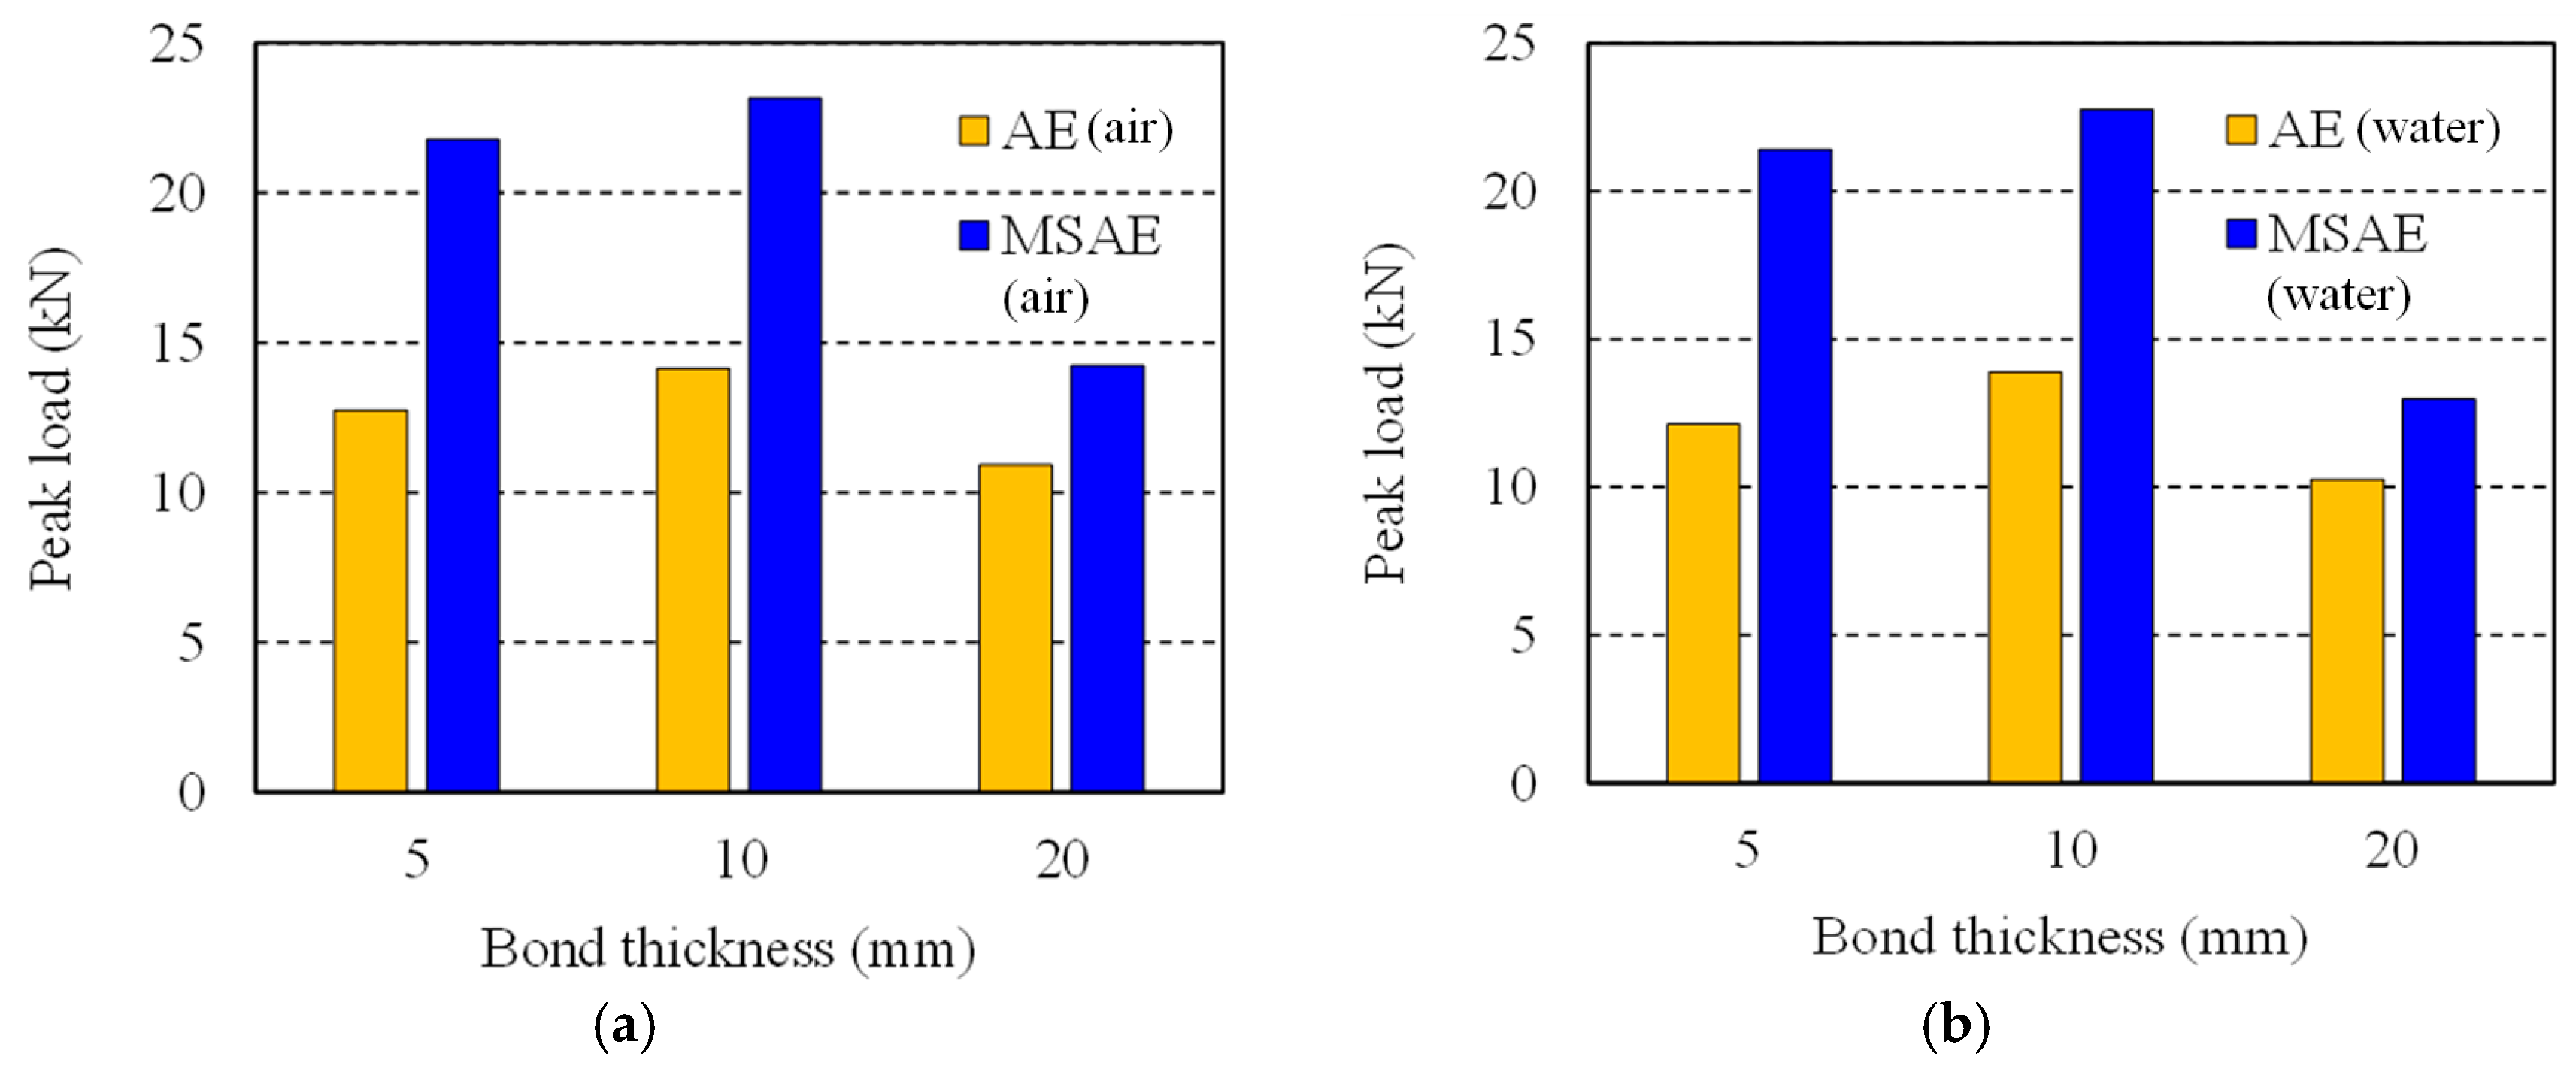
Figure 13b shows the test results for specimens bonded and cured underwater. Specimens plastered with MSAE and cured underwater showed higher capacities than the specimens bonded with AE. Even though the bonding capacities of specimens from the underwater condition decreased compared to the specimens formed in air, the reduction was only 4% on average for both specimens with and without micro-silica. Consequently, the results showed that the MASE can be applied successfully in sea conditions. Eliminating pores in a bonding material is very important when a structure is constructed and used at sea. If water particles in the pores undergo freeze-thawing action, cracking could occur in the epoxy matrix. Therefore, the reduction of micro-pores by adding micro-silica would significantly reduce the potential for cracking.
The bond thickness experiments showed that the maximum strength was obtained when the thickness was 10 mm. When the thickness was 5 mm, the load-carrying capacity was lower than that at 10 mm. The lowest load was obtained when the thickness was 20 mm. This phenomenon does not seem to be a material issue, but a structural issue. When the epoxy thickness is higher, shear and flexural stresses are generated on the interface due to the fact that a greater thickness translates into a larger weak zone in the middle of the specimen because the strength of the interface is independent of the interface thickness. However, this result is insignificant, because the capacity for bond thickness in a bonded concrete block will change depending on specimen size, loading scheme, etc. Also, since PS was applied to connect the modulus, the bond thickness does not directly dictate the overall bond behavior of the structure. The test results showed that the load-carrying capacity of the specimens with MSAE was enhance due to overall improvement in the integrity of the bonded interface increased by adding micro-silica in AE.

4.2. PSC Structural MSAE Bond Performance Discussion

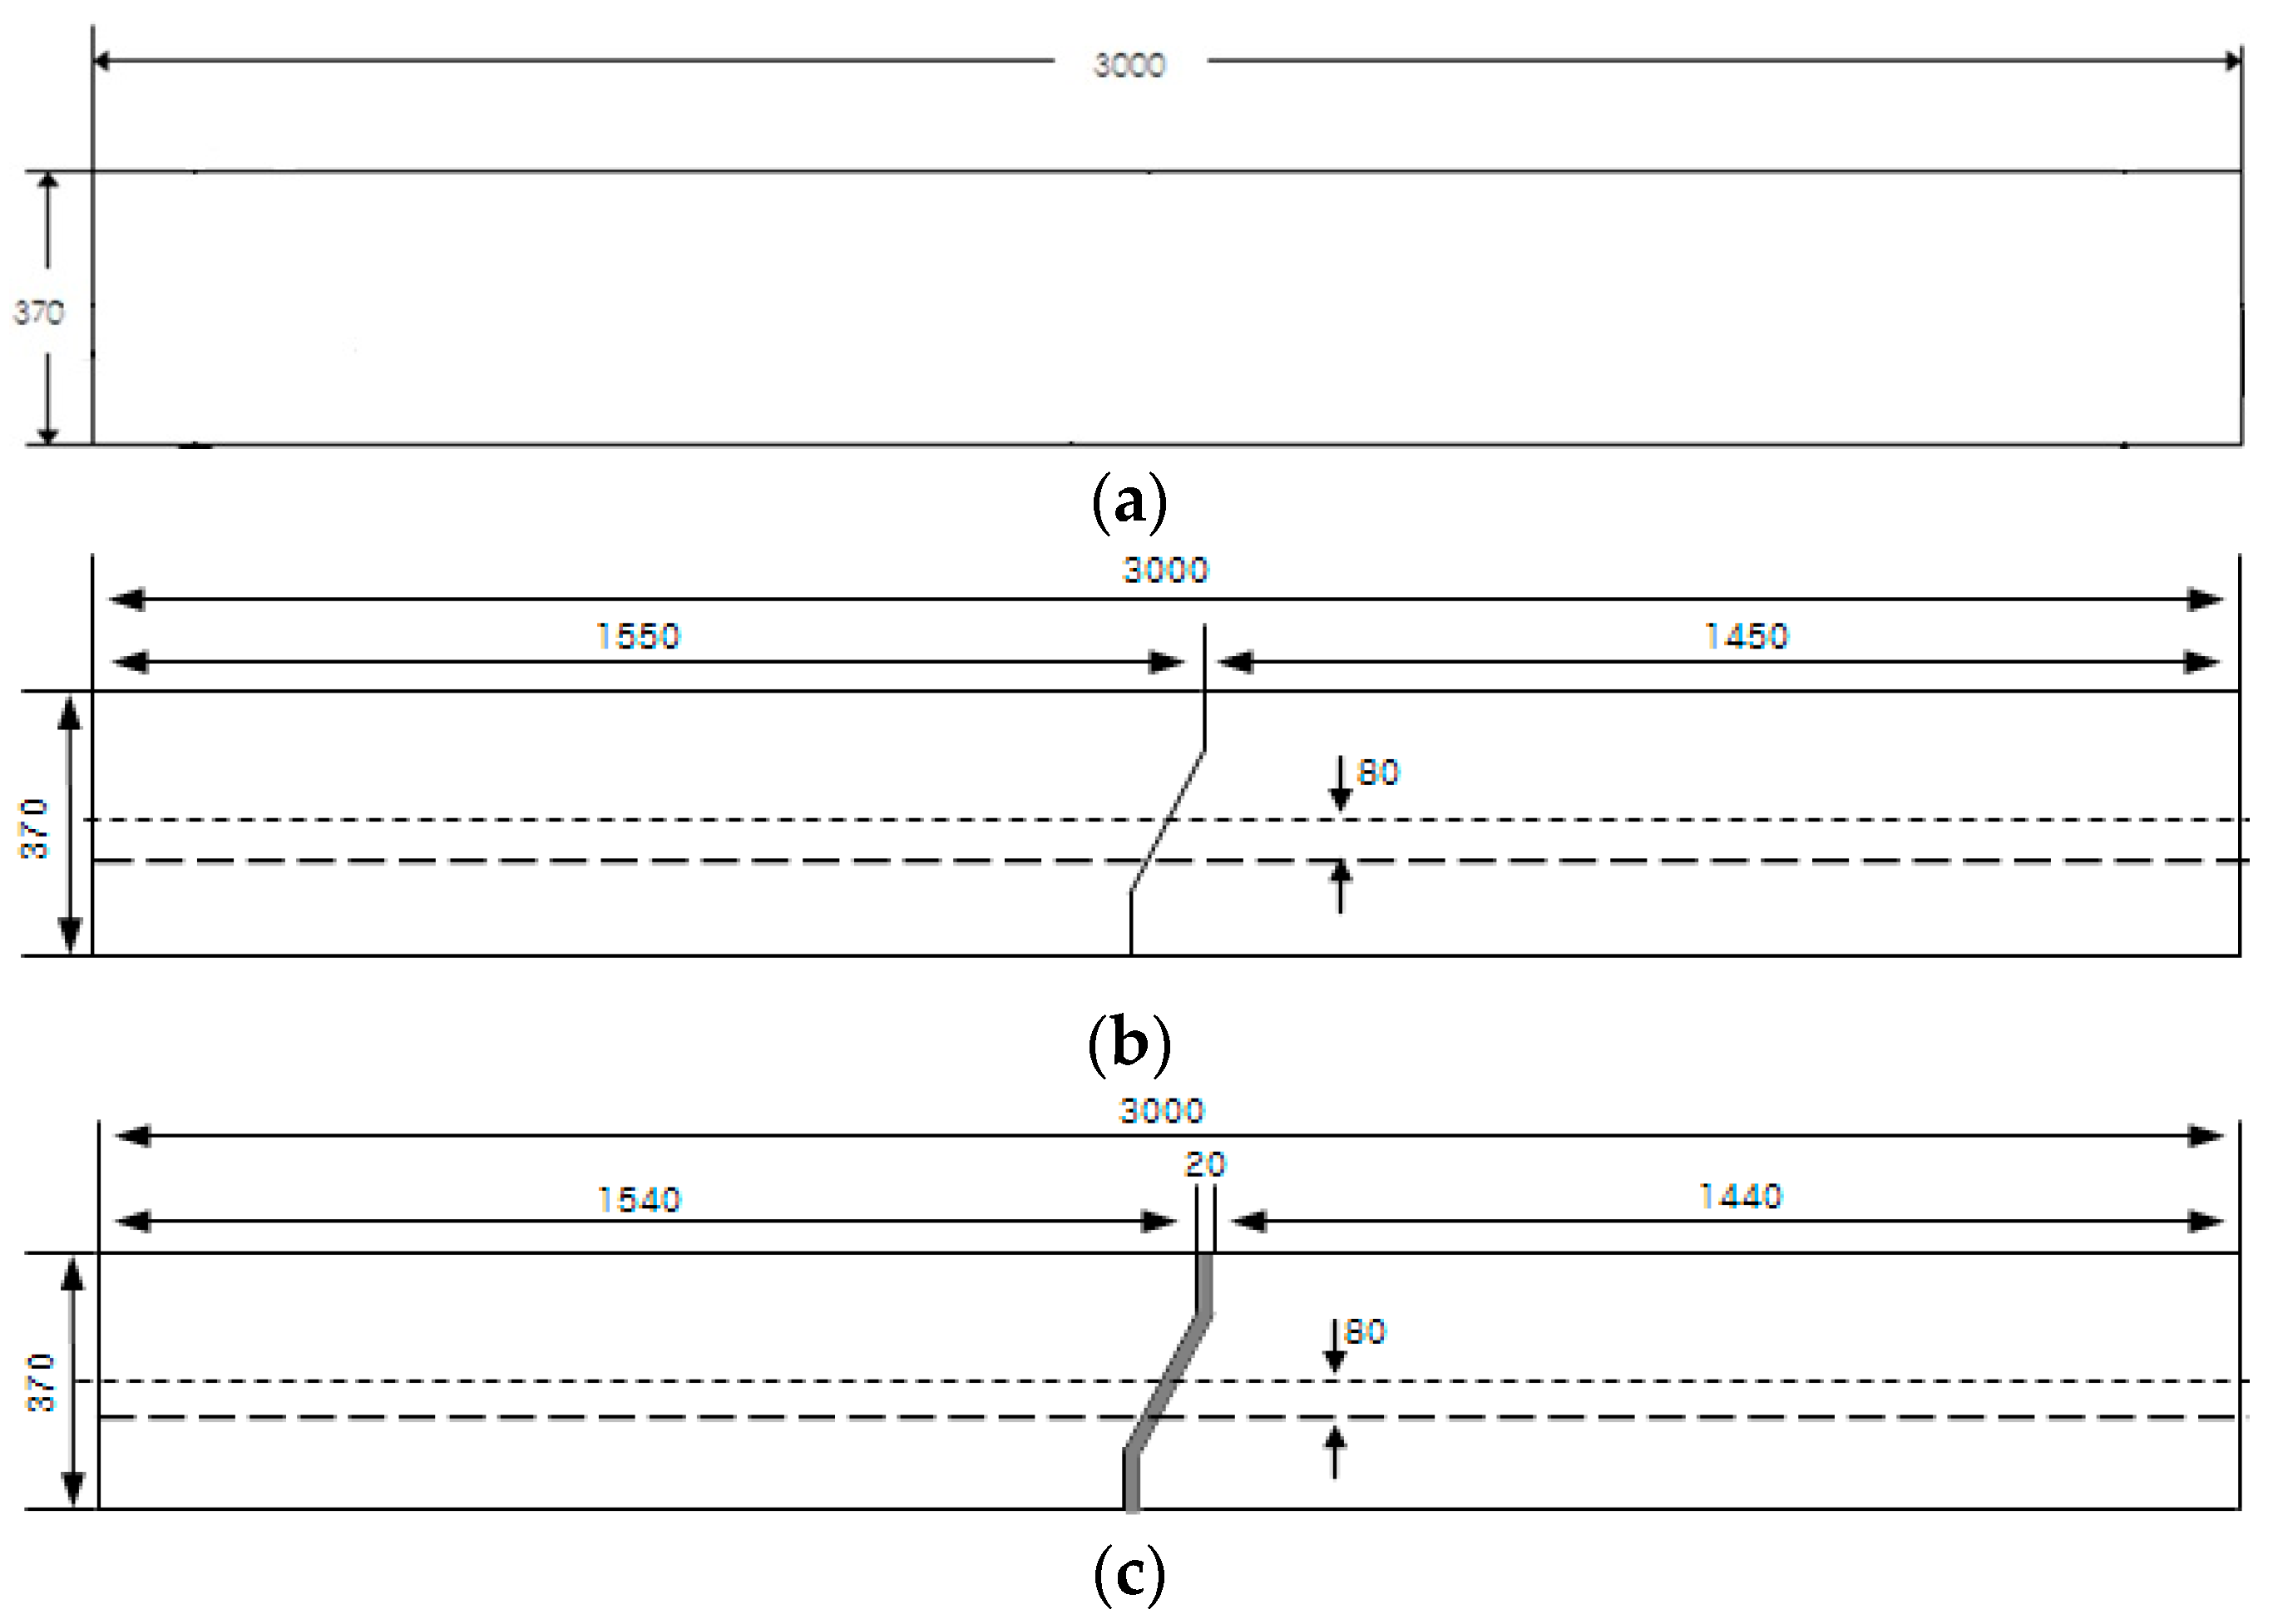
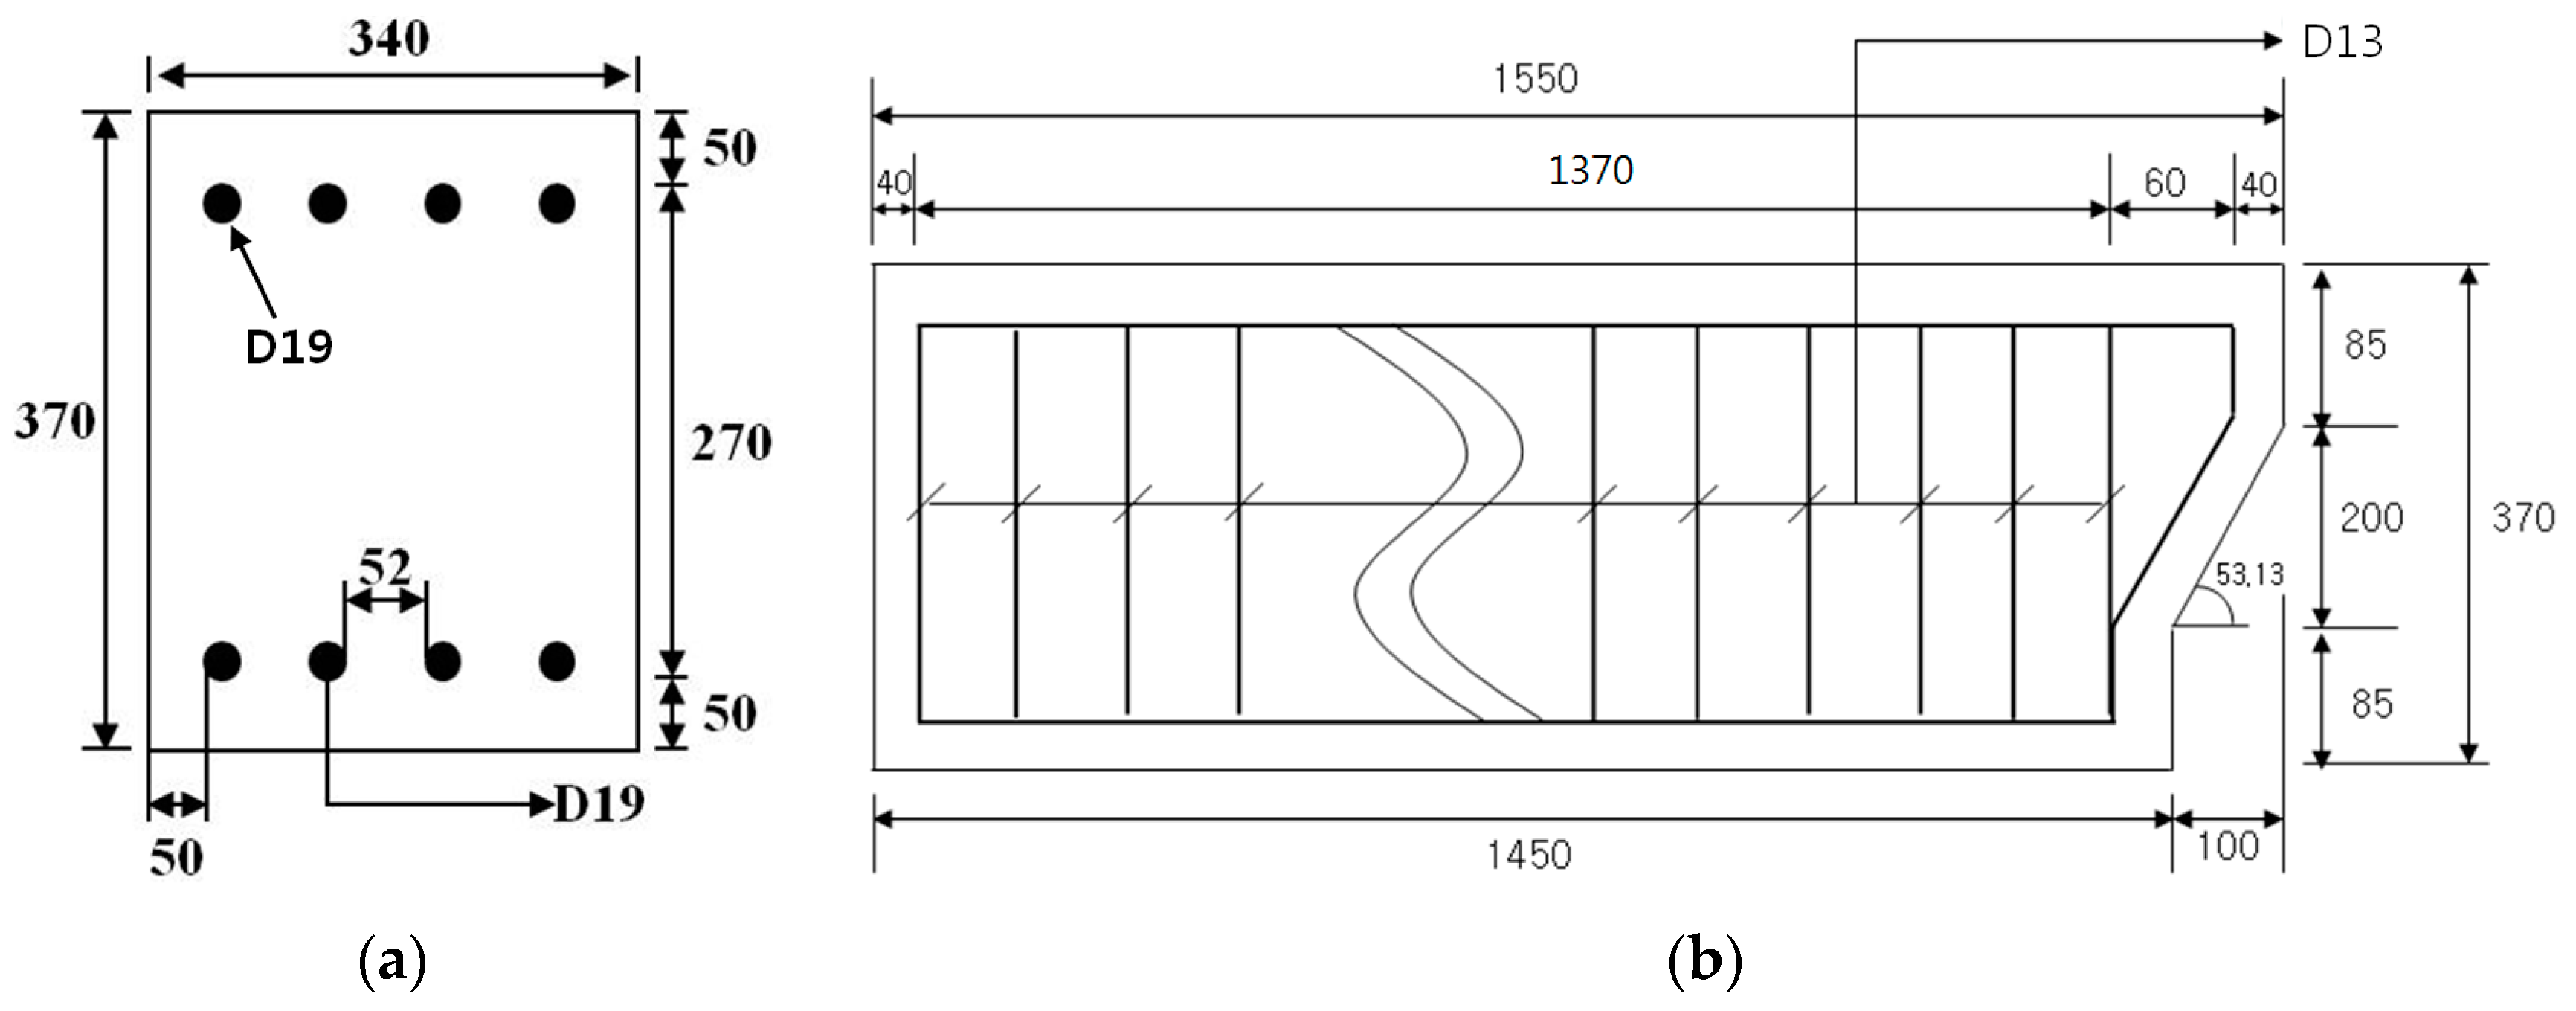
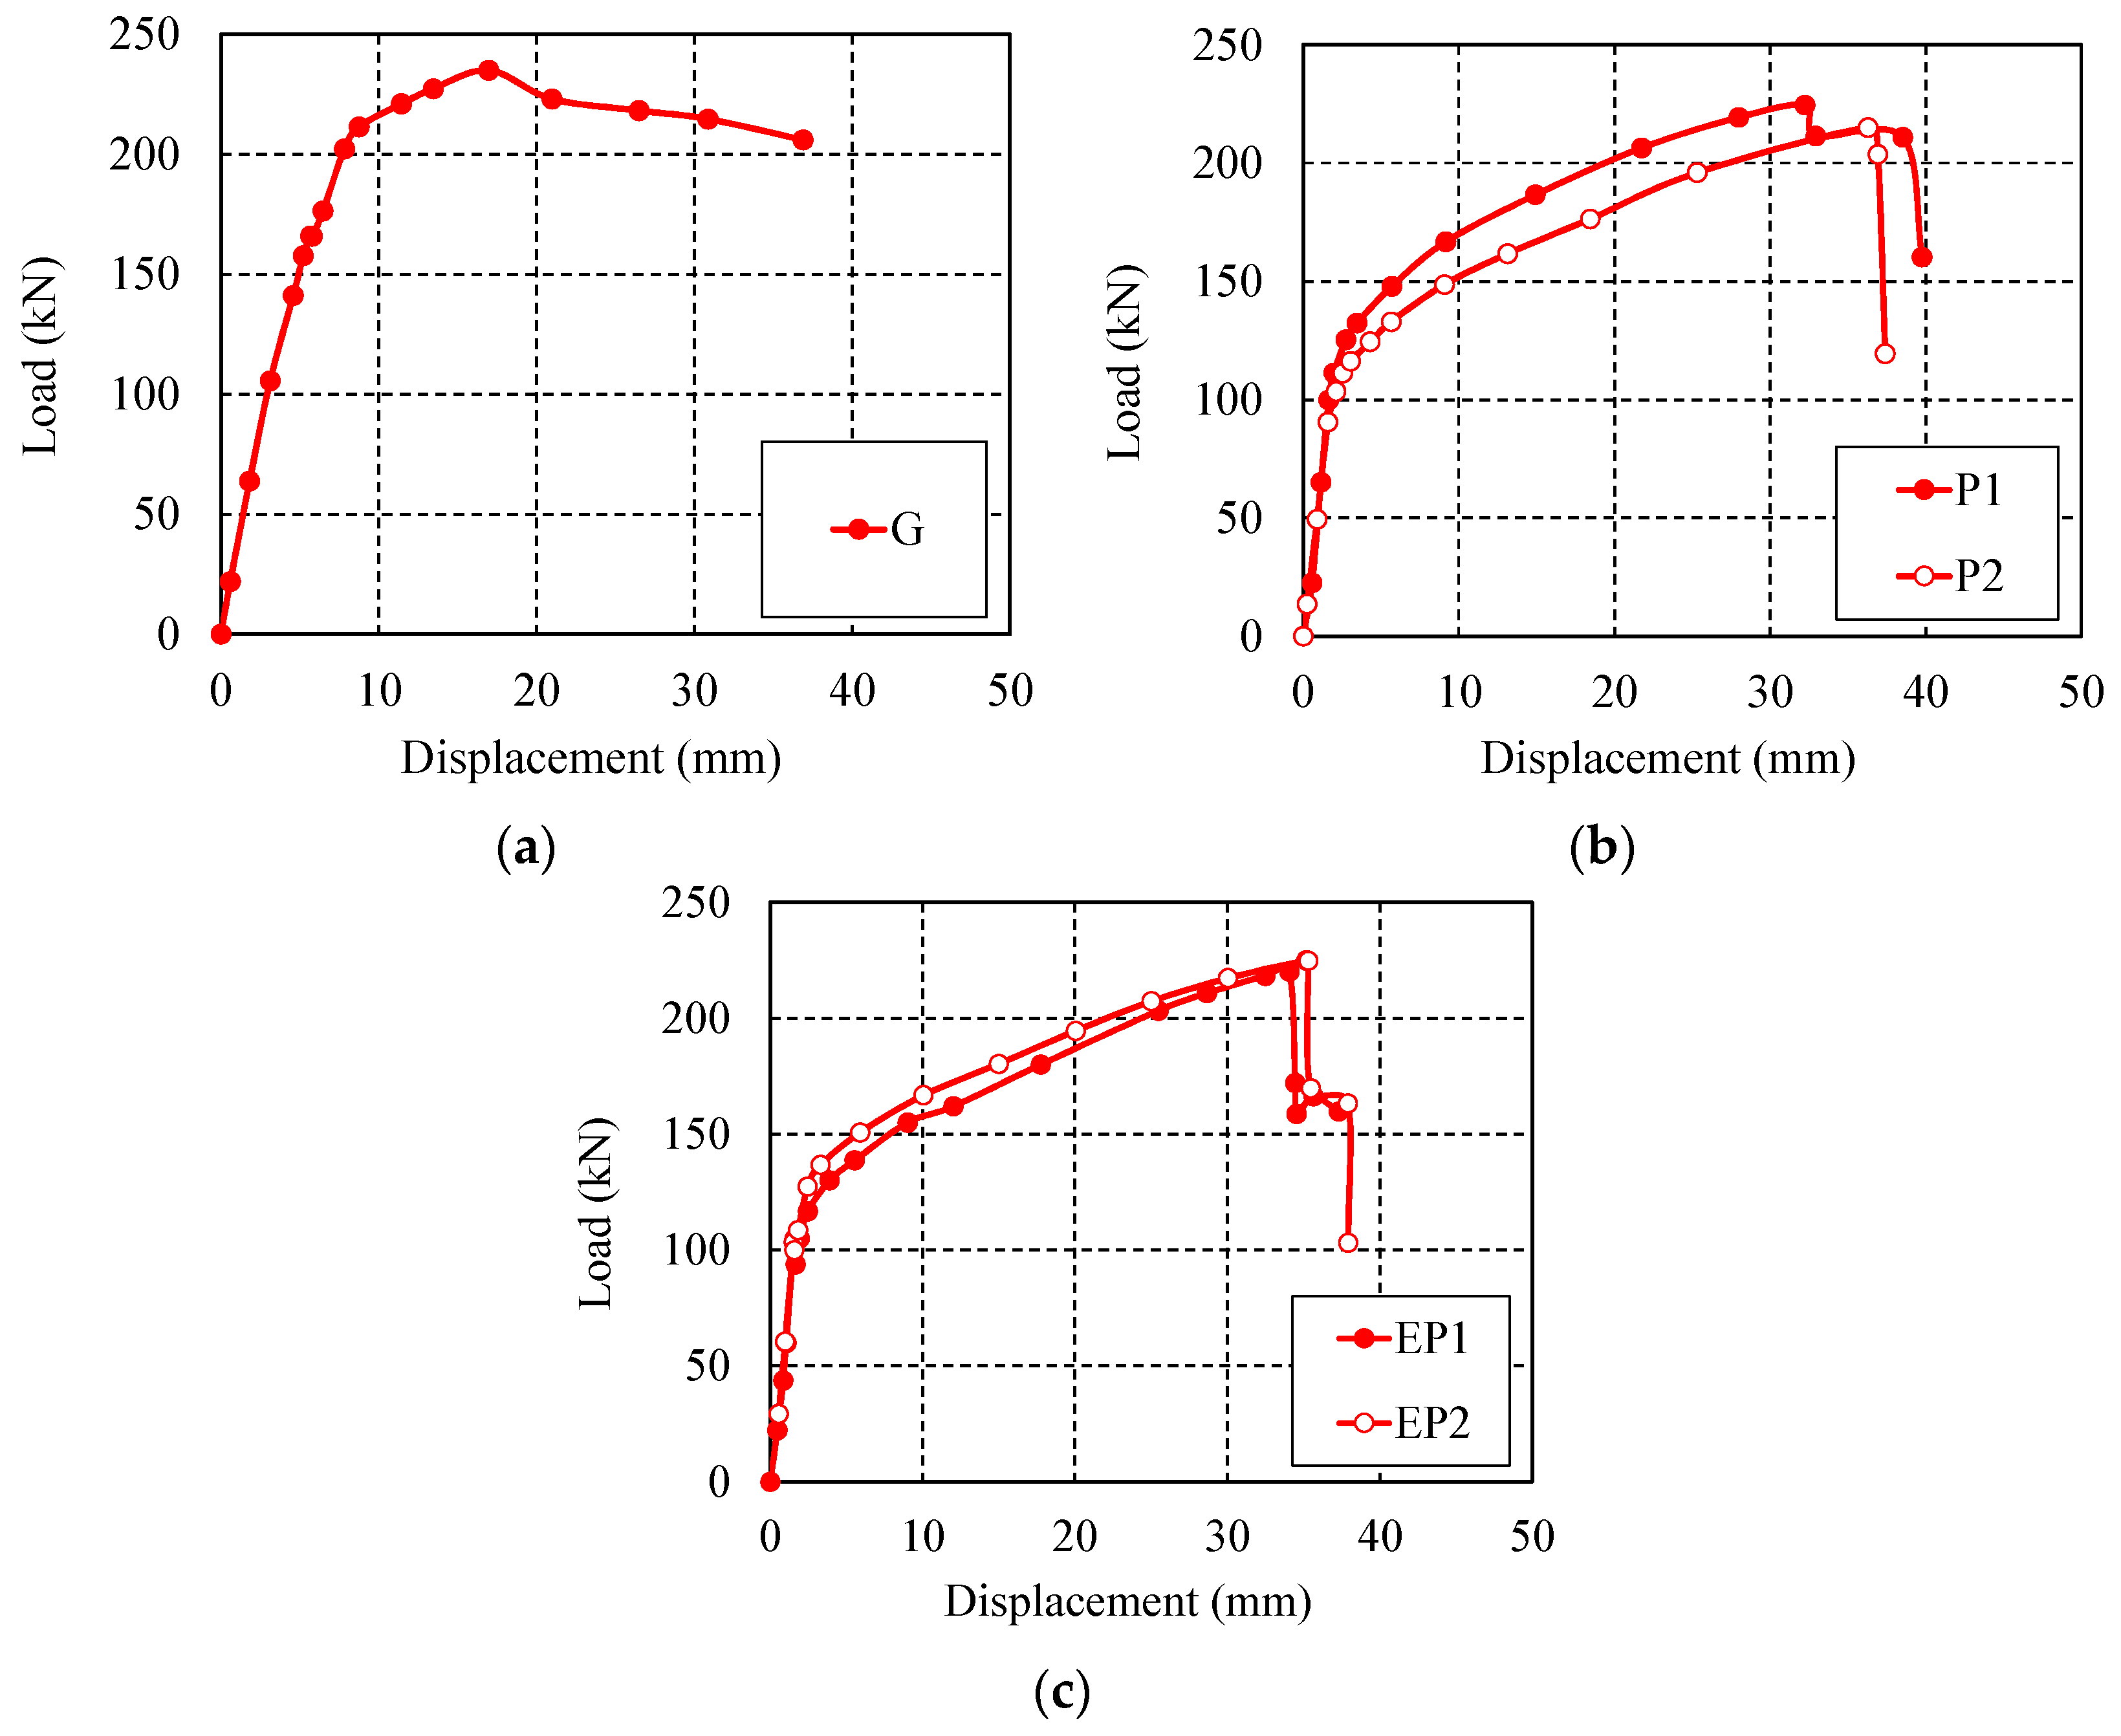
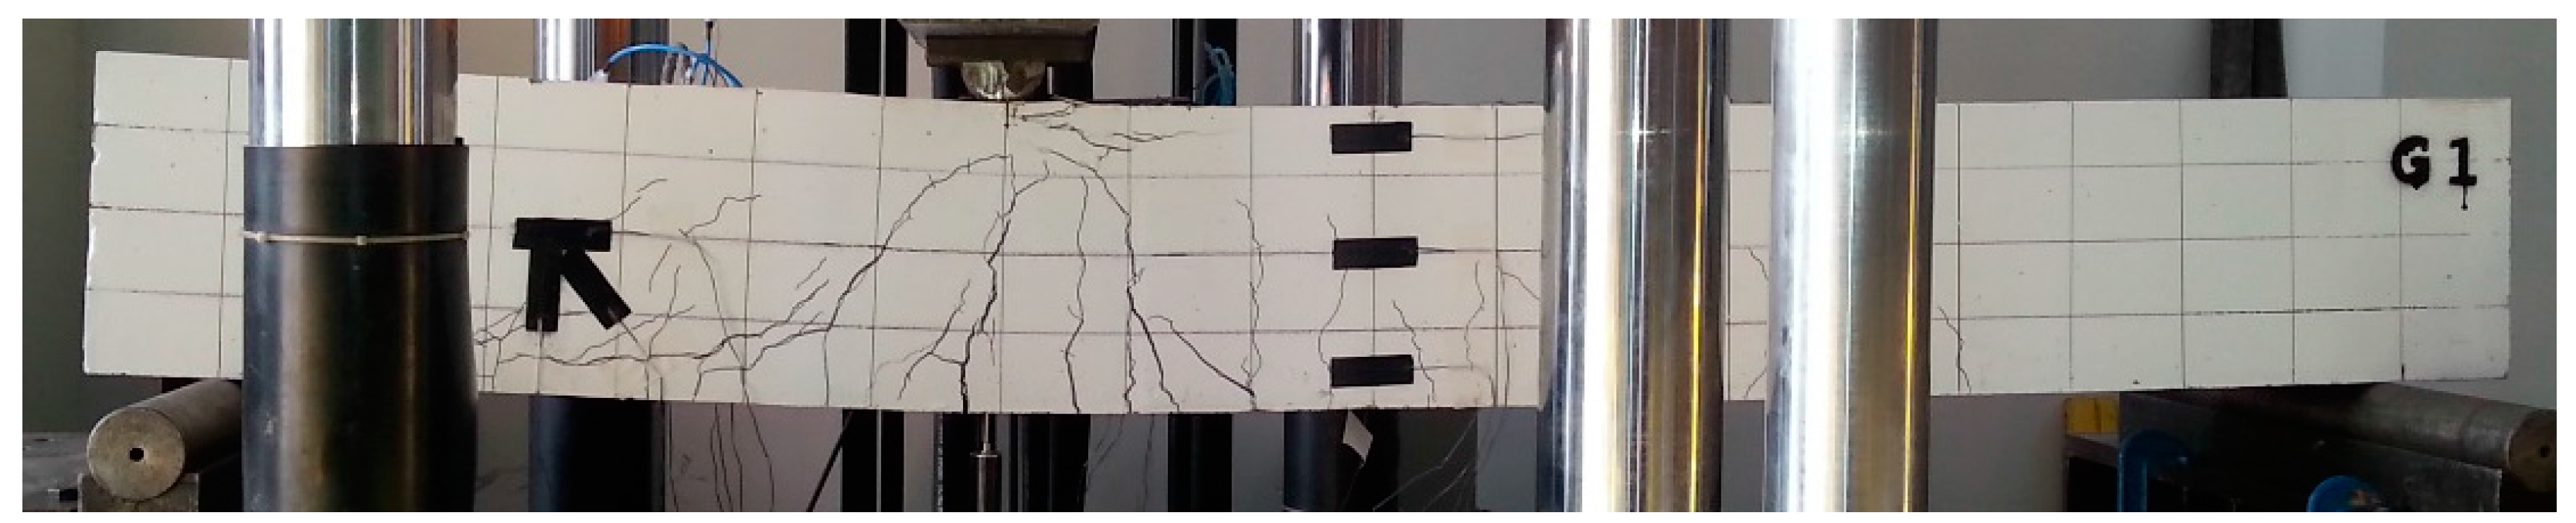
A comparison of the test results of P and EP specimens with those of the G (control) specimen showed that P and EP specimens had very similar load-carrying capacities of the G specimens. The maximum deflections of P and EP were different from that of the G specimens due to the difference in structural rigidity of RC and PSC. Since the specimens with splicing do not have continuity along the span, P and EP showed a large deflection. However, a relatively larger deflection could be better for a very large concrete module structure floating on the sea because it can absorb larger wave-induced energy. With respect to load-carrying capacity, the results showed that a spliced beam connected by PS could have the same structural capacity as that of a continuous beam.
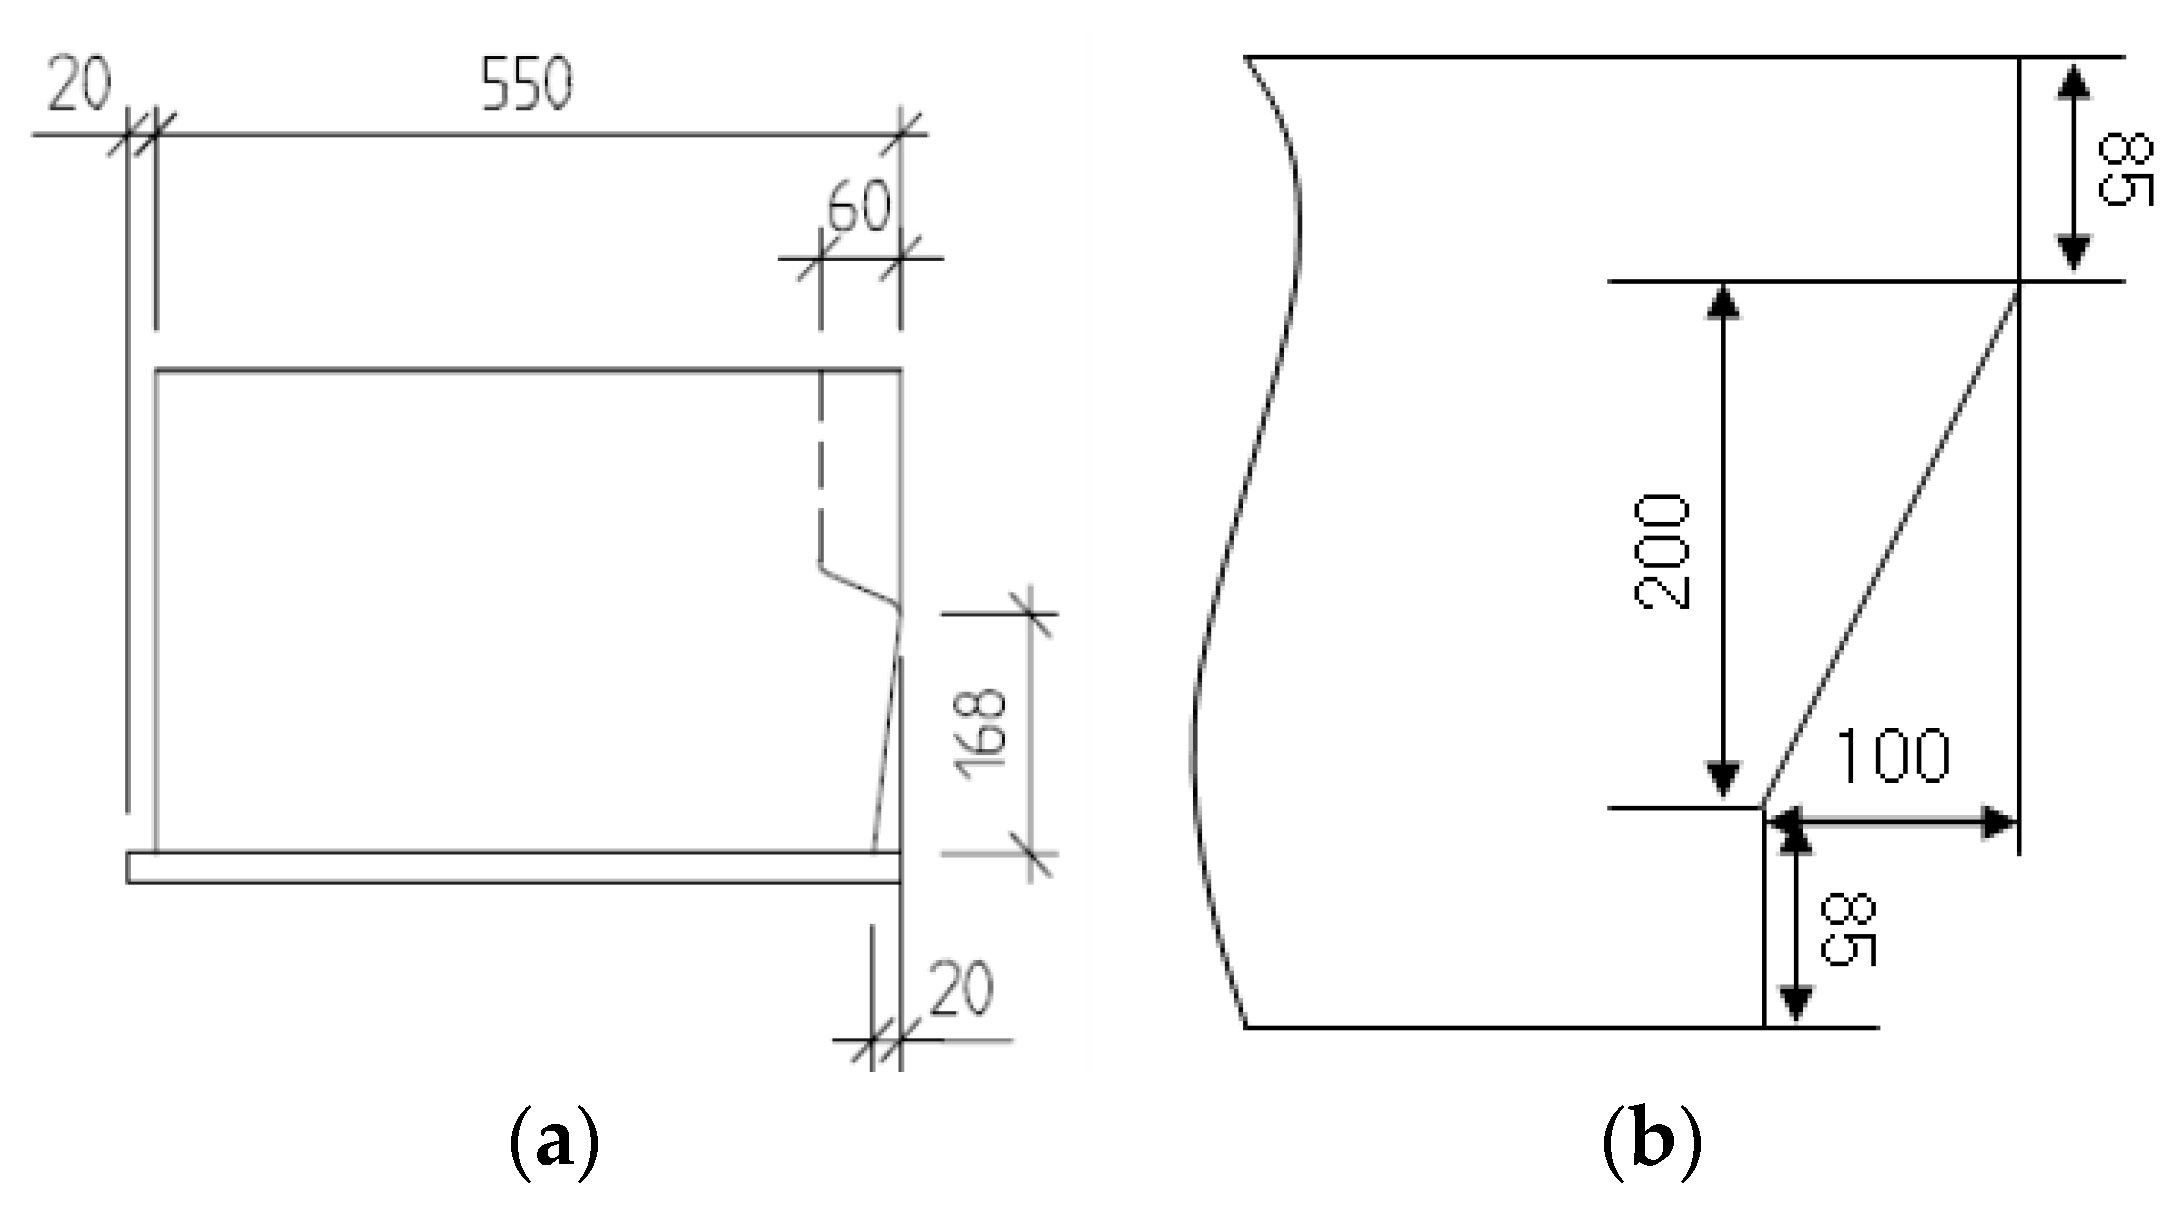
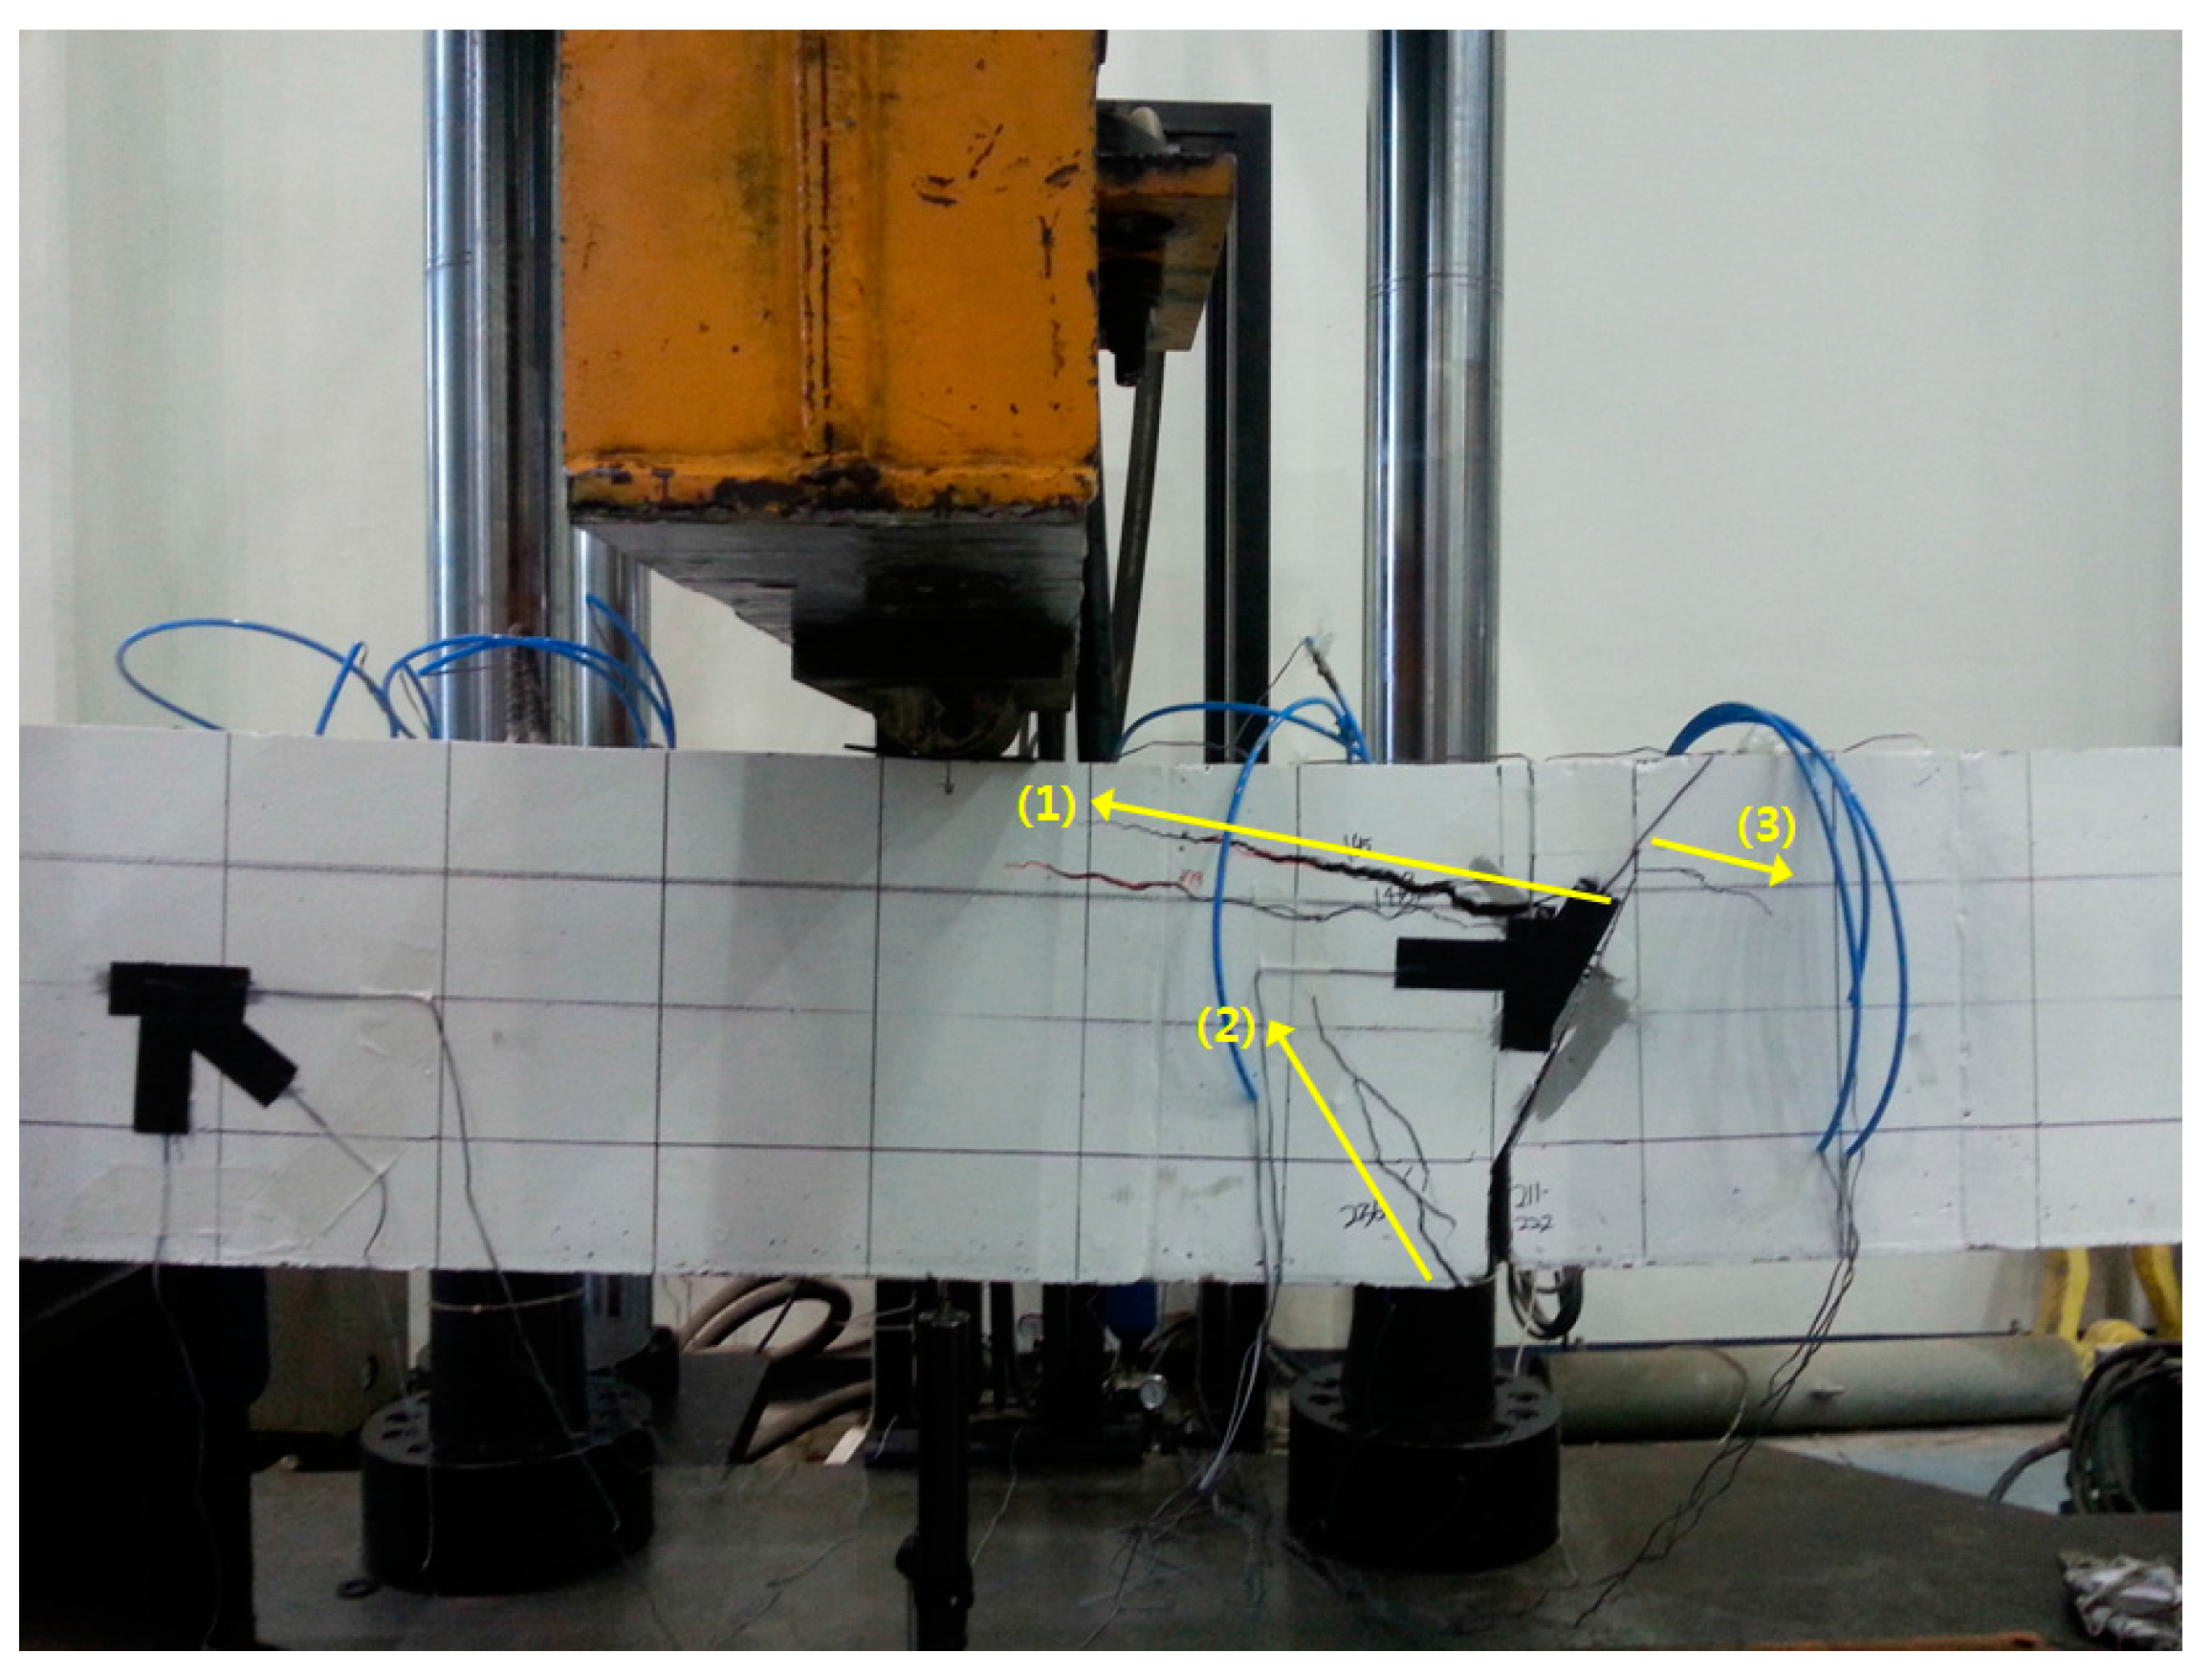
The effect of MSAE can be estimated by comparing P and EP series. We anticipated that MSAE would significantly contribute to stress distribution at the interface because it has a higher, stronger tensile strength than that of concrete. As the load increased, the interface opening was wider in P specimens than in EP specimens because the interface was not bonded. When the unbonded opening increased in P specimens, initial cracking occurred at the apex due to the stress concentration at the location. As the load increased, the inclined section below the apex shifted upward and interlocked with the right module. These movements caused the bottom interface to open and crack (2) to develop. Due to stress release at the inclined section away from crack (2), the stress concentration shifted to the top part of the beam and crack (3) occurred. Even though this stress concentration can be eliminated by securing a perfect fit at the interface of two concrete modules, it is practically impossible to create a perfect interface due to the material characteristics of concrete.
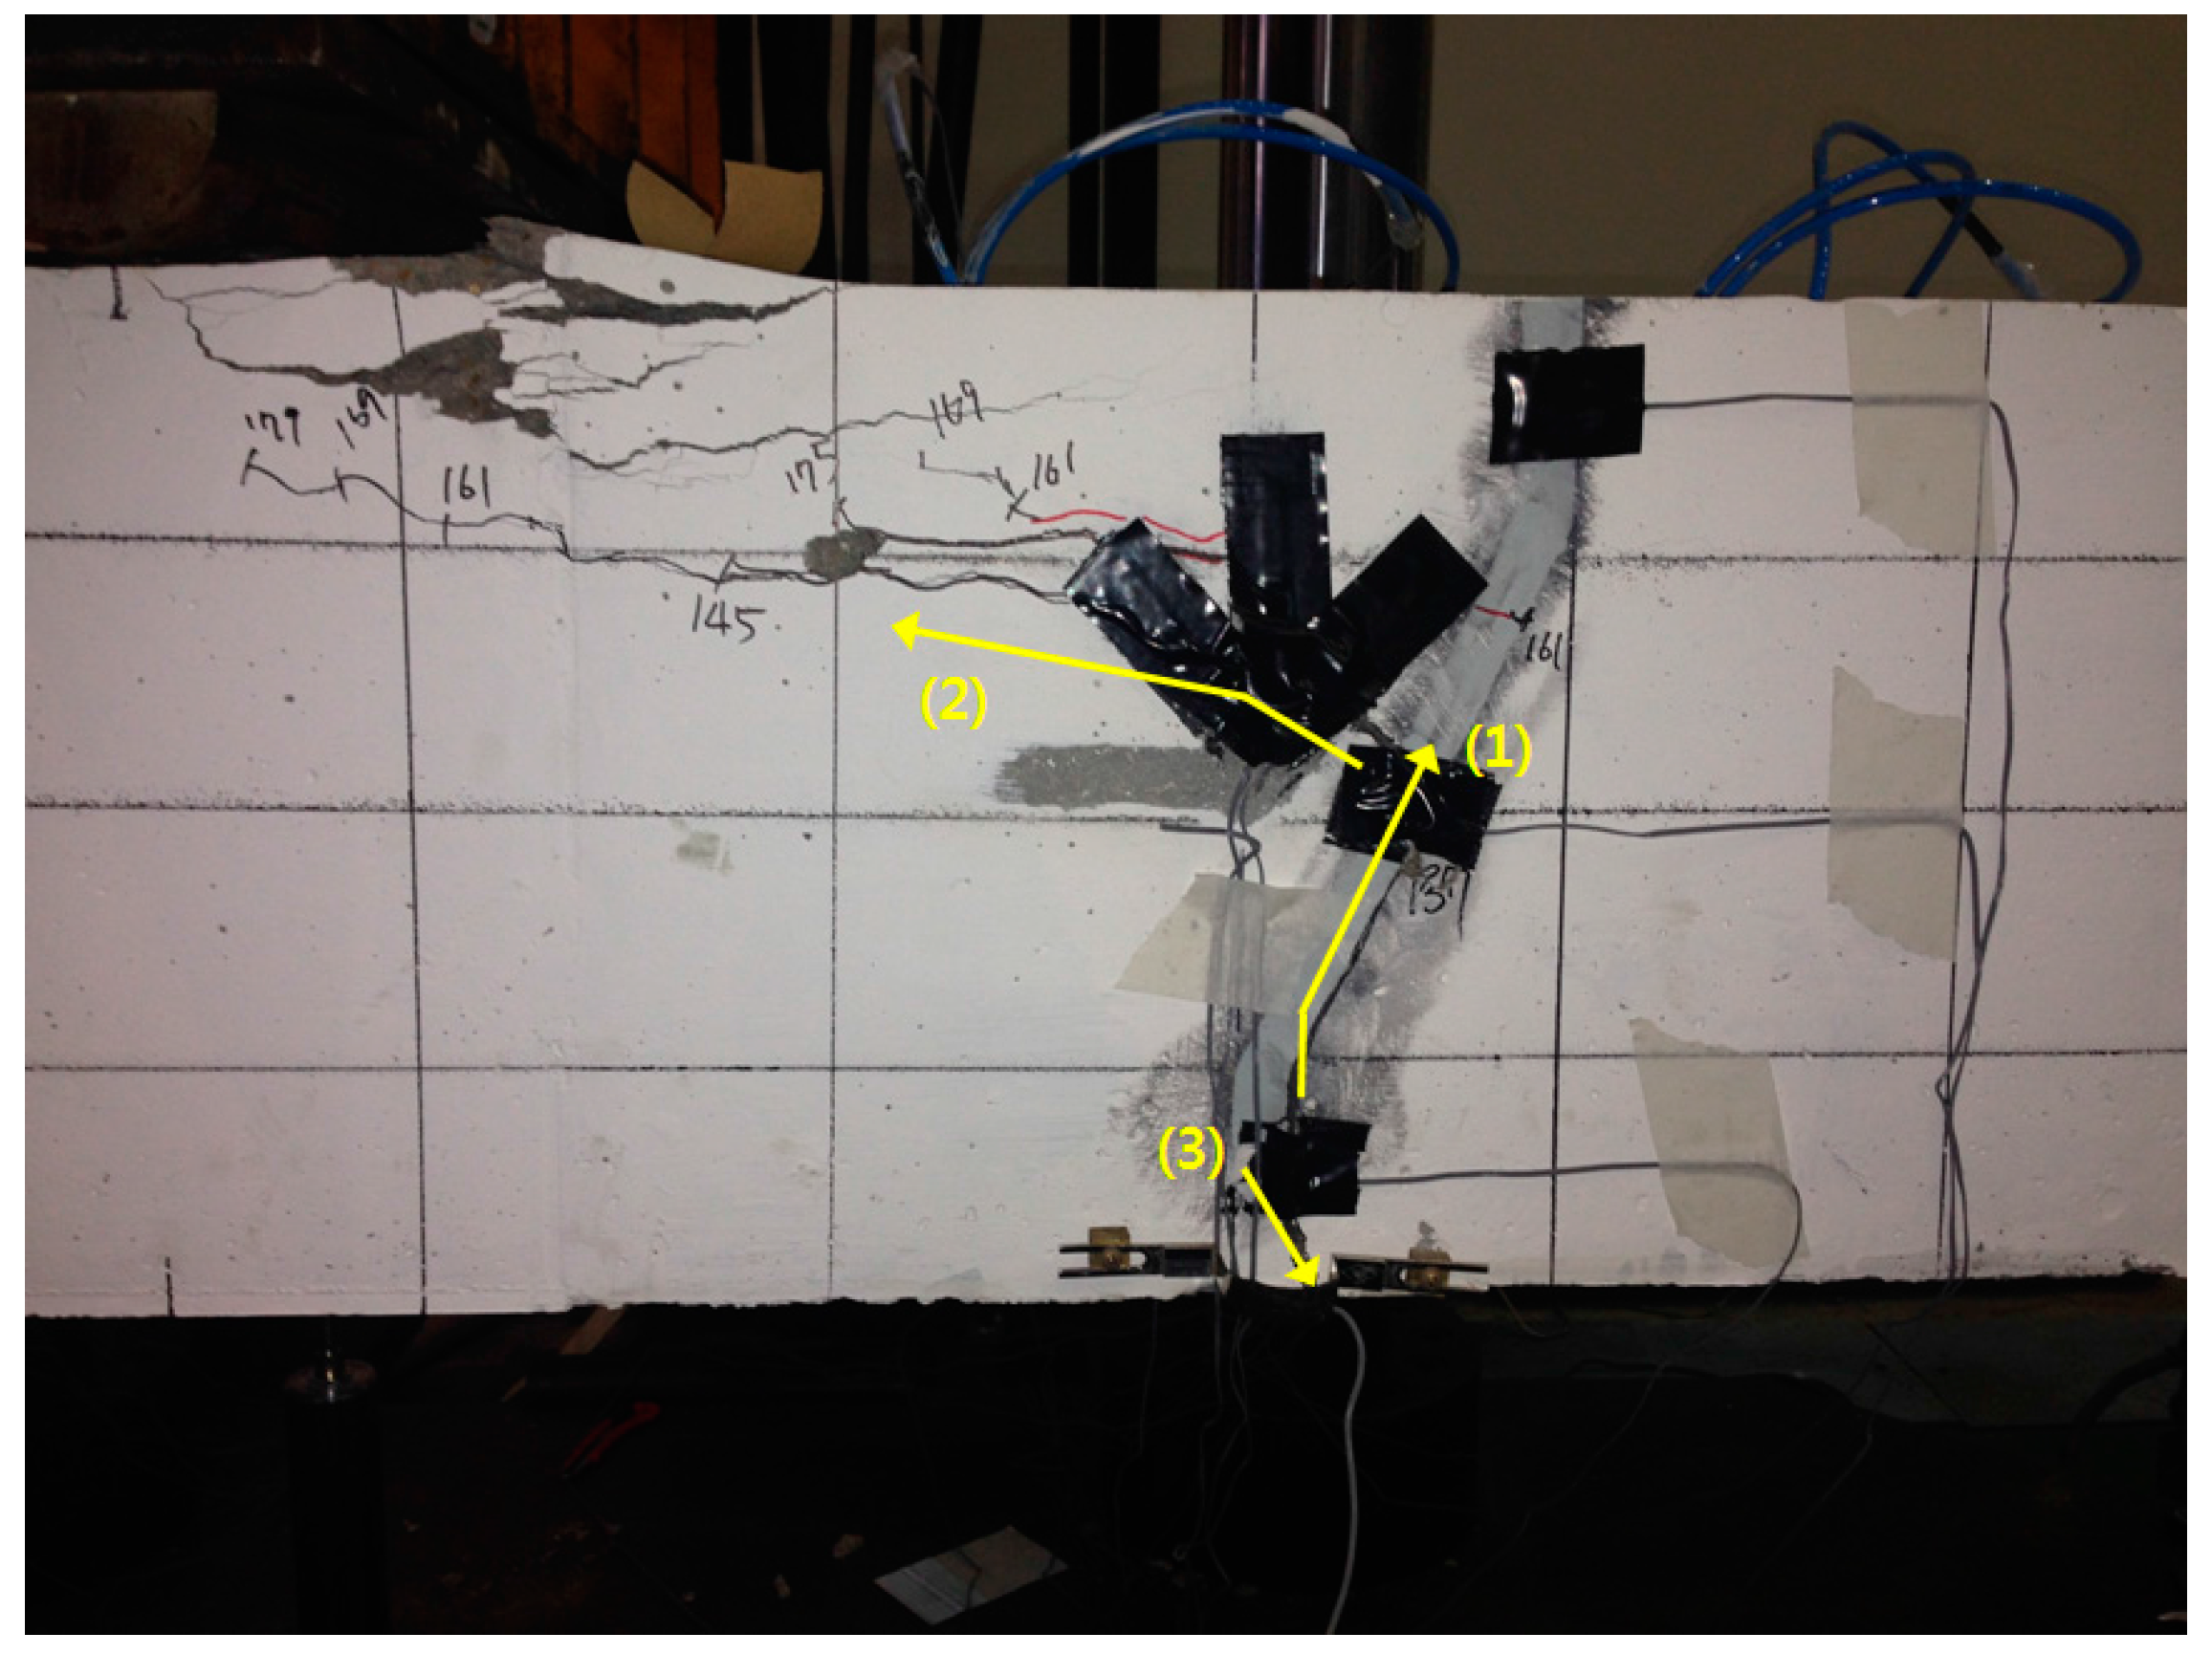
For the EP specimens bonded by MSAE, the interface opening did not start before initial cracking. As the load increased, debonding at the bottom region and sliding occurred at the middle of the inclined section of the interface, which led to cracking on the left-hand side as shown in Figure 17. Even though the final crack patterns of P and EP specimens seemed to be similar, the location of the main cracks was different. It is important to note that the main crack location is critical to structural safety and durability.
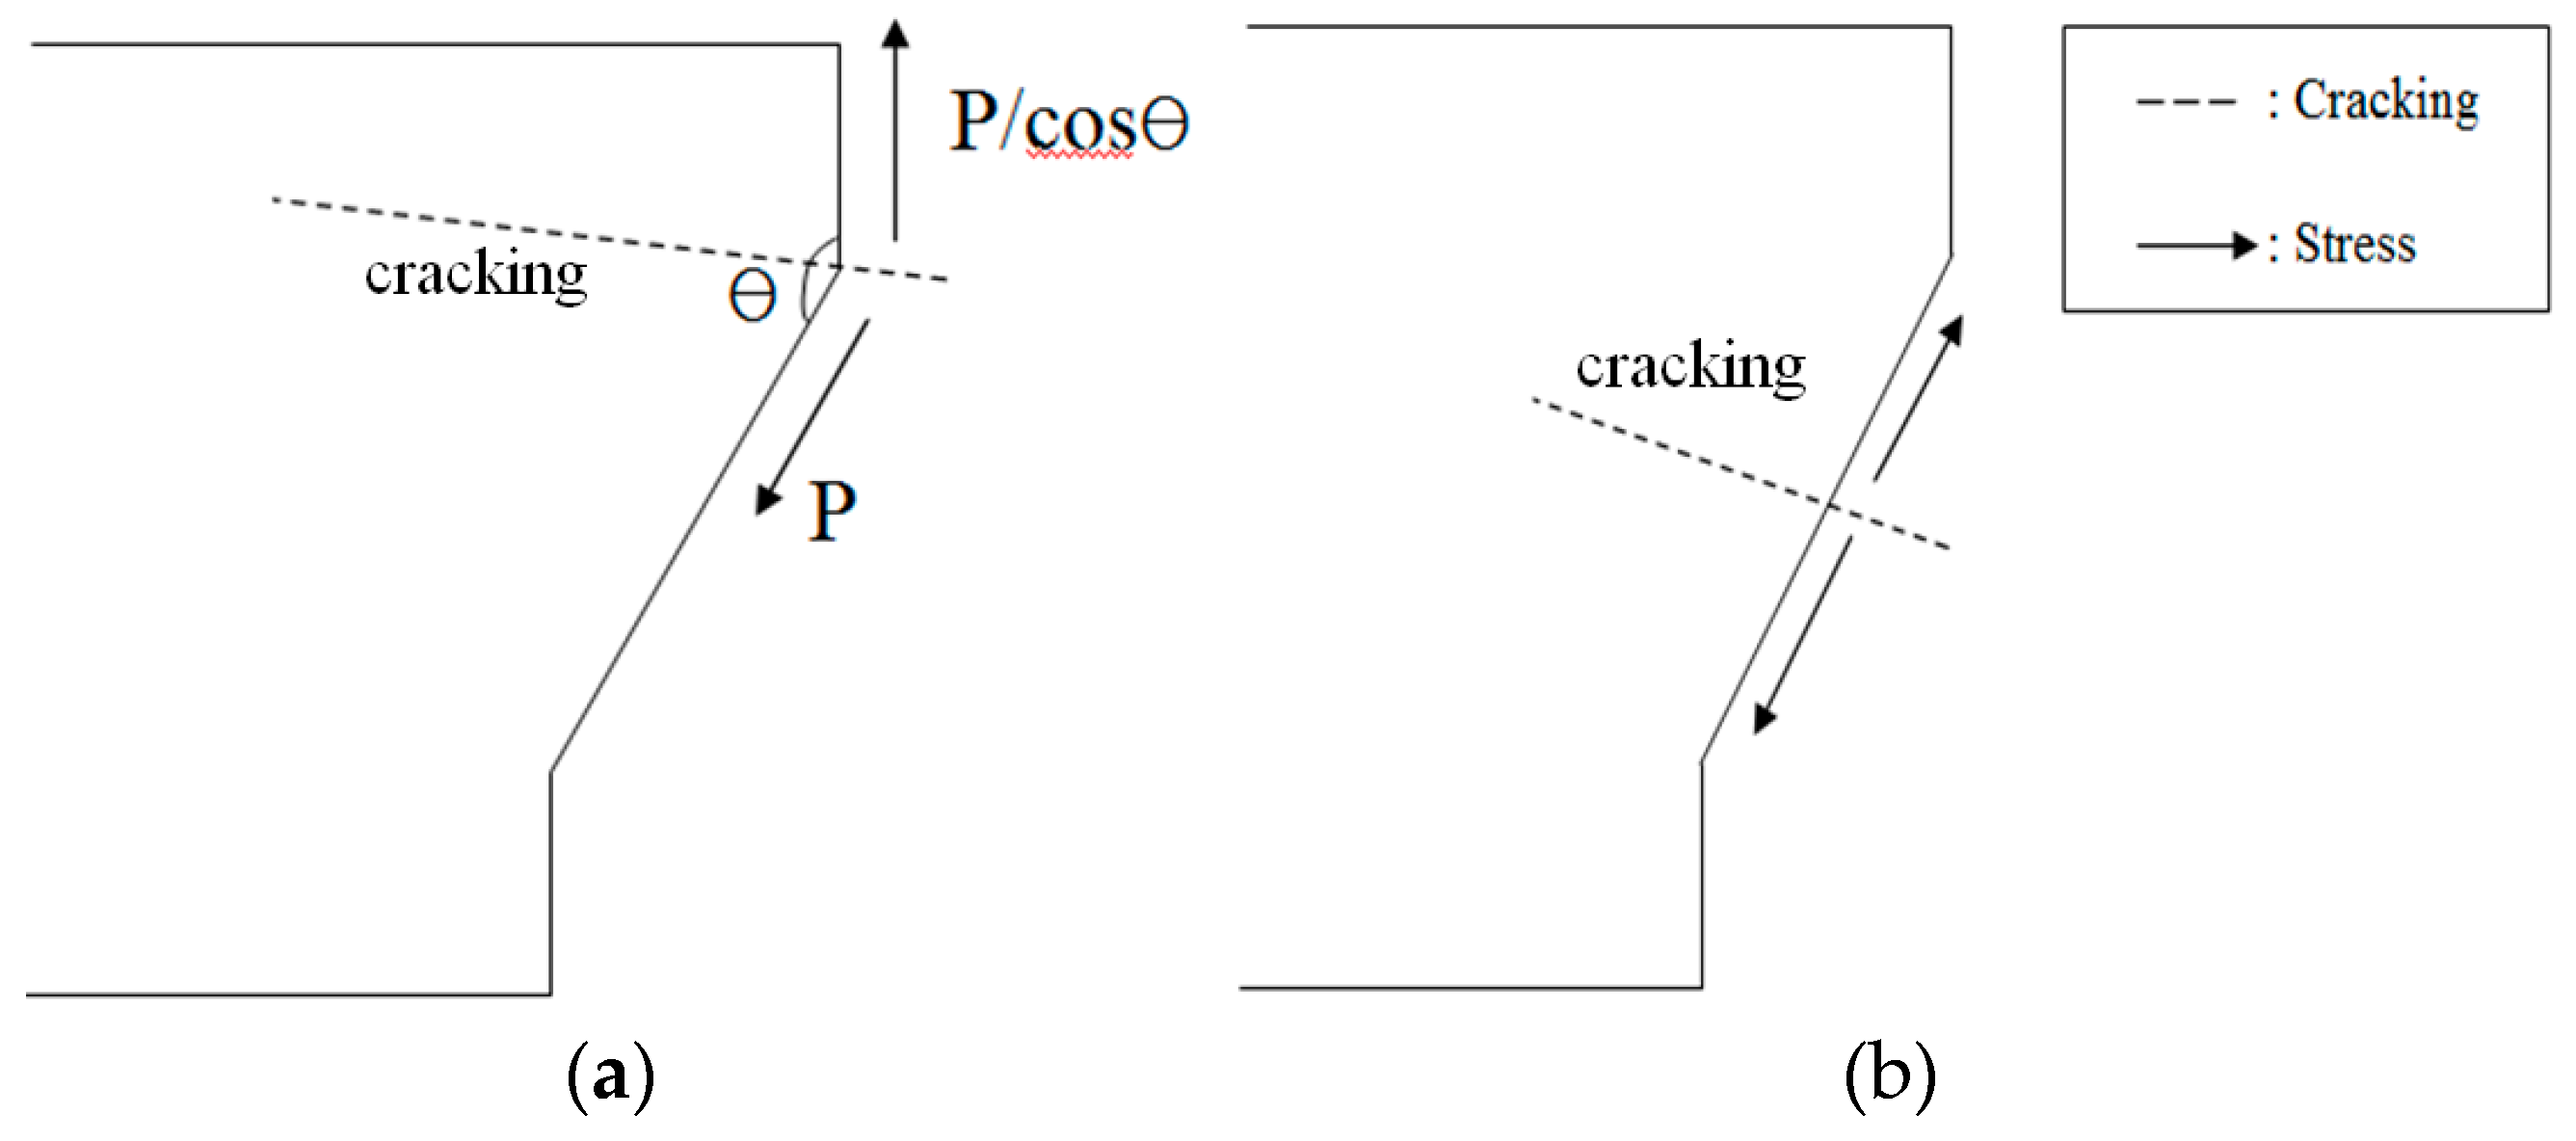
In Table 12 and Figure 20, the stress transmission processes of the P and EP series were compared. This comparison showed that the application of MSAE dictated the location of the cracking, and the stress transfer magnitude across the rebars was reduced from P to Pcosθ. Also, MSAE bonding prevented slip behavior from occurring at the interface, so the transmission of the stress was maintained. 
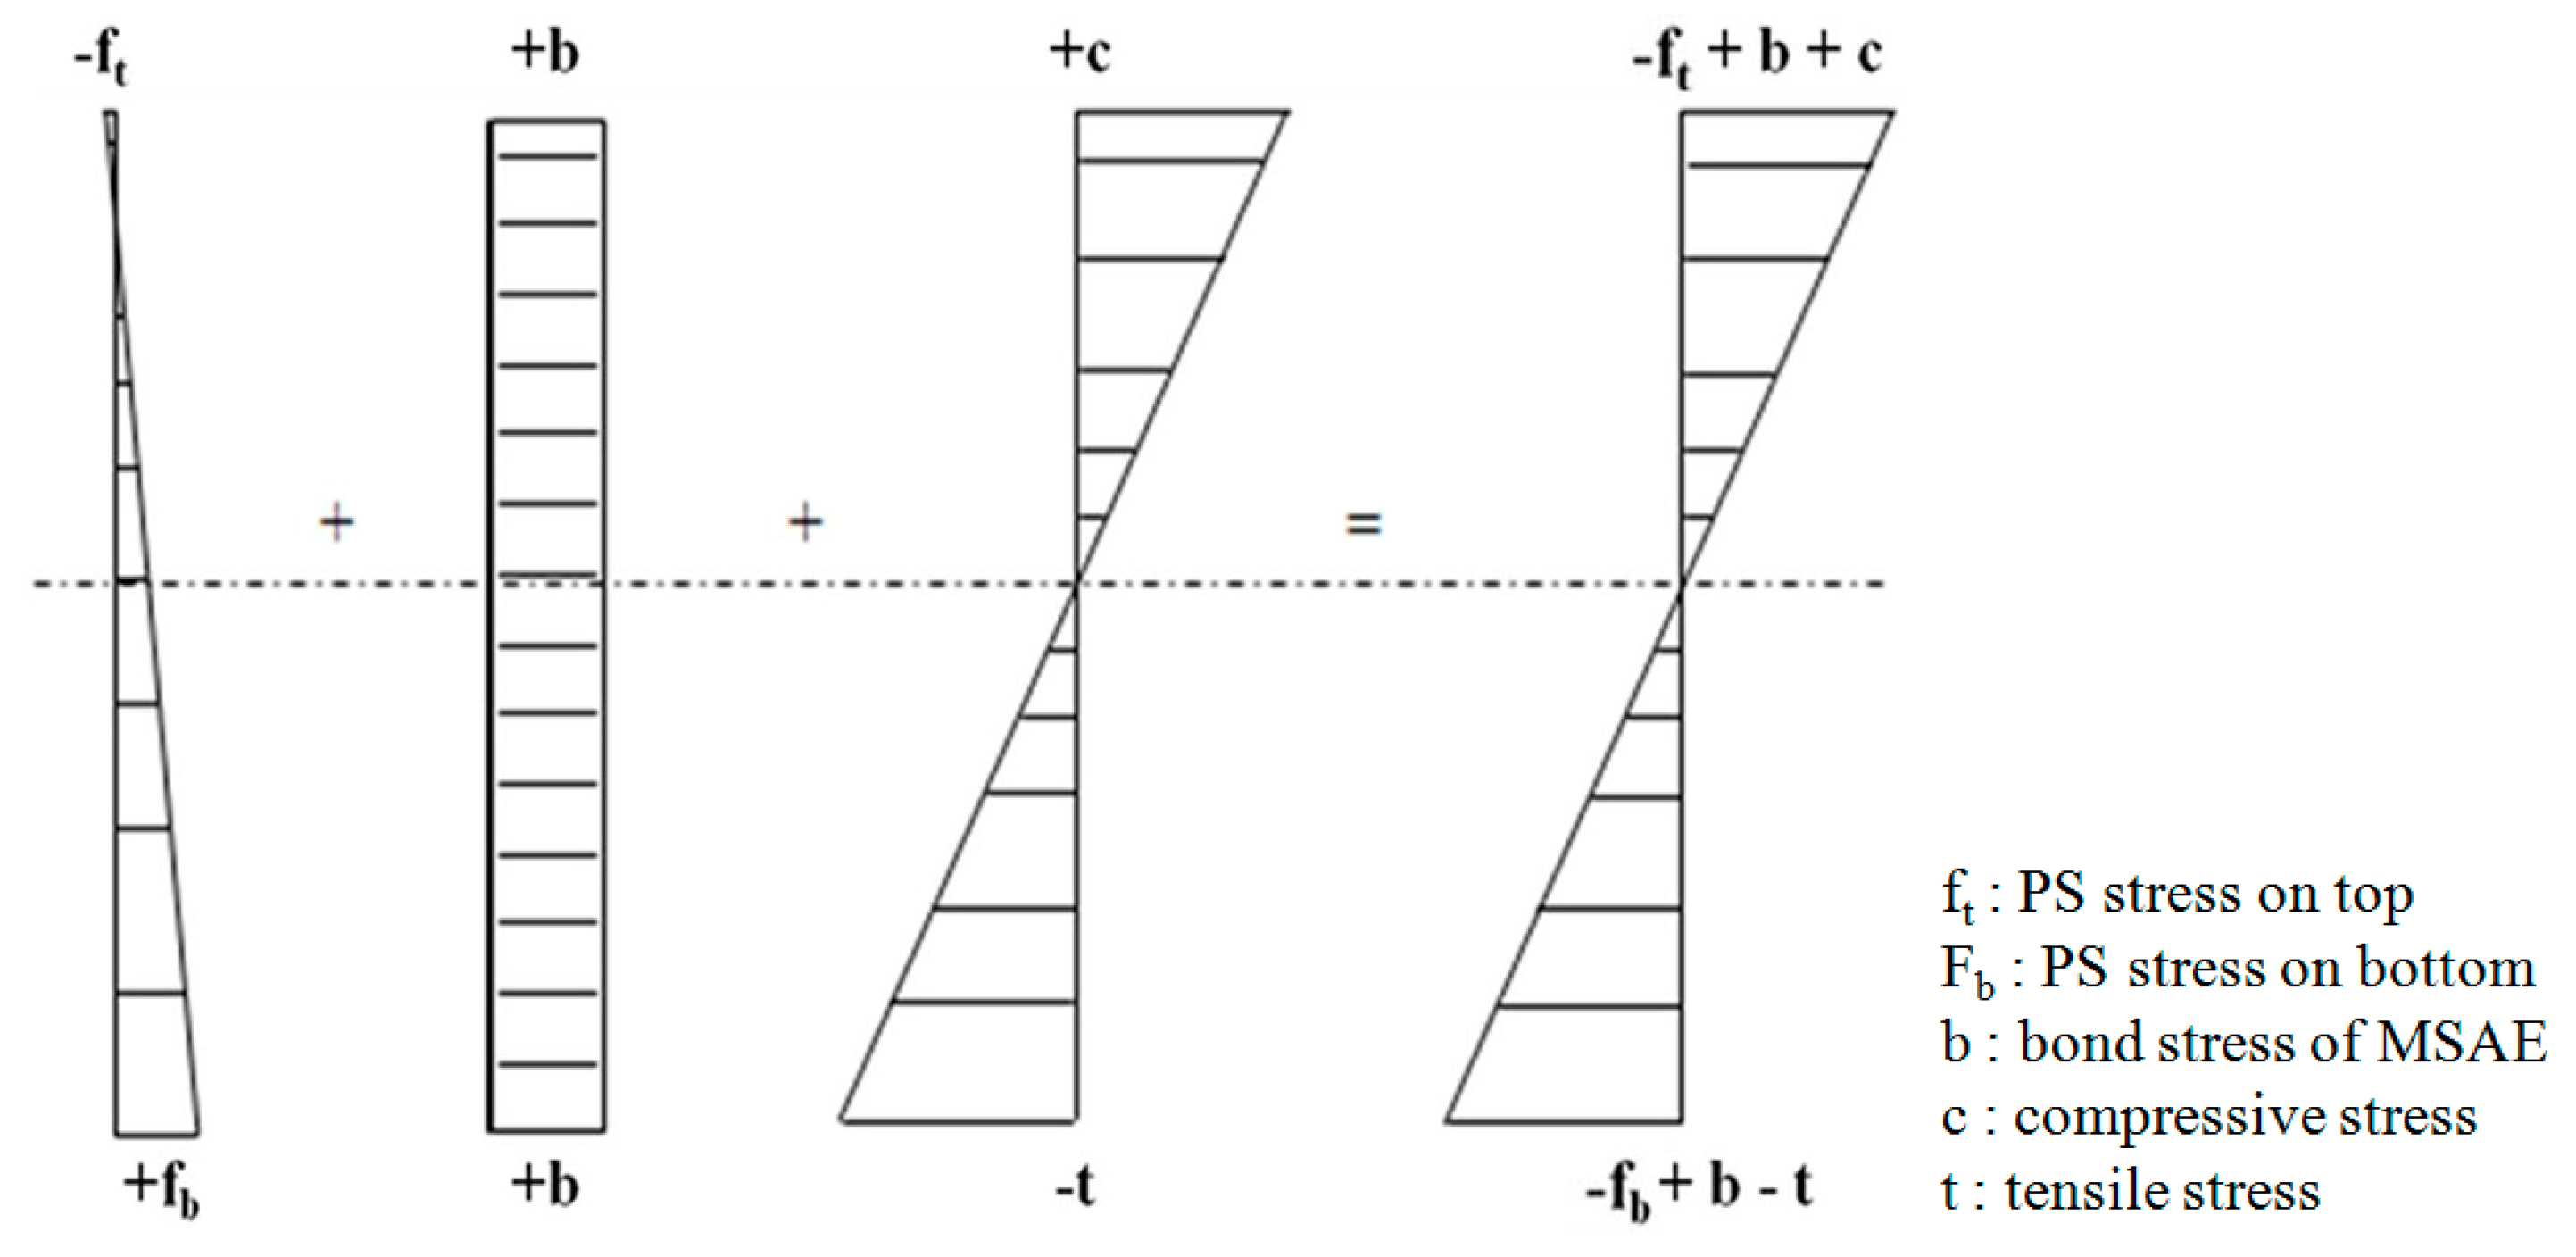
Figure 21 shows the interfacial stress profile across the cross-section. Before the application of load, the only stress applied to the cross-section was from the PS force and bond stress with top, bottom, and bond stress magnitudes of ft = −0.94 MPa, fb = 7.3 MPa, and b = 4.8 MPa, respectively. After the start of loading, the stress generated by the bending moment was 20 MPa on the top and bottom sections when the load was approximately 220 kN. The top and bottom surfaces had final compressive and tensile stresses of 24 and 8 MPa, respectively. The stress profile of the interface should not have failed due to the stress. However, crack (2) was observed in P specimens without MSAE and this resulted from the stress concentration and transfer described previously. In the case of the EP specimen with MSAE, there were no cracks at the bottom of the specimens. The interfacial behavior after MSAE application seemed to be adequate for maintaining continuity across the concrete module interface. When concrete floating structures are constructed by module connection, pre-bonding of modules by MSAE before PS has the advantage of maintaining continuity over the interface until ultimate failure [21]. Also, MSAE application at the interface allows continuous load transmission and stress distribution between the attached modules, allowing them to behave as one unit.
Figure 20. Stress distribution in rebars. (a) P series; and (b) EP series.
Polymers 07 01520 g020
Table 12. Change of stress transmission area.
PhaseP seriesEP series
Pre-cracking Polymers 07 01520 i001 Polymers 07 01520 i002
Post cracking Polymers 07 01520 i003 Polymers 07 01520 i004
Figure 21. Stress diagram at interface.
Polymers 07 01520 g021
In concrete structures, cracks are very important because they lead to the corrosion of steel reinforcing bars and the deterioration of load-carrying capacity. If a structure is constructed in sea water, the cracks are the most critical issue in the design of the structure. The results of the MSAE structural tests showed that MSAE helped in stress distribution along the interface. The interface experienced crack formation at the middle inclined section, while cracks formed at the bottom main tensile reinforcing bars were located in P specimens. Consequently, stress distribution of the MSAE increased the service life and durability of the concrete structures.

5. Conclusions

In this study, we optimized the micro-silica mixed aqua-epoxy (MSAE) formulation and we verified the performance of unreinforced plain concrete and PSC modules attached using MSAE. The following conclusions were drawn.
1)
To estimate the optimum MSAE mix proportion, 1%, 2%, 3%, and 4% of micro-silica were added to aqua-epoxy (AE) and tensile and bond shear tests were performed to evaluate the effects. The test results showed that a 2% mix proportion showed a positive effect from a capacity point of view. Also, the basic mix of aqua-epoxy with 2% micro-silica showed the optimum performance.
2)
To evaluate the performance of plain unreinforced concrete modules attached with MSAE, concrete-MSAE joint specimens with 5, 10, and 20 mm bond thicknesses were prepared and cured in dry and wet conditions. Based on 3-point loading tests, the maximum load was enhanced by about 70% from micro-silica, which reduced the pores in the epoxy matrix and the interface when the bond thickness was less than 10 mm. This resulted in enhancement of the net bonding surface area and homogeneity. The curing condition of dry or wet was not a major factor in the resulting trends.
3)
An evaluation of the effect of MSAE on PSC module attachment was performed by means of a three-point bending test. The results of MSAE-applied spliced PSC specimens showed that the maximum loads were similar to those of AE specimens and showed approximately the same capacity compared to that of continuous RC beam specimens. Based on these results we concluded that MSAE provides an insignificant capacity to increase at the structure level even though it increases capacity at the material level.
4)
MSAE did not improve structural capacity but did improve stress distribution, which led to stable crack formation. However, the specimens without MSAE showed induced stress concentration at the interface and crack formation around the tensile rebars. Consequently, the use of MSAE would help to increase the durability of concrete structures used in sea-water applications.

Acknowledgments

This work was supported by the New & Renewable Energy Core Technology Program of the Korea Institute of Energy Technology Evaluation and Planning (KETEP), granted financial resource from the Ministry of Trade, Industry & Energy, Korea (No. 20123010020110).

Author Contributions

Jang-Ho Jay Kim is a person who planned and developed the main idea of the study and performed most of test and analysis works as well as a main writer of the paper; Young-Jun You is a person who assisted the research and writing the paper; Youn-Ju Jeong is a PI of the research project; Ji-Hun Choi is a graduate student who assisted in the research work and writing of the paper.

Conflicts of Interest

The authors declare no conflict of interest.

References

  1. Suzuki, H. Overview of megafloat: Concept, design criteria, analysis, and design. Mar. Struct. 2005, 18, 111–132. [Google Scholar] [CrossRef]
  2. Zaleski-Zamenhof, L.C.; Grewick, B.C.; Hellesland, J.; Matsuishi, M.; Zhang, X. Concrete marine structures: A state of the art review. Mar. Struct. 1990, 3, 199–235. [Google Scholar] [CrossRef]
  3. Kim, Y.J.; Lee, S.W.; Yoo, Y.J.; Kim, J.H.J. Bonding material for performance evaluation of bonding material for floating concrete structure. Proc. J. Korea Concr. Inst. 2011, 11, 227–228. [Google Scholar]
  4. Woo, Y.J. Concrete to concrete bond strength: Influence of an epoxy based bonding agent on a roughened substrate. J. Korean Concr. Inst. 2007, 19, 66–70. [Google Scholar]
  5. Ahmad, Z.; Ansell, M. Fracture toughness properties of epoxy-based adhesives reinforced with nano-and microfiller additions for in situ timber bonding. In Proceedings of the 10th World Conference on Timber Engineering, Miyazaki, Japan, 2–5 June 2008; Volume 55, pp. 161–170.
  6. Feldman, D.; Barbalata, A. Synthetic Polymers-Technology, Properties, Applications; Chapman & Hall: London, UK, 1996; Volume 332. [Google Scholar]
  7. NZIC, New Zealand Institute of Chemistry. Available online: http://nzic.org.nz/ChemProcesses/polymers/10H.pdf (accessed on 27 June 2002).
  8. Guidelines for accelerated bridge construction using precast/prestressed concrete components. Available online: http://www.pcine.org/cfcs/cmsIT/baseComponents/fileManagerProxy.cfc?method=GetFile&fileID=29EA580A-F1F6-B13E-8B386984EA89F68F (accessed on 13 February 2015).
  9. Kim, S.B.; Yi, N.H.; Phan, H.D.; Nam, J.W.; Kim, J.H.J. Development of aqua-epoxy for repair and strengthening of RC structural members in underwater. Constr. Build. Mater. 2009, 23, 3079–3086. [Google Scholar] [CrossRef]
  10. Lai, M.; Friedrich, K.; Botsis, J.; Burkart, T. Evaluation of residual strains in epoxy with different mano/micro-fillers using embedded fiber Bragg grating sensor. Compos. Sci. Technol. 2010, 70, 2168–2175. [Google Scholar] [CrossRef]
  11. Imai, T.; Sawa, F.; Nakano, T.; Ozaki, T.; Shimizu, T.; Kozako, M.; Tanaka, T. Effects of nano-and micro-filler mixture on electrical insulation properties of epoxy based composites. IEEE Trans. Dielectr. Electr. Insul. 2006, 13, 319–326. [Google Scholar] [CrossRef]
  12. Vaisakh, S.S.; Hassanzadeh, M.; Metz, R.; Ramakrishnan, S.; Chappelle, D.; Sudhal, J.D.; Ananthakumarl, S. Effect of nano/micro-mixed ceramic fillers on the dielectric and thermal properties of epoxy polymer composites. Polym. Adv. Technol. 2013, 25, 240–248. [Google Scholar] [CrossRef]
  13. Yazdani, N.F.; Filsaime, M.; Manzur, T. Effect of steam curing on concrete piles with silica fume. Int. J. Concr. Struct. Mater. 2010, 6, 9–15. [Google Scholar] [CrossRef]
  14. Terence, C. US Department of Transportation, Federal Highway Administration; Silica Fume User’s Manual: Lovettsville, VA, USA, 2005. [Google Scholar]
  15. Concrete Construction. How microsilica improves concrete. Available online: concreteconstruction.net/concrete-construction/how-microsilica-improves-concrete.aspx (accessed on 21 January 2015).
  16. Friede, B. Microsilica–characterization of an unique additive. In Proceedings of the 10th Inorganic-Bonded Fiber Composites Conference (IIBCC), San Paulo, Brazil, 15–18 November 2006; Volume 1, pp. 135–144.
  17. Ajay, V.; Rajeev, C.; Yadav, R.K. Effect of micro-silica on the strength of concrete with ordinary Portland Cement. Res. J. Eng. Sci. 2012, 1, 1–4. [Google Scholar]
  18. Malhotra, V.M. SP-79: Fly Ash, Silica Fume, Slag and Other Mineral By-Products in Concrete; American Concrete Institute: Detroit, MI, USA, 1983; pp. 443–446. [Google Scholar]
  19. Hällmark, R.; Collin, P.; Nilsson, M. Concrete shear keys in prefabricated bridges with dry deck joints. Nord. Concr. Res. 2011, 44, 8. [Google Scholar]
  20. Schijve, J. Fatigue of Structures and Materials; Springer-Verlag: New York, NY, USA, 2009; pp. 59–88. [Google Scholar]
  21. Yang, I.H.; Kim, K.C. Strength estimation of joints in floating concrete structures subjected to shear. J. Korean Navig. Port Res. 2011, 37, 155–163. [Google Scholar] [CrossRef]

