3.1. Rotational Viscometry
Degradation of high-molar-mass HA in the presence of a trace amount of Cu(II) ions (1 μmol/L) and ascorbic acid (100 μmol/L) as the reducing agent mimics the situation that may occur during the early stage of acute phase inflammative degradation of SF within a particular joint due to hydroxyl radicals. Chemistry of the well-established Weissberger’s biogenic oxidative system (WBOS,
Scheme 1) under aerobic conditions can be illustratively described as follows:
Scheme 1.
Chemistry of WBOS (Weisberger biogenic oxidative system). AscH− and DHA (dehydroascorbate) denote ascorbate anion and dehydroascorbate, respectively.
Scheme 1.
Chemistry of WBOS (Weisberger biogenic oxidative system). AscH− and DHA (dehydroascorbate) denote ascorbate anion and dehydroascorbate, respectively.
As evident, the molecules of oxygen by a sequence of cyclic reactions is converted to H
2O
2 molecules, which from an intermediate Cu(I)–complex decompose fast to hydroxyl radicals according to the pseudo-Fenton reaction: H
2O
2 + Cu(I) → •OH + HO
− + Cu(II). •OH radicals can then initiate the free-radical degradative chain reaction [
22,
23,
24,
25,
26,
27,
28,
29,
30] of HA. The independent investigation of the mechanism of WBOS action proved that all three reactants,
i.e., ascorbic acid, Cu(II), and oxygen, were indispensable for initiation of the degradation of HA macromolecules. One should, however, bear in mind that it has been repeatedly established that most commercially available HAs contain a minute amount of transition metal ions including cupric ions [
31,
32,
33].
Two different experimental arrangements have been used so far when the HA macromolecules undergo free-radical degradation by WBOS. First, the HA degradative process is uninhibited, second an inhibitor/scavenger can be introduced in the function to protect the biopolymer degradation. The latter procedure has been exploited broadly to characterize various antioxidants/drugs to act as preventive and/or chain-breaking species.
By adding the substance for testing its protective effect against oxidative degradation of HA in time 0 min, i.e., at the onset of free-radical generation, the substance capability to scavenge •OH radicals and, thus, to act as a preventive antioxidant was addressed.
By adding the substance 1 h after the reaction onset, we investigated the ability of the substance to scavenge alkoxyl- and/or alkylperoxyl-type radicals and, thus, to inhibit the process in its developed stage.
The interpretation of results may be complicated by the potential effect of thiol compounds on non-radical decomposition of intermediately formed hydrogen peroxide and by the possibility of the depletion of WBOS due to consumption of ascorbic acid in Fenton’s like reaction cycle.
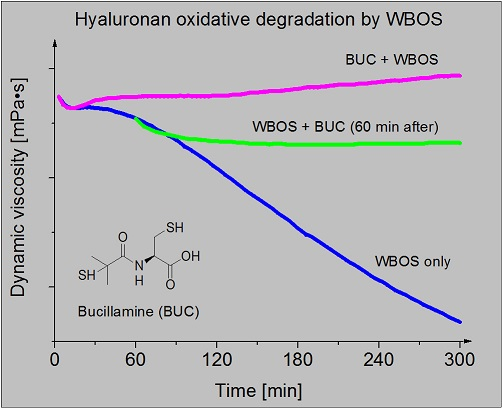
Figure 2 illustrates the decrease in dynamic viscosity (η) of the HA solution. Degradation of hyaluronan was induced by Cu(II)
plus ascorbic acid—Weissberger’s biogenic oxidative system (curves coded
i). The initial η value decreased from 11.5 to 7.4 mPa·s at the end of 5-h recording. Curve coded P0207-1A represents the η values of native HA solution. Bucillamine (100 μmol/L), applied before initiating the oxidative degradation of HA, prevented any reduction of the solution dynamic viscosity value. Moreover, rheopexy of the solution was clearly registered (panel B, curve coded
ii). As evident in
Figure 2, panel B, curve coded
iii, dynamic viscosity of the reaction mixture decreased from the initial value 11.5 to 11.1 mPa·s during 1 h. The addition of bucillamine in 100 μmol/L concentration led to only a slight decrease of η to the value 10.7 mPa·s in the course of the following 30 min. Afterwards, in the time interval from 90 min to 5 h, the dynamic viscosity of the reaction mixture altered minimally (
Figure 2, panel B, curve coded
iii).
Figure 2.
Graphical record of dynamic viscosity (η) values of: native HA biopolymer solution (P0207-1A), WBOS comprising reaction mixture (i) and bucillamine (100 μmol/L) action on oxidative HA degradation in vitro induced by WBOS in two experimental arrangements (ii, iii). The WBOS containing 1 μmol/L CuCl2 plus 100 μmol/L ascorbic acid. The changes of dynamic viscosity values were recorded by rotational viscometer for 5 h and temperature of 25 °C. All solutions were prepared in 0.15 mol/L NaCl. Panel (A), curve i represents the η of WBOS and HA solution, curve P0207-1A represents the η of native HA biopolymer coded P0207-1A; Panel (B), similarly, curve i represents the η of WBOS and HA solution, curve ii represents the changes of η in the presence of bucillamine (100 μmol/L) in the reaction mixture, when bucillamine was added at the beginning of the oxidative degradation of HA, curve iii represents the changes of η in the presence of bucillamine (100 μmol/L) in the reaction mixture, when bucillamine was added after one hour of the oxidative HA degradation.
![Polymers 06 02625 g002]()
3.2. SEC Analyses
The primary analysis of the reaction mixtures carried out by a fast SEC method, considering especially the status at 5 h of the solution containing bucillamine and/or decomposed drug molecules (
Figure 2, panel B, curve coded
ii), indicated a shift of the chromatogram peak to a higher elution volume compared to the volume of native HA sample P0207-1A used in our study (not shown). The greater elution volume observed indicates lower hydrodynamic volume of the polymer solute—hence, the dissolved polymer is represented by lower molar mass. A further examination of the reaction mixture by a rapid SEC method confirmed our primary observation that although dynamic viscosity of the reaction mixture does not indicate alteration of the molecular parameters of the HA sample treated, the SEC elution properties of this solution did reveal some relevant changes. For this reason, our further investigation was focused on a detailed molecular characterization of the polymeric samples recovered from the reaction mixture in solid forms.
Figure 3 displays the superimposition of the records of the 2414-DRI signal (the chromatograms) of four HA samples obtained by using the Alliance-MALS-DRI set. The elution volume window between approximately 12 and 21 mL represents the eluted polymeric fractions, while at the higher volume (>21 mL) the low-molar-mass species are eluted. A very good SEC separation is evident, especially for the native ultra-high-molar-mass (UHMM) HA sample. Records in
Figure 3 demonstrate that the set of chromatographic columns used and the experimental conditions were adequate for an efficient SEC fractionation of all four HA samples.
Figure 3.
Superimposition of DRI signal (analyte concentration) of four biopolymeric samples. The native HA sample P0207-1A, recovered polymers prepared by treating the native HA sample with WBOS without addition of bucillamine (i) and with addition of bucillamine in the system before the reaction onset (ii) and after 1 h (iii).
Figure 4 represents the comparison of differential MMD of all four samples. The molar mass of each polymeric fraction from the on-line MALS detector is absolute, not relative to some particular calibration standards, and the final molar mass distribution of the sample was obtained directly without any (relative) calibration. In experiments
i without the presence of bucillamine, the significant reduction of the molar mass may be observed when compared with original intact HA. The both chromatograms and the MMD of
ii and
iii samples recovered at 5 h (
Figure 3 and
Figure 4) show also the decrease of molar mass that is however, lower than that for experiment
i. A small shoulder in the high-molar-mass fractions for experiments
ii and
iii may be observed as well. This is the most plausibly a consequence of the little extent of aggregation in these two samples, however, the aggregation appears to be marginal. The most important molecular characteristics related to SEC-MALS analyses are summarized in
Table 1.
As is evident in
Table 1, the native HA P0207-1A sample is an ultra-high-molar-mass sample (average molar mass
Mw close to 1 MDa,
Rg ≈ 105 nm) with relatively broad MMD (
Mw/
Mn = 1.50). The slope α of the conformation plot of this sample (0.57) is typical of a native HA biopolymer. Several repeated experiments demonstrated high reproducibility of the P0207-1A degradation process by applying WBOS. For example, SEC-MALS measurements of samples
ii resulted in the
Mw values from 448.7 to 607.5 kDa.
Figure 4.
Comparison of differential MMD (molar mass distribution) of four biopolymeric samples. The native HA sample P0207-1A, recovered polymers prepared by treating the native HA sample with WBOS without addition of bucillamine (i) and with addition of bucillamine in the system before the reaction onset (ii) and after 1 h (iii).
Table 1.
Summary of SEC-MALS results of four samples.
Table 1.
Summary of SEC-MALS results of four samples.
| Sample | Mp (kDa) | Mw (kDa) | Mw/Mn (-/-) | Rg (nm) | K (nm) | α | Recovered Mass (%) | Mw (decrease, %) |
|---|
| P0207-1A | 886.1 | 970.4 | 1.50 | 105.1 | 4.27 × 10⁻² | 0.57 | 78.2 | 0.0 |
| i | 217.2 | 247.9 | 1.56 | 46.1 | 6.27× 10⁻² | 0.53 | 79.9 | −74.5 |
| ii | 370.9 | 563.5 | 1.61 | 76.8 | 8.18 × 10⁻² | 0.52 | 83.2 | −41.9 |
| iii | 418.2 | 609.8 | 1.44 | 78.6 | 5.70 × 10⁻² | 0.54 | 84.5 | −37.2 |
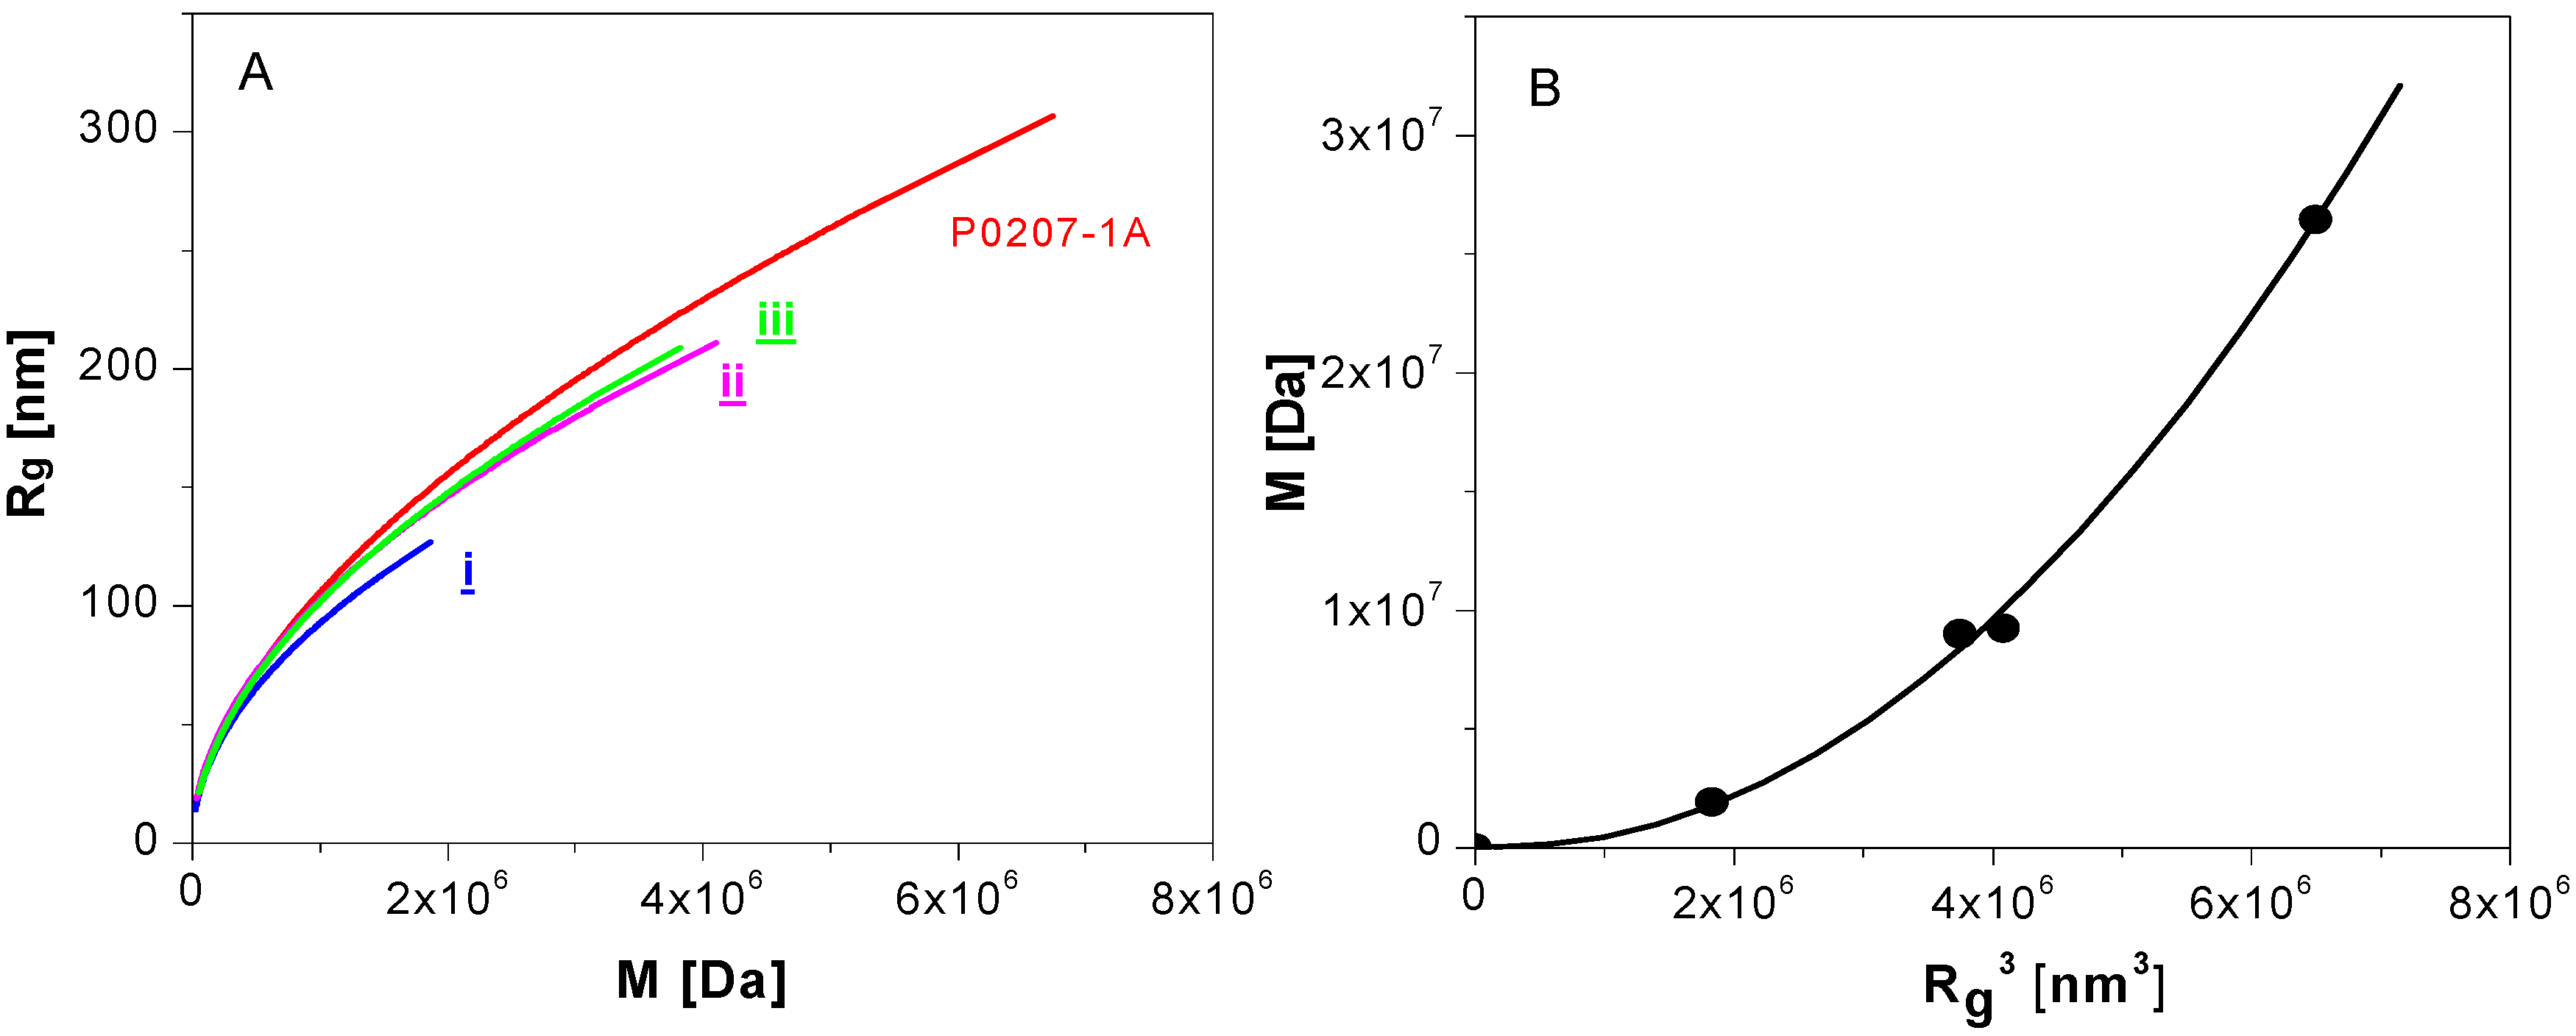
Comparison of the conformation plot
Rg =
f(M) of four samples is shown in
Figure 5, panel A. The conformation plot in the form
Rg =
K ×
Mα links gyration radius
Rg with chain length (molar mass) of macromolecules. In general, the conformation plot is very important because it supports the idea about possible polymer branching and potential derivatization or chemical modification of the polymer. Here the change/reduction of the molar mass with the extent of degradation is accompanied by the decrease of the gyration radius. The conformation plot of four samples clearly shows a molar mass decrease (to different extent) in the inspected/recovered
i,
ii, and
iii samples. The values of the slope α for these three samples (
Table 1) were somewhat lower with respect to the native P0207-1A sample. This conformational result is most plausibly a consequence of the little extent of aggregation of these three samples, which, according to the above-mentioned facts, could be classified as hyaluronans or true HA fragments.
Figure 5.
(A) represents the dependences of gyration radius (Rg) on molar mass (M). (B) illustrates M vs. the third power of gyration radius (Rg3), where the Rg values were taken at the end of curves of panel A. Native HA sample P0207-1A, recovered polymers prepared by treating native HA sample with WBOS without addition of bucillamine (i) and with addition of bucillamine in the system before the reaction onset (ii) and after 1 h (iii).
3.3. Non-Isothermal Chemiluminometric, TGA, and DSC Characterization of the Four Biopolymeric Samples
The non-isothermal chemiluminometric, TGA, and DSC methods served for the investigation of four biopolymeric samples (P0207-1A,
i,
ii, and
iii) enabling to evaluate the momentaneous state of fragmented hyaluronans towards (a) presence of hydroperoxides (inert atmosphere), (b) remaining oxidisability determined by the concentration of potential oxidation sites, (c) eventual tendency of fragmented samples to further transformation reactions such as crosslinking,
etc. One has to remind again that reprecipitated samples were examined apparently lacking all low molar mass compounds and that records obtained were typical for the temperature and oxygen induced reactions of functional groups that appeared in HA after the reaction with WBOS. It is to be noted that in inert atmosphere (
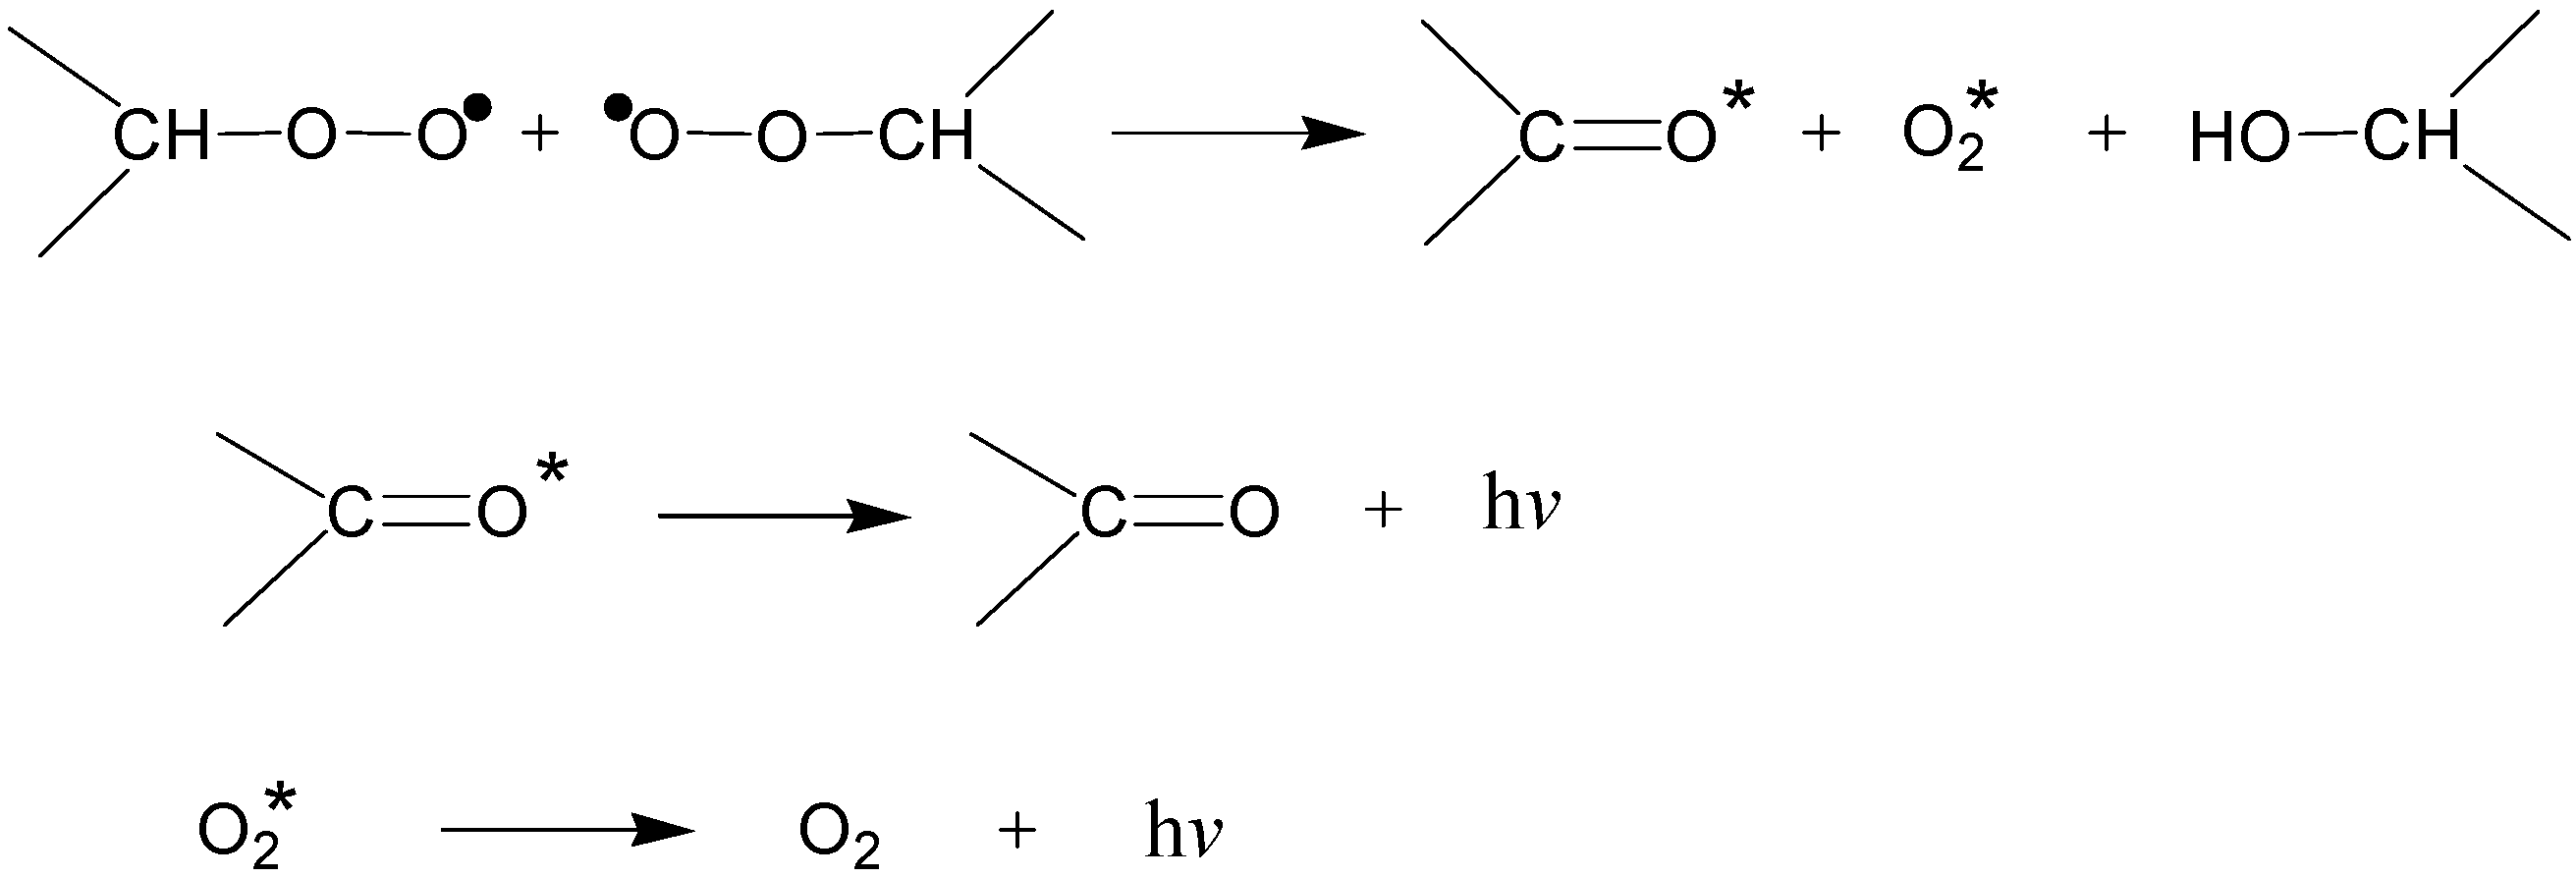
Figure 6) the chemiluminescence signal reflects the three mutually superimposed processes. At the lowest temperature it is the annealing of defect structures and structural abnormalities, at medium temperatures it is the bimolecular decomposition of hydroperoxides, and at the highest temperatures it is the scission of bonds linking the macromolecular chains. The structural defects and hydroperoxides are converted to radicals, of which recombination provides the heat necessary for the excitation of potential emitters, while their conversion into the ground state leads to light emission. On the other hand, in oxygen atmosphere we follow the oxidation of the fragmented sample as a whole. Secondary alkylperoxyl radicals, which are formed from bimolecular decomposition of hydroperoxides, are particularly “efficient” in such a process. They provide triplet carbonyls and singlet oxygen in a step which takes place in parallel (
Scheme 2). The exothermicity of disproportionation reaction of secondary alkylperoxyl radicals is very high (around 420 kJ/mol and higher). The recombination of alkoxyl-type radicals provides also some exothermicity (320–400 kJ/mol), however the absence of emitters reduces the light intensity to a considerably lower value. That is why the chemiluminescence from hyaluronan in nitrogen where peroxyl radicals are provided only from the bimolecular decomposition of hydroperoxides is significantly lower (compare
Figure 6 and
Figure 7).
Figure 6.
Non-isothermal chemiluminometry of four biopolymeric samples. The sample treatment was carried out in nitrogen. Native HA sample P0207-1A, recovered polymers prepared by treating native HA sample with WBOS without addition of bucillamine (i) and with addition of bucillamine in the system before the reaction onset (ii) and after 1 h (iii). The inserted plot (a) is a cross-section of the original runs where intensity of chemiluminescence is plotted to 10% of its value at 250 °C.
Scheme 2.
Mechanism of the population of excited states from carbonyls and oxygen subsequently emitting light. Asterisks denote the excited states of ketones (triplet) and oxygen (singlet), which are converted to the ground state with the emission of light.
Scheme 2.
Mechanism of the population of excited states from carbonyls and oxygen subsequently emitting light. Asterisks denote the excited states of ketones (triplet) and oxygen (singlet), which are converted to the ground state with the emission of light.
The results of non-isothermal chemiluminescence of four biopolymer samples, illustrated in
Figure 6 and
Figure 7, give the maximum of the light emission at temperatures above 200 °C. The temperature of maximum chemiluminescence intensity in nitrogen is lower than that in oxygen. The inserted graph A underlines the luminescence behavior of the material in the region of lower temperatures.
Figure 6 (red curve) illustrates that the native HA contains a certain amount of hydroperoxides as it performs a well-developed maximum in nitrogen situated at 238 °C. The non-isothermal chemiluminometric assay under oxygen atmosphere (
Figure 7, red curve) revealed that the native HA was readily oxidized giving rise to a chemiluminescence about 15 times more intense than that in nitrogen (
Figure 6, red curve). The assumed route is demonstrated in
Scheme 3. The peroxidic compound which comes into consideration is likely to be peracid, formed from the oxidation of C6 carbon of the glucopyranosyl unit. This peracid is ultimately converted to acid. The another kind of peroxides may be formed after the free radical attack of C3 carbon atom of glucosamine or C1 atom of glucuronyl acid unit that are linked via the oxygen bridge. This occurs as the main chain scission.
Figure 7.
Non-isothermal chemiluminometry of four biopolymeric samples. The samples were measured in oxygen. Native HA sample P0207-1A, recovered polymers prepared by treating native HA sample with WBOS without addition of bucillamine (i) and with addition of bucillamine in the system before the reaction onset (ii) and after 1 h (iii). The inserted plot (a) is a cross-section of the original runs in relative units where intensity of chemiluminescence is plotted to 10% of its maximum value.
Scheme 3.
The potential sites of the free-radical attack on HA.
Scheme 3.
The potential sites of the free-radical attack on HA.
The non-isothermal chemiluminescence of samples
i,
ii, and
iii (
Figure 6 and
Figure 7) indicates a reduction of the signal intensity for fragmented samples to a rather low value. This is a common feature of all fragmented samples and is in accordance with the performance of
N-acetyl-
l-cysteine reported in [
15]. In
Figure 6 and
Figure 7 we may also see the graphical metamorphosis of the plots of nonisothermal chemiluminescence for four biopolymer samples (inserts in
Figure 6 and
Figure 7). The chemiluminescence intensity was expressed there in relative units as
I/
I250, where
I250 is the light intensity at the last temperature reading (250 °C) and plotted until 10 p.c. of the whole graph. We see that samples
ii and
iii are, at low temperatures, less stable than the intact hyaluronan but more stable than that of sample
i. It is of interest that the molar mass
Mw is also reduced, depending on the method of HA treatment (
Figure 8). The decrease of the molar mass and the shift of the initial increase of chemiluminescence intensity to lower temperatures in nitrogen atmosphere correspond each to other. The initial increase of the chemiluminescence intensity in oxygen discriminates the fragmented samples in the sequence according to the facility of oxidation
ii >
i >
iii > P0207-1A. The chemiluminescence intensity Worth of further discussion is the finding that the sample denoted as
ii did not change the viscosity in the rotational viscometer while its molar mass was reduced almost to one half of the original value (
Table 1).
Figure 8.
The plot of temperature of achieving 10% of the maximum chemiluminescence intensity expressed in relative units vs. molar mass Mw. The sample treatments were carried out in oxygen (○) and nitrogen (●).
Figure 8.
The plot of temperature of achieving 10% of the maximum chemiluminescence intensity expressed in relative units vs. molar mass Mw. The sample treatments were carried out in oxygen (○) and nitrogen (●).
DSC records of both intact and fragmented hyaluronans appear to be rather complex involving endothermal release of low molar compounds absorbed (water) at low temperature not shown here and surprisingly also exotherms at increased temperatures. The temperature interval between 150 and 375 °C seems to be the most representative for the characterization of HA. In nitrogen (
Figure 9, panel A), the exotherms M and N may be seen. With the time of treatment in the rotational viscometer, the exotherms shift to lower temperatures. The most degraded sample
i loses the exotherm N that was originally situated at temperatures around 270 °C and is replaced by the shoulder. The exotherm M is splitted into two parts. The disappearance of the exotherm N may be linked to the reduction of the molar mass. The same result was observed in the paper of Hrabárová
et al. [
15], where protective effects of
N-acetyl-
l-cysteine against HA degradation were examined. DSC signals in oxygen (
Figure 9, panel B) are much more pronounced compared to nitrogen (10–20 times), which is probably related to oxidation of HA molecules. Here, we again distinguish two exotherms X and Y. Their maxima also shift to lower temperatures with the extent of HA degradation (
Table 2). It is of interest to plot the surface below the DSC exotherms from
Figure 9 vs. the number of average molar mass of degraded samples (
Figure 10). In the case of DSC nitrogen experiments the latter increases, the highest being for sample
i while for DSC in oxygen the highest being for intact sample. This decrease corresponds to the decrease of maximum chemiluminescence intensity with the extent of HA degradation in oxygen experiments (
Figure 7) and also to the depletion of oxidizable sites in HA. It is surprising that DSC records in nitrogen where mainly the degradation is expected give exotherms. Thus, it may be deduced that fragmented samples contain two kinds of sites:
- a
Oxidizable sites that are revealed in oxygen atmosphere,
- b
The sites capable of crosslinking or back polymerization that are exothermic that are revealed in a nitrogen atmosphere.
Figure 9.
DSC records after the subtraction of the slope line (within the temperature interval 150 and 300 °C for nitrogen (A) and 150 and 375 °C for oxygen (B)) of four biopolymeric samples. Native HA sample P0207-1A, recovered polymers prepared by treating native HA sample with WBOS without addition of bucillamine (i) and with addition of bucillamine in the system before the reaction onset (ii) and after 1 h (iii).
Table 2.
Temperatures of the maximum DSC exotherms and residual amount of the sample after the thermogravimetry experiment at 350 °C.
Table 2.
Temperatures of the maximum DSC exotherms and residual amount of the sample after the thermogravimetry experiment at 350 °C.
| Sample | Temperature of exotherm, °C | Amount of residue at 350 °C, % |
|---|
| M | N | X | Y | Nitrogen | Oxygen |
|---|
| P0207-1A | 239 | 262 | 262 | 359 | 45.6 | 33.6 |
| ii | 238 | 258 | 262 | 337 | 44.4 | 43.2 |
| iii | 218, 232 doublet | 250 | 250 | 337 | 52.4 | 50.9 |
| i | 211, 229 doublet | - | 248 | 334 | 54.8 | 49.4 |
Figure 10.
The surface below the DSC exotherms for oxygen (squares) and nitrogen (circles) experiments plotted vs. molar mass of respective samples.
Figure 10.
The surface below the DSC exotherms for oxygen (squares) and nitrogen (circles) experiments plotted vs. molar mass of respective samples.
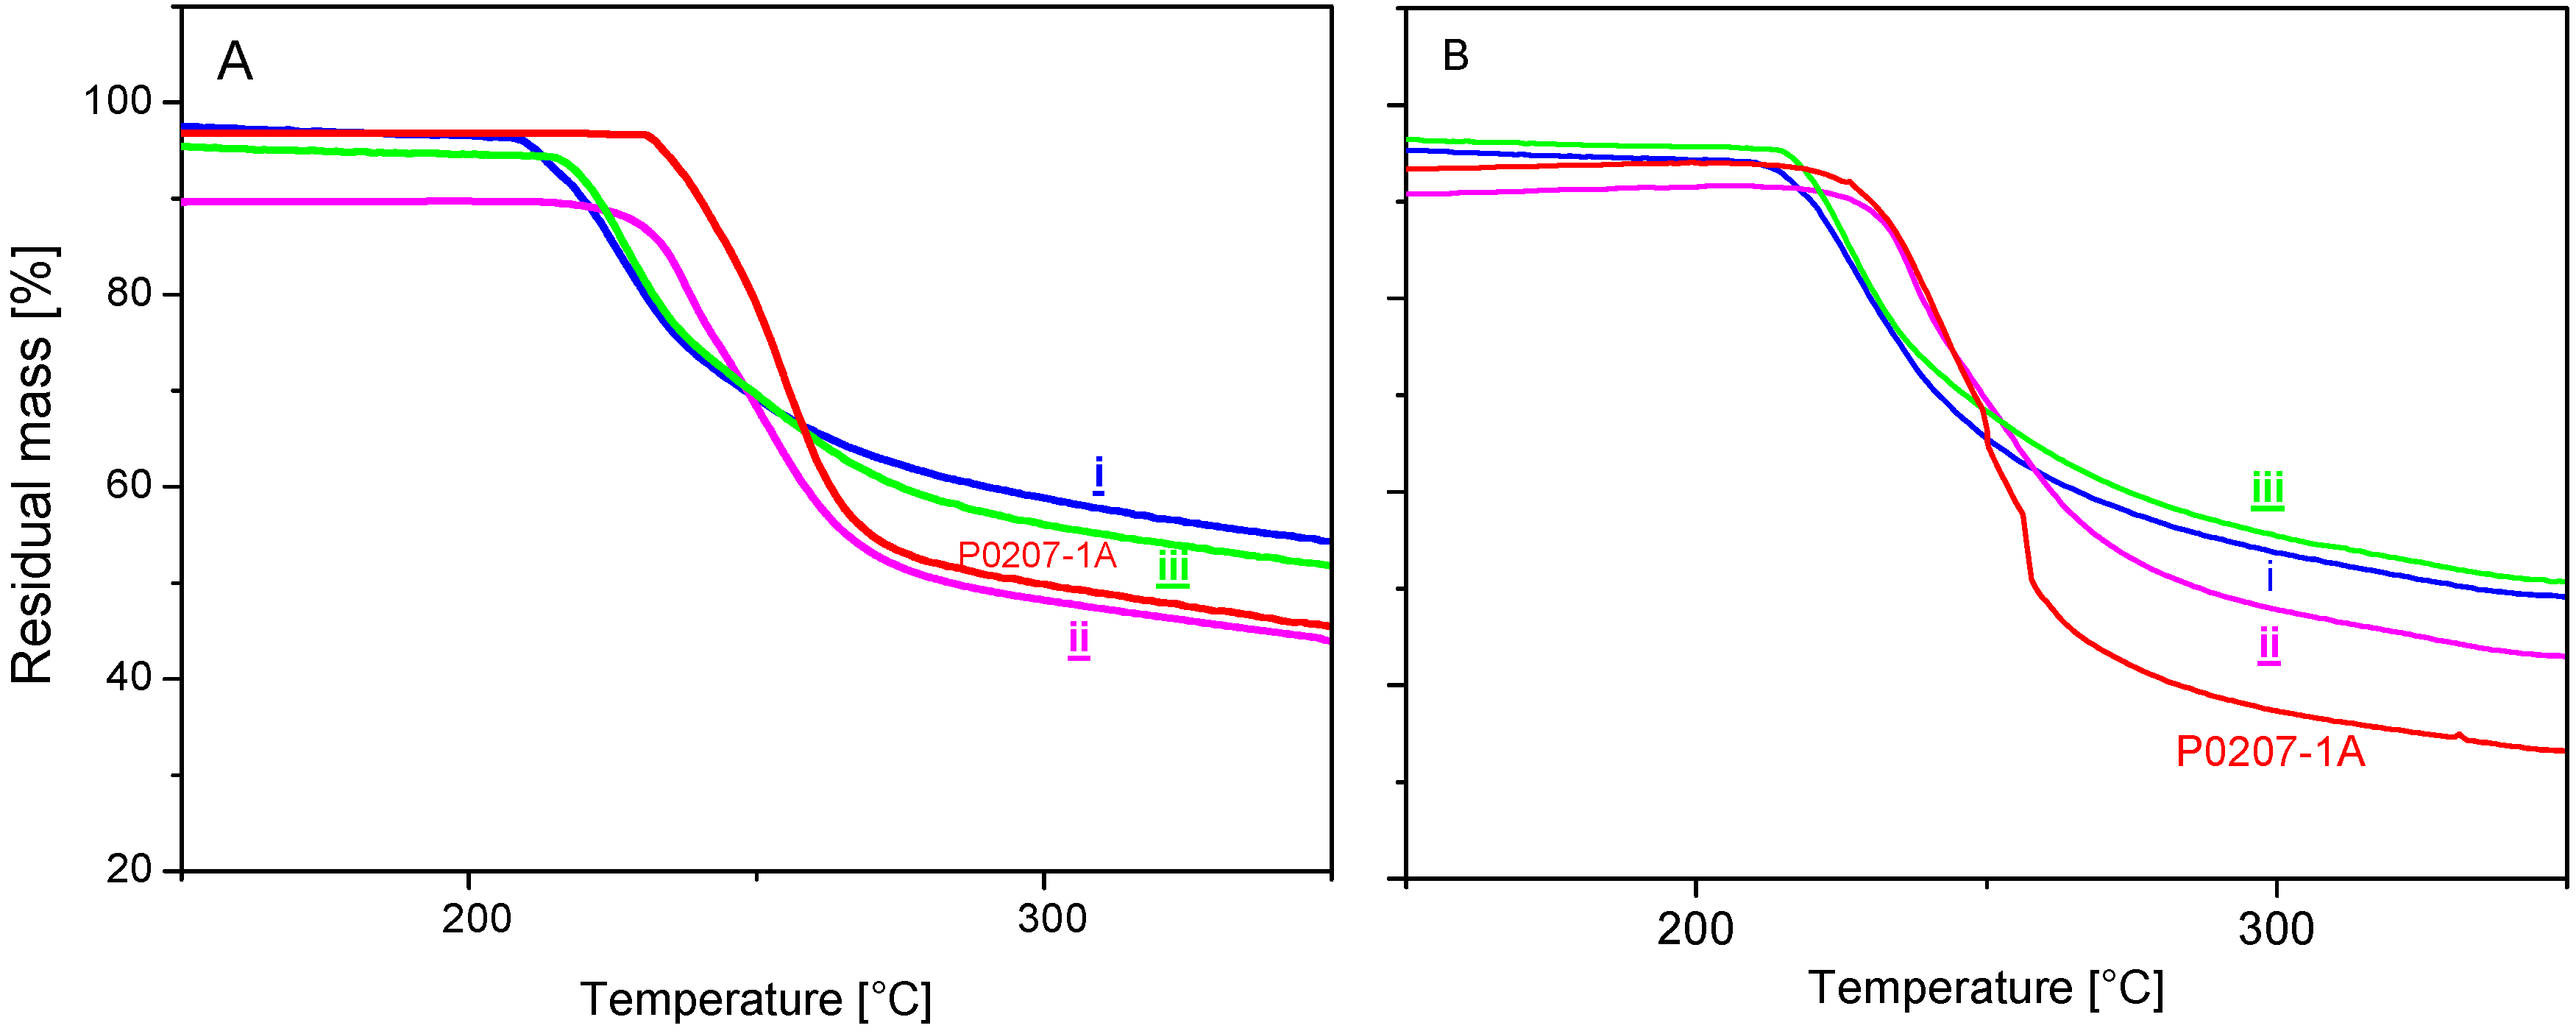
Nonisothermal thermogravimetry records also show that more fragmented samples of HA are less stable than intact ones. The curves for less stable samples are shifted to lower temperatures (
Figure 11). The amount of residue that remains on the thermogravimetry pan is significantly higher when compared with intact sample, which may be tentatively ascribed to the additional reactions taking place in fragmented samples when the temperature increases. The higher residue should then correspond with larger extent of additional crosslinking or back polymerization.
Figure 11.
TG (thermogravimetry) records of four biopolymeric samples. The sample treatment was carried out in nitrogen (A) and oxygen (B). Native HA sample P0207-1A, recovered polymers prepared by treating native HA sample with WBOS without addition of bucillamine (i) and with addition of bucillamine in the system before the reaction onset (ii) and after 1 h (iii).
Hyaluronan is an outstanding biopolymer among glycosaminoglycans (GAGs), HA, chondroitin sulfate, heparan sulfate, dermatan sulfate, and keratan sulfate. Contrary to these four sulphates, HAs are represented by extremely high molar masses—HA macromolecules are extruded extracellularly by type B fibroblasts. One of the characteristic differences between HA and other GAGs is that HA contains no sulphur atom. Due to the high molar mass of native HA, viscoelasticity of its aqueous solutions is high. However during inflammations (e.g., rheumatoid arthritis), HA degradation was unequivocally claimed [
34,
35]. Thus, viscoelasticity of SF can decrease significantly. The phenomenon of an extensive decrease of dynamic viscosity of the aqueous solutions of degraded HAs has been exploited in studies of free-radical scavenging properties of various antioxidants [
36,
37]. Several investigators demonstrated that thiol type compounds (R–SH), either endogenous or exogenous, can affect both initiation and propagation stages of HA free-radical degradation. The energy of the S-H bond equals ≈ 30 kcal/mol and the compounds may efficiently act as scavengers of •OH, ROO• and other free radicals. Several DMARDs can be ranked among thiol compounds (
d-penicillamine, aurothiomalate,
etc.). One molecule of bucillamine, a dithiol compound, is a source of either one or even two H atoms capable of reacting with free radicals. The observation of positive therapeutic action of bucillamine under RA conditions calls for
in vitro studies modeling the situation which may occur in an inflamed joint. The results represented in
Figure 2, curve
i, illustrate changes of dynamic viscosity of the HA solution whose degradation was initiated by •OH radicals. Under aerobic conditions, ascorbate is converted to H
2O
2, which in the presence of cuprous ions can generate reactive hydroxyl radicals •OH. It should be pointed out that higher ascorbate concentrations and/or Cu(II) ions can pronounce HA degradation and
vice versa [
38,
39]. The fate of HA in the reaction mixture was monitored by simple SEC analyses and an extensive HA macromolecule degradation was observed. In the 5th hour the decrease of the η value represented ≈ 64.3% (
Figure 2, curve
i). The curves
ii and
iii illustrated in
Figure 2, panels A and B, could lead to a premature conclusion that bucillamine can totally scavenge all free-radicals within the reaction mixture. Simple SEC analyses indicated a relevant accelerating molar mass reduction and analyses performed in the 5th hour by using 20 µL probes proved HA degradation. Since a direct injection of the radical reaction mixture cannot be carried out in a SEC-MALS apparatus, an inevitable step was to terminate the degradative process and separate the polymer. The three samples
i,
ii and
iii in the solid form underwent a supplementary FT-IR (Fourier transform infrared spectroscopy) and inductively coupled plasma mass spectrometric analyses (ICP-MS). As proved, neither sample
ii nor sample
iii contained sulfur atom and the FT-IR records of all four samples (P0207-1A,
i,
ii and
iii) were qualitatively identical (not shown). As shown in
Table 1, the recovered samples
ii and
iii are molecularly different from the native P0207-1A. Minor differences of
Rg vs.
M plots (
Figure 5, panel A) may be an indication of a different content of hydroperoxides in these four samples, as clearly evidenced in
Figure 6 and
Figure 7. Since SEC-MALS analyses demonstrated no branching and no extensive modification of these four polymer samples, the native HA, as well as the samples
i,
ii and
iii, can be classified as homopolymers. A prominent finding is the fact that the action of ascorbate
plus Cu(II) in the absence and presence of bucillamine that reduces the chemiluminescence intensity performed with reprecipitated samples from rotational viscometer. Apparently the level of hydroperoxides that are formed in samples having removed all low molar mass additives is markedly reduced (
Figure 6). The observation that the native HA P0207-1A contained a relevant amount of hydroperoxides, while samples
i,
ii and
iii were practically hydroperoxide-free may partly explain differences in DSC records observed in these four samples. Contrary to sample P0207-1A, the higher and different residue content after thermogravimetry measurements of recovered polymers prepared by treating native HA sample with WBOS without and with addition of bucillamine in the system requires additional studies. If Na
2O and NaNO
3 are considered as the components of the residue from sodium hyaluronate, their residual mass should be around 7.5% and 20.9%, respectively. Stability of the dynamic viscosity during HA radical degradation by ascorbate
plus Cu(II) in the presence of bucillamine is indeed a very interesting observation (
Figure 2, panels A and B). We have revealed that, similarly to other free radical oxidations of chain mechanism, the inhibitor, in our case bucillamine, may slow down free radical mediated degradation of the substrate but it did not stop it. Regardless of it HA degraded in the samples
ii and
iii, kept the η value recorded by rotational viscometry (
Figure 2, panel B, curve
iii) or increased even slightly (curve
ii) for at least five hours. In the literature [
40], we may find that bovine synovial fluid and albumin solutions of similar concentration are rheopectic,
i.e., their viscosity increases with time in steady shear. This unusual flow characteristic is caused by protein aggregation, and the total stress is enhanced by entanglement of this tenuous protein network with the long-chain polysaccharide sodium hyaluronate under physiological conditions. Neutron scattering measurements on albumin solutions demonstrate protein aggregation and all measurements are consistent with a weak dipolar attraction energy (of order 3kT) that is most likely augmented by hydrophobic interactions and/or disulfide bond formation between proteins. Our case may have something in common with it. On the one hand HA is fragmented and partially oxidized and its molar mass decreases. On the other hand, a sulphur compound may enhance the dragging of lower molar mass fragments into the coils of hyaluronans by association with oxidized structures and due to the shear stress the rheopexy may occur with parallel increase of viscosity. The similarity of the structural moieties in bucillamine with
N-acetyl groups of glucosamine units may contribute to it. These two opposite phenomena, namely the reduction of molar mass due to degradation and rheopexy due to association mediated by sulphur compounds induced by the shear stress in the rotational viscometer, may temporarily compensate each other.


