
A Study of the Friction Characteristics of Rubber Thermo-Mechanical Coupling

Abstract
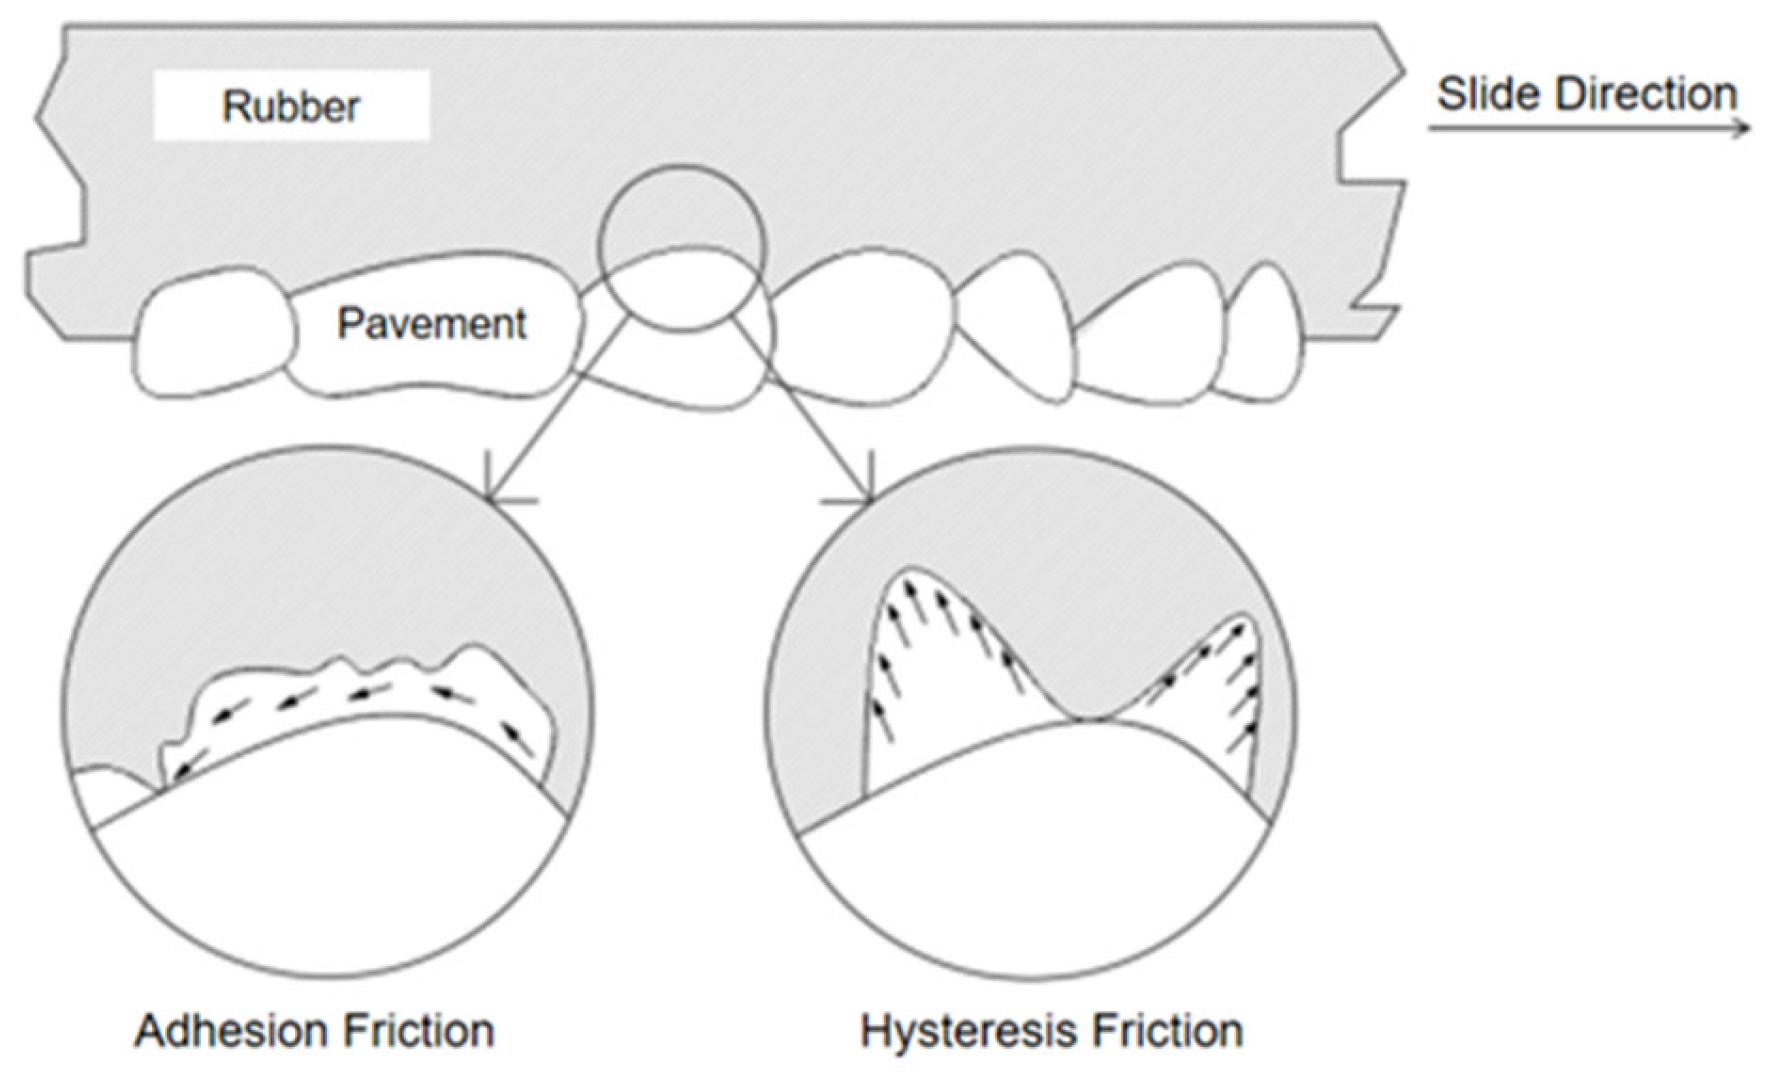
:1. Introduction
2. Experimental Section
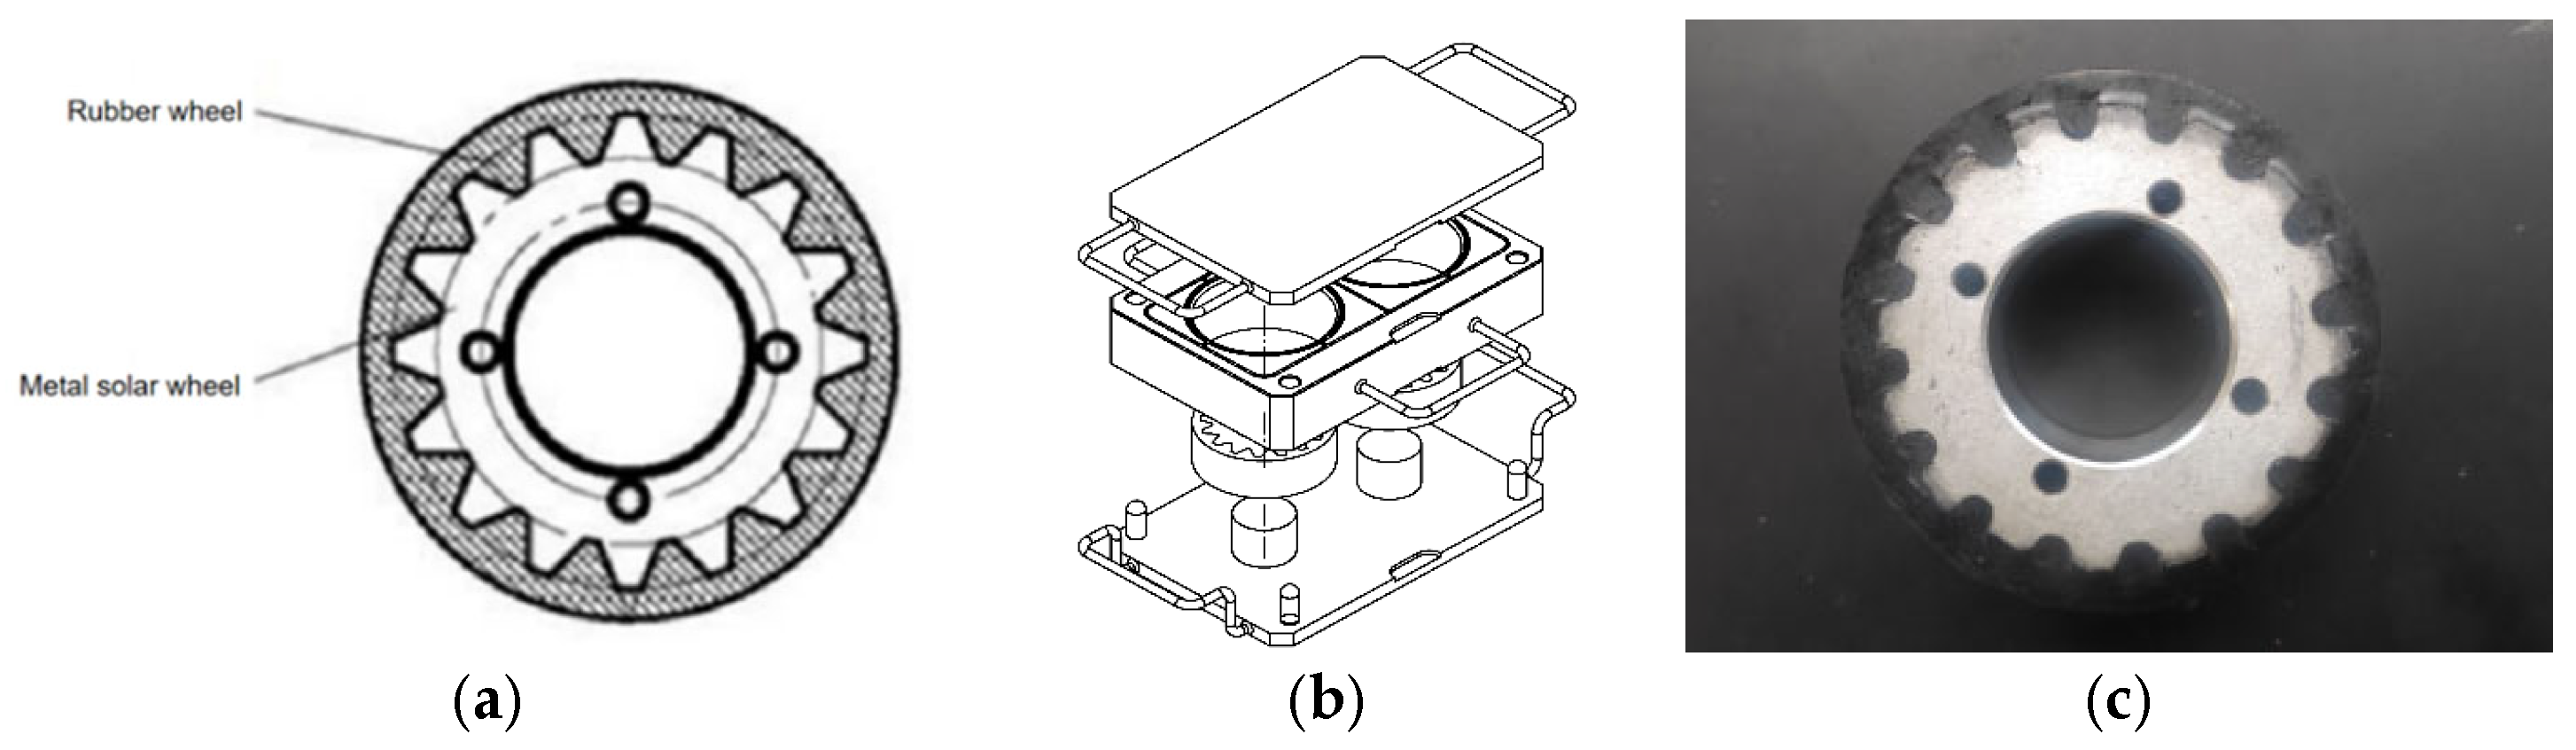
2.1. Test Samples
2.2. Test Equipment and Methods
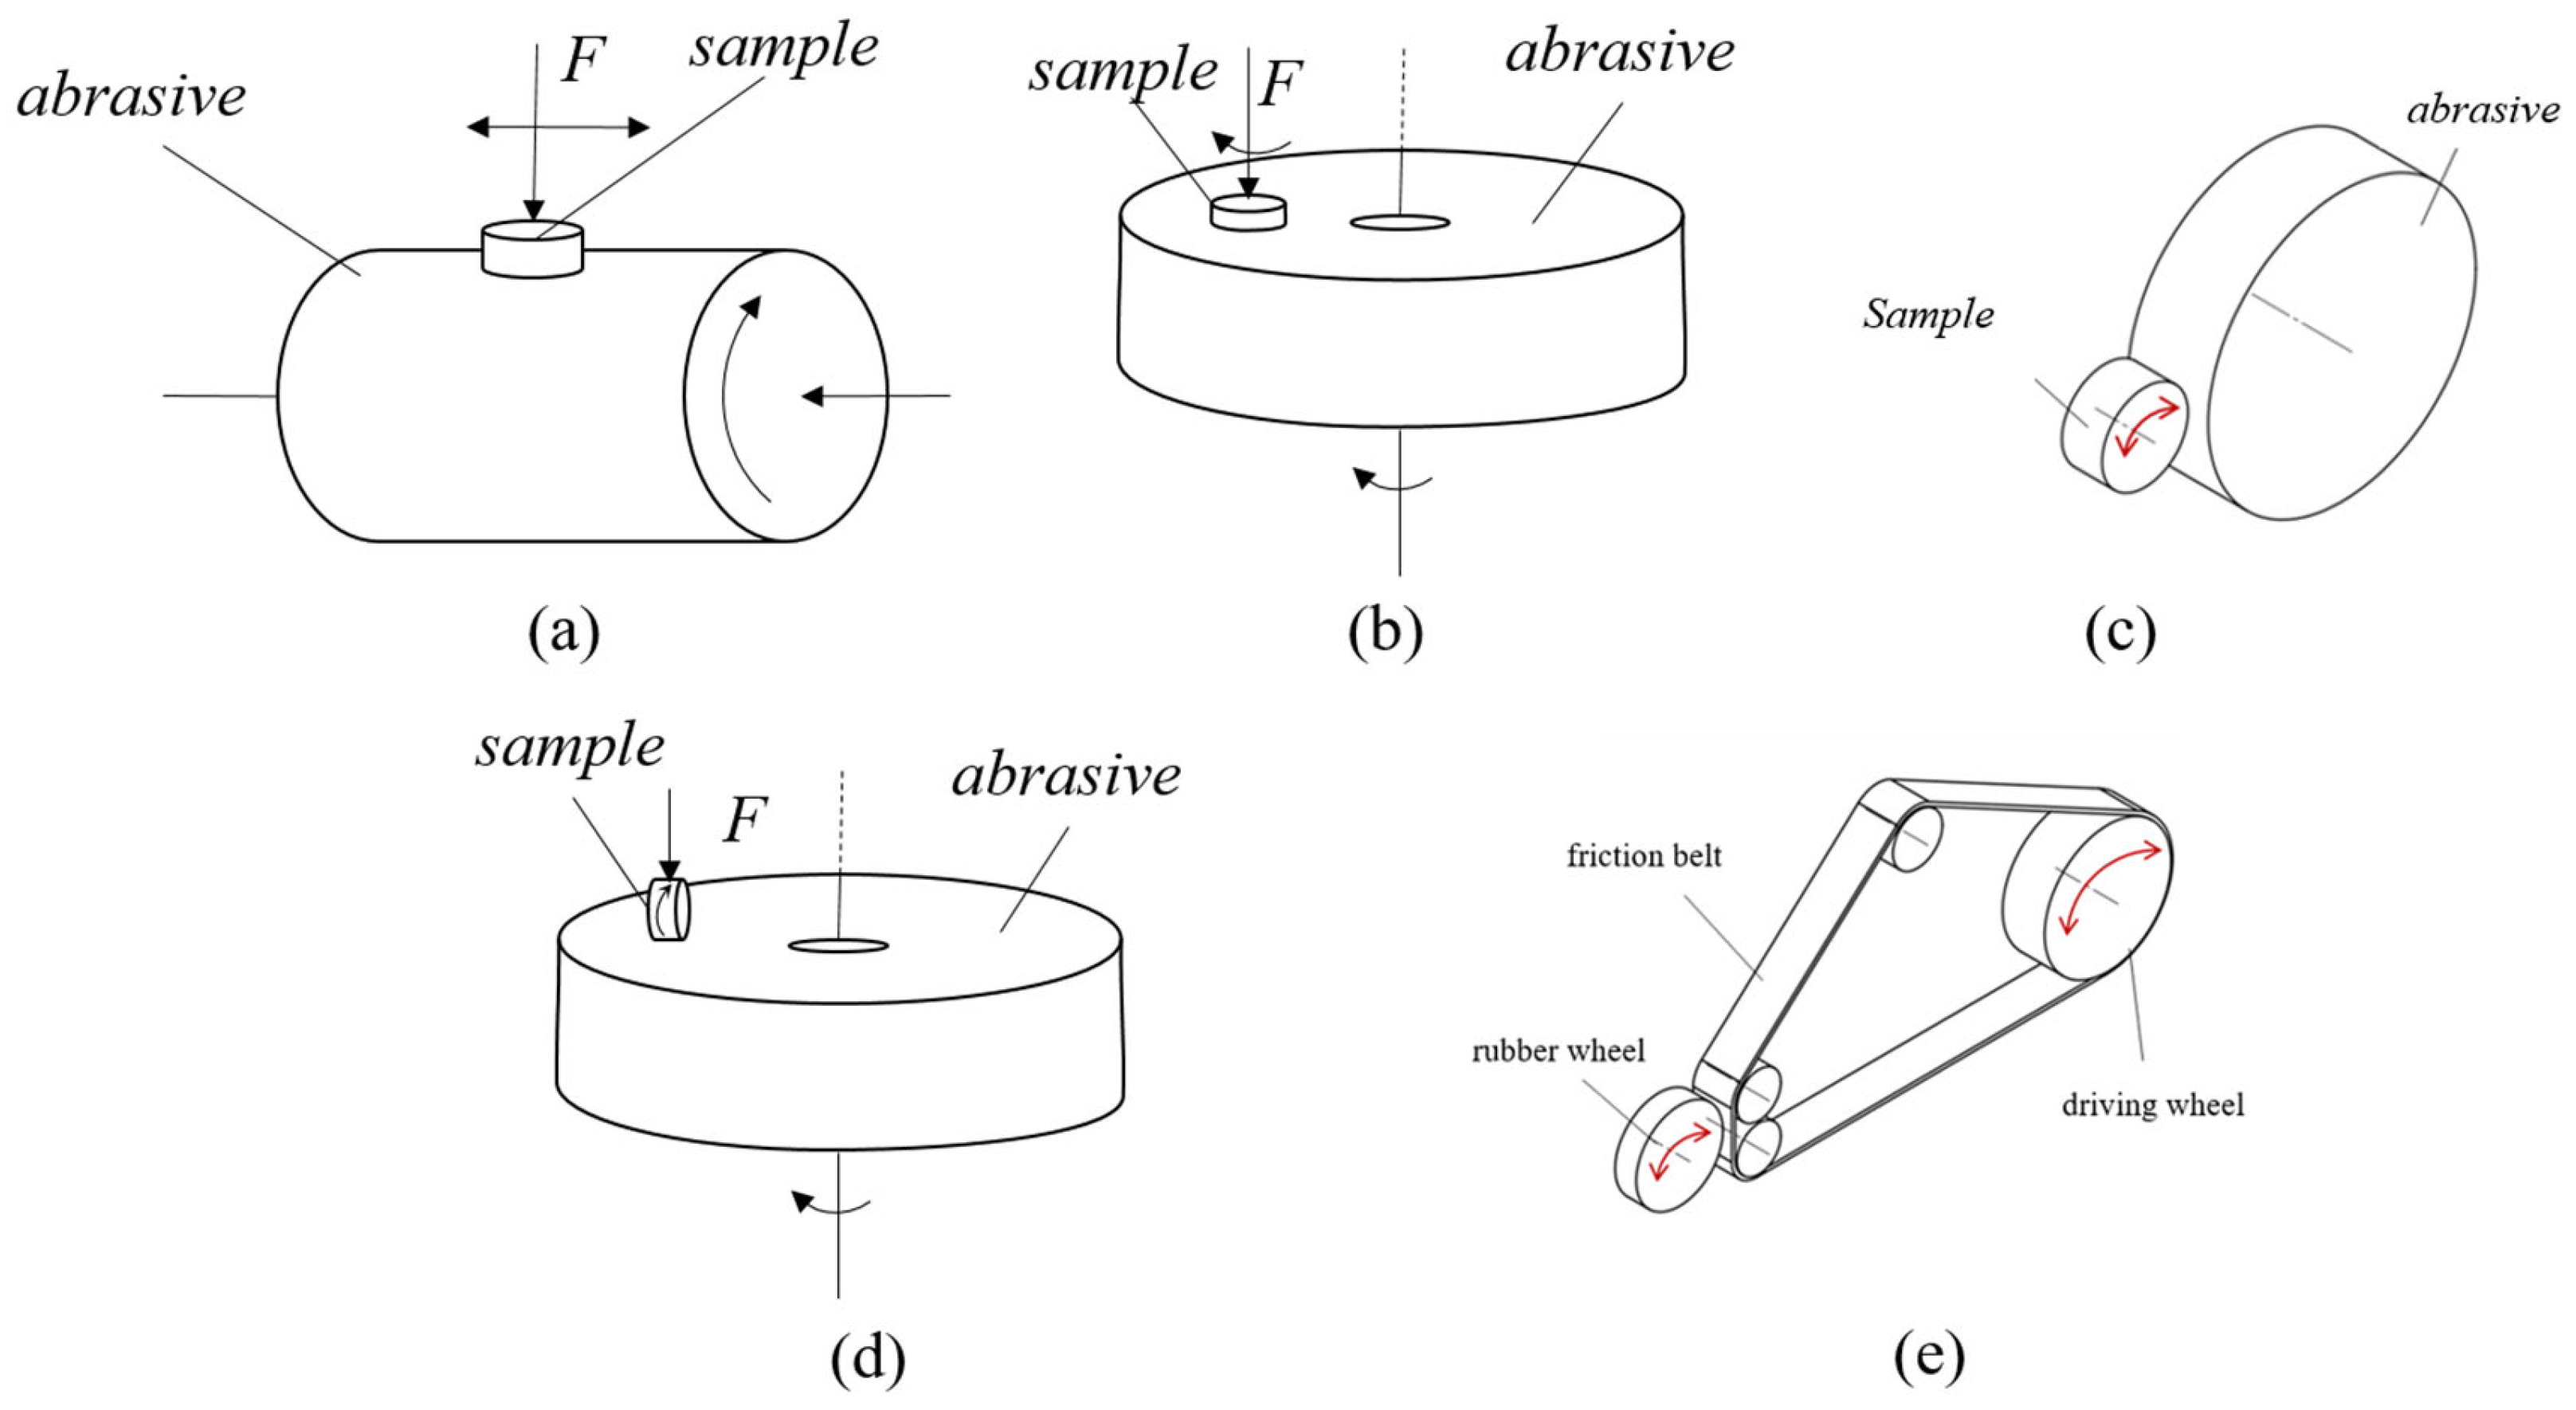
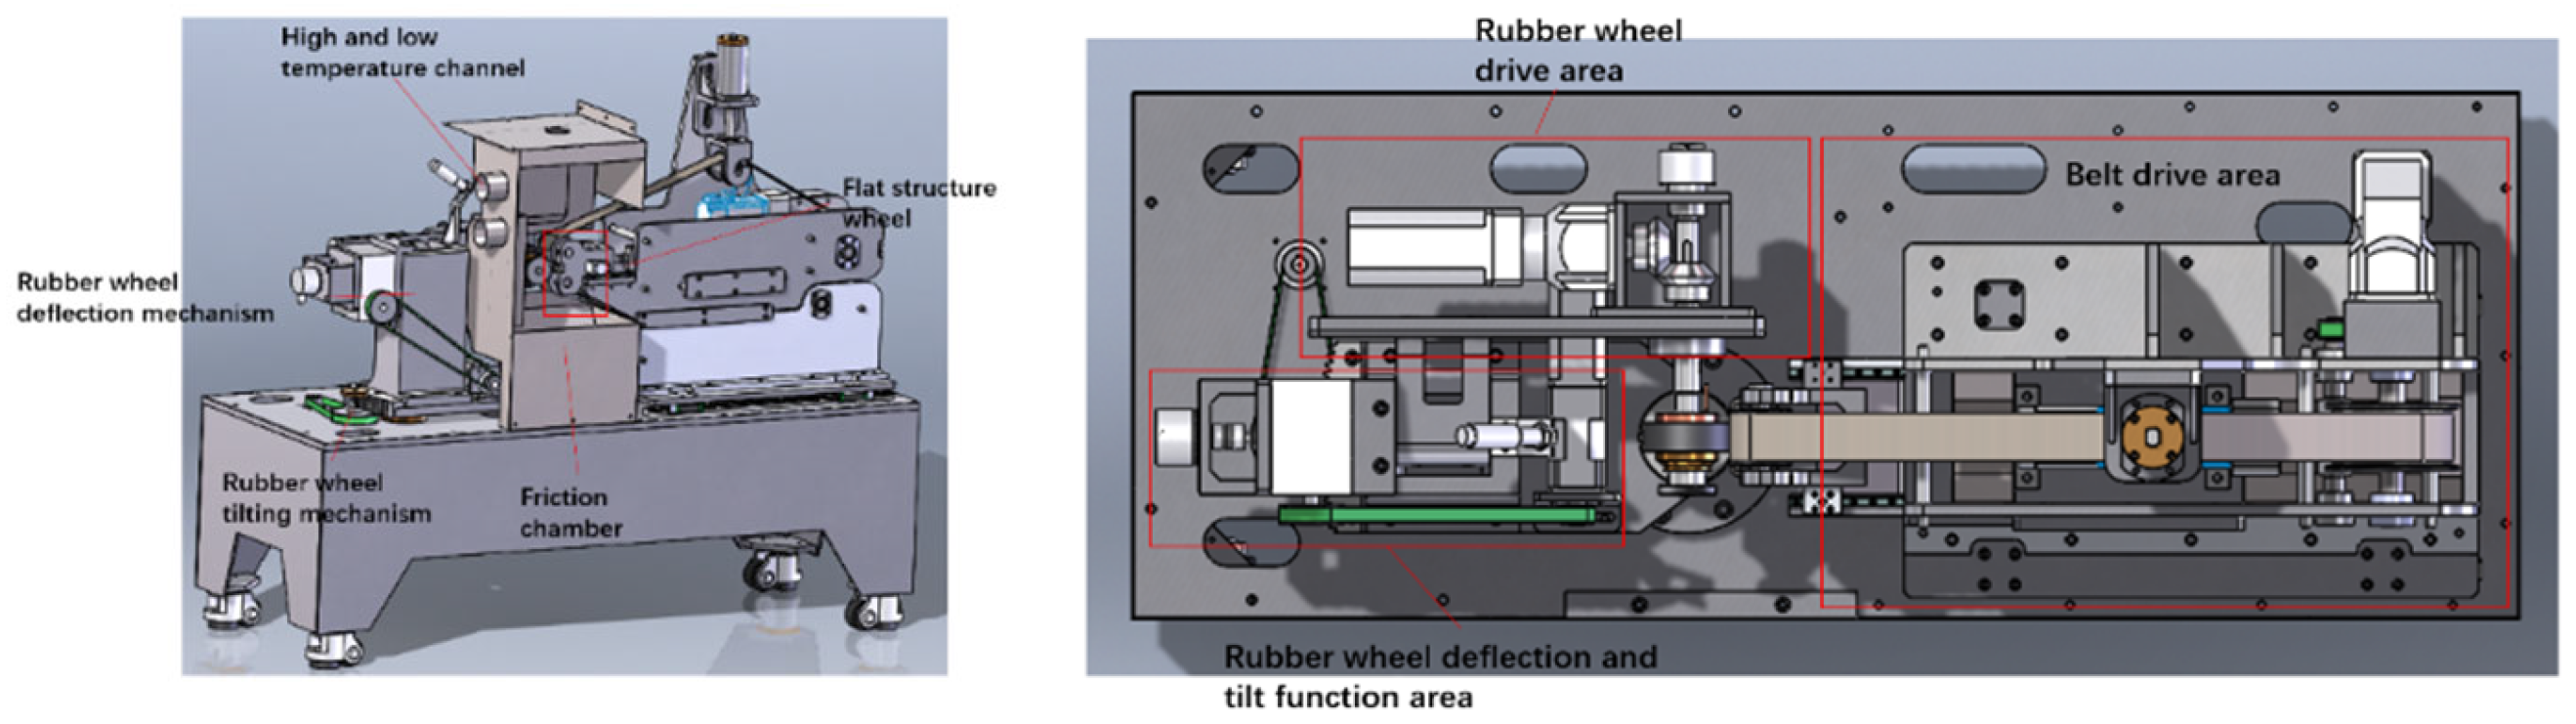
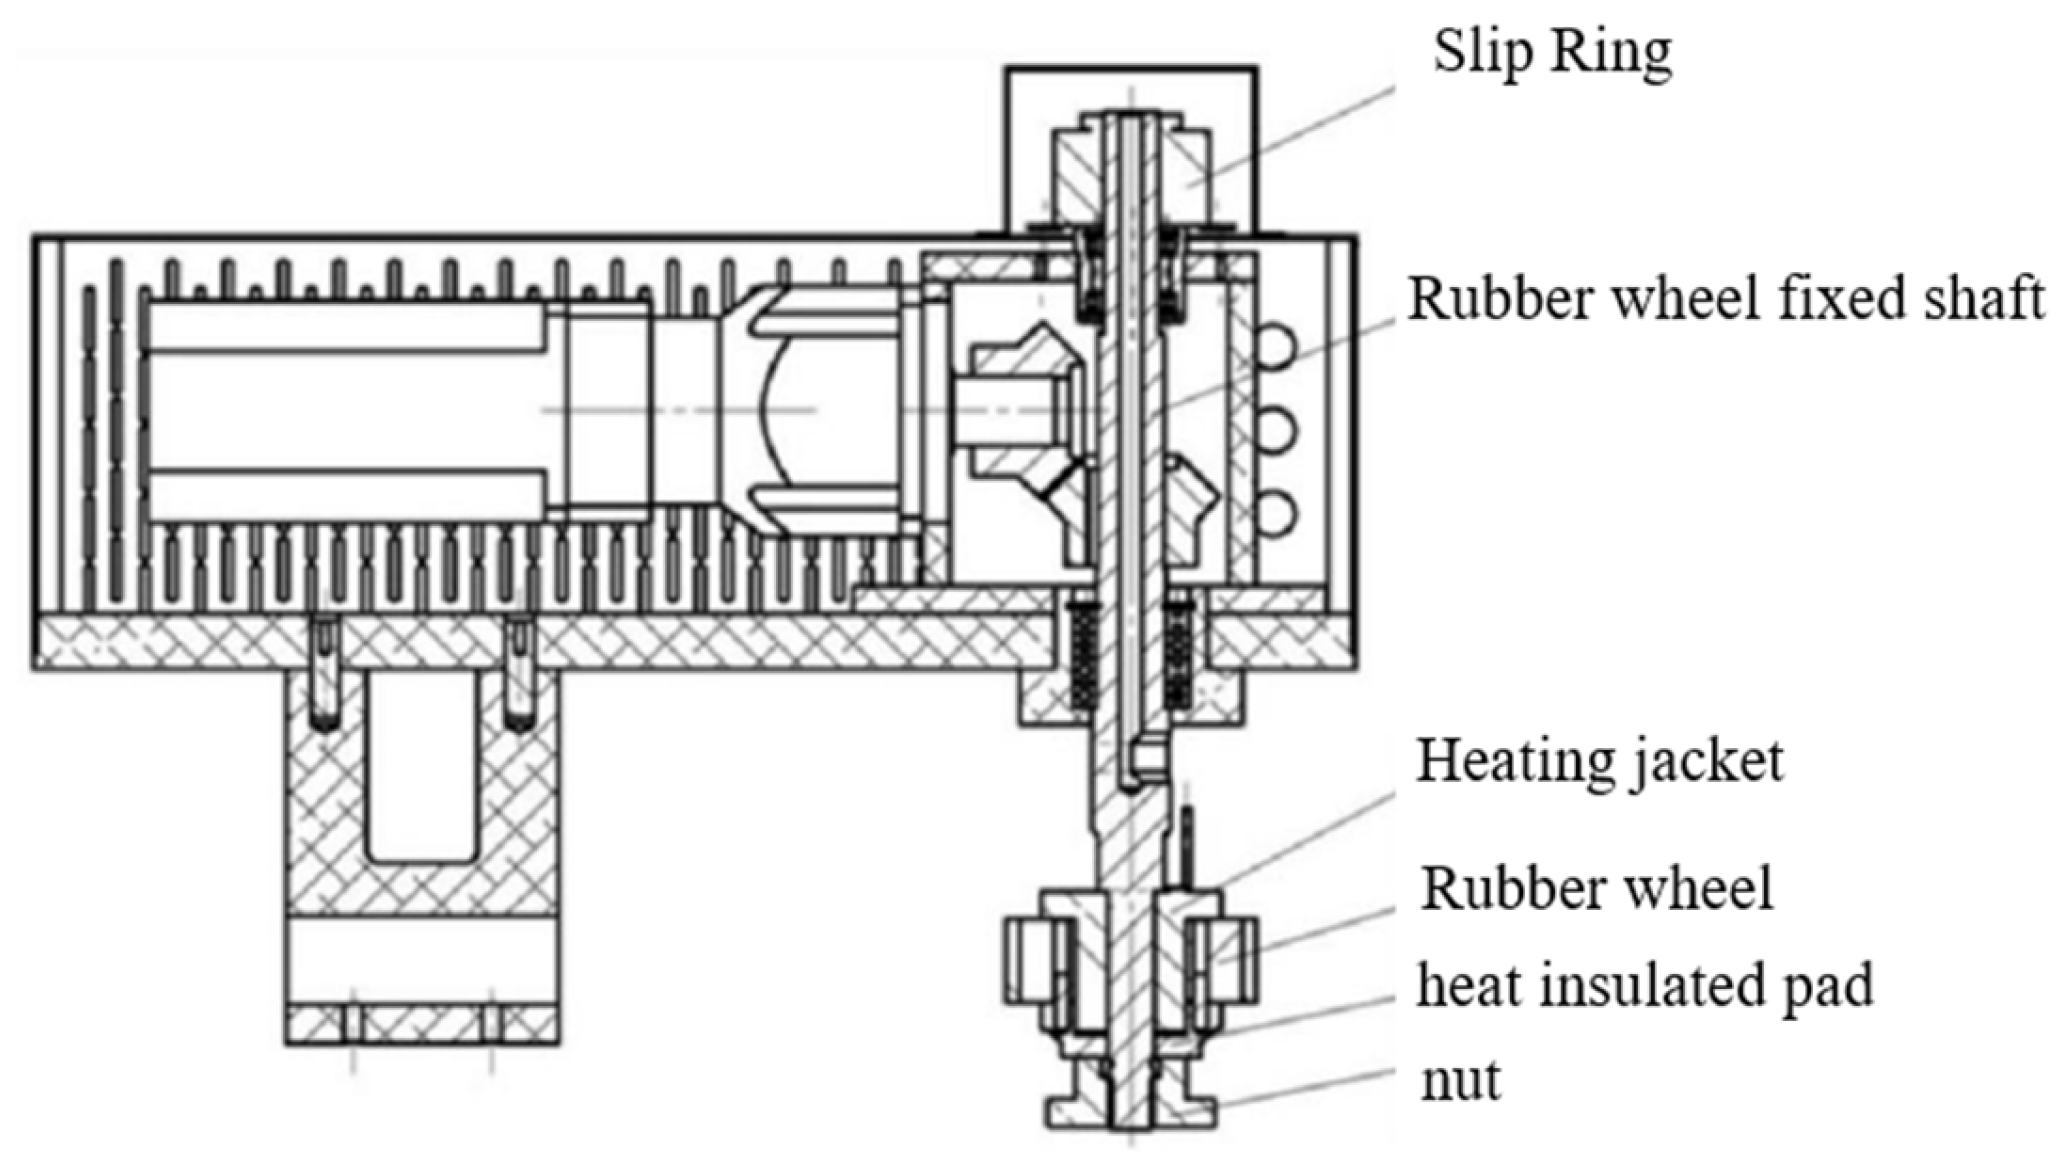
2.2.1. Experimental Equipment
2.2.2. Experimental Methods
- (1)
- Production of the rubber wheel sample
- (2)
- Pretreatment of the rubber wheels
- (3)
- Friction test
- (4)
- Analysis of test results
2.3. Selection of Experimental Conditions
3. Experimental Results and Discussion
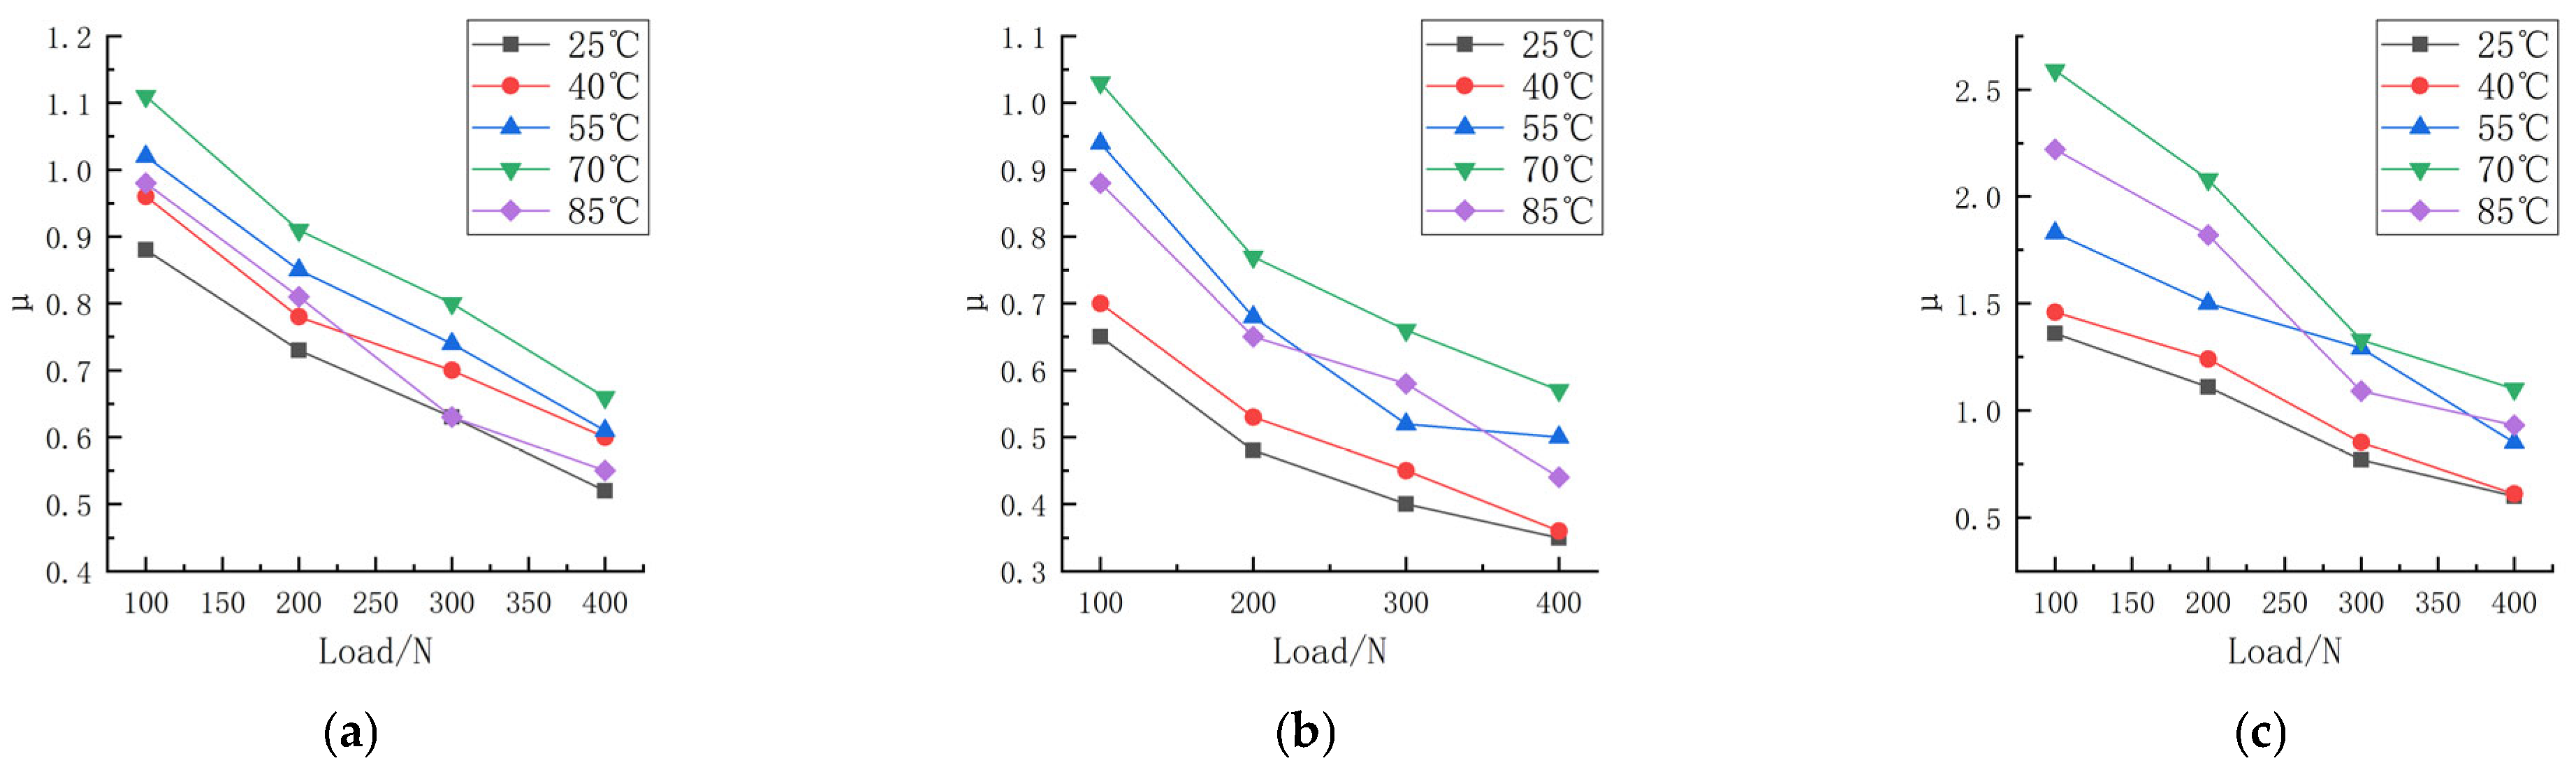
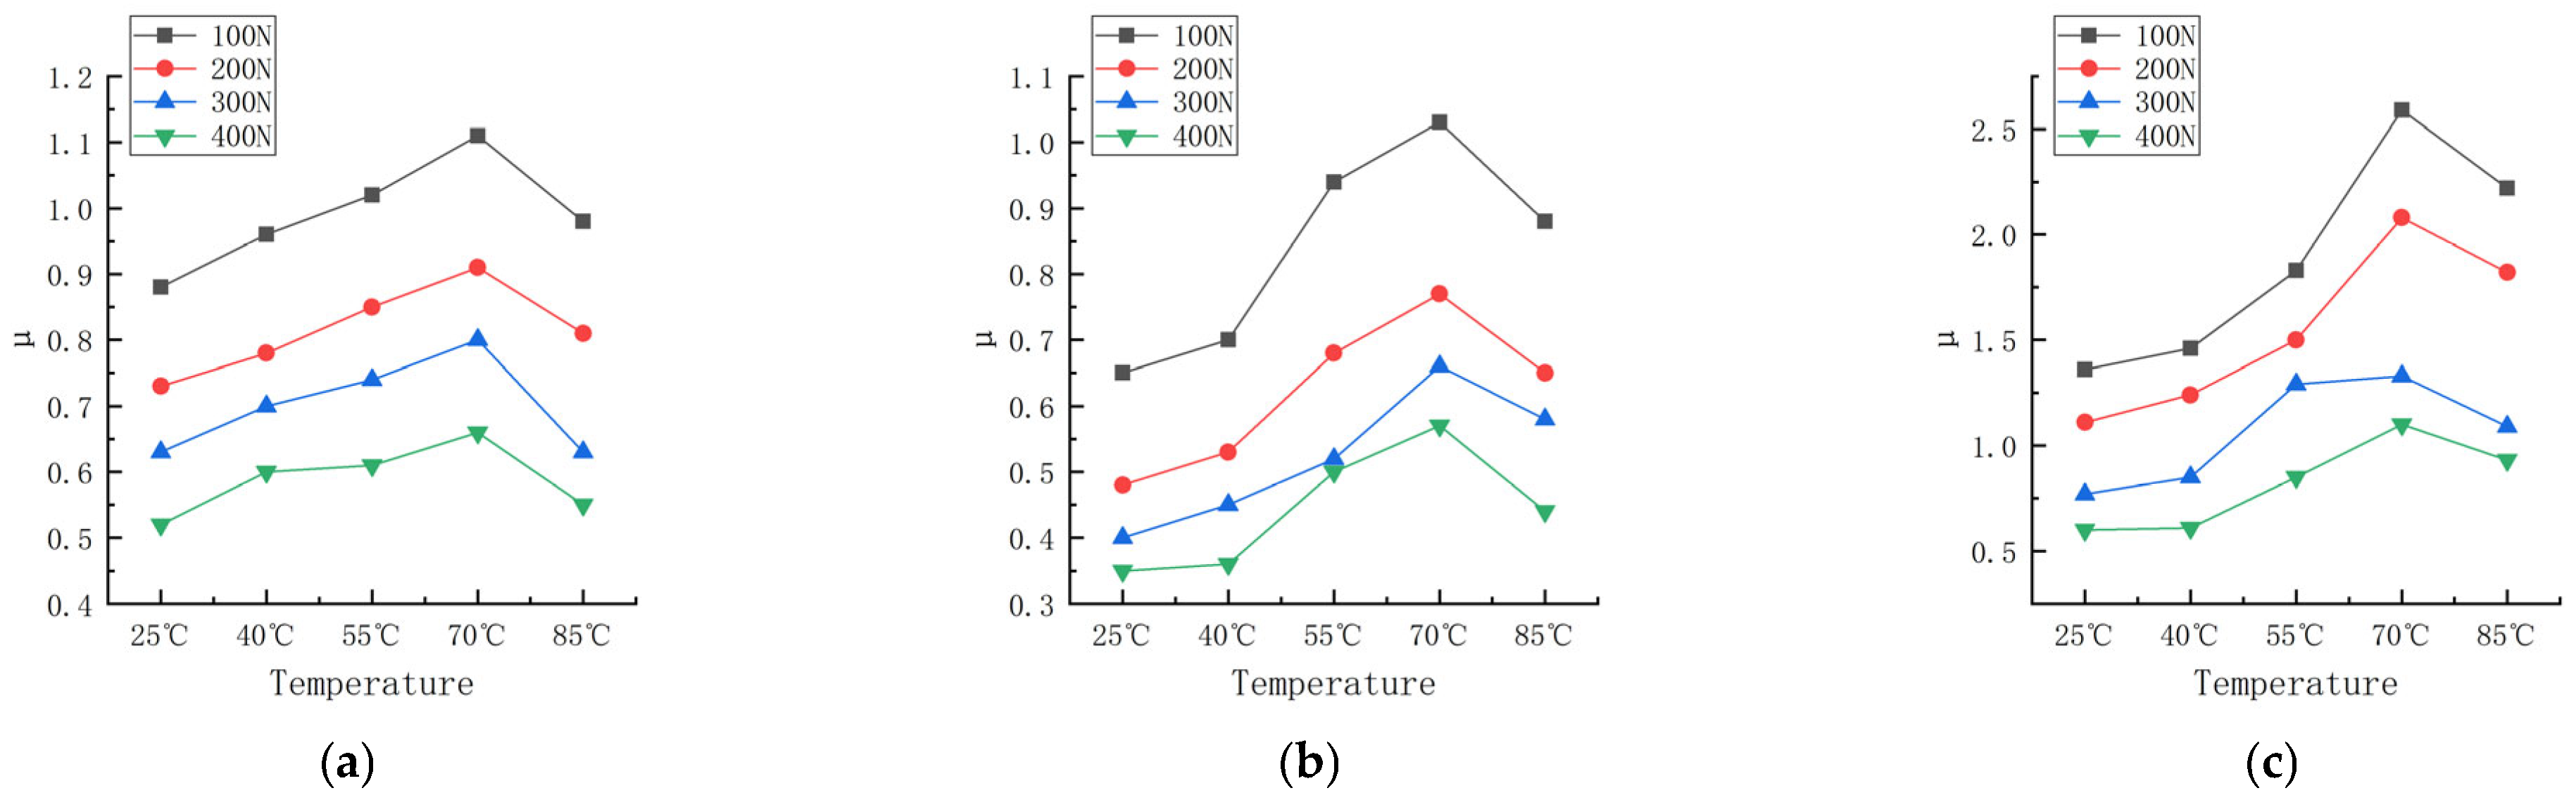
3.1. Effect of the Contact Pressure on the Friction Properties
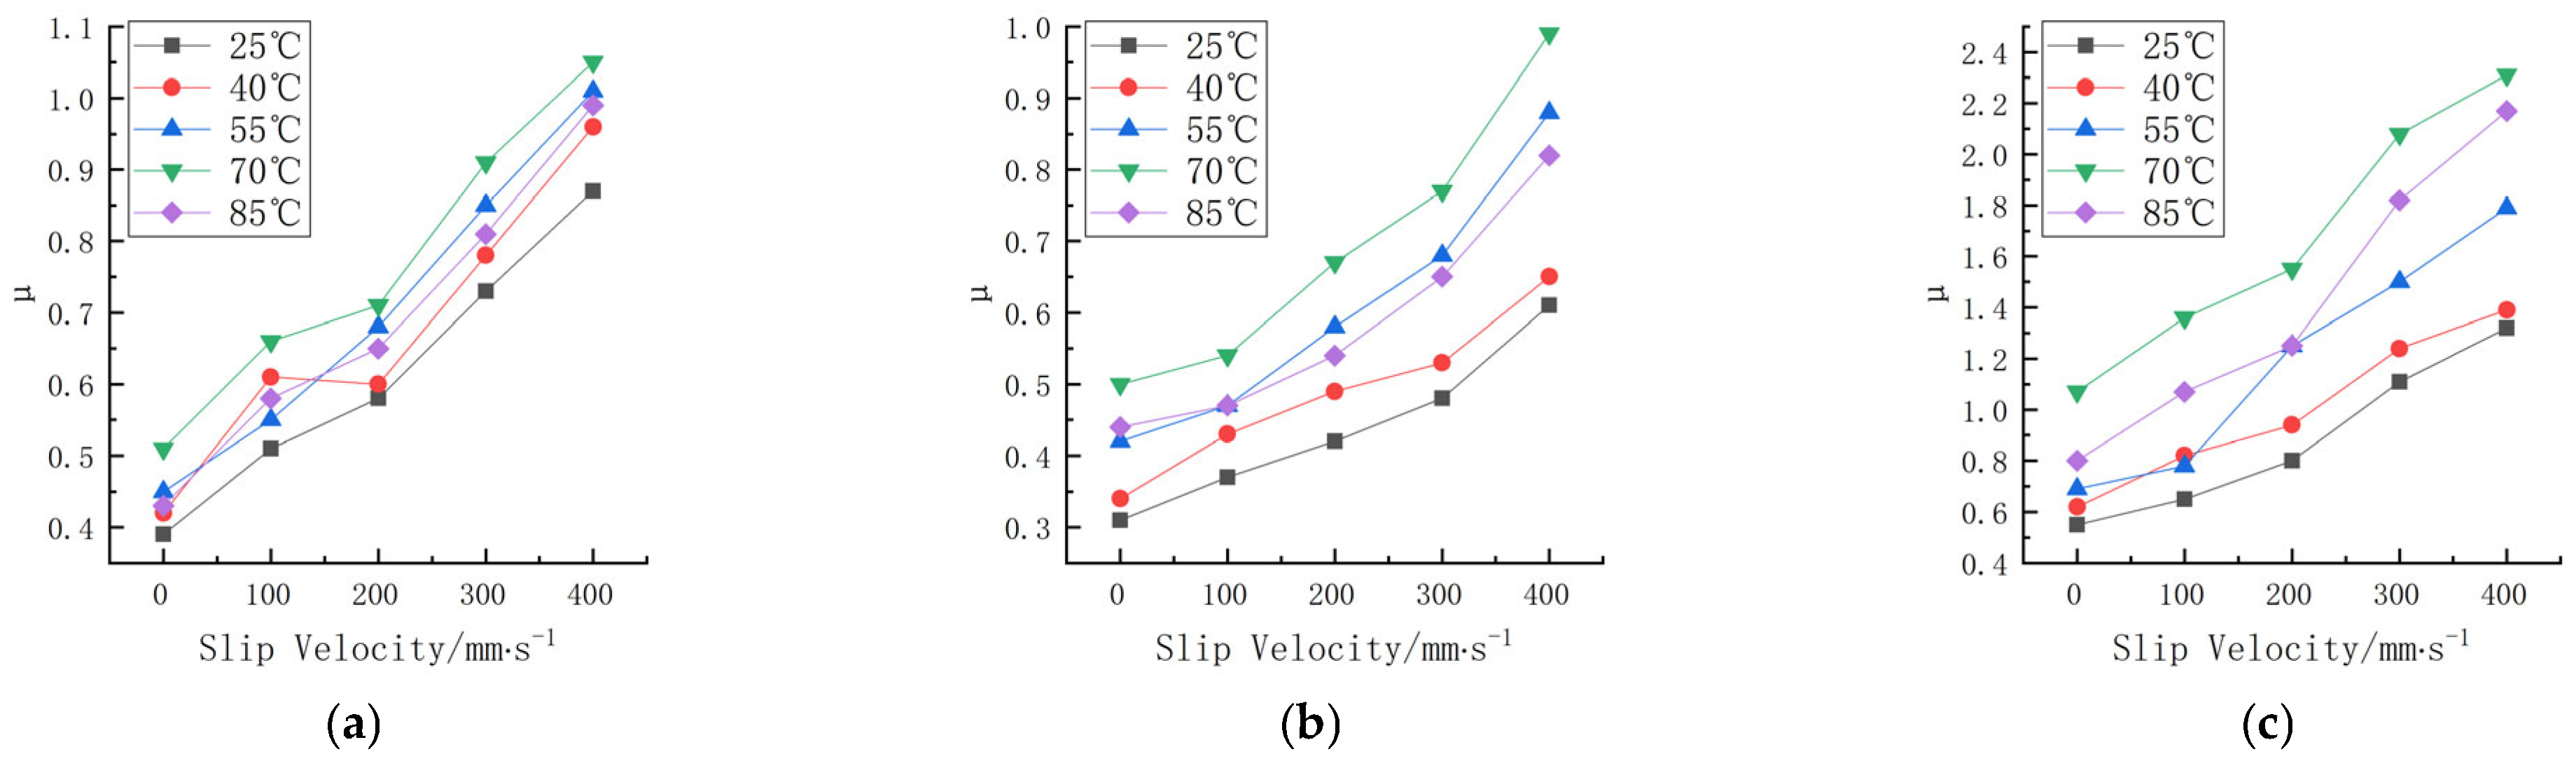
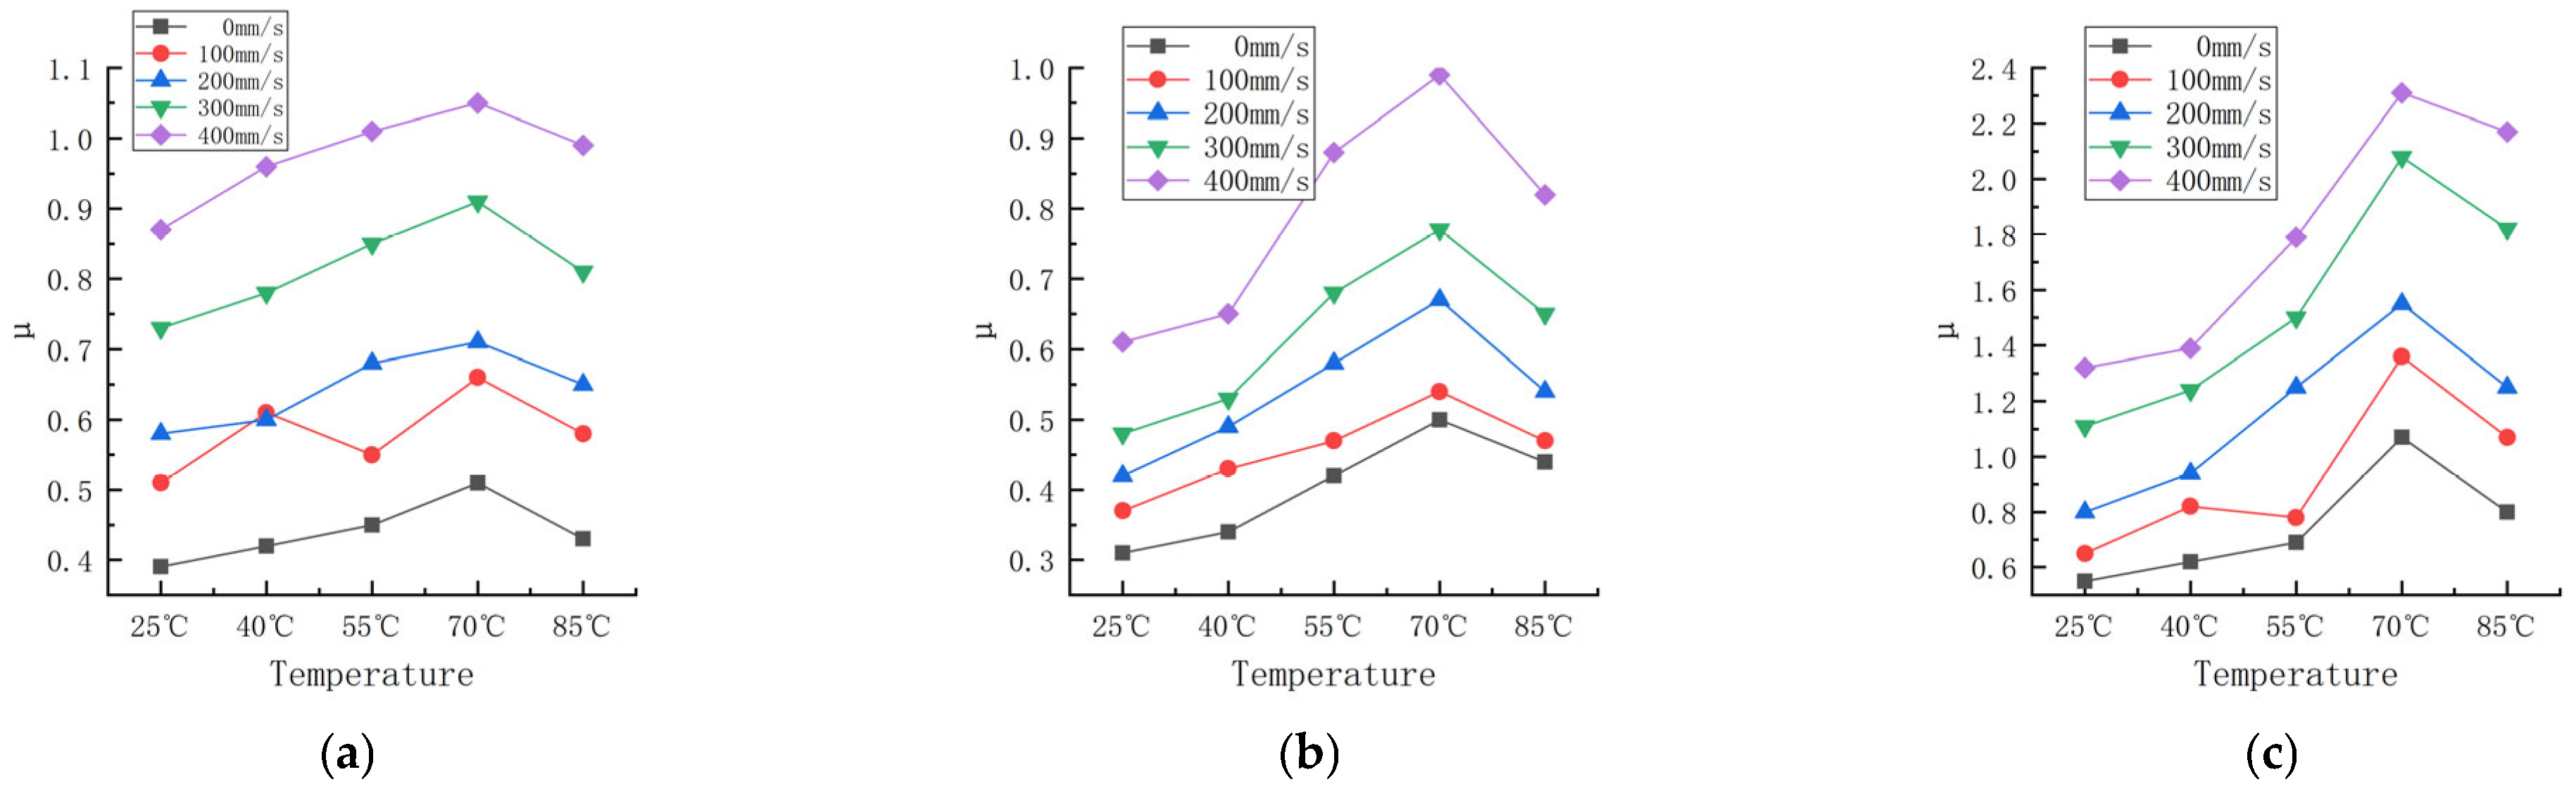
3.2. Effect of the Slip Velocity on the Friction Properties
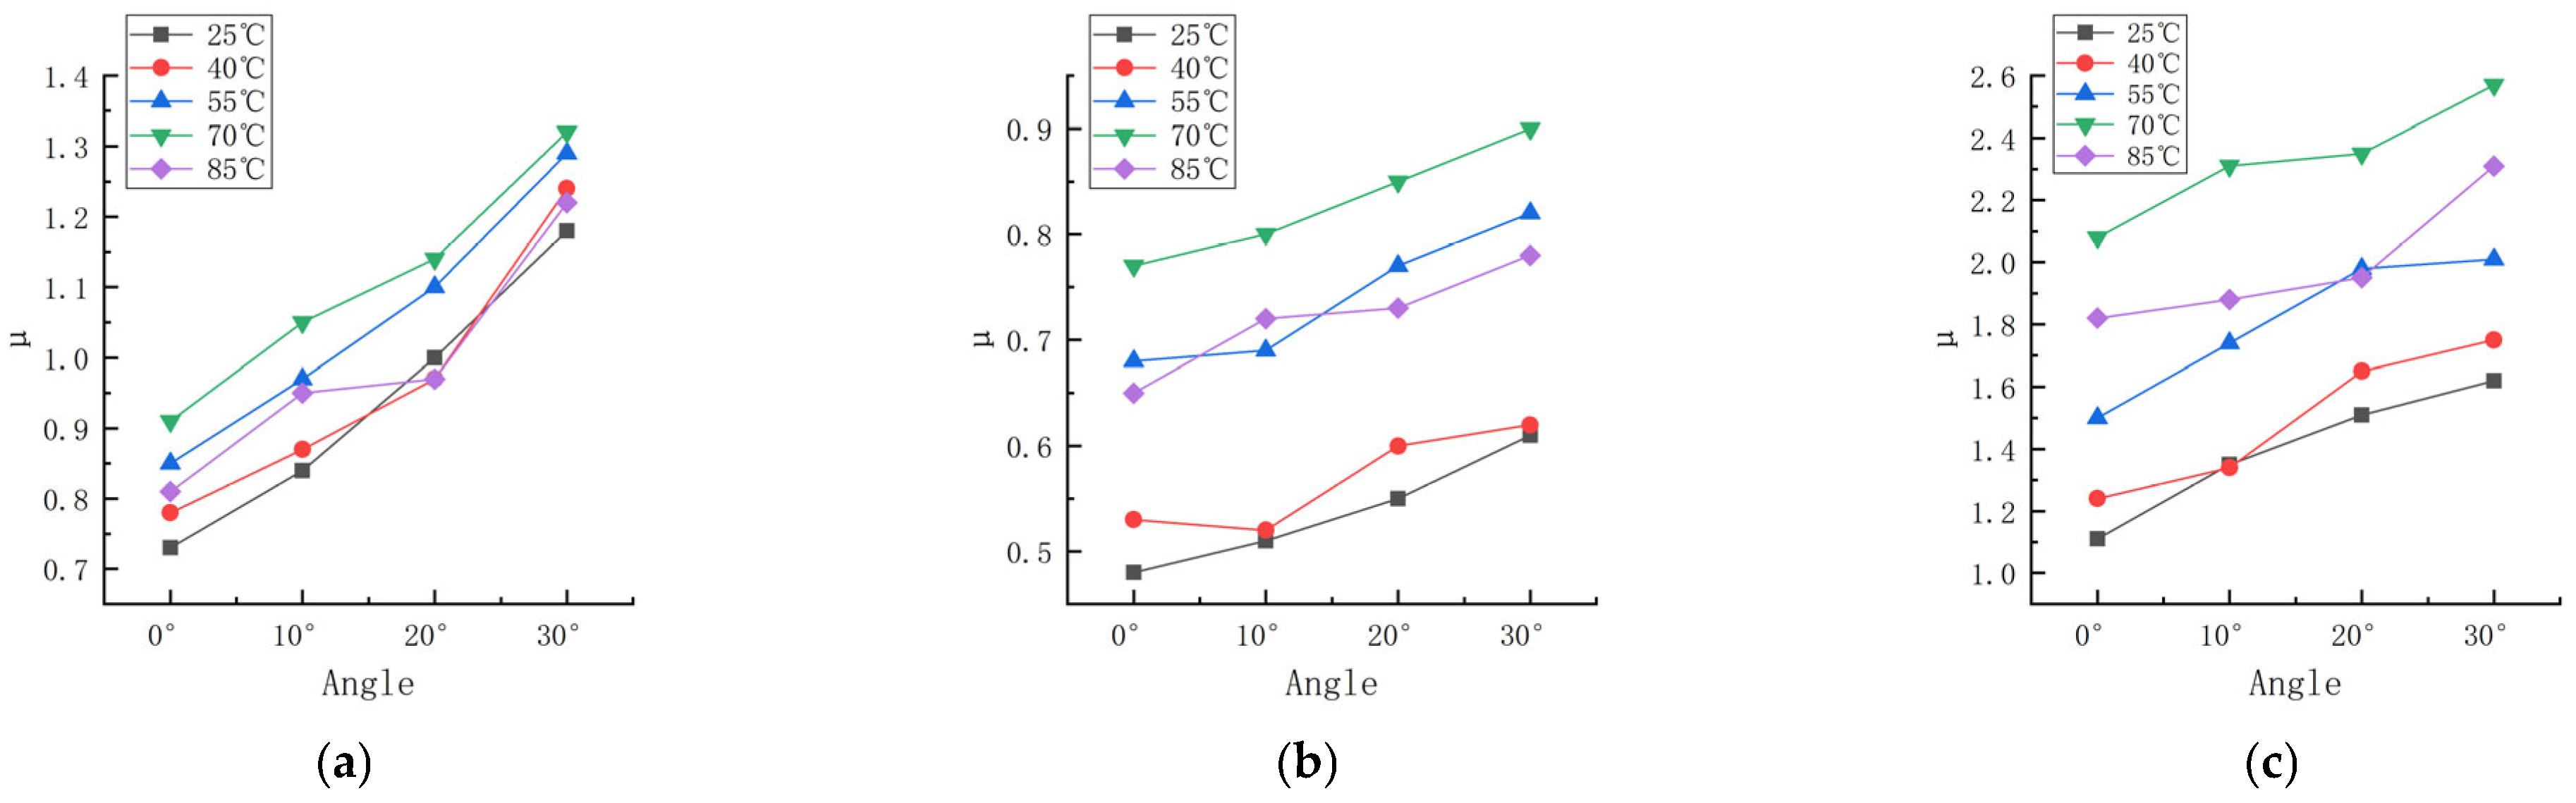
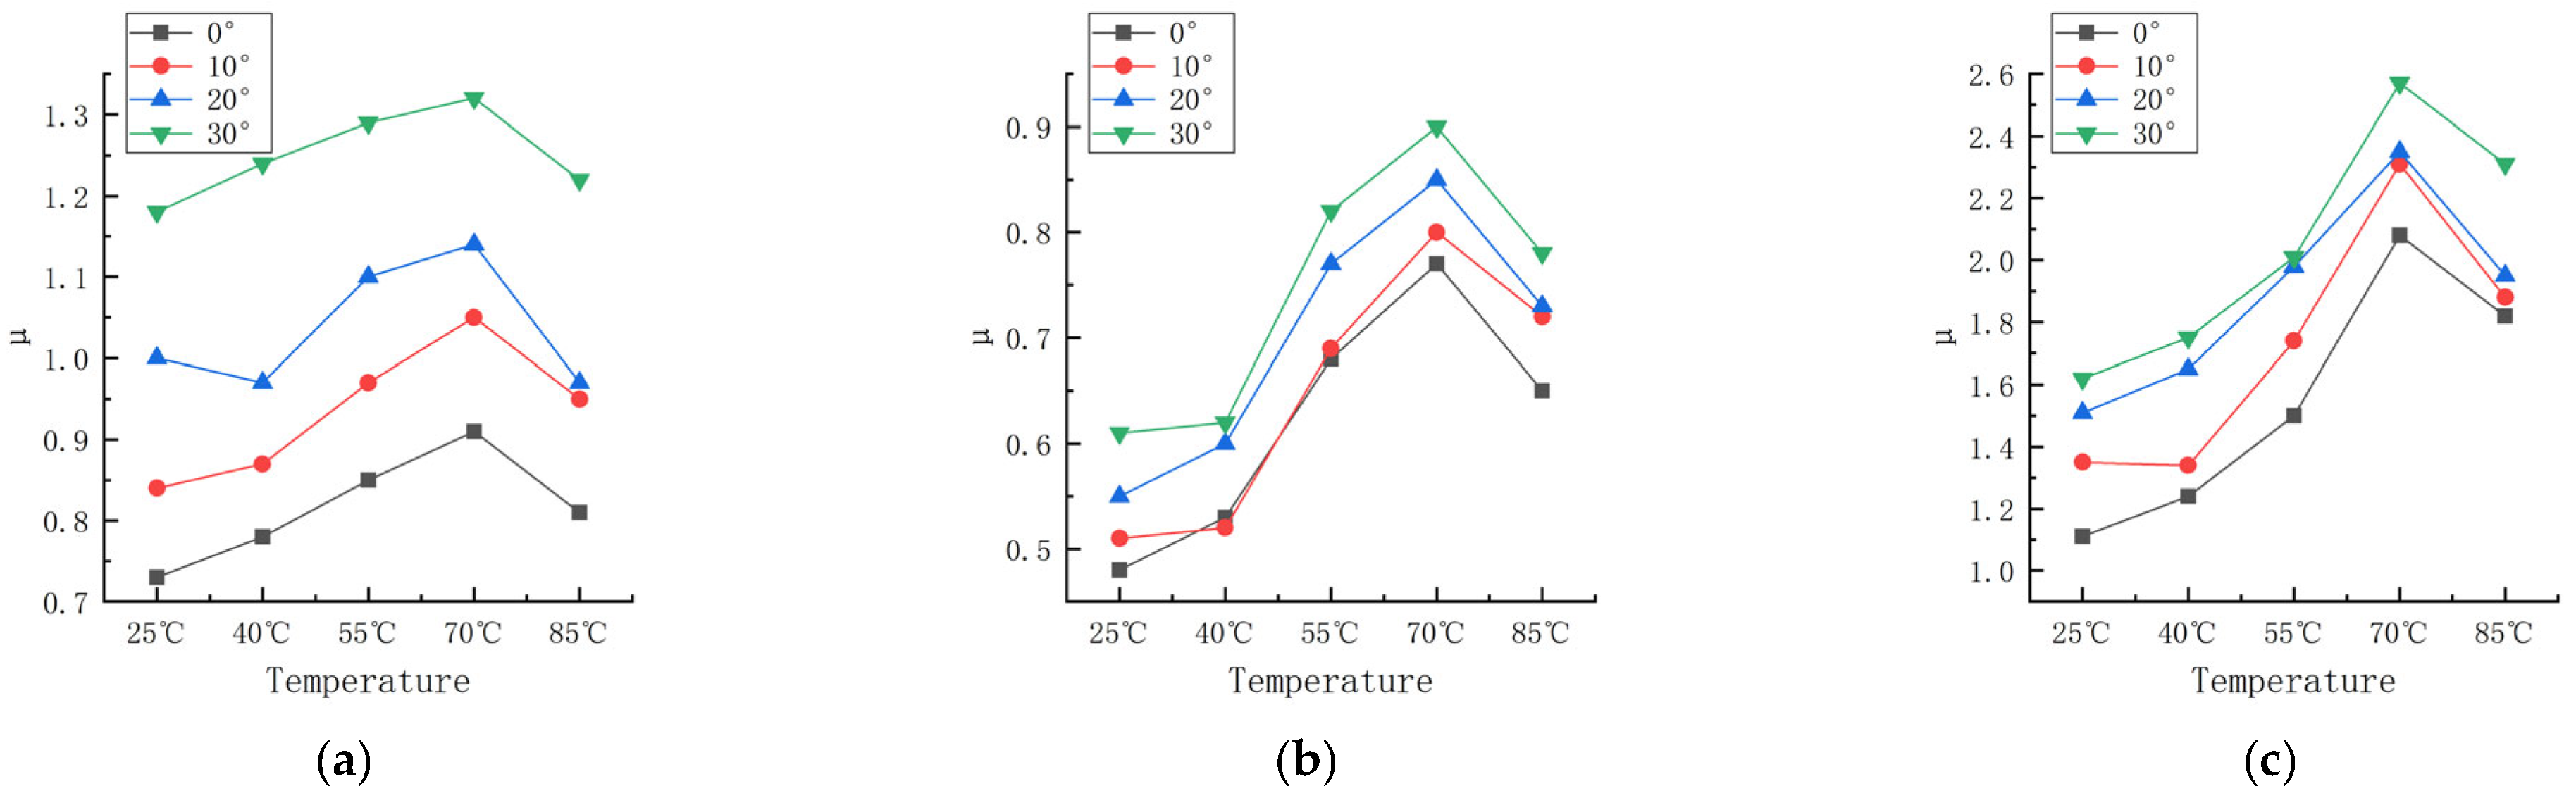
3.3. Effect of the Sideslip Angle on the Friction Properties
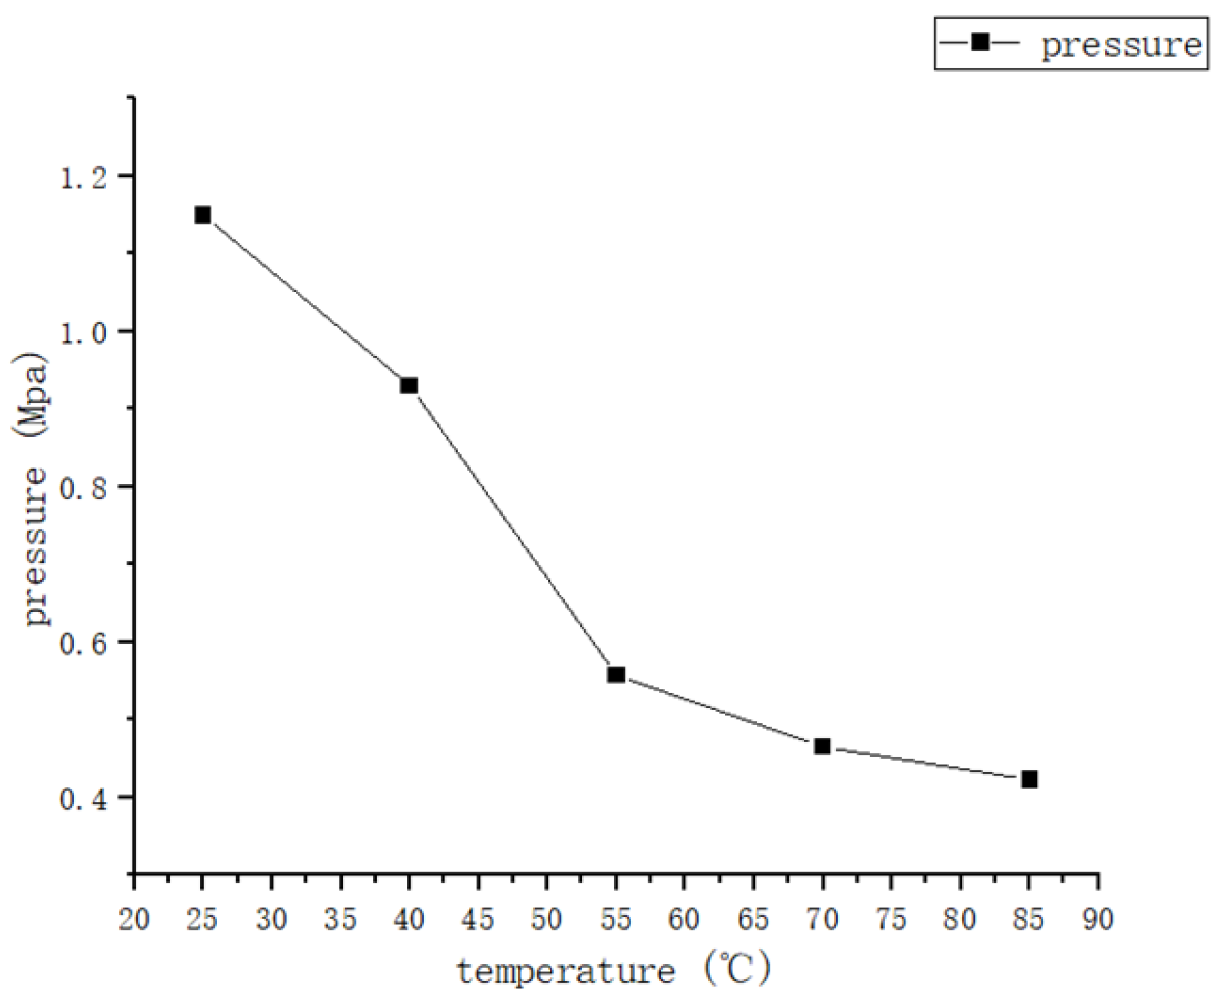
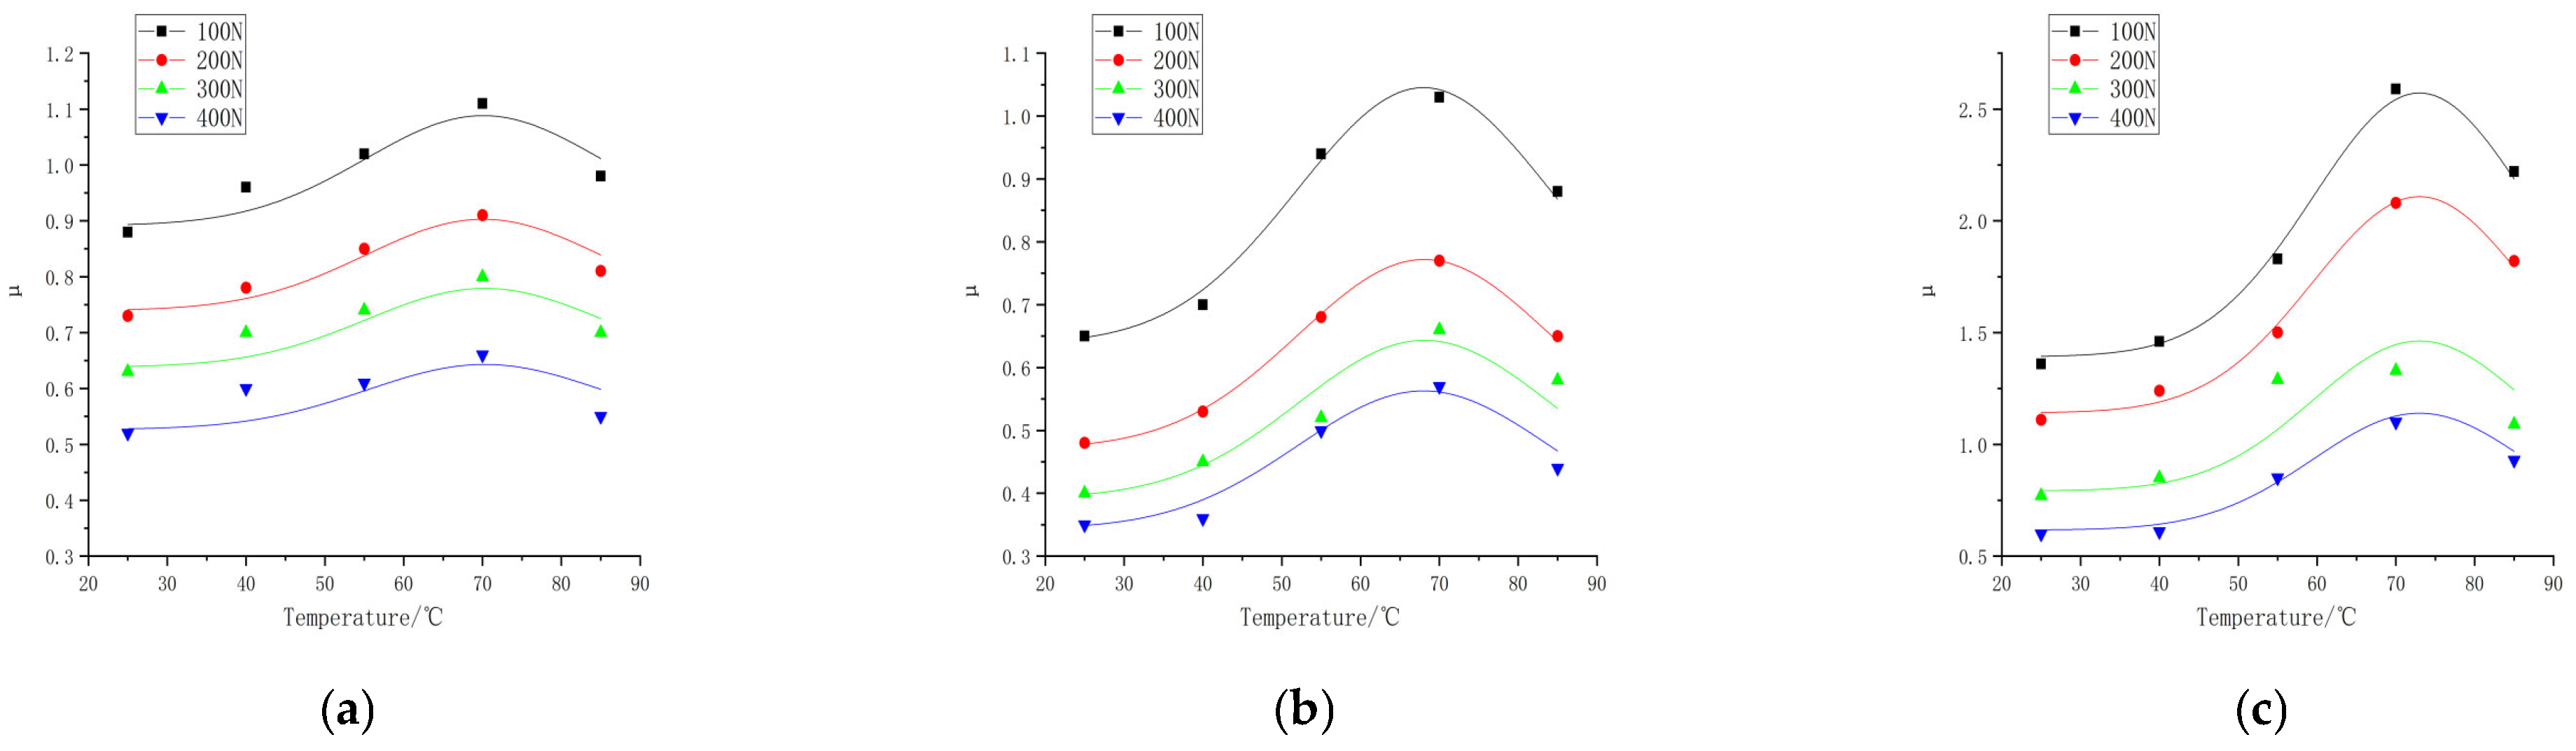
3.4. Effect of the Temperature on the Friction Properties
4. Friction Model Development and Validation
4.1. Modeling Friction
4.2. Validating the Friction Model
4.2.1. Comparison of the Model Predictions and Experimental Test Data under Different Contact Pressures and Temperatures
4.2.2. Fitting Results of the Model to the Experimental Data at Different Slip Velocities
5. Conclusions
Author Contributions
Funding
Data Availability Statement
Acknowledgments
Conflicts of Interest
Appendix A
| Formula | Slip Velocity /mm·s−1 | Load /N | Sideslip Angle /° | Temperature /°C | Friction Coefficient |
| 1# | 300 | 100 | 0 | 25 | 0.88 |
| 1# | 300 | 200 | 0 | 25 | 0.73 |
| 1# | 300 | 300 | 0 | 25 | 0.63 |
| 1# | 300 | 400 | 0 | 25 | 0.52 |
| 1# | 300 | 200 | 0 | 40 | 0.78 |
| 1# | 300 | 200 | 0 | 55 | 0.85 |
| 1# | 300 | 200 | 0 | 70 | 0.91 |
| 1# | 300 | 200 | 0 | 85 | 0.81 |
| 2# | 300 | 100 | 0 | 25 | 0.65 |
| 2# | 300 | 200 | 0 | 25 | 0.48 |
| 2# | 300 | 300 | 0 | 25 | 0.40 |
| 2# | 300 | 400 | 0 | 25 | 0.35 |
| 2# | 300 | 200 | 0 | 40 | 0.53 |
| 2# | 300 | 200 | 0 | 55 | 0.68 |
| 2# | 300 | 200 | 0 | 70 | 0.77 |
| 2# | 300 | 200 | 0 | 85 | 0.65 |
| 3# | 300 | 100 | 0 | 25 | 1.36 |
| 3# | 300 | 200 | 0 | 25 | 1.11 |
| 3# | 300 | 300 | 0 | 25 | 0.77 |
| 3# | 300 | 400 | 0 | 25 | 0.60 |
| 3# | 300 | 200 | 0 | 40 | 1.24 |
| 3# | 300 | 200 | 0 | 55 | 1.50 |
| 3# | 300 | 200 | 0 | 70 | 2.08 |
| 3# | 300 | 200 | 0 | 85 | 1.82 |
| 1# | 0 | 200 | 0 | 25 | 0.39 |
| 1# | 100 | 200 | 0 | 25 | 0.51 |
| 1# | 200 | 200 | 0 | 25 | 0.58 |
| 1# | 400 | 200 | 0 | 25 | 0.87 |
| 1# | 300 | 200 | 0 | 40 | 0.78 |
| 1# | 300 | 200 | 0 | 55 | 0.85 |
| 1# | 300 | 200 | 0 | 70 | 0.91 |
| 1# | 300 | 200 | 0 | 85 | 0.81 |
| 2# | 0 | 200 | 0 | 25 | 0.31 |
| 2# | 100 | 200 | 0 | 25 | 0.37 |
| 2# | 200 | 200 | 0 | 25 | 0.42 |
| 2# | 400 | 200 | 0 | 25 | 0.61 |
| 2# | 300 | 200 | 0 | 40 | 0.53 |
| 2# | 300 | 200 | 0 | 55 | 0.68 |
| 2# | 300 | 200 | 0 | 70 | 0.77 |
| 2# | 300 | 200 | 0 | 85 | 0.65 |
| 3# | 0 | 200 | 0 | 25 | 0.55 |
| 3# | 100 | 200 | 0 | 25 | 0.65 |
| 3# | 200 | 200 | 0 | 25 | 0.80 |
| 3# | 400 | 200 | 0 | 25 | 1.32 |
| 3# | 300 | 200 | 0 | 40 | 1.24 |
| 3# | 300 | 200 | 0 | 55 | 1.50 |
| 3# | 300 | 200 | 0 | 70 | 2.08 |
| 3# | 300 | 200 | 0 | 85 | 1.82 |
| 1# | 300 | 200 | 10 | 25 | 0.84 |
| 1# | 300 | 200 | 20 | 25 | 1.00 |
| 1# | 300 | 200 | 30 | 25 | 1.18 |
| 2# | 300 | 200 | 10 | 25 | 0.51 |
| 2# | 300 | 200 | 20 | 25 | 0.55 |
| 2# | 300 | 200 | 30 | 25 | 0.61 |
| 3# | 300 | 200 | 10 | 25 | 0.51 |
| 3# | 300 | 200 | 20 | 25 | 0.55 |
| 3# | 300 | 200 | 30 | 25 | 0.61 |
Appendix B
| Formula | Slip Velocity /mm·s−1 | Load /N | Sideslip Angle /° | Temperature /°C | Friction Coefficient |
| 1# | 300 | 100 | 0 | 40 | 0.96 |
| 1# | 300 | 100 | 0 | 55 | 1.02 |
| 1# | 300 | 100 | 0 | 70 | 1.11 |
| 1# | 300 | 100 | 0 | 85 | 0.98 |
| 1# | 300 | 300 | 0 | 40 | 0.70 |
| 1# | 300 | 300 | 0 | 55 | 0.74 |
| 1# | 300 | 300 | 0 | 70 | 0.80 |
| 1# | 300 | 300 | 0 | 85 | 0.63 |
| 1# | 300 | 400 | 0 | 40 | 0.60 |
| 1# | 300 | 400 | 0 | 55 | 0.61 |
| 1# | 300 | 400 | 0 | 70 | 0.66 |
| 1# | 300 | 400 | 0 | 85 | 0.55 |
| 2# | 300 | 100 | 0 | 40 | 0.70 |
| 2# | 300 | 100 | 0 | 55 | 0.94 |
| 2# | 300 | 100 | 0 | 70 | 1.03 |
| 2# | 300 | 100 | 0 | 85 | 0.88 |
| 2# | 300 | 300 | 0 | 40 | 0.45 |
| 2# | 300 | 300 | 0 | 55 | 0.52 |
| 2# | 300 | 300 | 0 | 70 | 0.66 |
| 2# | 300 | 300 | 0 | 85 | 0.58 |
| 2# | 300 | 400 | 0 | 40 | 0.36 |
| 2# | 300 | 400 | 0 | 55 | 0.50 |
| 2# | 300 | 400 | 0 | 70 | 0.57 |
| 2# | 300 | 400 | 0 | 85 | 0.44 |
| 3# | 300 | 100 | 0 | 40 | 1.46 |
| 3# | 300 | 100 | 0 | 55 | 1.83 |
| 3# | 300 | 100 | 0 | 70 | 2.59 |
| 3# | 300 | 100 | 0 | 85 | 2.22 |
| 3# | 300 | 300 | 0 | 40 | 0.85 |
| 3# | 300 | 300 | 0 | 55 | 1.29 |
| 3# | 300 | 300 | 0 | 70 | 1.33 |
| 3# | 300 | 300 | 0 | 85 | 1.09 |
| 3# | 300 | 400 | 0 | 40 | 0.61 |
| 3# | 300 | 400 | 0 | 55 | 0.85 |
| 3# | 300 | 400 | 0 | 70 | 1.10 |
| 3# | 300 | 400 | 0 | 85 | 0.93 |
| 1# | 0 | 200 | 0 | 40 | 0.42 |
| 1# | 0 | 200 | 0 | 55 | 0.45 |
| 1# | 0 | 200 | 0 | 70 | 0.51 |
| 1# | 0 | 200 | 0 | 85 | 0.43 |
| 1# | 100 | 200 | 0 | 40 | 0.61 |
| 1# | 100 | 200 | 0 | 55 | 0.55 |
| 1# | 100 | 200 | 0 | 70 | 0.66 |
| 1# | 100 | 200 | 0 | 85 | 0.58 |
| 1# | 200 | 200 | 0 | 40 | 0.60 |
| 1# | 200 | 200 | 0 | 55 | 0.68 |
| 1# | 200 | 200 | 0 | 70 | 0.74 |
| 1# | 200 | 200 | 0 | 85 | 0.65 |
| 1# | 400 | 200 | 0 | 40 | 0.96 |
| 1# | 400 | 200 | 0 | 55 | 1.01 |
| 1# | 400 | 200 | 0 | 70 | 1.05 |
| 1# | 400 | 200 | 0 | 85 | 0.99 |
| 2# | 0 | 200 | 0 | 40 | 0.34 |
| 2# | 0 | 200 | 0 | 55 | 0.42 |
| 2# | 0 | 200 | 0 | 70 | 0.50 |
| 2# | 0 | 200 | 0 | 85 | 0.44 |
| 2# | 100 | 200 | 0 | 40 | 0.43 |
| 2# | 100 | 200 | 0 | 55 | 0.47 |
| 2# | 100 | 200 | 0 | 70 | 0.54 |
| 2# | 100 | 200 | 0 | 85 | 0.47 |
| 2# | 200 | 200 | 0 | 40 | 0.49 |
| 2# | 200 | 200 | 0 | 55 | 0.58 |
| 2# | 200 | 200 | 0 | 70 | 0.67 |
| 2# | 200 | 200 | 0 | 85 | 0.54 |
| 2# | 400 | 200 | 0 | 40 | 0.65 |
| 2# | 400 | 200 | 0 | 55 | 0.88 |
| 2# | 400 | 200 | 0 | 70 | 0.99 |
| 2# | 400 | 200 | 0 | 85 | 0.82 |
| 3# | 0 | 200 | 0 | 40 | 0.62 |
| 3# | 0 | 200 | 0 | 55 | 0.69 |
| 3# | 0 | 200 | 0 | 70 | 1.07 |
| 3# | 0 | 200 | 0 | 85 | 0.80 |
| 3# | 100 | 200 | 0 | 40 | 0.82 |
| 3# | 100 | 200 | 0 | 55 | 0.78 |
| 3# | 100 | 200 | 0 | 70 | 1.36 |
| 3# | 100 | 200 | 0 | 85 | 1.07 |
| 3# | 200 | 200 | 0 | 40 | 0.94 |
| 3# | 200 | 200 | 0 | 55 | 1.25 |
| 3# | 200 | 200 | 0 | 70 | 1.55 |
| 3# | 200 | 200 | 0 | 85 | 1.25 |
| 3# | 400 | 200 | 0 | 40 | 1.39 |
| 3# | 400 | 200 | 0 | 55 | 1.79 |
| 3# | 400 | 200 | 0 | 70 | 2.31 |
| 3# | 400 | 200 | 0 | 85 | 2.17 |
References
- Wilkinson, S.C. Study of the factors affecting the friction of tread compounds on ice. Rubber Chem. Technol. 1954, 128, 475–481. [Google Scholar] [CrossRef]
- Grosch, K.A. The Relation between the Friction and Visco-Elastic Properties of Rubber. Proc. R. Soc. A Math. Phys. Eng. Sci. 1963, 274, 21–39. [Google Scholar]
- Wu, Y.P.; Zhou, Y.; Li, J.L.; Zhou, H.D.; Chen, J.M.; Zhao, H.C. A comparative study on wear behavior and mechanism of styrene butadiene rubber under dry and wet conditions. Wear 2016, 356–357, 1–8. [Google Scholar] [CrossRef]
- Bazlamit, S.M.; Reza, F. Changes in Asphalt Pavement Friction Components and Adjustment of Skid Number for Temperature. J. Transp. Eng. 2005, 131, 470–476. [Google Scholar] [CrossRef]
- Anupam, K.; Srirangam, S.K.; Scarpas, A.; Kasbergen, C. Influence of Temperature on Tire-Pavement Friction: Analyses. Transp. Res. Rec. J. Transp. Res. Board 2013, 2369, 114–124. [Google Scholar] [CrossRef]
- McFarlane, J.S.; Tabor, D. Relation between Friction and Adhesion. Proc. R. Soc. Lond. A 1950, 202, 244–253. [Google Scholar]
- Schallamach, A. Friction and abrasion of rubber. Wear 1958, 1, 384–417. [Google Scholar] [CrossRef]
- Savkoor, A.R. On the friction of rubber. Wear 1965, 8, 222–237. [Google Scholar] [CrossRef]
- Dorsch, V.; Becker, A.; Vossen, L. Enhanced rubber friction model for finite element simulations of rolling tyres. Plast. Rubber Compos. 2013, 31, 458–464. [Google Scholar] [CrossRef]
- Canudas-De-Wit, C.; Tsiotras, P.; Velenis, E.; Basset, M.; Gissinger, G. Dynamic friction models for road/tire longitudinal interaction. Veh. Syst. Dyn. 2003, 39, 189–226. [Google Scholar] [CrossRef]
- Liang, K.; Tu, Q.-Z.; Shen, X.-M.; Fang, Z.-H.; Yang, X.; Zhang, Y.; Xiang, H.-Y. An improved LuGre model for calculating static steering torque of rubber tracked chassis. Def. Technol. 2022, 18, 797–810. [Google Scholar] [CrossRef]
- Shao, R.; Wahle, M.; Zimmermann, M. A model for the dynamic friction behaviour of rubber-like materials. Tribol. Int. 2021, 164, 107220. [Google Scholar] [CrossRef]
- Fortunato, G.; Ciaravola, V.; Furno, A.; Scaraggi, M.; Lorenz, B.; Persson, B.N.J. Dependency of rubber friction on normal force or load: Theory and experiment. Tire Sci. Technol. 2017, 45, 25–54. [Google Scholar] [CrossRef]
- Lang, A.; Klüppel, M. Influences of temperature and load on the dry friction behaviour of tire tread compounds in contact with rough granite. Wear 2017, 380, 15–25. [Google Scholar] [CrossRef]
- Fukahori, Y.; Gabriel, P.; Liang, H.; Busfield, J. A new generalized philosophy and theory for rubber friction and wear. Wear 2020, 446, 203166. [Google Scholar] [CrossRef]
- Guo, F.; Zhang, J.; Chen, Z.; Zhang, M.; Pei, J.; Li, R. Investigation of friction behavior between tire and pavement by molecular dynamics simulations. Constr. Build. Mater. 2021, 300, 124037. [Google Scholar] [CrossRef]
- Urinov, D.; Mamajonov, J.; Melikuziyev, A.; Olimov, M. Research Of Properties Of Rubber Products Depending On Temperature. JournalNX 2020, 6, 156–158. [Google Scholar]
- Chen, X.; Kong, Y.; Wang, M.; Huang, X.; Huang, Y.; Lv, Y.; Li, G. Wear and aging behavior of vulcanized natural rubber nanocomposites under high-speed and high-load sliding wear conditions. Wear 2022, 498, 204341. [Google Scholar] [CrossRef]
- Grosch, K.A. The speed and temperature dependence of rubber friction and its bearing on the skid resistance of tires. In The Physics of Tire Traction: Theory and Experiment; Springer US: Boston, MA, USA, 1974; pp. 143–165. [Google Scholar]
- Tolpekina, T.V.; Persson, B.N.J. Adhesion and friction for three tire tread compounds. Lubricants 2019, 7, 20. [Google Scholar] [CrossRef]
- Klüppel, M. Evaluation of viscoelastic master curves of filled elastomers and applications to fracture mechanics. J. Phys. Condens. Matter 2008, 21, 035104. [Google Scholar] [CrossRef] [PubMed]


| Formula 1# | Formula 2# | Formula 3# | |||
|---|---|---|---|---|---|
| Component | phr | Component | phr | Component | phr |
| NR | 100.00 | 3#RSS | 100.00 | STR20 | 70.00 |
| N234 | 60.00 | N115 | 53.00 | BR | 30.00 |
| Stearic acid | 1.00 | 175GR | 7.00 | N234 | 55.00 |
| ZnO | 3.50 | ZnO | 3.50 | TXN-203 | 2.00 |
| Ceresine wax | 1.50 | Stearic acid | 2.00 | ZnO | 3.50 |
| 4020 | 1.50 | Ceresine wax | 1.00 | Stearic acid | 2.00 |
| RD | 1.50 | 4020 | 2.00 | Ceresine wax | 1.00 |
| S | 1.10 | RD | 1.50 | 4020 | 2.00 |
| NS | 1.20 | Resin | 5.00 | RD | 1.00 |
| S | 1.20 | NS | 1.00 | ||
| CZ | 1.10 | S | 1.40 | ||
| CTP | 0.17 | ||||
| Slip Velocity /mm·s−1 | Load /N | Sideslip Angle /° | Temperature /°C |
|---|---|---|---|
| 0 | 100 | 0 | 25 |
| 100 | 200 | 10 | 40 |
| 200 | 300 | 20 | 55 |
| 300 | 400 | 30 | 70 |
| 400 | 85 |
| Fitting Parameters | Compound Formulations | ||
|---|---|---|---|
| Formula 1# | Formula 2# | Formula 3# | |
| α | 0.2238 | 0.6278 | 0.8712 |
| β | 0.002231 | 0.001974 | 0.002744 |
| γ | 1.013 | 0.980 | 1.028 |
| a1 | 10.3850 | 12.1476 | 71.9234 |
| a2 | 0.3975 | 0.3204 | 0.5443 |
| b1 | −0.3834 | −0.4440 | −0.6167 |
| b2 | 1.200 | 1.550 | 1.455 |
| tm | 70 | 68 | 73 |
Disclaimer/Publisher’s Note: The statements, opinions and data contained in all publications are solely those of the individual author(s) and contributor(s) and not of MDPI and/or the editor(s). MDPI and/or the editor(s) disclaim responsibility for any injury to people or property resulting from any ideas, methods, instructions or products referred to in the content. |
© 2024 by the authors. Licensee MDPI, Basel, Switzerland. This article is an open access article distributed under the terms and conditions of the Creative Commons Attribution (CC BY) license (https://creativecommons.org/licenses/by/4.0/).
Share and Cite
Liu, J.; Wang, M.; Yin, H. A Study of the Friction Characteristics of Rubber Thermo-Mechanical Coupling. Polymers 2024, 16, 596. https://doi.org/10.3390/polym16050596
Liu J, Wang M, Yin H. A Study of the Friction Characteristics of Rubber Thermo-Mechanical Coupling. Polymers. 2024; 16(5):596. https://doi.org/10.3390/polym16050596
Chicago/Turabian StyleLiu, Junyu, Meng Wang, and Haishan Yin. 2024. "A Study of the Friction Characteristics of Rubber Thermo-Mechanical Coupling" Polymers 16, no. 5: 596. https://doi.org/10.3390/polym16050596