

Preparation and Optical Properties of PVDF-CaFe2O4 Polymer Nanocomposite Films
 , and
, and
Abstract
:1. Introduction
2. Experimental
3. Results and Discussion
4. Conclusions
Author Contributions
Funding
Institutional Review Board Statement
Informed Consent Statement
Data Availability Statement
Acknowledgments
Conflicts of Interest
References
- Kum-onsa, P.; Putasaeng, B.; Manyam, J.; Thongbai, P. Significantly improved dielectric properties of poly (vinylidene fluoride) polymer nanocomposites by the addition of nAu−LaFeO3 hybrid particles. Mater. Res. Bull. 2022, 146, 111603. [Google Scholar] [CrossRef]
- Sengwa, R.J.; Dhatarwal, P. Crystalline phases thermal behaviour and radio frequencies dielectric properties of PVDF/PEO/metal oxides hybrid polymer nanocomposite films. J. Polym. Res. 2022, 29, 1–10. [Google Scholar] [CrossRef]
- Pusty, M.; Shirage, P.M. Insights and perspectives on graphene-PVDF based nanocomposite materials for harvesting mechanical energy. J. Alloys Compd. 2022, 904, 164060. [Google Scholar] [CrossRef]
- Kulkarni, N.D.; Kumari, P. Development of highly flexible PVDF-TiO2 nanocomposites for piezoelectric nanogenerator applications. Mater. Res. Bull. 2023, 157, 112039. [Google Scholar] [CrossRef]
- Prateek; Bhunia, R.; Siddiqui, S.; Garg, A.; Gupta, R.K. Significantly enhanced energy density by tailoring the interface in hierarchically structured TiO2–BaTiO3–TiO2 nanofillers in PVDF-based thin-film polymer nanocomposites. ACS Appl. Mater. Interfaces 2019, 11, 14329–14339. [Google Scholar] [CrossRef]
- Taha, T.A.; Mahmoud, M.H.; Hamdeh, H.H. Development, thermal and dielectric investigations of PVDF-Y2O3 polymer nanocomposite films. J. Polym. Res. 2021, 28, 148. [Google Scholar] [CrossRef]
- Singh, D.; Singh, N.; Garg, A.; Gupta, R.K. Engineered thiol anchored Au-BaTiO3/PVDF polymer nanocomposite as efficient dielectric for electronic applications. Compos. Sci. Technol. 2019, 174, 158–168. [Google Scholar]
- Zhi, C.; Shi, S.; Si, Y.; Fei, B.; Huang, H.; Hu, J. Recent Progress of Wearable Piezoelectric Pressure Sensors Based on Nanofibers, Yarns, and Their Fabrics via Electrospinning. Adv. Mater. Technol. 2022, 8, 2201161. [Google Scholar] [CrossRef]
- Kepler, R.G.; Anderson, R.A. Ferroelectric polymers. Adv. Phys. 1992, 41, 1–57. [Google Scholar] [CrossRef]
- Gupta, A.; Agarwal, P.; Bee, S.; Tandon, P.; Gupta, V.D. Heat capacity and vibrational dynamics of polyvinylidene fluoride (β-form). Polym. Sci. Ser. A 2011, 53, 375–384. [Google Scholar] [CrossRef]
- Samara, G.A.; Bauer, F. The role of high pressure in the study and applications of the ferroelectric polymer polyvinylidene fluoride and its copolymers. Ferroelectrics 1995, 171, 299–311. [Google Scholar] [CrossRef]
- Ahmed, I.; Khan, A.N.; Jan, R.; Gul, I.H. Structure–properties relationships of graphene and spinel nickel ferrites based poly(vinylidene fluoride) hybrid polymer nanocomposites for improved dielectric and EMI shielding characteristics. Mater. Res. Bull. 2021, 148, 111687. [Google Scholar] [CrossRef]
- Sapkota, B.; Martin, A.; Lu, H.; Mahbub, R.; Ahmadi, Z.; Azadehranjbar, S.; Mishra, E.; Shield, J.E.; Jeelani, S.; Rangari, V. Changing the polarization and mechanical response of flexible PVDF-nickel ferrite films with nickel ferrite additives. Mater. Sci. Eng. B 2022, 283, 115815. [Google Scholar] [CrossRef]
- Tripathy, A.; Raj, N.P.M.J.; Saravanakumar, B.; Kim, S.-J.; Ramadoss, A. Tuning of highly piezoelectric bismuth ferrite/PVDF-copolymer flexible films for efficient energy harvesting performance. J. Alloys Compd. 2023, 932, 167569. [Google Scholar] [CrossRef]
- Rathi, P.L.; Ponraj, B.; Deepa, S. Enhancement of dielectric and magnetic properties of electroactive LaNiO3 based PVDF films by inclusion of magnetic Sn0.2Fe2.8O4 nanofiller. Mater. Chem. Phys. 2022, 297, 127259. [Google Scholar]
- Mohammed, M. Optical properties of ZnO nanoparticles dispersed in PMMA/PVDF blend. J. Mol. Struct. 2018, 1169, 9–17. [Google Scholar] [CrossRef]
- Khatun, F.; Thakur, P.; Hoque, N.A.; Kool, A.; Roy, S.; Biswas, P.; Bagchi, B.; Das, S. In situ synthesized electroactive and large dielectric BaF2/PVDF nanocomposite film for superior and highly durable self-charged hybrid photo-power cell. Energy Convers. Manag. 2018, 171, 1083–1092. [Google Scholar] [CrossRef]
- Huyen, D.N. Carbon nanotubes and semiconducting polymer nanocomposites. In Carbon Nanotubes-Synthesis, Characterization, Applications; IntechOpen: London, UK, 2011. [Google Scholar]
- Panda, M.; Sultana, N.; Singh, A.K. Structural and optical properties of PVDF/GO nanocomposites. Full-Nanotub. Carbon Nanostruct. 2021, 30, 559–570. [Google Scholar] [CrossRef]
- Indolia, A.P.; Gaur, M.S. Optical properties of solution grown PVDF-ZnO nanocomposite thin films. J. Polym. Res. 2013, 20, 43. [Google Scholar] [CrossRef]
- El-Metwally, E.G.; Nasrallah, D.A.; Fadel, M. The effect of Li4Ti5O12 nanoparticles on structural, linear and third order nonlinear optical properties of PVDF films. Mater. Res. Express 2019, 6, 085312. [Google Scholar] [CrossRef]
- Gaur, A.M.; Rana, D.S. Structural, optical and electrical properties of MgCl2 doped polyvinylidene fluoride (PVDF) composites. J. Mater. Sci. Mater. Electron. 2014, 26, 1246–1251. [Google Scholar] [CrossRef]
- El-Masry, M.M.; Ramadan, R. The effect of CoFe2O4, CuFe2O4 and Cu/CoFe2O4 nanoparticles on the optical properties and piezoelectric response of the PVDF polymer. Appl. Phys. A 2022, 128, 1–13. [Google Scholar] [CrossRef]
- Hu, L.; Yao, J.; You, F.; Jiang, X.; Li, Z.; Yan, L.; Qi, Y. Preparation and dielectric properties of cysteine modified nano Ag/PYDF composite. J. Funct. Mater. Gongneng Cailiao 2018, 49, 5151–5155. [Google Scholar]
- Teow, Y.H.; Ooi, B.S.; Ahmad, A.L. Study on PVDF-TiO2 mixed-matrix membrane behaviour towards humic acid adsorption. J. Water Process Eng. 2017, 15, 99–106. [Google Scholar] [CrossRef]
- Vadivel, S.; Maruthamani, D.; Habibi-Yangjeh, A.; Paul, B.; Dhar, S.S.; Selvam, K. Facile synthesis of novel CaFe2O4/g-C3N4 nanocomposites for degradation of methylene blue under visible-light irradiation. J. Colloid Interface Sci. 2016, 480, 126–136. [Google Scholar] [CrossRef] [PubMed]
- Murao, R.; Harano, T.; Kimura, M.; Jung, I.H. Thermodynamic modeling of multi-component calcium ferrite for sintering reaction analysis. Nippon Steel Techical Rep. 2020, 123, 67–74. [Google Scholar]
- Balasubramanian, P.; Settu, R.; Chen, S.-M.; Chen, T.-W.; Sharmila, G. A new electrochemical sensor for highly sensitive and selective detection of nitrite in food samples based on sonochemical synthesized Calcium Ferrite (CaFe2O4) clusters modified screen printed carbon electrode. J. Colloid Interface Sci. 2018, 524, 417–426. [Google Scholar] [CrossRef]
- Asiri, S.; Güner, S.; Korkmaz, A.D.; Amir, M.; Batoo, K.M.; Almessiere, M.A.; Gungunes, H.; Sözeri, H.; Baykal, A. Magneto-optical properties of BaCryFe12−yO19 (0.0 ≤ y ≤ 1.0) hexaferrites. J. Magn. Magn. Mater. 2018, 451, 463–472. [Google Scholar] [CrossRef]
- Reid, A.F.; Wadsley, A.D.; Ringwood, A.E. High pressure NaAlGeO4, a calcium ferrite isotype and model structure of silicates at depth in the earth’s mantle. Acta Crystallogr. 1967, 23, 736–739. [Google Scholar] [CrossRef]
- Orives, J.R.; Viali, W.R.; Santagneli, S.H.; Afonso, C.R.; Carvalho, M.H.; De Oliveira, A.J.; Nalin, M. Phosphate glasses via coacervation route containing CdFe2O4 nanoparticles: Structural, optical, and magnetic characterization. Dalton Trans. 2018, 47, 5771–5779. [Google Scholar] [CrossRef]
- Iftikhar, S.; Warsi, M.F.; Haider, S.; Musaddiq, S.; Shakir, I.; Shahid, M. The impact of carbon nanotubes on the optical, electrical, and magnetic parameters of Ni2+ and Co2+ based spinel ferrites. Ceram. Int. 2019, 45, 21150–21161. [Google Scholar] [CrossRef]
- Das, A.K.; Govindaraj, R.; Srinivasan, A. Structural and magnetic properties of sol-gel derived CaFe2O4 nanoparticles. J. Magn. Magn. Mater. 2018, 451, 526–531. [Google Scholar] [CrossRef]
- Manohar, A.; Krishnamoorthi, C. Structural, optical, dielectric and magnetic properties of CaFe2O4 nanocrystals prepared by solvothermal reflux method. J. Alloys Compd. 2017, 722, 818–827. [Google Scholar] [CrossRef]
- Casals, O.; Šutka, A.; Granz, T.; Waag, A.; Wasisto, H.S.; Daniel Prades, J.; Fàbrega, C. Visible light-driven p-type semiconductor gas sensors based on CaFe2O4 nanoparticles. Sensors 2020, 20, 850. [Google Scholar]
- Behera, A.; Kandi, D.; Martha, S.; Parida, K. Constructive interfacial charge carrier separation of a p-CaFe2O4@ n-ZnFe2O4 heterojunction architect photocatalyst toward photodegradation of antibiotics. Inorg. Chem. 2019, 58, 16592–16608. [Google Scholar] [CrossRef]
- El-Masry, M.M.; Ramadan, R. Enhancing the properties of PVDF/MFe2O4; (M: Co–Zn and Cu–Zn) nanocomposite for the piezoelectric optronic applications. J. Mater. Sci. Mater. Electron. 2022, 33, 15946–15963. [Google Scholar] [CrossRef]
- De Paola, M.G.; Paletta, R.; Lopresto, C.G.; Lio, G.E.; De Luca, A.; Chakraborty, S.; Calabrò, V. Stability of Film-Forming Dispersions: Affects the Morphology and Optical Properties of Polymeric Films. Polymers 2021, 13, 1464. [Google Scholar] [CrossRef]
- De Paola, M.G.; Paletta, R.; Lopresto, C.G.; Calabrò, V. Multiple light scattering as a preliminary tool for starch-based film formulation. J. Phase Chang. Mater. 2021, 1, 2. [Google Scholar] [CrossRef]
- De Paola, M.G.; Andreoli, T.; Lopresto, C.G.; Calabrò, V. Starch/pectin-biobased films: How initial dispersions could affect their performances. J. Appl. Polym. Sci. 2021, 139, 52032. [Google Scholar] [CrossRef]
- Sa’aedi, A.; Akl, A.A.; Hassanien, A.S. Effective role of Rb doping in controlling the crystallization, crystal imperfections, and microstructural and morphological features of ZnO-NPs synthesized by the sol–gel approach. CrystEngComm 2022, 24, 4661–4678. [Google Scholar] [CrossRef]
- Yousefi, S.; Ghasemi, B.; Nikolova, M.P. Morpho/Opto-structural Characterizations and XRD-Assisted Estimation of Crystallite Size and Strain in MgO Nanoparticles by Applying Williamson–Hall and Size–Strain Techniques. J. Clust. Sci. 2021, 33, 2197–2207. [Google Scholar] [CrossRef]
- Li, L.; Zhang, M.; Rong, M.; Ruan, W. Studies on the transformation process of PVDF from α to β phase by stretching. RSC Adv. 2014, 4, 3938–3943. [Google Scholar] [CrossRef]
- Badatya, S.; Bharti, D.K.; Srivastava, A.K.; Gupta, M.K. Solution processed high performance piezoelectric eggshell membrane–PVDF layer composite nanogenerator via tuning the interfacial polarization. J. Alloys Compd. 2021, 863, 158406. [Google Scholar] [CrossRef]
- Ohlan, A.; Singh, K.; Chandra, A.; Dhawan, S.K. Microwave absorption behavior of core−shell structured poly (3, 4-ethylenedioxy thiophene)−barium ferrite nanocomposites. ACS Appl. Mater. Interfaces 2010, 2, 927–933. [Google Scholar] [CrossRef] [PubMed]
- Luna, C.B.B.; da Silva, A.L.; Siqueira, D.D.; dos Santos Filho, E.A.; Araújo, E.M.; do Nascimento, E.P.; de Melo Costa, A.C.F. Preparation of flexible and magnetic PA6/SEBS-MA nanocomposites reinforced with Ni-Zn ferrite. Polym. Compos. 2022, 43, 68–83. [Google Scholar] [CrossRef]
- Wang, Y.; Dai, S.; Chen, F.; Xu, T.; Nie, Q. Physical properties and optical band gap of new tellurite glasses within the TeO2–Nb2O5–Bi2O3 system. Mater. Chem. Phys. 2009, 113, 407–411. [Google Scholar] [CrossRef]
- Wang, G.; Nie, Q.; Wang, X.; Dai, S.; Zhu, M.; Shen, X.; Bai, K.; Zhang, X. Research on optical band gap of the novel GeSe2–In2Se3–KI chalcohalide glasses. Spectrochim. Acta Part A Mol. Biomol. Spectrosc. 2010, 75, 1125–1129. [Google Scholar] [CrossRef]
- Zaid, M.H.M.; Matori, K.A.; Ab Aziz, S.H.; Kamari, H.M.; Wahab, Z.A.; Effendy, N.; Alibe, I.M. Comprehensive study on compositional dependence of optical band gap in zinc soda lime silica glass system for optoelectronic applications. J. Non-Cryst. Solids 2016, 449, 107–112. [Google Scholar] [CrossRef]
- Alshammari, A.H.; Alshammari, M.; Alshammari, K.; Allam, N.K.; Taha, T. PVC/PVP/SrTiO3 polymer blend nanocomposites as potential materials for optoelectronic applications. Results Phys. 2023, 44, 106173. [Google Scholar] [CrossRef]
- El-naggar, A.M.; Heiba, Z.K.; Mohamed, M.B.; Kamal, A.M.; Osman, M.M.; Albassam, A.A.; Lakshminarayana, G. Improvement of the optical characteristics of PVA/PVP blend with different concentrations of SnS2/Fe. J. Vinyl Addit. Technol. 2022, 28, 82–93. [Google Scholar] [CrossRef]
- Taha, T.A.; Hendawy, N.; El-Rabaie, S.; Esmat, A.; El-Mansy, M.K. Effect of NiO NPs doping on the structure and optical properties of PVC polymer films. Polym. Bull. 2018, 76, 4769–4784. [Google Scholar] [CrossRef]
- Tripathi, S.K.; Kaur, R. Investigation of non-linear optical properties of CdS/PS polymer nanocomposite synthesized by chemical route. Opt. Commun. 2015, 352, 55–62. [Google Scholar] [CrossRef]
- Sakr, G.; Yahia, I.; Fadel, M.; Fouad, S.; Romčević, N. Optical spectroscopy, optical conductivity, dielectric properties and new methods for determining the gap states of CuSe thin films. J. Alloys Compd. 2010, 507, 557–562. [Google Scholar] [CrossRef]
- Soliman, T.; Vshivkov, S.; Elkalashy, S. Structural, linear and nonlinear optical properties of Ni nanoparticles–Polyvinyl alcohol nanocomposite films for optoelectronic applications. Opt. Mater. 2020, 107, 110037. [Google Scholar] [CrossRef]
- Gündüz, B. Optical properties of poly[2-methoxy-5-(3′,7′-dimethyloctyloxy)-1,4-phenylenevinylene] light-emitting polymer solutions: Effects of molarities and solvents. Polym. Bull. 2015, 72, 3241–3267. [Google Scholar] [CrossRef]
- Banerjee, M.; Jain, A.; Mukherjee, G. Microstructural and optical properties of polyvinyl alcohol/manganese chloride composite film. Polym. Compos. 2018, 40, E765–E775. [Google Scholar] [CrossRef]
- Hassanien, A.S.; Sharma, I. Optical properties of quaternary a-Ge15-x Sbx Se50 Te35 thermally evaporated thin-films: Refractive index dispersion and single oscillator parameters. Optik 2019, 200, 163415. [Google Scholar] [CrossRef]
- Ali, H.E.; Abd-Rabboh, H.S.; Awwad, N.S.; Algarni, H.; Sayed, M.; El-Rehim, A.A.; Abdel-Aziz, M.; Khairy, Y. Photoluminescence, optical limiting, and linear/nonlinear optical parameters of PVP/PVAL blend embedded with silver nitrate. Optik 2021, 247, 167863. [Google Scholar] [CrossRef]
- AlAbdulaal, T.; Yahia, I. Analysis of optical linearity and nonlinearity of Fe3+-doped PMMA/FTO polymeric films: New trend for optoelectronic polymeric devices. Phys. B Condens. Matter 2020, 601, 412628. [Google Scholar] [CrossRef]
- Ali, H.E.; Khairy, Y. Synthesis, characterization, refractive index-bandgap relations, and optical nonlinearity parameters of CuI/PVOH nanocomposites. Opt. Laser Technol. 2020, 136, 106736. [Google Scholar] [CrossRef]
- Helal, A.I.; Vshivkov, S.A.; Zaki, M.F.; Elkalashy, S.I.; Soliman, T.S. Effect of carbon nano tube in the structural and physical properties of polyvinyl chloride films. Phys. Scr. 2021, 96, 085804. [Google Scholar] [CrossRef]
- Alrowaili, Z.A.; Taha, T.A.; El-Nasser, K.S.; Donya, H. Significant Enhanced Optical Parameters of PVA-Y2O3 Polymer Nanocomposite Films. J. Inorg. Organomet. Polym. Mater. 2021, 31, 3101–3110. [Google Scholar] [CrossRef]
- Abomostafa, H.M.; Abulyazied, D.E. Linear and Nonlinear Optical Response of Nickel Core–Shell @ Silica/PMMA Nanocomposite Film for Flexible Optoelectronic Applications. J. Inorg. Organomet. Polym. Mater. 2021, 31, 2902–2914. [Google Scholar] [CrossRef]


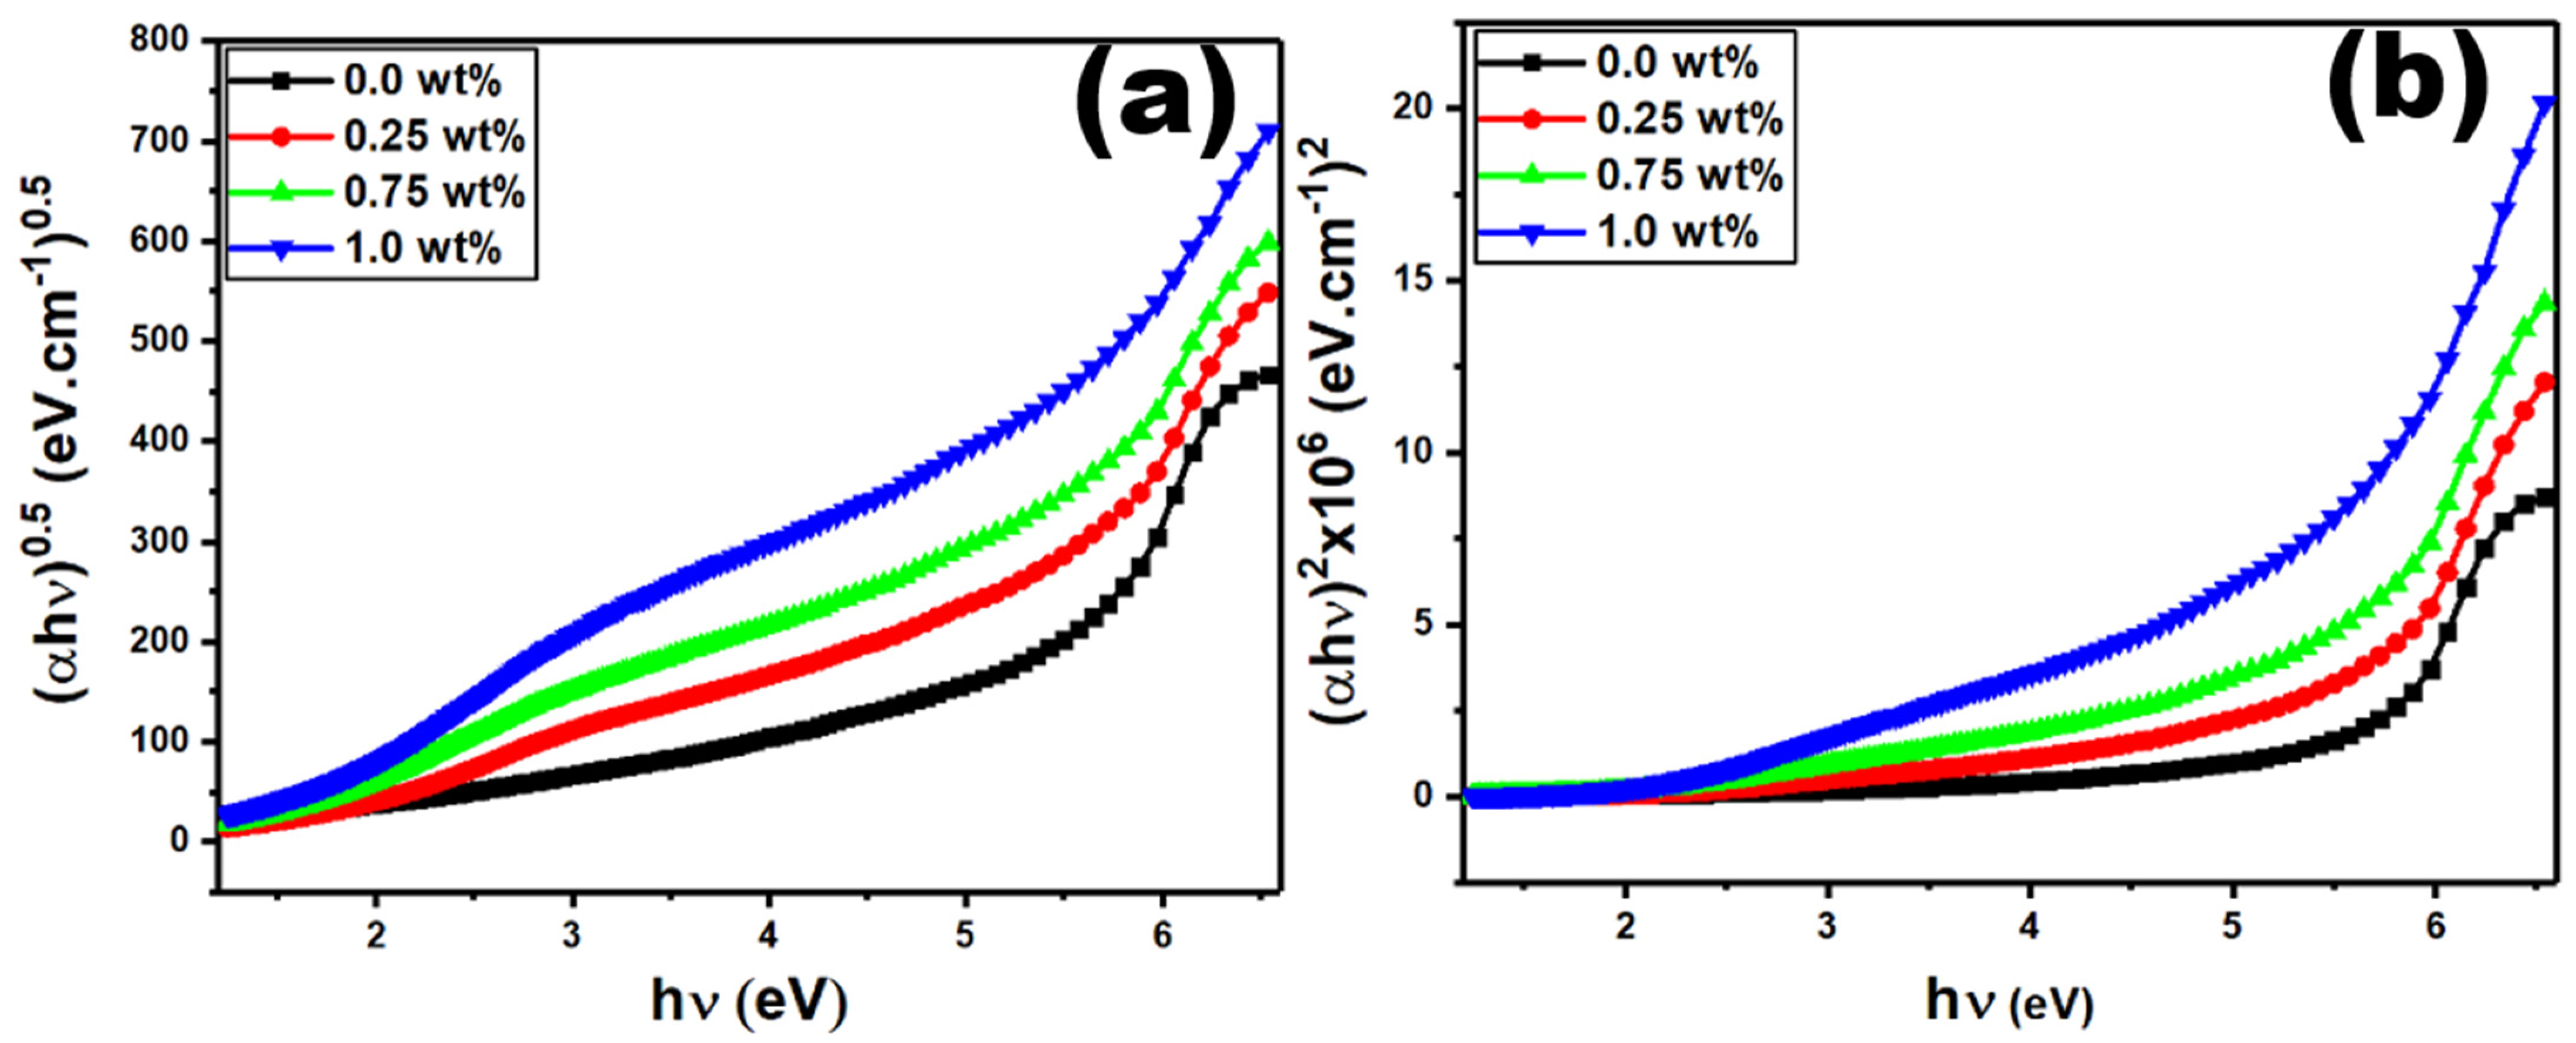
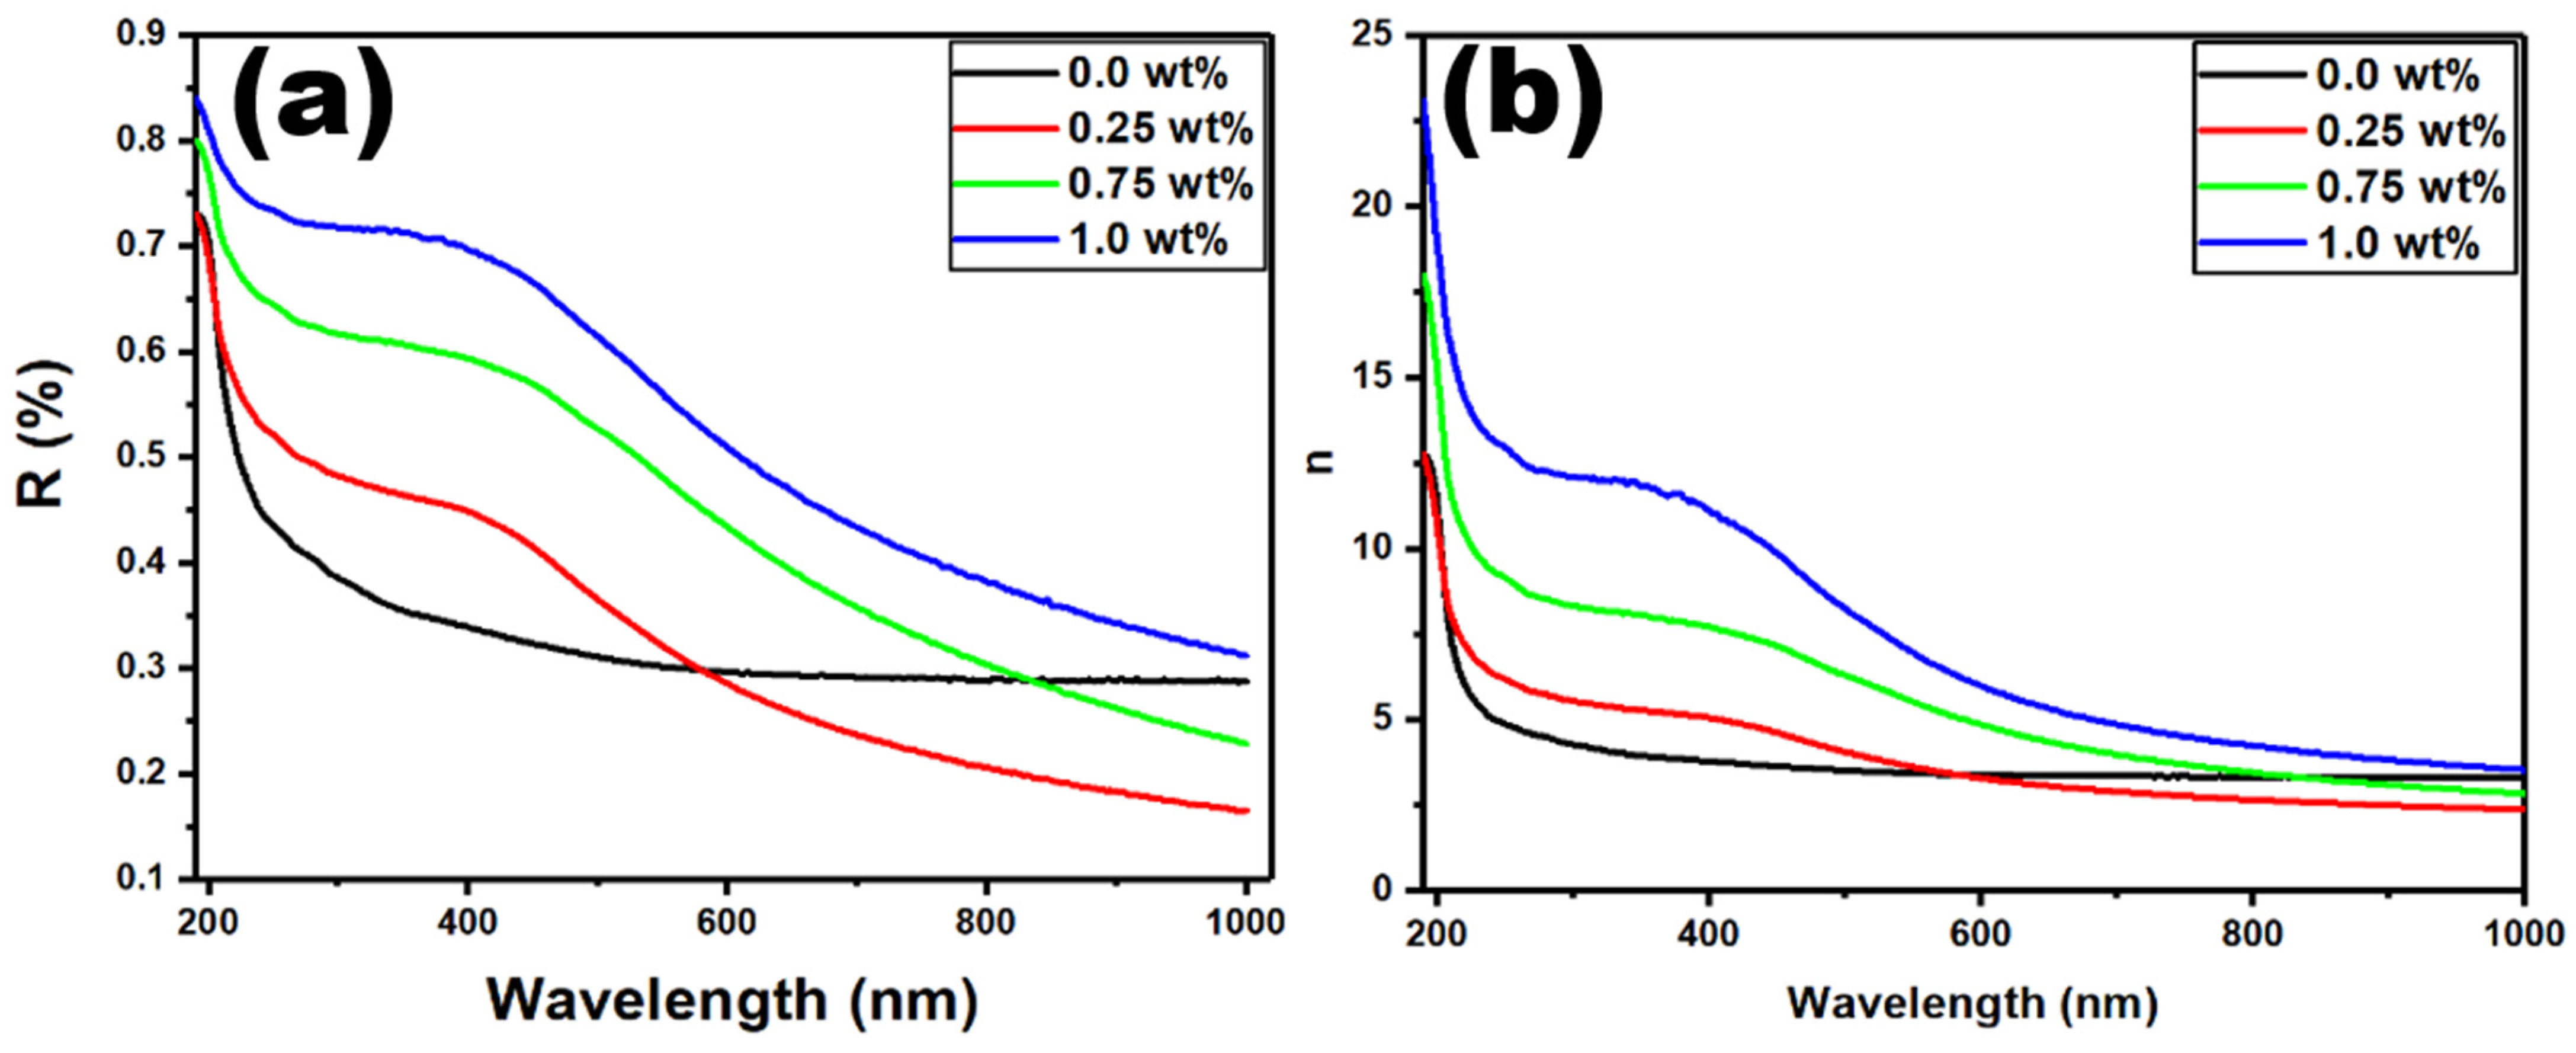
| CaFe2O4 Concentrations (wt%) | Edir (eV) | Eind (eV) | E0 (eV) | Ed (eV) | n0 | Eg (eV) |
|---|---|---|---|---|---|---|
| 0.0 | 5.59 | 5.2 | 6.60 | 68.60 | 3.38 | 5.50 |
| 0.25 | 5.48 | 4.71 | 7.32 | 150.13 | 4.64 | 5.35 |
| 0.75 | 5.35 | 4.39 | 7.69 | 384.30 | 7.14 | 5.10 |
| 1.00 | 5.15 | 4.18 | 7.41 | 787.84 | 10.36 | 4.95 |
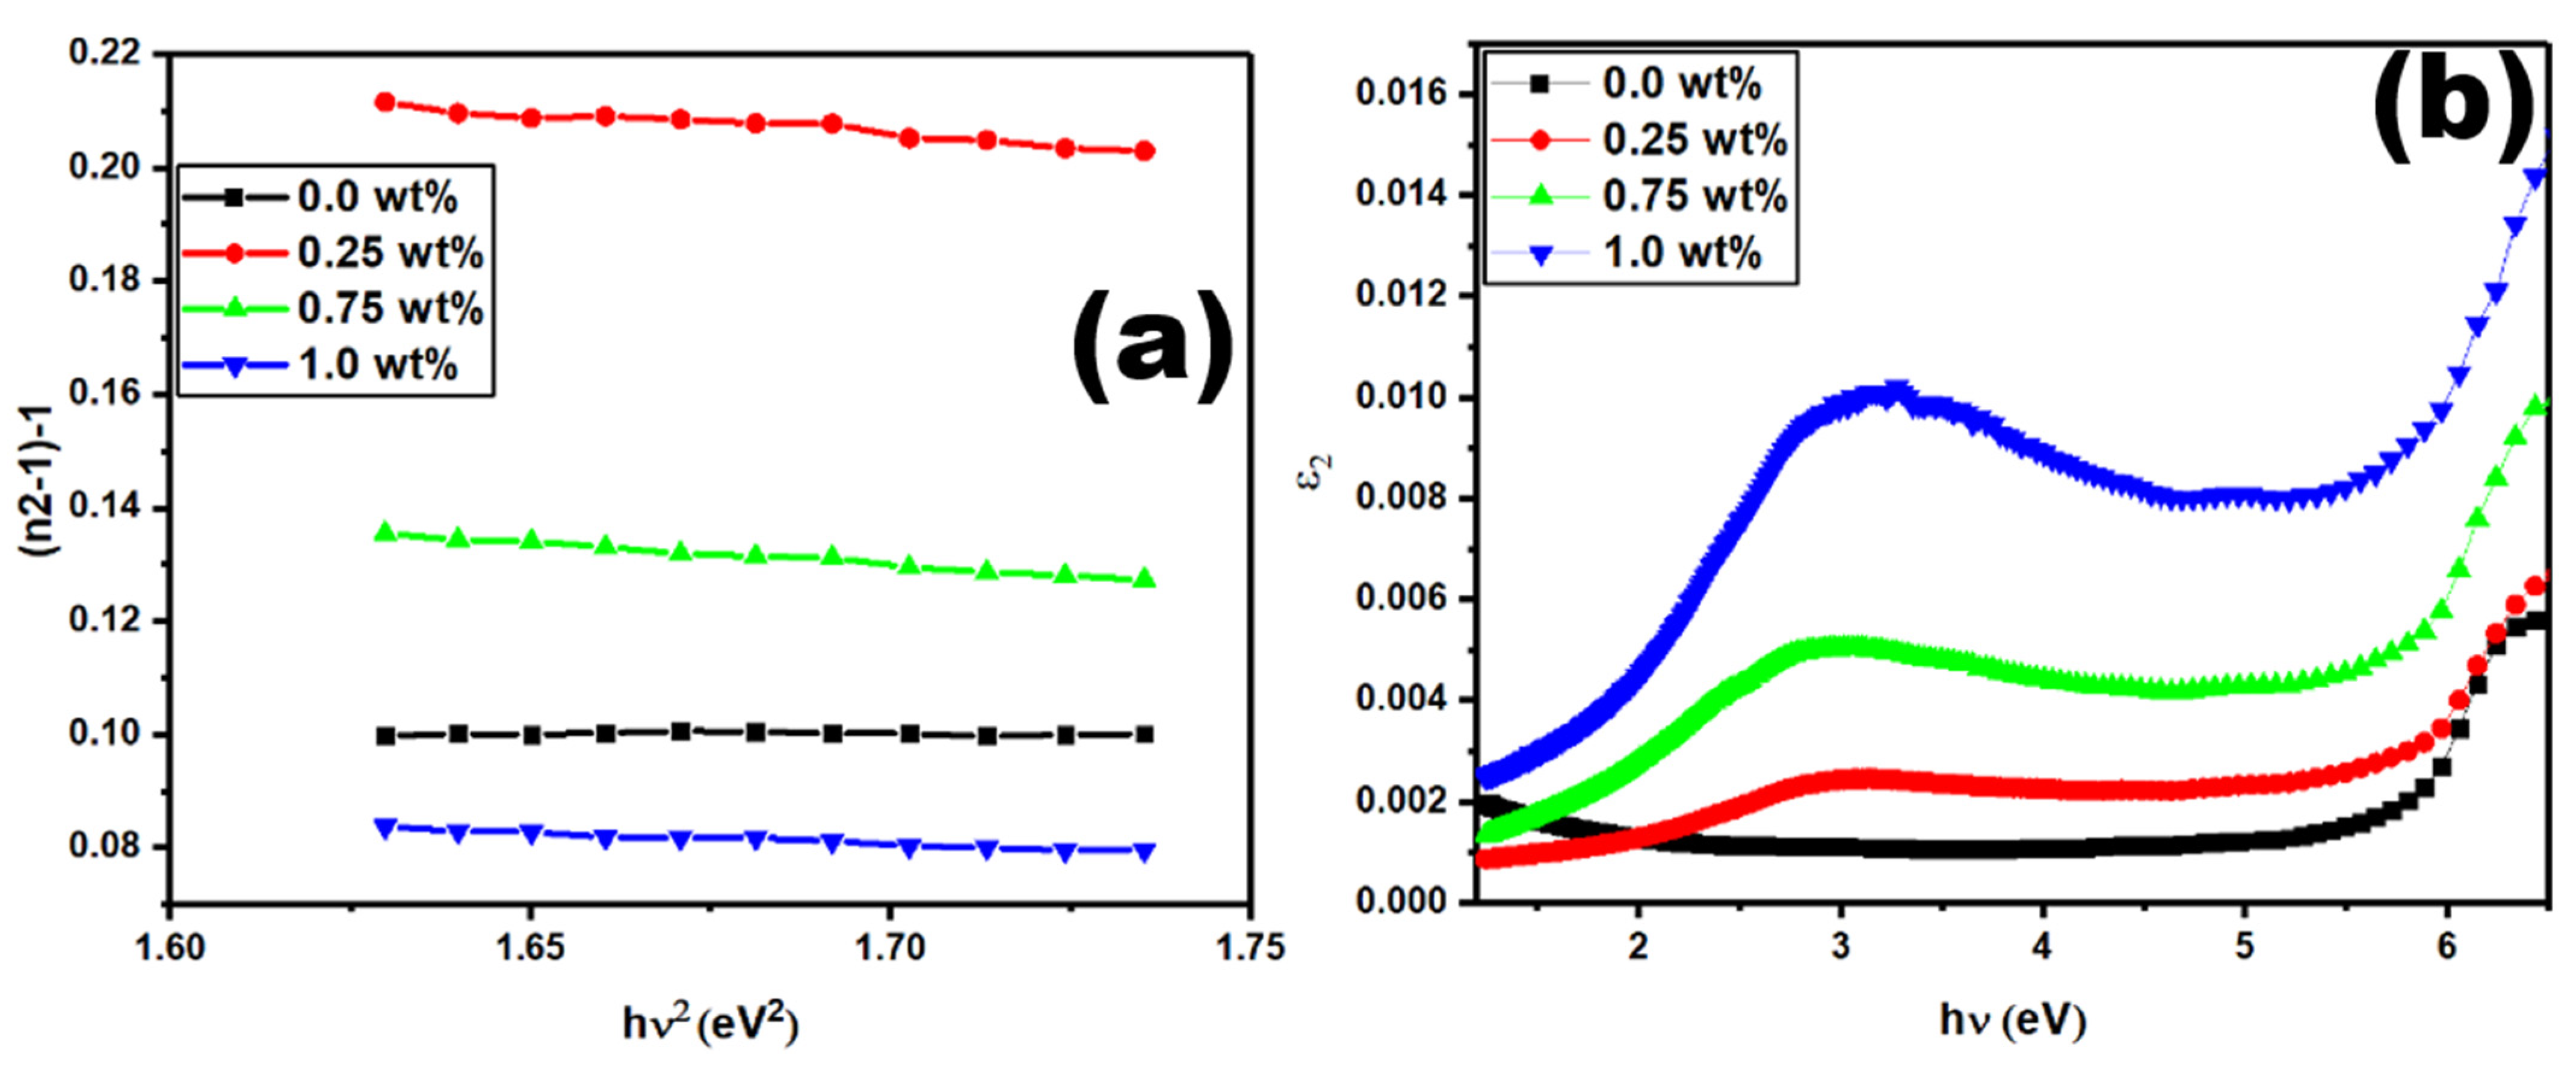
| CaFe2O4 Content (wt%) | f (eV)2 | χ(1) (esu) | χ (3) (esu) | n2 (esu) |
|---|---|---|---|---|
| 0.0 | 452.49 | 0.83 | 8 × 10⁻¹¹ | 8.9 × 10⁻¹⁰ |
| 0.25 | 1098.99 | 1.63 | 12 × 10−10 | 9.8 × 10⁻⁹ |
| 0.75 | 2955.14 | 3.98 | 425 × 10−10 | 2.25 × 10⁻⁷ |
| 1.0 | 5840.71 | 8.46 | 870 × 10−9 | 3.17 × 10⁻⁶ |
Disclaimer/Publisher’s Note: The statements, opinions and data contained in all publications are solely those of the individual author(s) and contributor(s) and not of MDPI and/or the editor(s). MDPI and/or the editor(s) disclaim responsibility for any injury to people or property resulting from any ideas, methods, instructions or products referred to in the content. |
© 2023 by the authors. Licensee MDPI, Basel, Switzerland. This article is an open access article distributed under the terms and conditions of the Creative Commons Attribution (CC BY) license (https://creativecommons.org/licenses/by/4.0/).
Share and Cite
Alhassan, S.; Alshammari, M.; Alshammari, K.; Alotaibi, T.; Alshammari, A.H.; Fawaz, Y.; Taha, T.A.M.; Henini, M. Preparation and Optical Properties of PVDF-CaFe2O4 Polymer Nanocomposite Films. Polymers 2023, 15, 2232. https://doi.org/10.3390/polym15092232
Alhassan S, Alshammari M, Alshammari K, Alotaibi T, Alshammari AH, Fawaz Y, Taha TAM, Henini M. Preparation and Optical Properties of PVDF-CaFe2O4 Polymer Nanocomposite Films. Polymers. 2023; 15(9):2232. https://doi.org/10.3390/polym15092232
Chicago/Turabian StyleAlhassan, Sultan, Majed Alshammari, Khulaif Alshammari, Turki Alotaibi, Alhulw H. Alshammari, Yasir Fawaz, Taha Abdel Mohaymen Taha, and Mohamed Henini. 2023. "Preparation and Optical Properties of PVDF-CaFe2O4 Polymer Nanocomposite Films" Polymers 15, no. 9: 2232. https://doi.org/10.3390/polym15092232