
The Effects of rGO Content and Drying Method on the Textural, Mechanical, and Thermal Properties of rGO/Polymer Composites

Abstract
:
1. Introduction
2. Materials and Methods
2.1. Materials
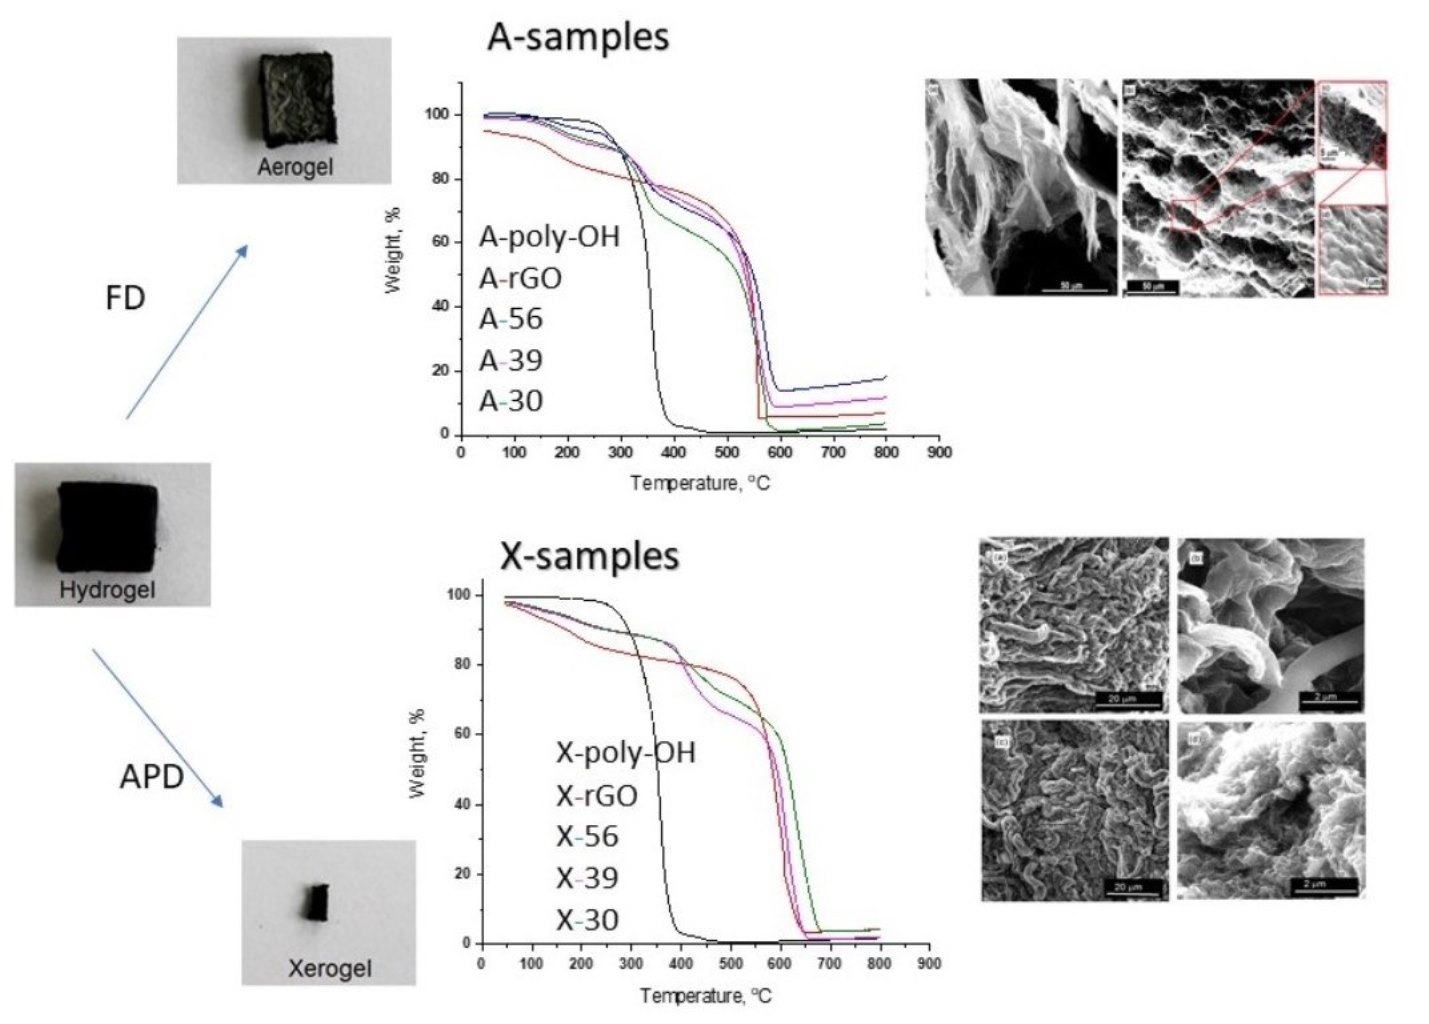
2.2. Synthesis of Composite Hydrogels and rGO Hydrogel
2.3. Characterization
2.3.1. Textural Properties
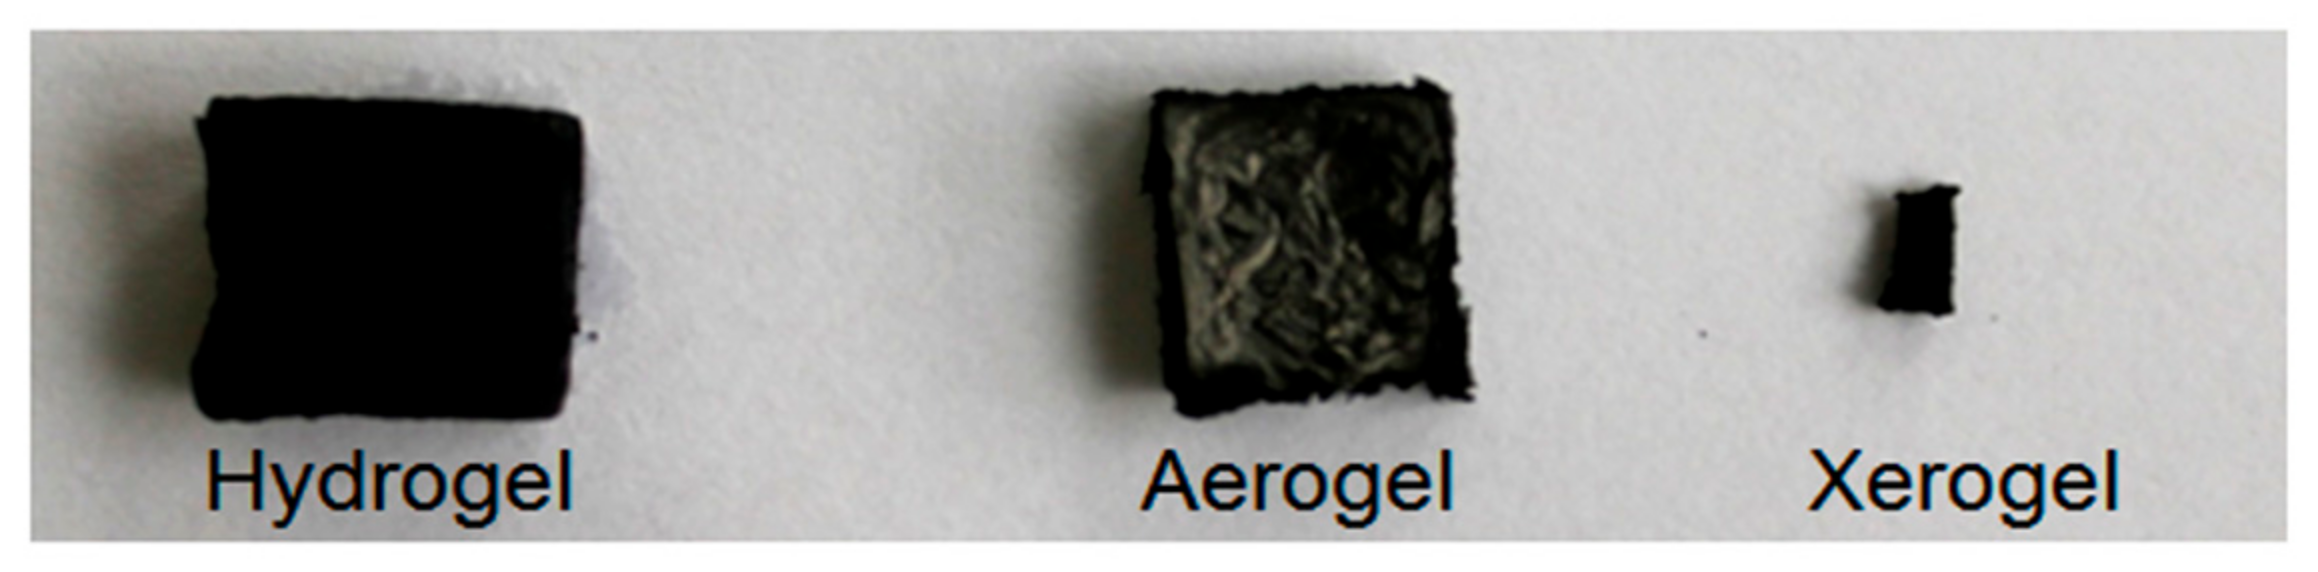
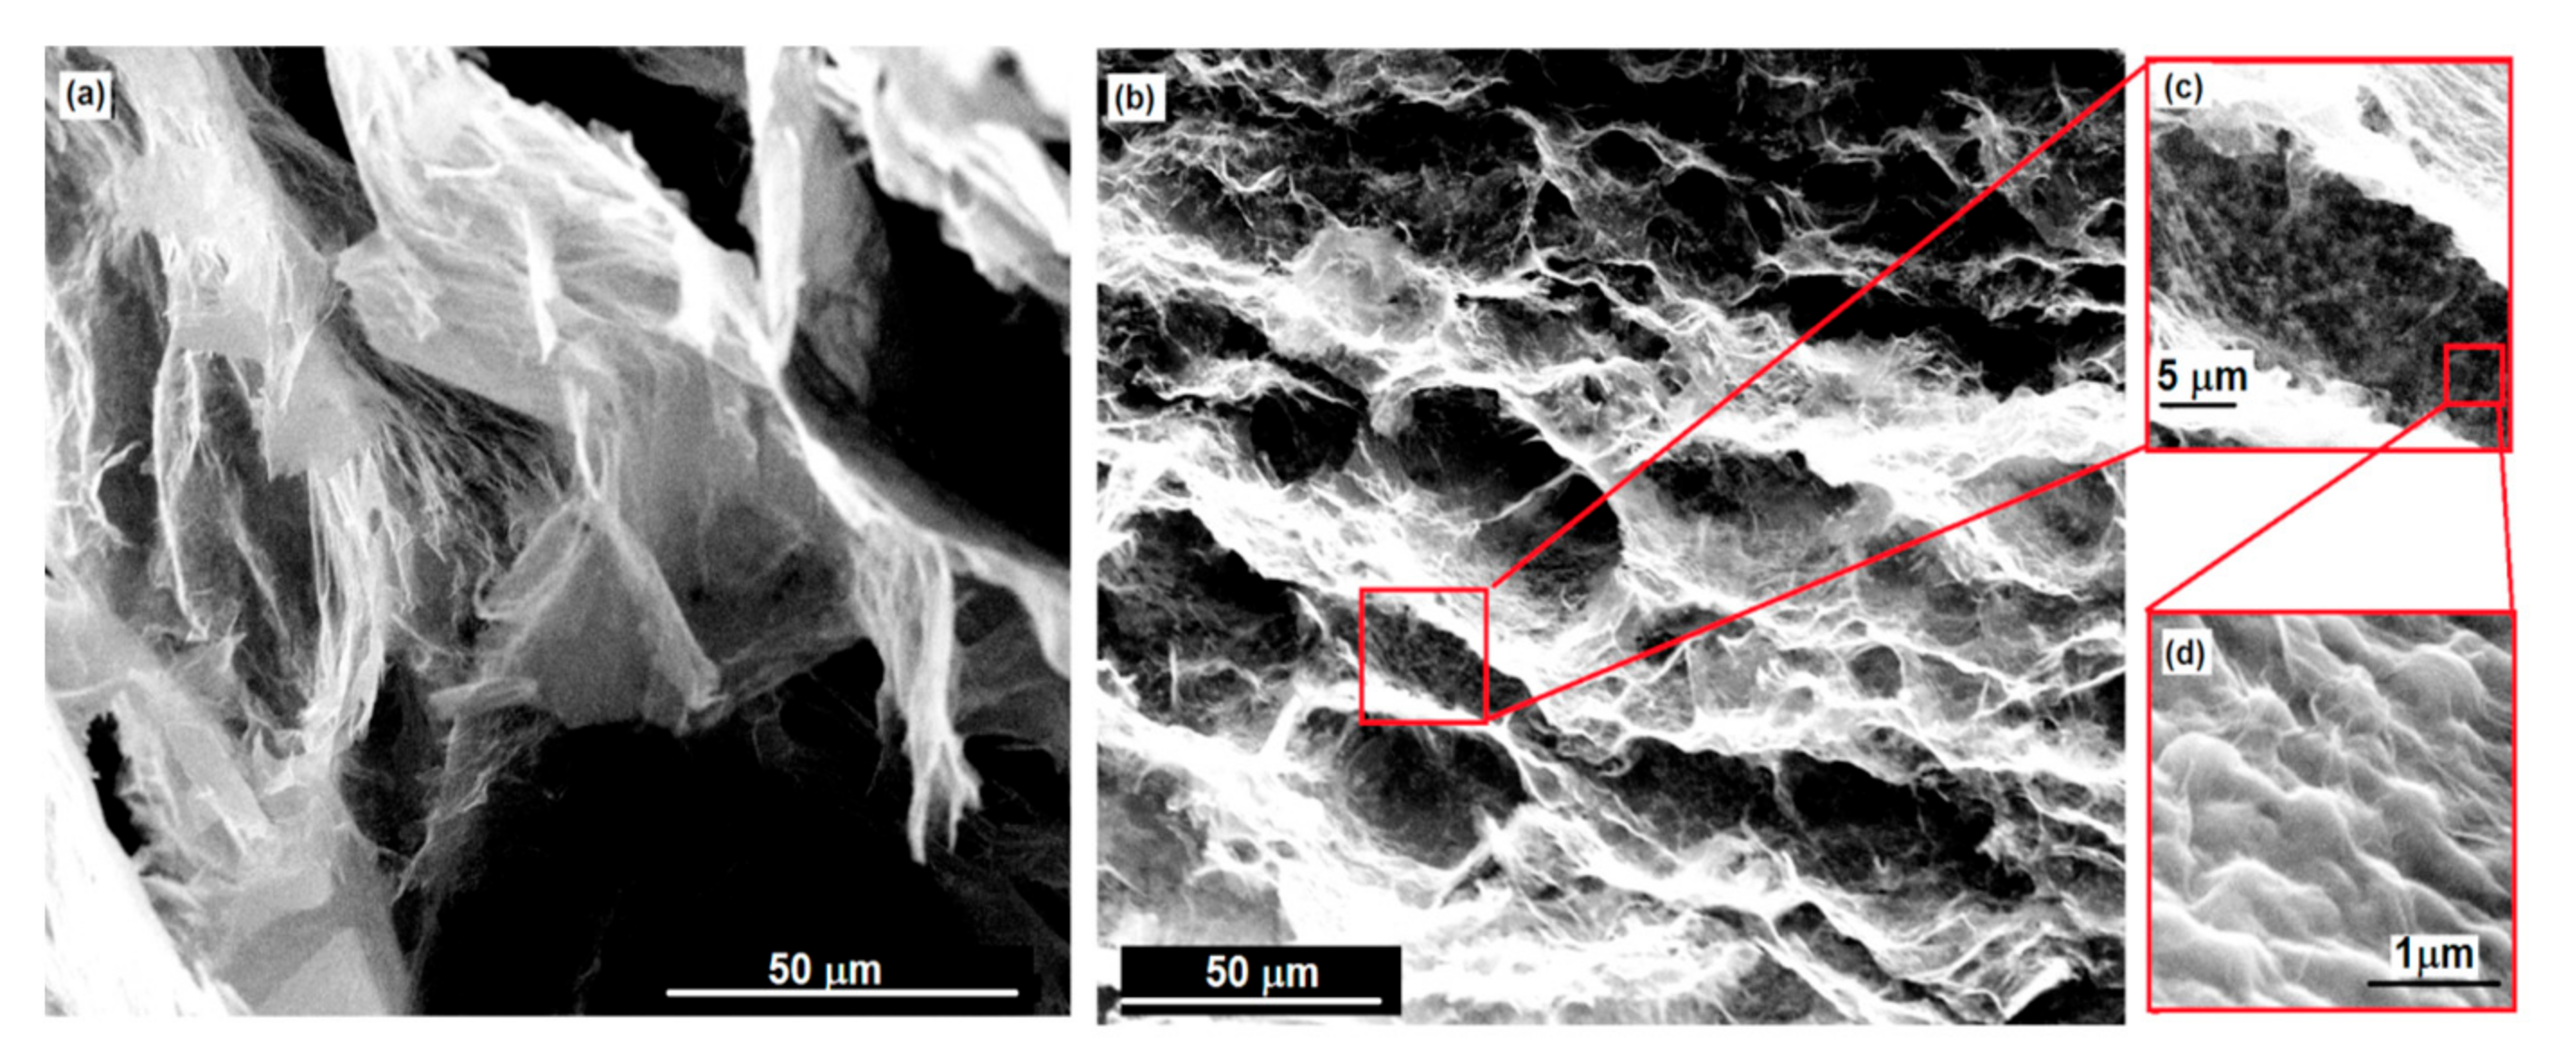
2.3.2. Morphology
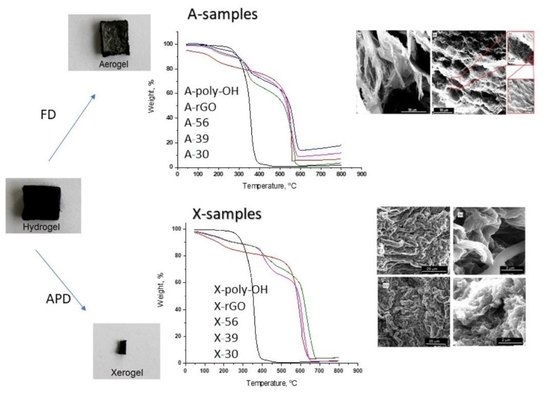
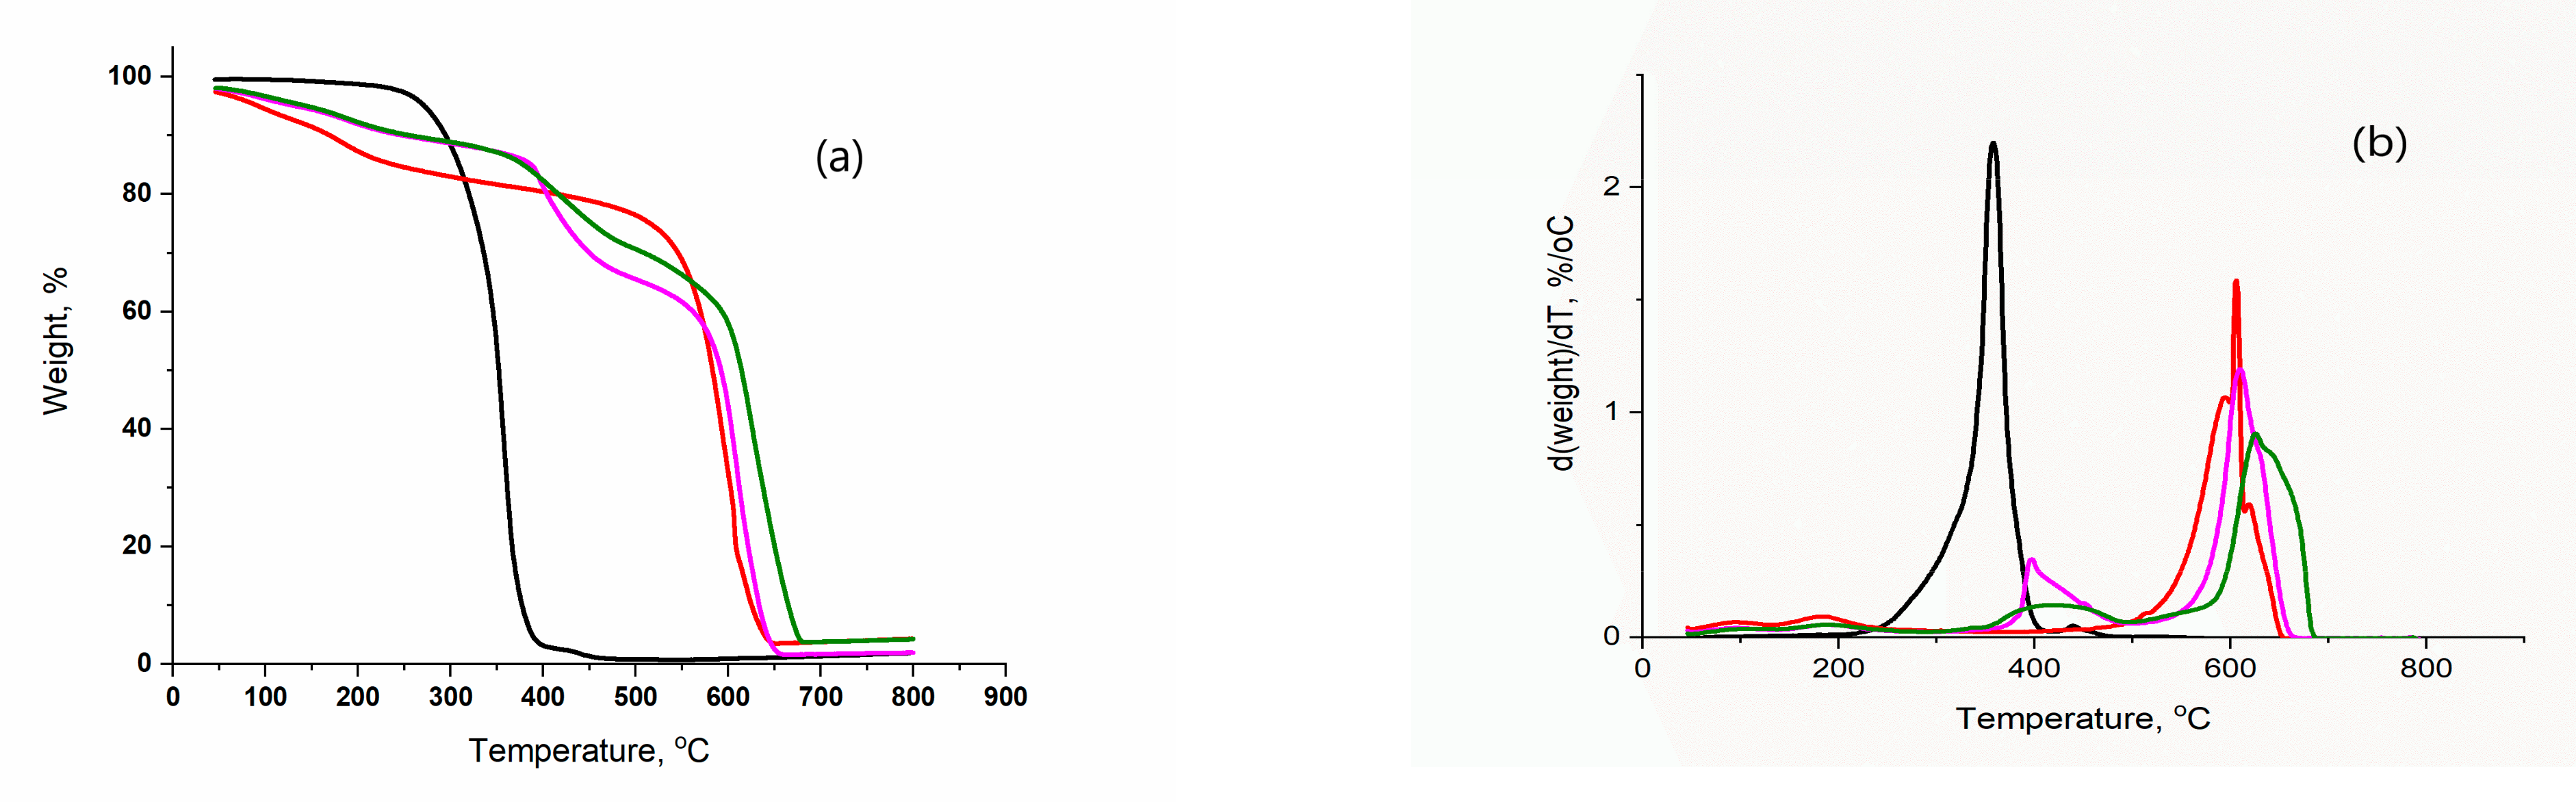
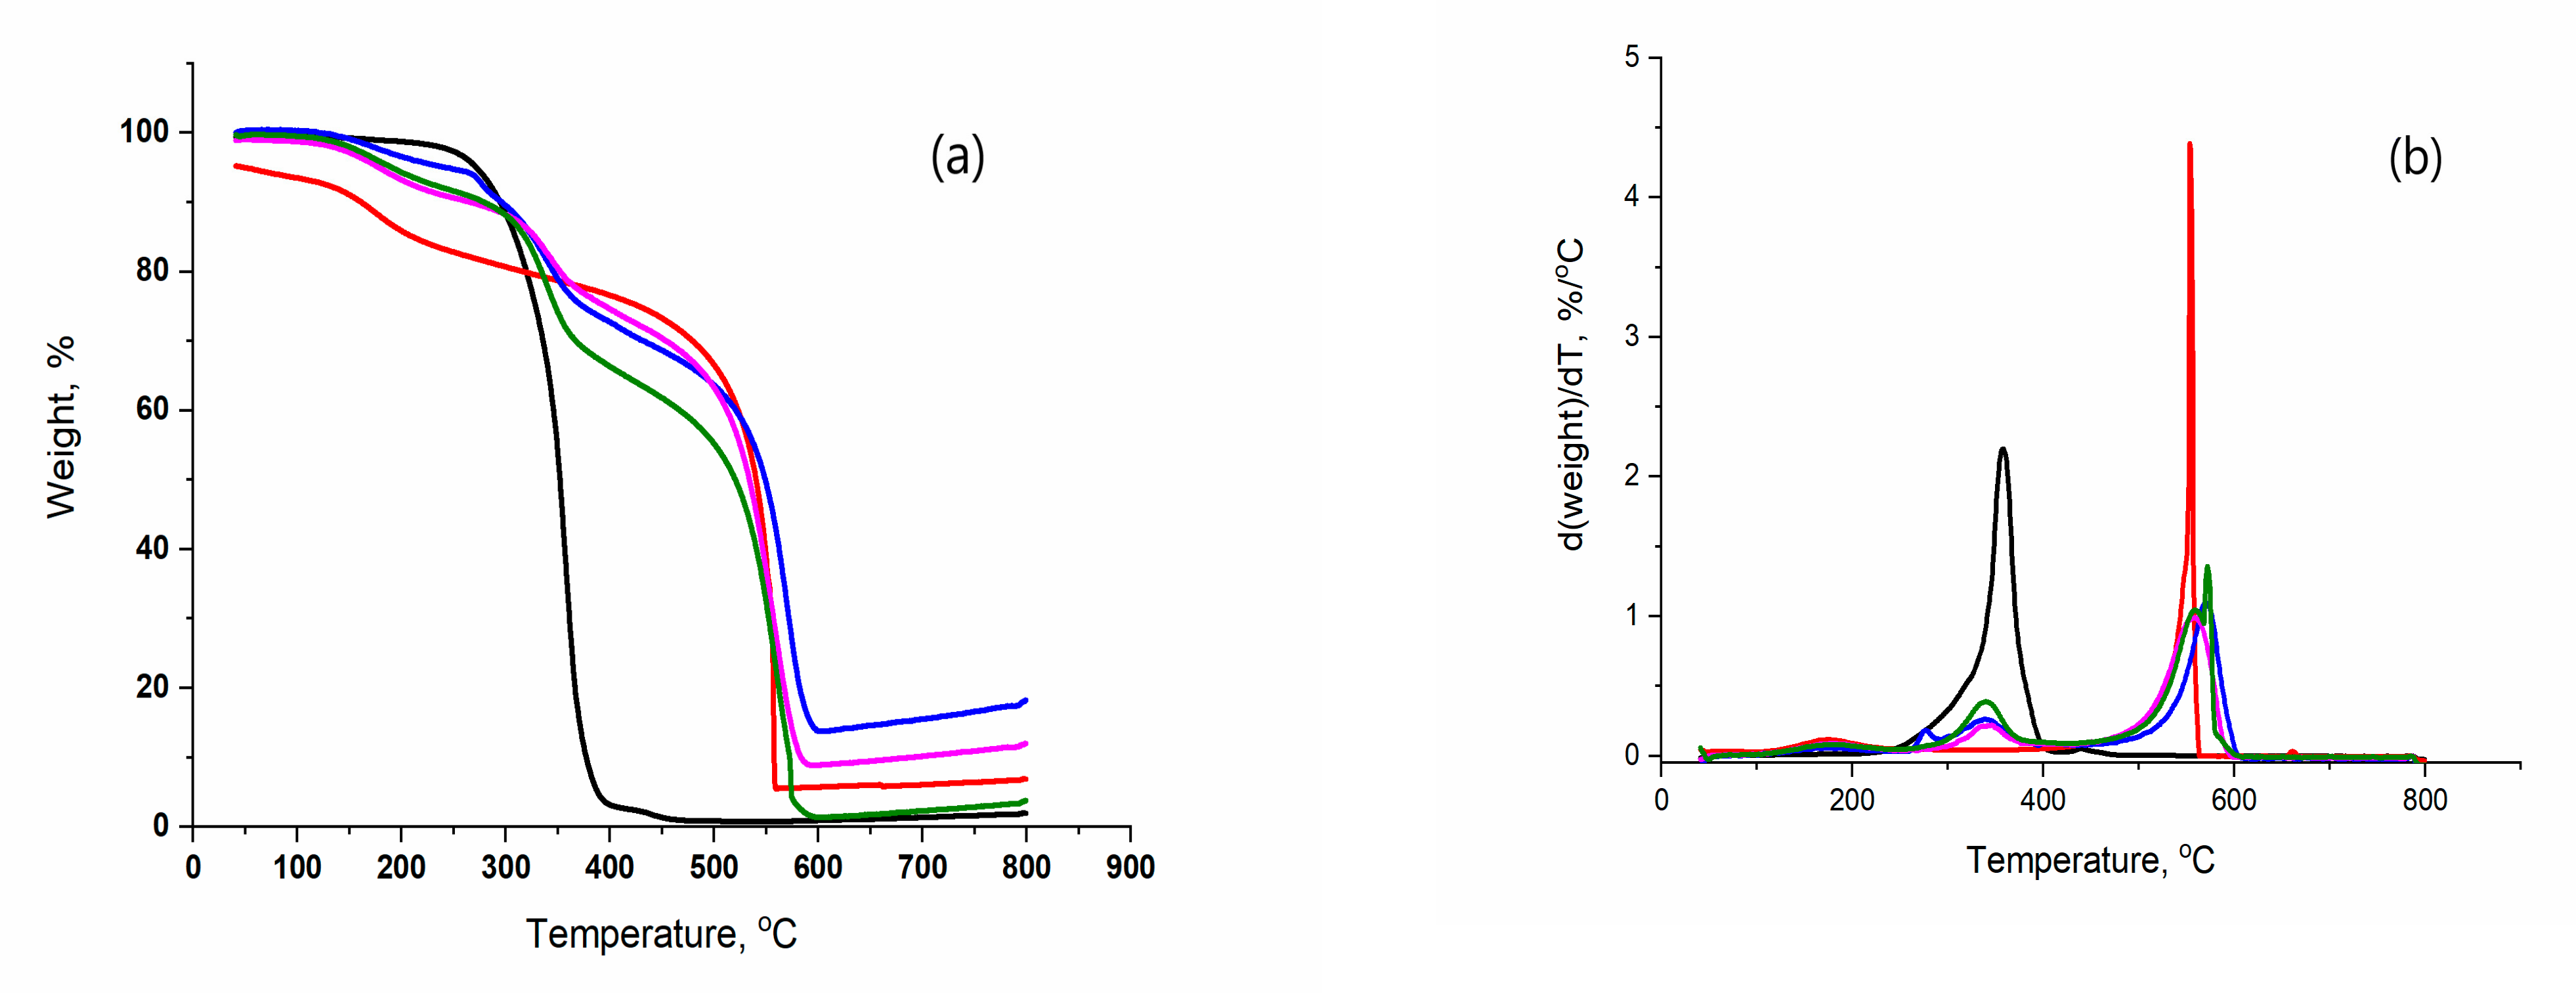
2.3.3. Thermal Degradation and Stability
2.3.4. Mechanical Properties
3. Results and Discussion
4. Conclusions
Author Contributions
Funding
Institutional Review Board Statement
Acknowledgments
Conflicts of Interest
References
- Gorgolis, G.; Galiotis, C. Graphene aerogels: A review. 2D Mater. 2017, 4, 032001. [Google Scholar] [CrossRef]
- Huang, Y.; Liang, J.; Chen, Y. An overview of the applications of graphene-based materials in supercapacitors. Small 2012, 8, 1805–1834. [Google Scholar] [CrossRef] [PubMed]
- Li, Y.; Fu, Z.-Y.; Su, B.-L. Hierarchically Structured Porous Materials for Energy Conversion and Storage. Adv. Funct. Mater. 2012, 22, 4634–4667. [Google Scholar] [CrossRef]
- Qiu, B.; Xing, M.; Zhang, J. Mesoporous TiO2 nanocrystals grown in situ on graphene aerogels for high photocatalysis and lithium-ion batteries. J. Am. Chem. Soc. 2014, 136, 5852–5855. [Google Scholar] [CrossRef] [PubMed]
- Chang, Z.; Zhang, D.-S.; Chen, Q.; Bu, X.-H. Microporous organic polymers for gas storage and separation applications. Phys. Chem. Chem. Phys. PCCP 2013, 15, 5430–5442. [Google Scholar] [CrossRef]
- Schedin, F.; Geim, A.K.; Morozov, S.V.; Hill, E.W.; Blake, P.; Katsnelson, M.I.; Novoselov, K.S. Detection of individual gas molecules adsorbed on graphene. Nat. Mater. 2007, 6, 652–655. [Google Scholar] [CrossRef]
- Zhou, X.; Li, Y.; Peng, T.; Xie, W.; Zhao, X. Synthesis, characterization and its visible-light-induced photocatalytic property of carbon doped ZnO. Mater. Lett. 2009, 63, 1747–1749. [Google Scholar] [CrossRef]
- Parlett, C.M.A.; Wilson, K.; Lee, A.F. Hierarchical porous materials: Catalytic applications. Chem. Soc. Rev. 2013, 4, 23876–23893. [Google Scholar] [CrossRef]
- Huang, J.; Tao, C.-A.; An, Q.; Zhang, W.; Wu, Y.; Li, X.; Shen, D.; Li, G. 3D-ordered macroporous poly(ionic liquid) films as multifunctional materials. Chem. Comm. 2010, 46, 967–969. [Google Scholar] [CrossRef]
- Wang, X.; Husson, S.M.; Qian, X.; Wickramasinghe, S.R. Inverse colloidal crystal microfiltration membranes. J. Memb. Sci. 2010, 365, 302–310. [Google Scholar] [CrossRef]
- Zhong, Y.; Zhou, M.; Huang, F.; Lin, T.; Wan, D. Effect of graphene aerogel on thermal behavior of phase change materials for thermal management, Sol. Energy Mater. Sol. Cells 2013, 113, 195–200. [Google Scholar] [CrossRef]
- Xu, Y.; Sheng, K.; Li, C.; Shi, G. Self-assembled graphene hydrogel via a one step hydrothermal process. ACS Nano 2010, 4, 4324–4330. [Google Scholar] [CrossRef] [PubMed]
- Sun, H.; Xu, Z.; Gao, C. Multifunctional, ultra-flyweight, synergistically assembled carbon aerogels. Adv. Mater. 2013, 25, 2554–2560. [Google Scholar] [CrossRef] [PubMed]
- Ma, X.; Li, Y.; Wang, W.; Ji, Q.; Xia, Y. Temperature-sensitive poly(N-isopropylacrylamide)/graphene oxide nanocomposite hydrogels by in situ polymerization with improved swelling capability and mechanical behavior. Eur. Polym. J. 2013, 49, 389–396. [Google Scholar] [CrossRef]
- Chen, C.-M.; Zhang, Q.; Huang, C.-H.; Zhao, X.-C.; Zhang, B.-S.; Kong, Q.-Q.; Wang, M.-Z.; Yang, Y.-G.; Caia, R.; Su, D.S. Macroporous ‘bubble’ graphene film via template-directed ordered-assembly for high rate supercapacitors. Chem. Commun. 2012, 48, 7149–7151. [Google Scholar] [CrossRef]
- Li, Y.; Chen, J.; Huang, L.; Li, C.; Hong, J.-D.; Shi, G. Highly Compressible Macroporous Graphene Monoliths via an Improved Hydrothermal Process. Adv. Mater. 2014, 26, 4789–4793. [Google Scholar] [CrossRef]
- Bi, H.; Chen, I.-W.; Lin, T.; Huang, F. A New Tubular Graphene Form of a Tetrahedrally Connected Cellular Structure. Adv. Mater. 2015, 27, 5943–5949. [Google Scholar] [CrossRef]
- Zhu, C.; Han TY, J.; Duoss, E.B.; Golobic, A.M.; Kuntz, J.D.; Spadaccini, C.M.; Worsley, M.A. Highly Compressible 3D Periodic Graphene Aerogel Microlattices. Nat. Commun. 2015, 6, 6962. [Google Scholar] [CrossRef] [Green Version]
- Zhang, M.; Li, Y.; Su, Z.; Wei, G. Recent advances in the synthesis and applications of graphene–polymer nanocomposites. Polym. Chem. 2015, 6, 6107–6124. [Google Scholar] [CrossRef]
- Arzac, A.; Leal, G.P.; Carlos de la Cal, J.; Tomovska, R. Water-Borne Polymer/Graphene Nanocomposites. Macromol. Mater. Eng. 2017, 302, 1600315. [Google Scholar] [CrossRef]
- Hu, W.C.; Li, W.D.; Dai, S.C.Z. A critical review on the development and performance of polymer/graphene nanocomposites. Sci. Eng. Compos. Mater. 2018, 25, 1059–1073. [Google Scholar]
- Nwosu, C.N.; Iliut, M.; Vijayaraghavan, A. Graphene and water-based elastomer nanocomposites—A review. Nanoscale 2021, 13, 9505–9540. [Google Scholar] [CrossRef]
- Fadil, Y.; Thickett, S.C.; Agarwal, V.; Zetterlund, P.B. Synthesis of graphene-based polymeric nanocomposites using emulsion techniques. Prog. Polym. Sci. 2022, 125, 101476. [Google Scholar] [CrossRef]
- Spasevska, D.; Danilovska, V.; Leal, G.P.; Blazevska- Giliev, J.; Tomovska, R. Reactive emulsion mixing as a novel pathway toward water borne reduced graphene oxide/polymer composites. RSC Adv. 2014, 4, 24477–24483. [Google Scholar] [CrossRef]
- Spasevska, D.; Leal, G.P.; Fernández, M.; Blazevska Gilev, J.; Paulis, M.; Tomovska, R. Crosslinked reduced graphene oxide/polymer composites via in situ synthesis by semicontinuous emulsion polymerization. RSC Adv. 2015, 5, 16414–16421. [Google Scholar] [CrossRef] [Green Version]
- Ormategui, N.; Veloso, A.; Leal, G.P.; Rodriguez-Couto, S.; Tomovska, R. Design of Stable and Powerful Nanobiocatalysts, Based on Enzyme Laccase Immobilized on Self-Assembled 3D Graphene/Polymer Composite Hydrogels. ACS Appl. Mater. Interfaces 2015, 7, 14104–14112. [Google Scholar] [CrossRef]
- Trajcheva, A.; Politakos, N.; Perez, B.T.; Joseph, Y.; Gilev, J.B.; Tomovska, R. QCM nanocomposite gas sensors–Expanding the application of waterborne polymer composites based on graphene nanoribbon. Polymer 2021, 213, 123335. [Google Scholar] [CrossRef]
- Zhang, W.; Li, S.; Ma, J.; Wu, Y.; Liu, C.; Yan, H. pH-Induced Electrostatic Interaction between Polyacrylates and Amino-Functionalized Graphene Oxide on Stability and Coating Performances. Polymers 2021, 13, 3406. [Google Scholar] [CrossRef]
- Díez-Pascual, A.M. Development of Graphene-Based Polymeric Nanocomposites: A Brief Overview. Polymers 2021, 13, 2978. [Google Scholar] [CrossRef]
- Prasad, M.D.; Sharma, A.; Tambe, P. Graphene Nanoribbons Reinforced Polymer Nanocomposites and its Applications: A Review. J. Phys. Conf. Ser. 2022, 2225, 012004. [Google Scholar] [CrossRef]
- Fadil, Y.; Agarwal, V.; Jasinski, F.; Thickett, S.C.; Minami, H.; Zetterlund, P.B. Electrically conductive polymer/rGO nanocomposite films at ambient temperature via miniemulsion polymerization using GO as surfactant. Nanoscale 2019, 11, 6566–6570. [Google Scholar] [CrossRef]
- Zhang, Z.; Scherer, G.W. Supercritical Drying of Cementitious Materials. Cement Concrete Res. 2017, 99, 137–154. [Google Scholar] [CrossRef] [Green Version]
- Zhang, Y.; Li, Y.; Lei, Q.; Fang, X.; Xie, H.; Yu, W. Tightly-packed fluorinated graphene aerogel/polydimethylsiloxane composite with excellent thermal management properties. Compos. Sci. Technol. 2022, 220, 109302. [Google Scholar] [CrossRef]
- Li, C.; Qiu, L.; Zhang, B.; Li, D.; Liu, C.-Y. Robust Vacuum-/air-Dried Graphene Aerogels and Fast Recoverable Shape-Memory Hybrid Foams. Adv. Mater. 2016, 28, 1510–1516. [Google Scholar] [CrossRef] [PubMed]
- Chabot, V.; Higgins, D.; Yu, A.P.; Xiao, X.C.; Chen, Z.W.; Zhang, J.J. A review of graphene and graphene oxide sponge materials and applications to energy and the environment. Energy Environ. Sci. 2014, 7, 1564–1596. [Google Scholar] [CrossRef]
- Yang, H.; Zhang, T.; Jiang, M.; Duana, Y.; Zhang, J. Ambient pressure dried graphene aerogels with superelasticity and multifunctionality. J. Mater. Chem. A 2015, 3, 19268–19272. [Google Scholar] [CrossRef]
- Ding, M.; Li, C. Recent Advances in Simple Preparation of 3D Graphene Aerogels Based on 2D Graphene Materials. Front Chem. 2022, 10, 815463. [Google Scholar] [CrossRef]
- Zhang, X.; Sui, Z.; Xu, B.; Yue, S.; Luo, Y.; Zhan, W.; Liu, B. Mechanically strong and highly conductive graphene aerogel and its use as electrodes for electrochemical power sources. J. Mater. Chem. 2011, 21, 6494–6497. [Google Scholar] [CrossRef]
- Cheng, Y.; Zhou, S.; Hu, P.; Zhao, G.; Li, Y.; Zhang, X.; Han, W. Enhanced mechanical, thermal, and electric properties of graphene aerogels via supercritical ethanol drying and high-temperature thermal reduction. Sci. Rep. 2017, 7, 1439. [Google Scholar] [CrossRef] [Green Version]
- Xie, J.; Niu, L.; Qiao, Y.; Lei, Y.; Li, G.; Zhang, X.; Chen, P. The influence of the drying method on the microstructure and the compression behavior of graphene aerogel. Diam. Relat. Mater. 2022, 121, 108772. [Google Scholar] [CrossRef]
- Wang, Z.; Tang, Z.; Han, Z.; Shen, S.; Zhao, B.; Yang, J. Effect of drying conditions on the structure of three-dimensional N-doped graphene and its electrochemical performance. RSC Adv. 2015, 5, 19838–19843. [Google Scholar] [CrossRef]
- Chen, R.; Xu, C. Preparation and properties of graphene nano sheets-polystyrene nanocomposites via in situ emulsion polymerization. Chem. Phys. Lett. 2010, 484, 247–253. [Google Scholar]
- Tan, Y.; Fang, L.; Xiao, J.; Song, Y.; Zheng, Q. Grafting of copolymers onto graphene by miniemulsion polymerization for conductive polymer composites: Improved electrical conductivity and compatibility induced by interfacial distribution of graphene. Polym Chem. 2013, 4, 2939–2944. [Google Scholar] [CrossRef]
- Adhikari, B.; Biswas, A.; Banerajee, A. Graphen- oxide -based hydrogels to make metal nanoparticle containing reduced graphene oxide—Based functionalized hybrid hydrogels. Appl. Mater. Interfaces 2012, 4, 5472–5482. [Google Scholar] [CrossRef]
- Acik, M.; Lee, G.; Mattevi, C.; Pirkle, A.; Naklace, R.; Chowala, M.; Cho, K.; Chabel, Y. The role of oxygen during thermal reduction of graphene oxide studied by infrared absorption spectroscopy. J. Phys. Chem. C 2015, 115, 19761–19781. [Google Scholar] [CrossRef]
- Nguyen, S.; Nguyen, H.; Rinaldy, A.; Nguyen, N.; Fan, Z.; Duong, H. Morphology control and thermal stability of binderless- graphene aerogels from graphite for energy storage applications. Colloids Surf. A Physicochem. Eng. Asp. 2012, 444, 352–358. [Google Scholar] [CrossRef]
- Chen, P.B. One-pot synthesis and characterization of reduced graphene oxide—Gelatin nanocomposite hydrogels. RSC Adv. 2016, 6, 6171–6181. [Google Scholar]
- Goodwin, J.W.; Huges, R.W. Rheology for Chemists; The Royal Society for Chemistry: Cambridge, UK, 2008. [Google Scholar]


| Sample | D (mg/cm3) | SA (m2/g) | Vp (cm3/g) | dp (nm) | P (%) |
|---|---|---|---|---|---|
| X-30 | 540 | 22 | 0.017 | 3.1 | 31 |
| X-39 | 820 | 23 | 0.020 | 3.5 | 24 |
| X-56 | 930 | 44 | 0.042 | 3.7 | 45 |
| X-rGO | 450 | 52 | 0.050 | 3.8 | 96 |
| Sample | D (mg/cm3) | SA (m2/g) | Vp (cm3/g) | dp (nm) | P (%) |
|---|---|---|---|---|---|
| A-30 | 28 | 960 | 2.10 | 8.8 | 7500 |
| A-39 | 35 | 880 | 1.80 | 8.1 | 5100 |
| A-56 | 53 | 660 | 1.05 | 6.3 | 2000 |
| A-RGO | 25 | 1000 | 2.2 | 8.9 | 8800 |
| X-poly-OH | X-30 | X-39 | X-56 | X-rGO | |
|---|---|---|---|---|---|
| T1,i (°C) | - | 50 | 50 | 50 | 50 |
| T1,m (°C) | - | 198 | 96 | 95 | 95 |
| T1,f (°C) | - | 137 | 136 | 135 | 131 |
| Δm1 (%) | - | 5 | 5 | 5 | 8 |
| T2,i (°C) | 220 | 374 | 359 | 343 | - |
| T2,m (°C) | 350 | 440 | 420 | 400 | - |
| T2,f (°C) | 410 | 520 | 500 | 490 | - |
| Δm2 (%) | 97.2 | 20 | 26 | 20 | - |
| T3,i (°C) | - | 580 | 540 | 520 | 405 |
| T3,m (°C) | - | 640 | 610 | 568 | 606 |
| T3,f (°C) | - | 680 | 675 | 670 | 665 |
| Δm3 (%) | - | 31 | 29 | 26 | 88 |
| A-poly-OH | A-30 | A-39 | A-56 | A-rGO | |
|---|---|---|---|---|---|
| T1,i (°C) | - | 104 | 105 | 104 | 125 |
| T1,m (°C) | - | 168 | 166 | 168 | 177 |
| T1,f (°C) | - | 232 | 236 | 235 | 230 |
| Δm1 (%) | - | 7 | 6 | 5 | 16 |
| T2,i (°C) | 246 | 293 | 280 | 250 | - |
| T2,m (°C) | 357 | 350 | 340 | 295 | - |
| T2,f (°C) | 446 | 388 | 380 | 360 | - |
| Δm2 (%) | 98 | 27 | 18 | 15 | - |
| T3,i (°C) | - | 478 | 450 | 433 | 420 |
| T3,m (°C) | - | 570 | |||
| T3,f (°C) | - | 628 | 609 | 590 | 564 |
| Δm3 (%) | - | 66 | 60 | 40 | 70 |
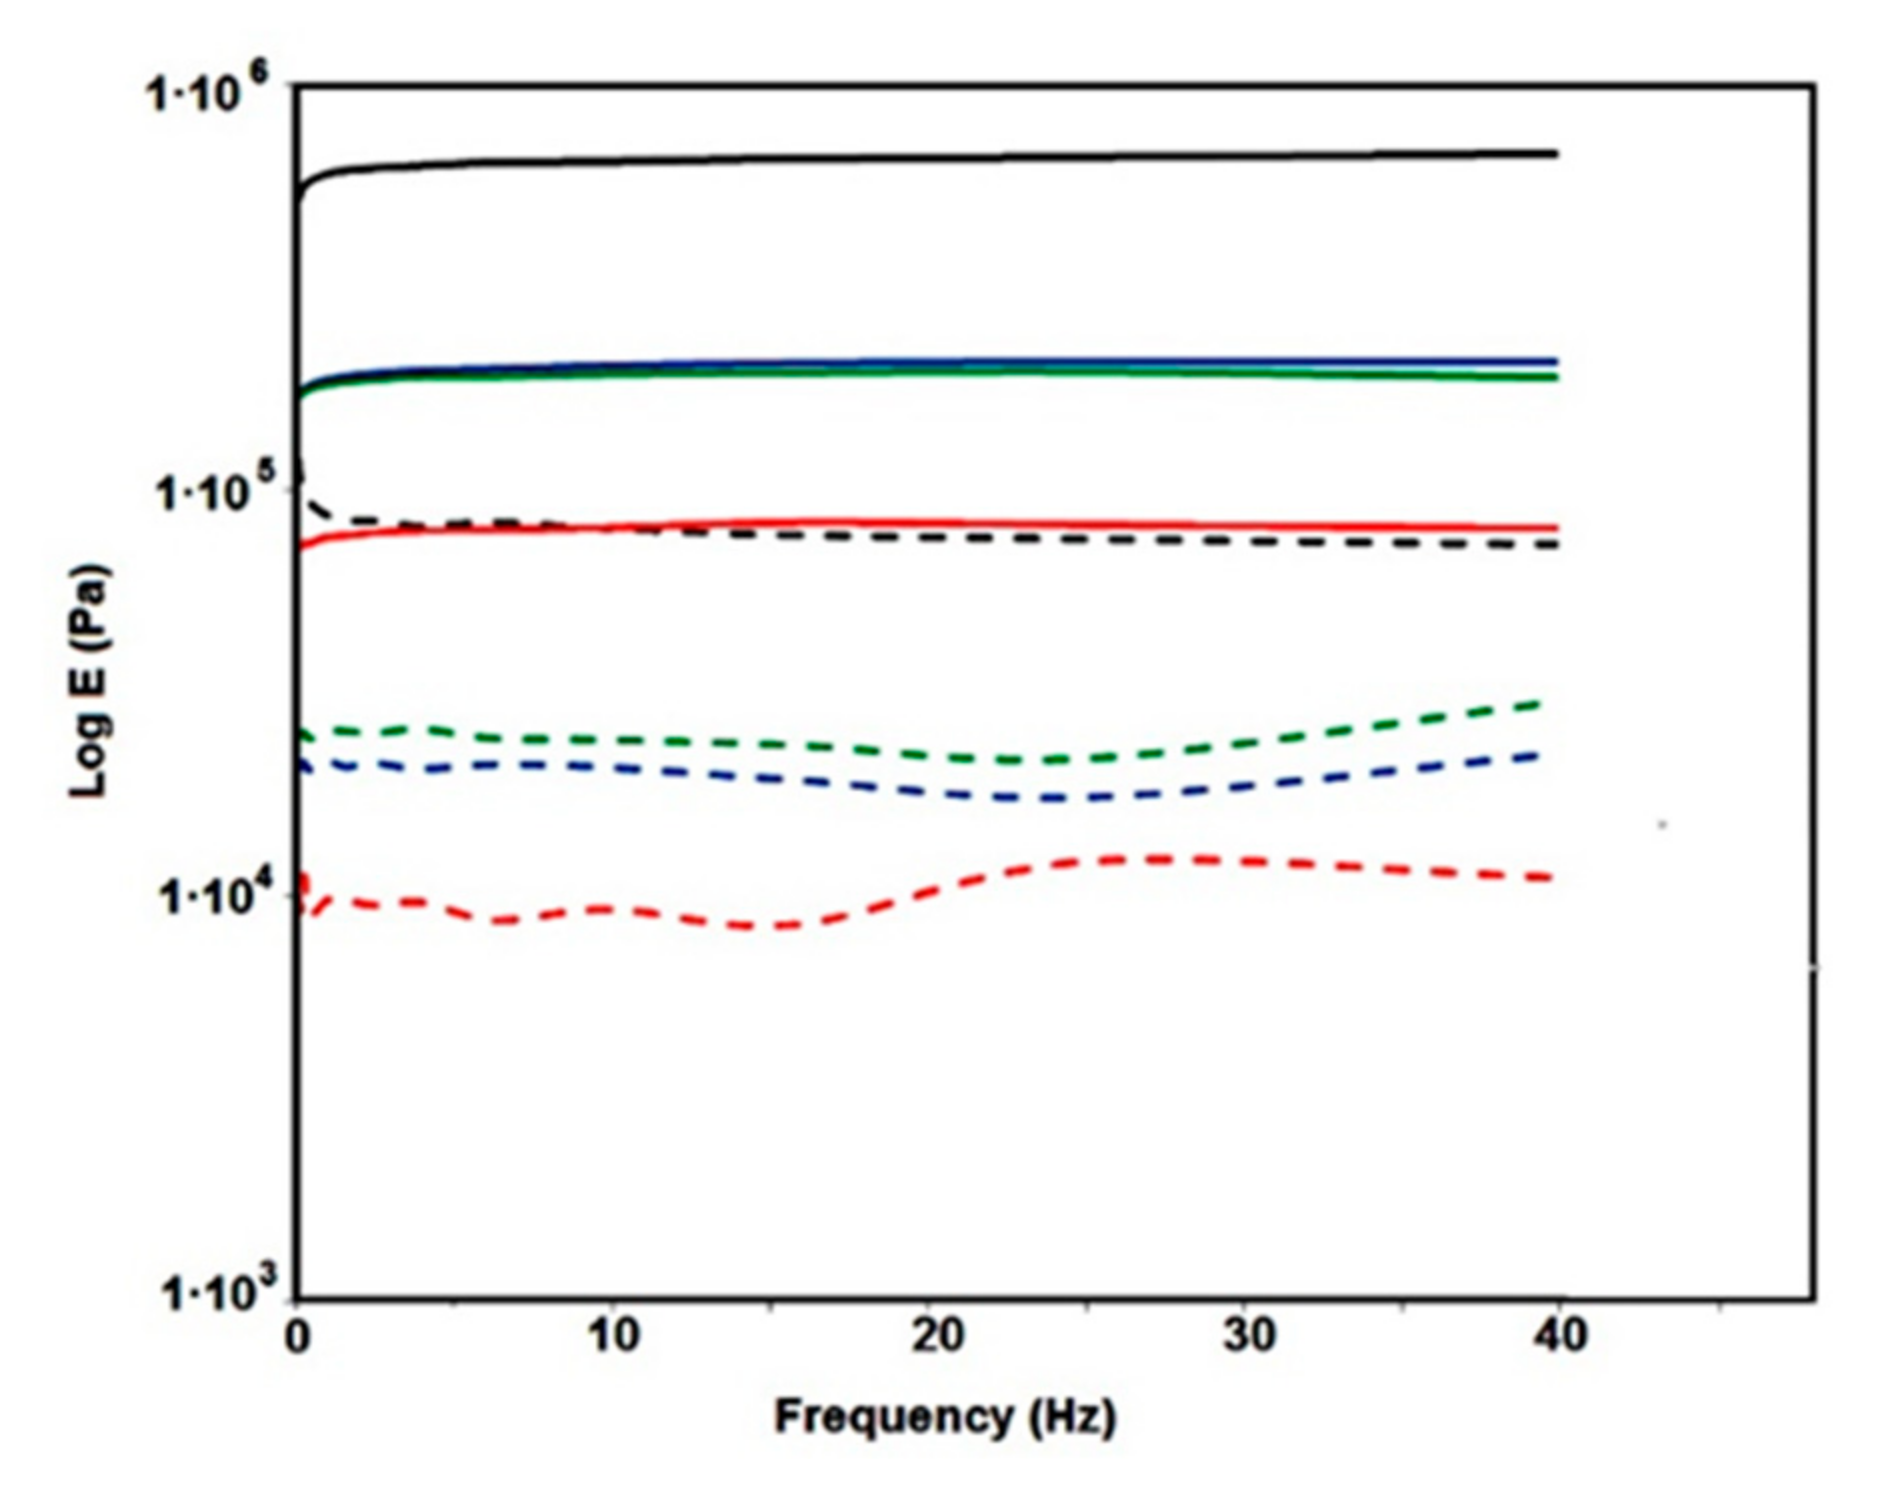
| Sample | E’, (kPa) | qc, (mol/m3) | dc, (nm) |
|---|---|---|---|
| Poly-OH | 86.7 | 35.0 | 3.62 |
| A-30 | 200 | 80.8 | 2.74 |
| A-39 | 323 | 130.5 | 2.33 |
| A-56 | 550 | 222.1 | 1.95 |
| A-rGO | 567 | 228.8 | 1.93 |
Disclaimer/Publisher’s Note: The statements, opinions and data contained in all publications are solely those of the individual author(s) and contributor(s) and not of MDPI and/or the editor(s). MDPI and/or the editor(s) disclaim responsibility for any injury to people or property resulting from any ideas, methods, instructions or products referred to in the content. |
© 2023 by the authors. Licensee MDPI, Basel, Switzerland. This article is an open access article distributed under the terms and conditions of the Creative Commons Attribution (CC BY) license (https://creativecommons.org/licenses/by/4.0/).
Share and Cite
Jovanovic, J.D.; Blagojevic, S.N.; Adnadjevic, B.K. The Effects of rGO Content and Drying Method on the Textural, Mechanical, and Thermal Properties of rGO/Polymer Composites. Polymers 2023, 15, 1287. https://doi.org/10.3390/polym15051287
Jovanovic JD, Blagojevic SN, Adnadjevic BK. The Effects of rGO Content and Drying Method on the Textural, Mechanical, and Thermal Properties of rGO/Polymer Composites. Polymers. 2023; 15(5):1287. https://doi.org/10.3390/polym15051287
Chicago/Turabian StyleJovanovic, Jelena D., Stevan N. Blagojevic, and Borivoj K. Adnadjevic. 2023. "The Effects of rGO Content and Drying Method on the Textural, Mechanical, and Thermal Properties of rGO/Polymer Composites" Polymers 15, no. 5: 1287. https://doi.org/10.3390/polym15051287