
Investigation of the Mechanical Properties of Quick-Strength Geopolymer Material Considering Preheated-to-Room Temperature Ratio of Sand, Na2SiO3-to-NaOH Ratio, and Fly Ash-to-GGBS Ratio


Abstract
:1. Introduction
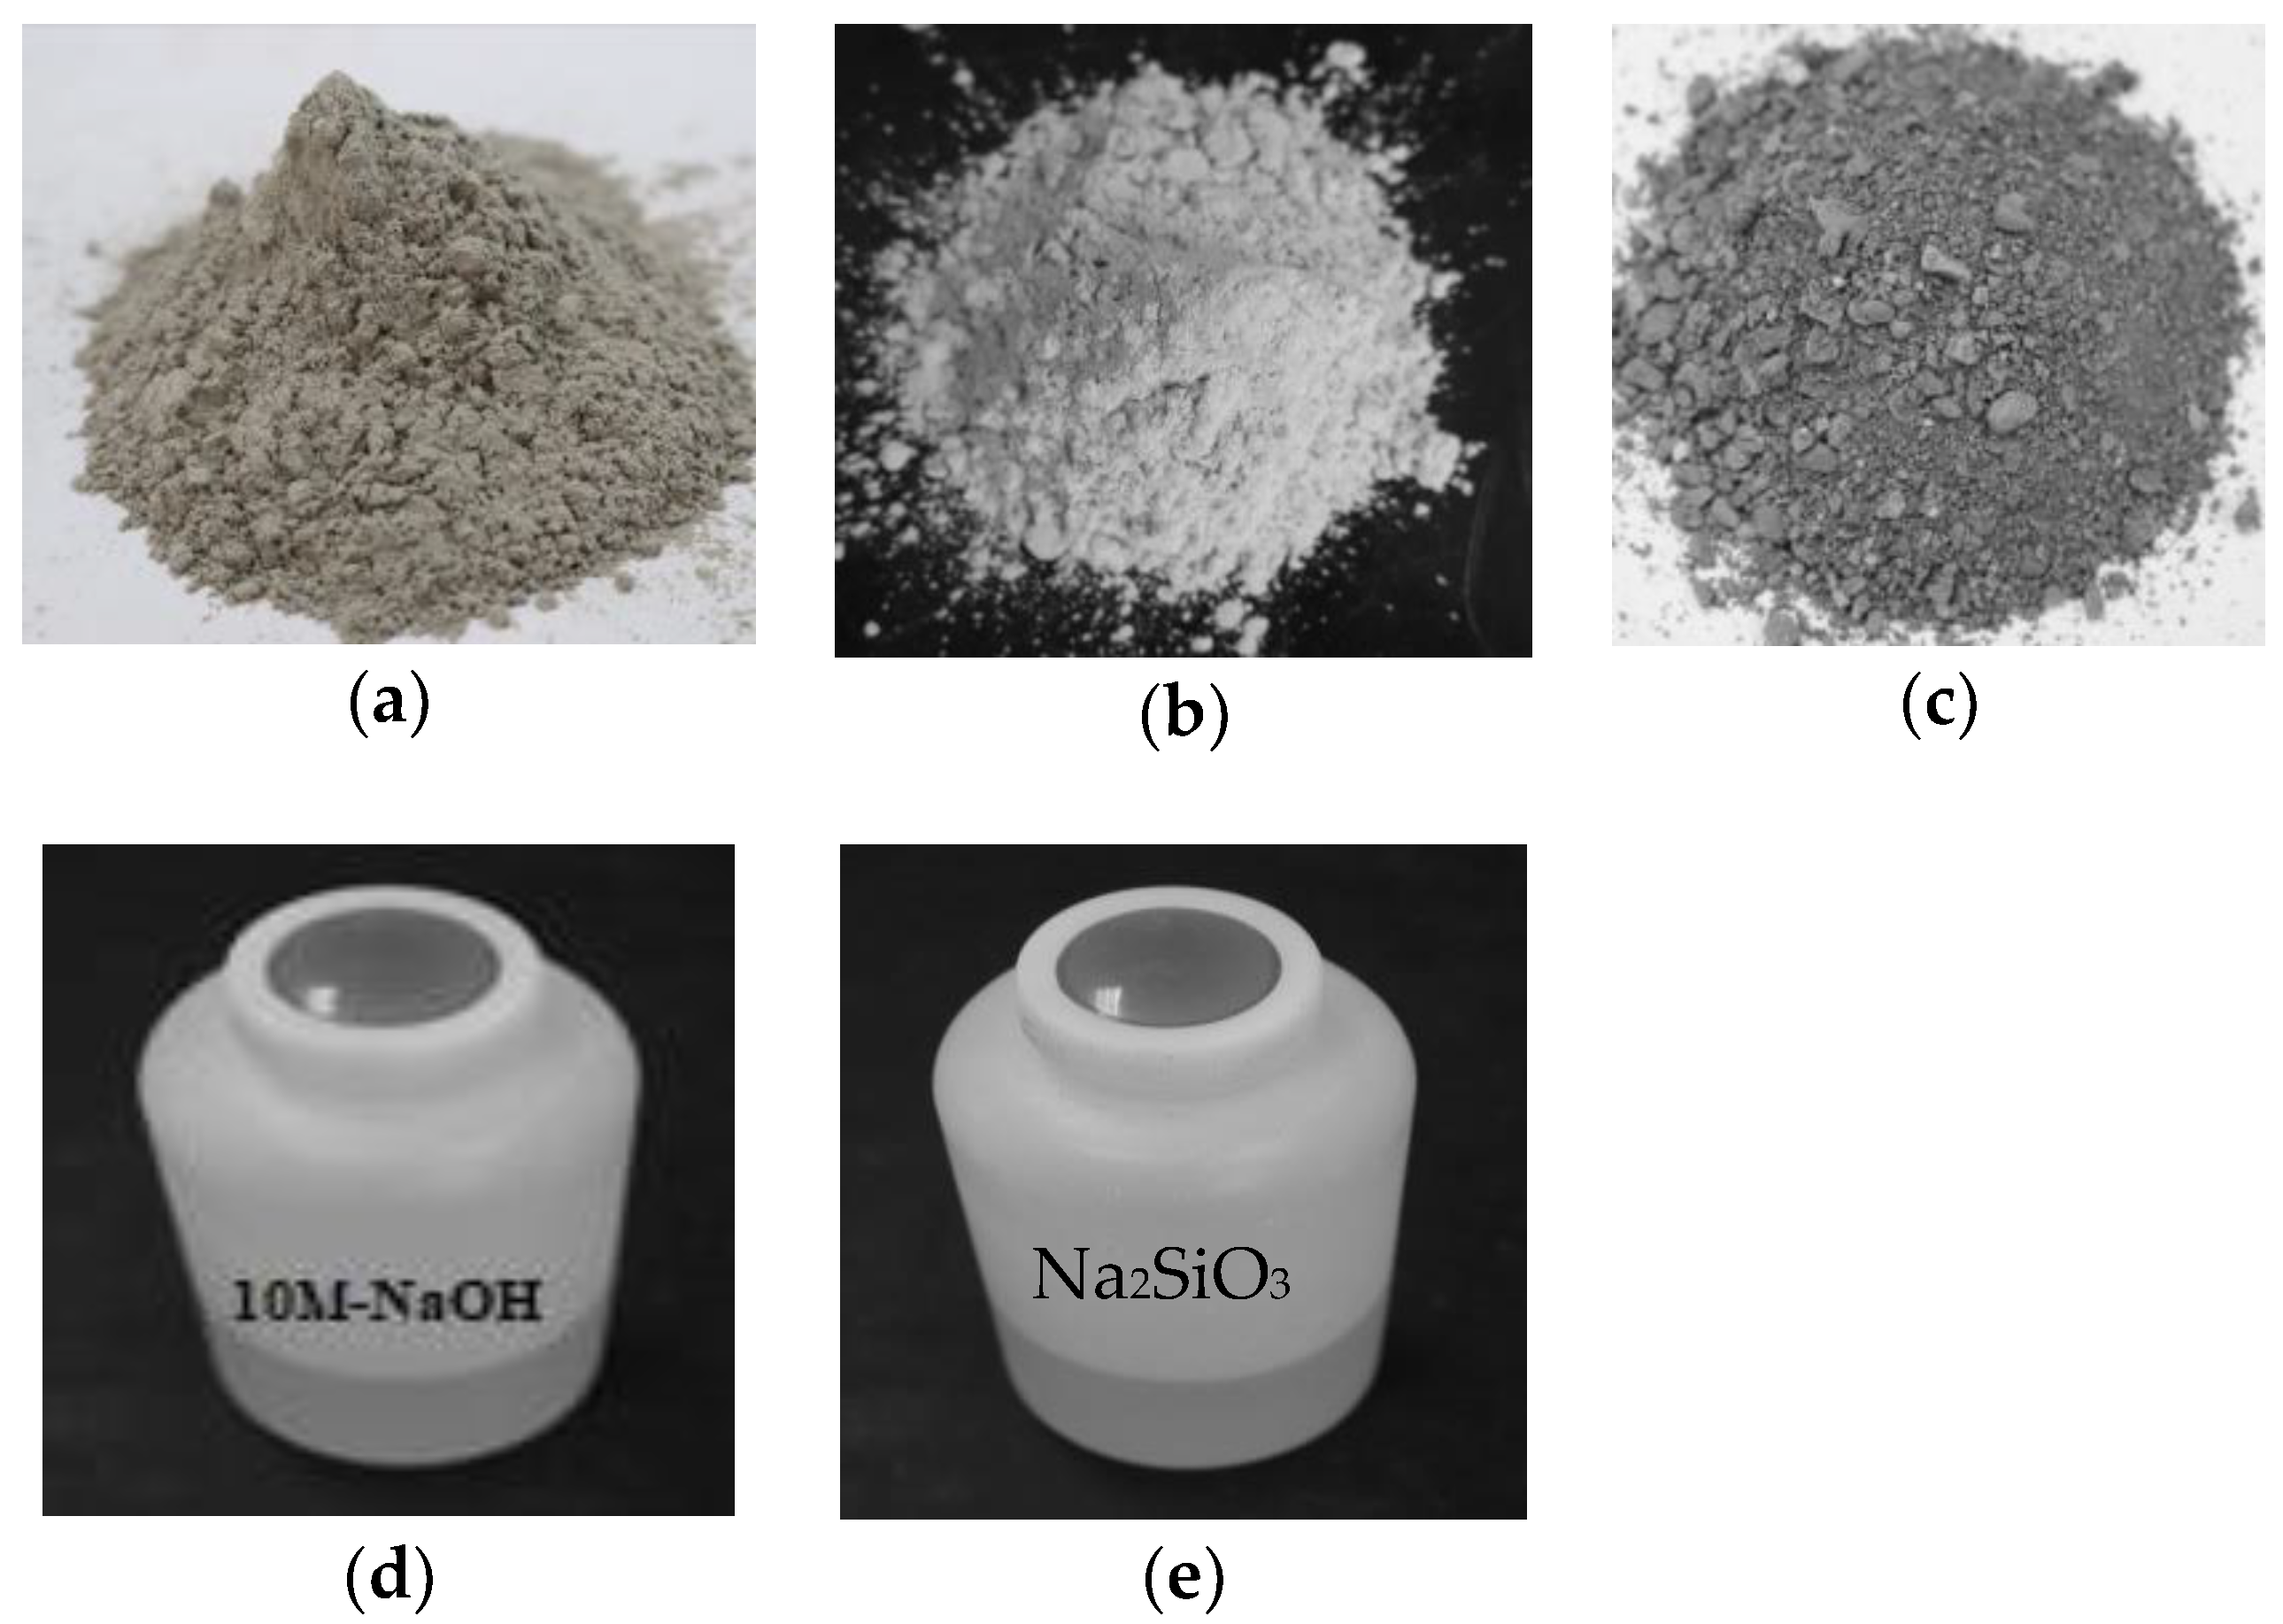
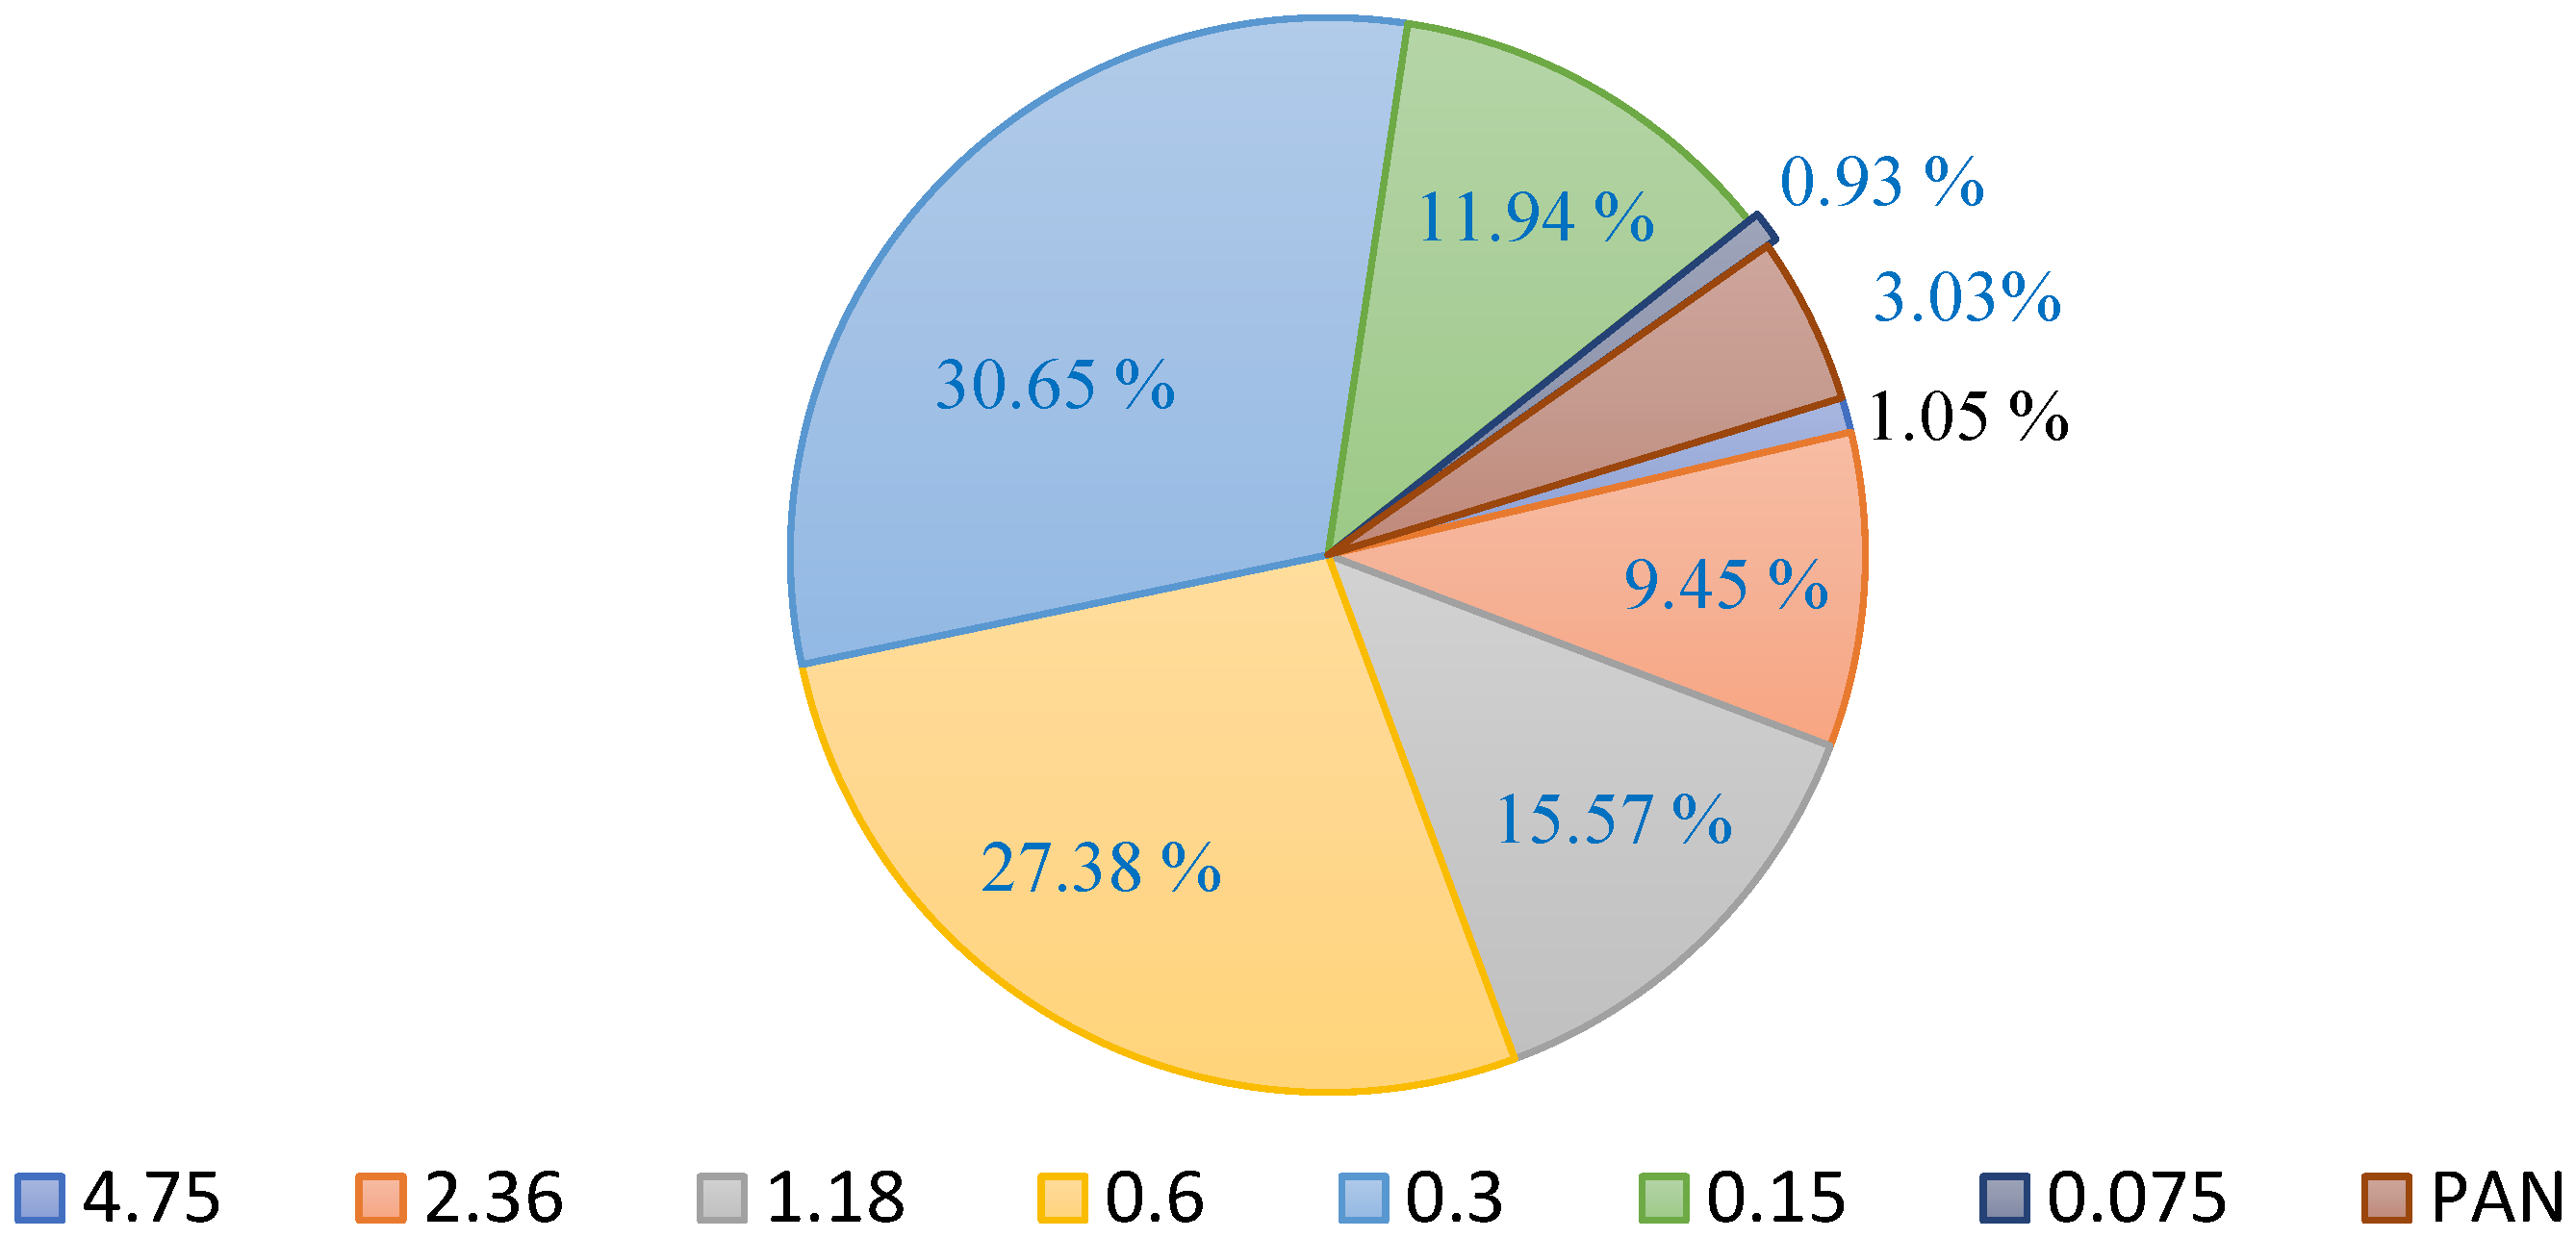
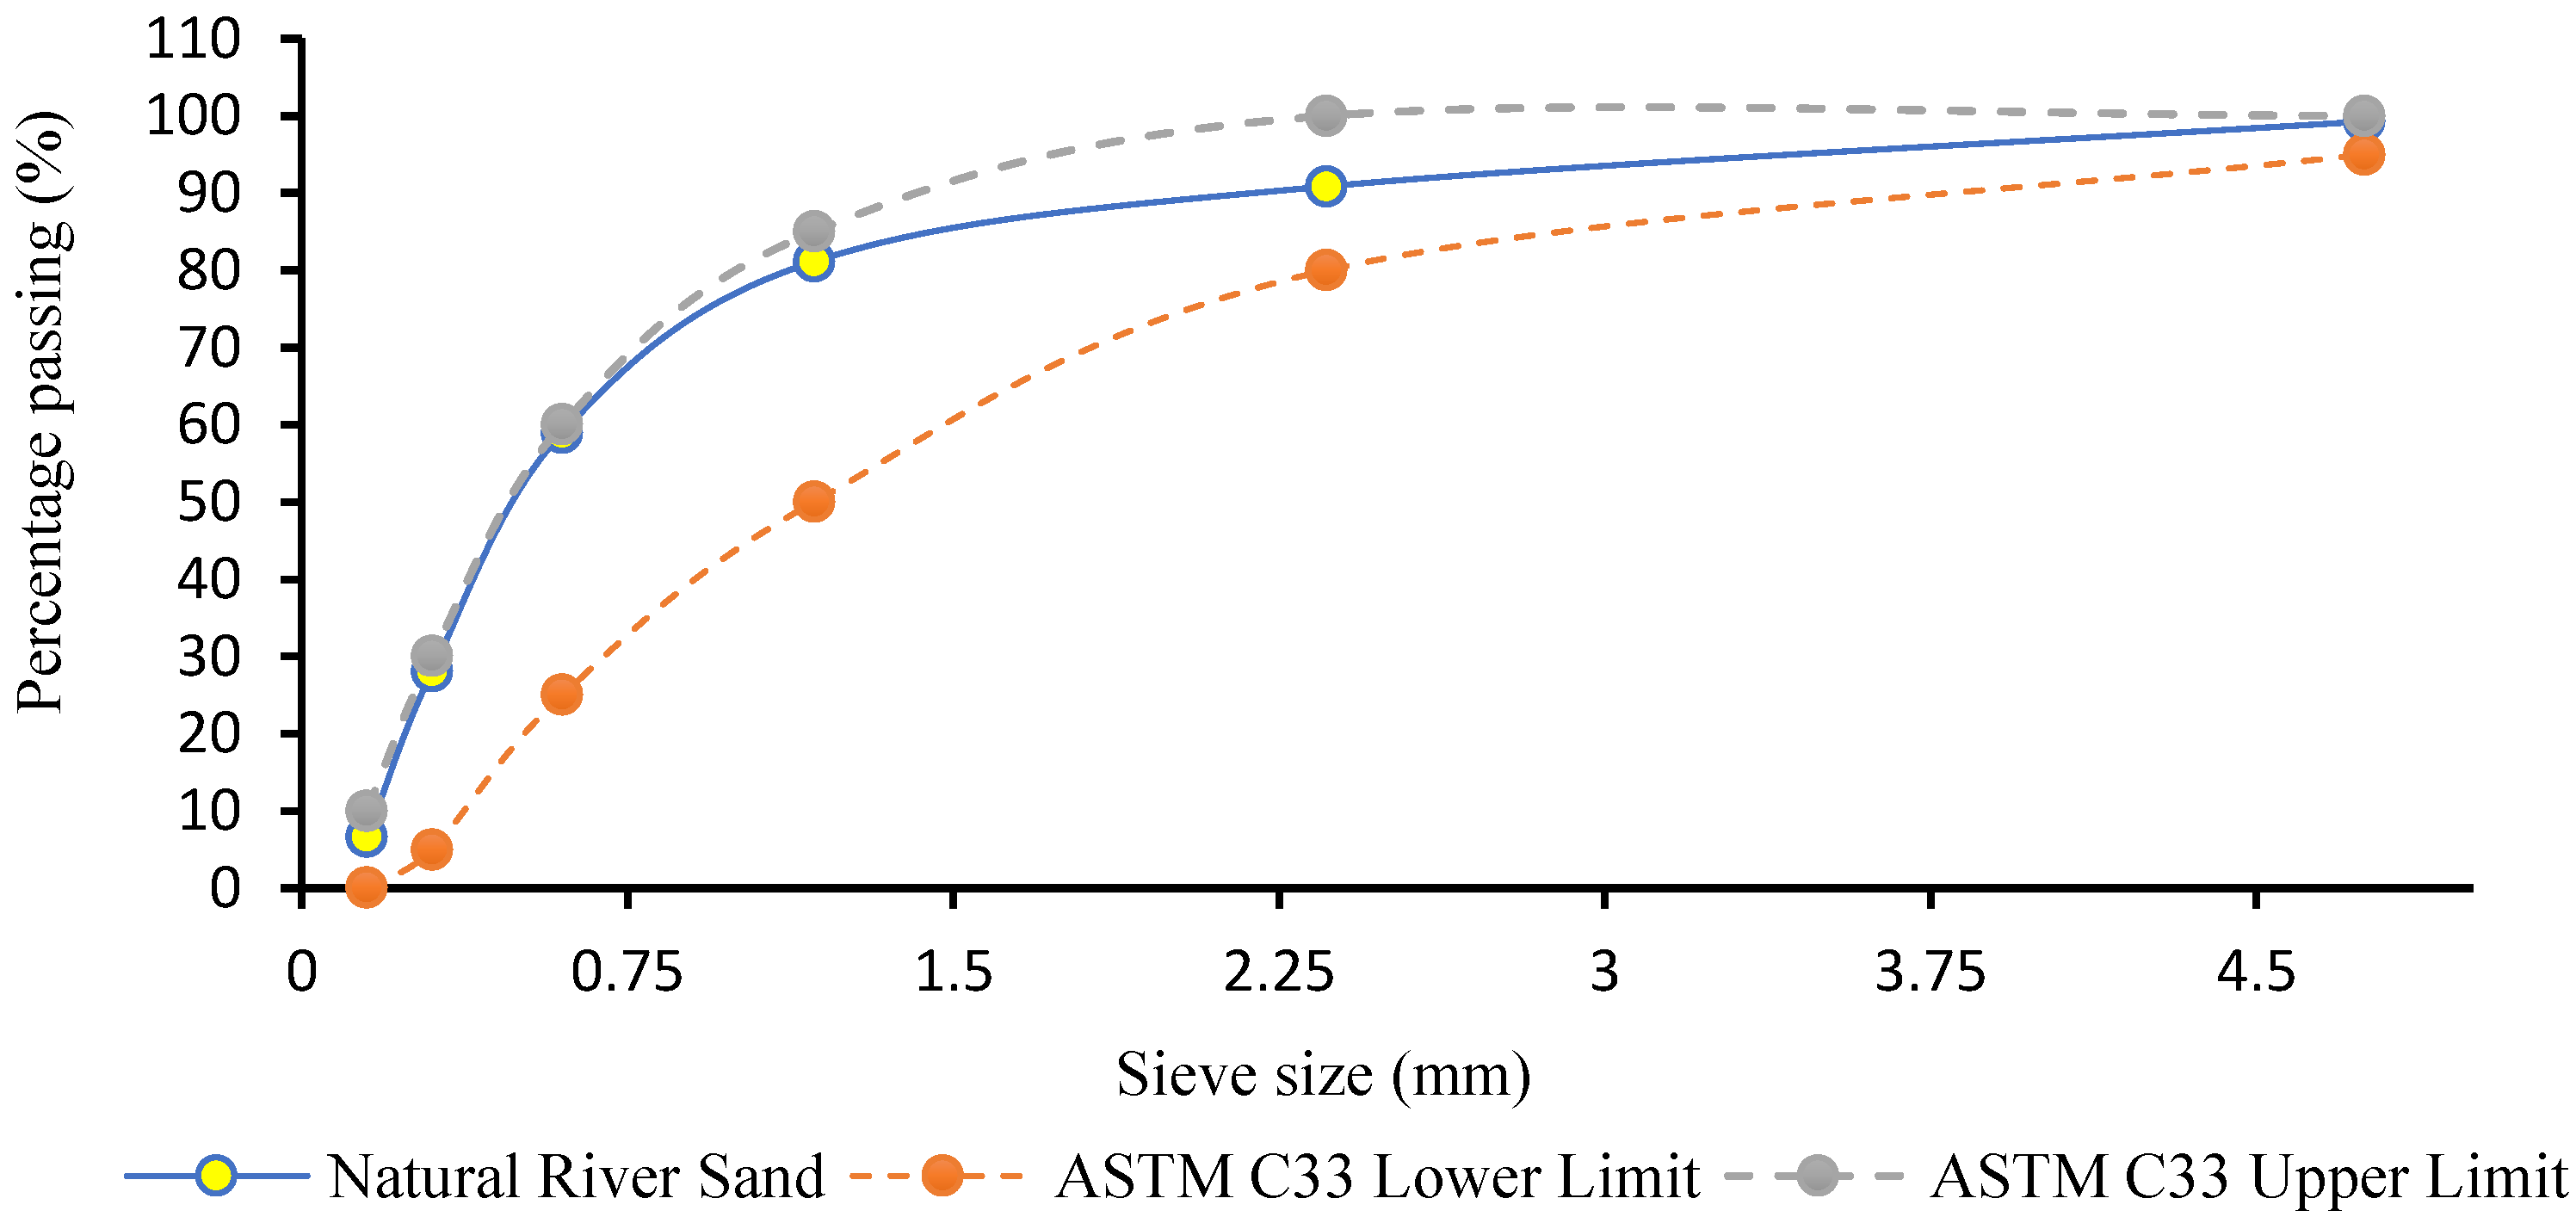
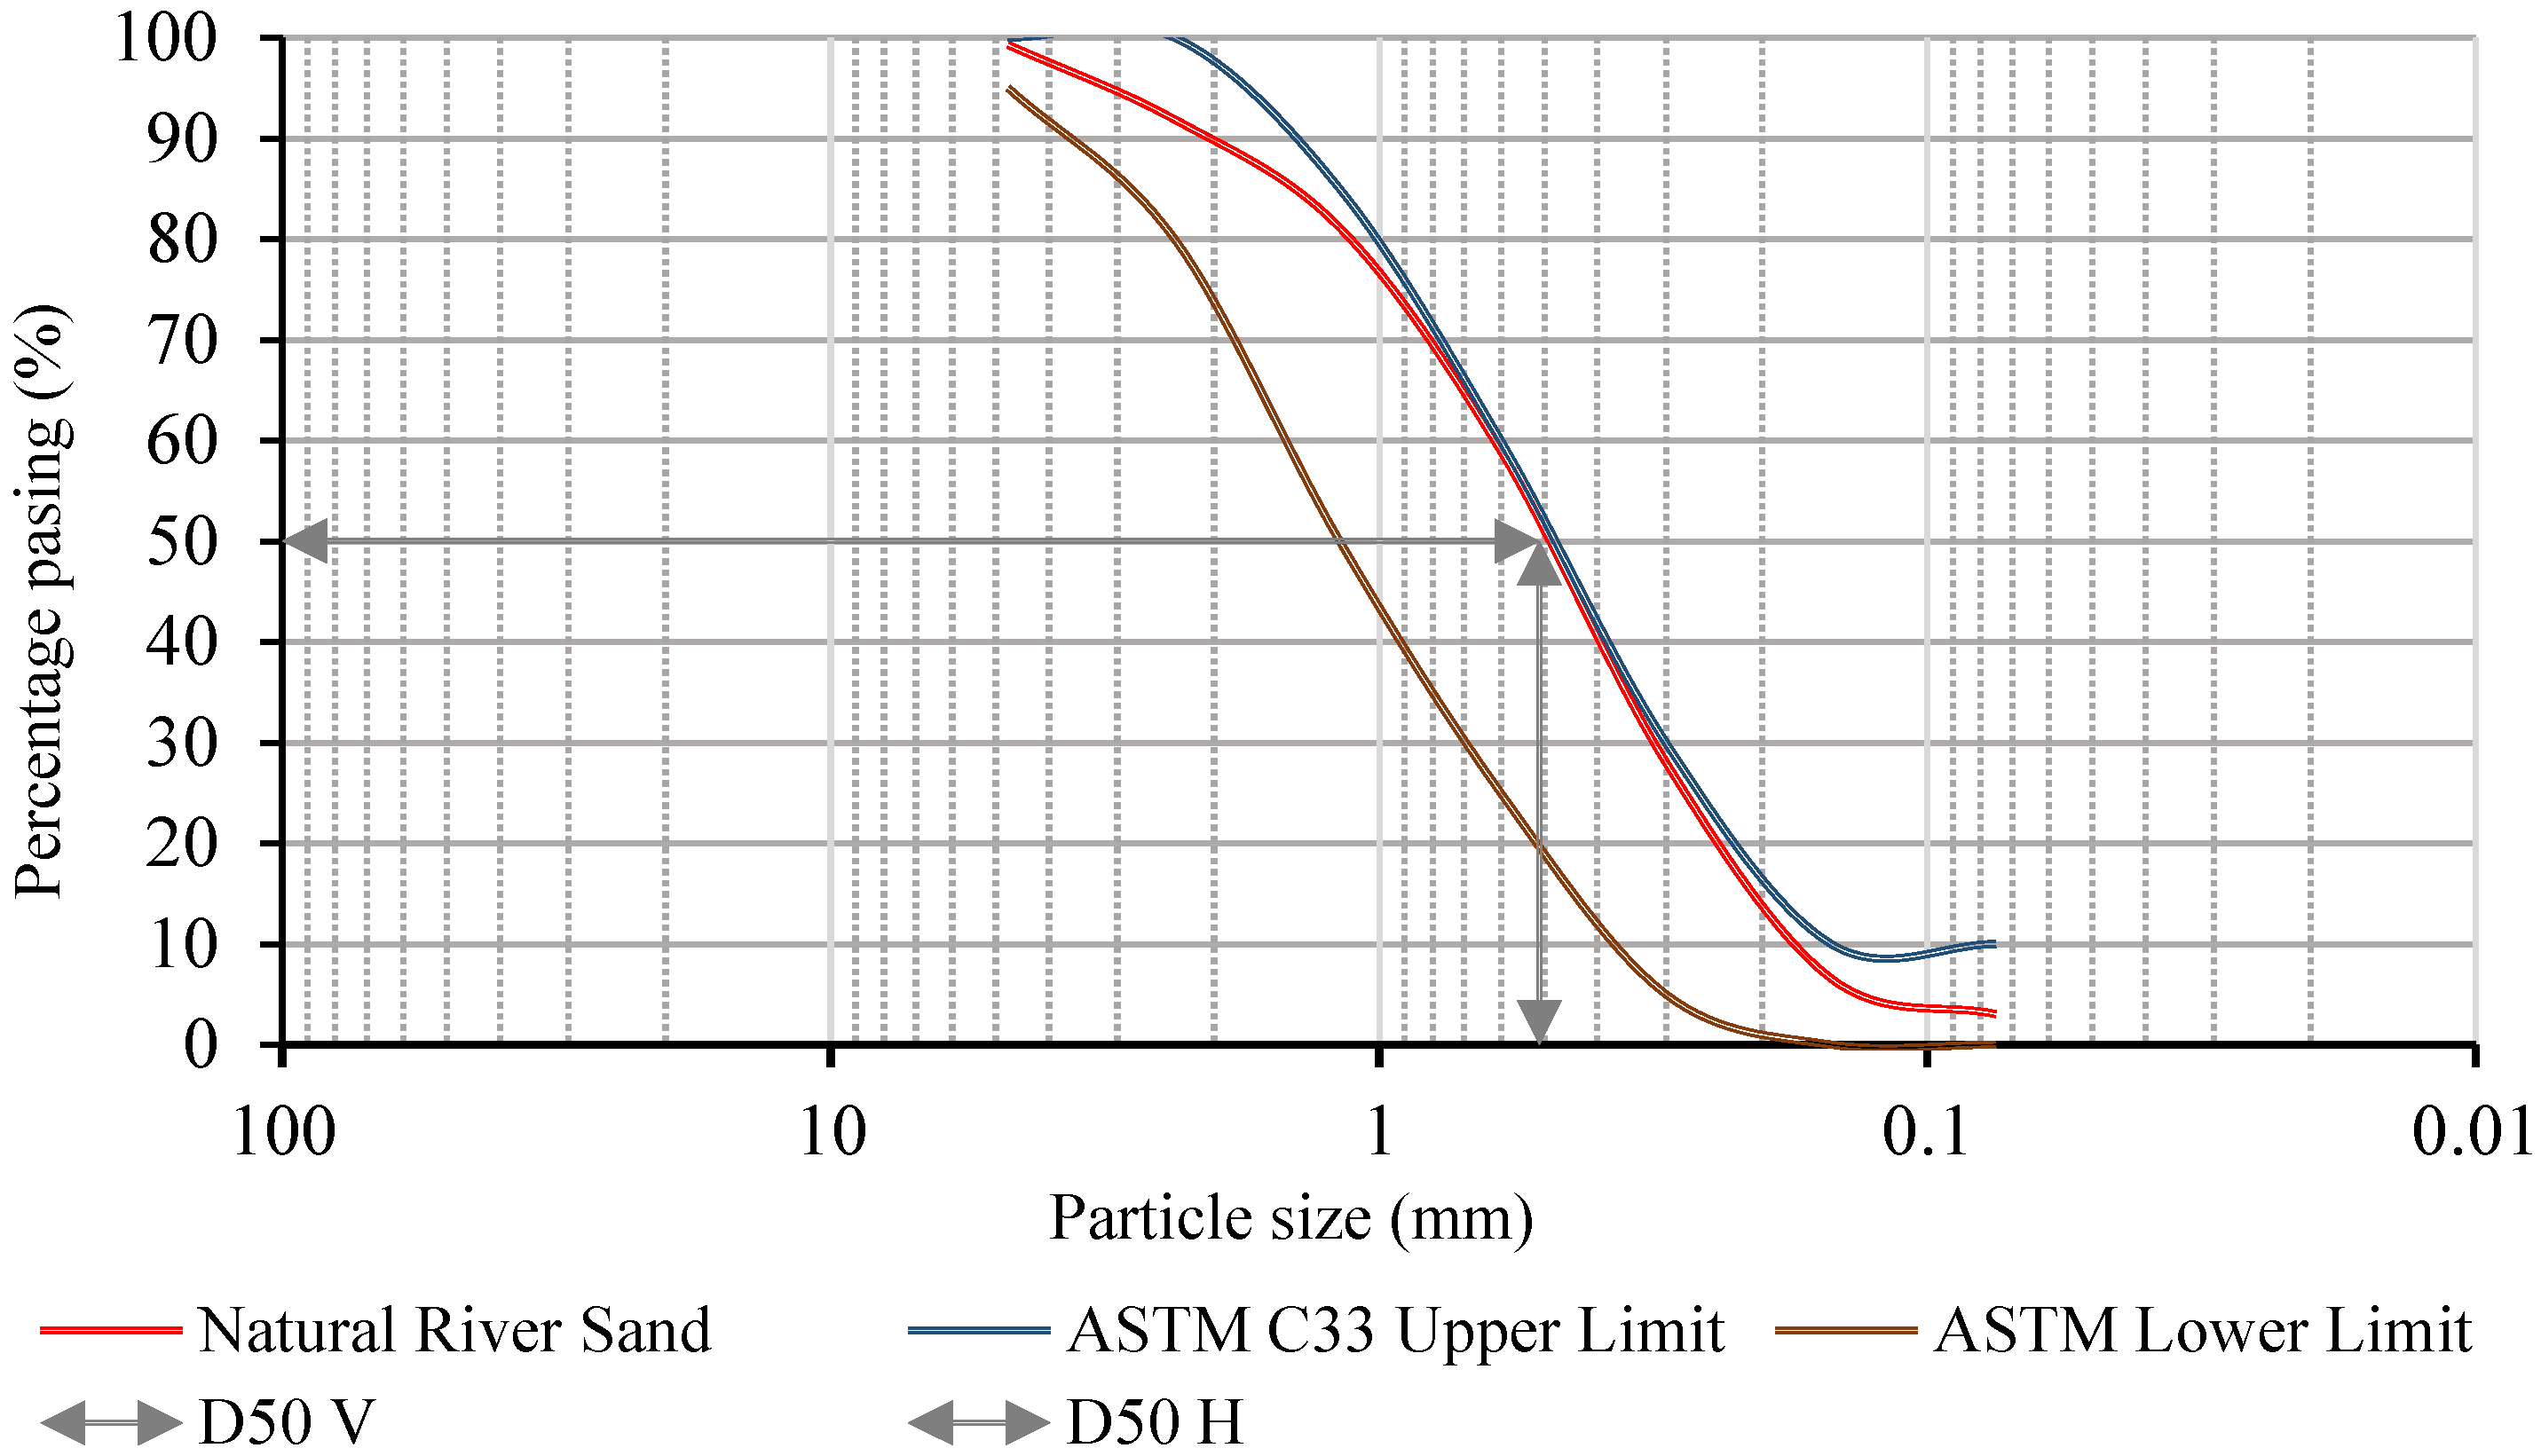
2. Materials and Methods
2.1. Mix Proportions
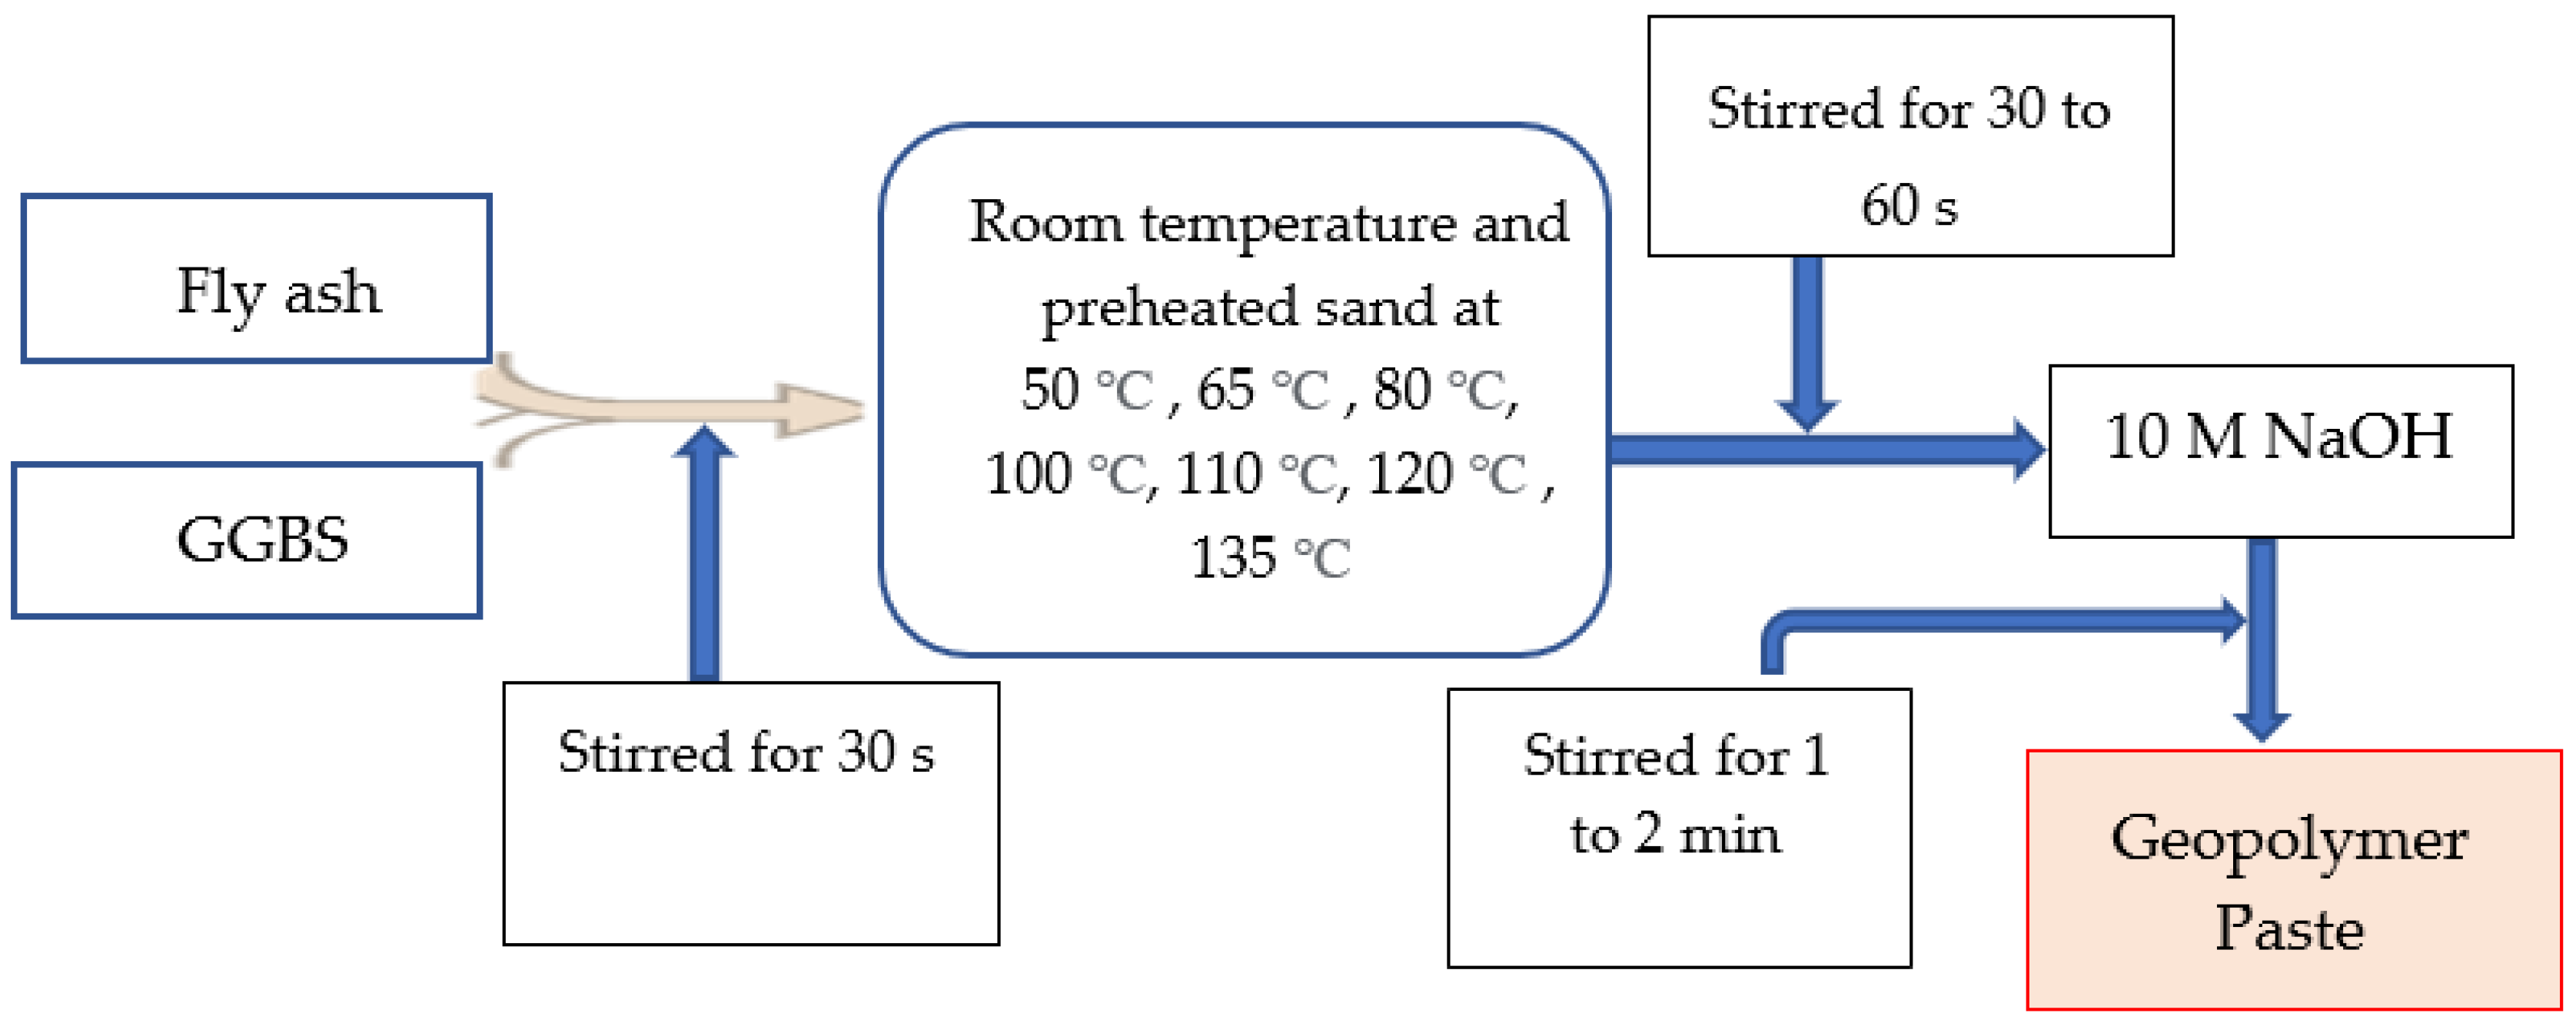
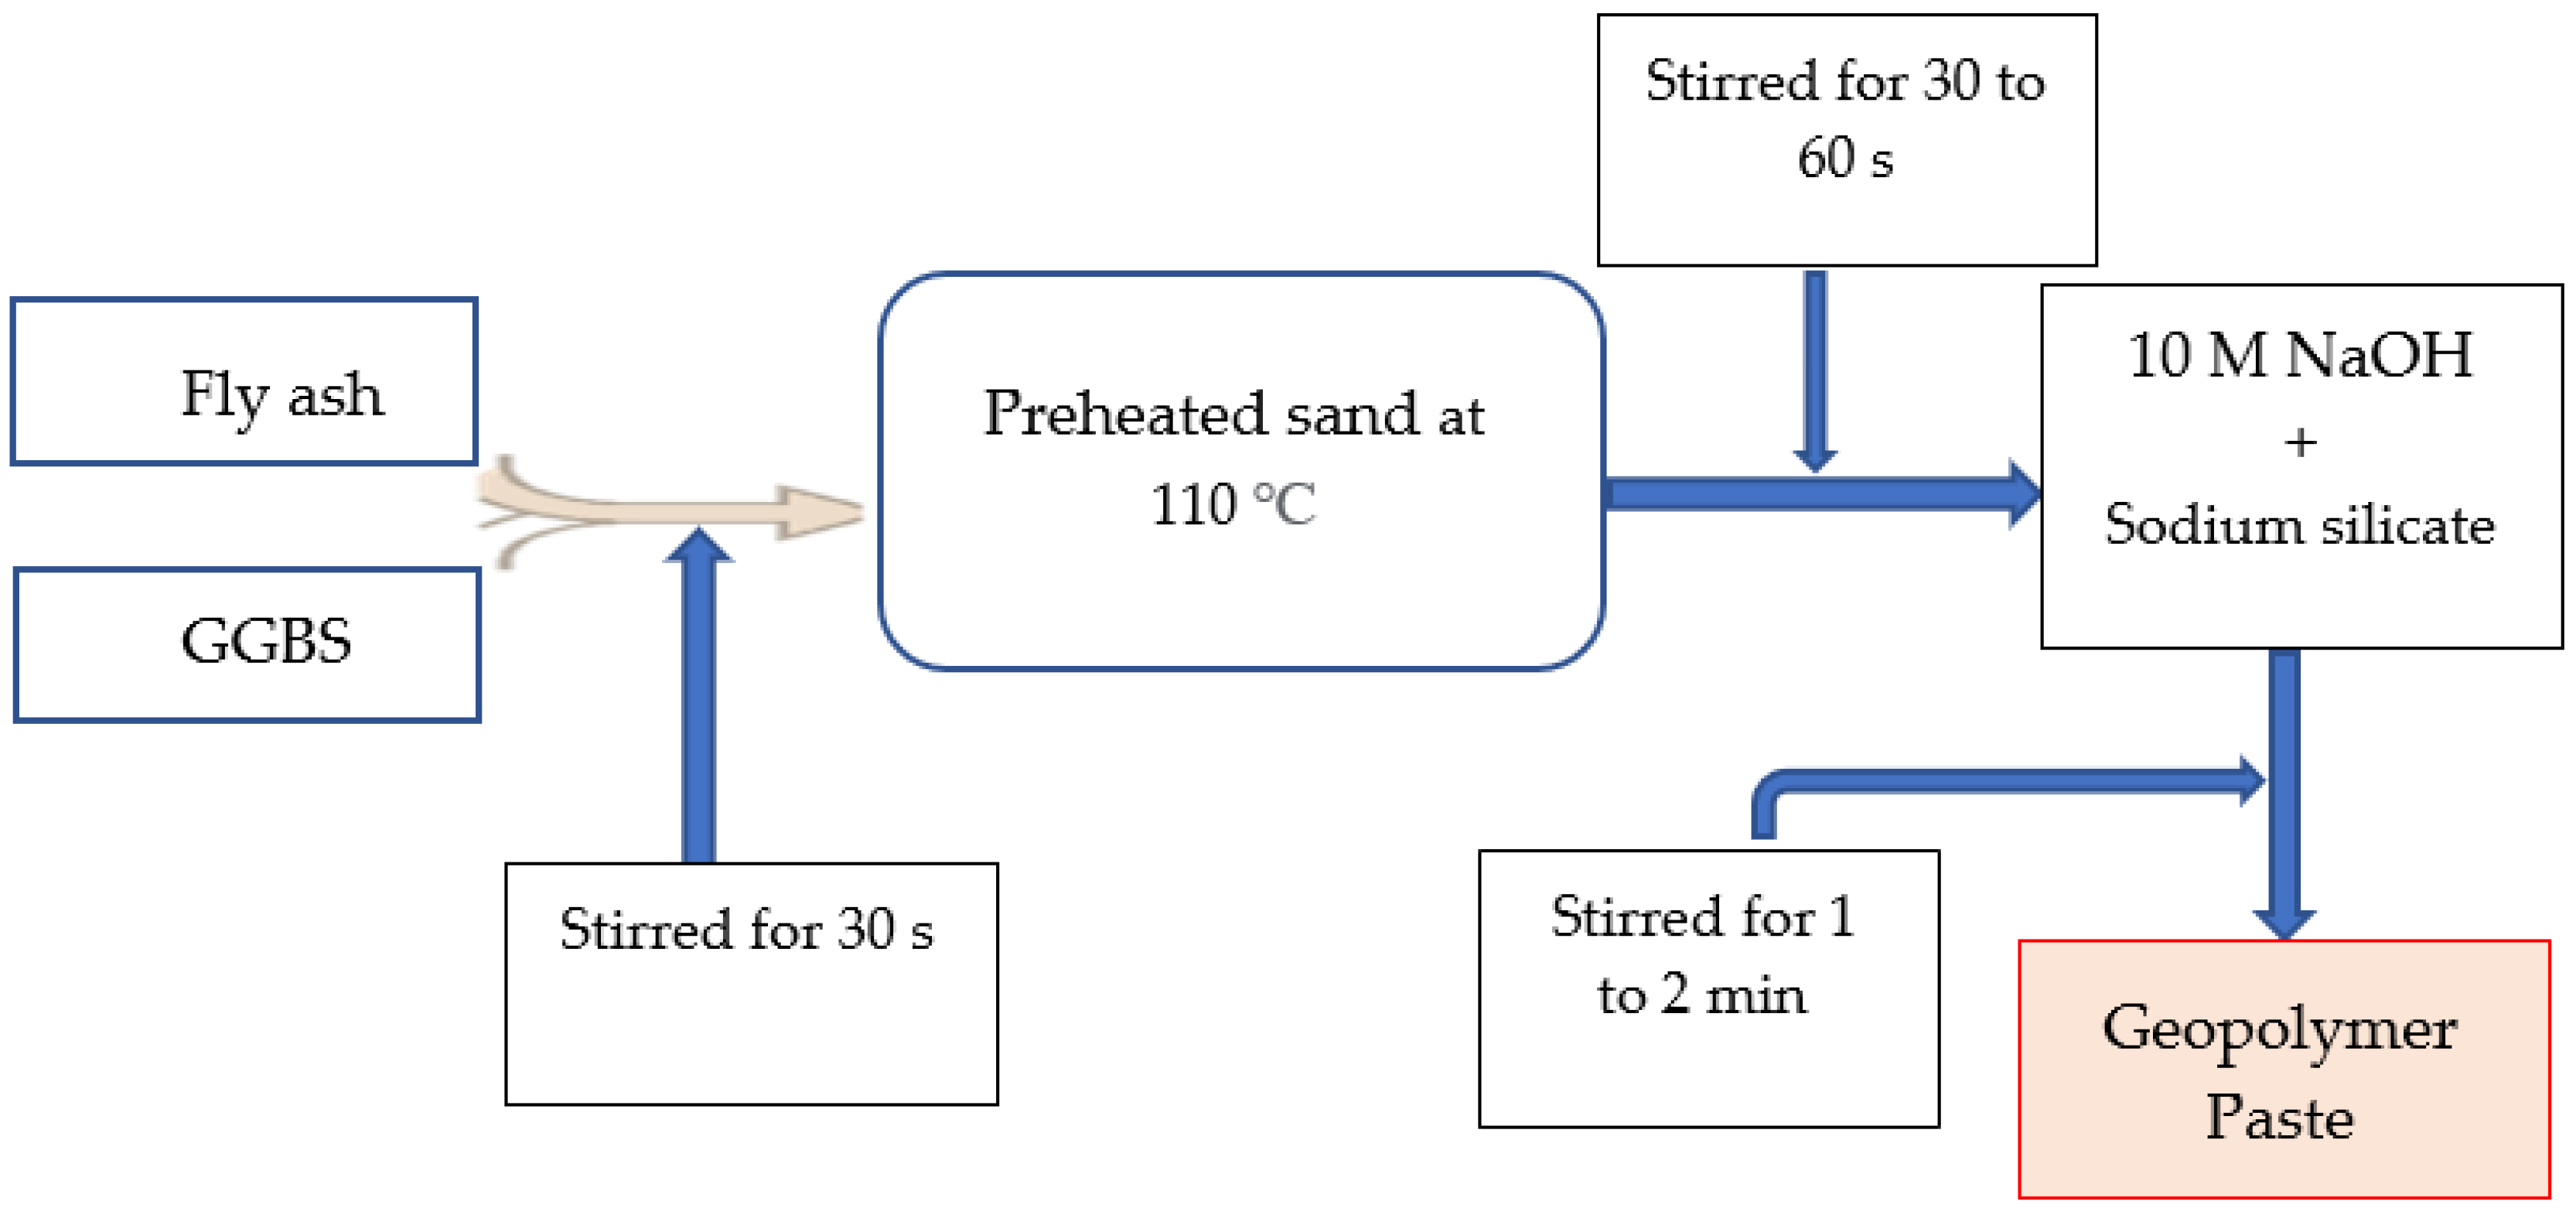
2.2. Casting of Specimen and Curing
2.3. Test Procedure
3. Results and Discussion
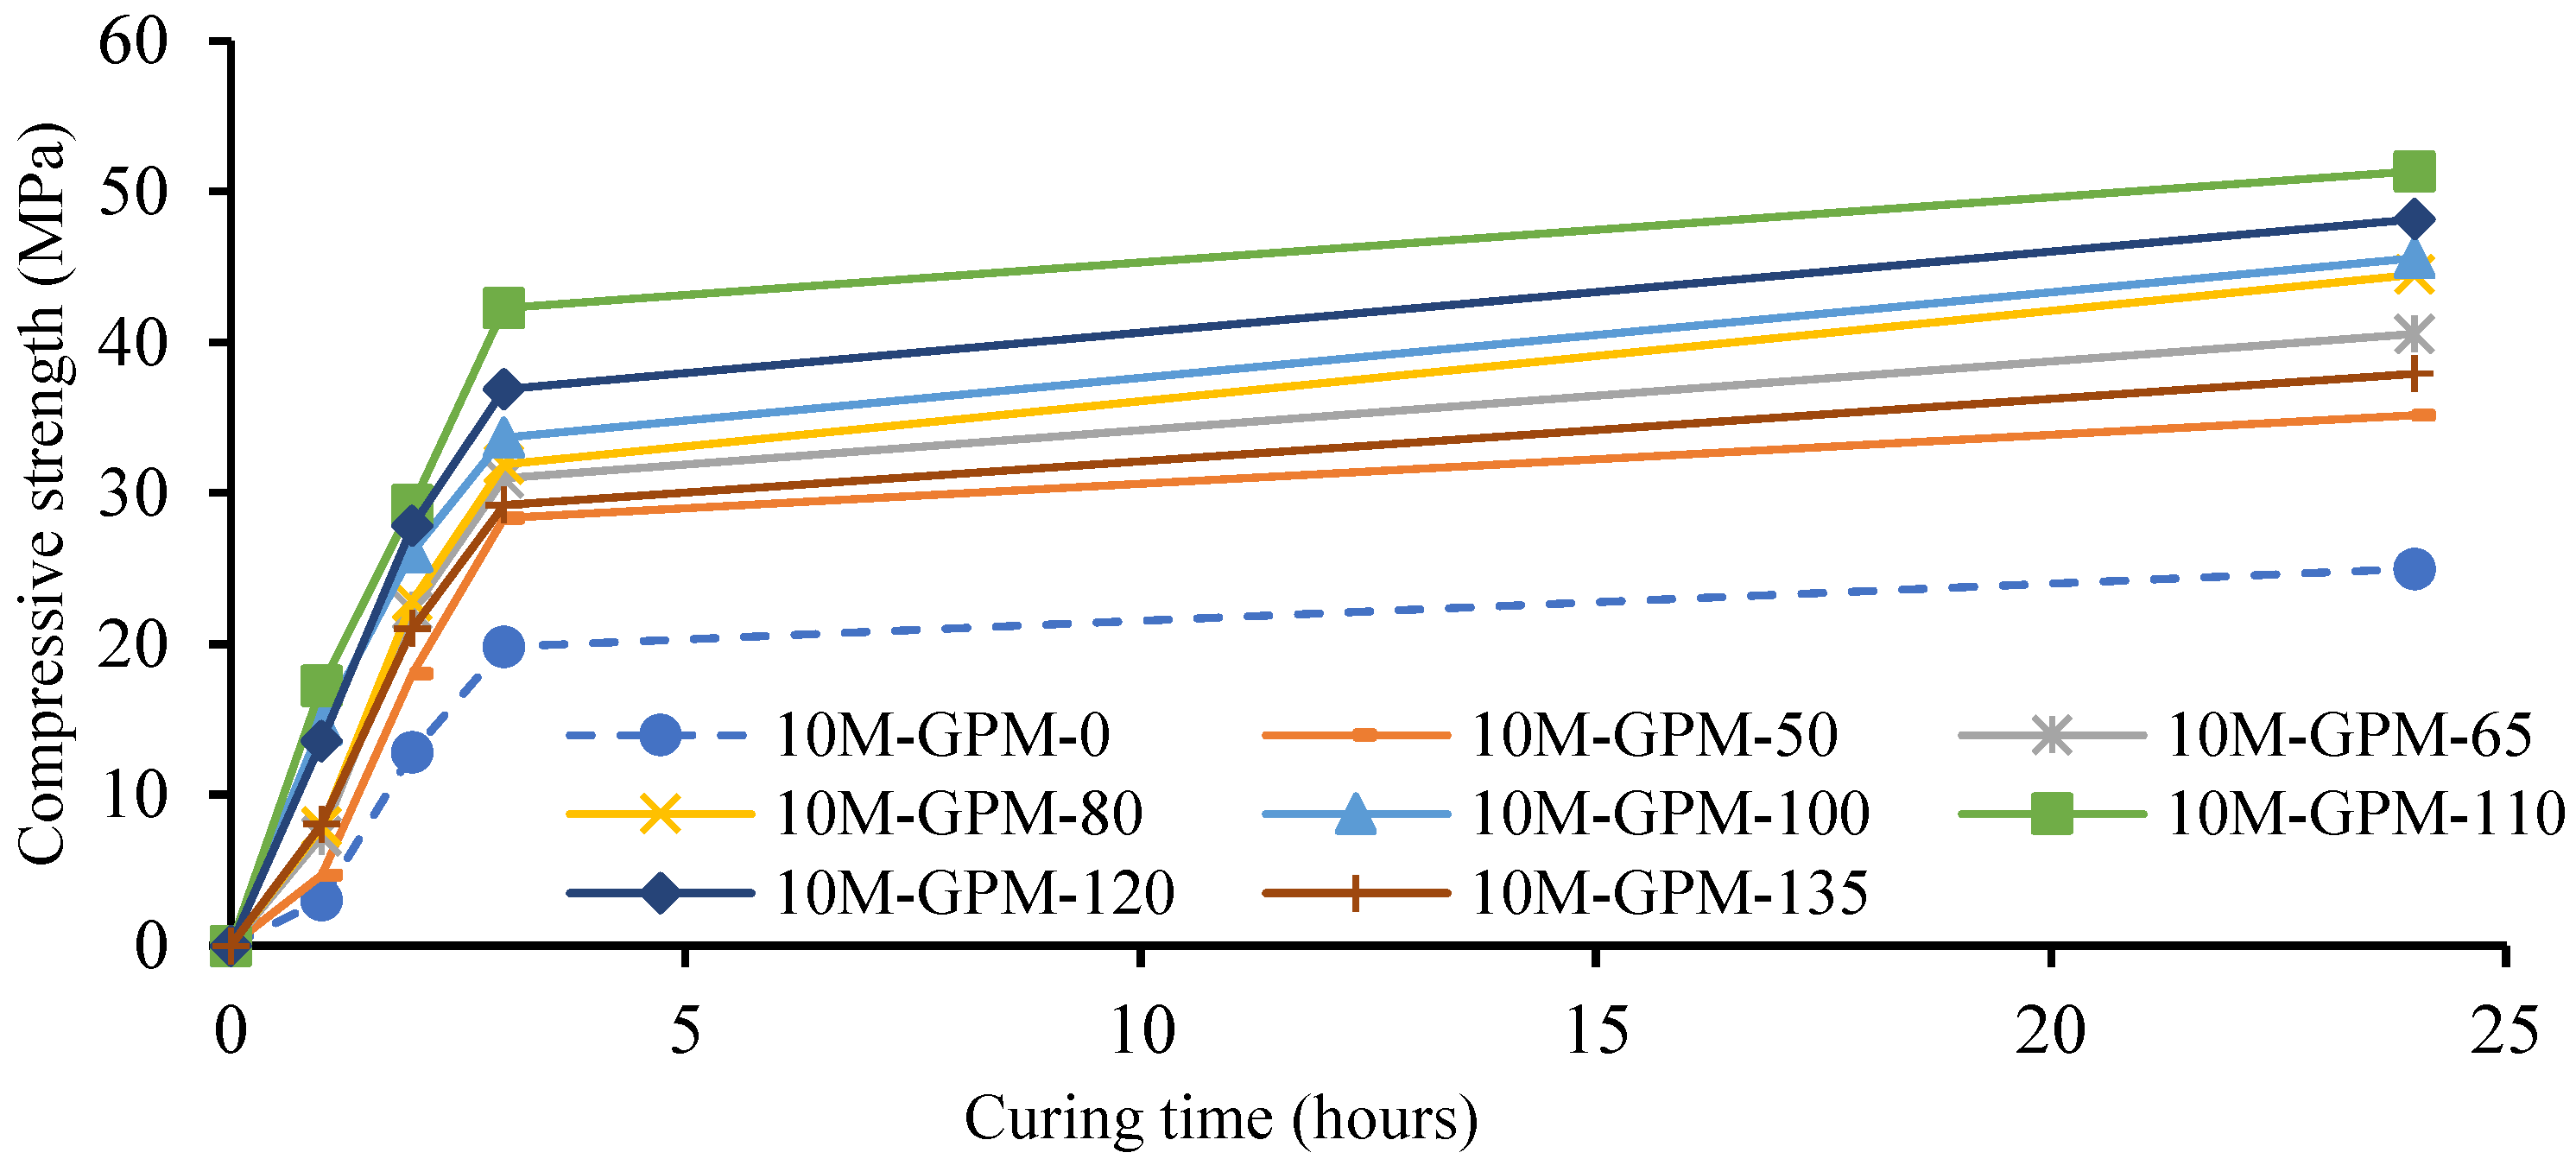
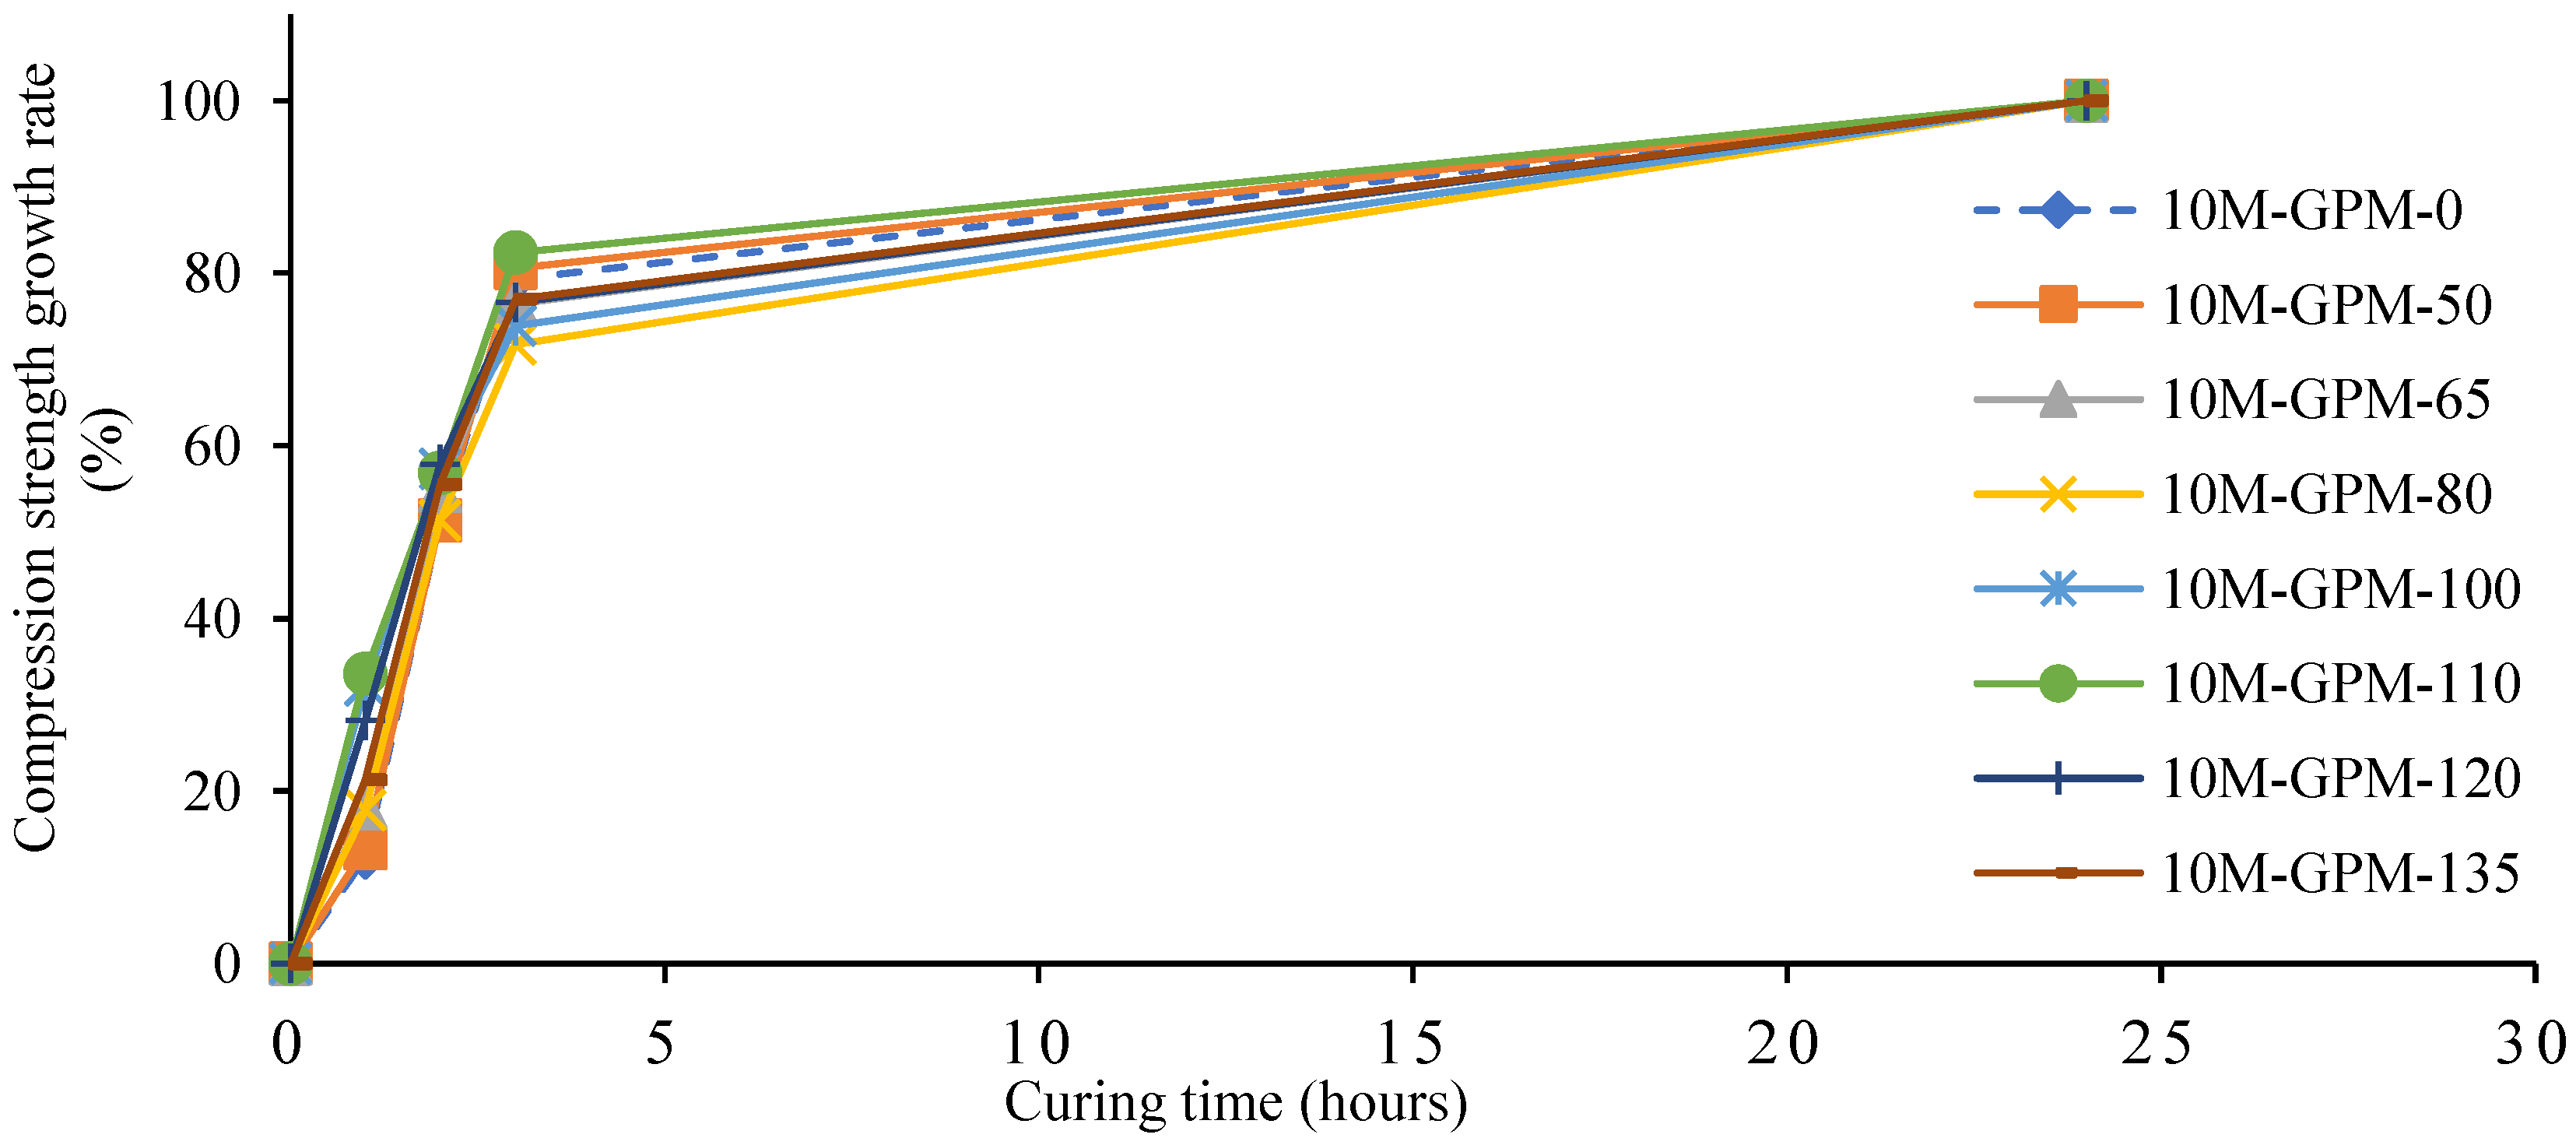
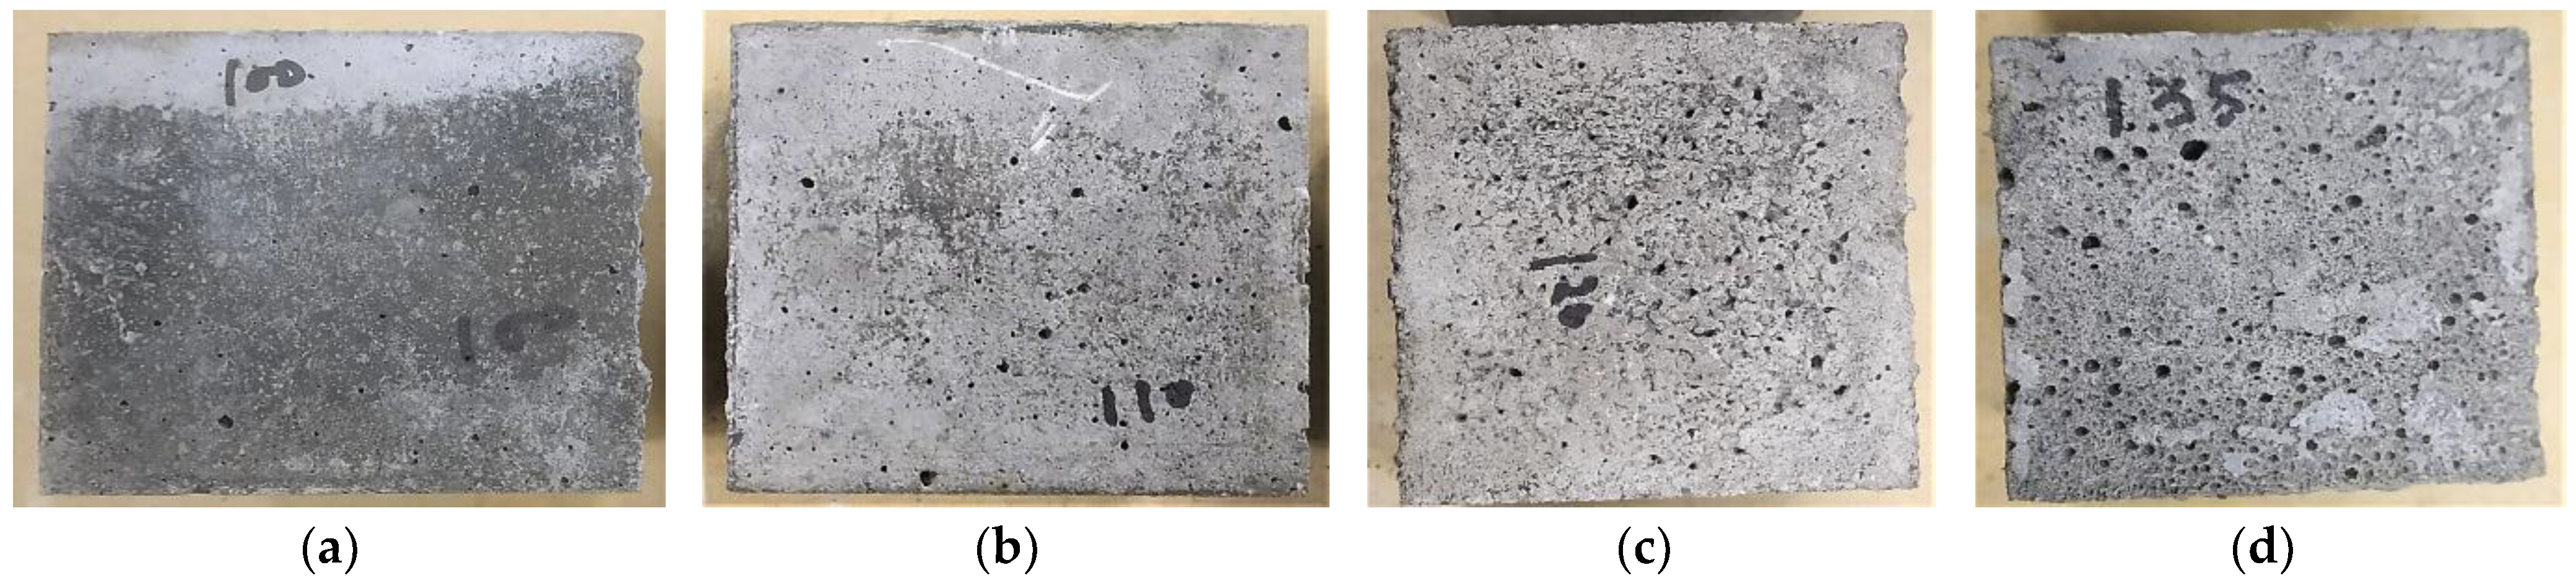
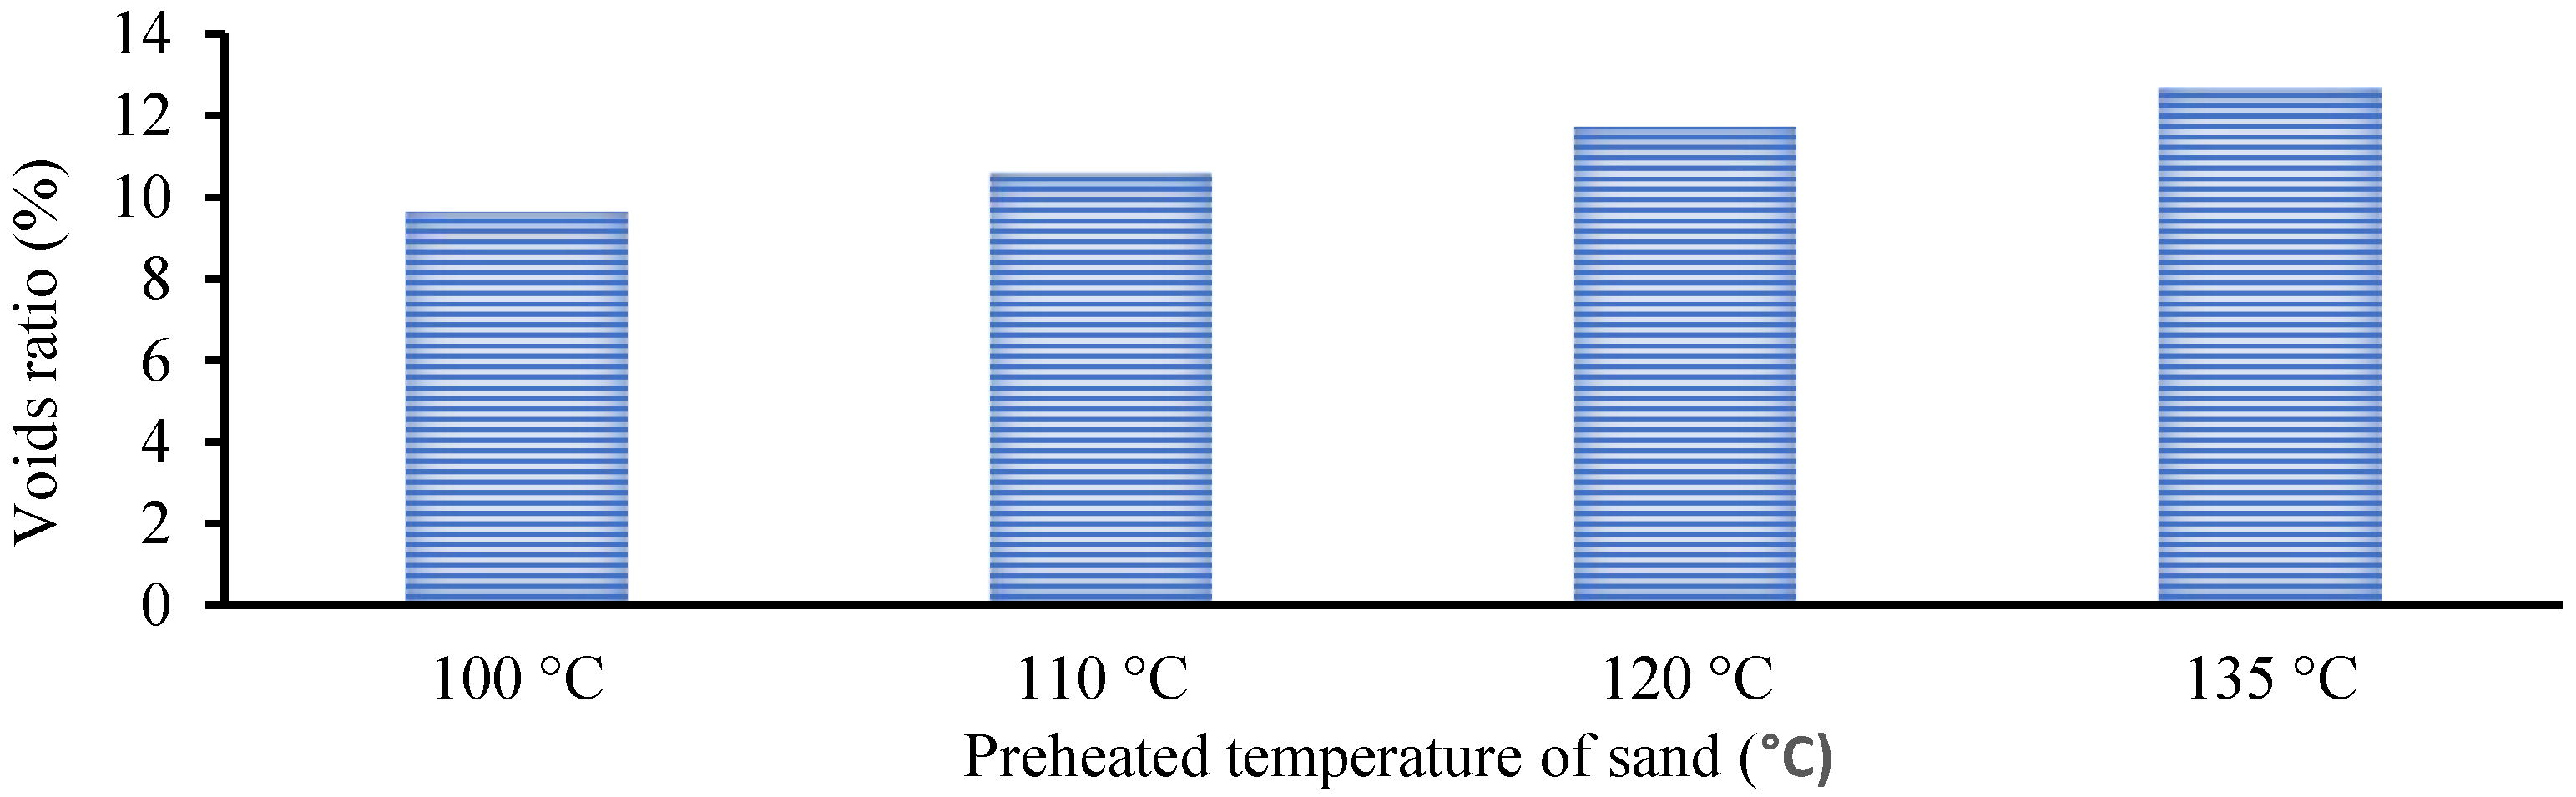
3.1. The Impact of Preheated Sand
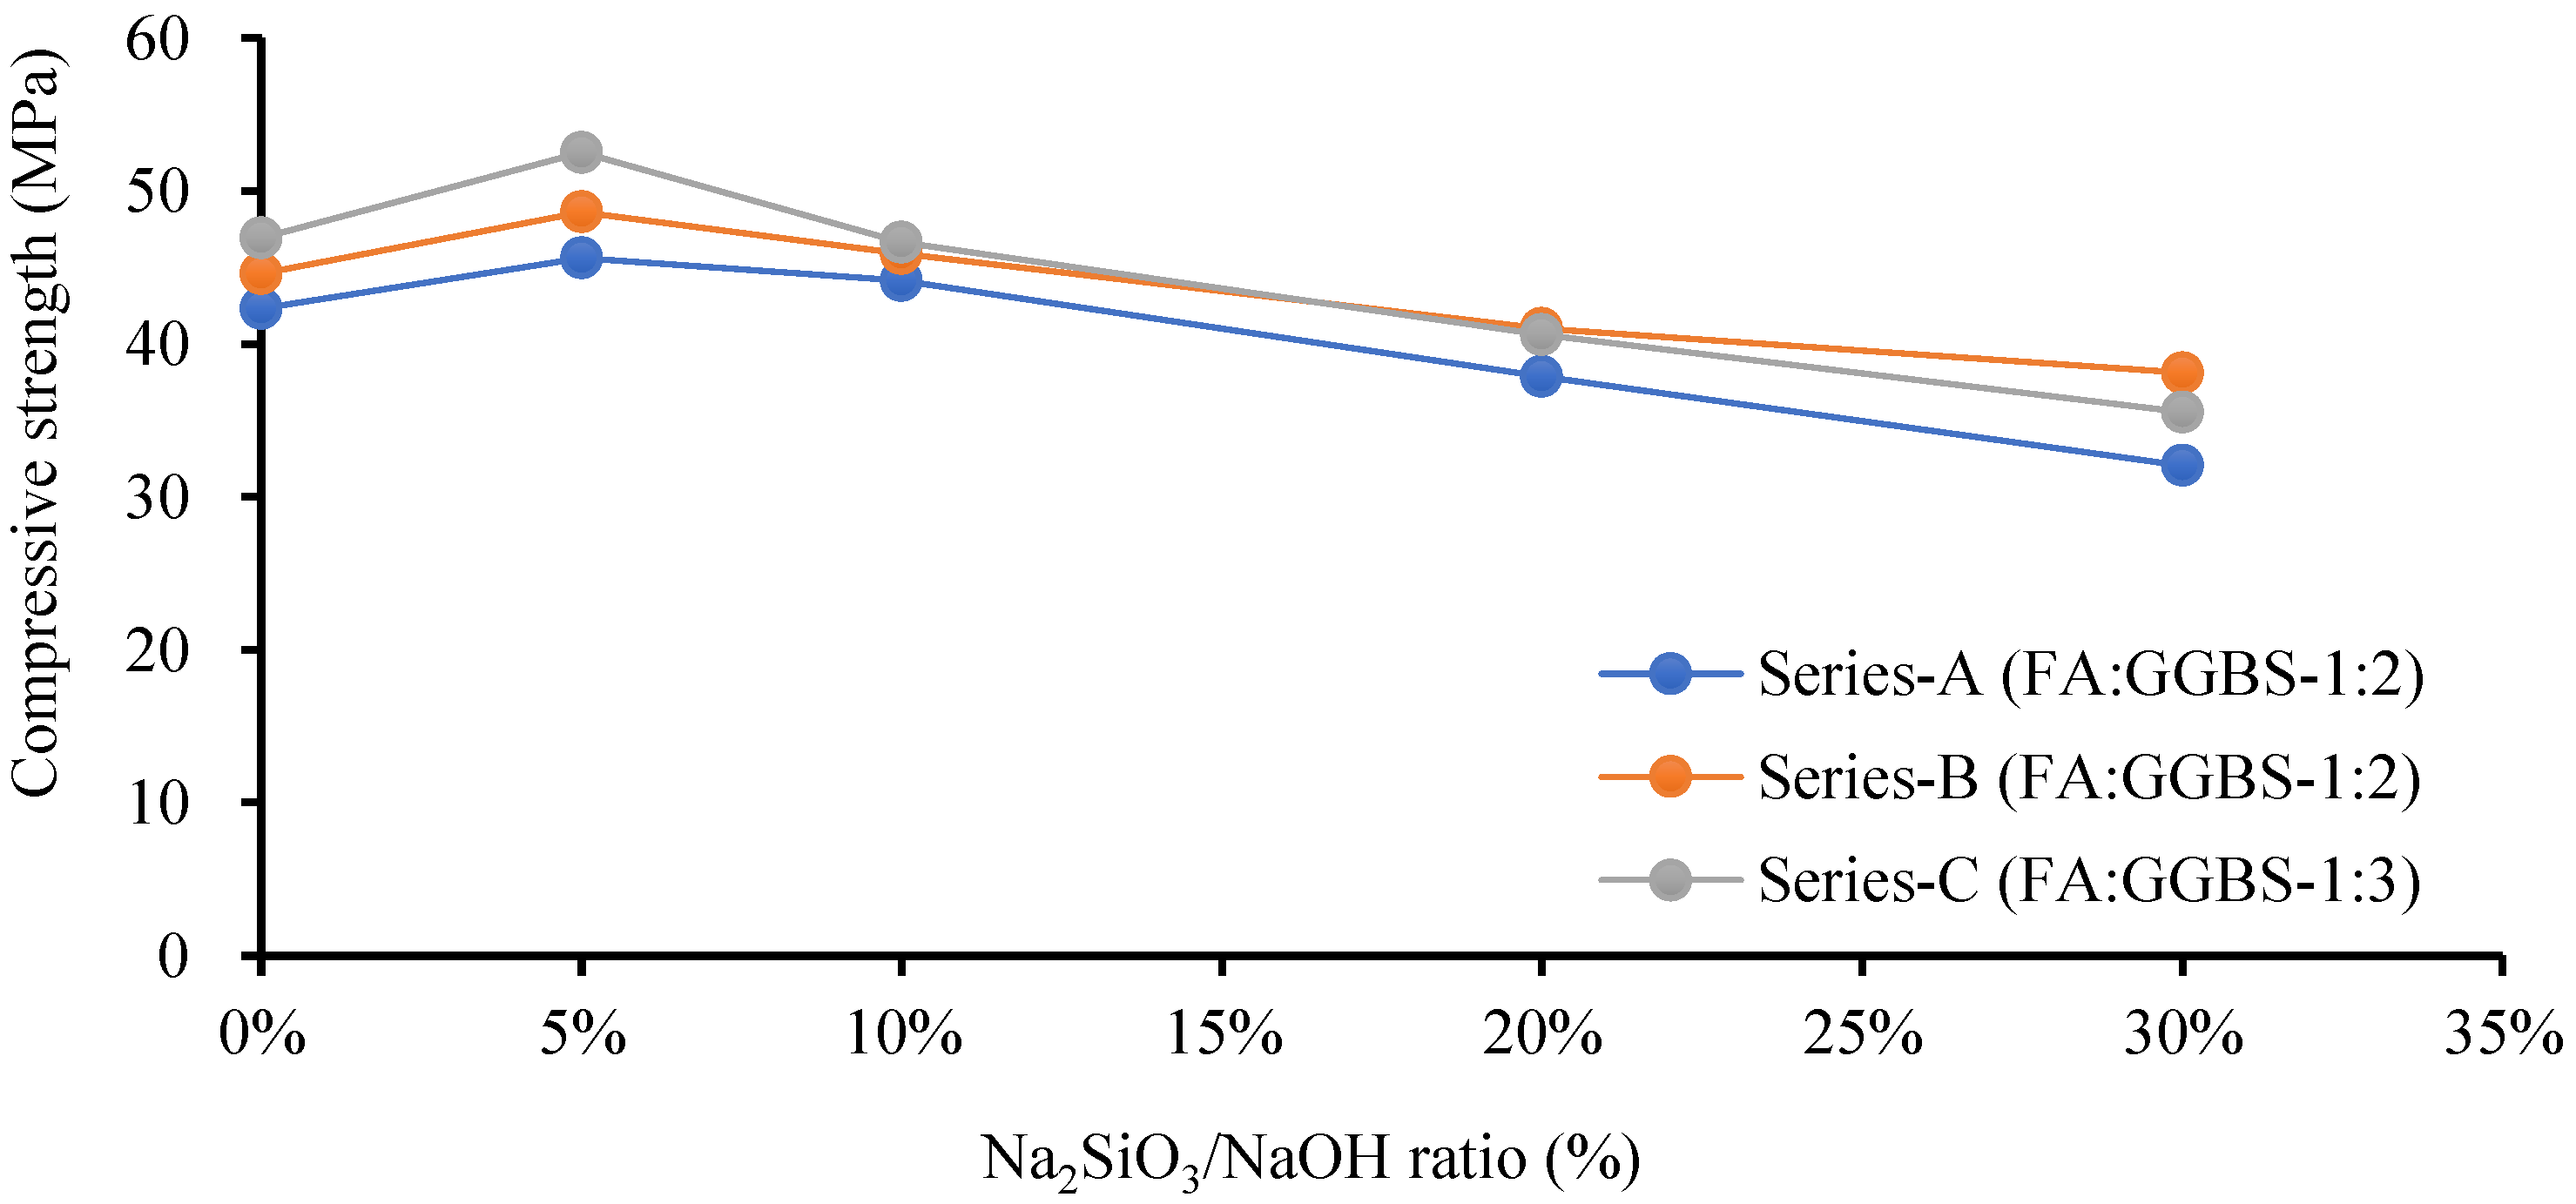
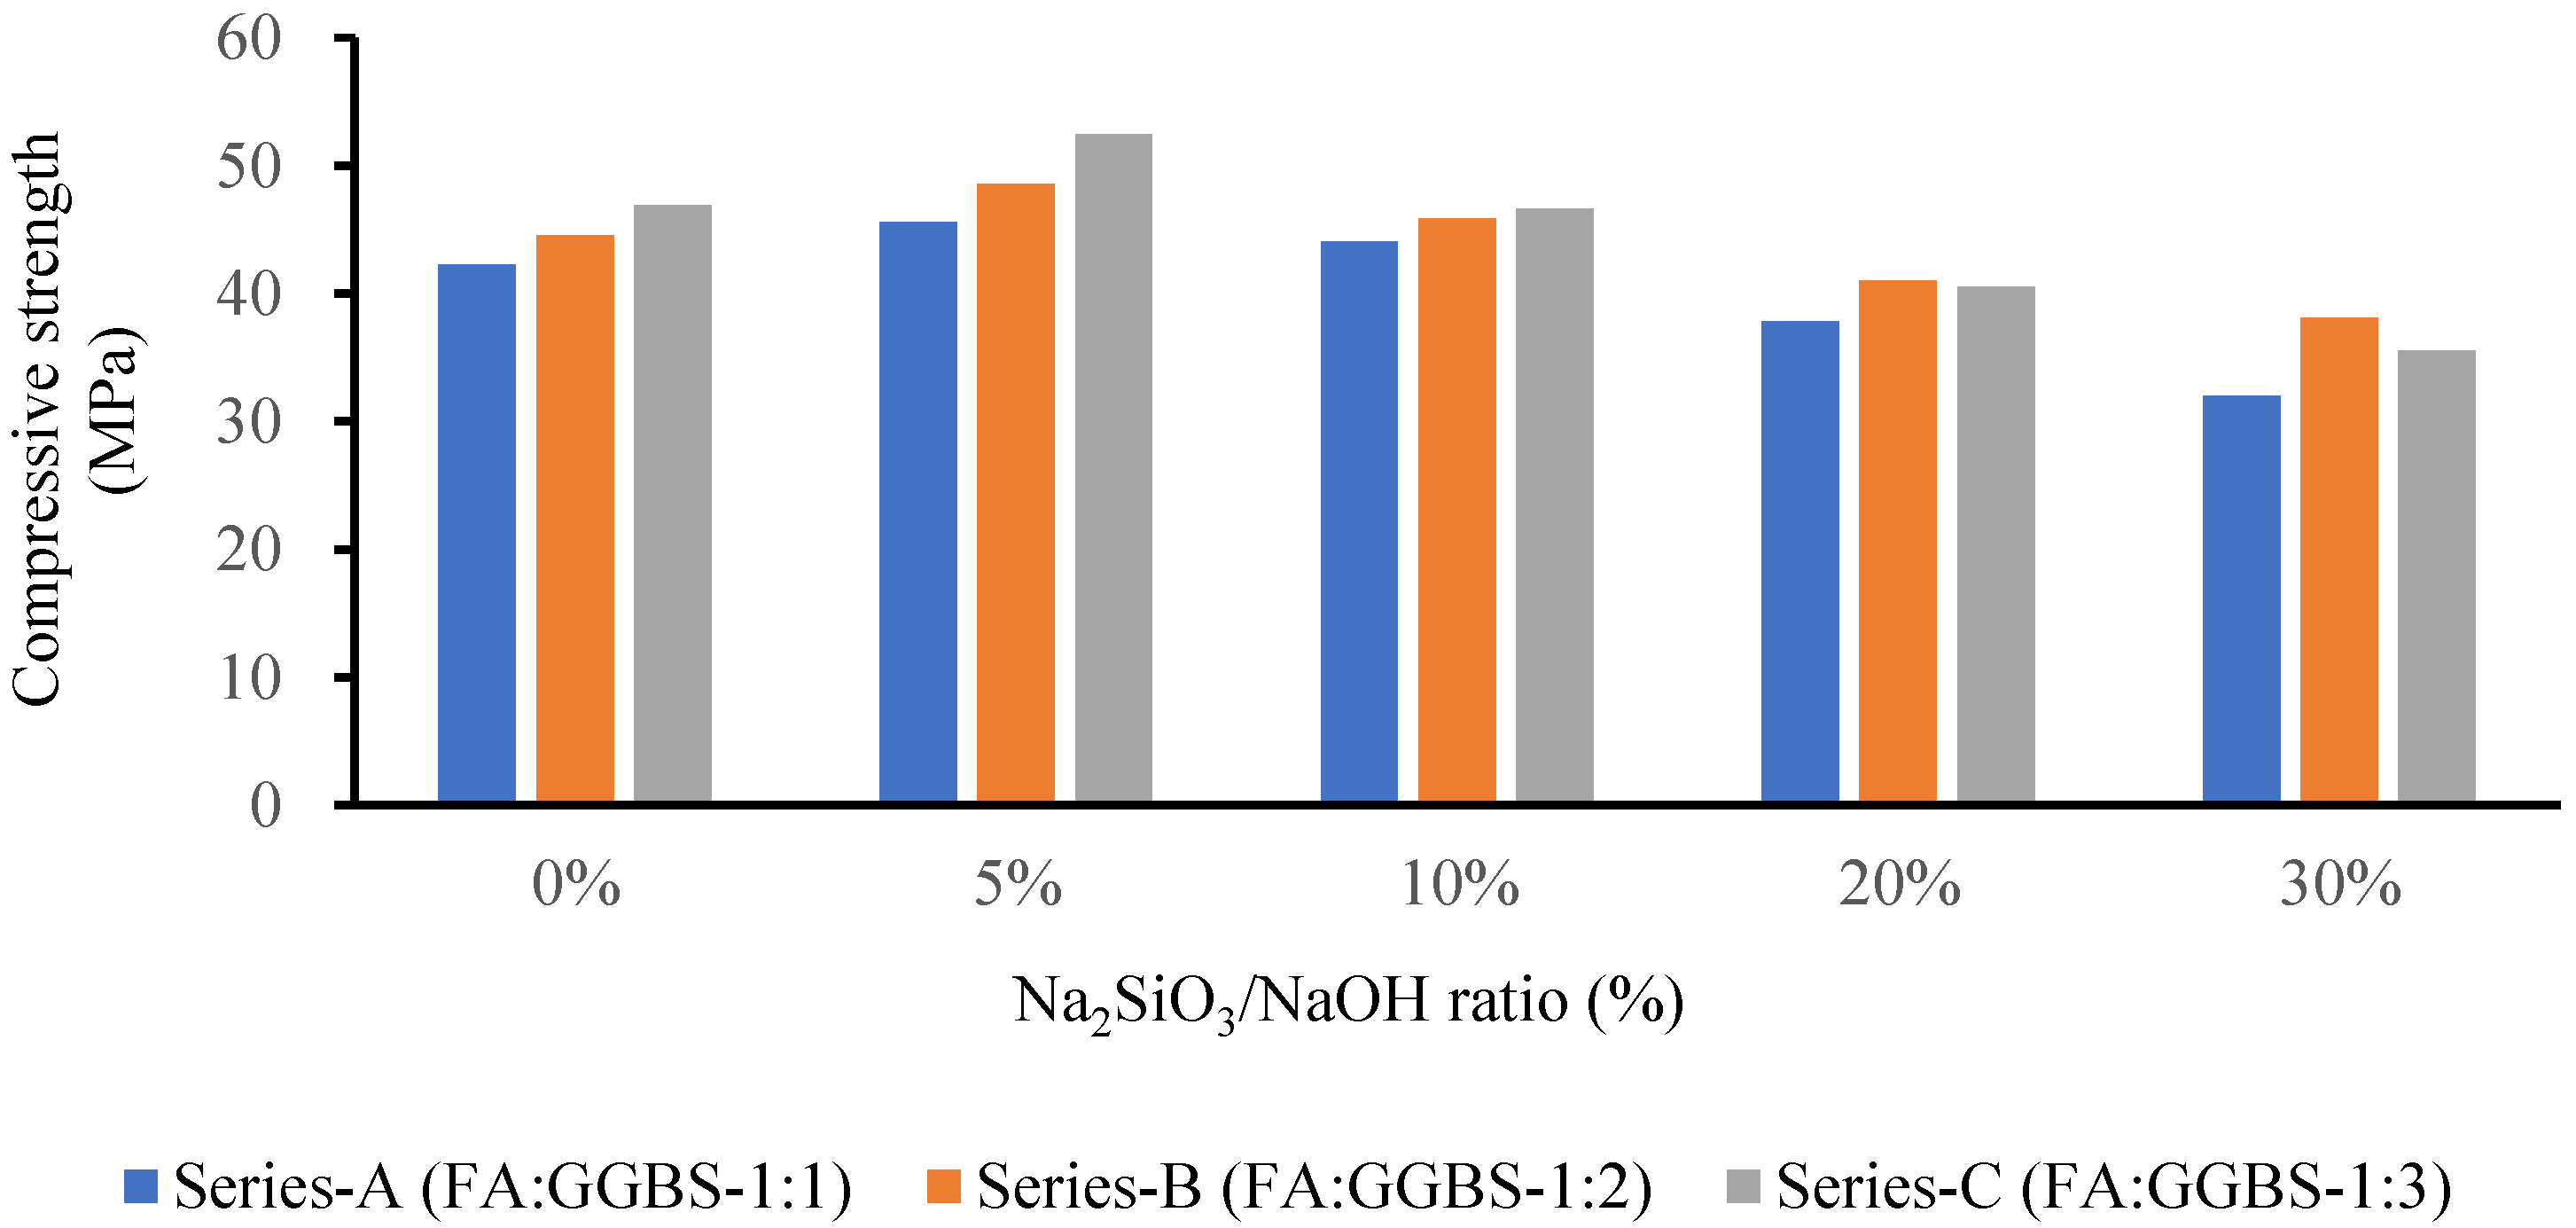
3.2. Impact of the SS-to-SH (%) Ratio on the Mechanical Strength of the GPM with Sand Preheated at 110 °C
3.3. Effect of the Molar Ratio (SiO2/Al2O3)
3.4. Microstructure Study of the Phase 2 GPM
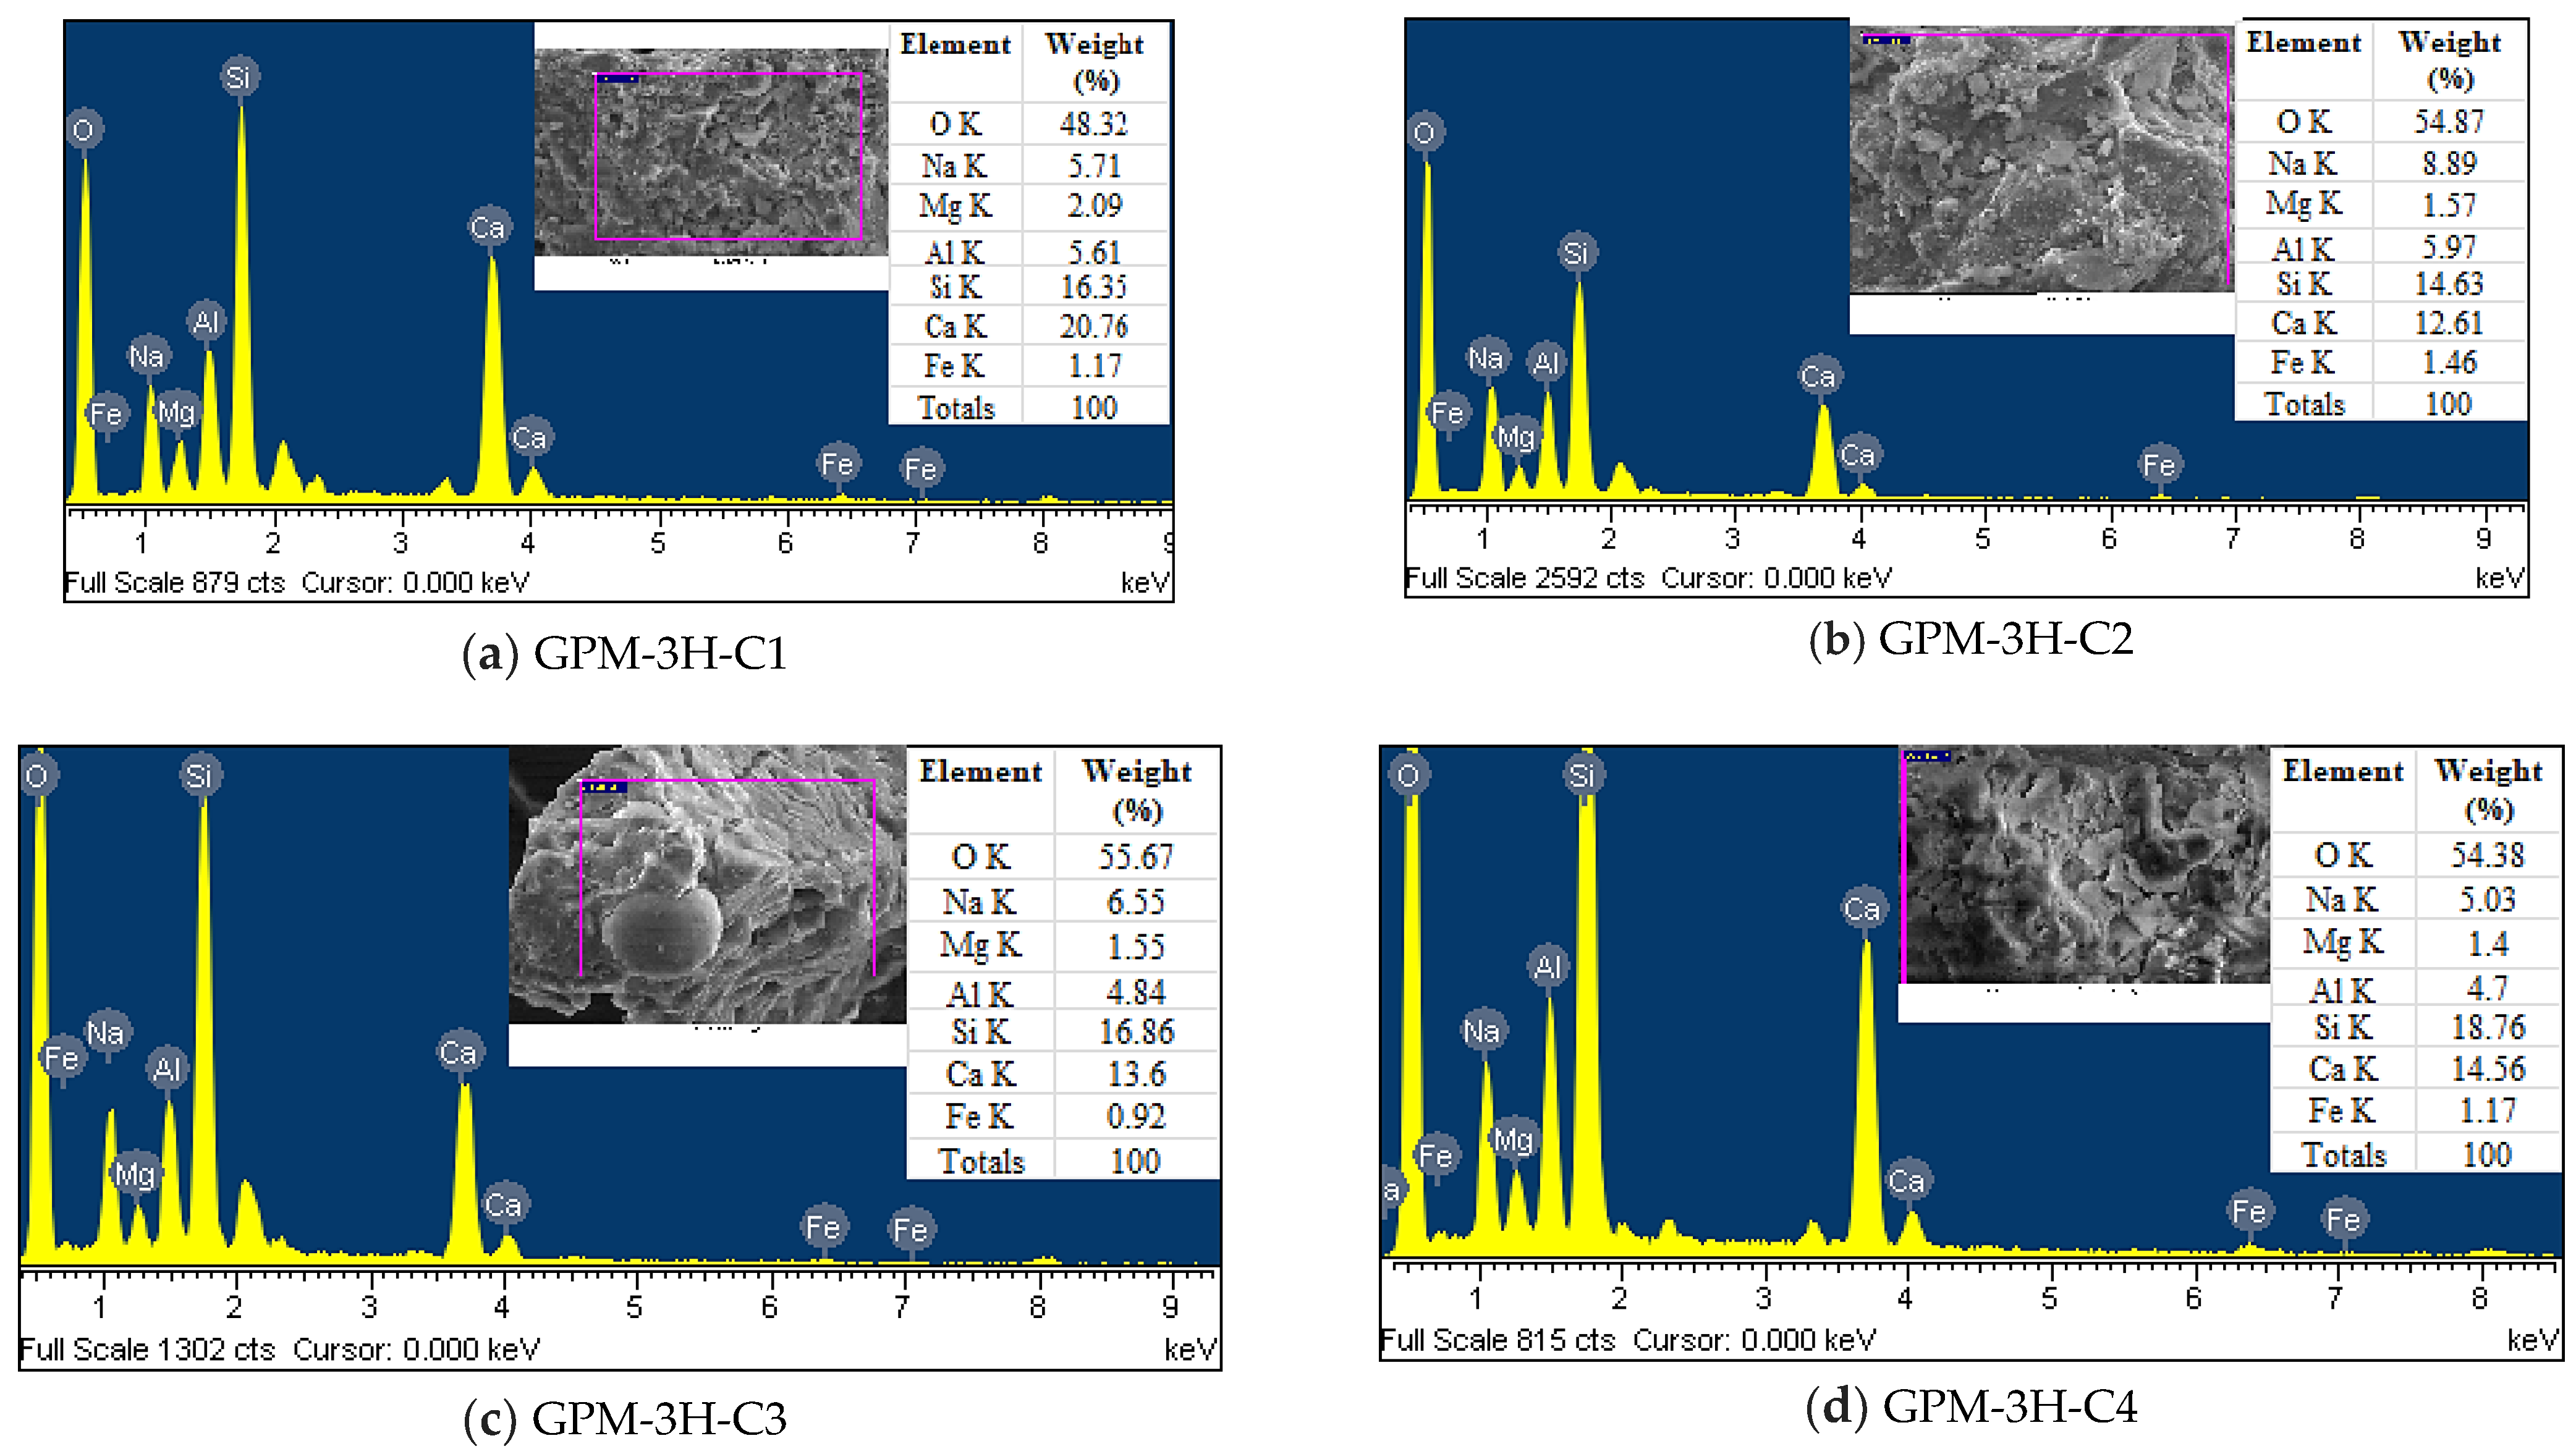
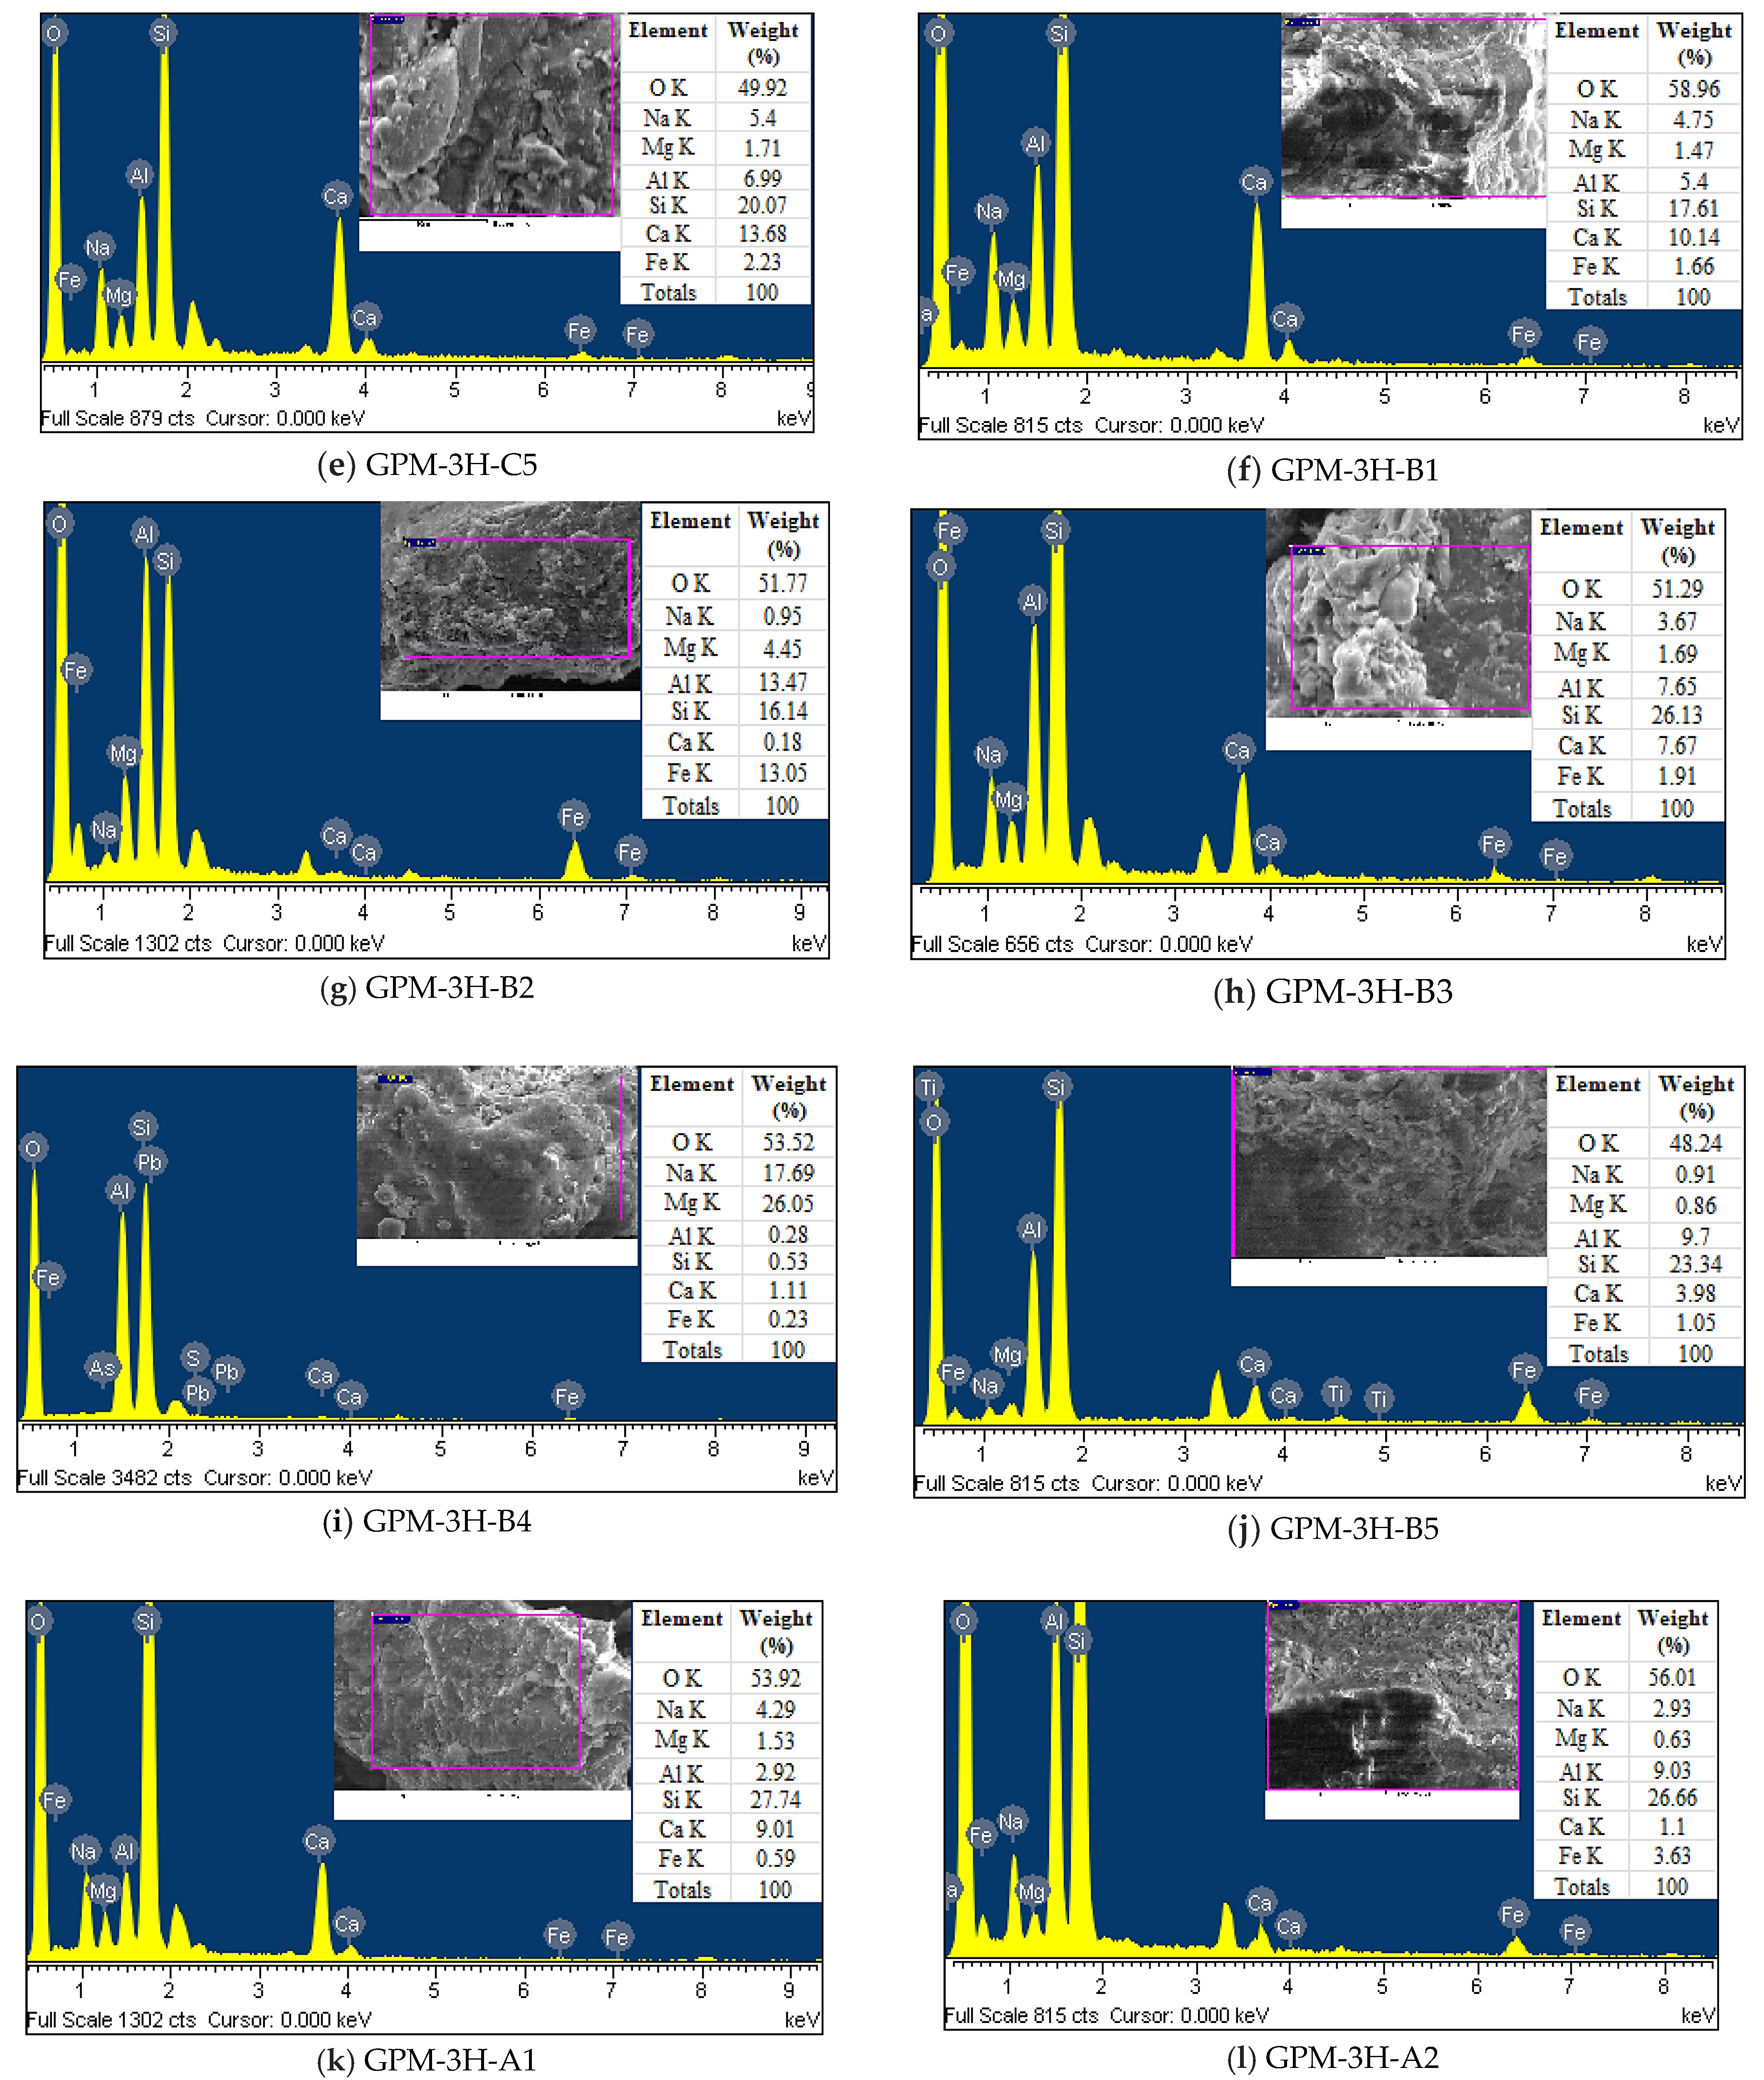
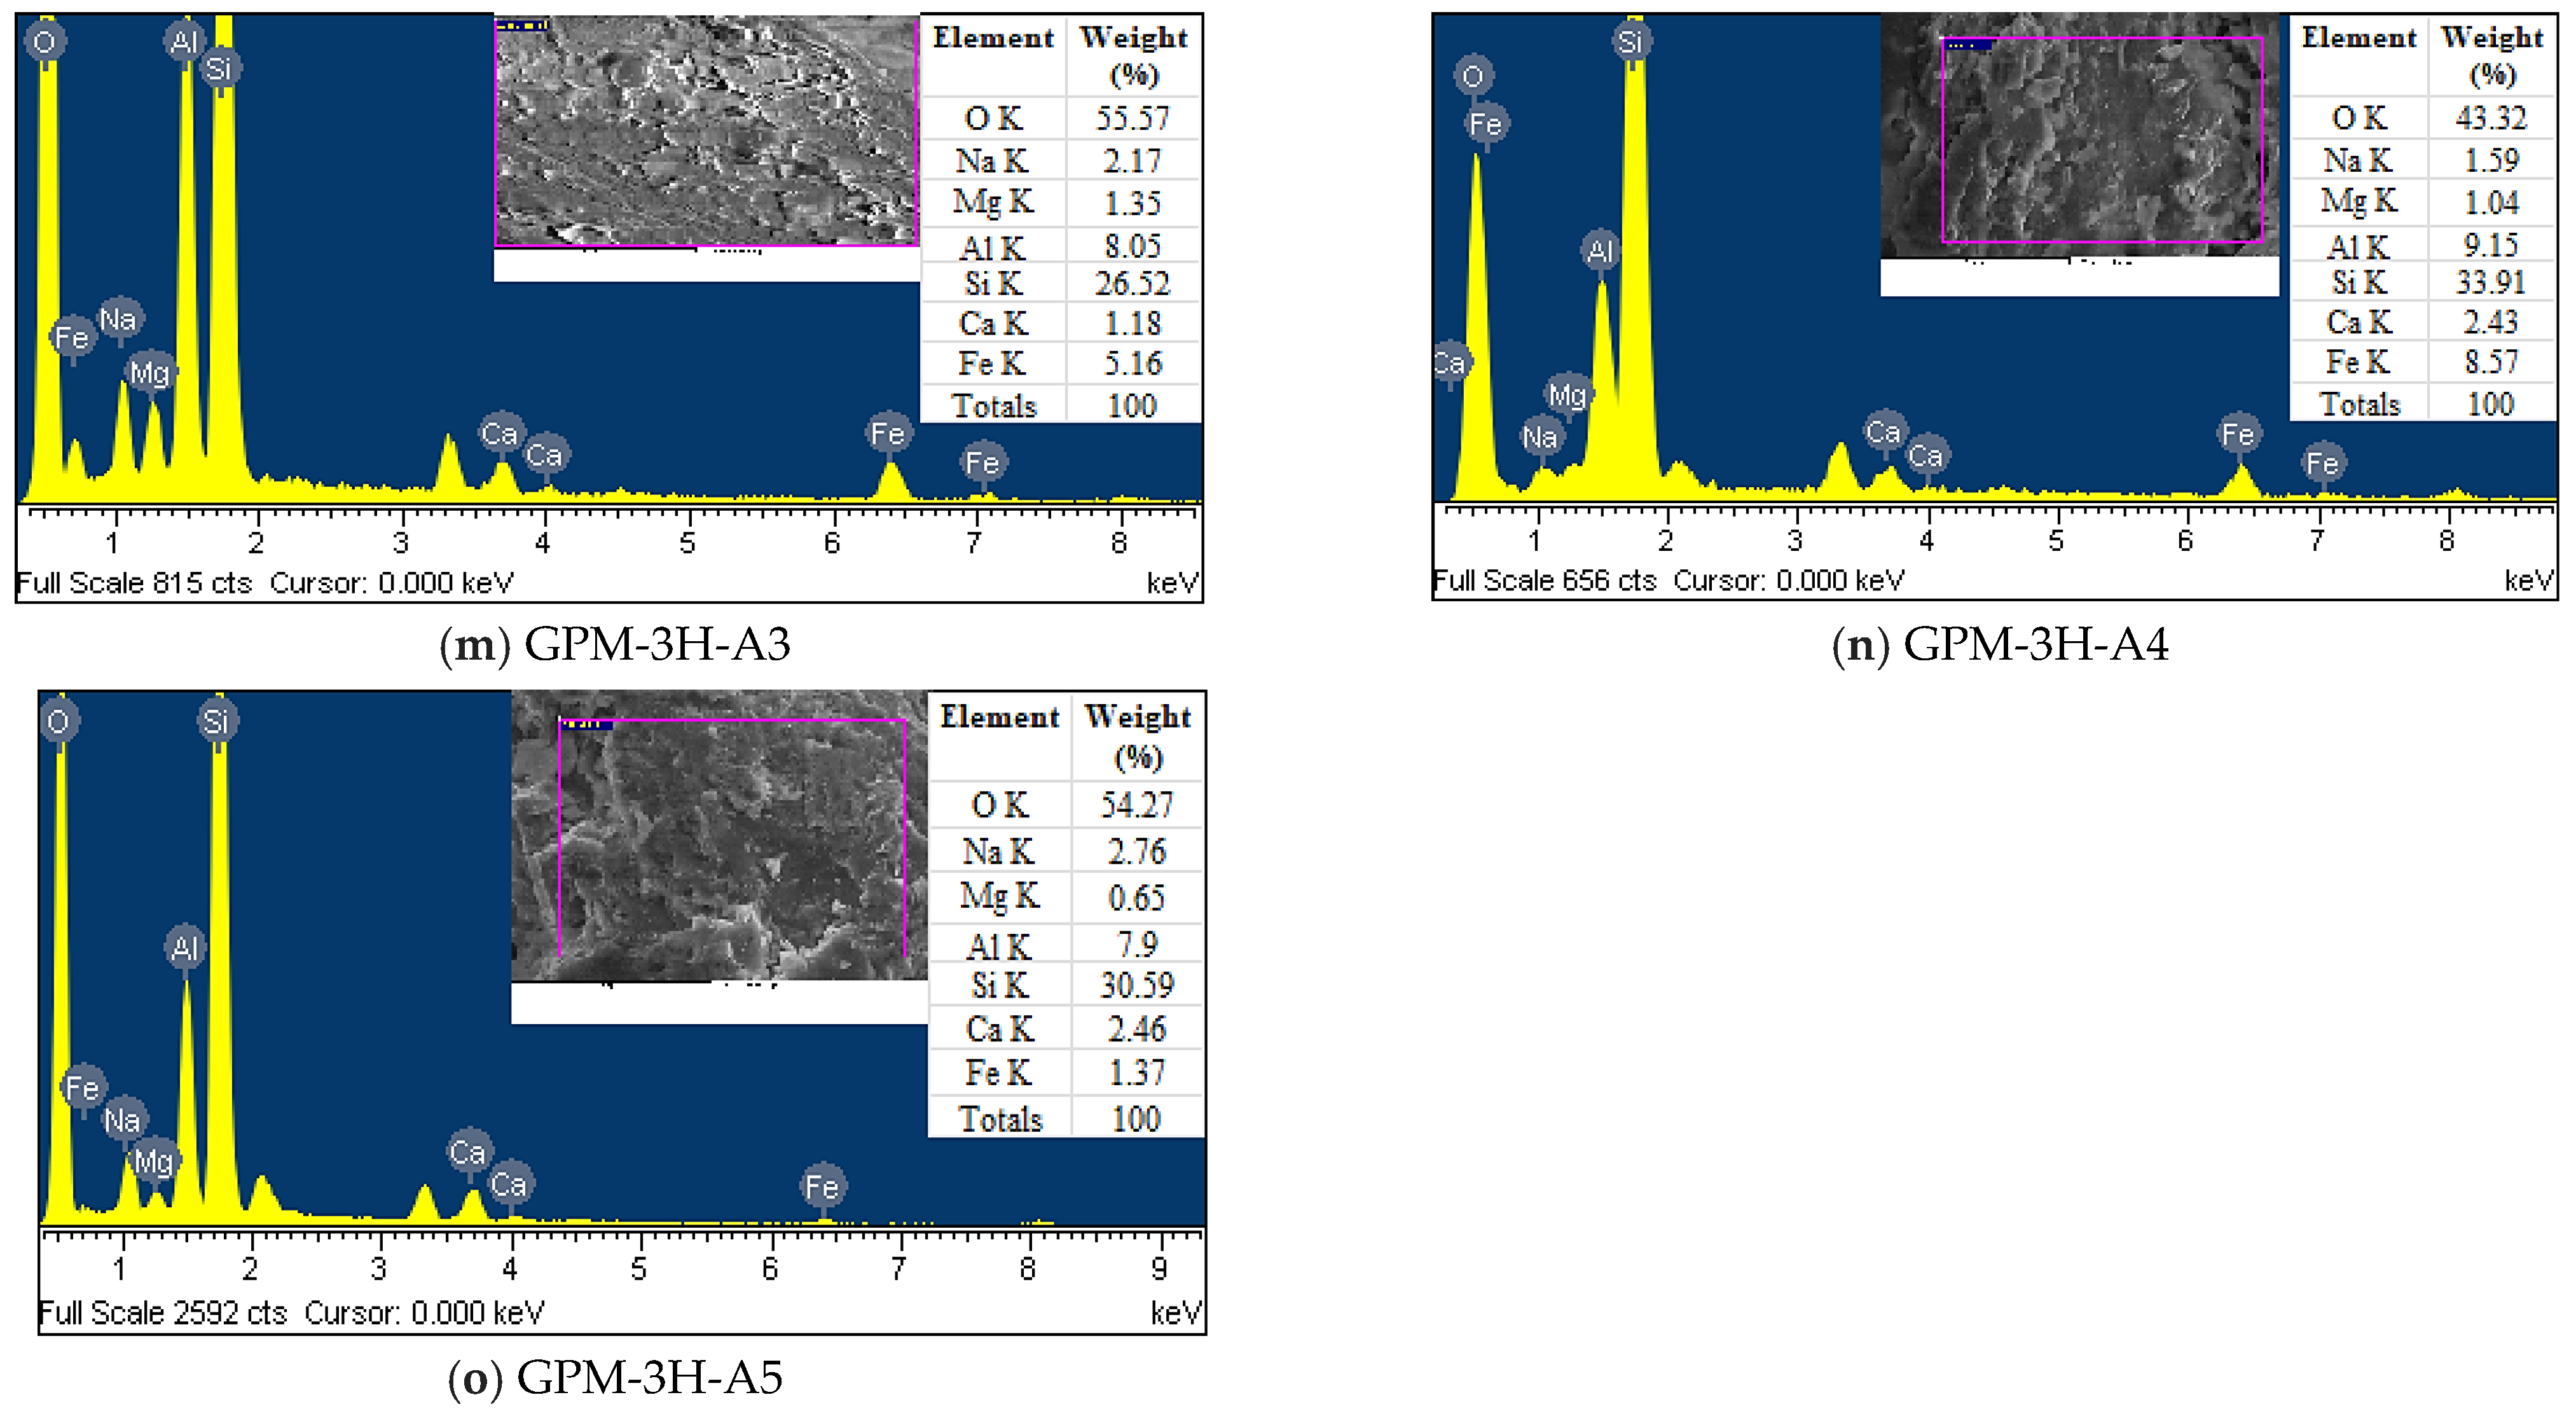
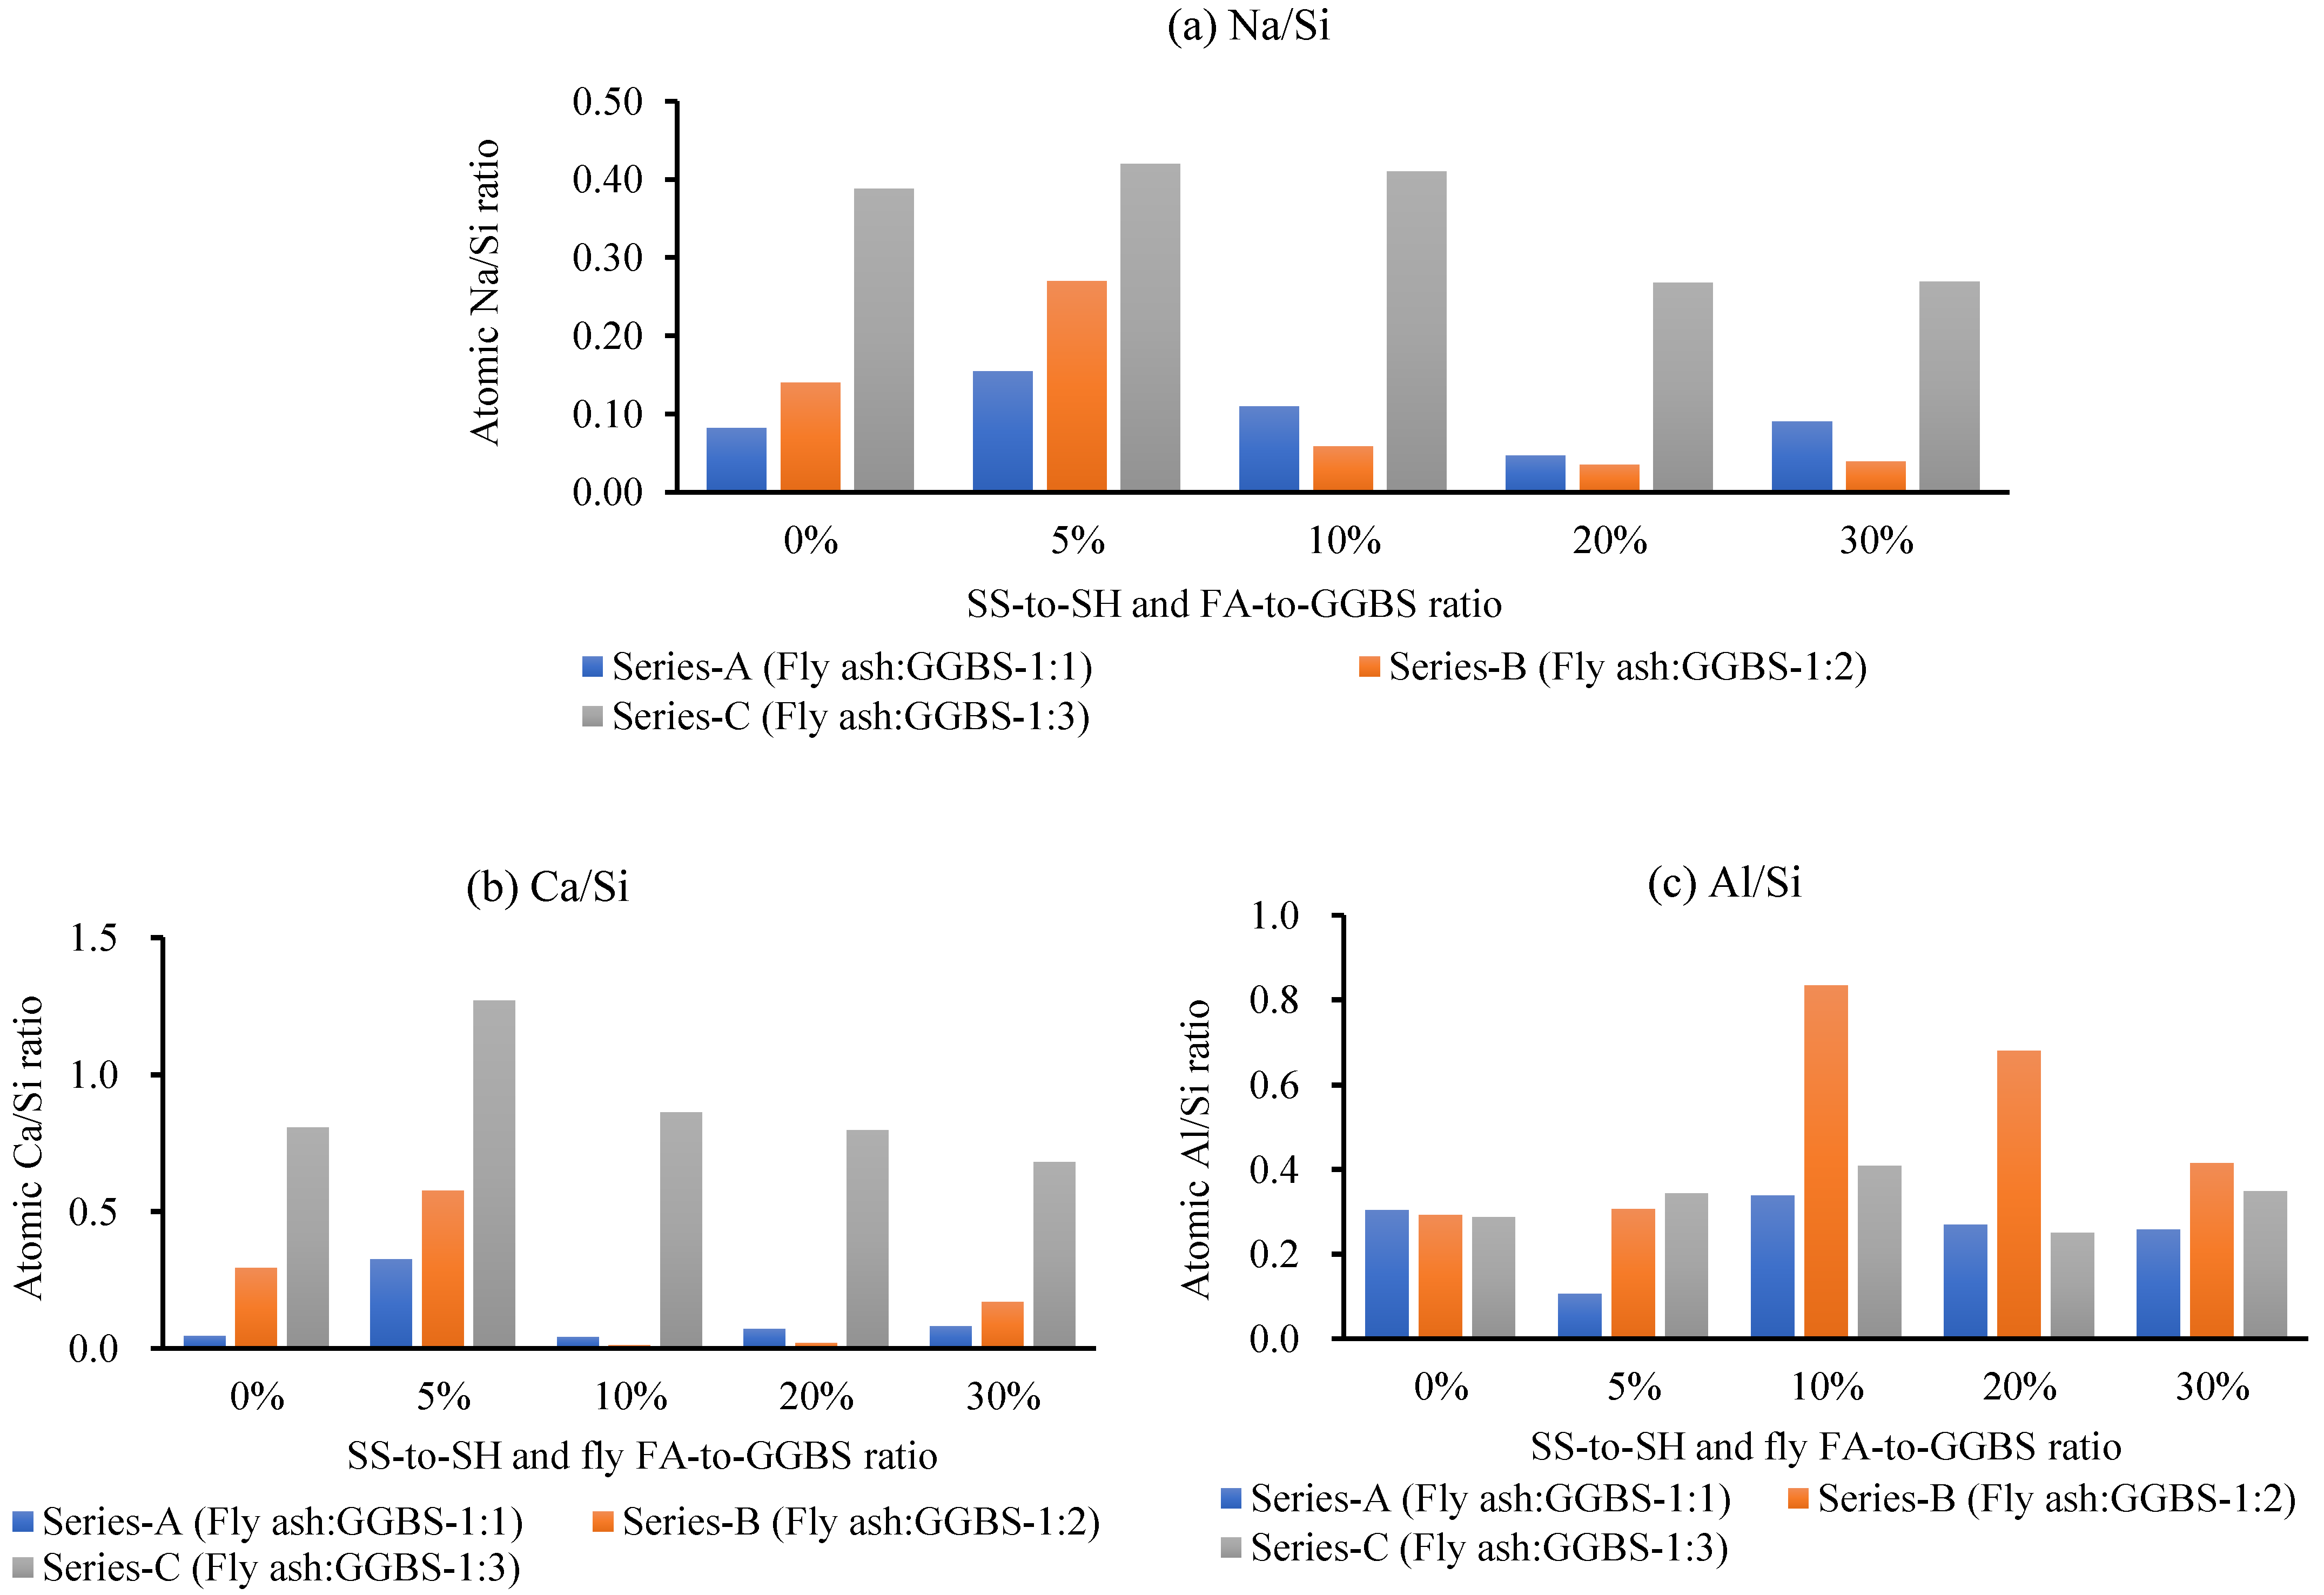
3.4.1. EDS Analysis
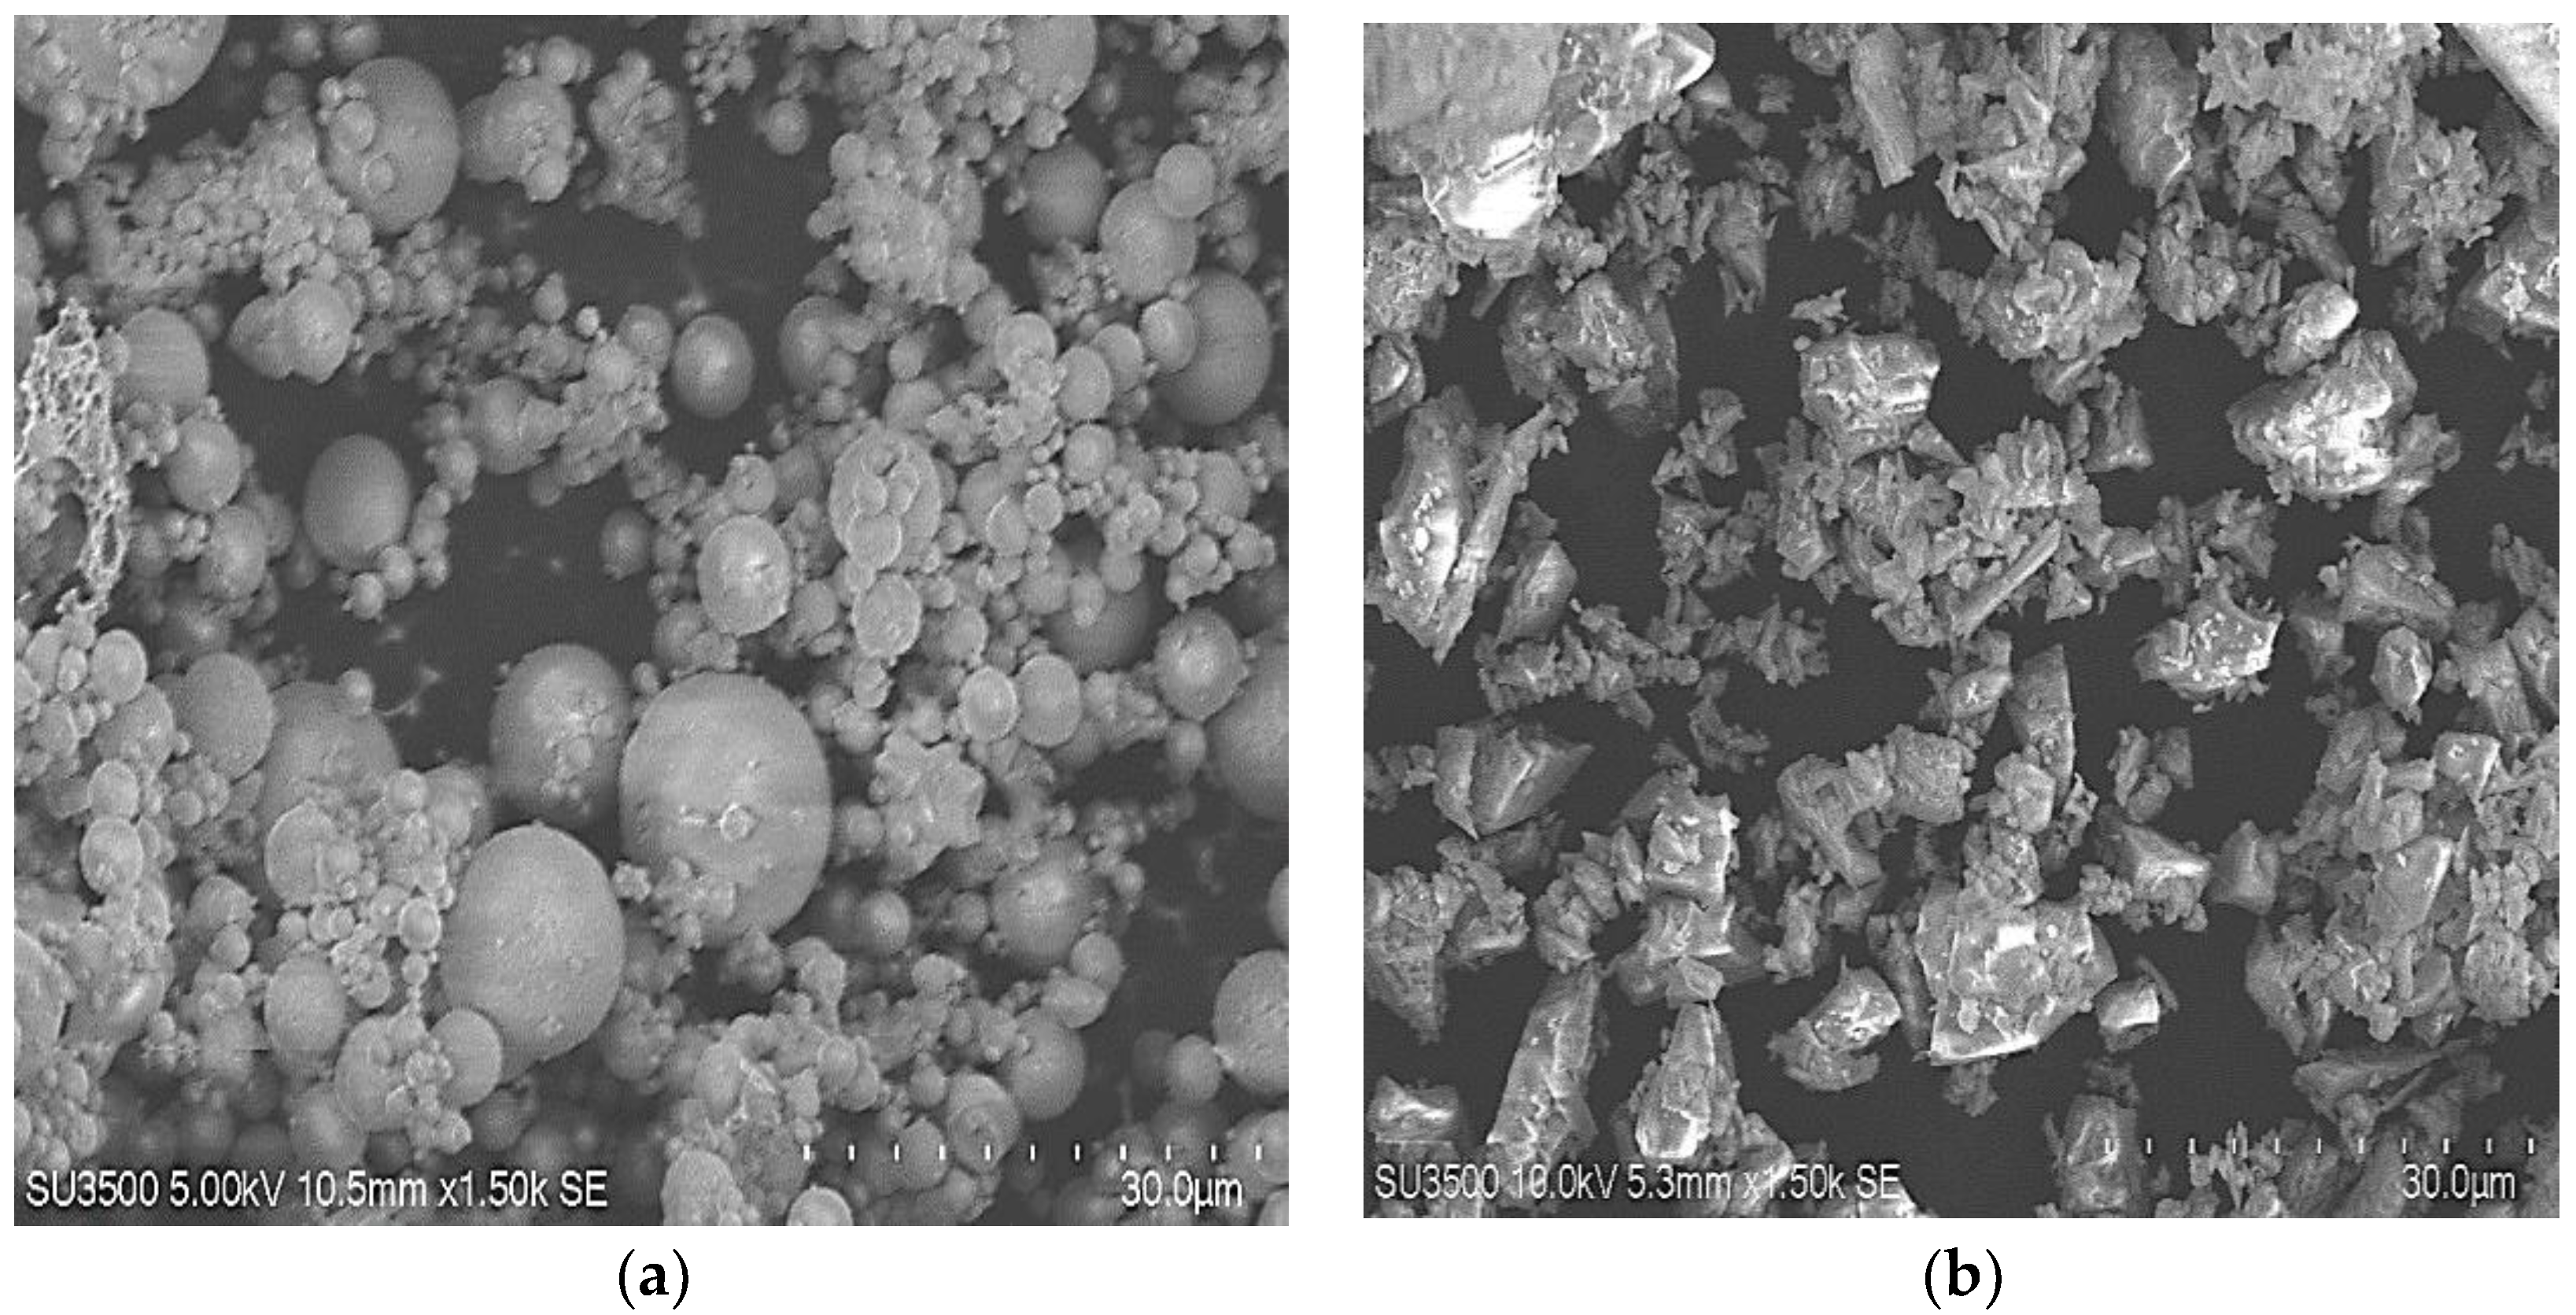
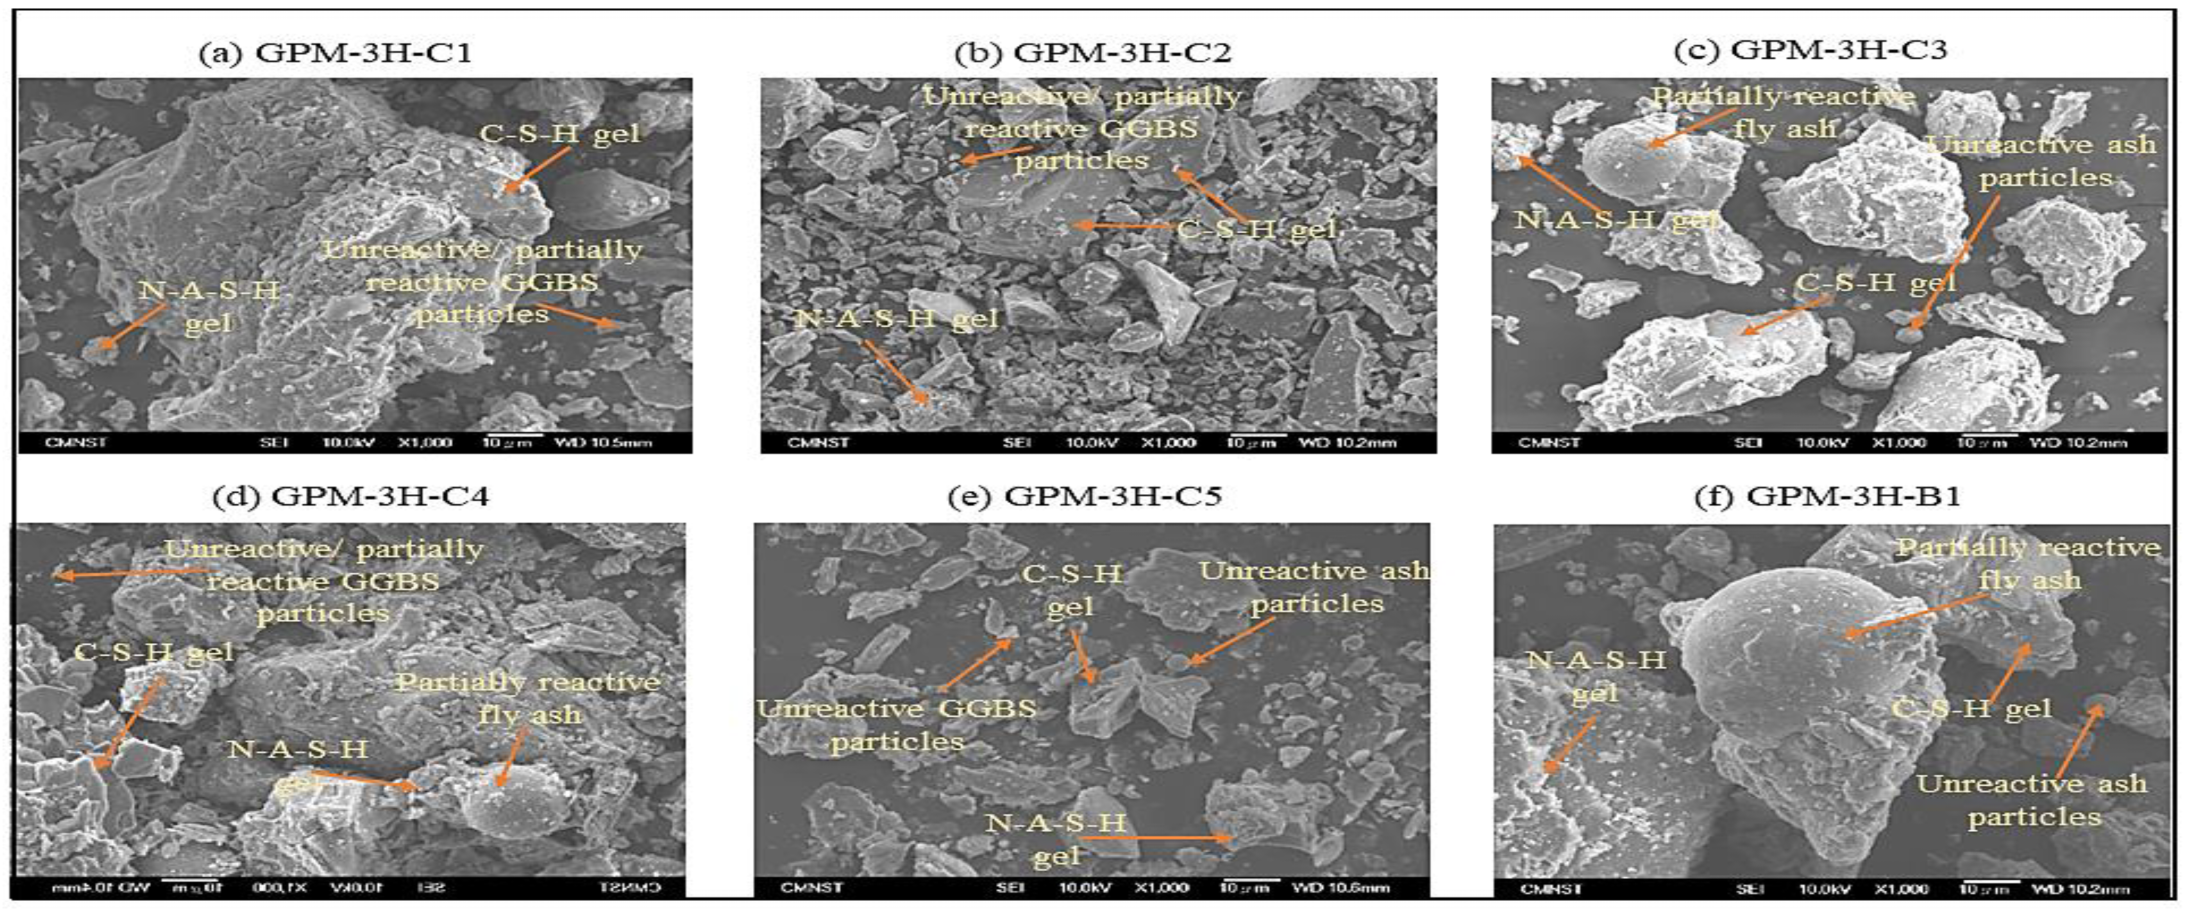
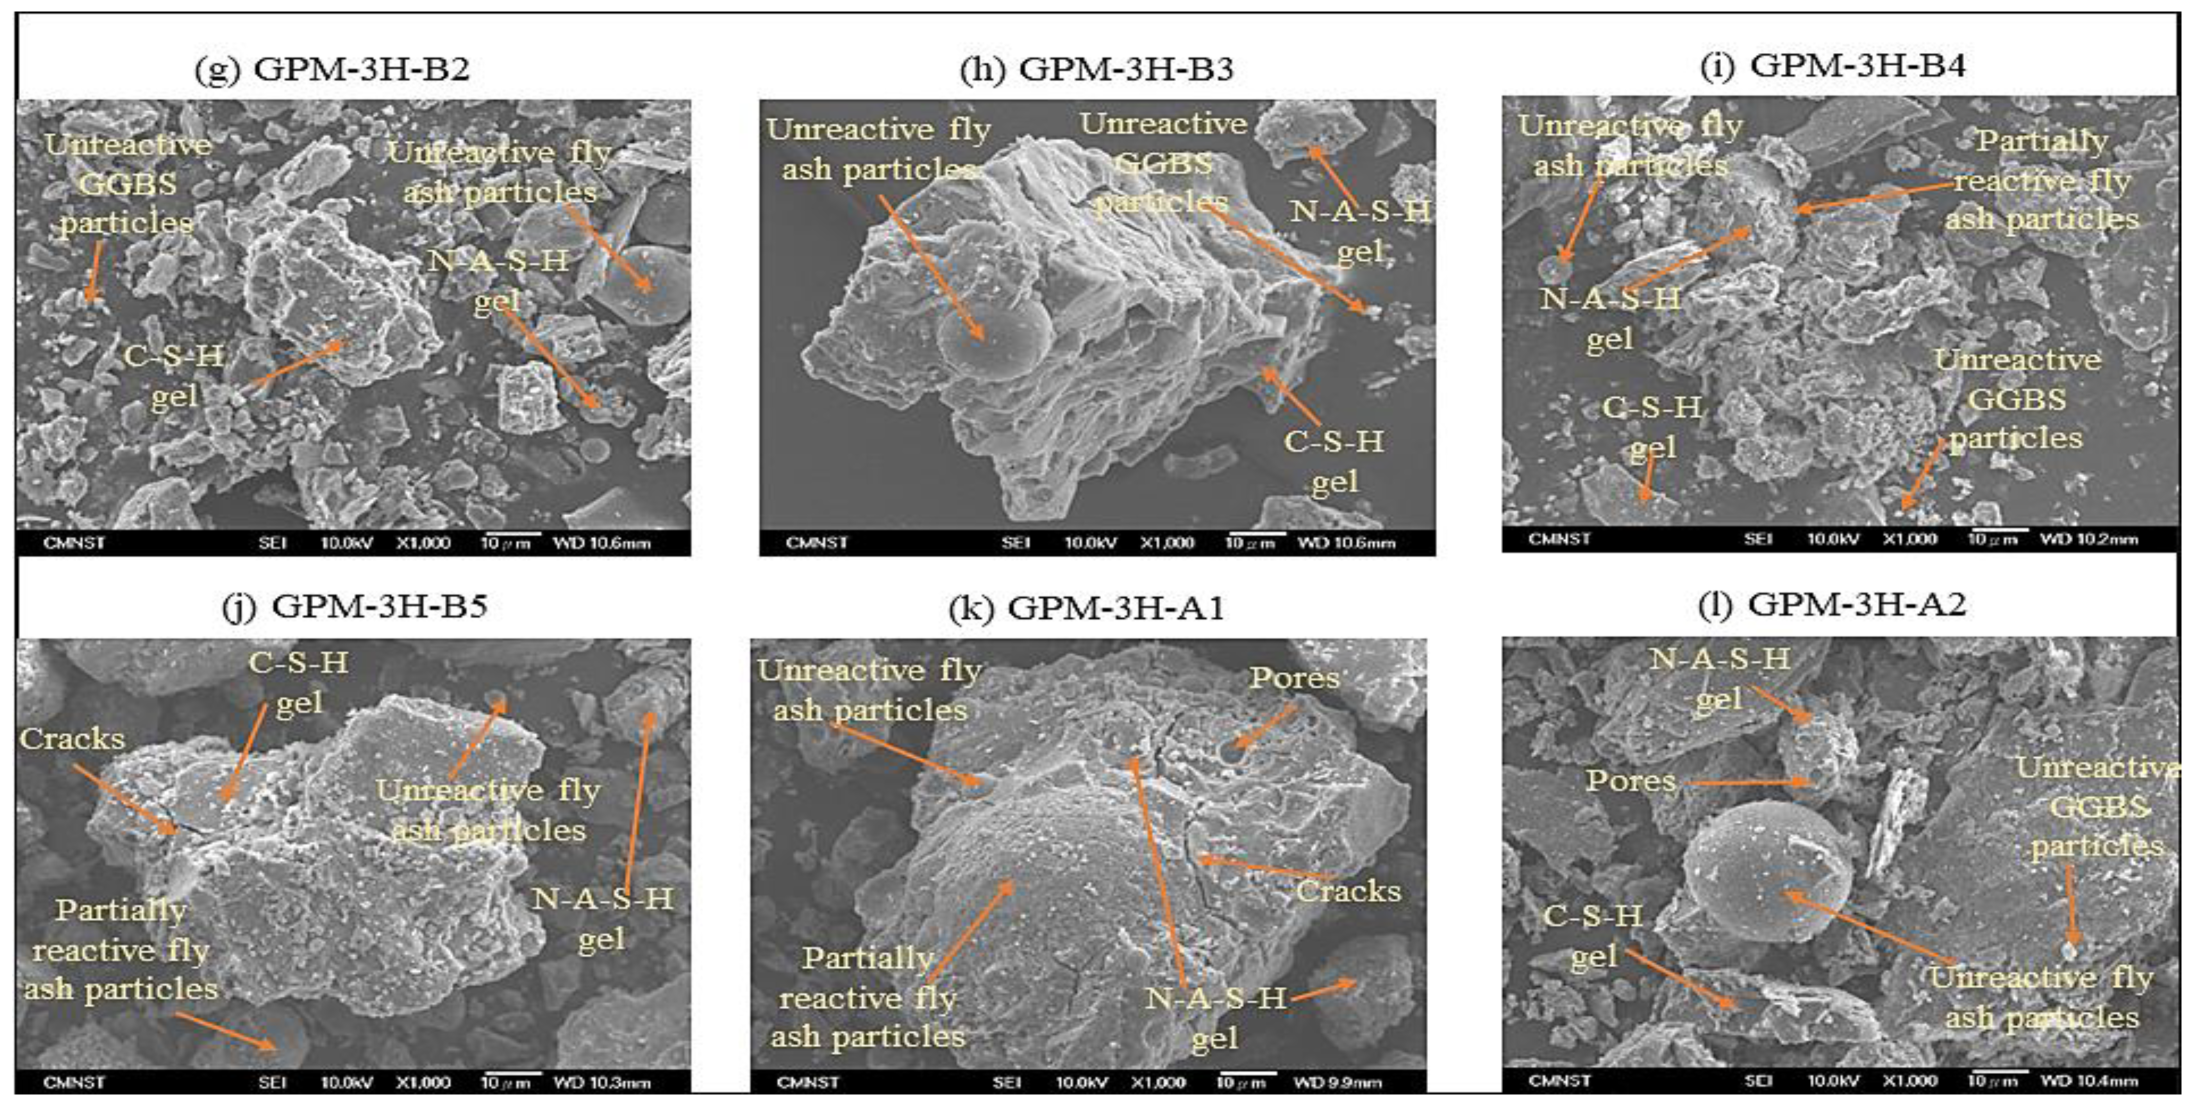
3.4.2. SEM Analysis
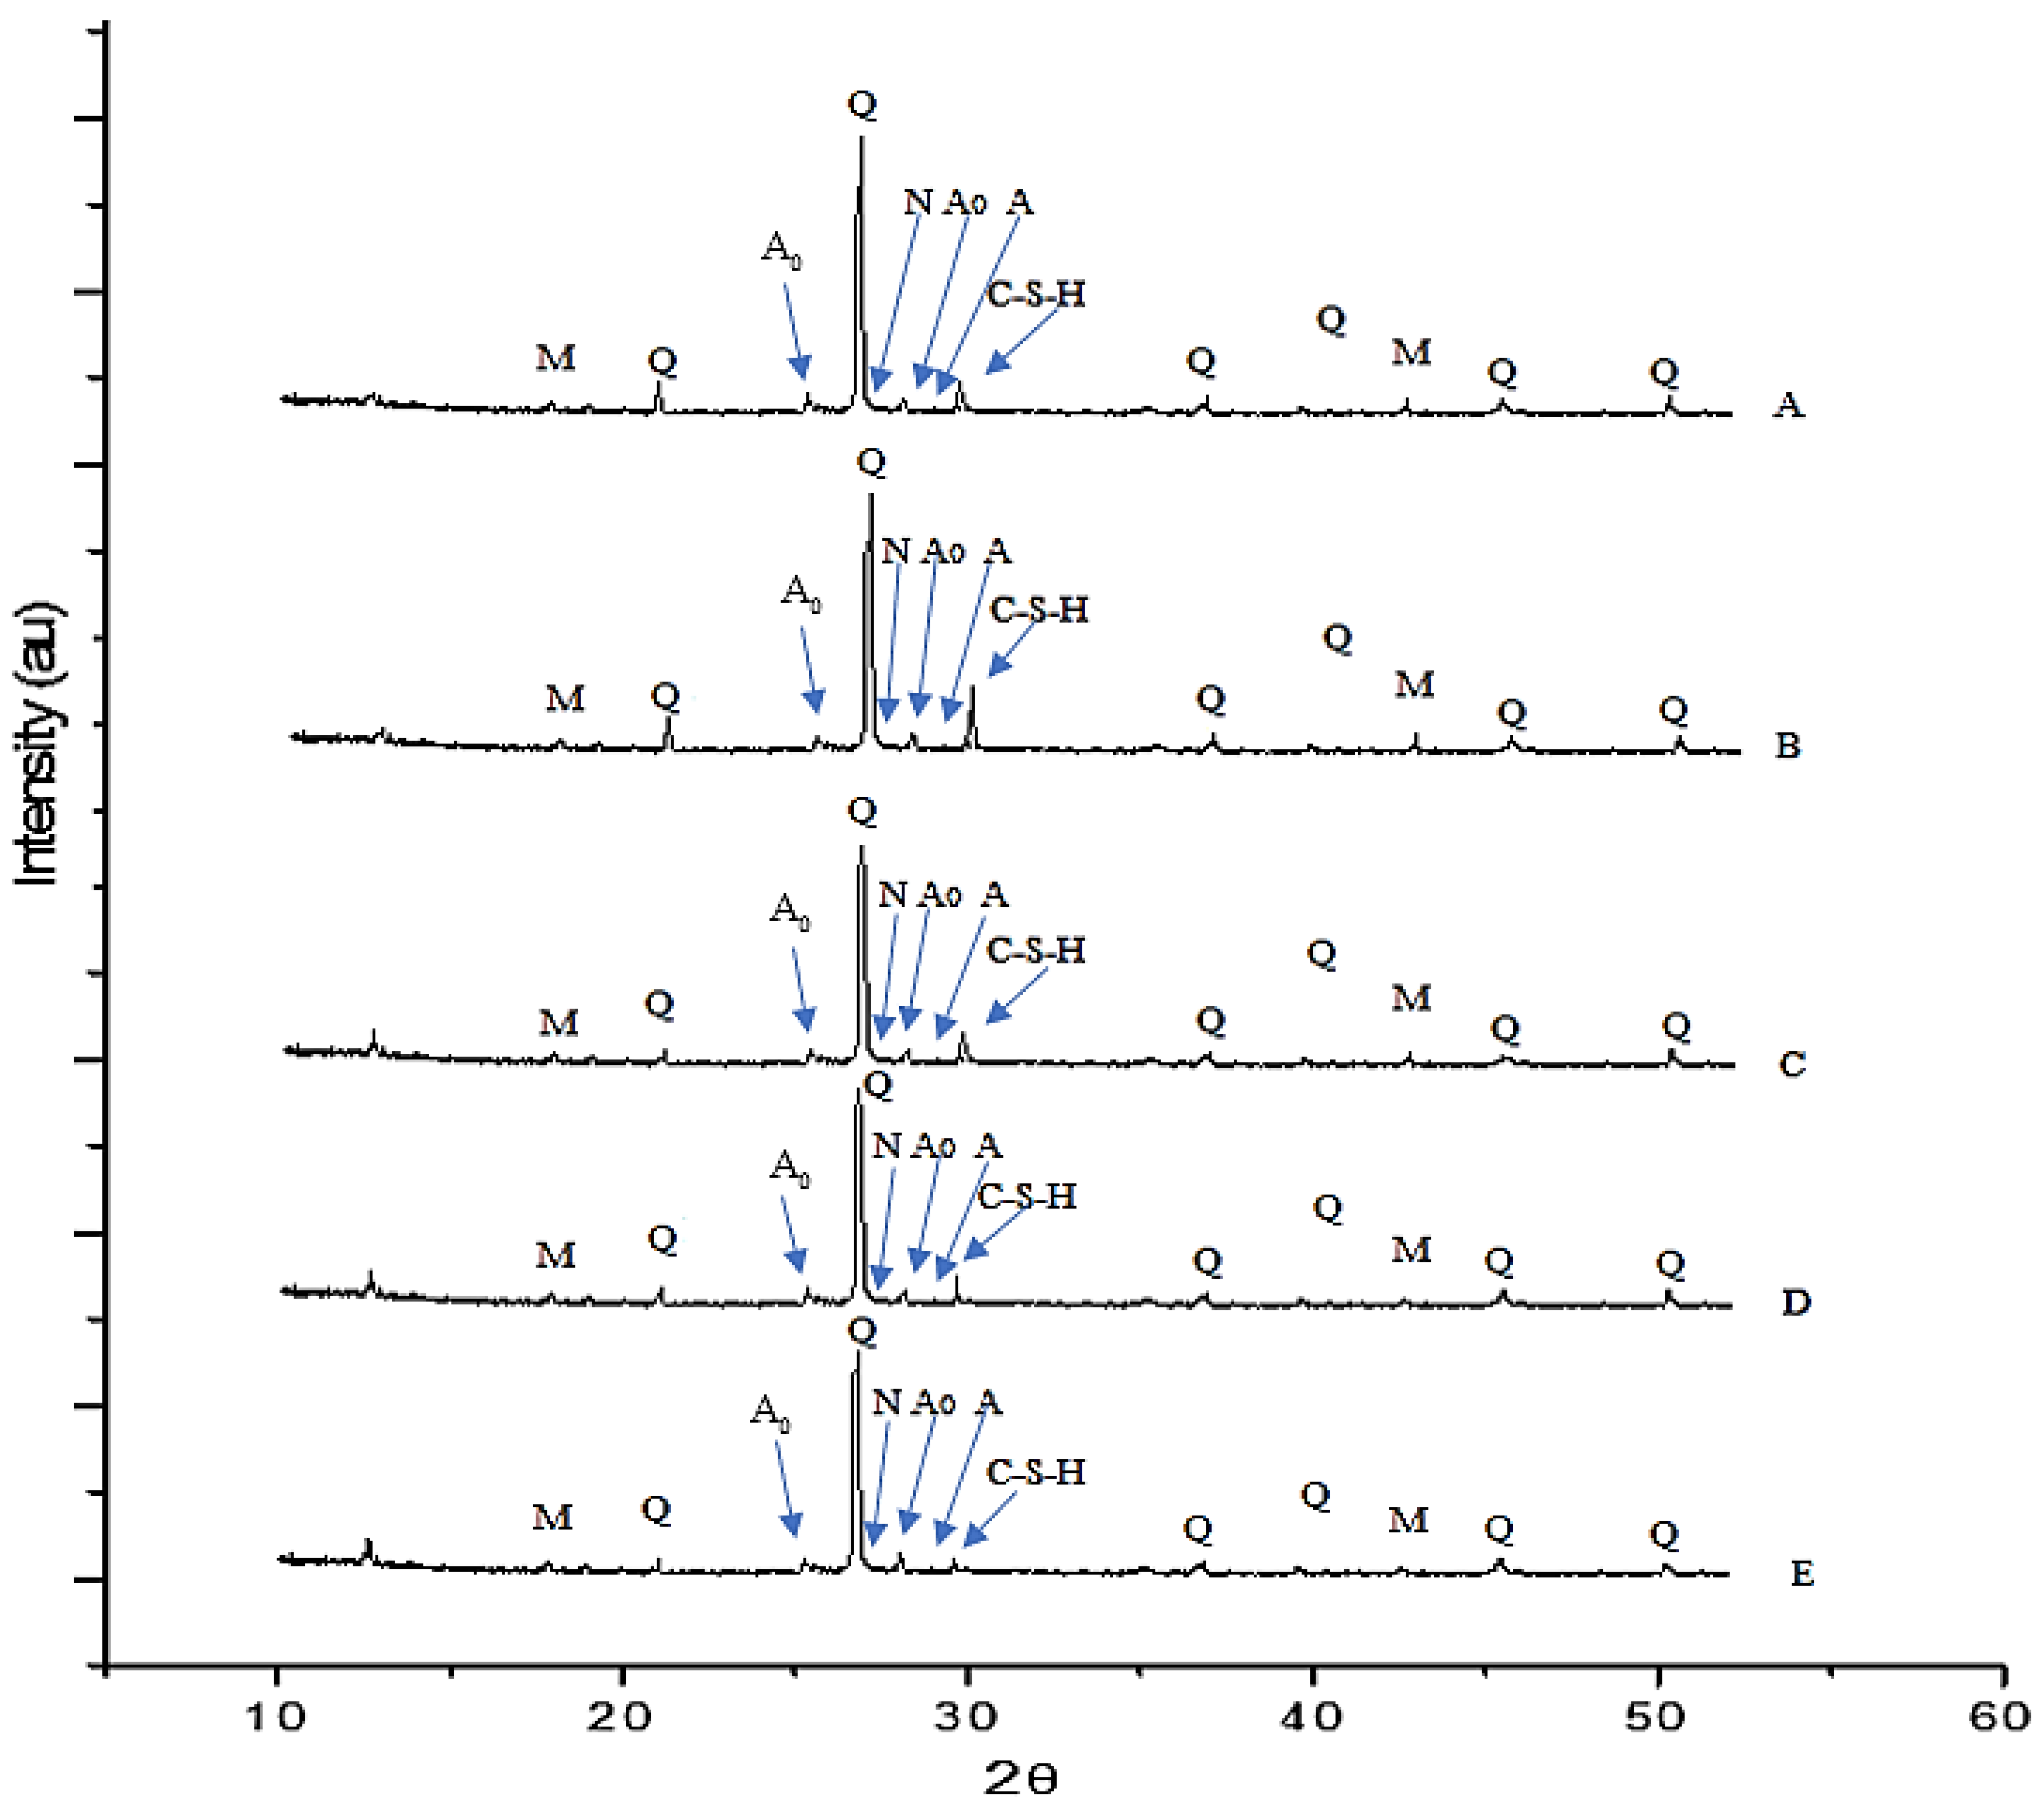
3.4.3. XRD Analysis
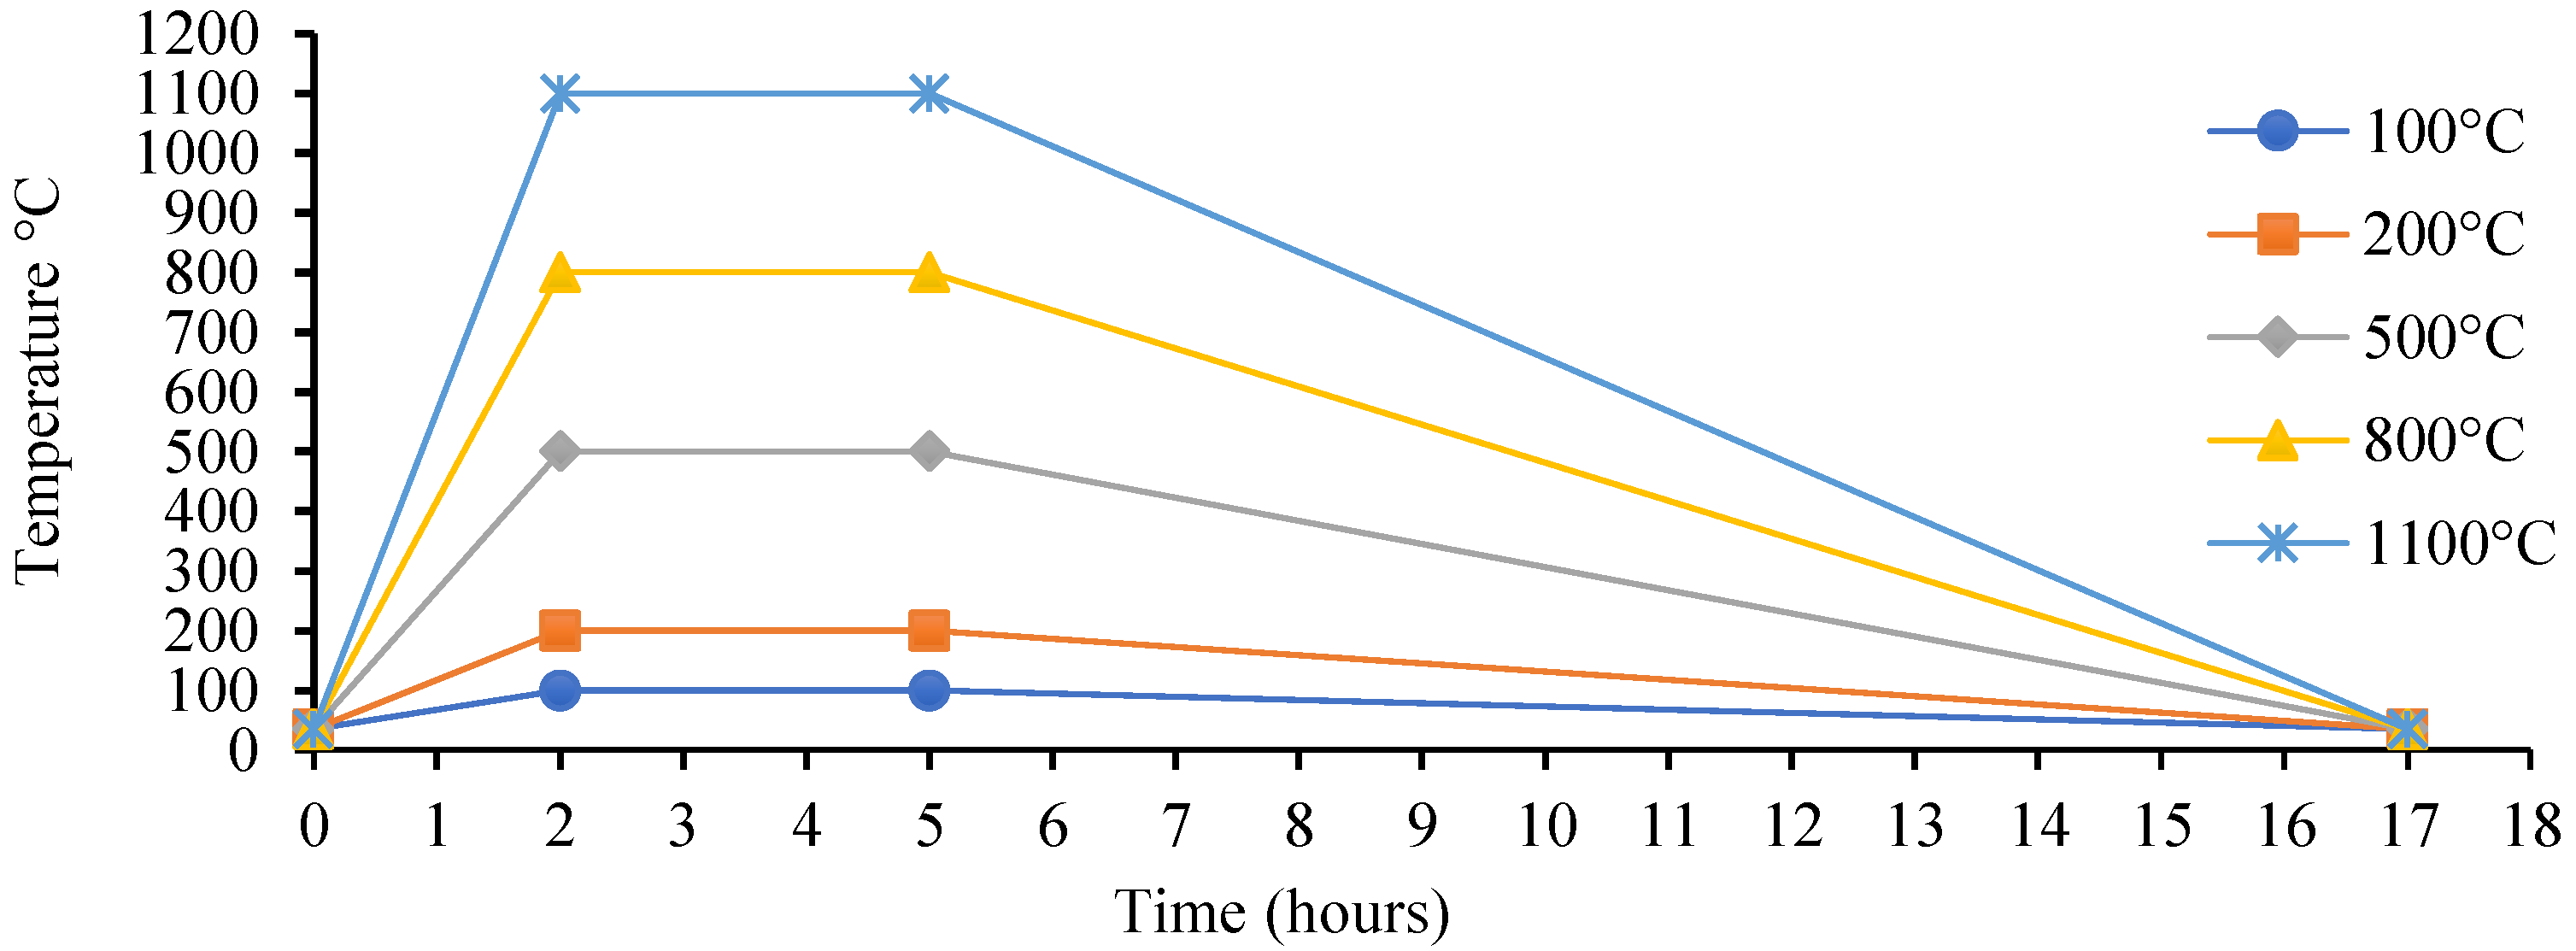
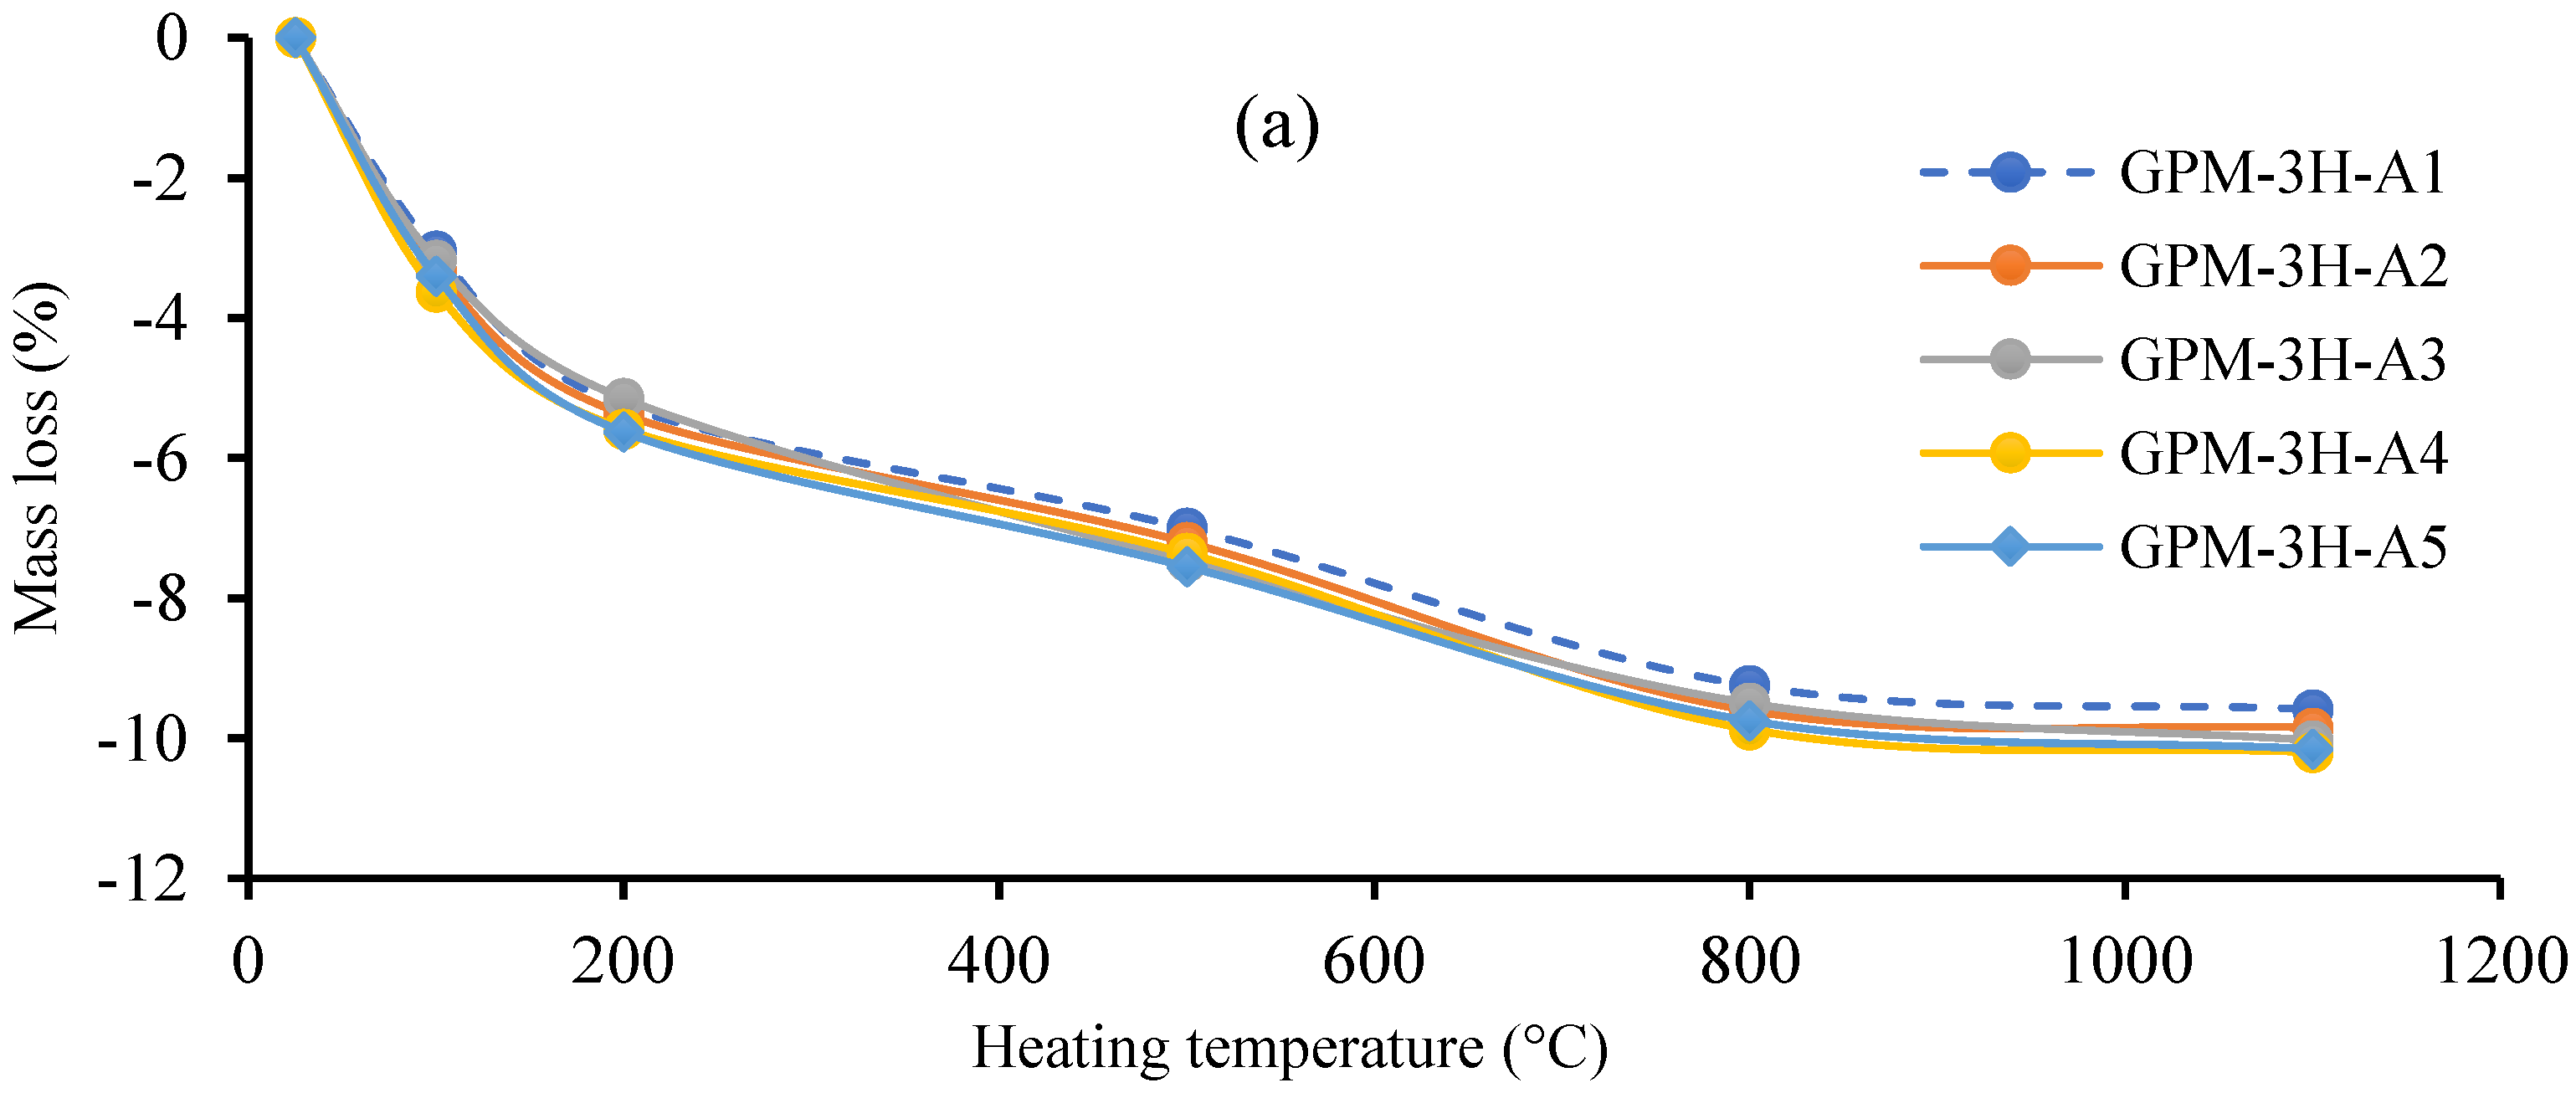
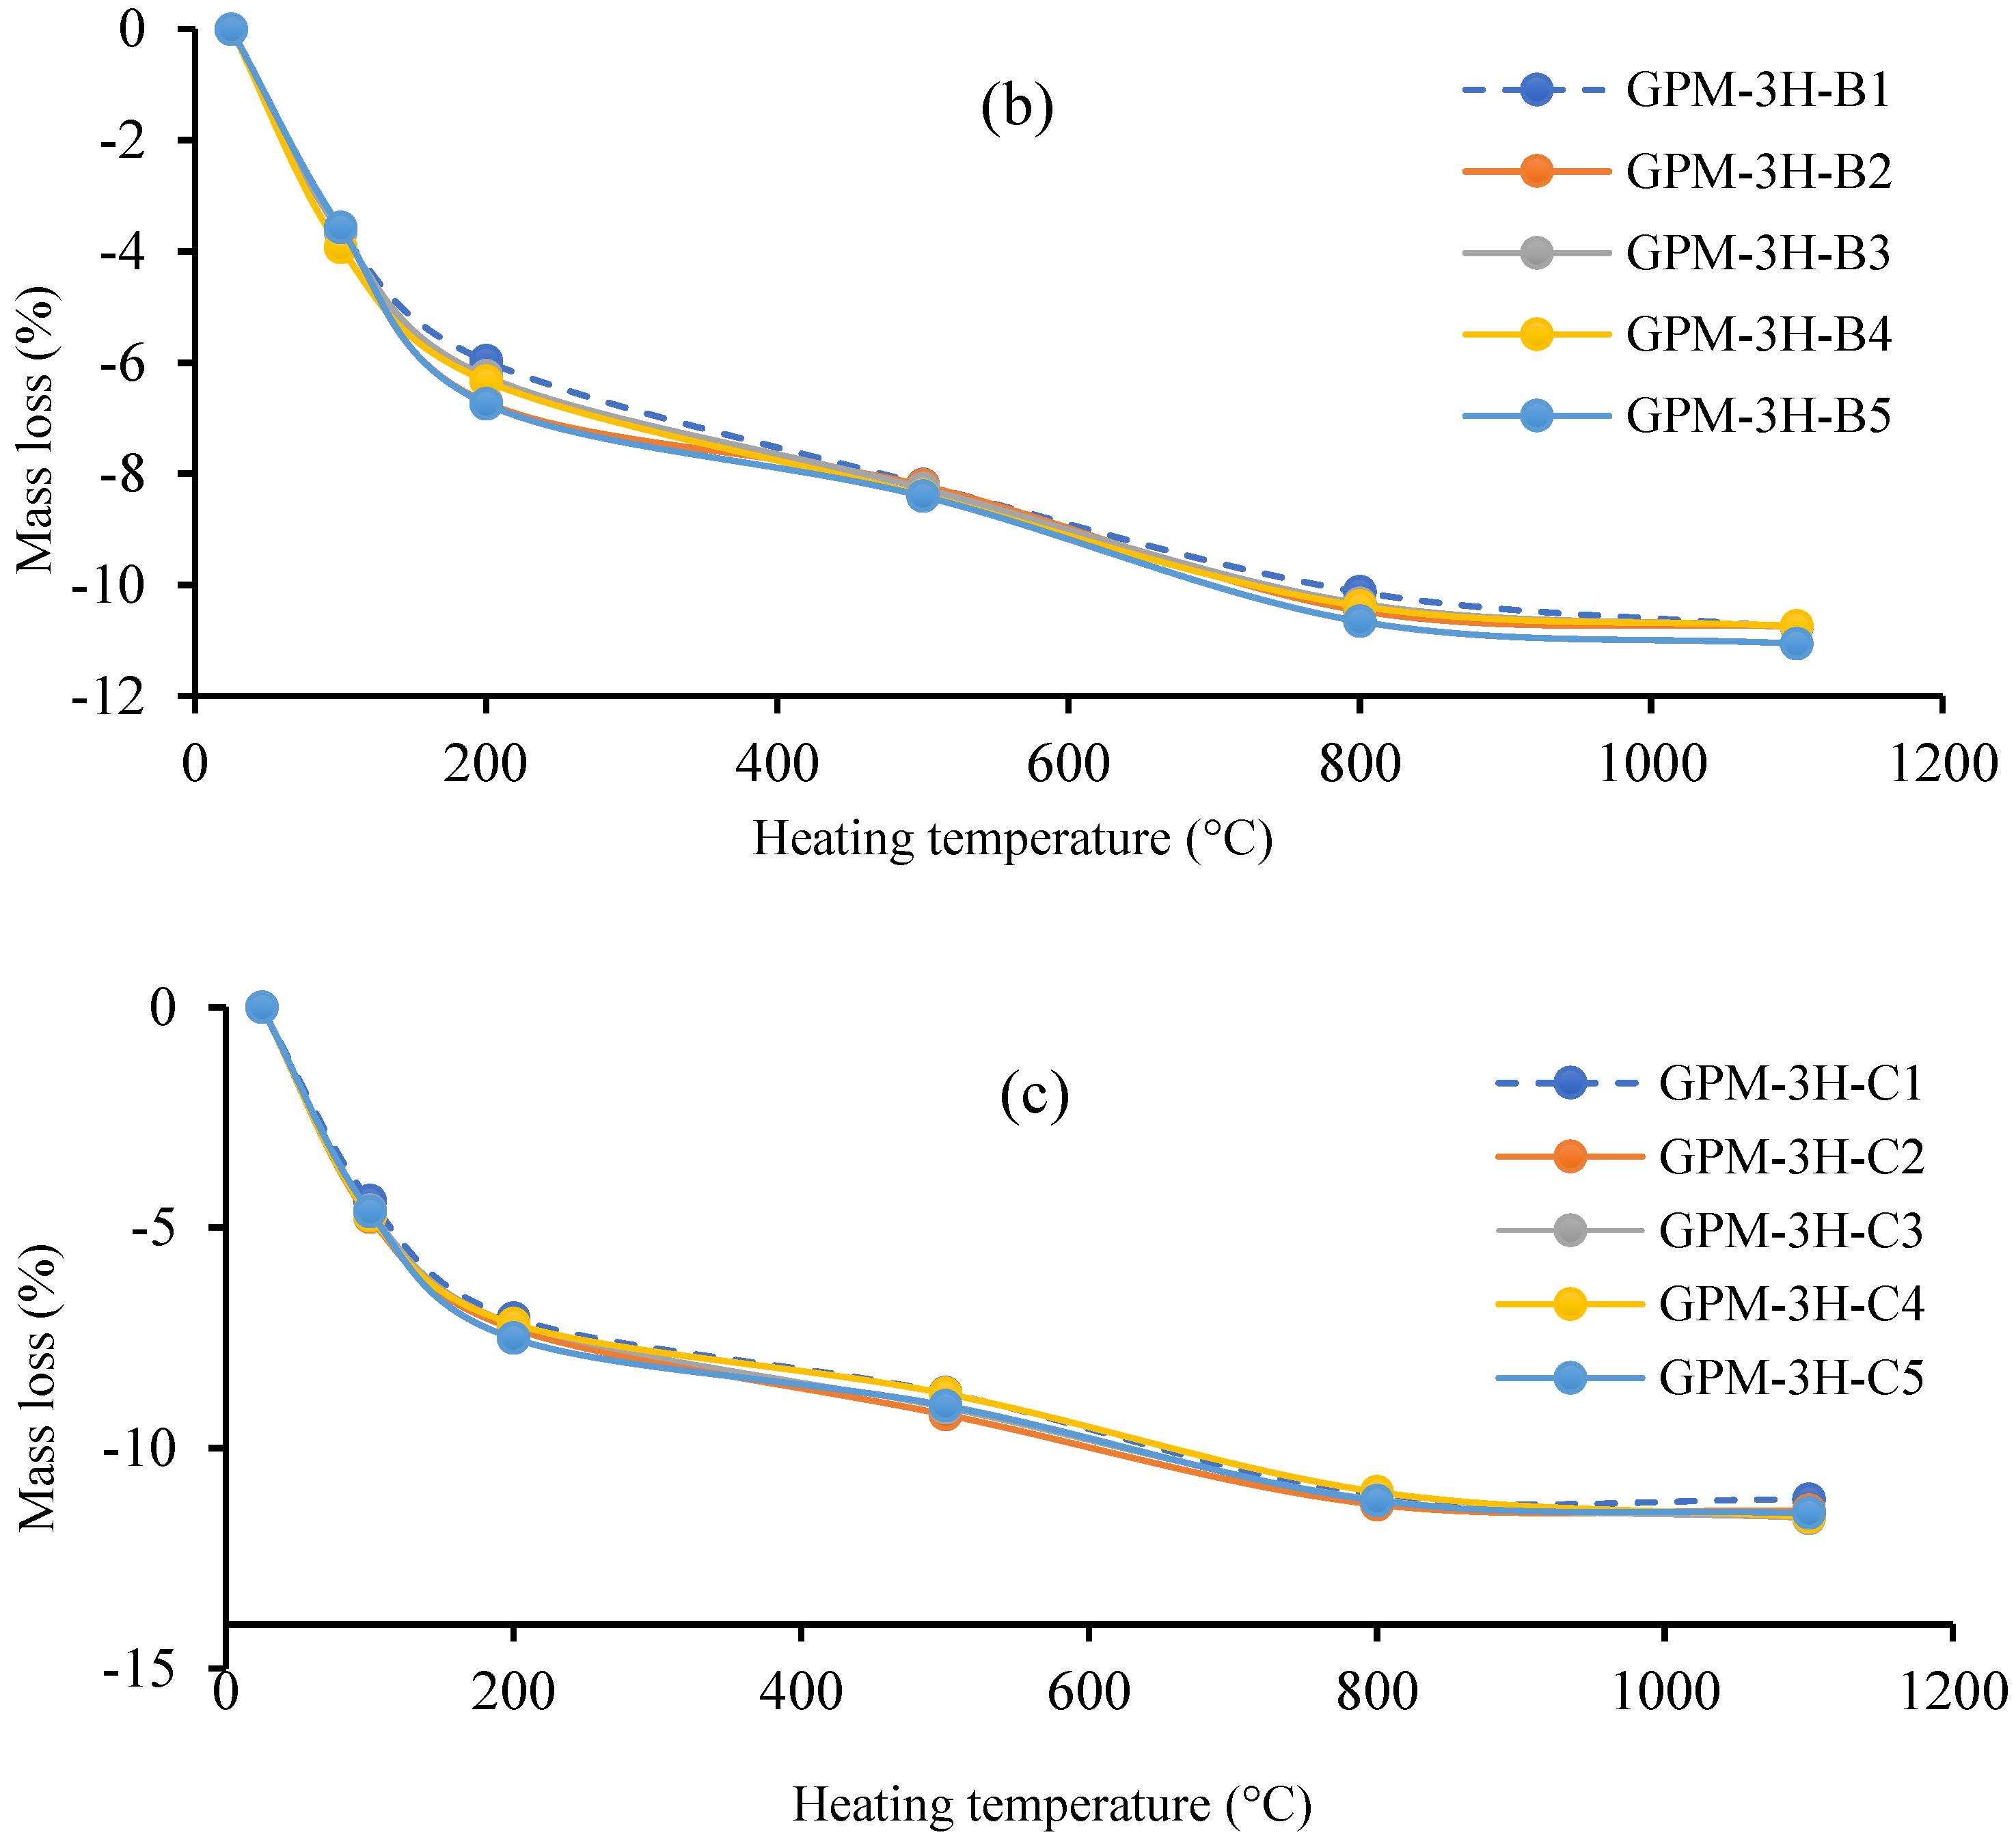
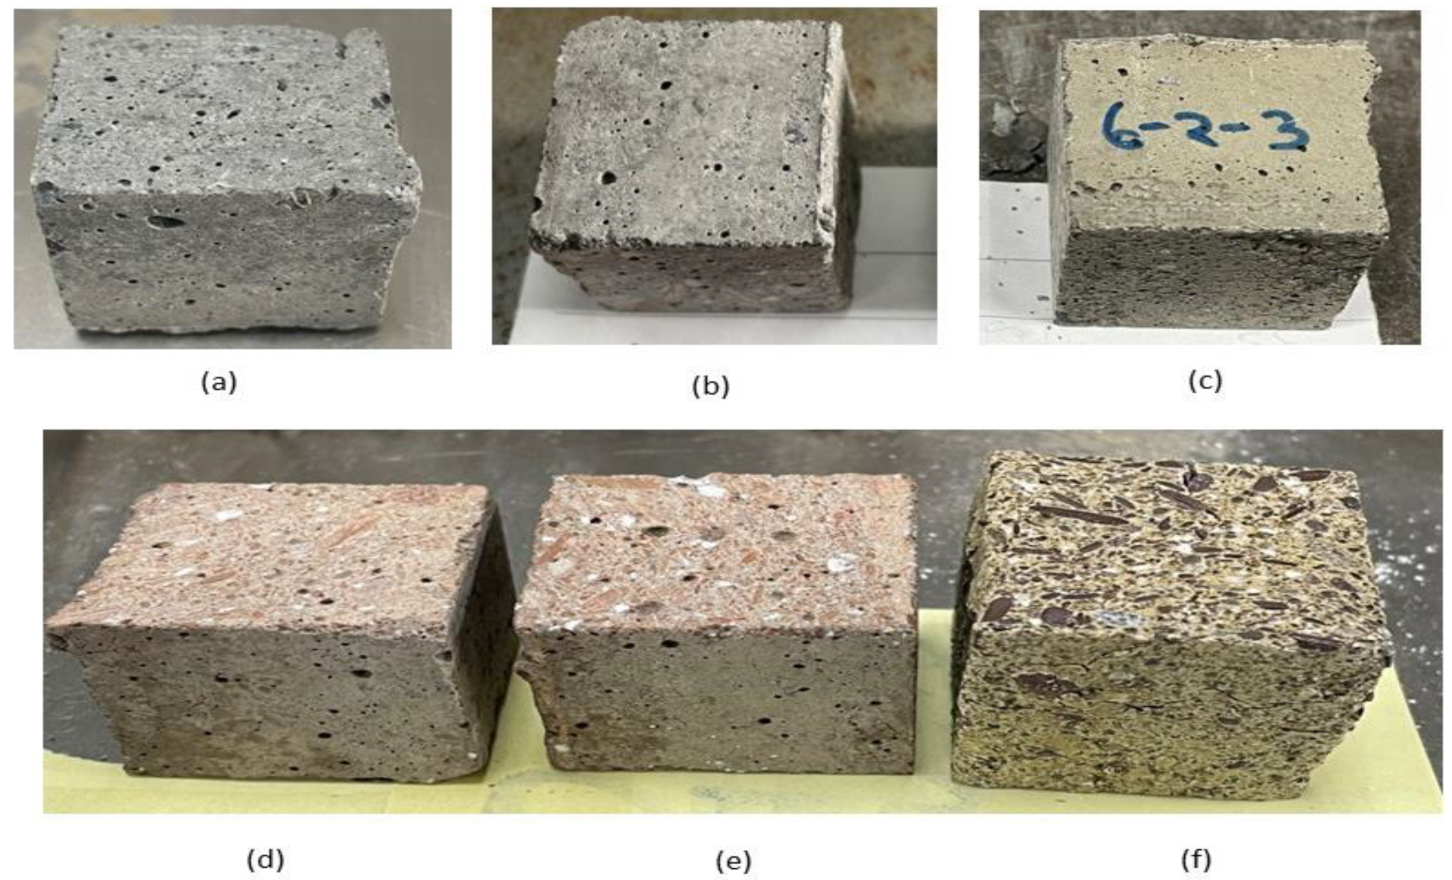
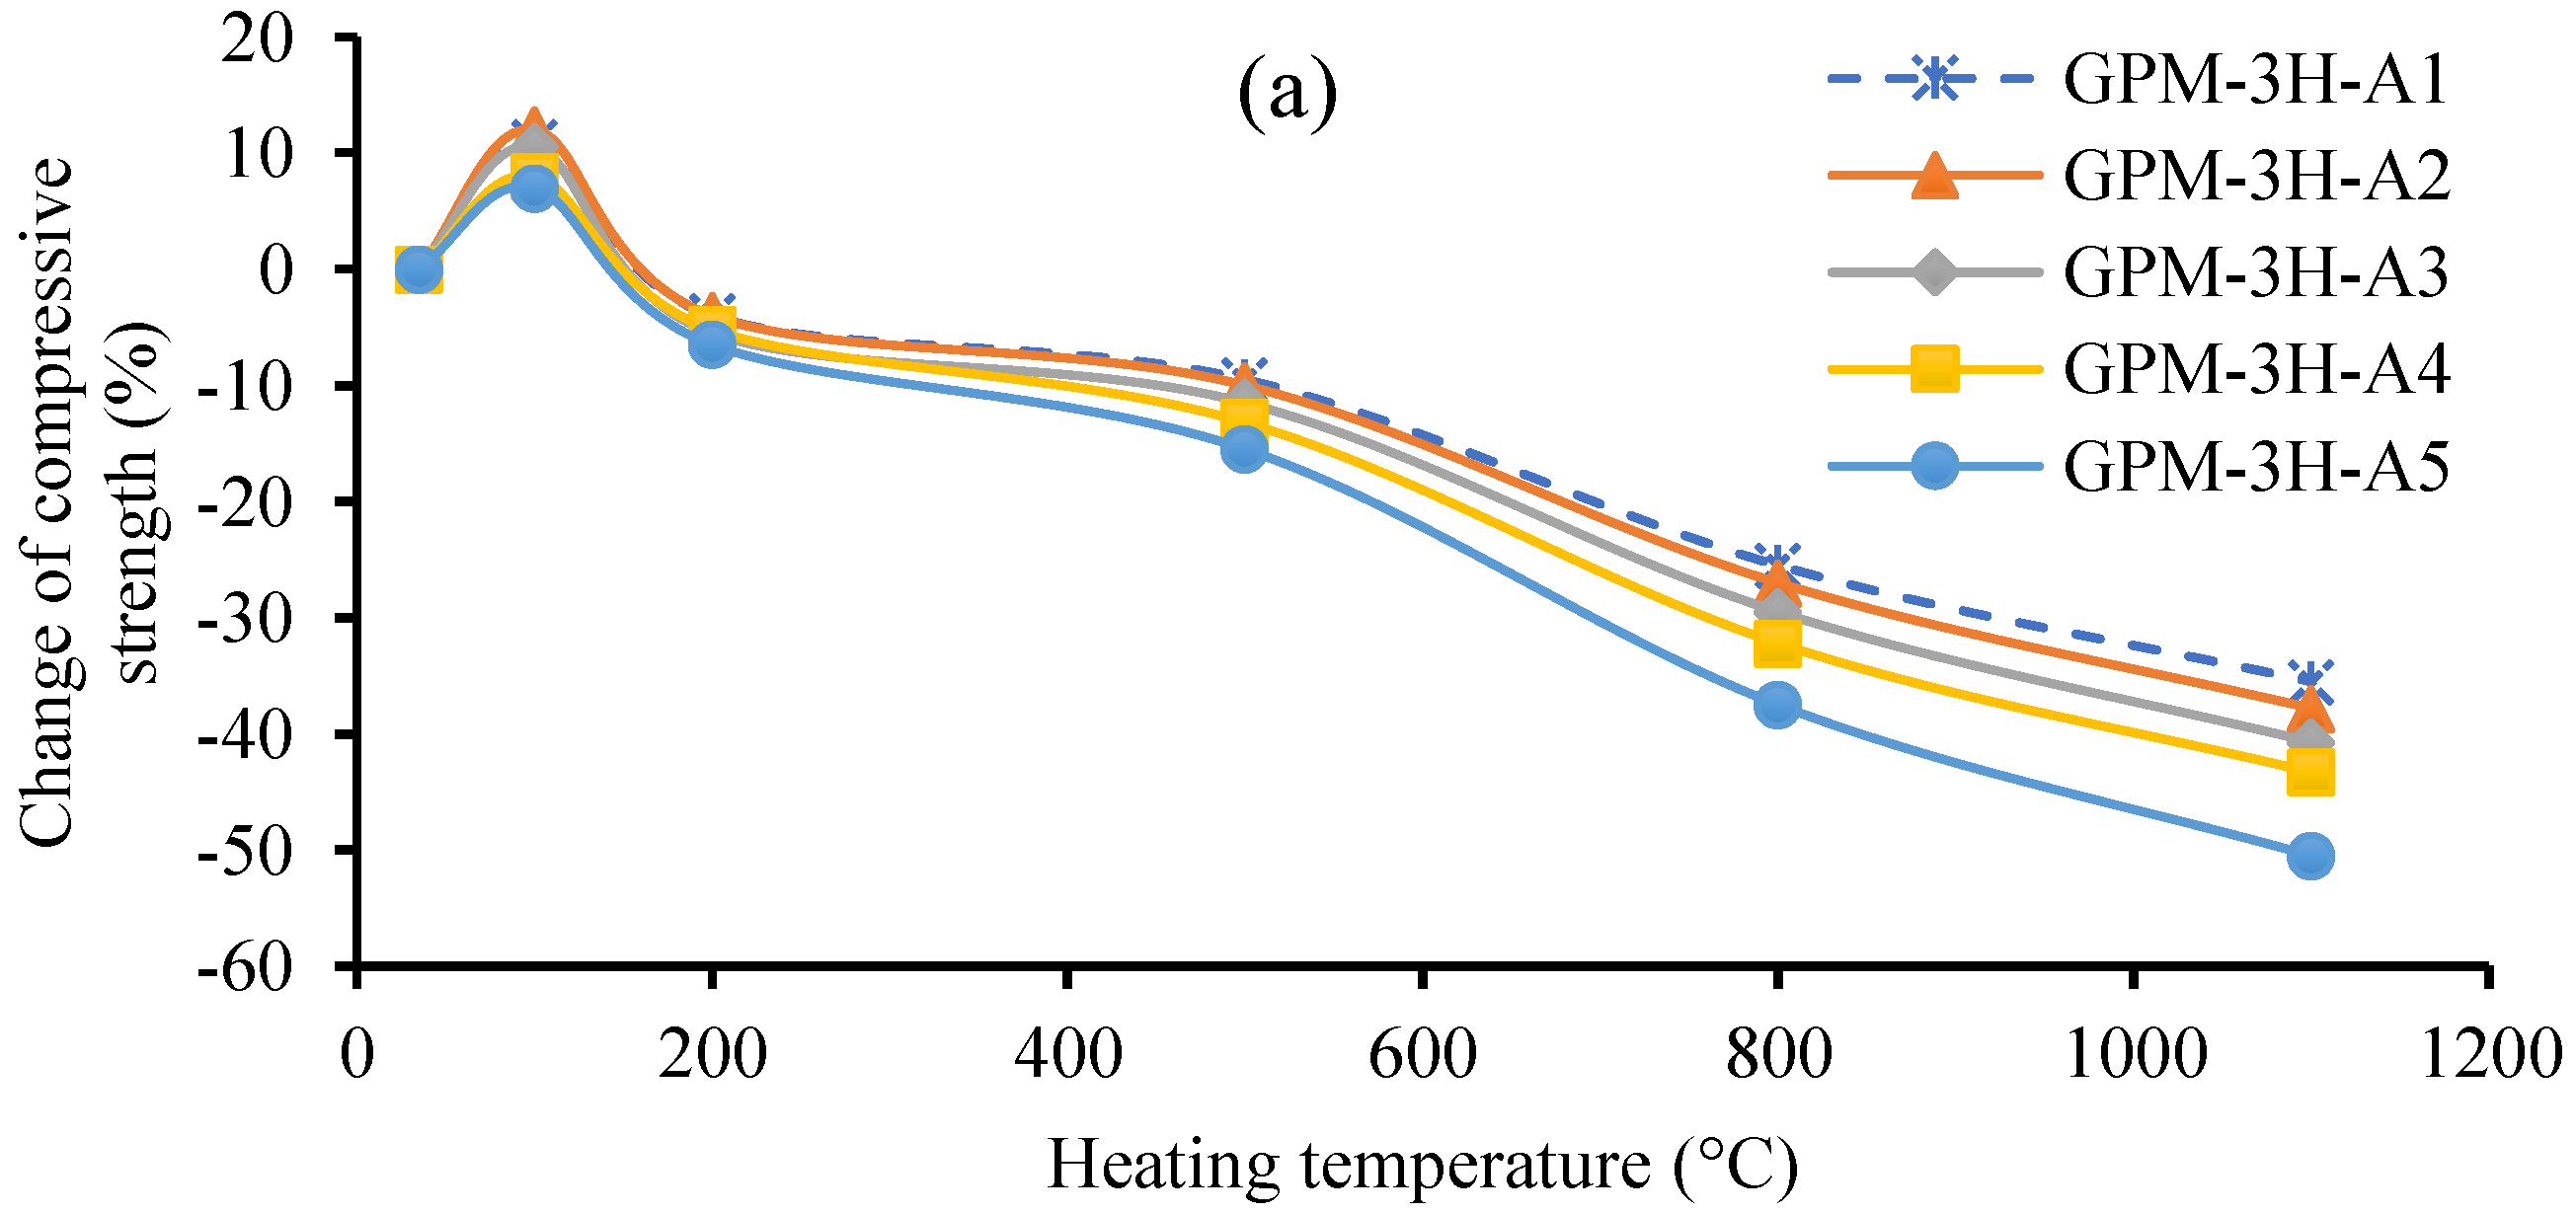
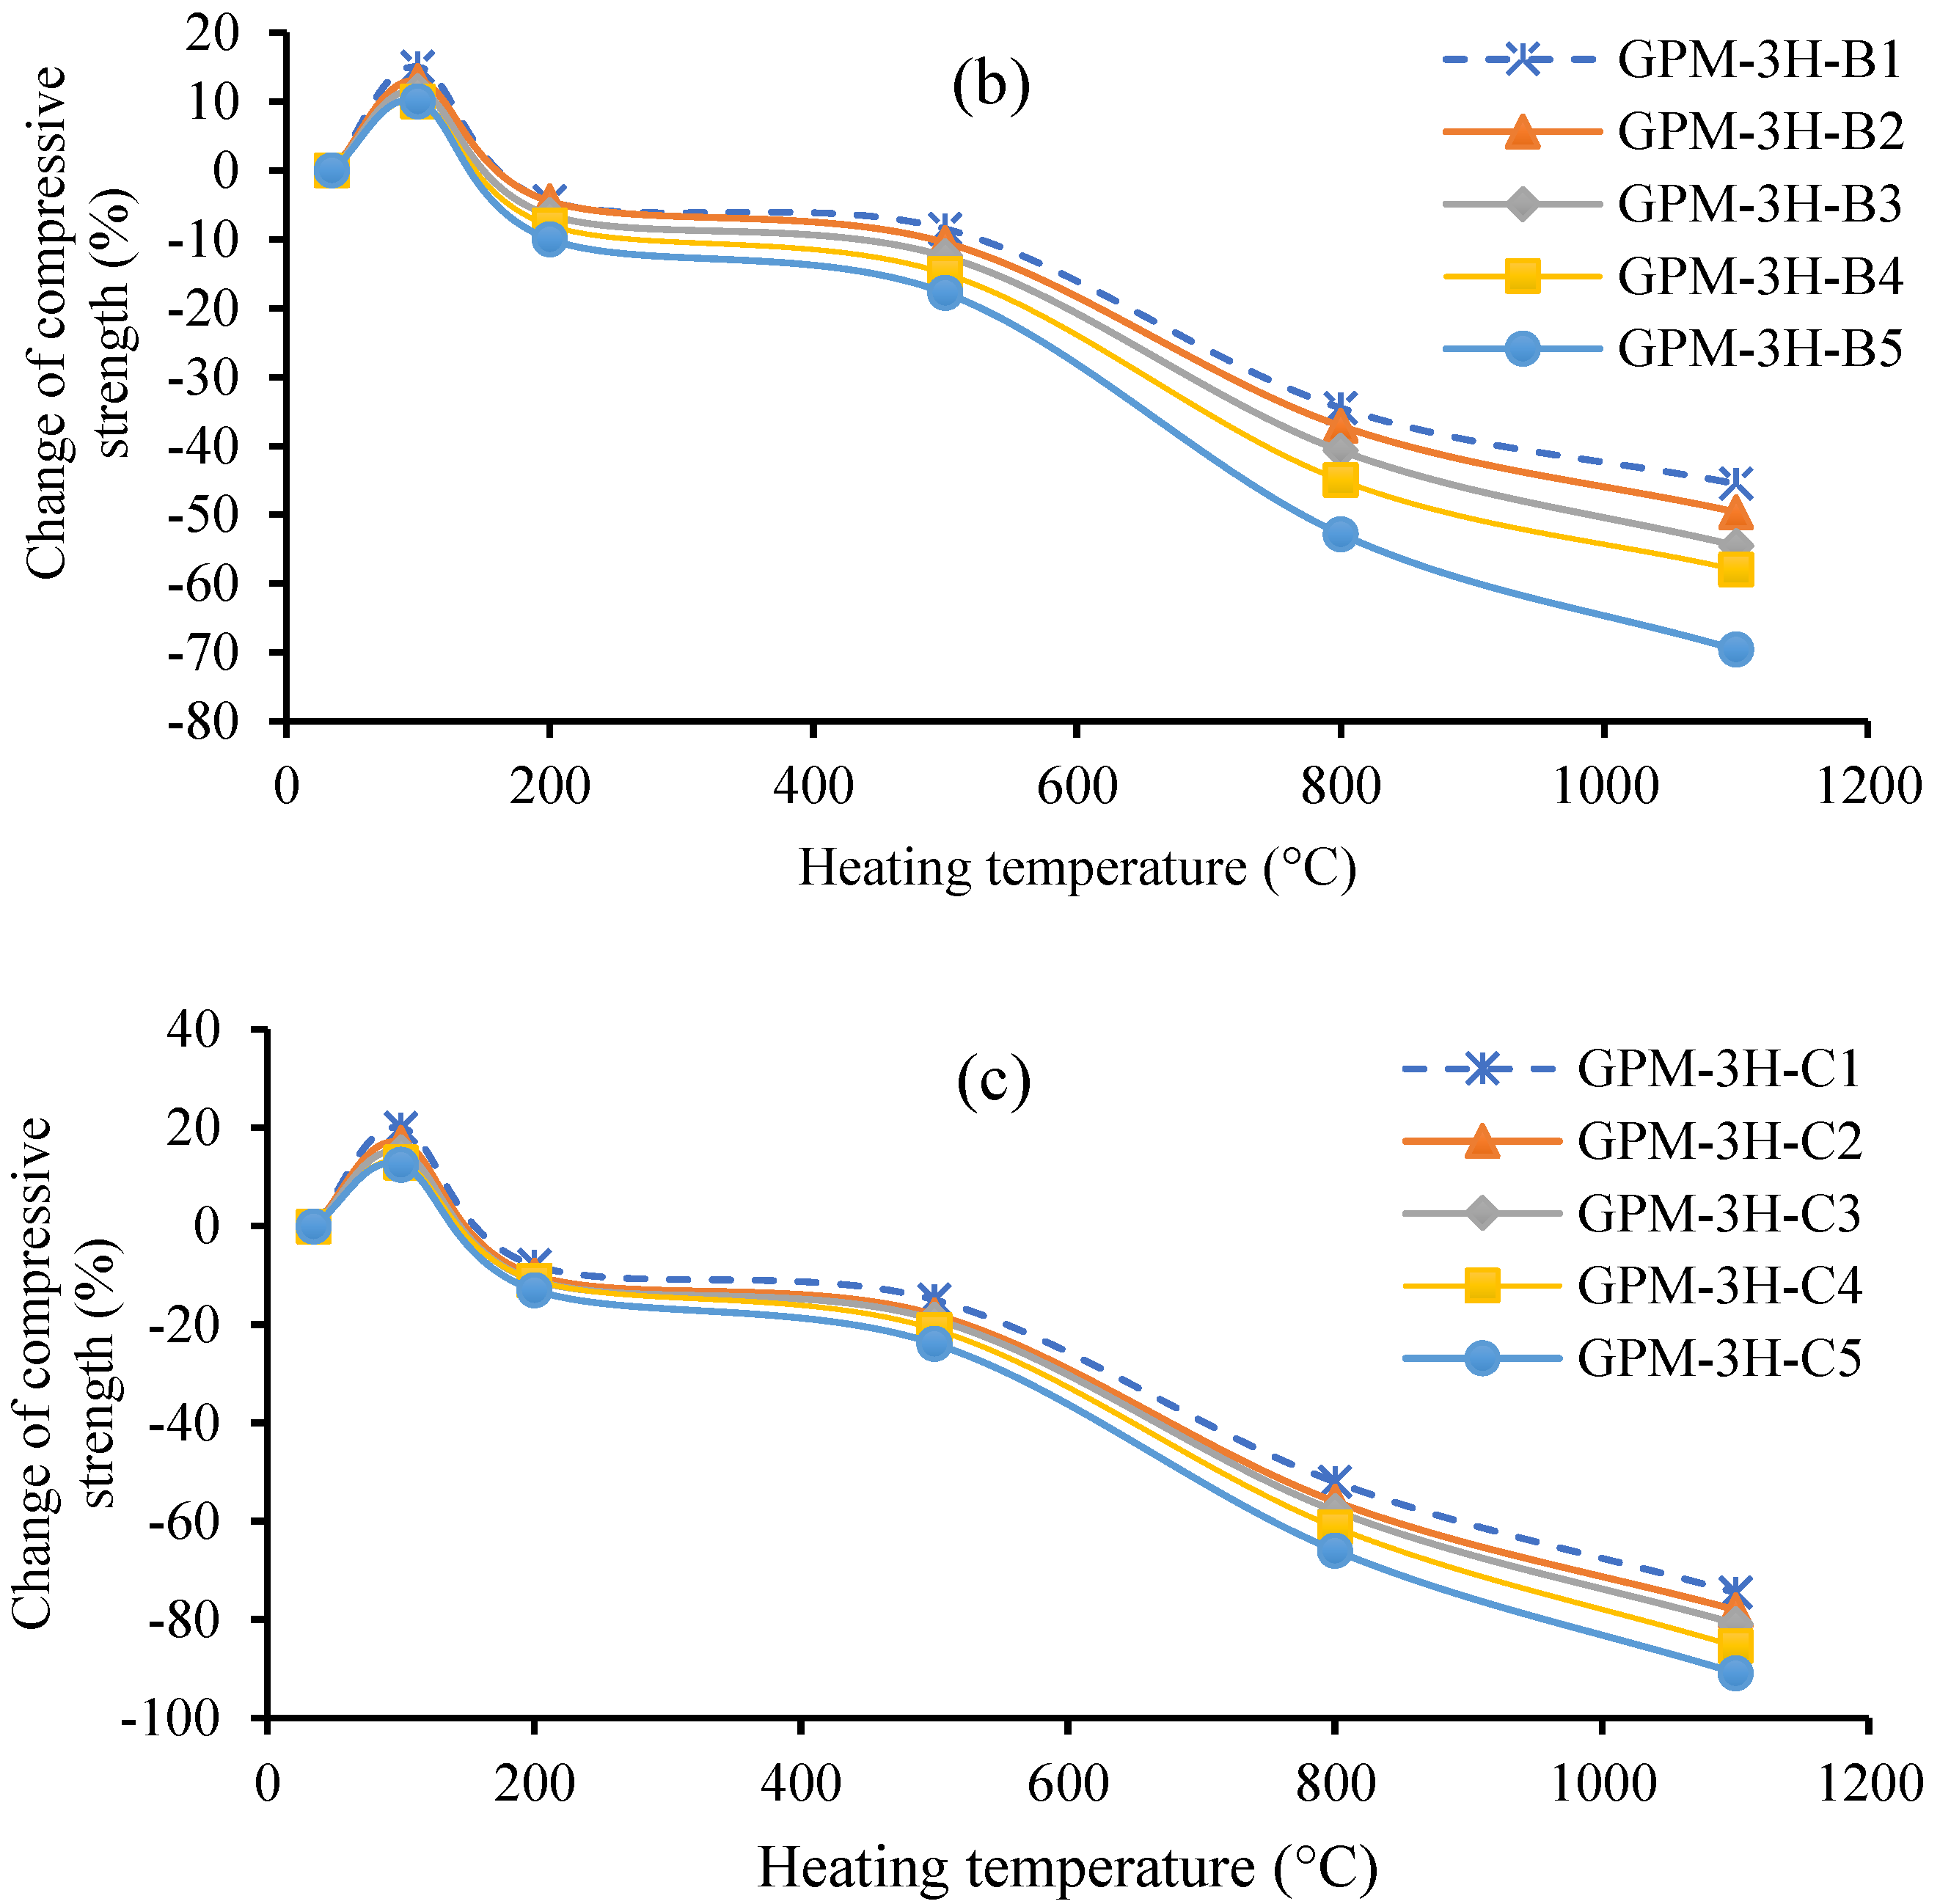
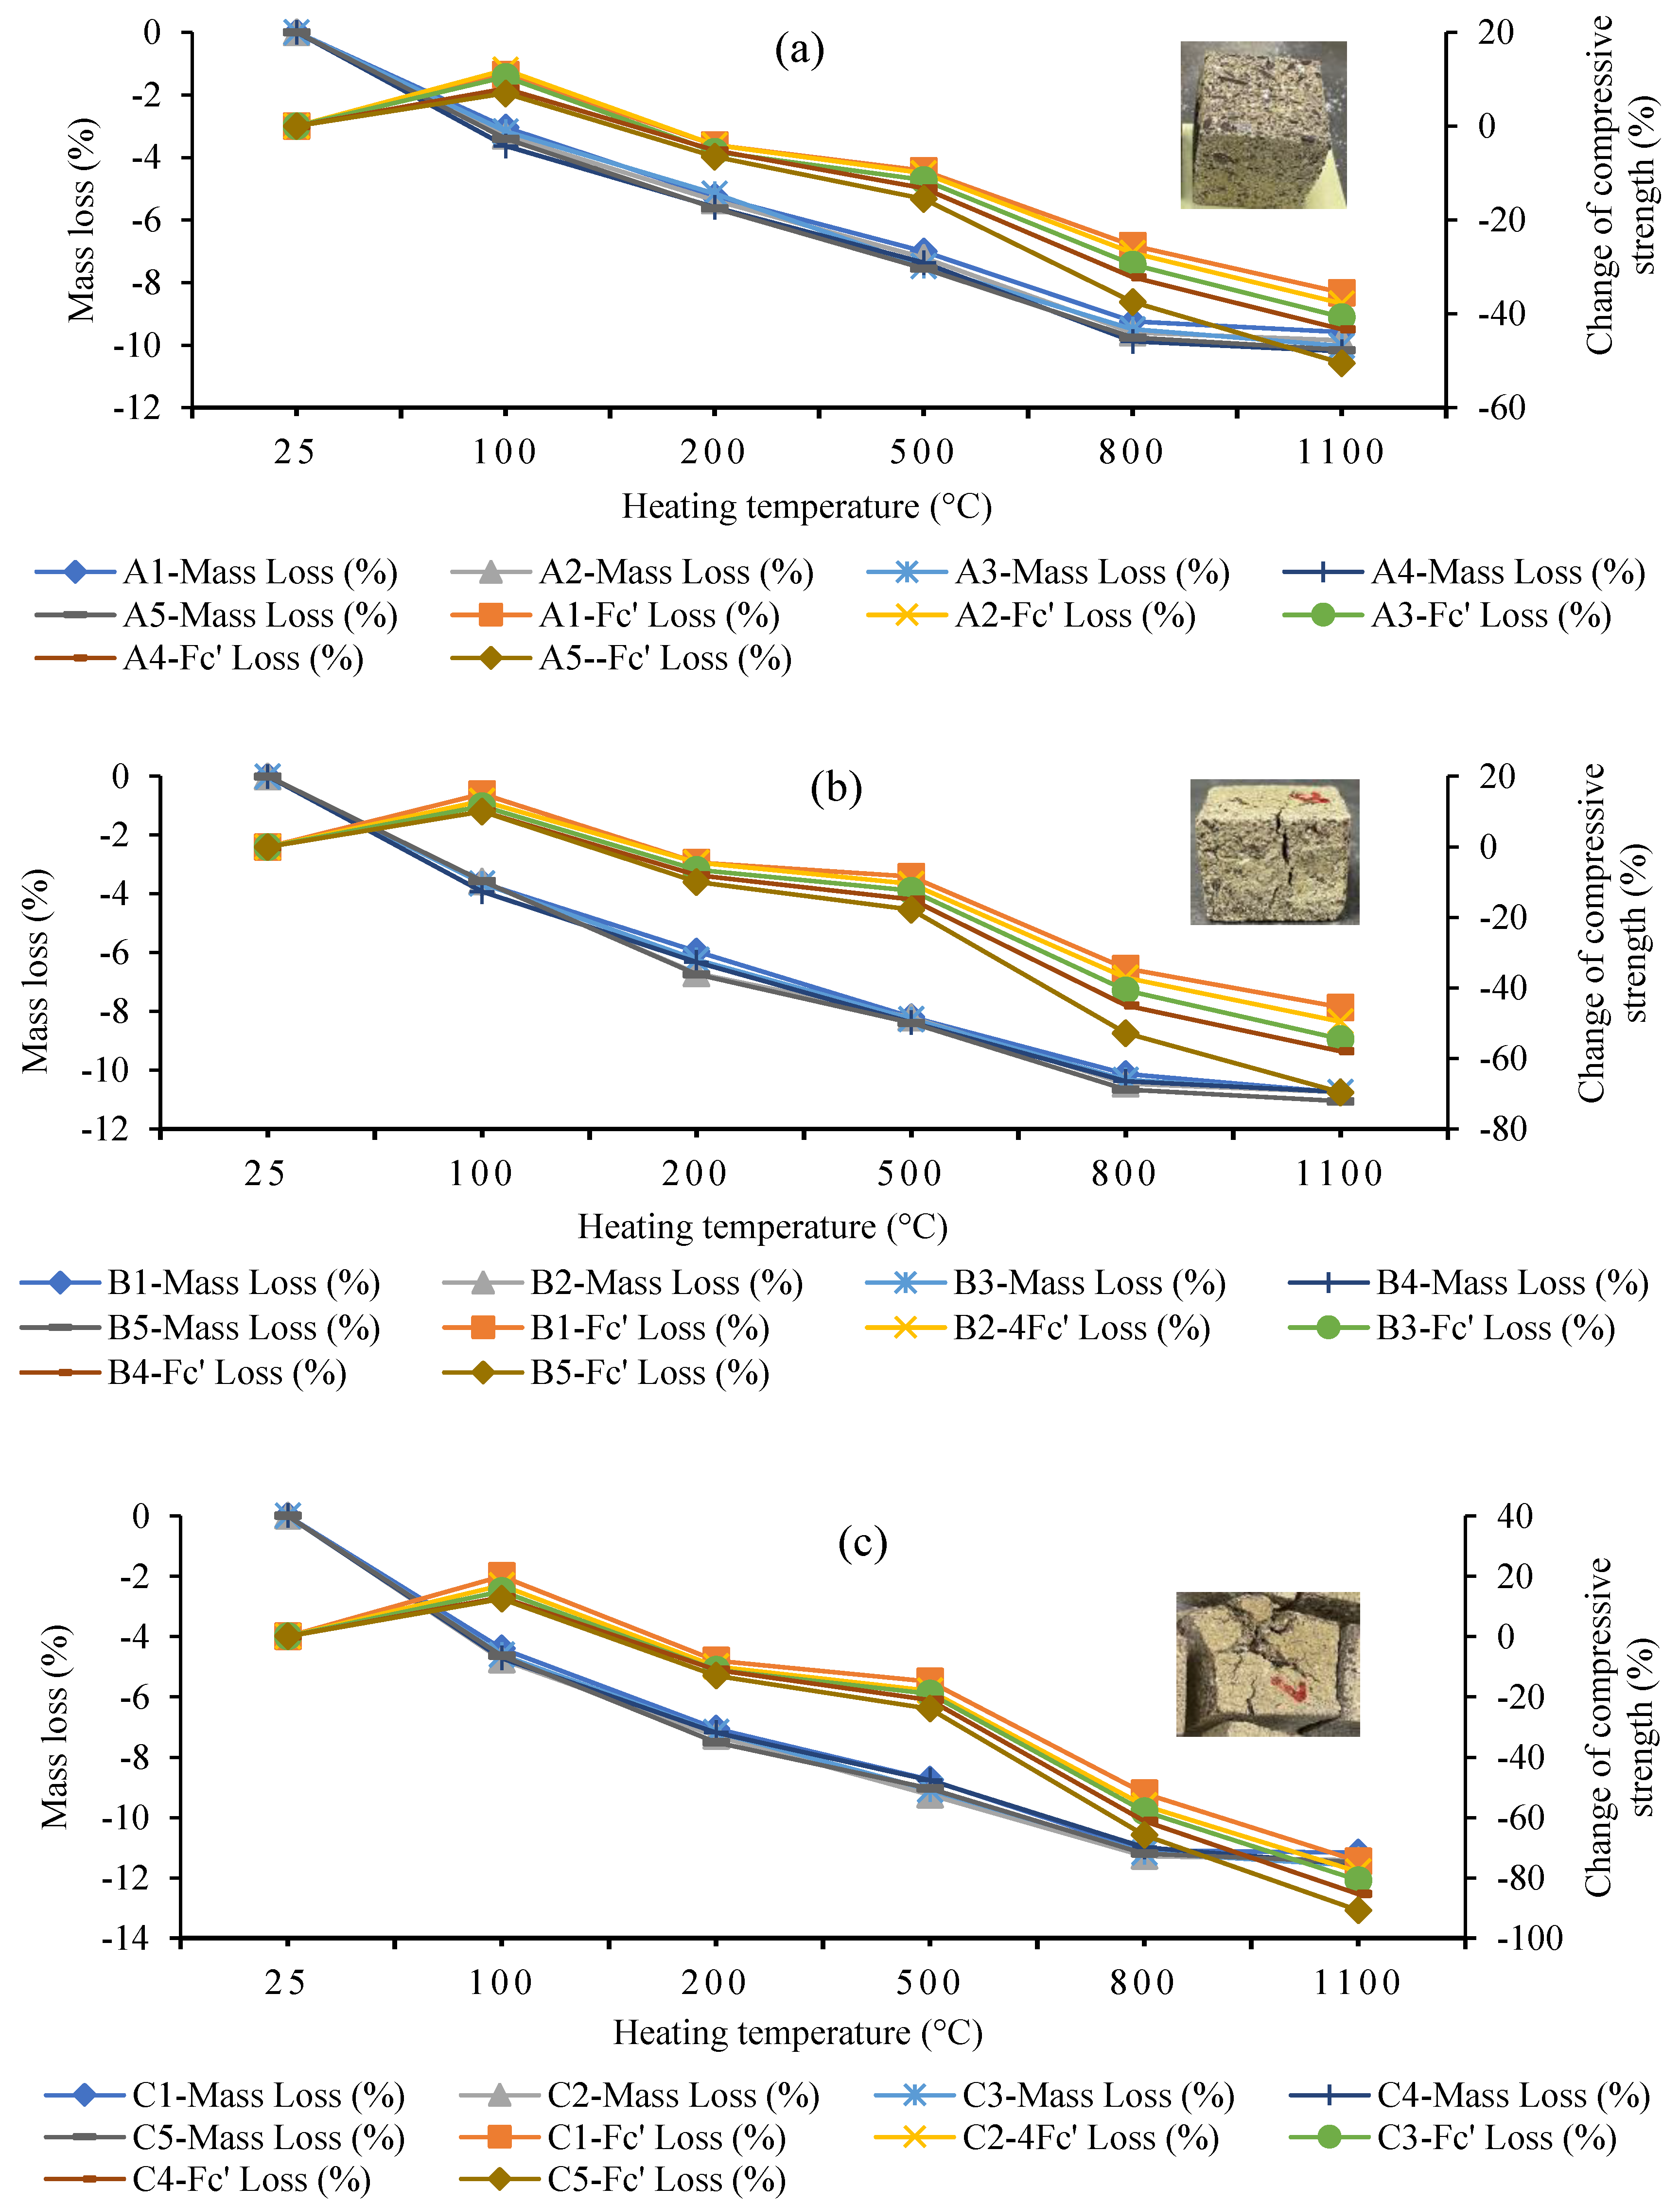
3.5. Thermal Stability of the GPM Using Various Na2SiO3-to-NaOH and Fly Ash (FA)-to-GGBS Ratios
4. Conclusions
Author Contributions
Funding
Institutional Review Board Statement
Data Availability Statement
Acknowledgments
Conflicts of Interest
References
- Madlool, N.A.; Saidur, R.; Hossain, M.S.; Rahim, N. A critical review on energy use and savings in the cement industries. Renew. Sustain. Energy Rev. 2011, 15, 2042–2060. [Google Scholar] [CrossRef]
- Kusuma, G.H.; Budidarmawan, J.; Susilowati, A. Impact of concrete quality on sustainability. Procedia Eng. 2015, 125, 754–759. [Google Scholar] [CrossRef] [Green Version]
- Assi, L.N.; Carter, K.; Deaver, E.; Ziehl, P. Review of availability of source materials for geopolymer/sustainable concrete. J. Clean. Prod. 2020, 263, 121477. [Google Scholar] [CrossRef]
- Friedlingstein, P.; Andrew, R.M.; Rogelj, J.; Peters, G.P.; Canadell, J.G.; Knutti, R.; Luderer, G.; Raupach, M.R.; Schaeffer, M.; van Vuuren, D.P. Persistent growth of CO2 emissions and implications for reaching climate targets. Nat. Geosci. 2014, 7, 709–715. [Google Scholar] [CrossRef]
- Narayanan, A.; Shanmugasundaram, P. An experimental investigation on flyash-based geopolymer mortar under different curing regime for thermal analysis. Energy Build. 2017, 138, 539–545. [Google Scholar] [CrossRef]
- Davidovits, J. Geopolymers: Inorganic polymeric new materials. J. Therm. Anal. Calorim. 1991, 37, 1633–1656. [Google Scholar] [CrossRef]
- Carroll, C.; Juneau, A. Repair of concrete bridge deck expansion joints using elastomeric concrete. Pract. Period. Struct. Des. Constr. 2015, 20, 04014038. [Google Scholar] [CrossRef]
- Mitoulis, S.A.; Domaneschi, M.; Cimellaro, G.P.; Casas, J.R. Bridge and transport network resilience–a perspective. In Proceedings of Institution of Civil Engineers-Bridge Engineering; Thomas Telford Ltd.: London, UK, 2022; pp. 138–149. [Google Scholar]
- Luukkonen, T.; Abdollahnejad, Z.; Yliniemi, J.; Kinnunen, P.; Illikainen, M. One-part alkali-activated materials: A review. Cem. Concr. Res. 2018, 103, 21–34. [Google Scholar] [CrossRef]
- Wang, S.-d. Review of recent research on alkali-activated concrete in China. Mag. Concr. Res. 1991, 43, 29–35. [Google Scholar] [CrossRef]
- Won, J.-P.; Kim, J.-M.; Lee, S.-J.; Lee, S.-W.; Park, S.-K. Mix proportion of high-strength, roller-compacted, latex-modified rapid-set concrete for rapid road repair. Constr. Build. Mater. 2011, 25, 1796–1800. [Google Scholar] [CrossRef]
- Singh, B.; Ishwarya, G.; Gupta, M.; Bhattacharyya, S. Geopolymer concrete: A review of some recent developments. Constr. Build. Mater. 2015, 85, 78–90. [Google Scholar] [CrossRef]
- Aleem, M.A.; Arumairaj, P. Geopolymer concrete–A review. Int. J. Eng. Sci. Emerg. Technol. 2012, 1, 118–122. [Google Scholar] [CrossRef]
- Hardjito, D.; Cheak, C.C.; Ing, C.L. Strength and setting times of low calcium fly ash-based geopolymer mortar. Mod. Appl. Sci. 2008, 2, 3–11. [Google Scholar] [CrossRef] [Green Version]
- Hardjito, D.; Wallah, S.E.; Sumajouw, D.M.; Rangan, B.V. Factors influencing the compressive strength of fly ash-based geopolymer concrete. Civ. Eng. Dimens. 2004, 6, 88–93. [Google Scholar]
- Nguyen, K.T.; Le, T.A.; Lee, J.; Lee, D.; Lee, K. Investigation on properties of geopolymer mortar using preheated materials and thermogenetic admixtures. Constr. Build. Mater. 2017, 130, 146–155. [Google Scholar] [CrossRef]
- Deb, P.S.; Nath, P.; Sarker, P.K. The effects of ground granulated blast-furnace slag blending with fly ash and activator content on the workability and strength properties of geopolymer concrete cured at ambient temperature. Mater. Des. (1980–2015) 2014, 62, 32–39. [Google Scholar] [CrossRef] [Green Version]
- Vikas, G.; Rao, T.G. Setting Time, Workability and Strength Properties of Alkali Activated Fly Ash and Slag Based Geopolymer Concrete Activated with High Silica Modulus Water Glass. Iran. J. Sci. Technol. Trans. Civ. Eng. 2021, 45, 1483–1492. [Google Scholar] [CrossRef]
- Li, N.; Shi, C.; Zhang, Z.; Wang, H.; Liu, Y. A review on mixture design methods for geopolymer concrete. Compos. Part B Eng. 2019, 178, 107490. [Google Scholar] [CrossRef]
- Kim, J.T.; Seo, D.S.; Kim, G.J.; Lee, J.K. Effect of Water Glass on Compressive Strength of Aluminosilicate-Based Geopolymer. In Proceedings of Advanced Materials Research; Trans Tech Publications Ltd.: Wollerau, Switzerland, 2010; pp. 2273–2276. [Google Scholar]
- ASTM C618-00; Standard specification for coal fly ash and raw or calcined natural pozzolan for use as a mineral admixture in concrete. Annual Book of ASTM Standards: Philadelphia, PA, USA, 2000.
- Abdul Rahim, R.; Rahmiati, T.; Azizli, K.A.; Man, Z.; Nuruddin, M.F.; Ismail, L. Comparison of using NaOH and KOH activated fly ash-based geopolymer on the mechanical properties. In Proceedings of Materials Science Forum; Trans Tech Publications Ltd.: Wollerau, Switzerland, 2015; pp. 179–184. [Google Scholar]
- ASTM C33/C33M-13; Standard Specification for Concrete Aggregates. ASTM Standards: West Conshohocken, PA, USA, 2013. [CrossRef]
- ASTM D2216; Standard Test Methods for Laboratory Determination of Water (Moisture) Content of Soil and Rock by Mass. Annual Book of ASTM Standards: West Conshohocken, PA, USA, 2010.
- Xie, J.; Wang, J.; Rao, R.; Wang, C.; Fang, C. Effects of combined usage of GGBS and fly ash on workability and mechanical properties of alkali activated geopolymer concrete with recycled aggregate. Compos. Part B Eng. 2019, 164, 179–190. [Google Scholar] [CrossRef]
- Xing, S.; Wu, C. Preparation of magnesium phosphate cement and application in concrete repair. In Proceedings of MATEC Web of Conferences; EDP Sciences: Les Ulis, France, 2018; p. 02007. [Google Scholar]
- Zhu, T.; Dittrich, M. Carbonate precipitation through microbial activities in natural environment, and their potential in biotechnology: A review. Front. Bioeng. Biotechnol. 2016, 4, 4. [Google Scholar] [CrossRef] [Green Version]
- ASTM C109/C109M-11; Standard Test Method for Compressive Strength of Hydraulic Cement Mortars. American Society for Testing and Materials International. ASTM Standards: West Conshohocken, PA, USA, 2011.
- Oner, A.; Akyuz, S. An experimental study on optimum usage of GGBS for the compressive strength of concrete. Cem. Concr. Compos. 2007, 29, 505–514. [Google Scholar] [CrossRef]
- Le Roy, R. The AFREM code type model for creep and shrinkage of high-performance concrete. In Proceedings of the 4th International Symposium on Utilization of High-strength/High-performance Concrete, Paris, France, 29–31 May 1996; pp. 387–396. [Google Scholar]
- Zhu, X.; Tang, D.; Yang, K.; Zhang, Z.; Li, Q.; Pan, Q.; Yang, C. Effect of Ca (OH) 2 on shrinkage characteristics and microstructures of alkali-activated slag concrete. Constr. Build. Mater. 2018, 175, 467–482. [Google Scholar] [CrossRef] [Green Version]
- Görhan, G.; Kürklü, G. The influence of the NaOH solution on the properties of the fly ash-based geopolymer mortar cured at different temperatures. Compos. Part B Eng. 2014, 58, 371–377. [Google Scholar] [CrossRef]
- ASTM C1688; Standard Test Method for Density and Void Content of Freshly Mixed Pervious Concrete. ASTM Standards: West Conshohocken, PA, USA, 2014.
- Phoo-ngernkham, T.; Maegawa, A.; Mishima, N.; Hatanaka, S.; Chindaprasirt, P. Effects of sodium hydroxide and sodium silicate solutions on compressive and shear bond strengths of FA–GBFS geopolymer. Constr. Build. Mater. 2015, 91, 1–8. [Google Scholar] [CrossRef]
- Kaur, M.; Singh, J.; Kaur, M. Synthesis of fly ash based geopolymer mortar considering different concentrations and combinations of alkaline activator solution. Ceram. Int. 2018, 44, 1534–1537. [Google Scholar] [CrossRef]
- Yip, C.; Van Deventer, J. Effect of granulated blast furnace slag on geopolymerisation. In Proceedings of the 6th World Congress of Chemical Engineering, Melbourne, Australia, 23–27 September 2001. [Google Scholar]
- Mallikarjuna Rao, G.; Gunneswara Rao, T. Final setting time and compressive strength of fly ash and GGBS-based geopolymer paste and mortar. Arab. J. Sci. Eng. 2015, 40, 3067–3074. [Google Scholar] [CrossRef]
- Hardjito, D.; Wallah, S.E.; Sumajouw, D.M.; Rangan, B.V. On the development of fly ash-based geopolymer concrete. Mater. J. 2004, 101, 467–472. [Google Scholar]
- Xu, H.; Van Deventer, J. The geopolymerisation of alumino-silicate minerals. Int. J. Miner. Process. 2000, 59, 247–266. [Google Scholar] [CrossRef] [Green Version]
- Jurinak, J.; Summers, L. Oilfield applications of colloidal silica gel. SPE Prod. Eng. 1991, 6, 406–412. [Google Scholar] [CrossRef]
- Hamouda, A.A.; Akhlaghi Amiri, H.A. Factors affecting alkaline sodium silicate gelation for in-depth reservoir profile modification. Energies 2014, 7, 568–590. [Google Scholar] [CrossRef]
- Zhu, T.; Lin, Y.; Lu, X.; Dittrich, M. Assessment of cyanobacterial species for carbonate precipitation on mortar surface under different conditions. Ecol. Eng. 2018, 120, 154–163. [Google Scholar] [CrossRef]
- Yang, K.-H.; Song, J.-K.; Ashour, A.F.; Lee, E.-T. Properties of cementless mortars activated by sodium silicate. Constr. Build. Mater. 2008, 22, 1981–1989. [Google Scholar] [CrossRef] [Green Version]
- Chindaprasirt, P.; De Silva, P.; Sagoe-Crentsil, K.; Hanjitsuwan, S. Effect of SiO2 and Al2O3 on the setting and hardening of high calcium fly ash-based geopolymer systems. J. Mater. Sci. 2012, 47, 4876–4883. [Google Scholar] [CrossRef]
- Prusty, J.K.; Pradhan, B. Investigation on effect of precursor materials and sand-to-binder ratio on strength development, acid resistance and microstructure evolution of geopolymer mortar. Constr. Build. Mater. 2022, 346, 128501. [Google Scholar] [CrossRef]
- Ismail, I.; Bernal, S.A.; Provis, J.L.; San Nicolas, R.; Hamdan, S.; van Deventer, J.S. Modification of phase evolution in alkali-activated blast furnace slag by the incorporation of fly ash. Cem. Concr. Compos. 2014, 45, 125–135. [Google Scholar] [CrossRef]
- Raza, A.; El Ouni, M.H.; Azab, M.; Ali, K.; Haider, H.; Rashedi, A. A scientometric review on mechanical and durability performance of geopolymer Paste: Effect of various raw materials. Constr. Build. Mater. 2022, 345, 128297. [Google Scholar] [CrossRef]
- Wongpa, J.; Kiattikomol, K.; Jaturapitakkul, C.; Chindaprasirt, P. Compressive strength, modulus of elasticity, and water permeability of inorganic polymer concrete. Mater. Des. 2010, 31, 4748–4754. [Google Scholar] [CrossRef]
- Rafeet, A.; Vinai, R.; Soutsos, M.; Sha, W. Effects of slag substitution on physical and mechanical properties of fly ash-based alkali activated binders (AABs). Cem. Concr. Res. 2019, 122, 118–135. [Google Scholar] [CrossRef]
- Zhang, Z.; Li, L.; Ma, X.; Wang, H. Compositional, microstructural and mechanical properties of ambient condition cured alkali-activated cement. Constr. Build. Mater. 2016, 113, 237–245. [Google Scholar] [CrossRef]
- Yost, J.R.; Radlińska, A.; Ernst, S.; Salera, M.; Martignetti, N.J. Structural behavior of alkali activated fly ash concrete. Part 2: Structural testing and experimental findings. Mater. Struct. 2013, 46, 449–462. [Google Scholar] [CrossRef]
- Gopalakrishnan, R.; Chinnaraju, K. Durability of ambient cured alumina silicate concrete based on slag/fly ash blends against sulfate environment. Constr. Build. Mater. 2019, 204, 70–83. [Google Scholar] [CrossRef]
- Bakharev, T. Resistance of geopolymer materials to acid attack. Cem. Concr. Res. 2005, 35, 658–670. [Google Scholar] [CrossRef]
- Huseien, G.F.; Mirza, J.; Ismail, M.; Hussin, M.W. Influence of different curing temperatures and alkali activators on properties of GBFS geopolymer mortars containing fly ash and palm-oil fuel ash. Constr. Build. Mater. 2016, 125, 1229–1240. [Google Scholar] [CrossRef]
- Falayi, T. A comparison between fly ash-and basic oxygen furnace slag-modified gold mine tailings geopolymers. Int. J. Energy Environ. Eng. 2020, 11, 207–217. [Google Scholar] [CrossRef] [Green Version]
- Huseien, G.F.; Mirza, J.; Ismail, M.; Ghoshal, S.; Hussein, A.A. Geopolymer mortars as sustainable repair material: A comprehensive review. Renew. Sustain. Energy Rev. 2017, 80, 54–74. [Google Scholar] [CrossRef]
- ASTM E119-18C; Standard Test Methods for Fire Tests of Building Construction and Materials. ASTM International: West Conshohocken, PA, USA, 2018.
- Peng, G.-F.; Bian, S.-H.; Guo, Z.-Q.; Zhao, J.; Peng, X.-L.; Jiang, Y.-C. Effect of thermal shock due to rapid cooling on residual mechanical properties of fiber concrete exposed to high temperatures. Constr. Build. Mater. 2008, 22, 948–955. [Google Scholar] [CrossRef]
- Fletcher, I.A.; Welch, S.; Torero, J.L.; Carvel, R.O.; Usmani, A. Behaviour of concrete structures in fire. Therm. Sci. 2007, 11, 37–52. [Google Scholar] [CrossRef]
- Mehta, P.K.; Monteiro, P.J. Concrete: Microstructure, Properties, and Materials; McGraw-Hill Education: New York, NY, USA, 2014. [Google Scholar]
- Mehta, A.; Siddique, R.; Ozbakkaloglu, T.; Shaikh, F.U.A.; Belarbi, R. Fly ash and ground granulated blast furnace slag-based alkali-activated concrete: Mechanical, transport and microstructural properties. Constr. Build. Mater. 2020, 257, 119548. [Google Scholar] [CrossRef]
- Sudarshan, D.K.; Vyas, A. Impact of fire on mechanical properties of concrete containing marble waste. J. King Saud Univ.-Eng. Sci. 2019, 31, 42–51. [Google Scholar] [CrossRef]


| Specification of Liquid Sodium Silicate (Na2SiO3), | Quantity (%) |
|---|---|
| Specific Weight | 1.526 g/cm3 |
| SiO2% | 28–30 |
| Na2O% | 9–10 |
| Fe% | Under 0.02 |
| pH value | 12.00 |
| Chemical Composition (% by Mass) | SiO2 | Al2O3 | Fe2O3 | SO3 | CaO | As | S | Pb | Loss on Ignition |
|---|---|---|---|---|---|---|---|---|---|
| Class-F fly ash (FA) | 58.58 | 25.47 | 2.37 | 0.96 | 0.00 | 6.36 | 0.96 | 5.63 | 0.63 |
| S-4000 GGBS | 21.64 | 8.53 | 0.81 | 0.91 | 68.11 | - | - | - | 0.11 |
| Material Type | Property | Results |
|---|---|---|
| Class-F fly ash | Specific gravity (ASTM C618-16) | 1.45 |
| S-4000 ground granulated blast furnace slag (GGBS) | Specific gravity (ASTM C618-16) | 2.59 |
| Natural river sand | Specific gravity (ASTM C128-15) | 2.63 (SSD) 2.76 (OD) |
| Natural river sand | Water absorption (%) (ASTM C128-15) | 2.88 |
| Natural river sand | Fineness modulus (ASTM C33/C33M-13) | 2.63 |
| Specimen ID | FA-to-GGBS Ratio (Mass) | FA (g) | GGBS (g) | SS Solution (g) | SH-10M (g) | SS-to-SH Ratio | Preheated Sand | Ct (Oven) | Cp (h) | Al-to-Bi Ratio (Mass) | Li-to-S Ratio (Mass) | Bi-to-S Ratio (Mass) | MR SiO2 to Al2O3 | MR CaO to SiO2 | |
|---|---|---|---|---|---|---|---|---|---|---|---|---|---|---|---|
| Phase 1 | 10M-GPM-0 | 1:1 | 185.6 | 185.6 | - | 269.67 | - | (25 ± 2 °C) | 50 °C | 1, 2, 3, 24 | 0.726 | 0.30 | 0.42 | 2.36 | 0.85 |
| 10M-GPM-50 | 1:1 | 185.6 | 185.6 | - | 269.67 | - | 50 °C | 50 °C | “ | 0.726 | 0..30 | 0.42 | 2.36 | 0.85 | |
| 10M-GPM-65 | 1:1 | 185.6 | 185.6 | - | 269.67 | - | 65 °C | 50 °C | “ | 0.726 | 0.30 | 0.42 | 2.36 | 0.85 | |
| 10M-GPM-80 | 1:1 | 185.6 | 185.6 | - | 269.67 | - | 80 °C | 50 °C | “ | 0.726 | 0.30 | 0.42 | 2.36 | 0.85 | |
| 10M-GPM-100 | 1:1 | 185.6 | 185.6 | - | 269.67 | - | 100 °C | 50 °C | “ | 0.726 | 0.30 | 0.42 | 2.36 | 0.85 | |
| 10M-GPM-110 | 1:1 | 185.6 | 185.6 | - | 269.67 | - | 110 °C | 50 °C | “ | 0.726 | 0.30 | 0.42 | 2.36 | 0.85 | |
| 10M-GPM-120 | 1:1 | 185.6 | 185.6 | - | 269.67 | - | 120 °C | 50 °C | “ | 0.726 | 0.30 | 0.42 | 2.36 | 0.85 | |
| 10M-GPM-135 | 1:1 | 185.6 | 185.6 | - | 269.67 | - | 135 °C | 50 °C | “ | 0.726 | 0.30 | 0.42 | 2.36 | 0.85 | |
| Series A | |||||||||||||||
| Phase 2 | GPM-3H-A1 | 1:1 | 185.6 | 185.6 | 0 | 269.67 | 0% | 110 °C | 50 °C | 3 h | 0.726 | 0.30 | 0.42 | 2.36 | 0.85 |
| GPM-3H-A2 | 1:1 | 185.6 | 185.6 | 13.4 | 256.27 | 5% | 110 °C | 50 °C | “ | 0.726 | 0.30 | 0.42 | 2.41 | 0.83 | |
| GPM-3H-A3 | 1:1 | 185.6 | 185.6 | 26.96 | 242.71 | 10% | 110 °C | 50 °C | “ | 0.726 | 0.30 | 0.42 | 2.46 | 0.81 | |
| GPM-3H-A4 | 1:1 | 185.6 | 185.6 | 53.93 | 215.74 | 20% | 110 °C | 50 °C | “ | 0.726 | 0.30 | 0.42 | 2.57 | 0.78 | |
| GPM-3H-A5 | 1:1 | 185.6 | 185.6 | 80.89 | 188.78 | 30% | 110 °C | 50 °C | “ | 0.726 | 0.30 | 0.42 | 2.67 | 0.75 | |
| Series B | |||||||||||||||
| Phase 2 | GPM-3H-B1 | 1:2 | 123.73 | 247.46 | 0 | 269.67 | 0% | 110 °C | 50 °C | “ | 0.726 | 0.30 | 0.42 | 2.4 | 1.34 |
| GPM-3H-B2 | 1:2 | 123.73 | 247.46 | 13.4 | 256.27 | 5% | 110 °C | 50 °C | “ | 0.726 | 0.30 | 0.42 | 2.46 | 1.30 | |
| GPM-3H-B3 | 1:2 | 123.73 | 247.46 | 26.96 | 242.71 | 10% | 110 °C | 50 °C | “ | 0.726 | 0.30 | 0.42 | 2.52 | 1.27 | |
| GPM-3H-B4 | 1:2 | 123.73 | 247.46 | 53.93 | 215.74 | 20% | 110 °C | 50 °C | “ | 0.726 | 0.30 | 0.42 | 2.64 | 1.21 | |
| GPM-3H-B5 | 1:2 | 123.73 | 247.46 | 80.89 | 188.78 | 30% | 110 °C | 50 °C | “ | 0.726 | 0.30 | 0.42 | 2.77 | 1.16 | |
| Series C | |||||||||||||||
| Phase 2 | GPM-3H-C1 | 1:3 | 92.8 | 278.4 | 0 | 269.67 | 0% | 110 °C | 50 °C | “ | 0.726 | 0.30 | 0.42 | 2.42 | 1.65 |
| GPM-3H-C2 | 1:3 | 92.8 | 278.4 | 13.4 | 256.27 | 5% | 110 °C | 50 °C | “ | 0.726 | 0.30 | 0.42 | 2.49 | 1.61 | |
| GPM-3H-C3 | 1:3 | 92.8 | 278.4 | 26.96 | 242.71 | 10% | 110 °C | 50 °C | “ | 0.726 | 0.30 | 0.42 | 2.56 | 1.57 | |
| GPM-3H-C4 | 1:3 | 92.8 | 278.4 | 53.93 | 215.74 | 20% | 110 °C | 50 °C | “ | 0.726 | 0.30 | 0.42 | 2.69 | 1.49 | |
| GPM-3H-C5 | 1:3 | 92.8 | 278.4 | 80.89 | 188.78 | 30% | 110 °C | 50 °C | “ | 0.726 | 0.30 | 0.42 | 2.83 | 1.41 | |
| Specimen ID | Flow (mm) | Compressive Strength (MPa) | |||
|---|---|---|---|---|---|
| 1 h | 2 h | 3 h | 24 h | ||
| 10M-GPM-0 | 182.00 | 3.06 | 12.83 | 19.82 | 24.99 |
| 10M-GPM-50 | 180.00 | 4.71 | 18.07 | 28.35 | 35.18 |
| 10M-GPM-65 | 178.00 | 7.30 | 22.21 | 31.00 | 40.57 |
| 10M-GPM-80 | 175.00 | 7.89 | 22.84 | 31.92 | 44.50 |
| 10M-GPM-100 | 171.00 | 14.69 | 26.13 | 33.71 | 45.60 |
| 10M-GPM-110 | 168.0 | 17.23 | 29.19 | 42.31 | 51.36 |
| 10M-GPM-120 | 165.00 | 13.58 | 27.86 | 36.90 | 48.18 |
| 10M-GPM-135 | 161.50 | 8.08 | 21.03 | 29.19 | 37.92 |
| Sr. No | Mix ID | FA-to-GGBS (by Mass) | Na2SiO3-to-NaOH (SS-to-SH) (by Mass) | Initial Setting Time (min) | Final Setting Time (min) | Flow Rate (%) | SiO2 to Al2O3 | CaO to SiO2 | f’c (Mean) in 3 h (MPa) | SD | CoV (%) |
|---|---|---|---|---|---|---|---|---|---|---|---|
| Series A | |||||||||||
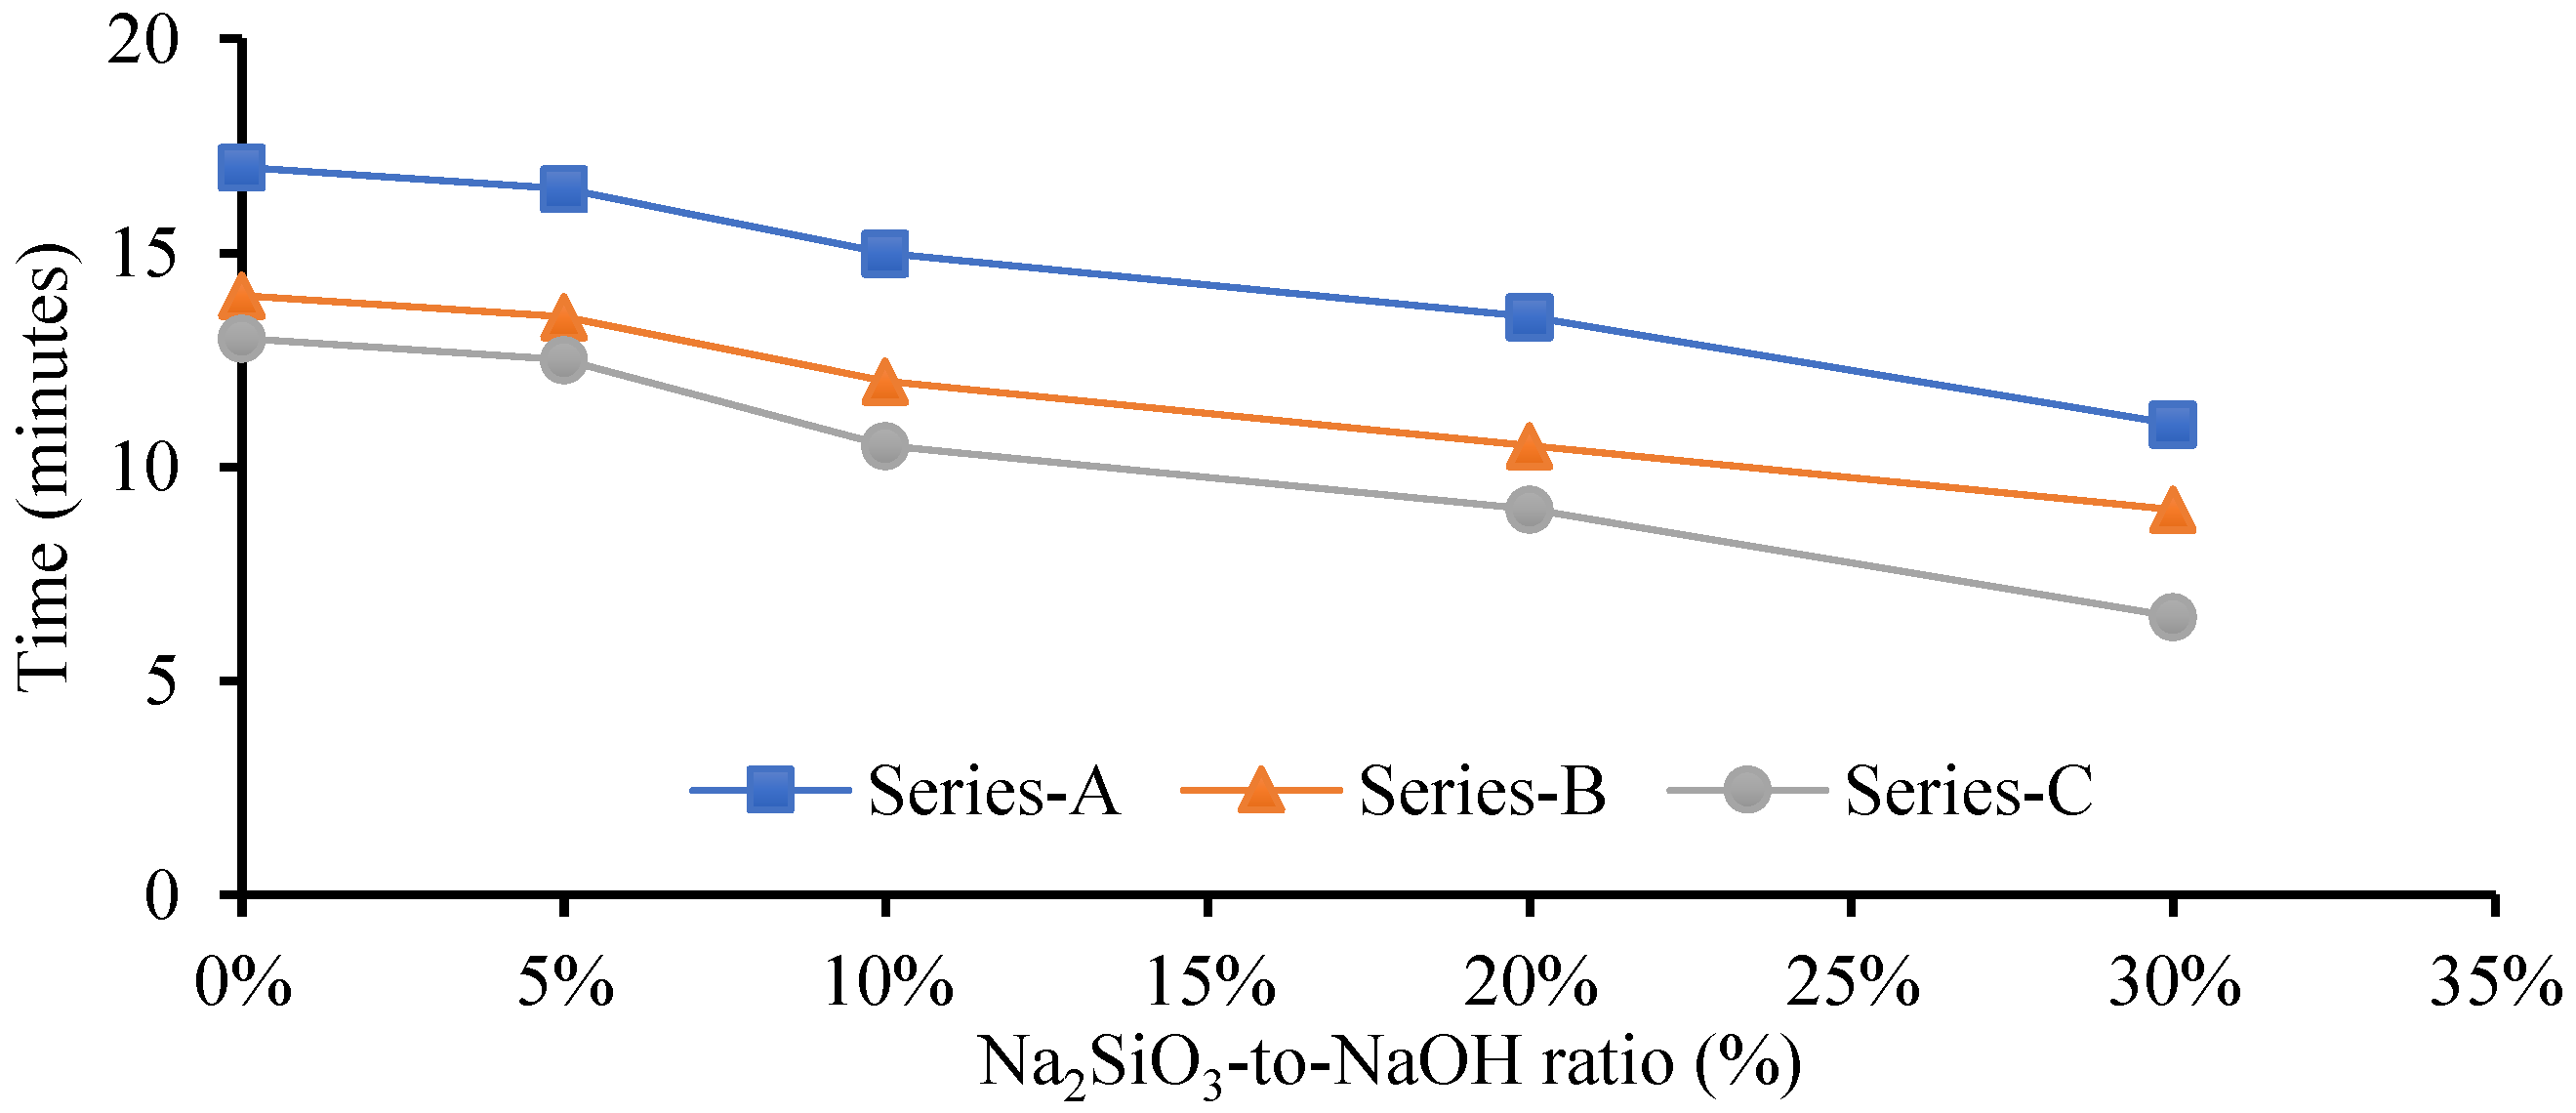
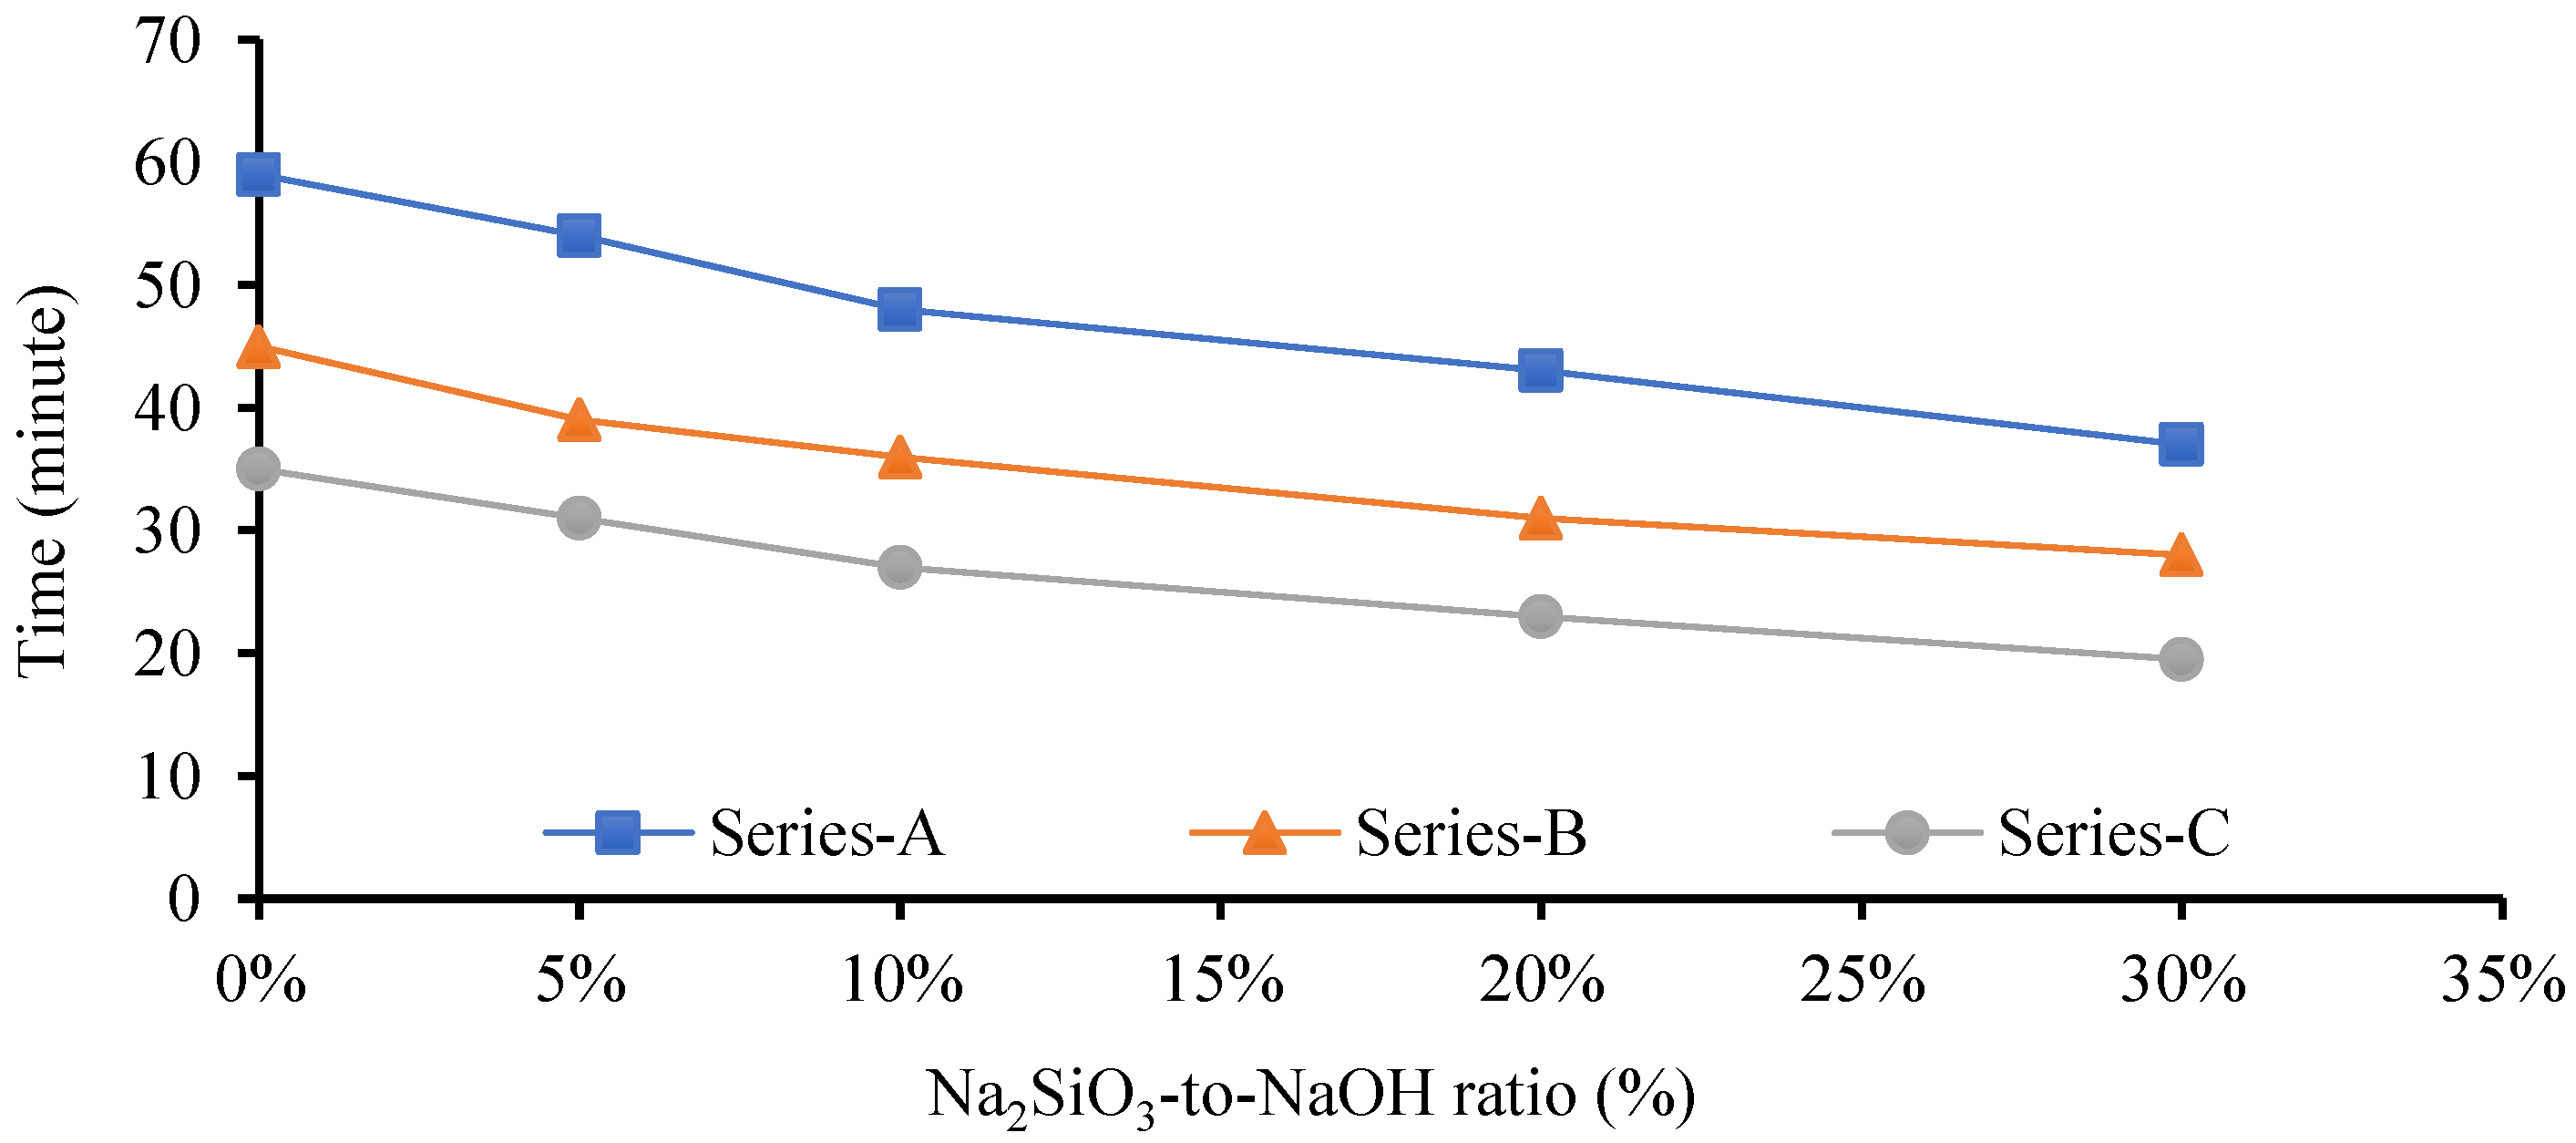
| 1 | GPM-3H-A1 | (1:1) | 0% | 17 | 59 | 37.0 | 2.36 | 0.85 | 42.31 | 1.3 | 3.07 |
| 2 | GPM-3H-A2 | (1:1) | 5% | 16.5 | 54 | 36.5 | 2.41 | 0.83 | 45.61 | 1.07 | 2.35 |
| 3 | GPM-3H-A3 | (1:1) | 10% | 15 | 48 | 34.5 | 2.46 | 0.81 | 44.14 | 0.266 | 0.59 |
| 4 | GPM-3H-A4 | (1:1) | 20% | 13.5 | 43 | 33.0 | 2.57 | 0.78 | 37.88 | 1.21 | 3.21 |
| 5 | GPM-3H-A5 | (1:1) | 30% | 11.5 | 37 | 30.5 | 2.67 | 0.75 | 32.04 | 1.97 | 6.15 |
| Series B | |||||||||||
| 1 | GPM-3H-B1 | (1:2) | 0% | 14 | 45 | 34.0 | 2.4 | 1.34 | 44.59 | 2.05 | 4.60 |
| 2 | GPM-3H-B2 | (1:2) | 5% | 13.5 | 39 | 33.0 | 2.46 | 1.30 | 48.61 | 0.71 | 1.45 |
| 3 | GPM-3H-B3 | (1:2) | 10% | 12 | 36 | 32.0 | 2.52 | 1.27 | 45.89 | 1.51 | 3.29 |
| 4 | GPM-3H-B4 | (1:2) | 20% | 10.5 | 31 | 30.0 | 2.64 | 1.21 | 41.02 | 1.45 | 3.54 |
| 5 | GPM-3H-B5 | (1:2) | 30% | 9.0 | 28 | 27.5 | 2.77 | 1.16 | 38.12 | 1.28 | 3.37 |
| Series C | |||||||||||
| 1 | GPM-3H-C1 | (1:3) | 0% | 13.0 | 35 | 31.0 | 2.42 | 1.65 | 45.95 | 0.99 | 2.14 |
| 2 | GPM-3H-C2 | (1:3) | 5% | 12.5 | 31 | 30.5 | 2.49 | 1.61 | 52.52 | 1.92 | 3.65 |
| 3 | GPM-3H-C3 | (1:3) | 10% | 10.5 | 27 | 28.0 | 2.56 | 1.57 | 46.70 | 5.10 | 10.92 |
| 4 | GPM-3H-C4 | (1:3) | 20% | 9.0 | 23 | 29.0 | 2.69 | 1.49 | 40.6 | 1.28 | 3.14 |
| 5 | GPM-3H-C5 | (1:3) | 30% | 7.5 | 19.5 | 25.5 | 2.83 | 1.41 | 35.55 | 1.41 | 3.96 |
Disclaimer/Publisher’s Note: The statements, opinions and data contained in all publications are solely those of the individual author(s) and contributor(s) and not of MDPI and/or the editor(s). MDPI and/or the editor(s) disclaim responsibility for any injury to people or property resulting from any ideas, methods, instructions or products referred to in the content. |
© 2023 by the authors. Licensee MDPI, Basel, Switzerland. This article is an open access article distributed under the terms and conditions of the Creative Commons Attribution (CC BY) license (https://creativecommons.org/licenses/by/4.0/).
Share and Cite
Bhina, M.R.; Liu, K.-Y.; Hu, J.-E.H.-Y.; Tsai, C.-T. Investigation of the Mechanical Properties of Quick-Strength Geopolymer Material Considering Preheated-to-Room Temperature Ratio of Sand, Na2SiO3-to-NaOH Ratio, and Fly Ash-to-GGBS Ratio. Polymers 2023, 15, 1084. https://doi.org/10.3390/polym15051084
Bhina MR, Liu K-Y, Hu J-EH-Y, Tsai C-T. Investigation of the Mechanical Properties of Quick-Strength Geopolymer Material Considering Preheated-to-Room Temperature Ratio of Sand, Na2SiO3-to-NaOH Ratio, and Fly Ash-to-GGBS Ratio. Polymers. 2023; 15(5):1084. https://doi.org/10.3390/polym15051084
Chicago/Turabian StyleBhina, Mohammad Rizwan, Kuang-Yen Liu, John-Eric Hsin-Yu Hu, and Chih-Ta Tsai. 2023. "Investigation of the Mechanical Properties of Quick-Strength Geopolymer Material Considering Preheated-to-Room Temperature Ratio of Sand, Na2SiO3-to-NaOH Ratio, and Fly Ash-to-GGBS Ratio" Polymers 15, no. 5: 1084. https://doi.org/10.3390/polym15051084