
Analysis of the Effect of Fiber Orientation on Mechanical and Elastic Characteristics at Axial Stresses of GFRP Used in Wind Turbine Blades


 ,
, 
Abstract
:1. Introduction
2. Materials and Methods
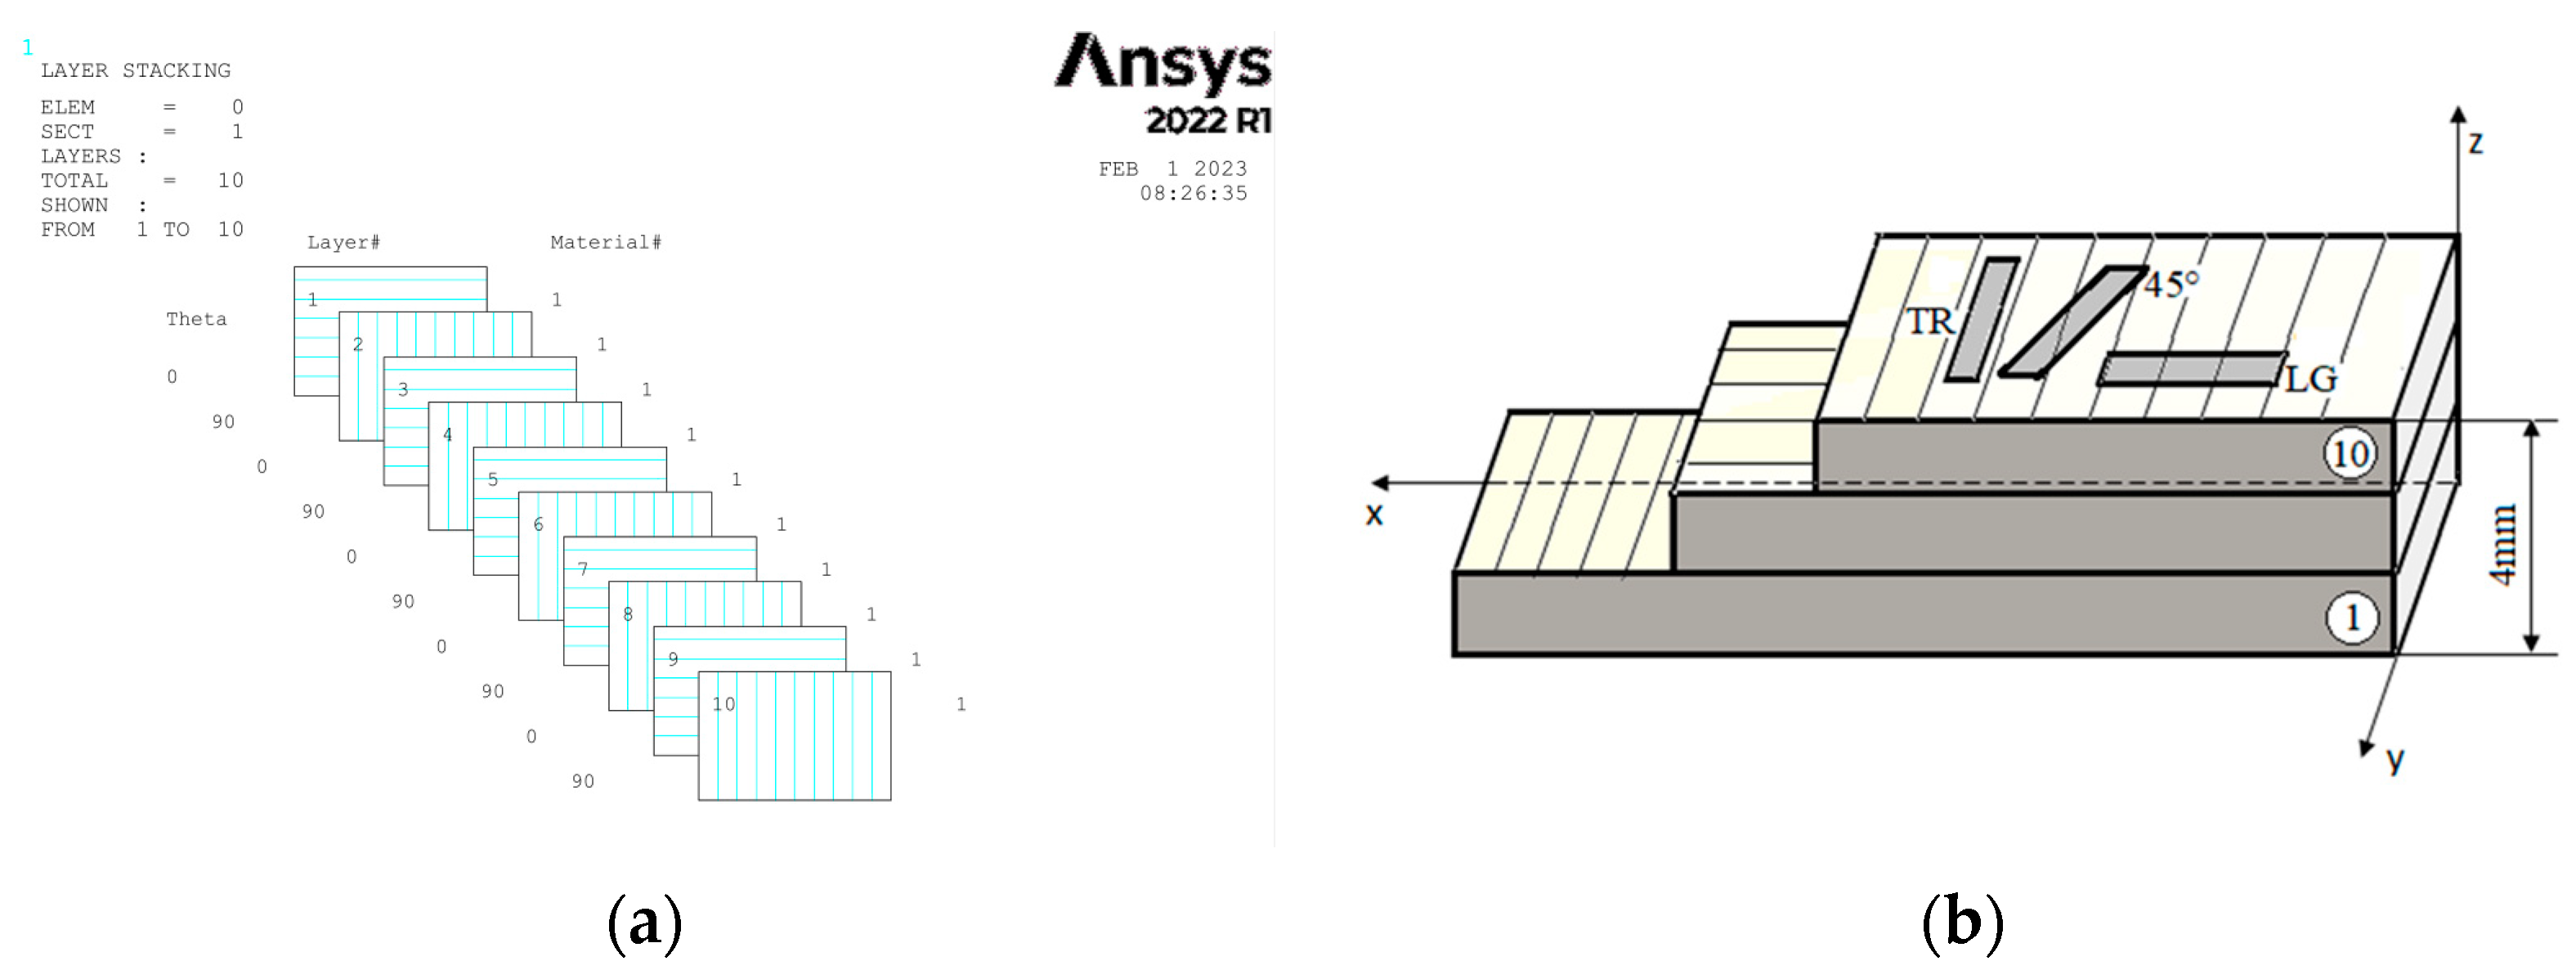
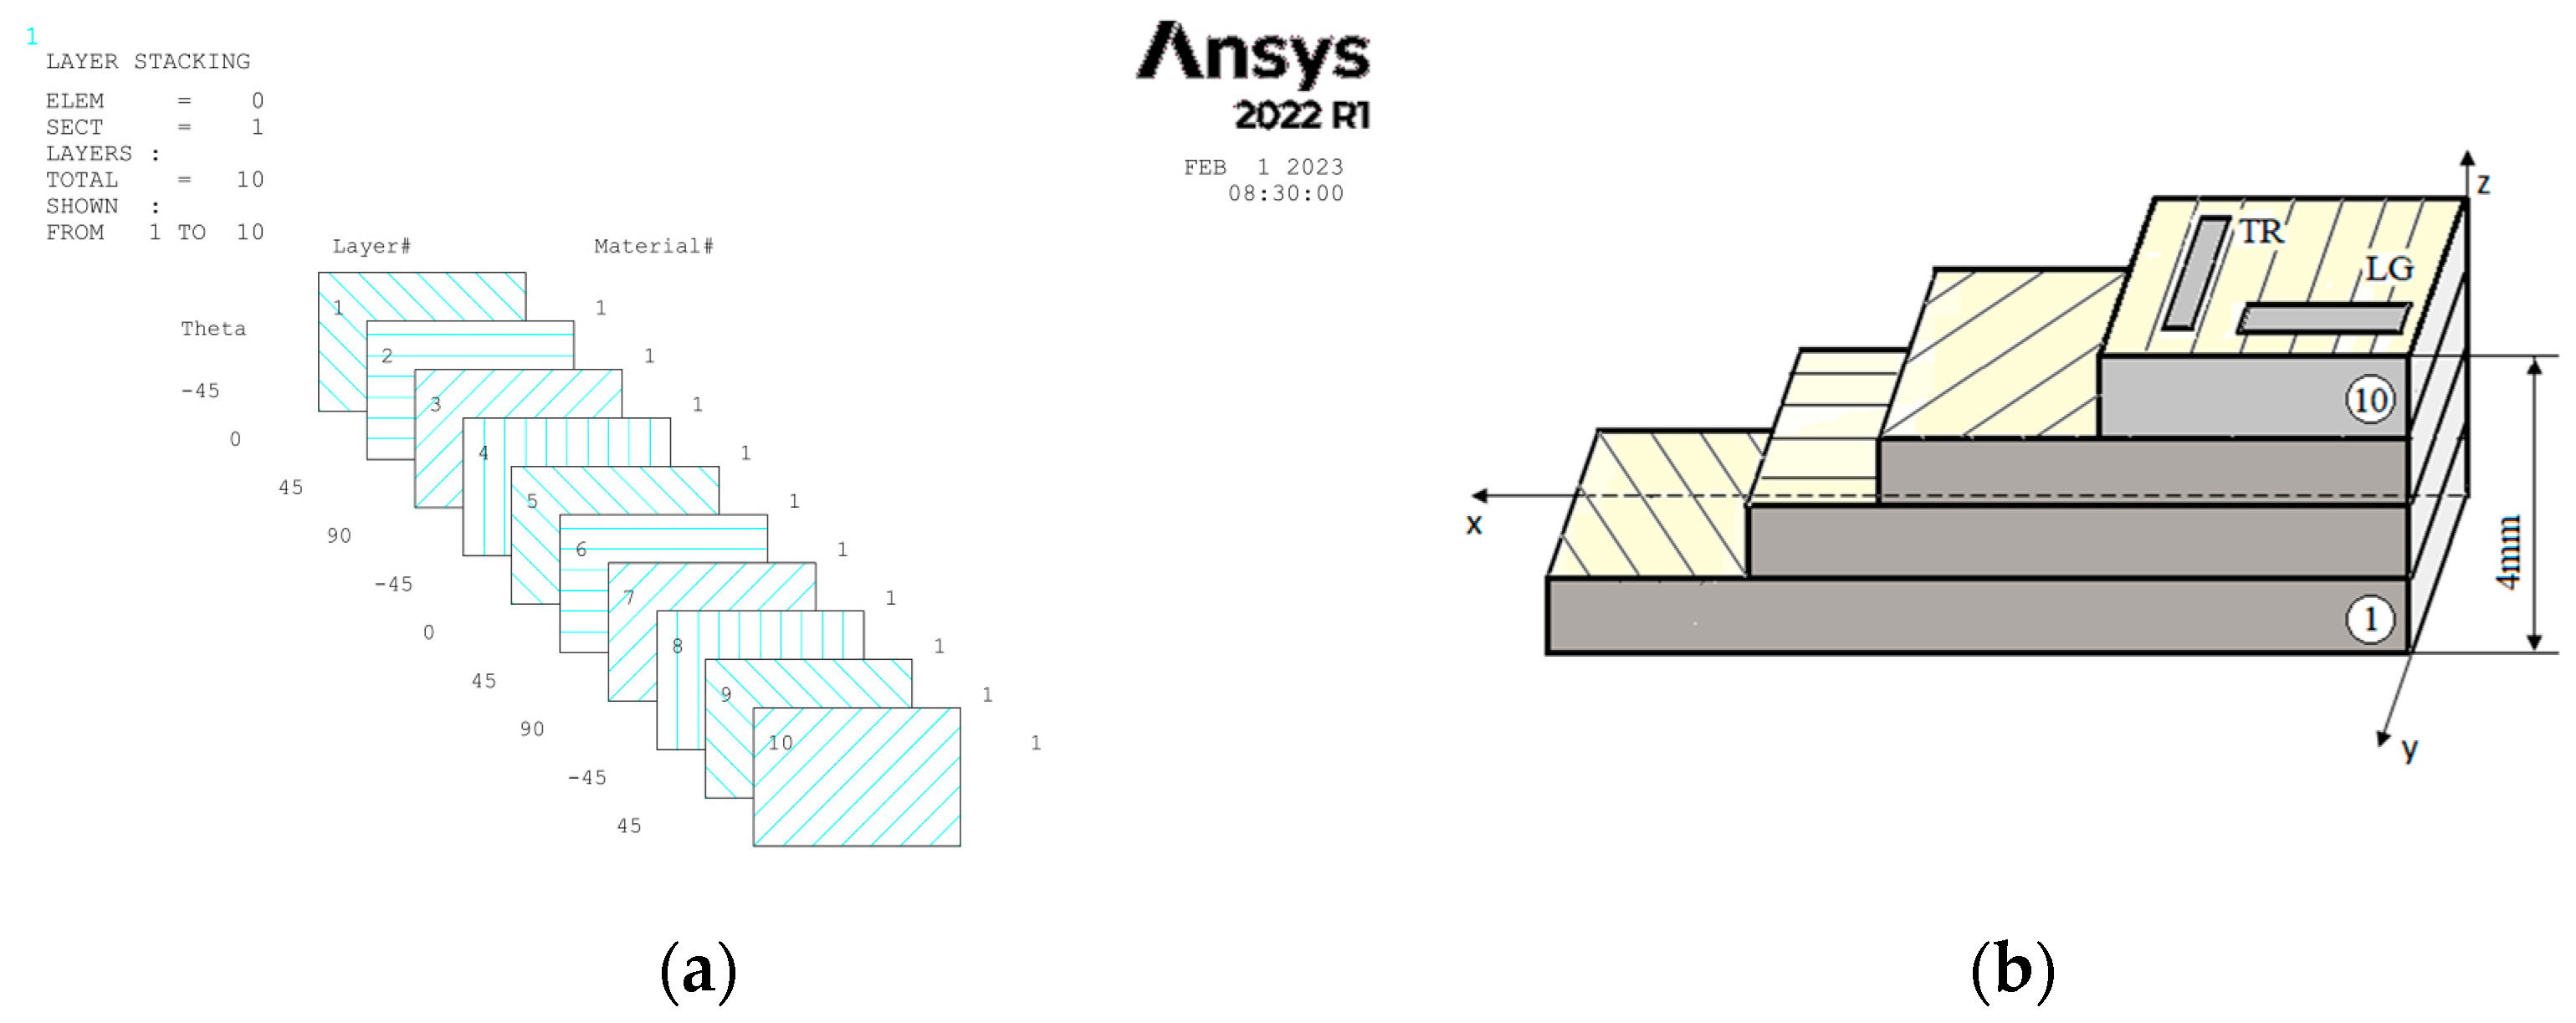
2.1. Materials
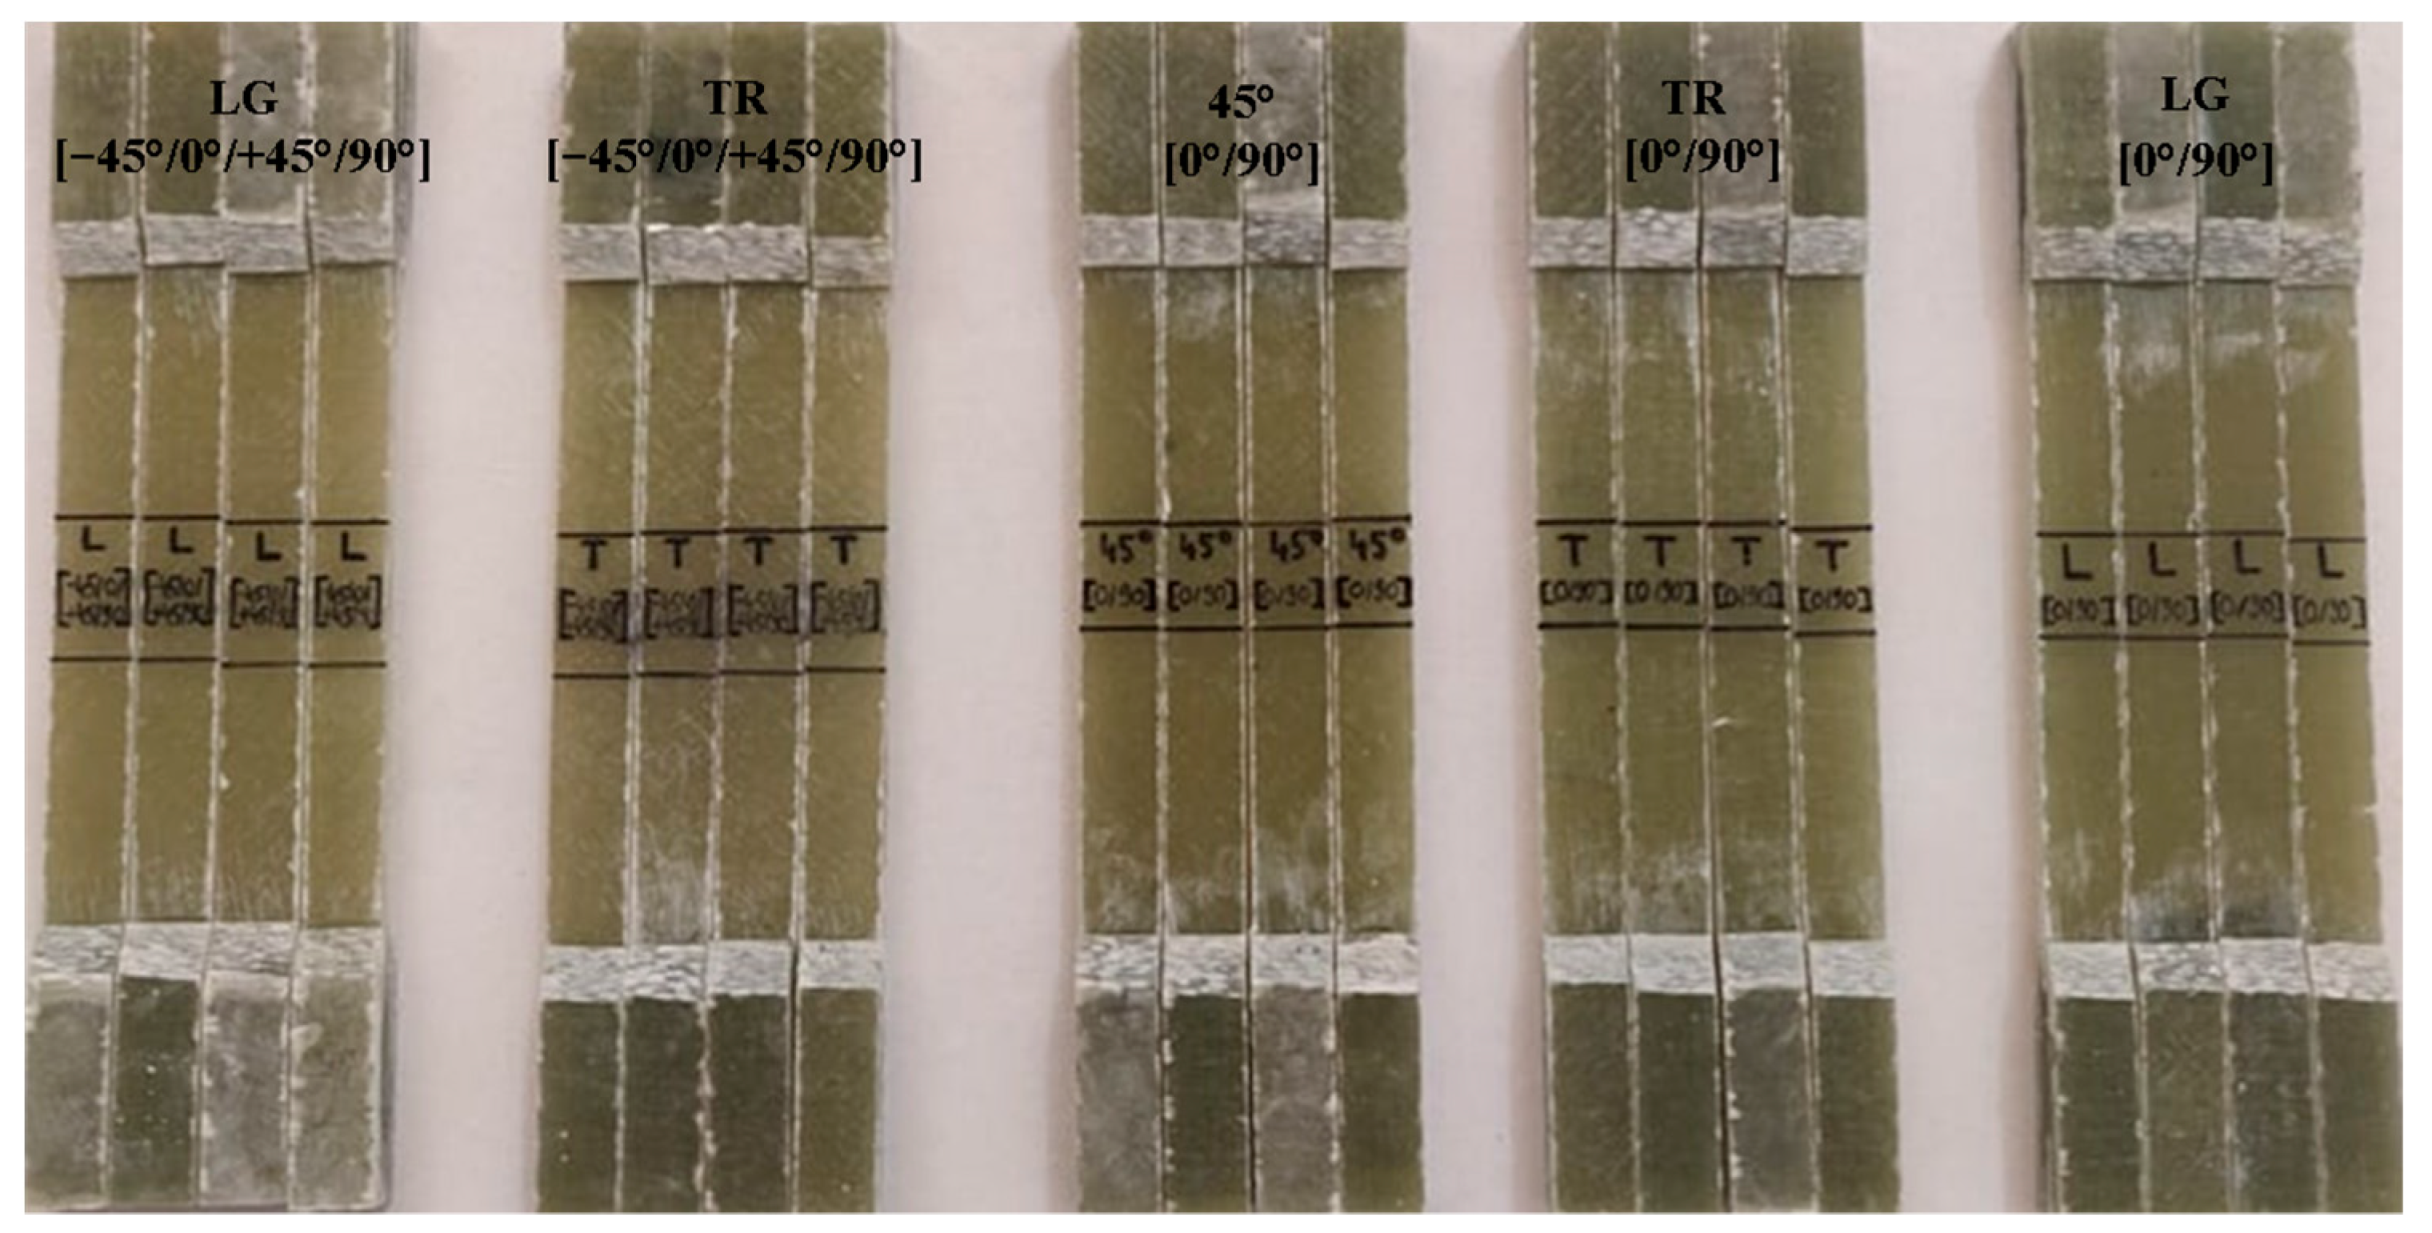
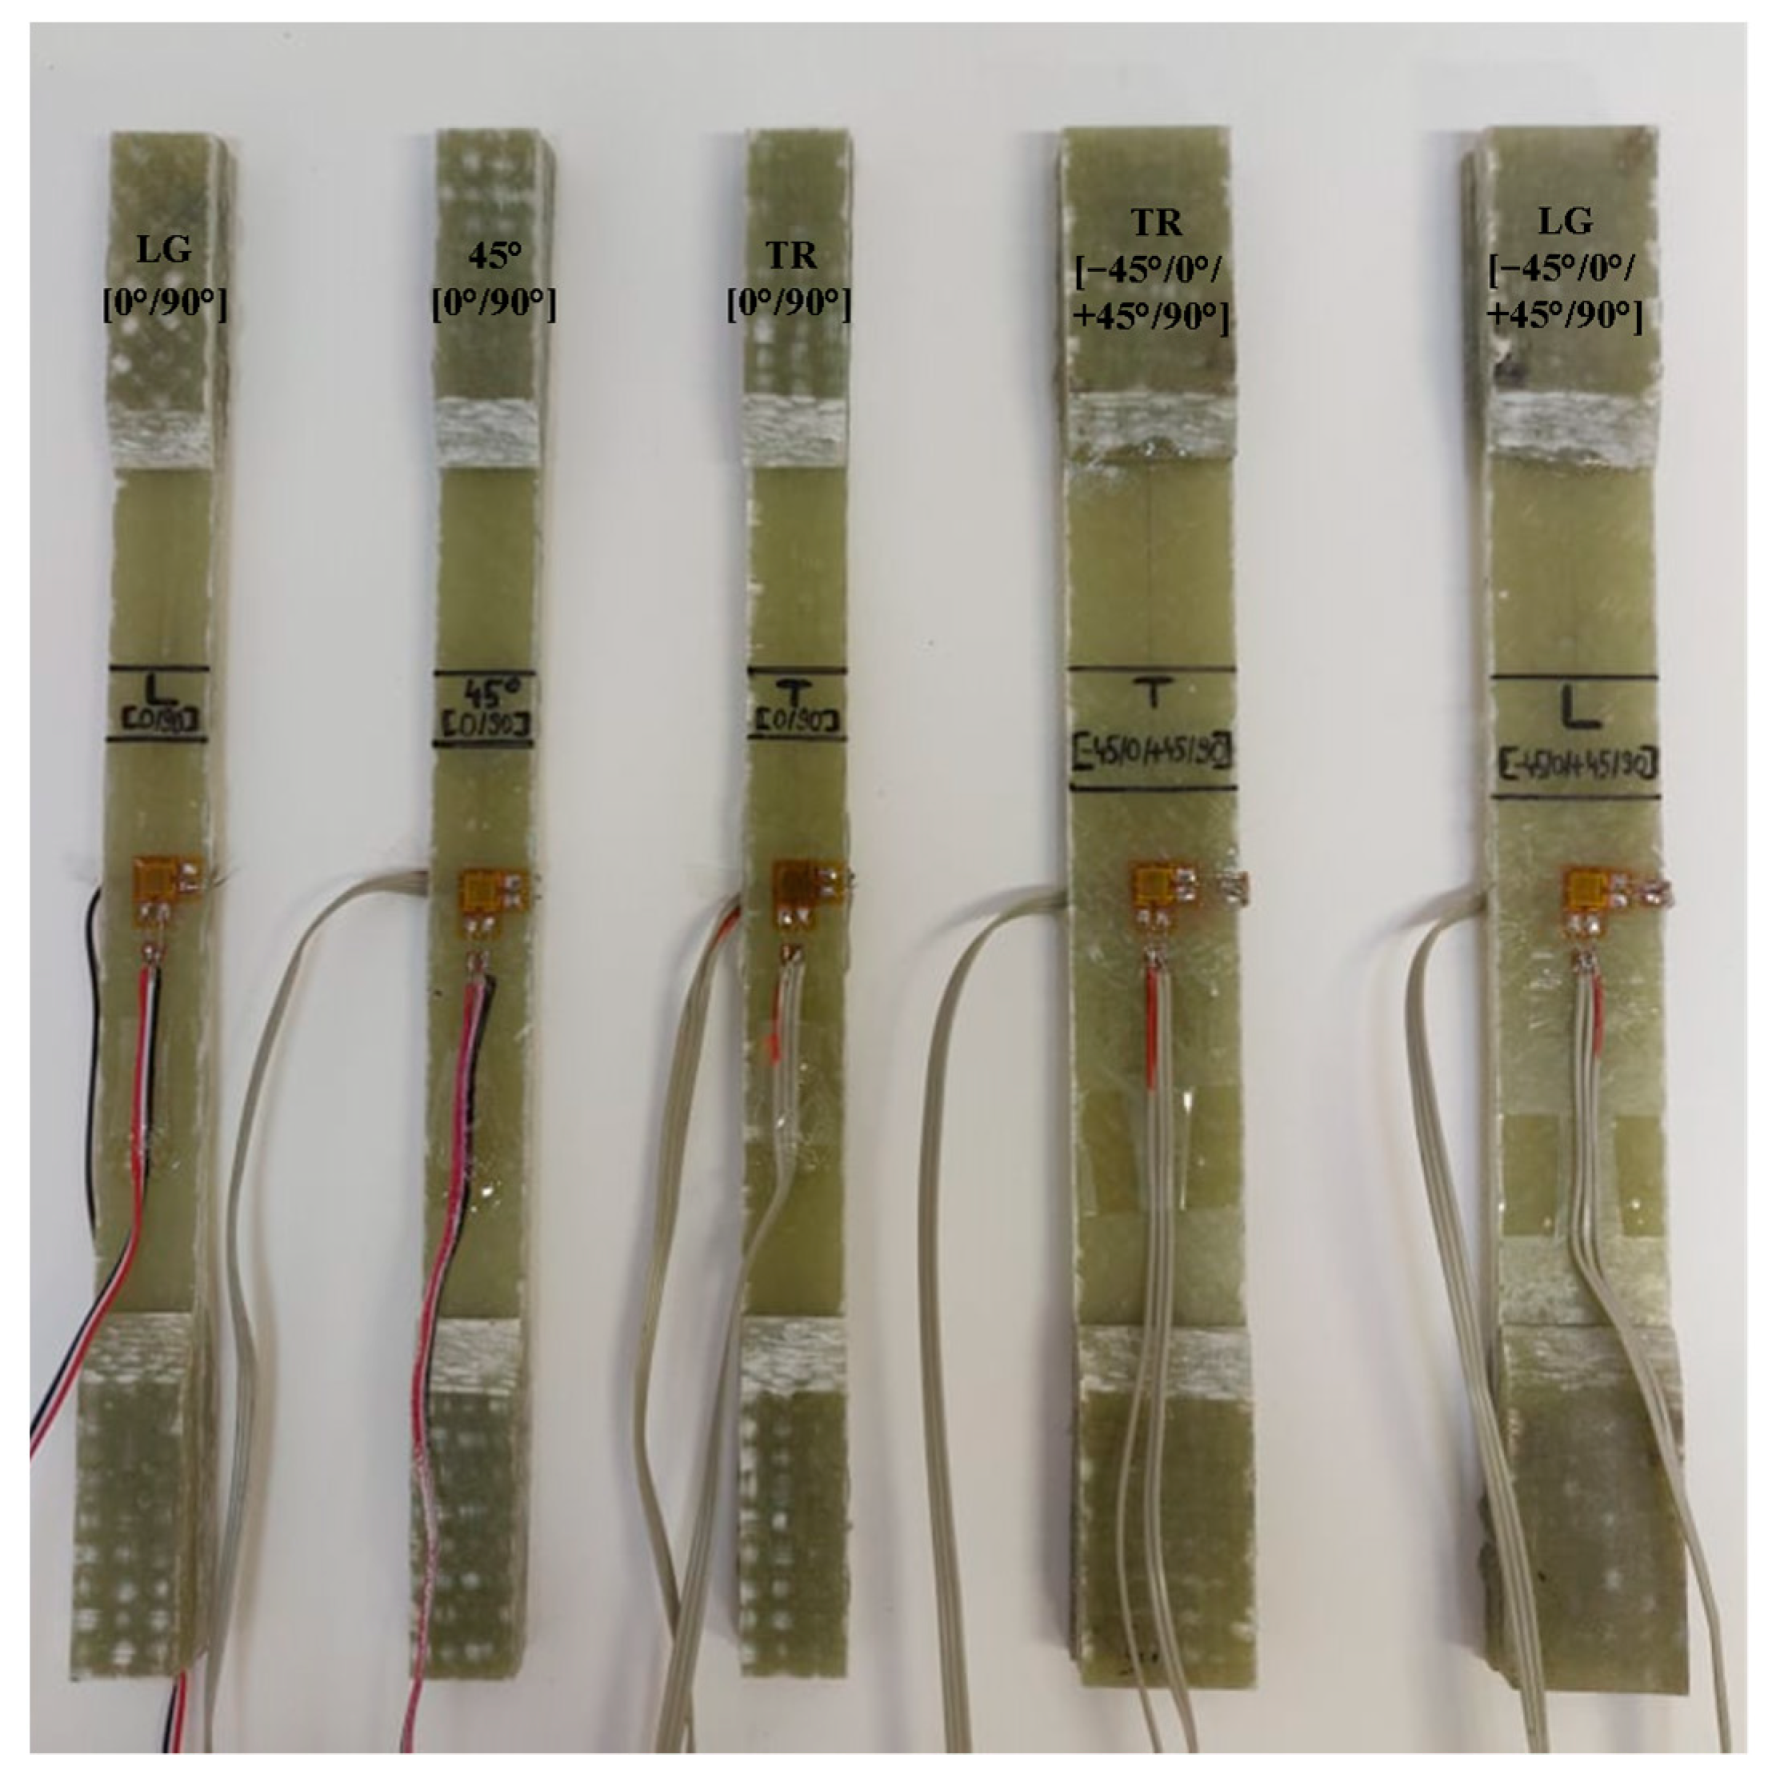
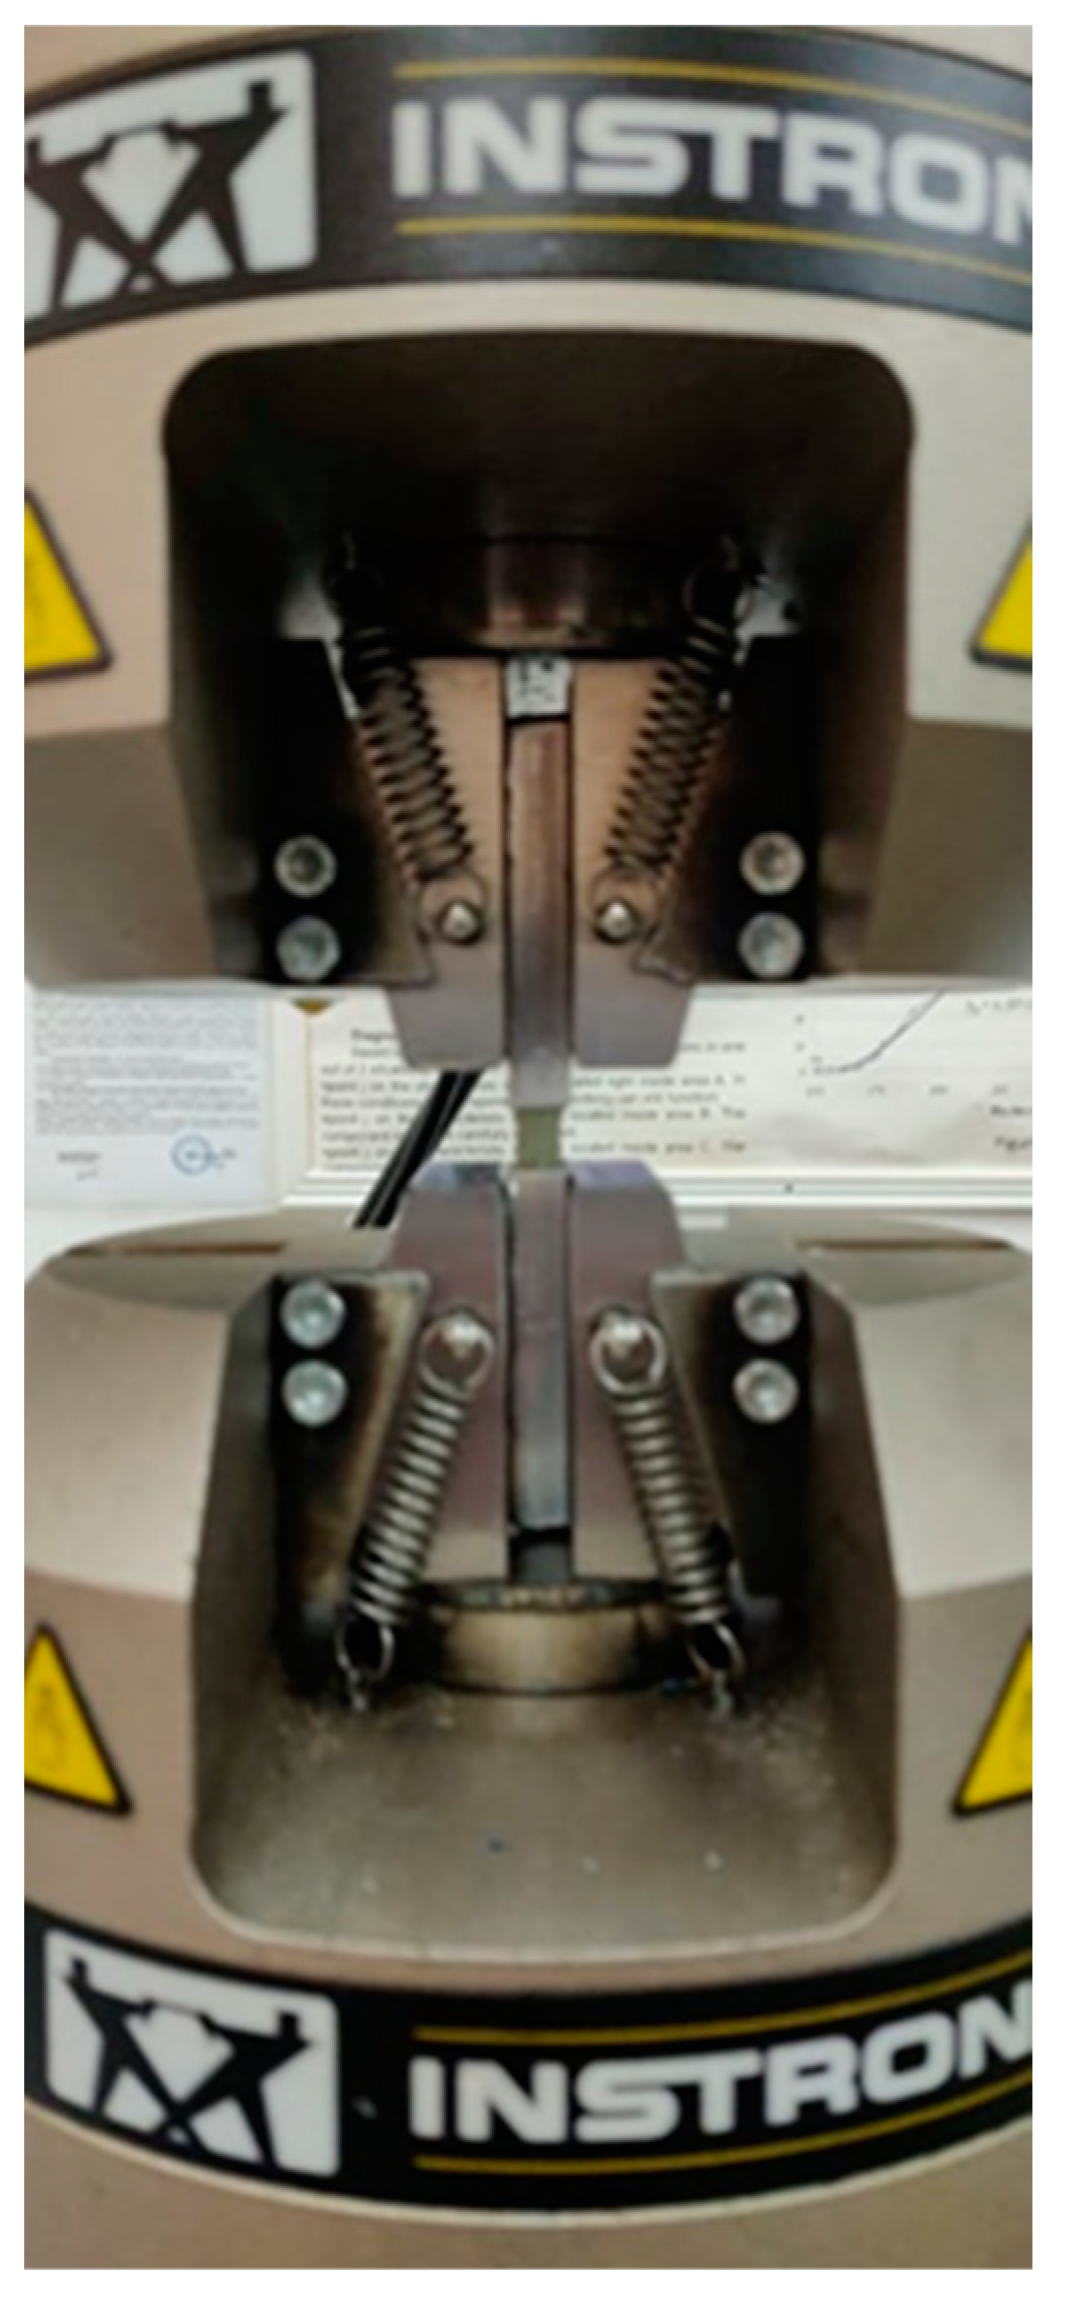
2.2. Tensile Tests
2.3. Compression Tests
2.4. Electron Microscopy Analyses (SEM)
3. Results
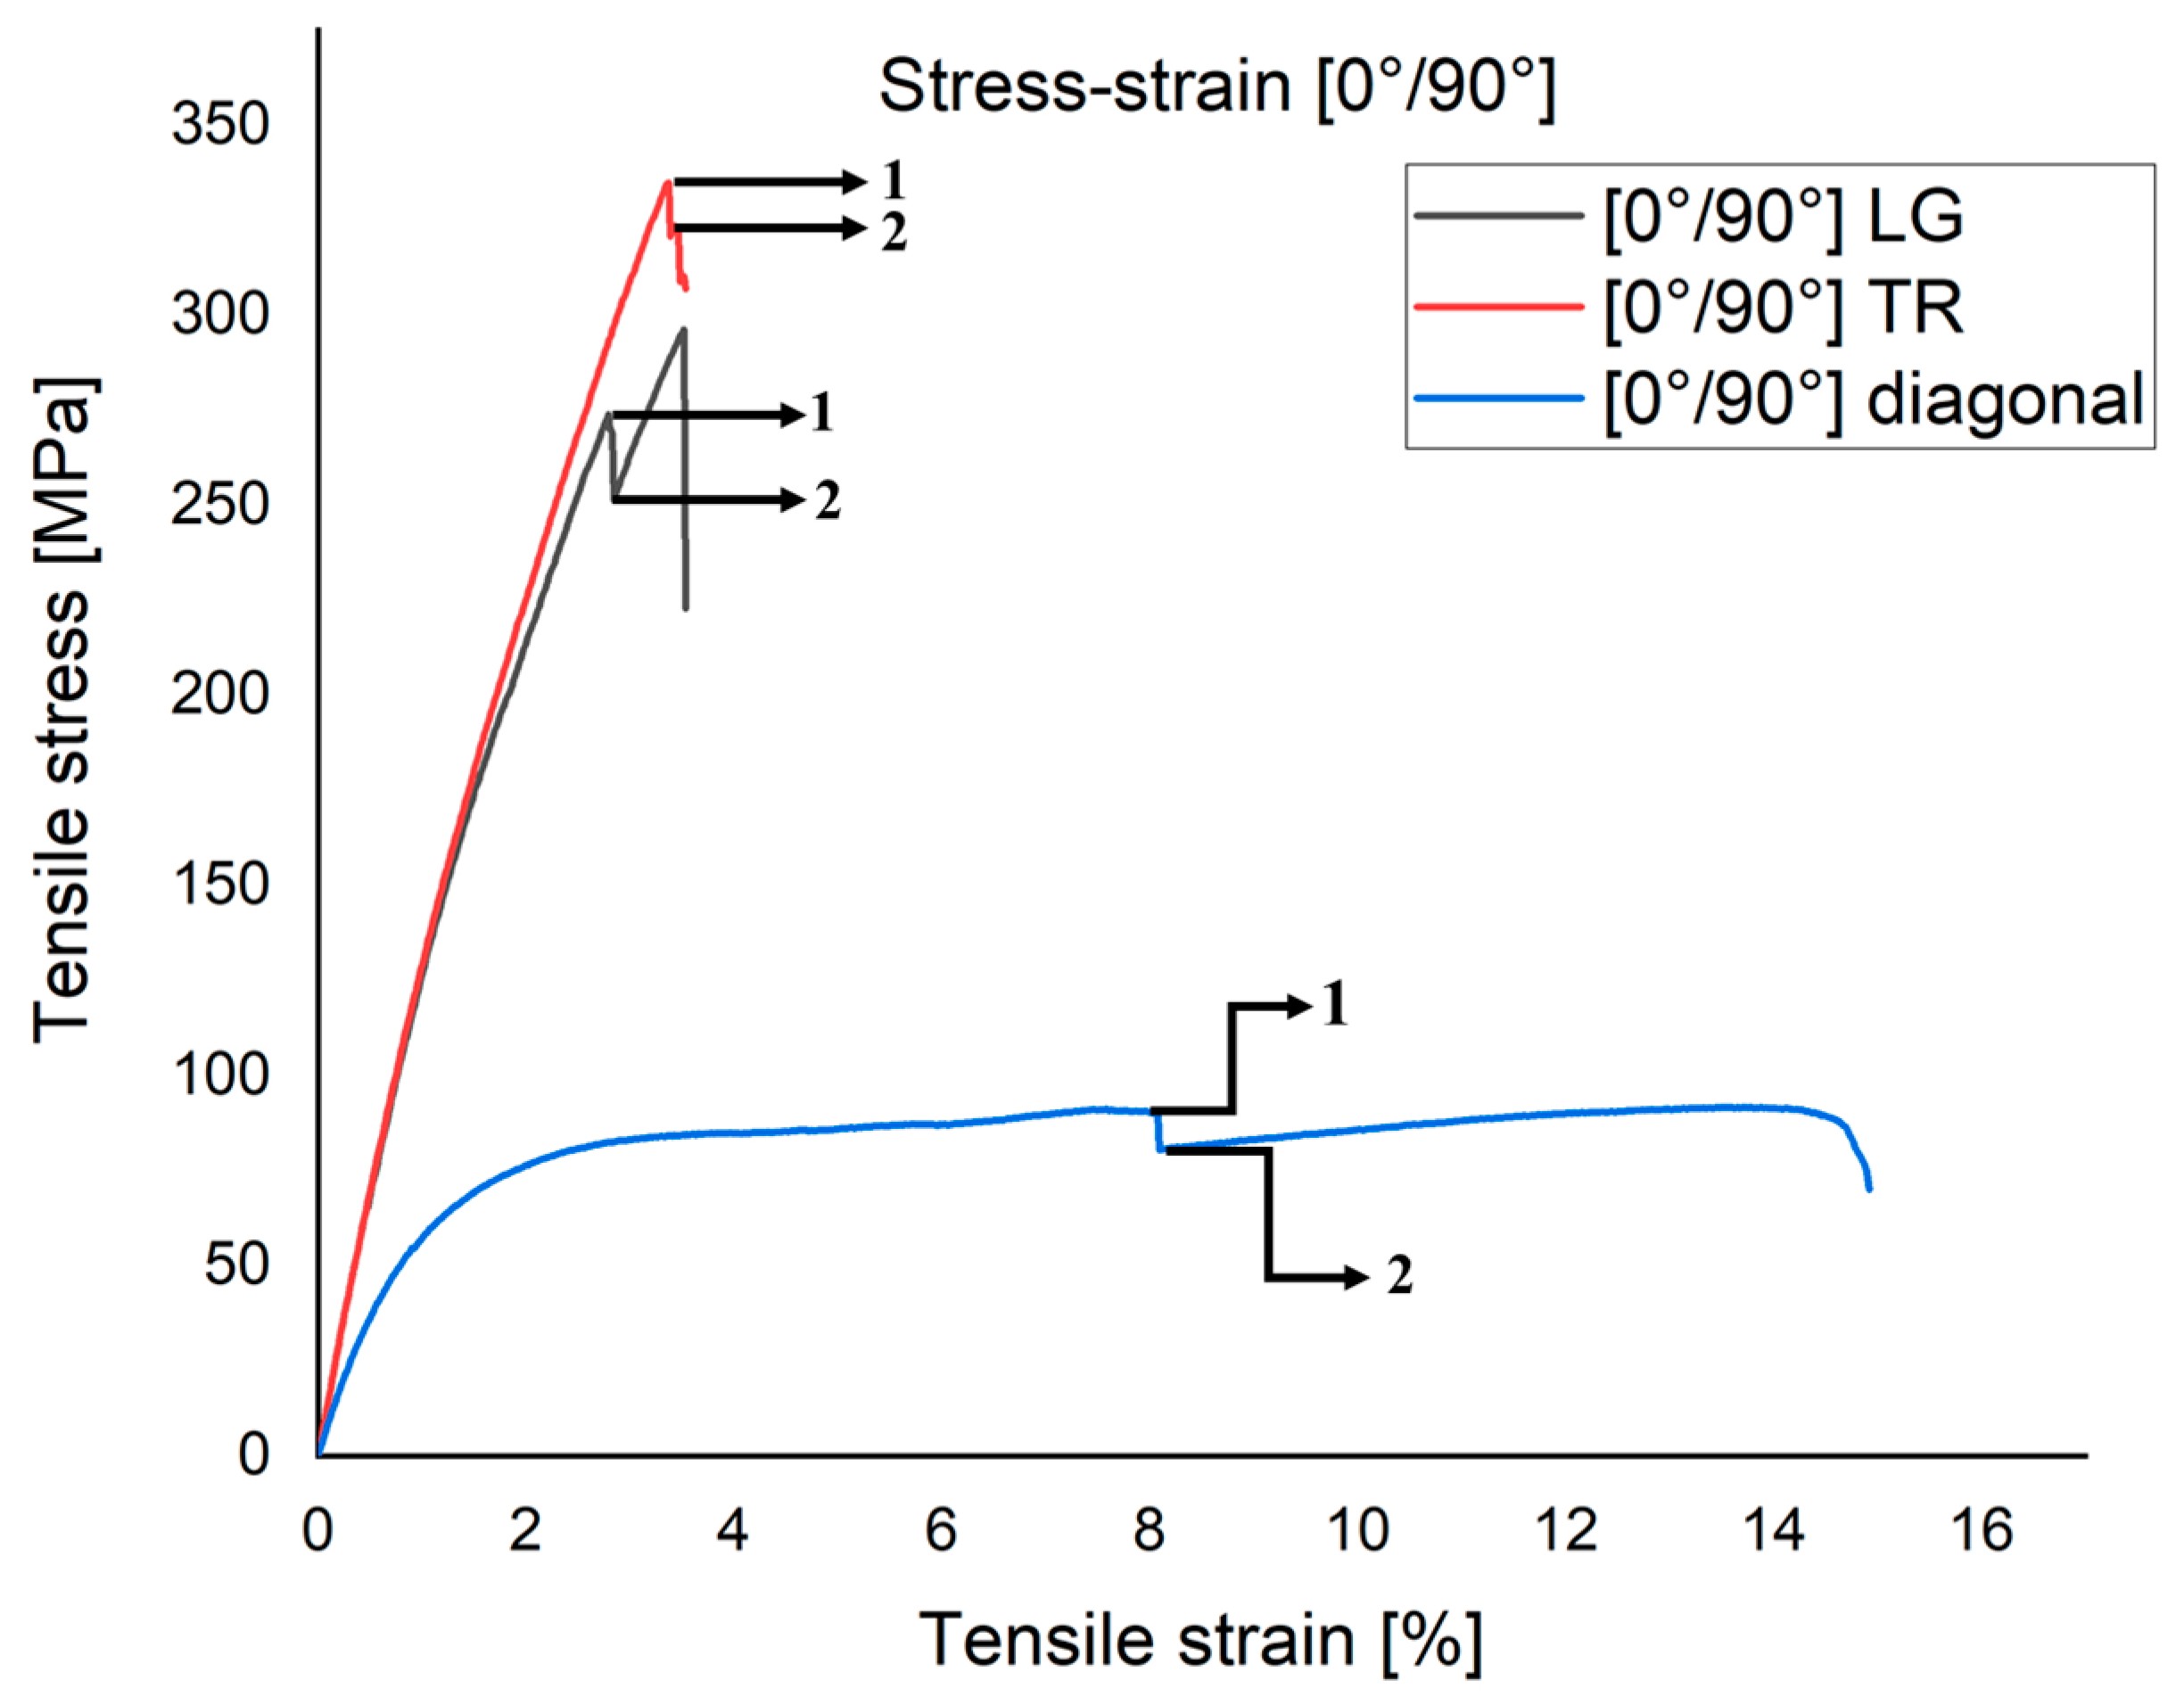
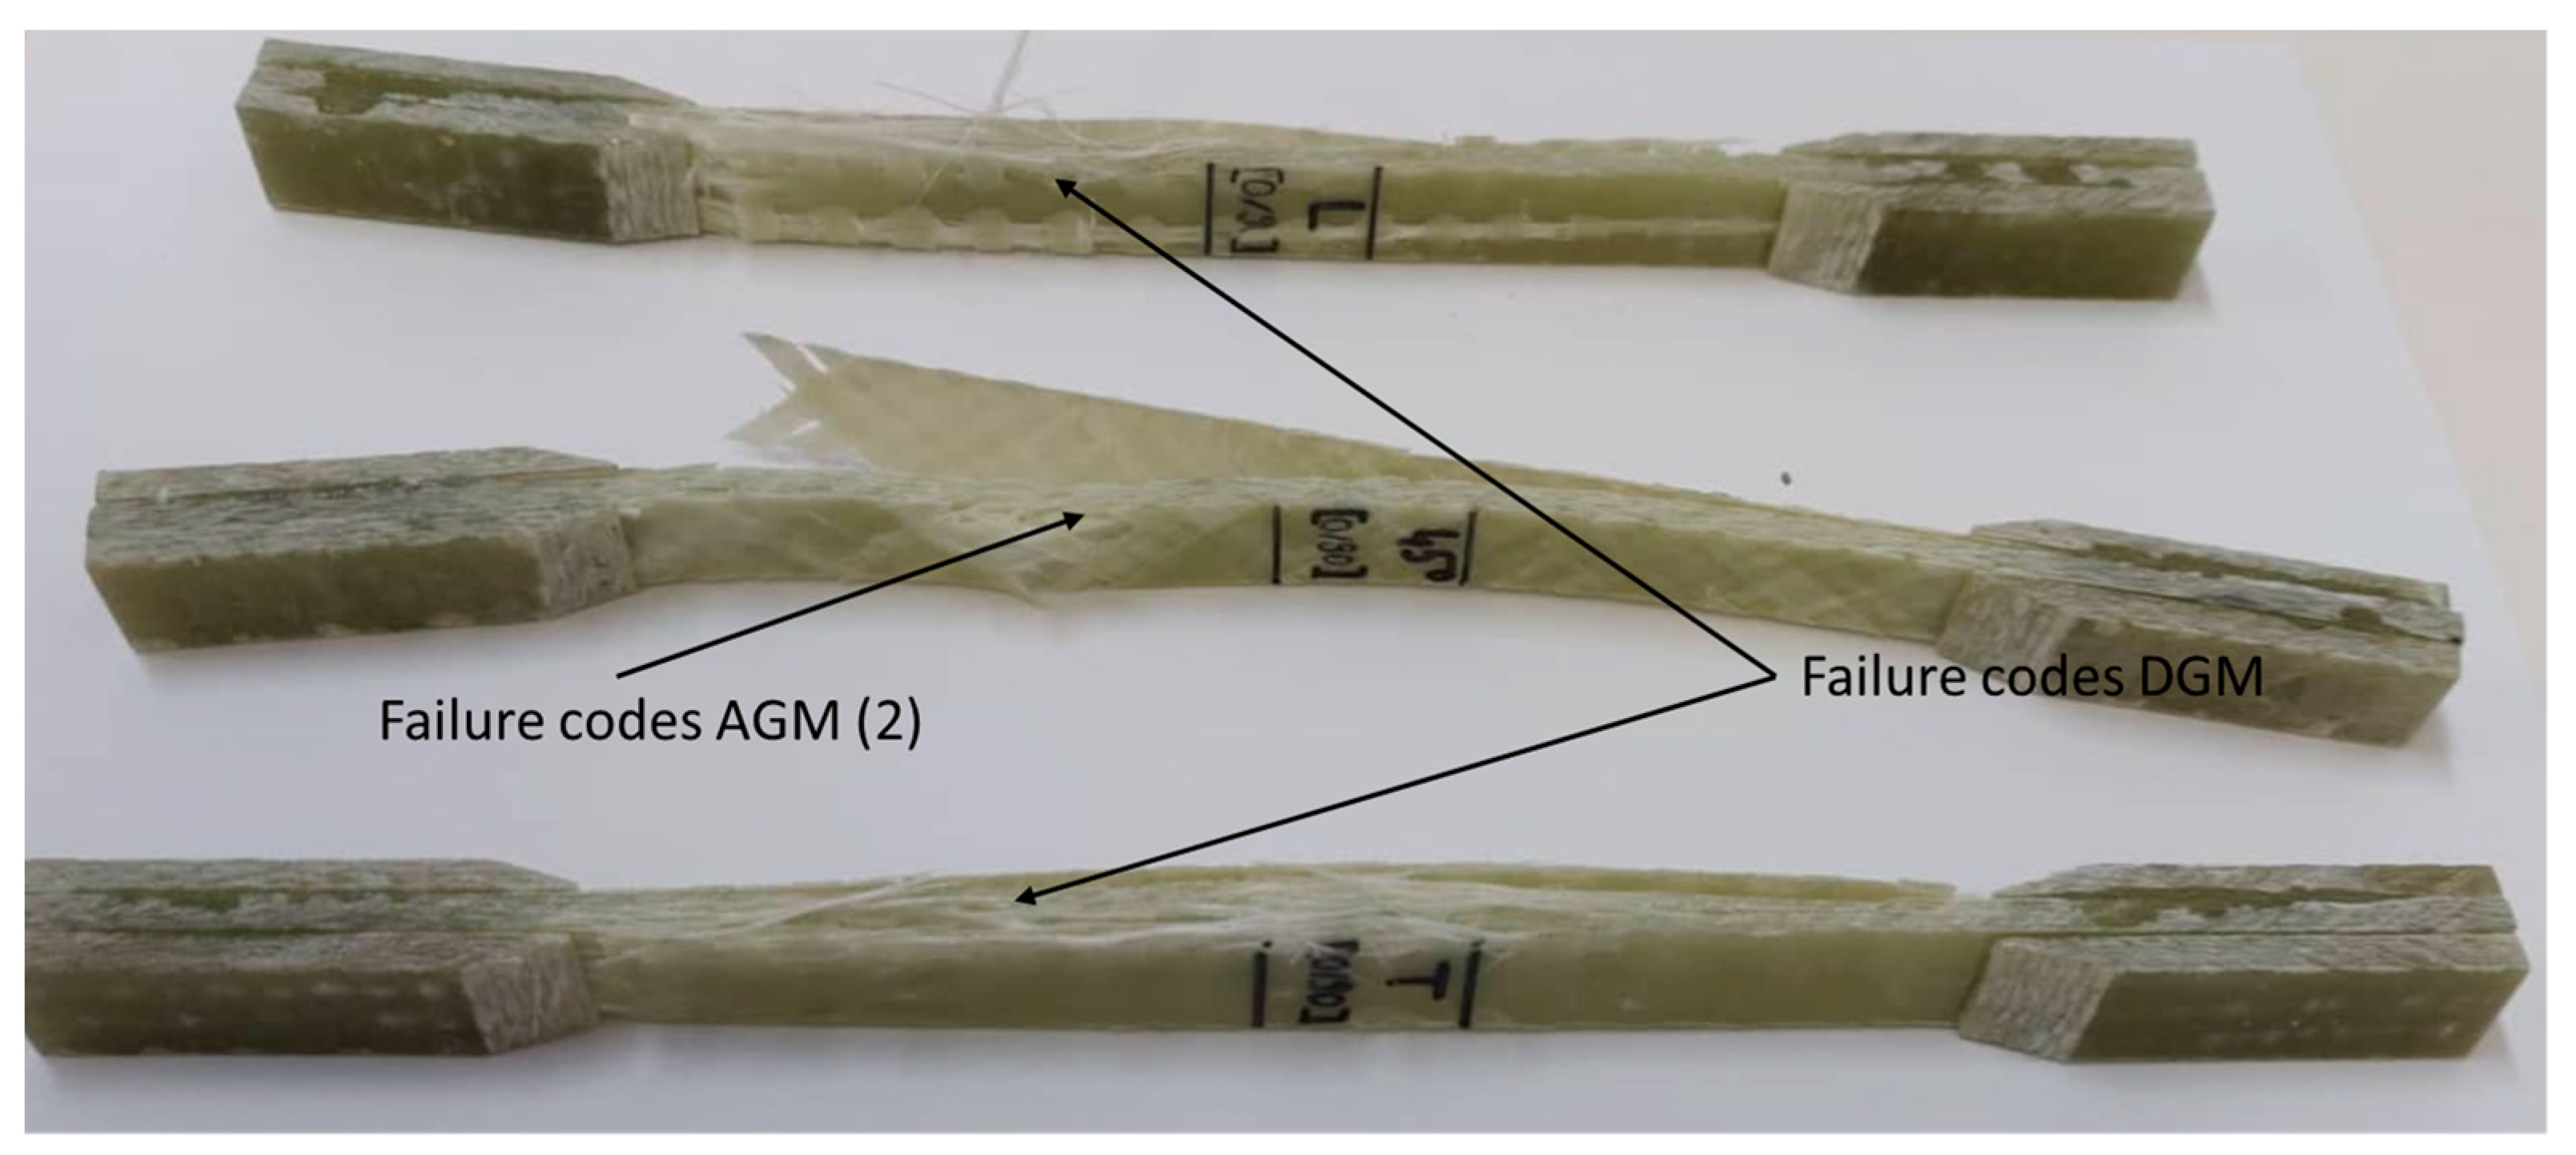
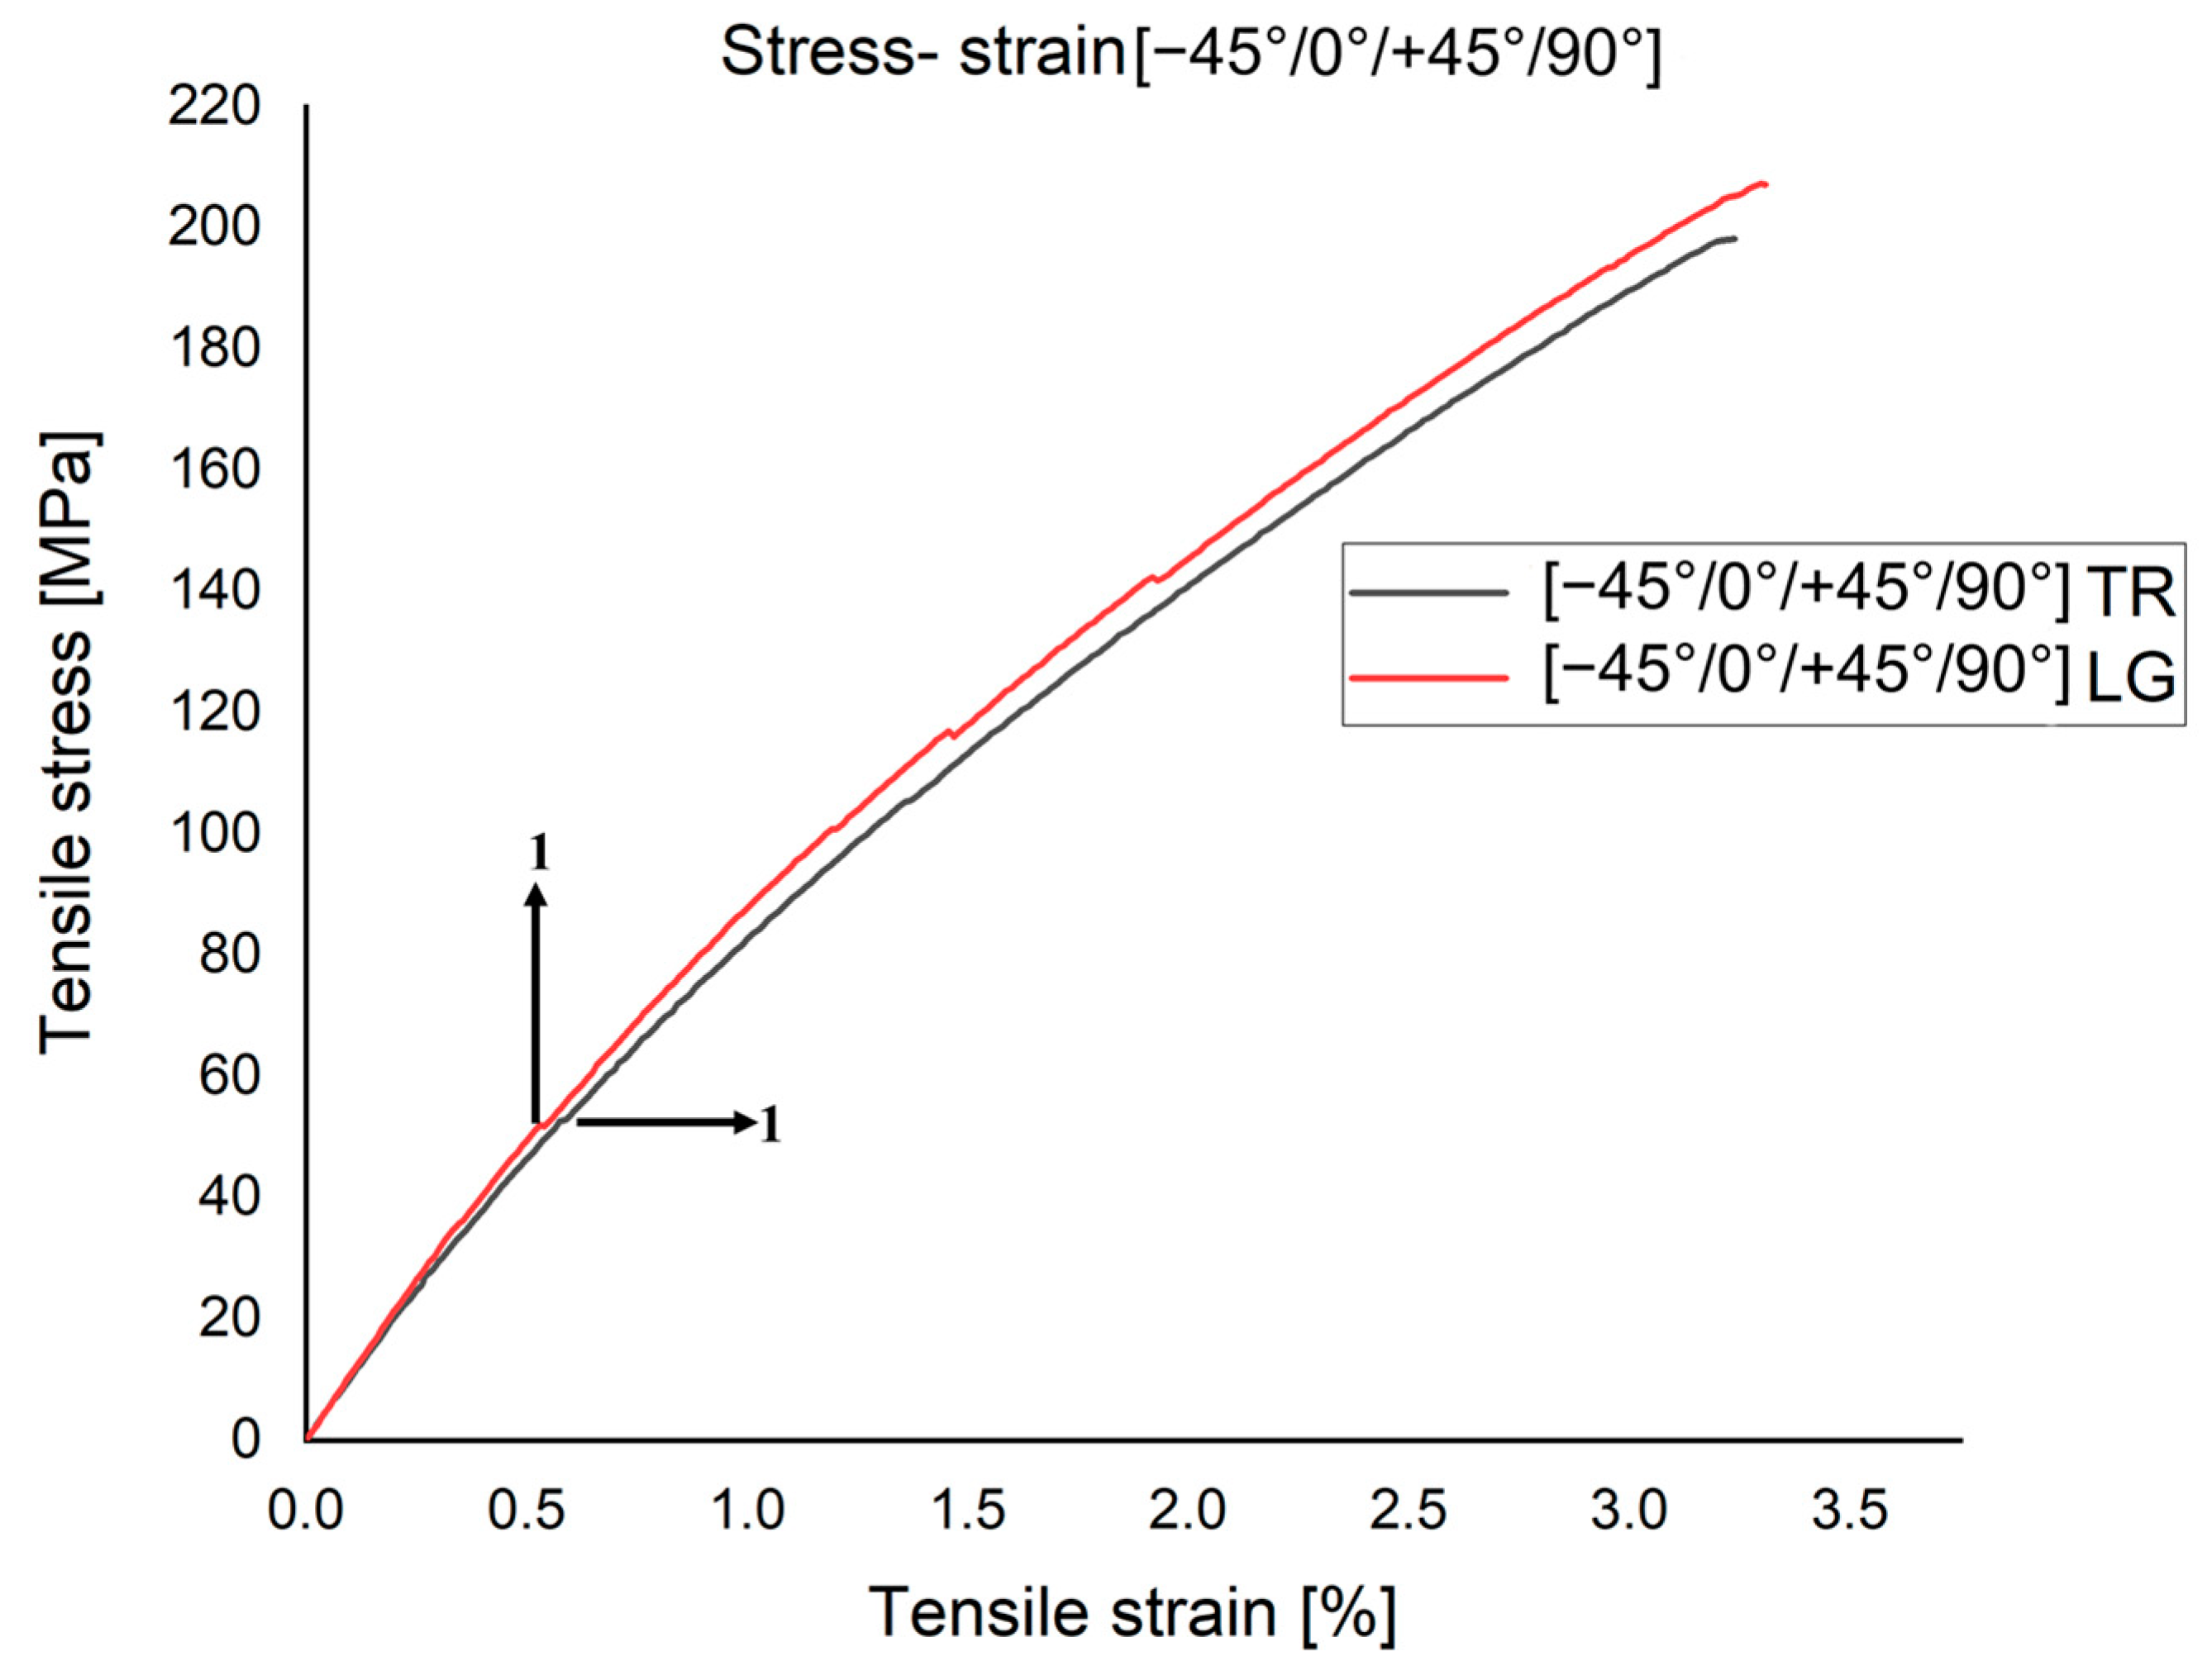
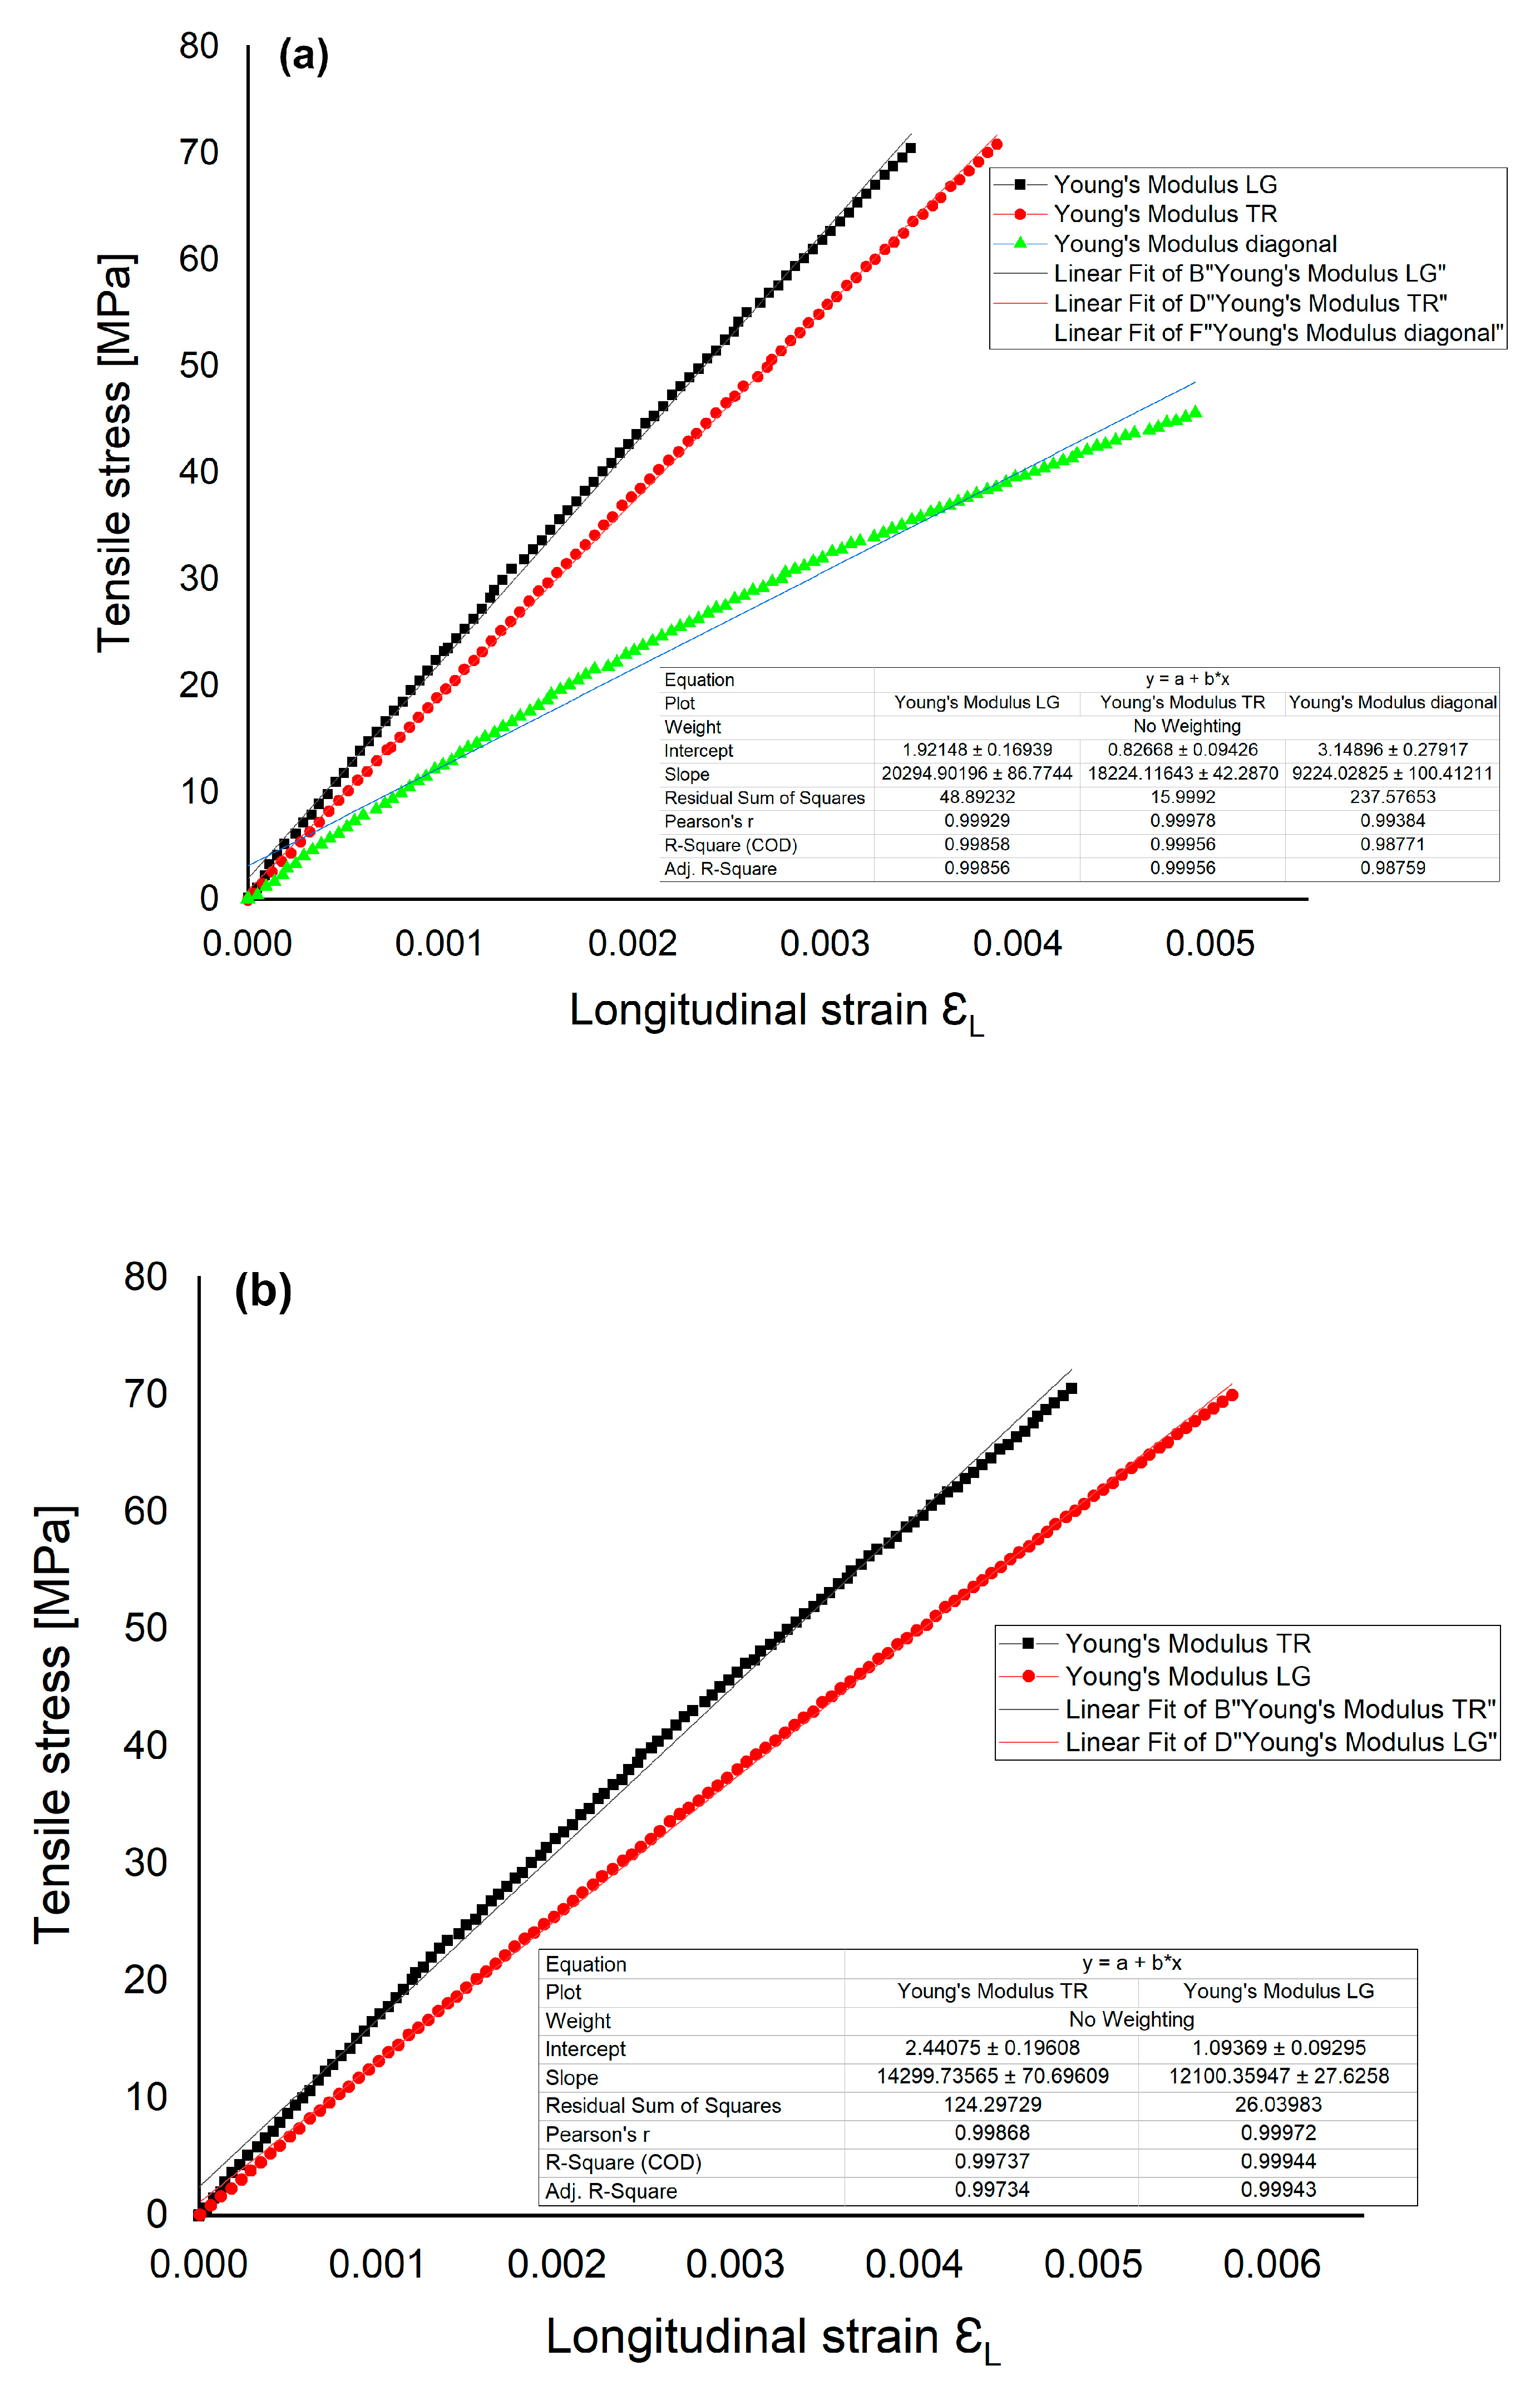
3.1. Mechanical Properties of GFRP under Static Tensile Loading at [0°/90°] and [−45°/0°/+45°/90°]
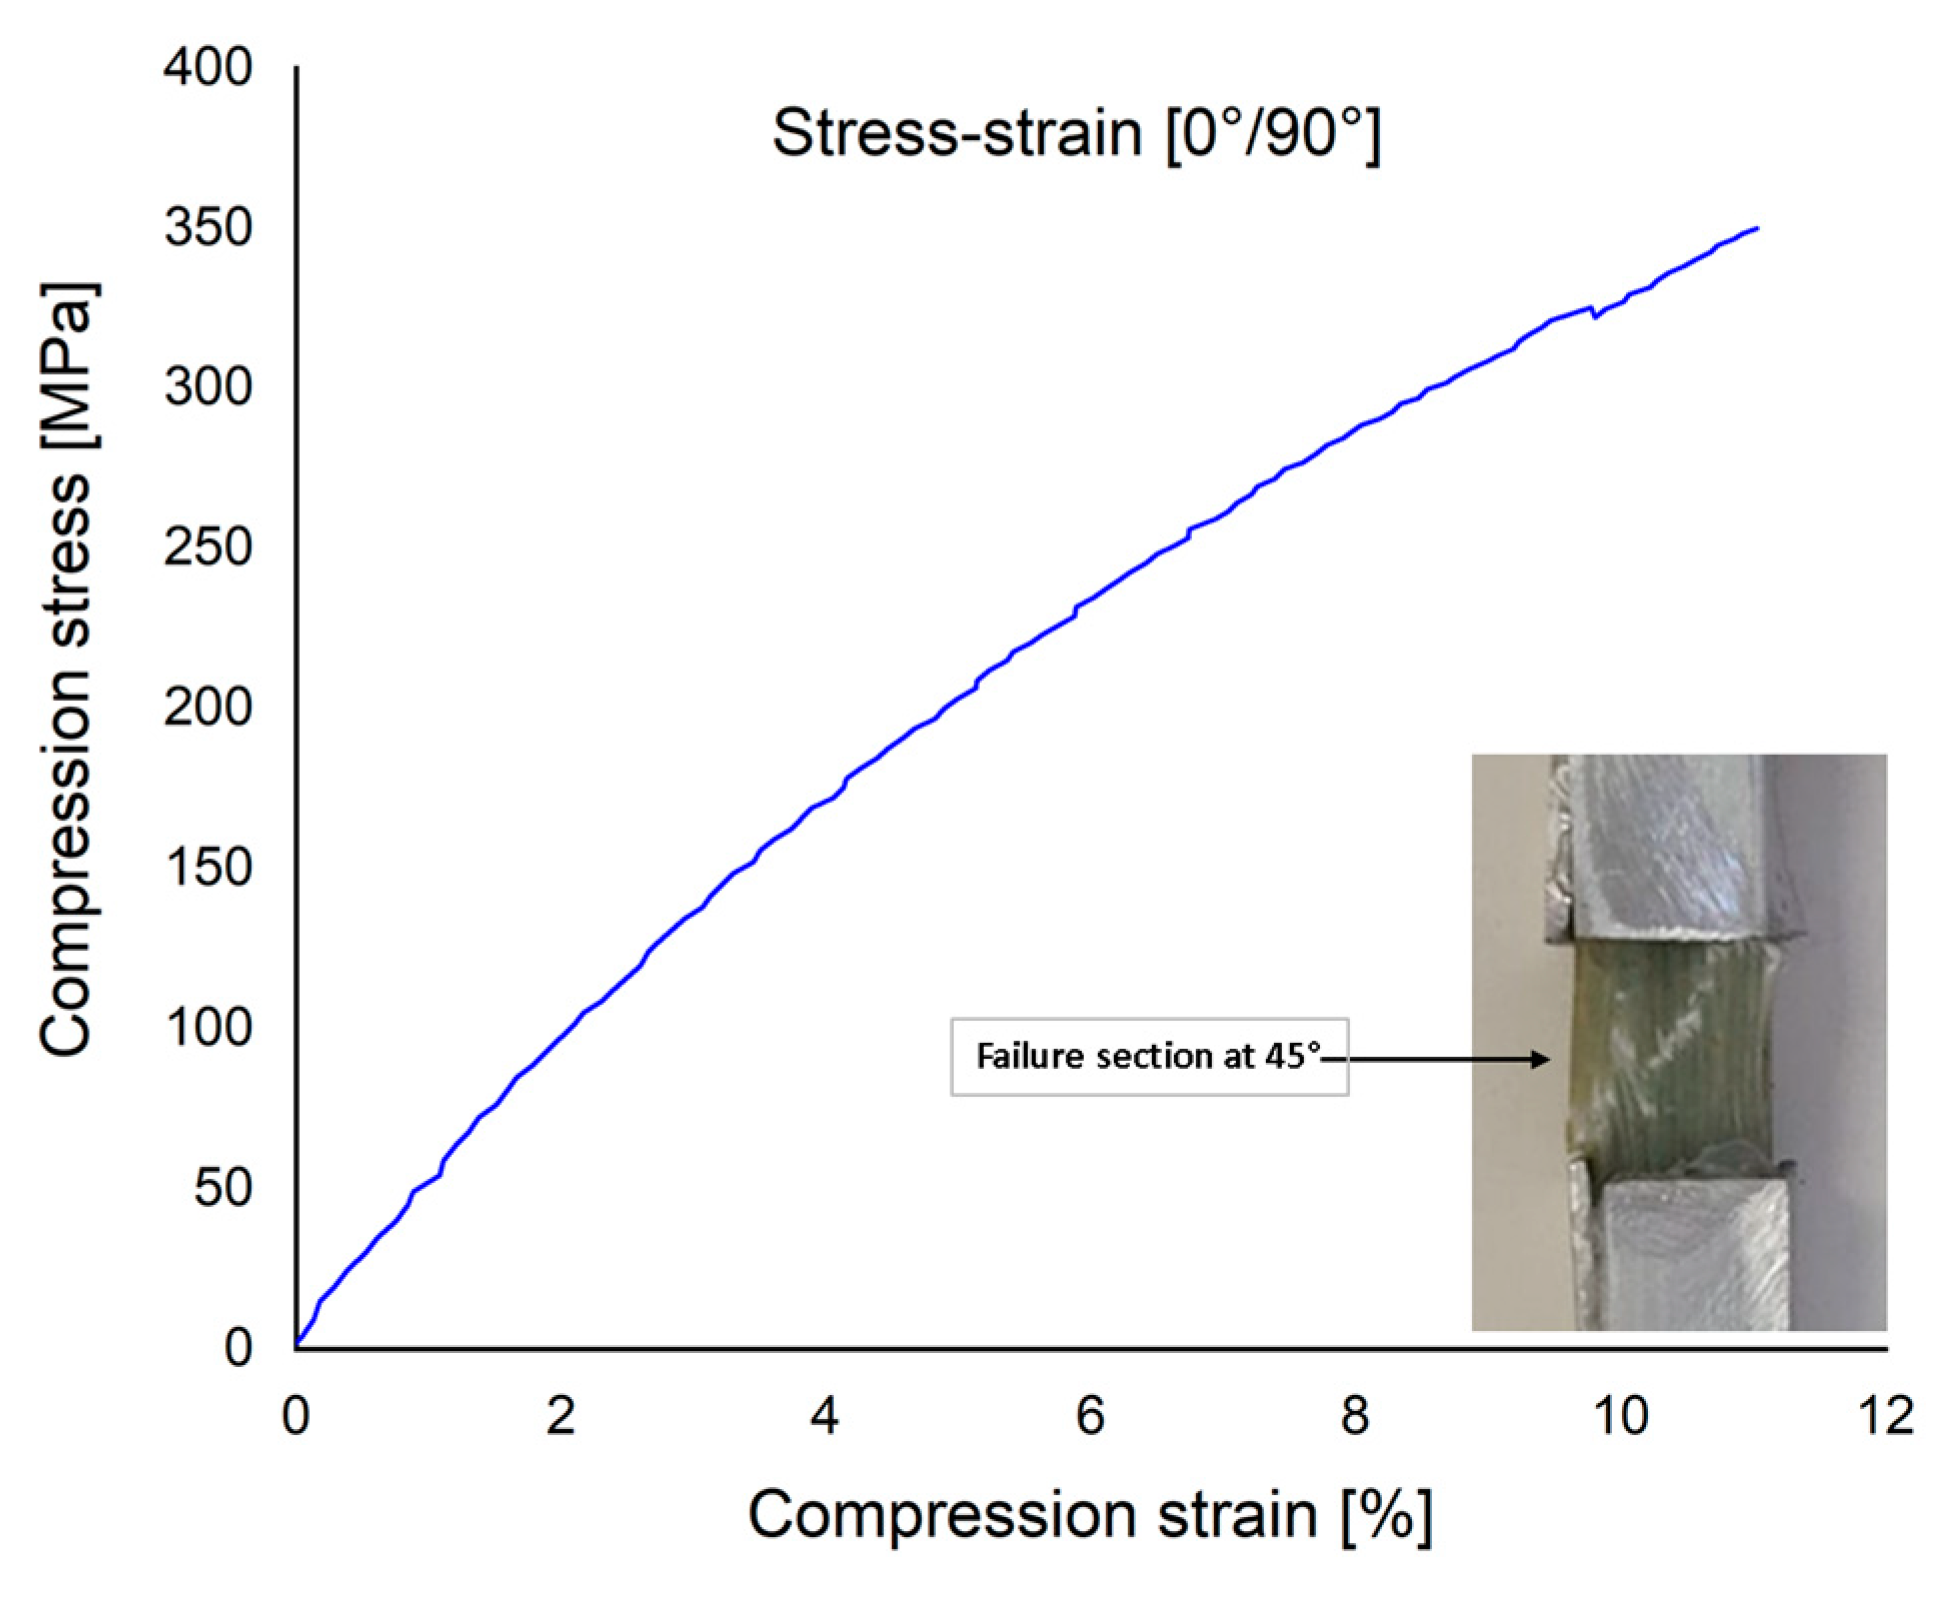
3.2. Compression Test
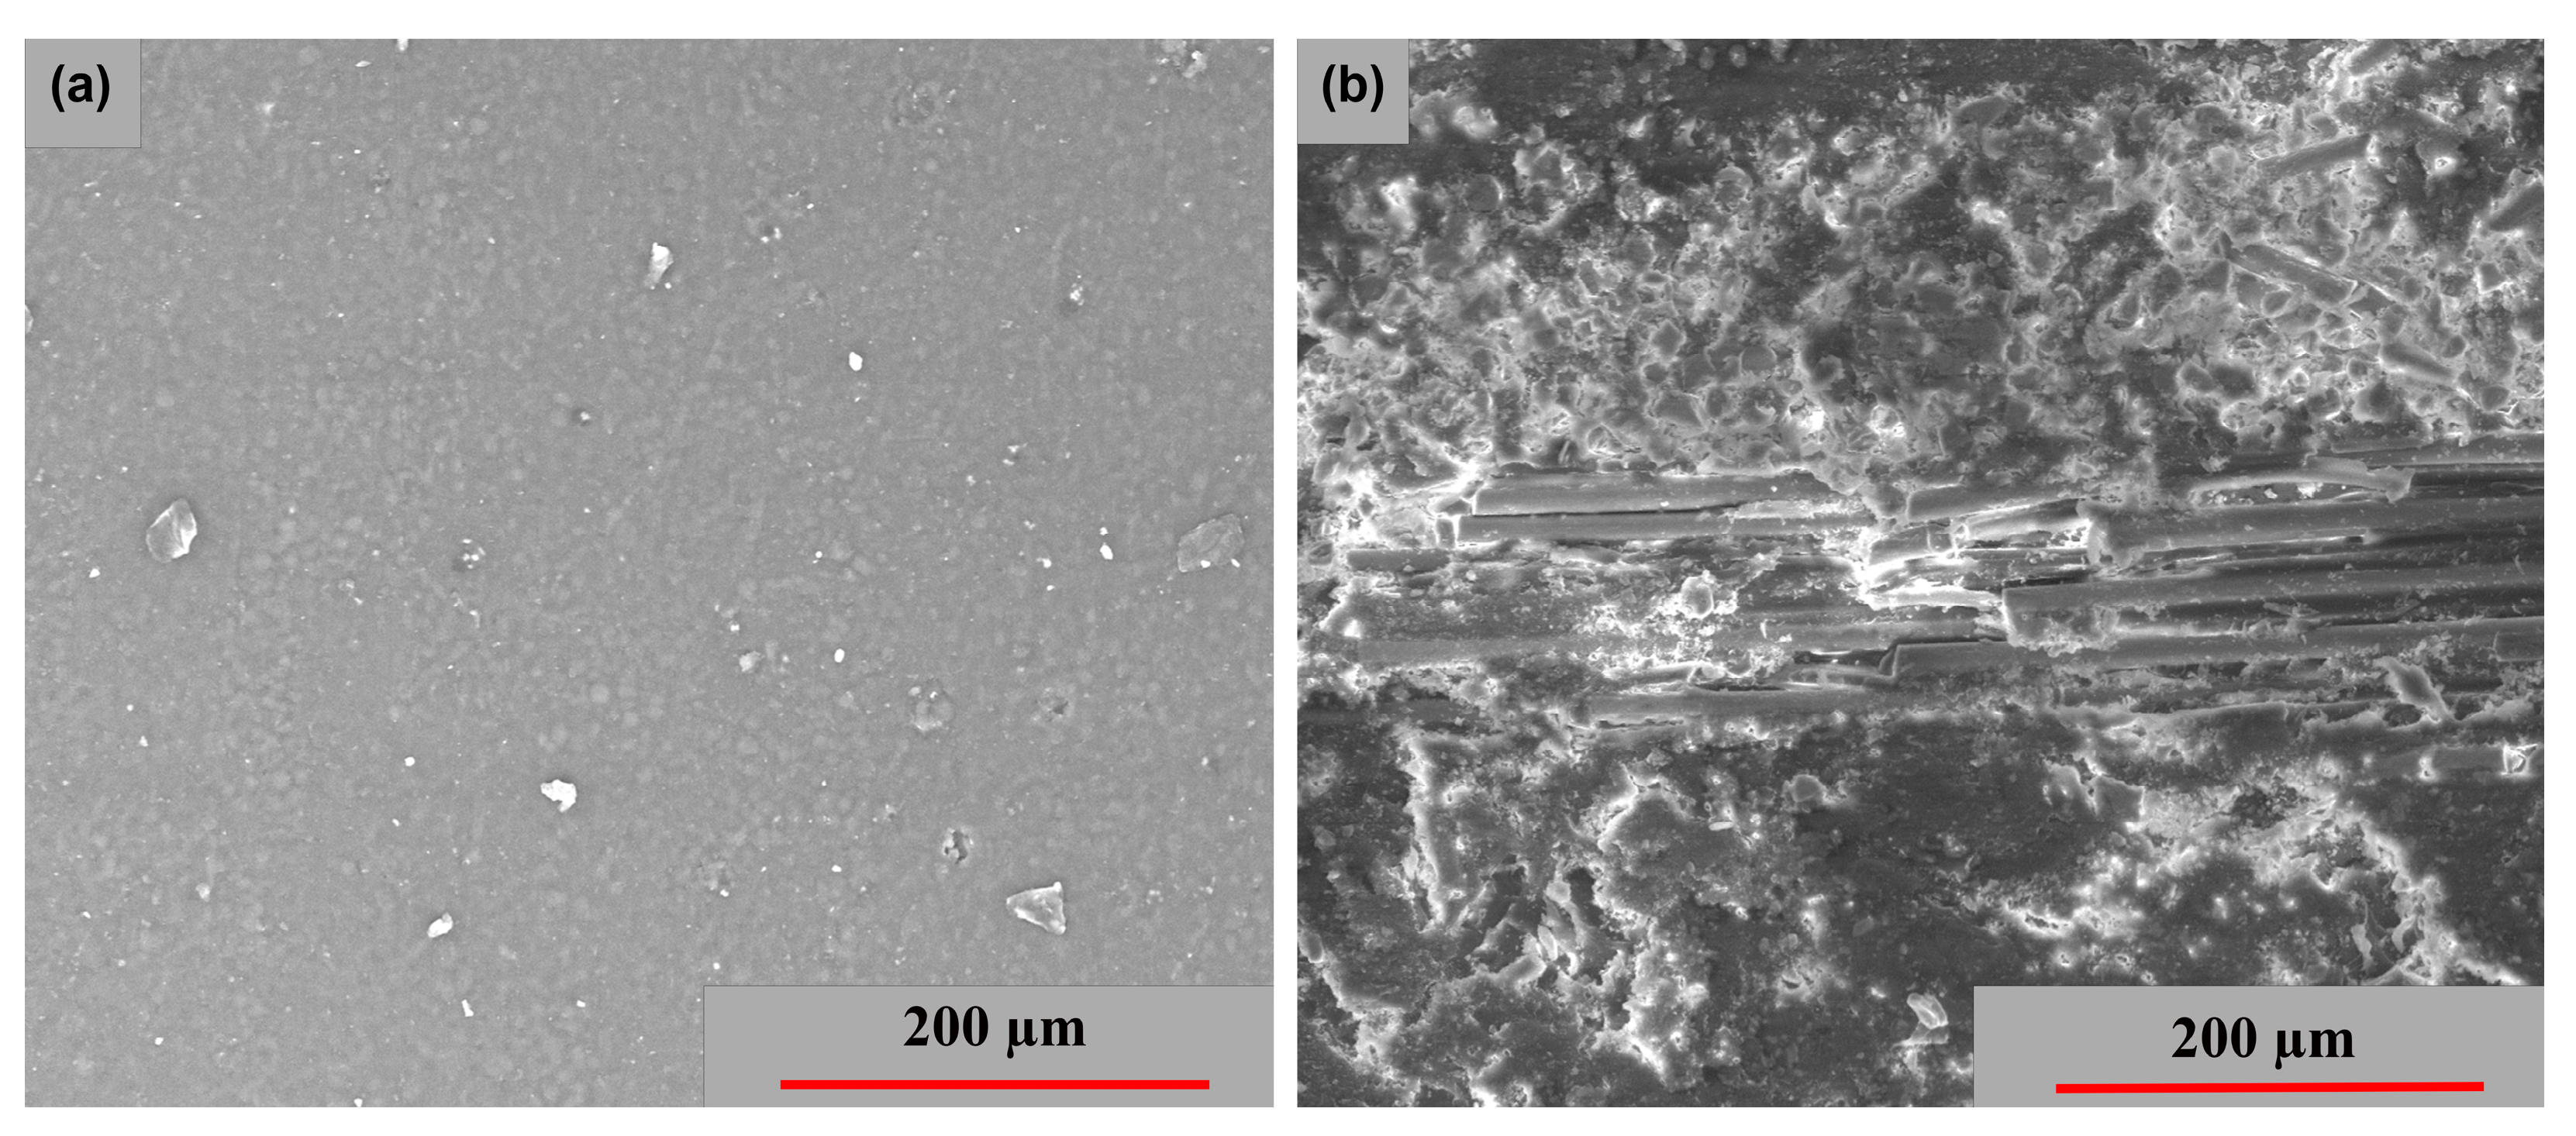
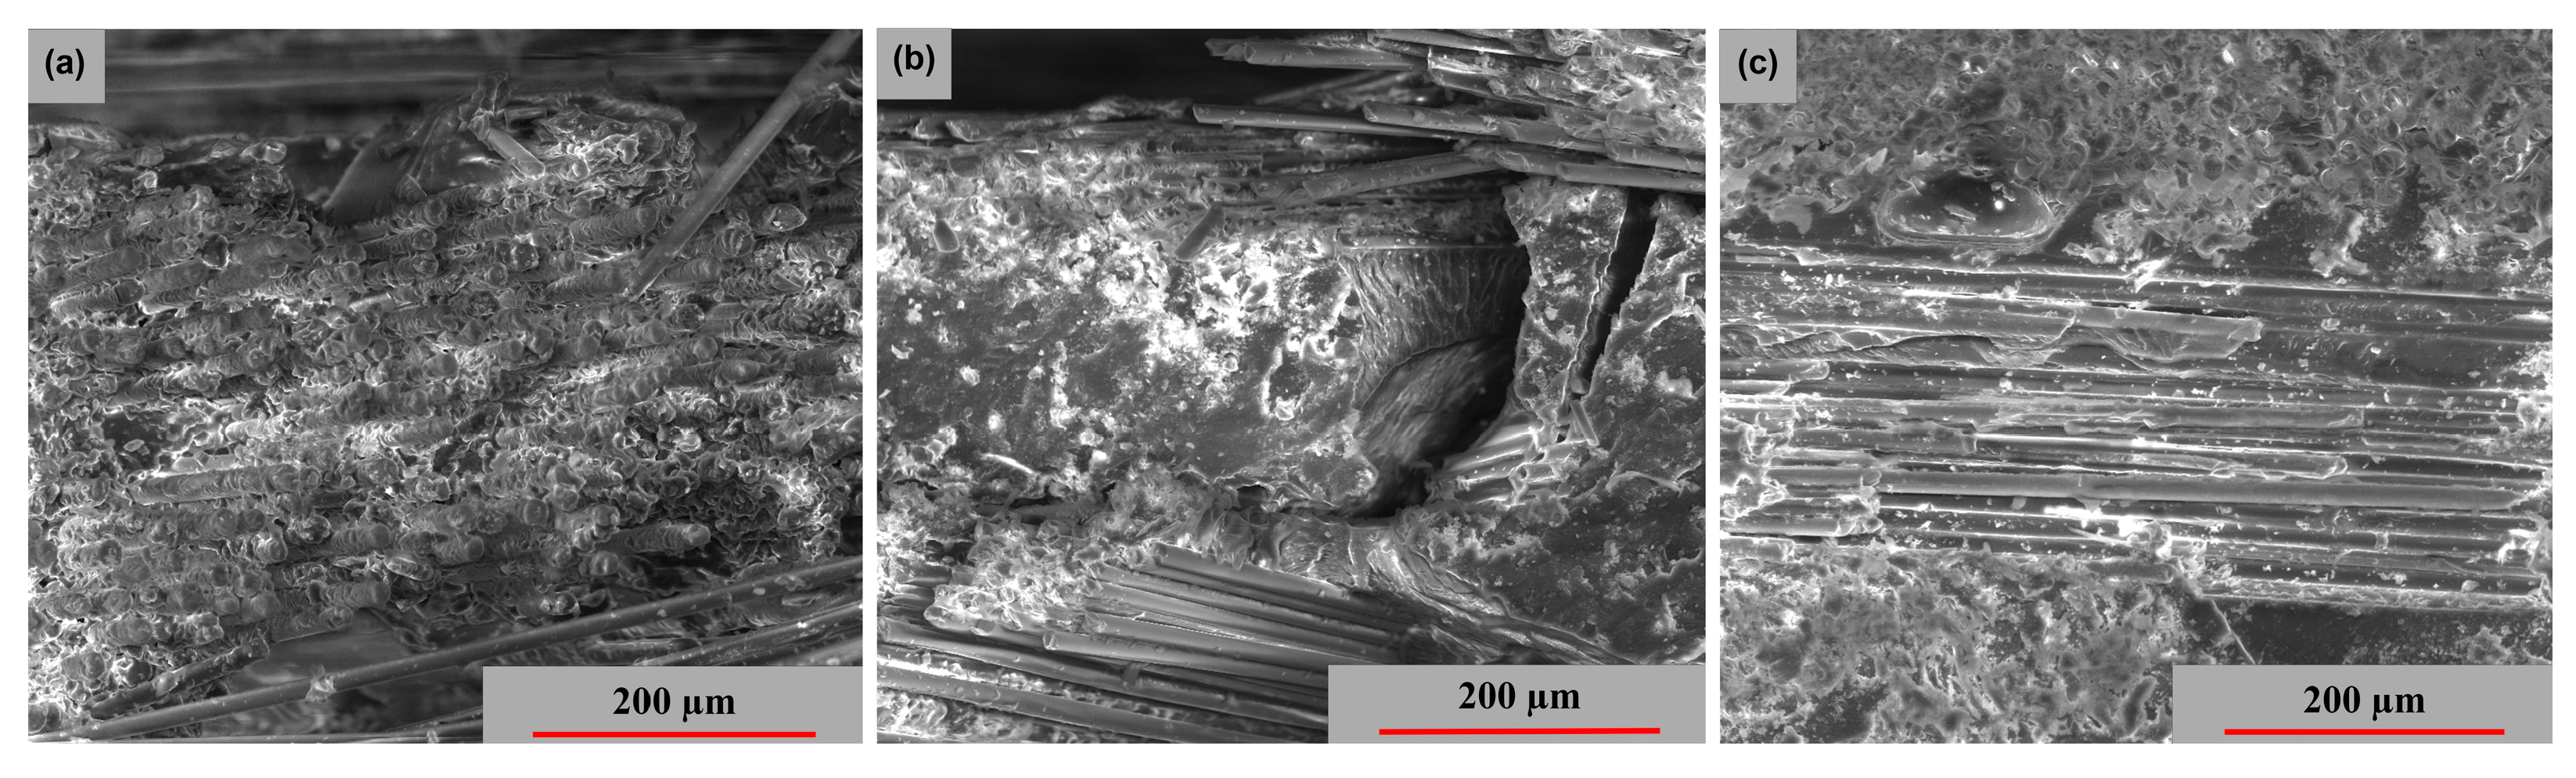
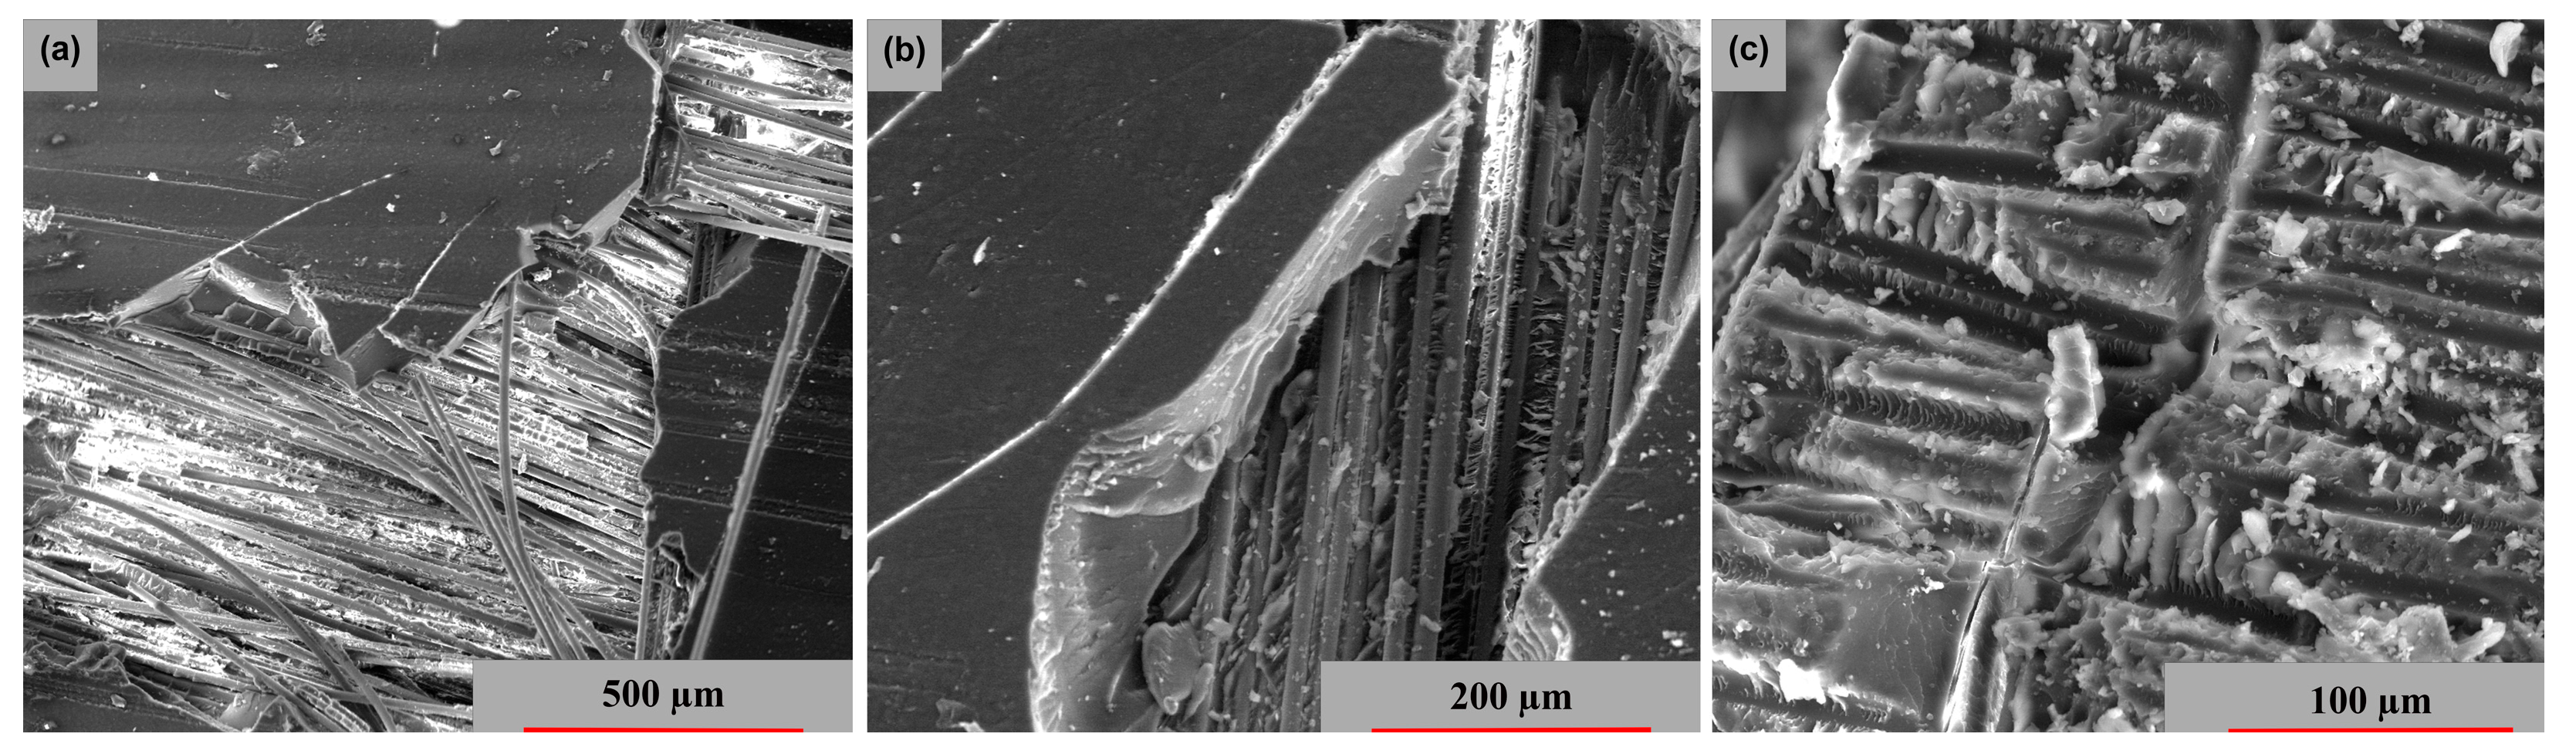
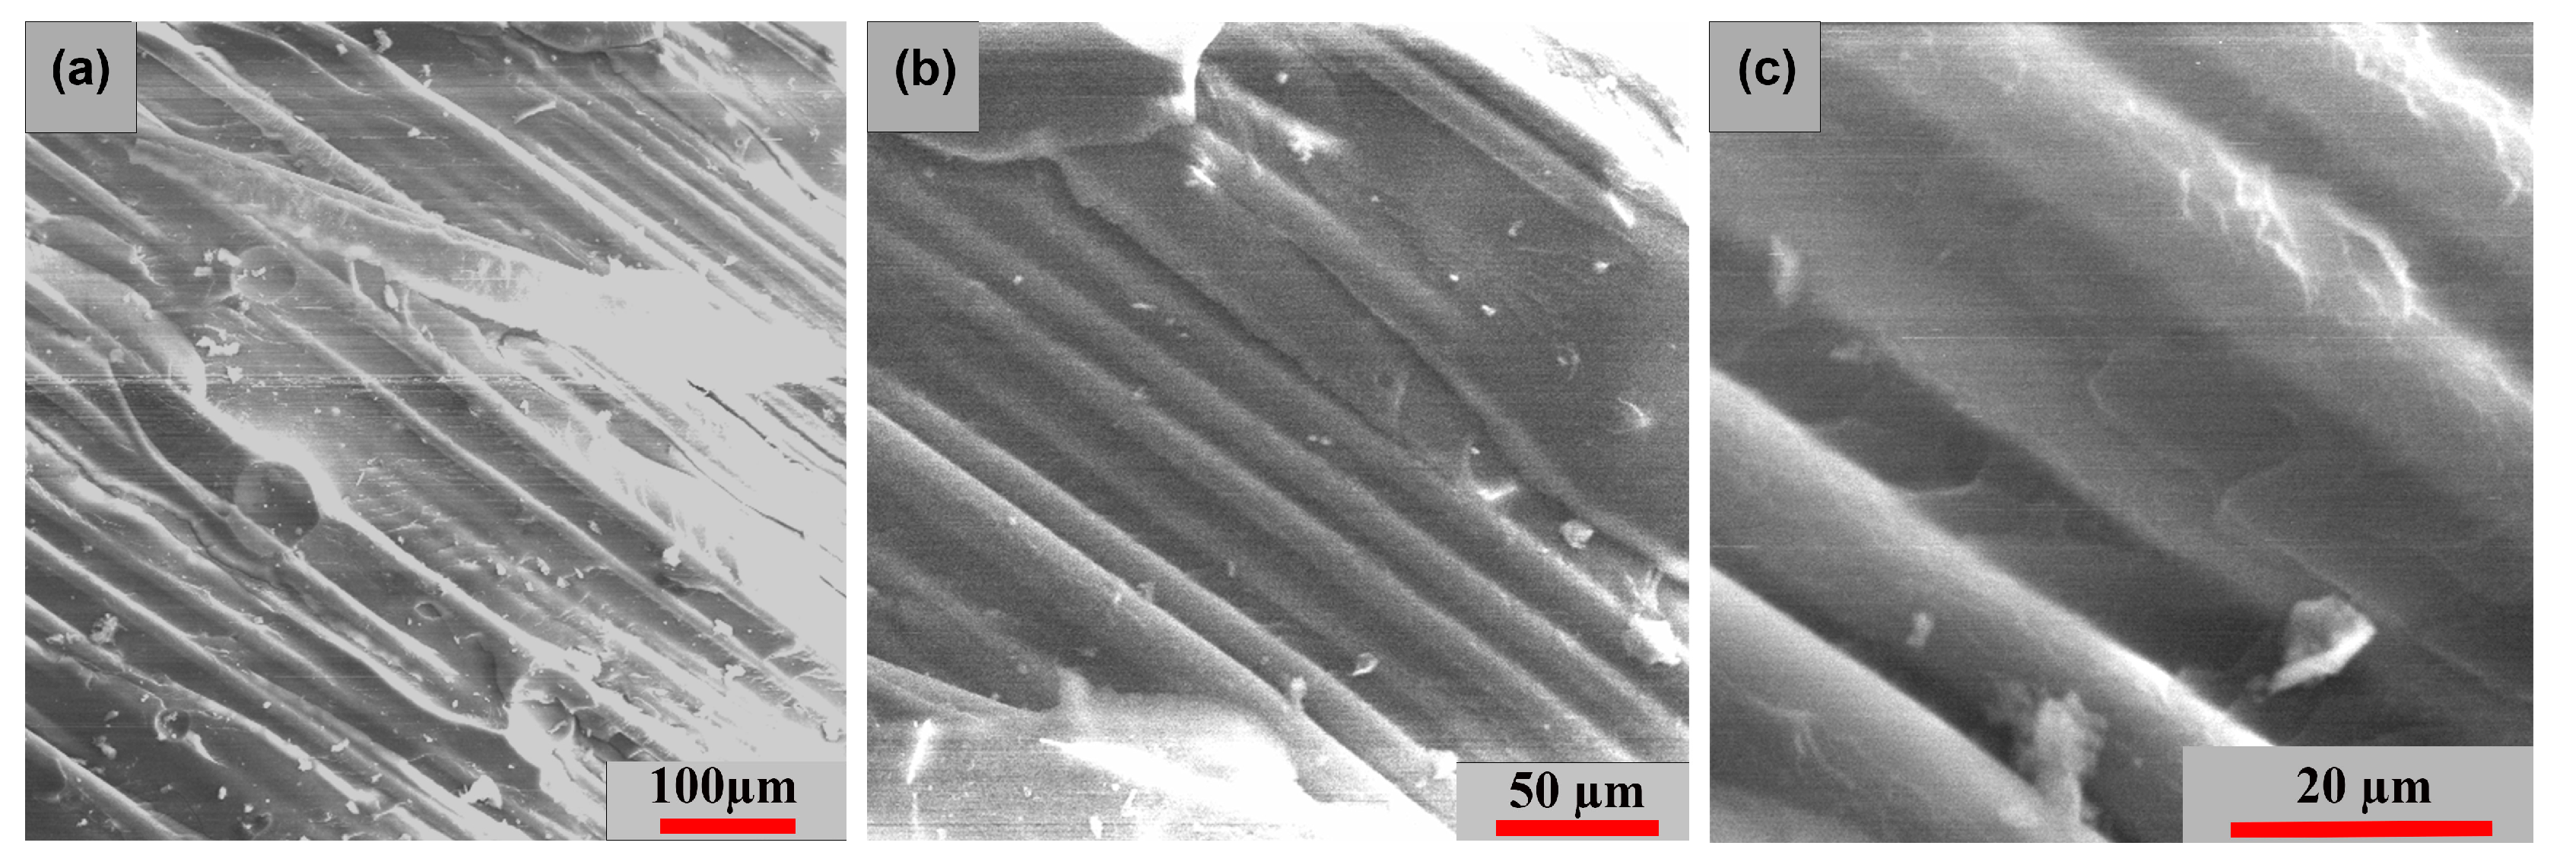
3.3. SEM Surface at [0°/90°]
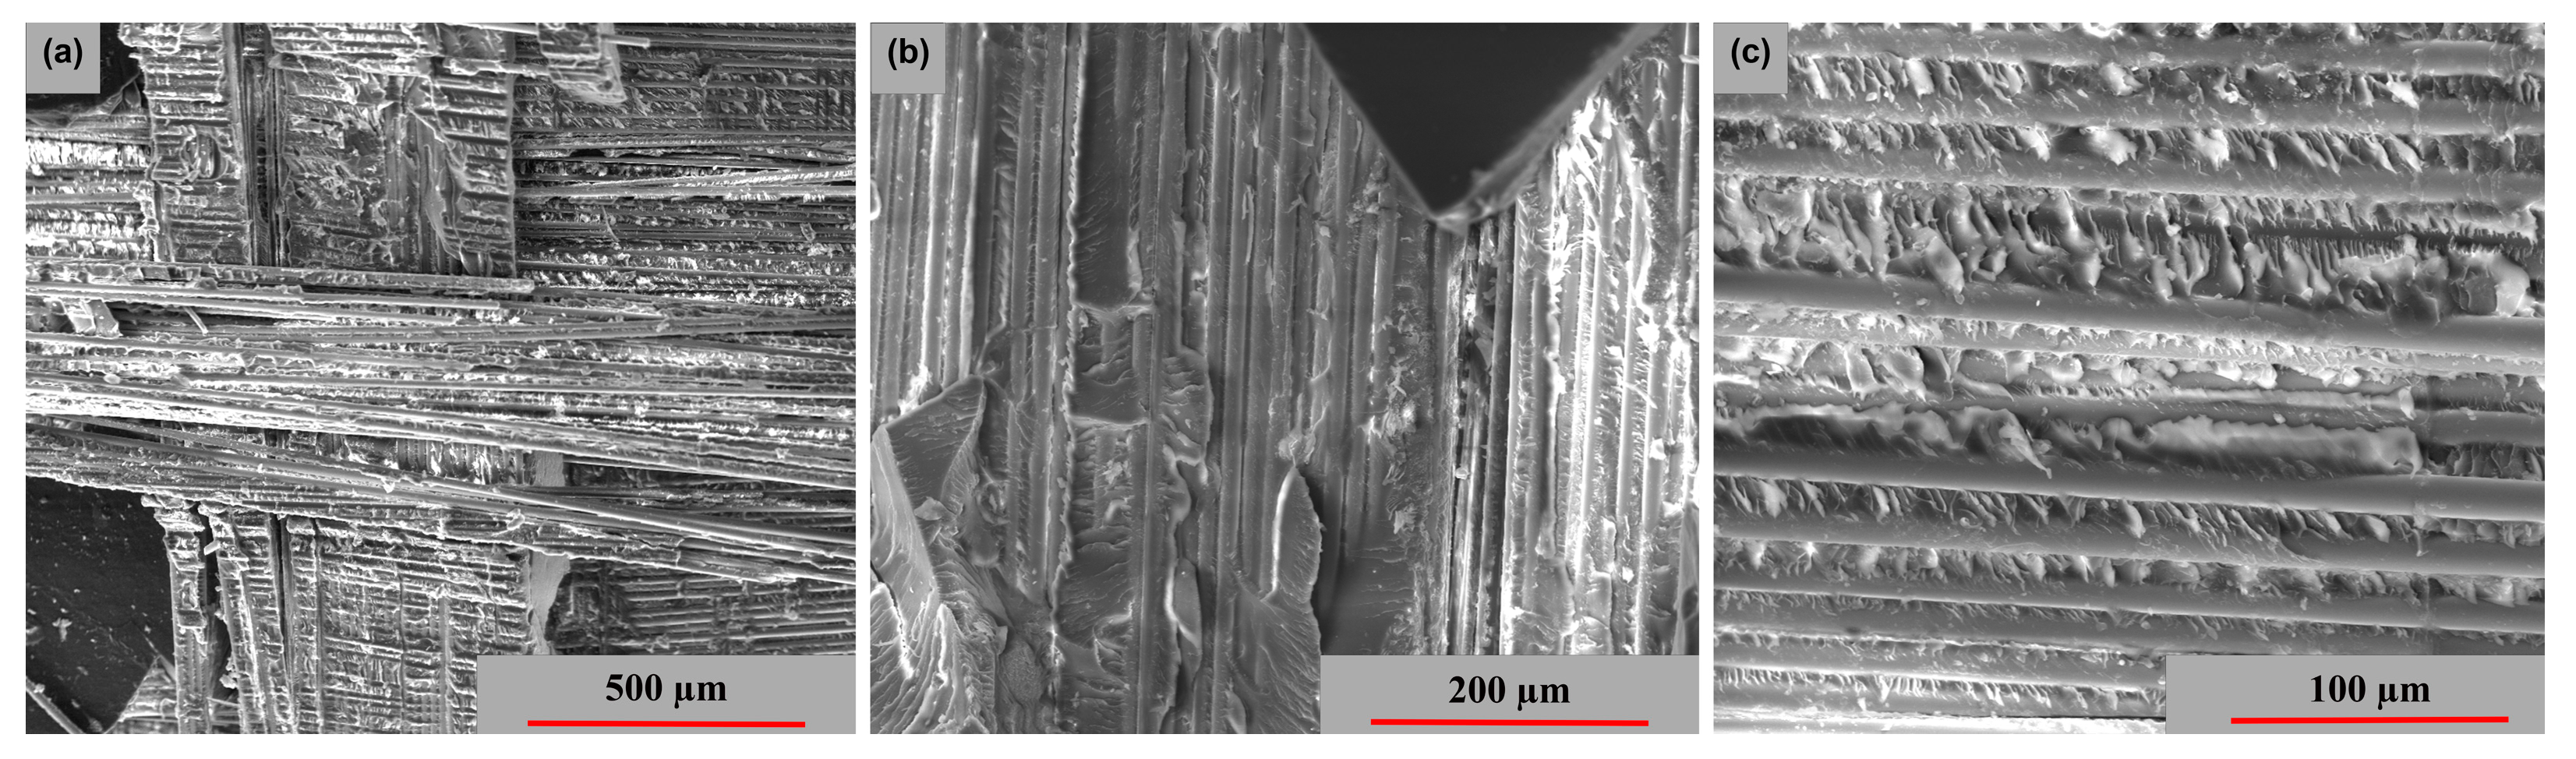
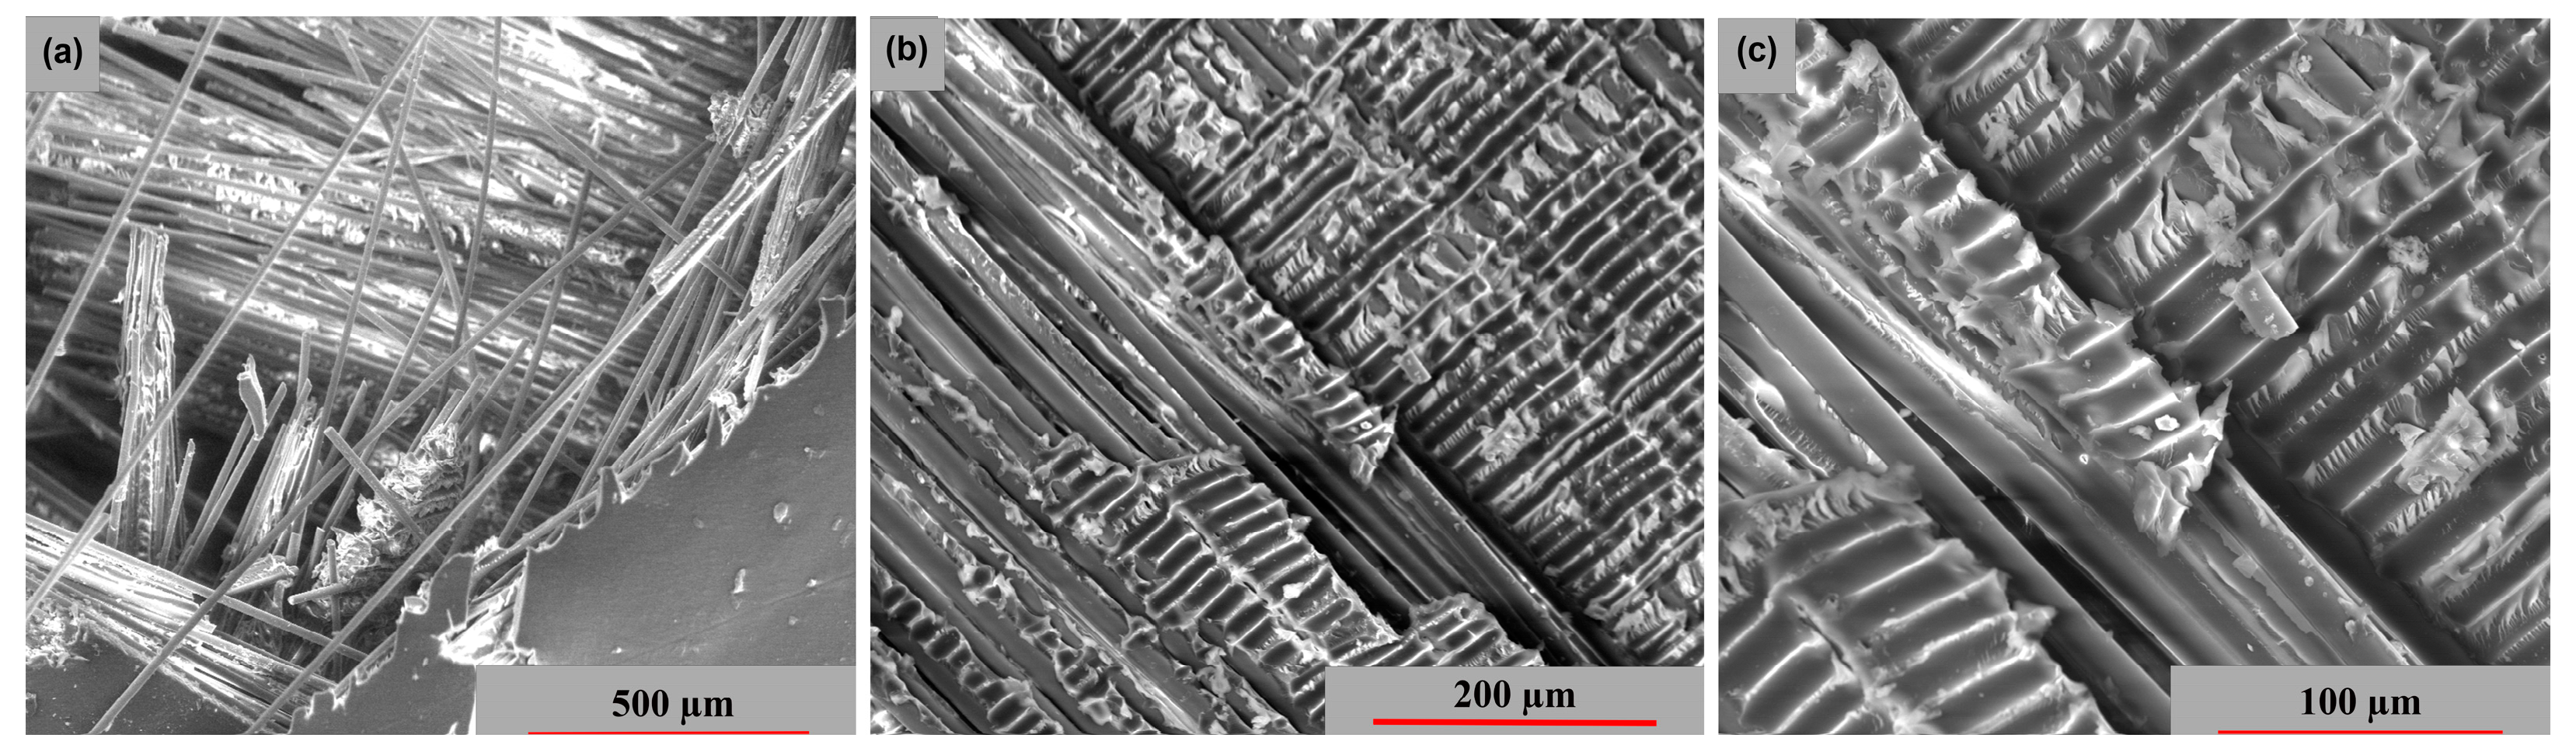
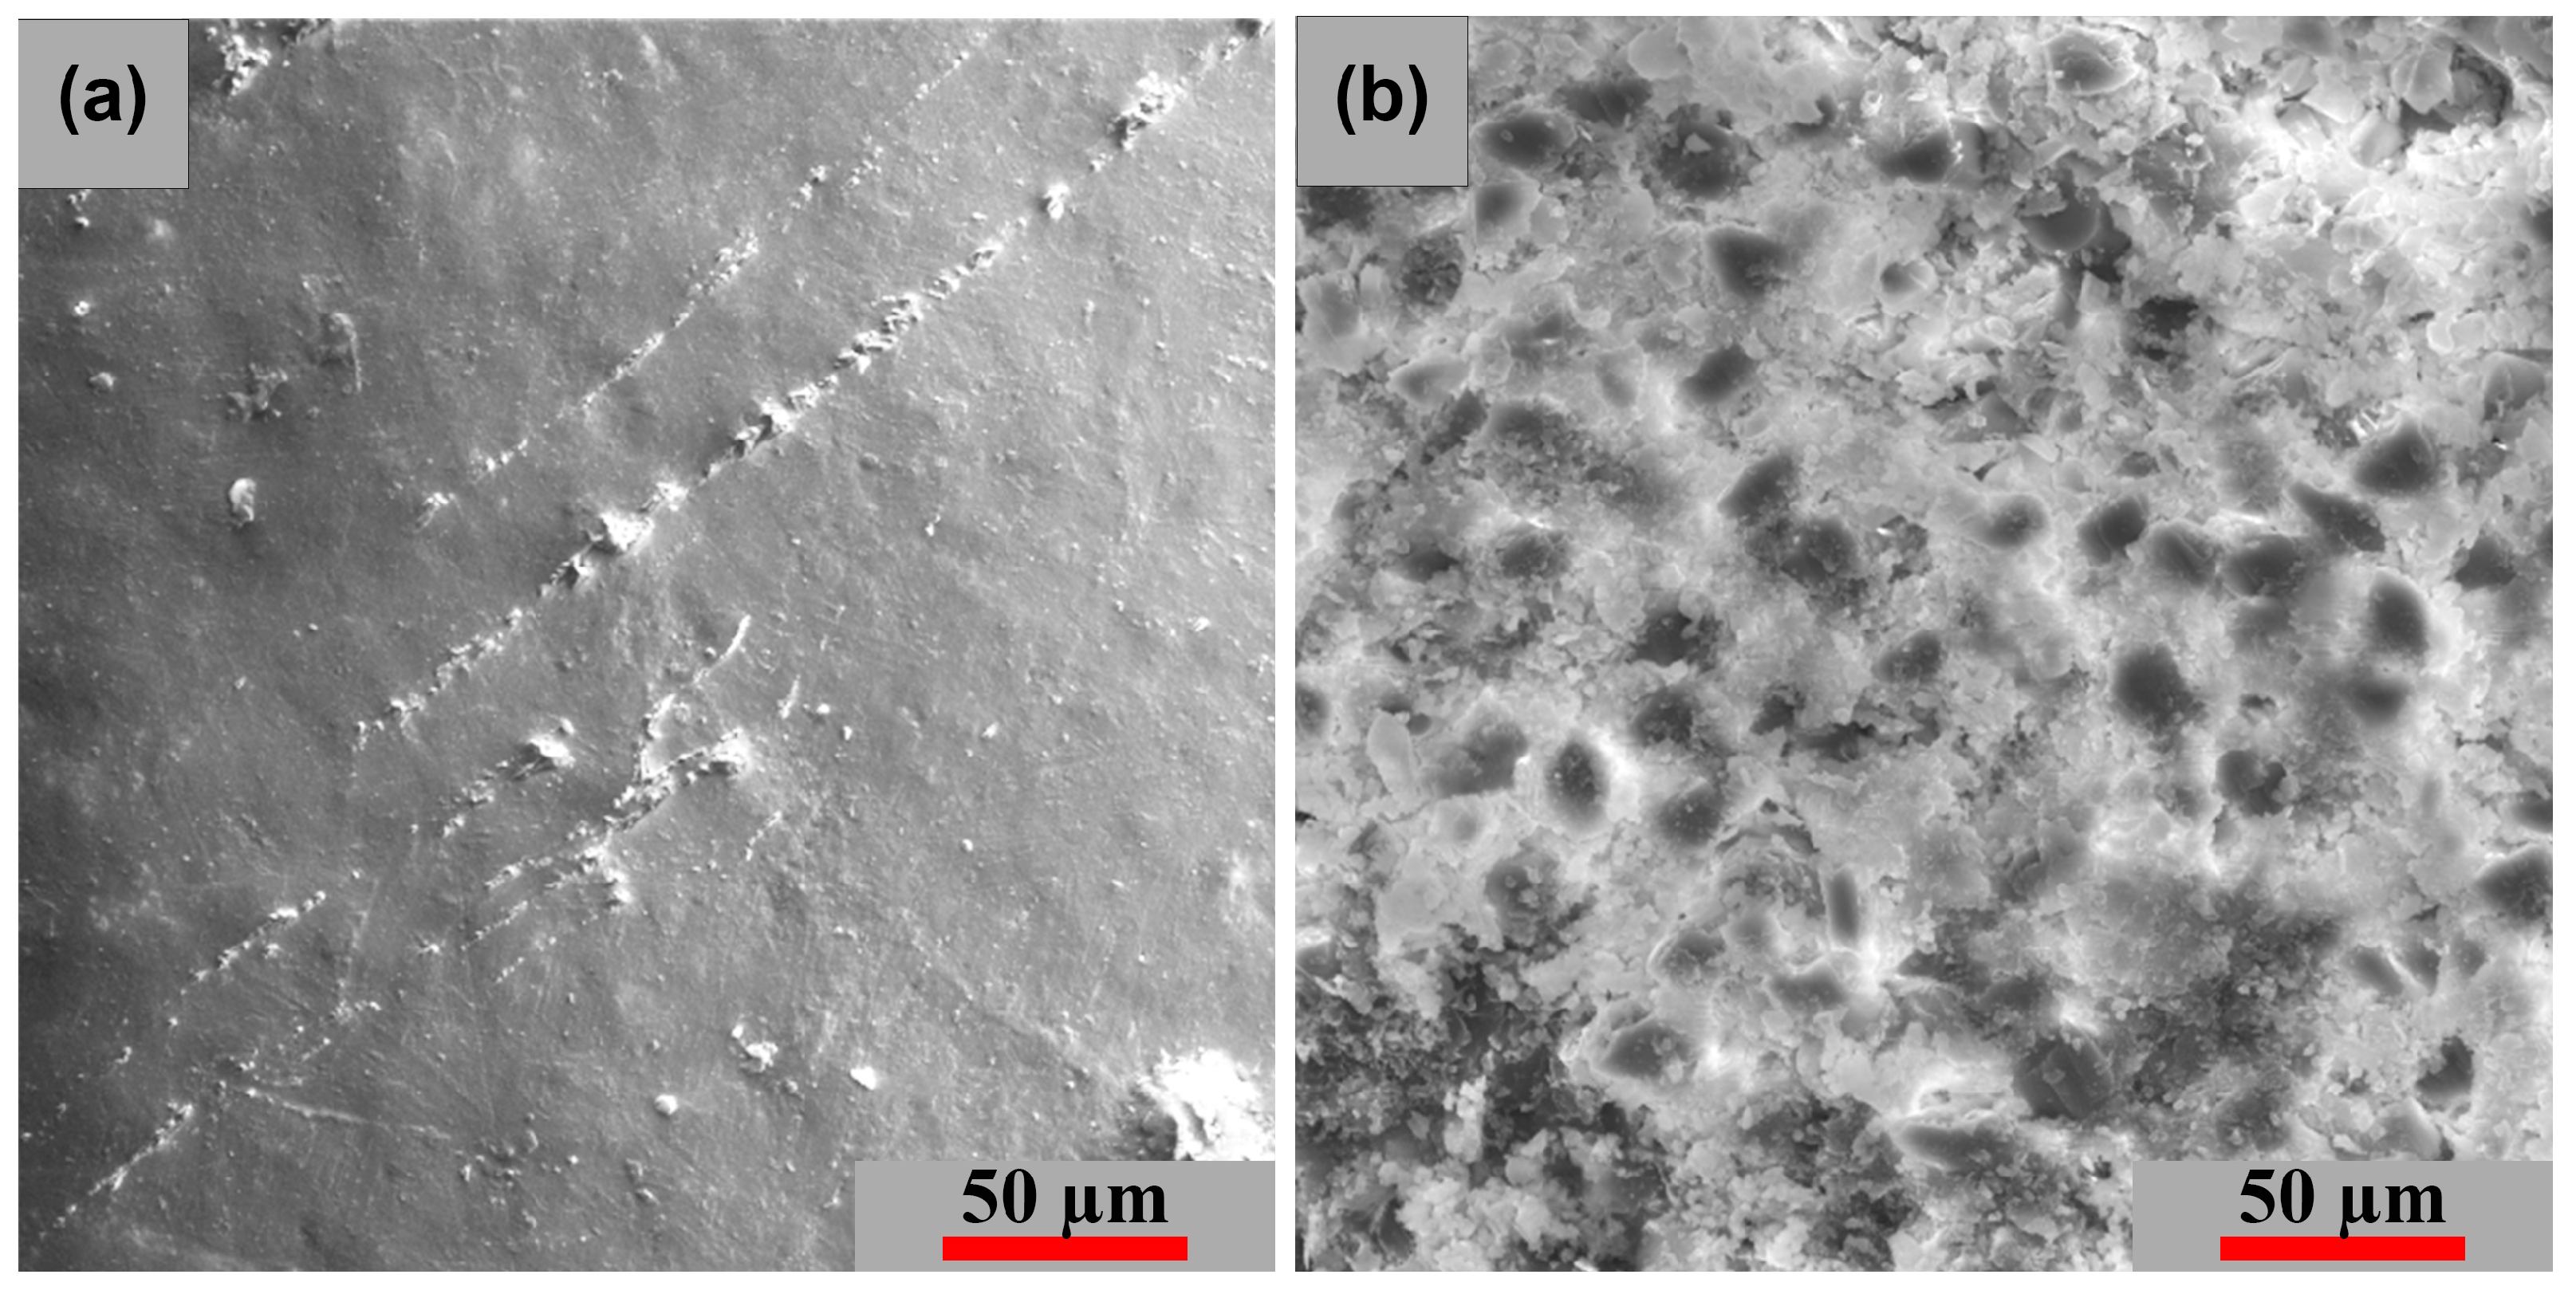
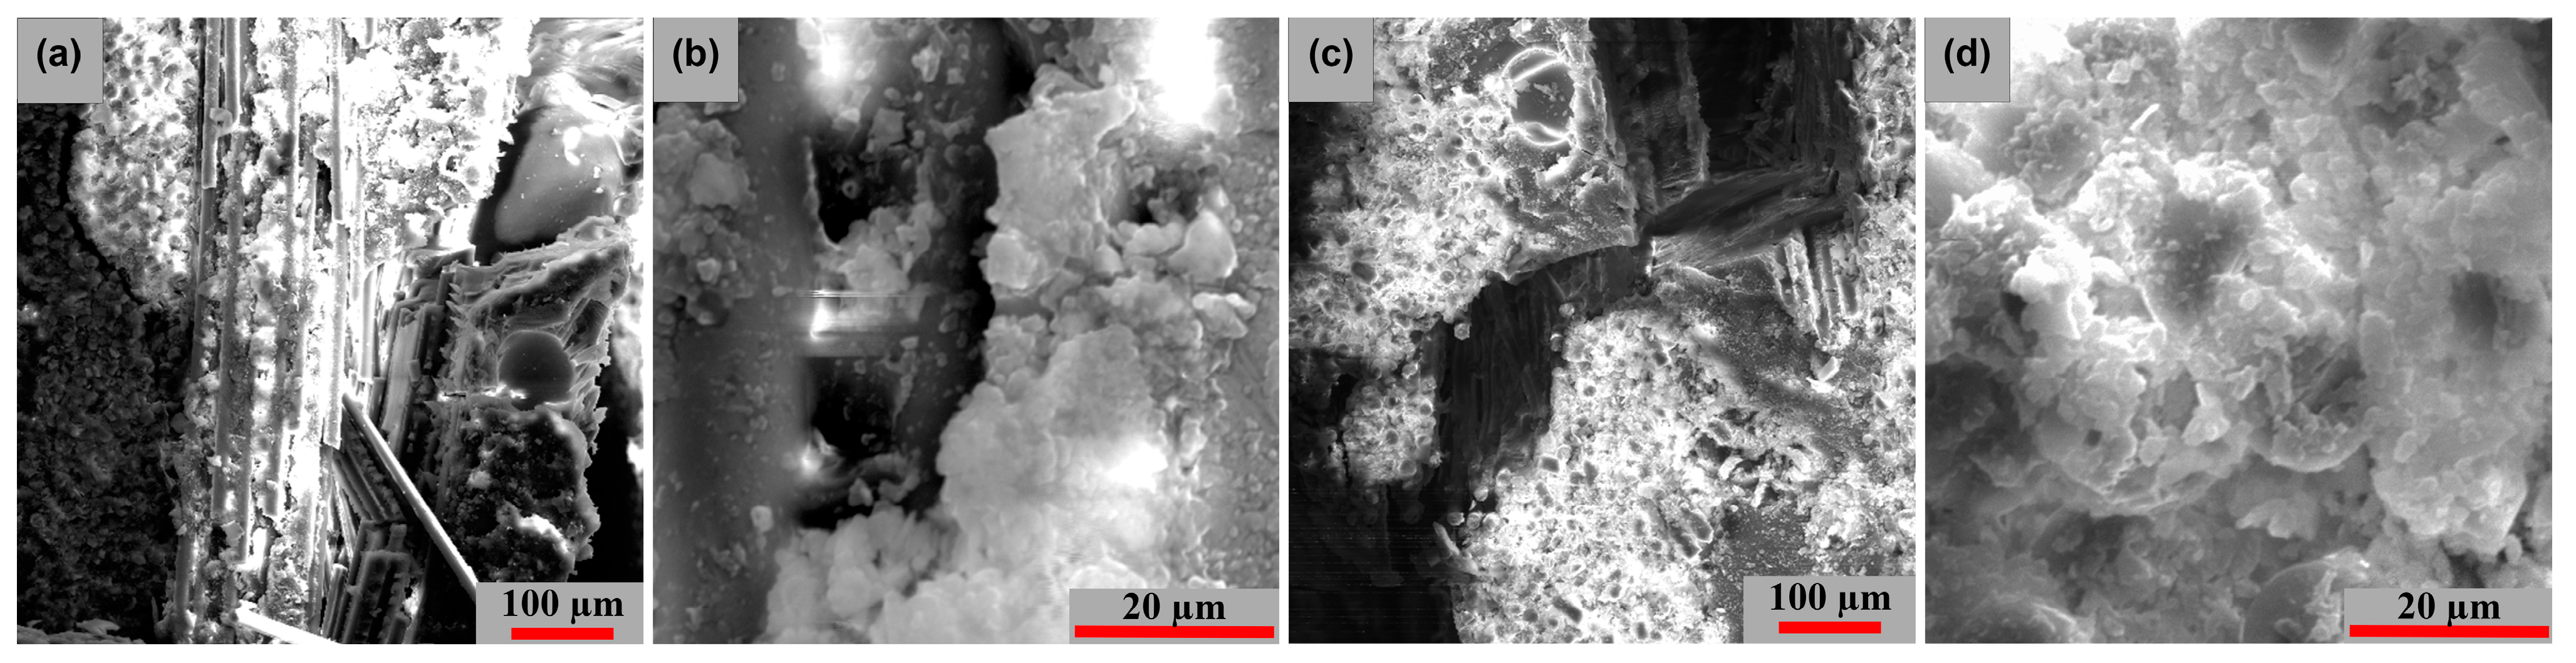
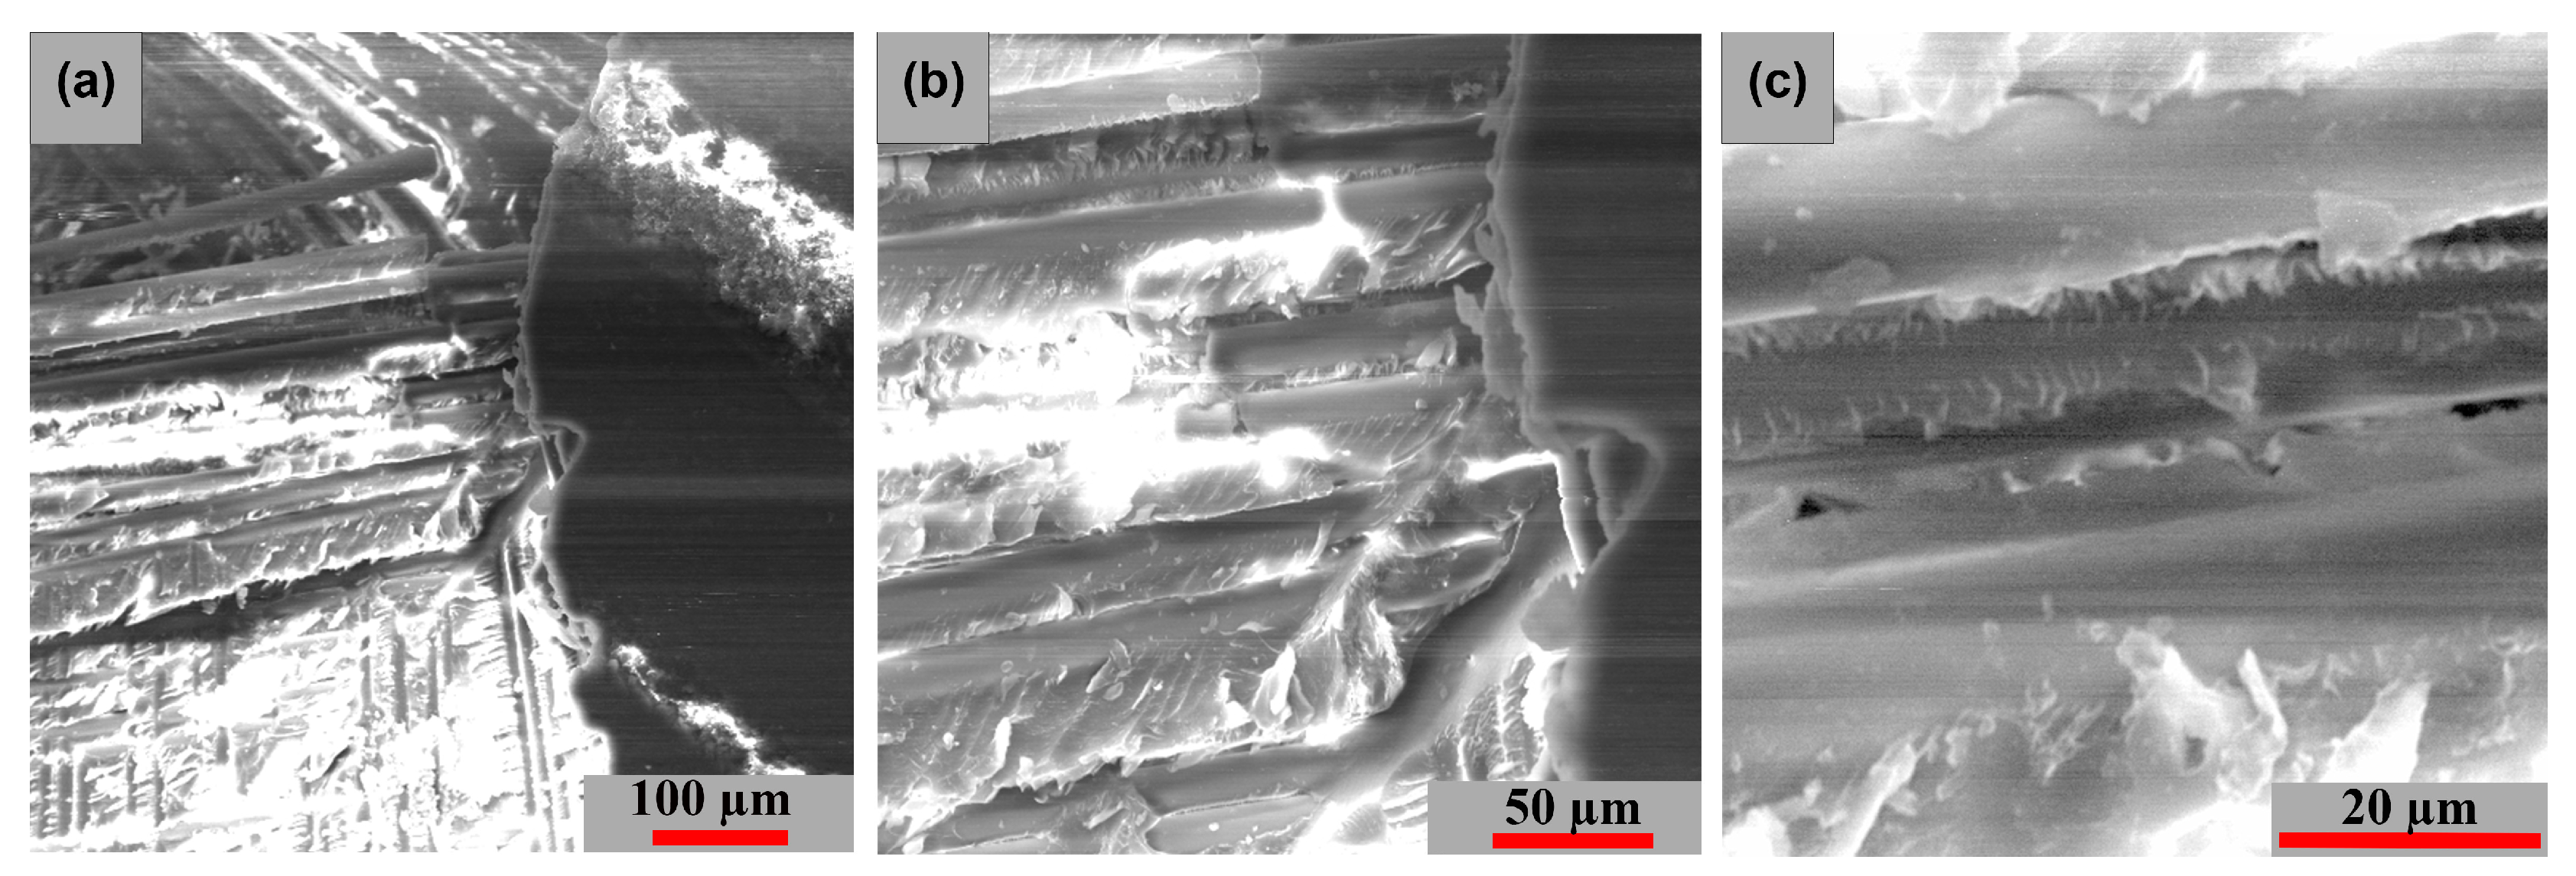
3.4. SEM Surface at [−45°/0°/+45°/90°]
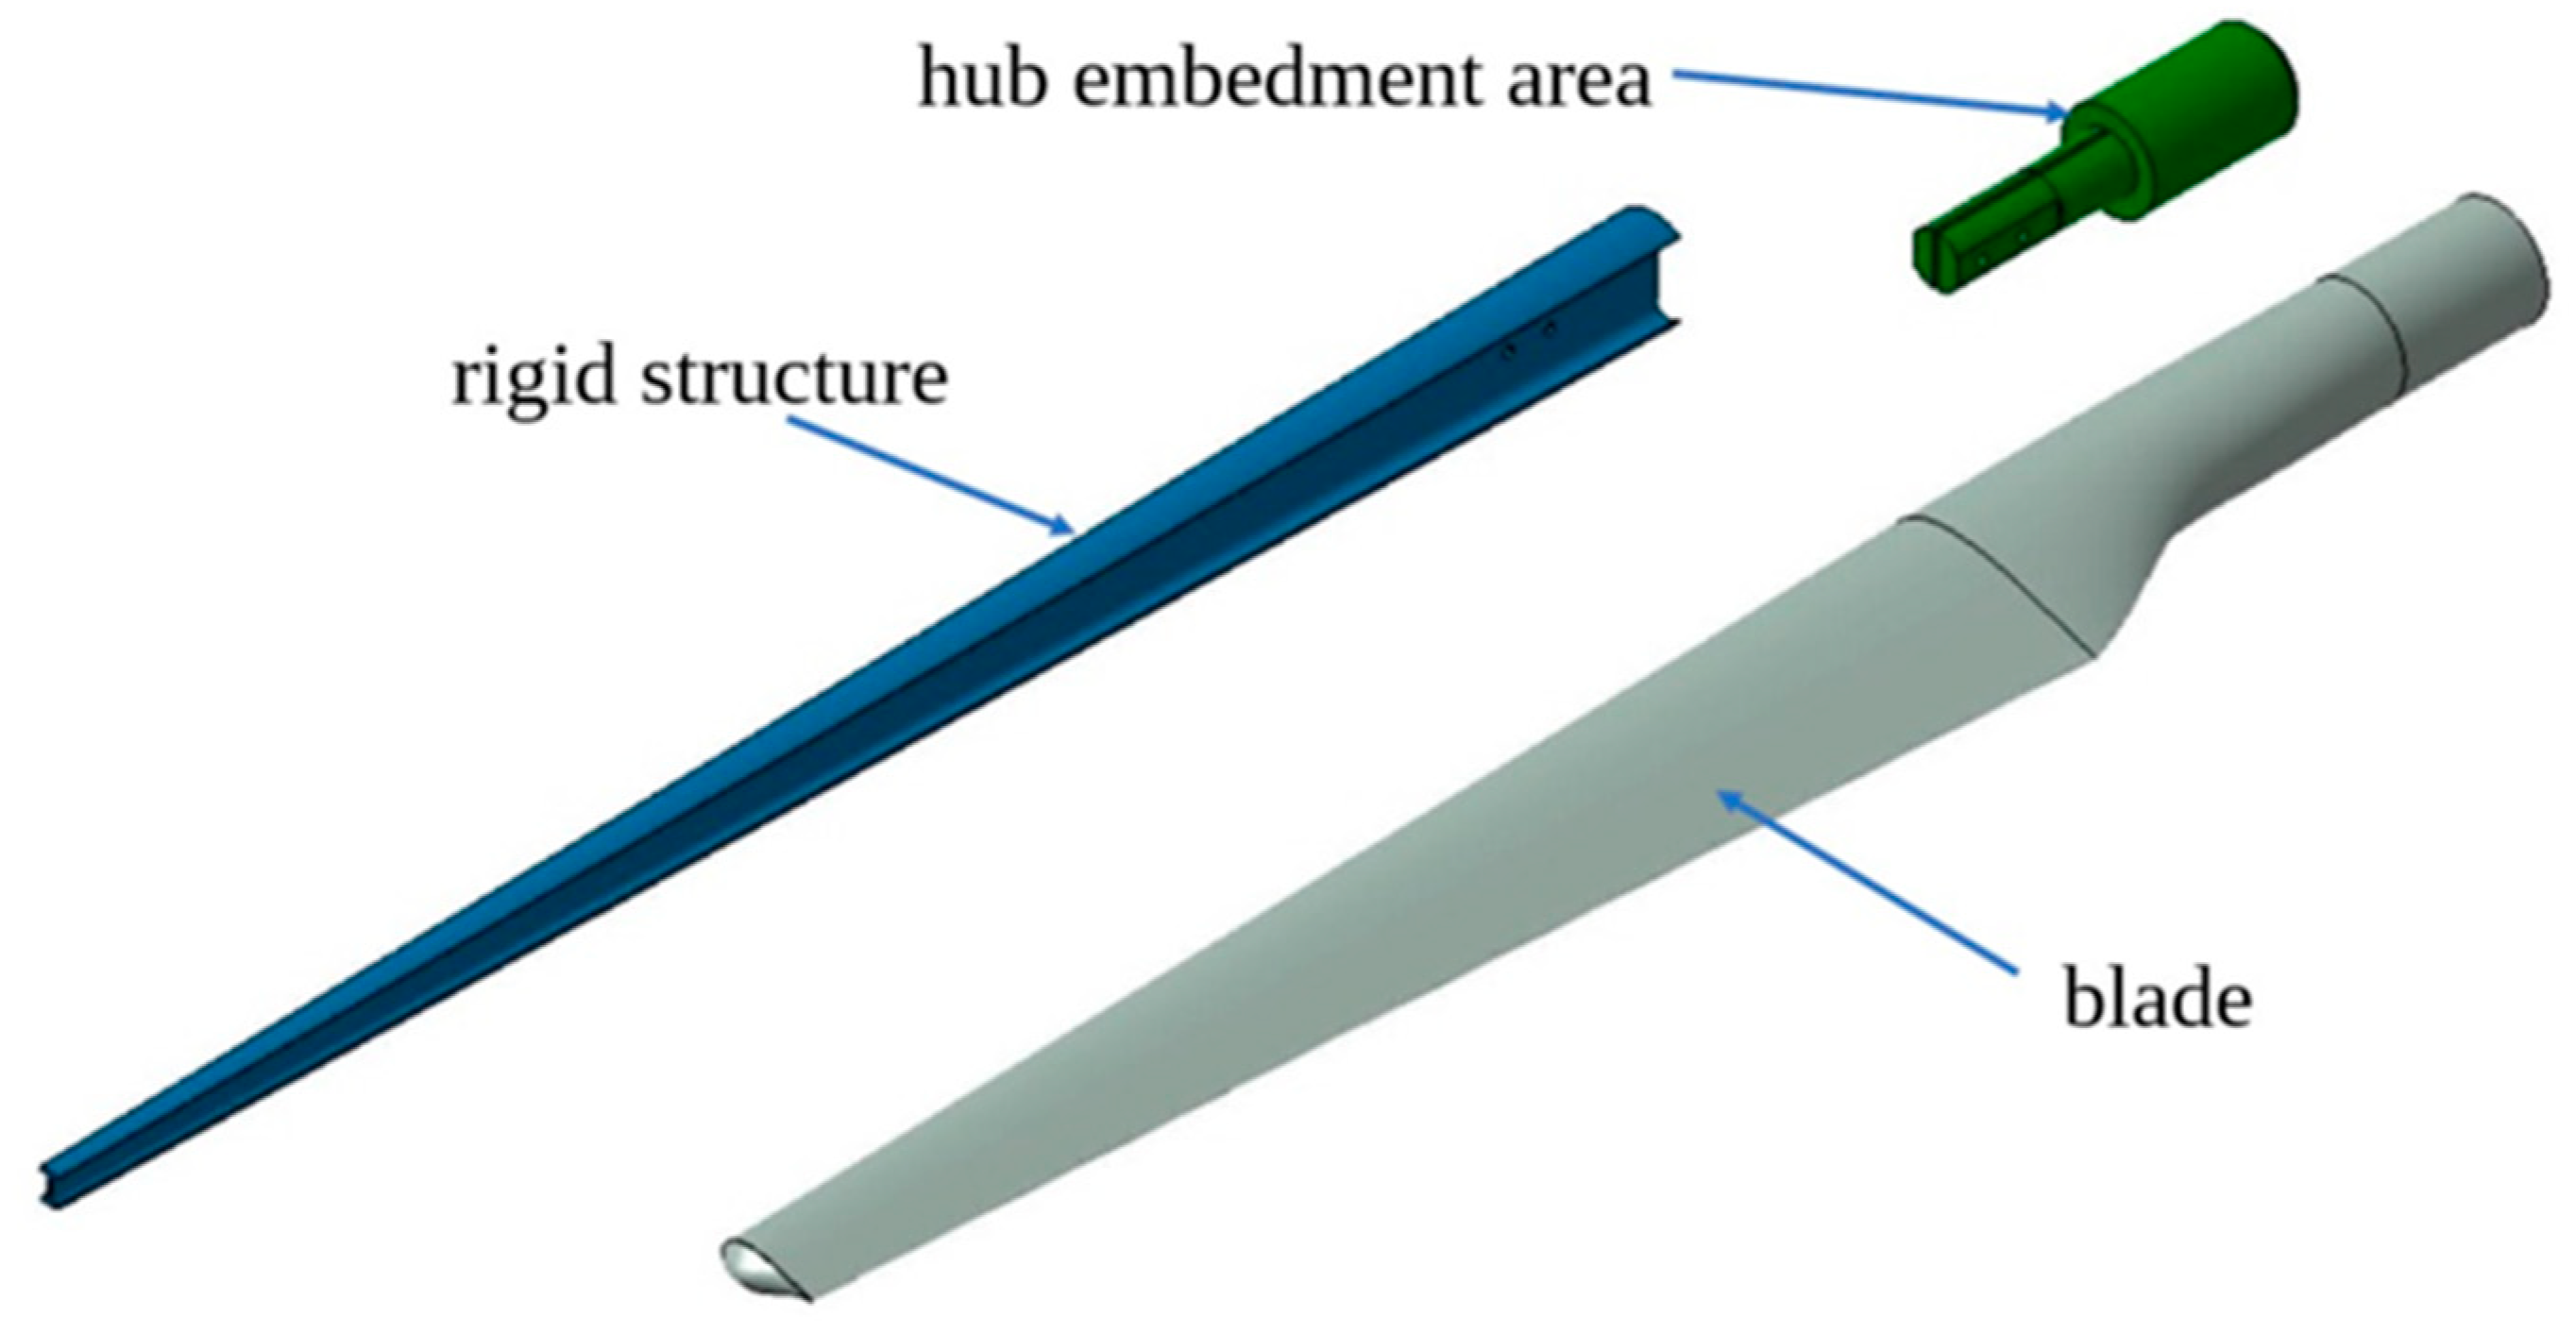
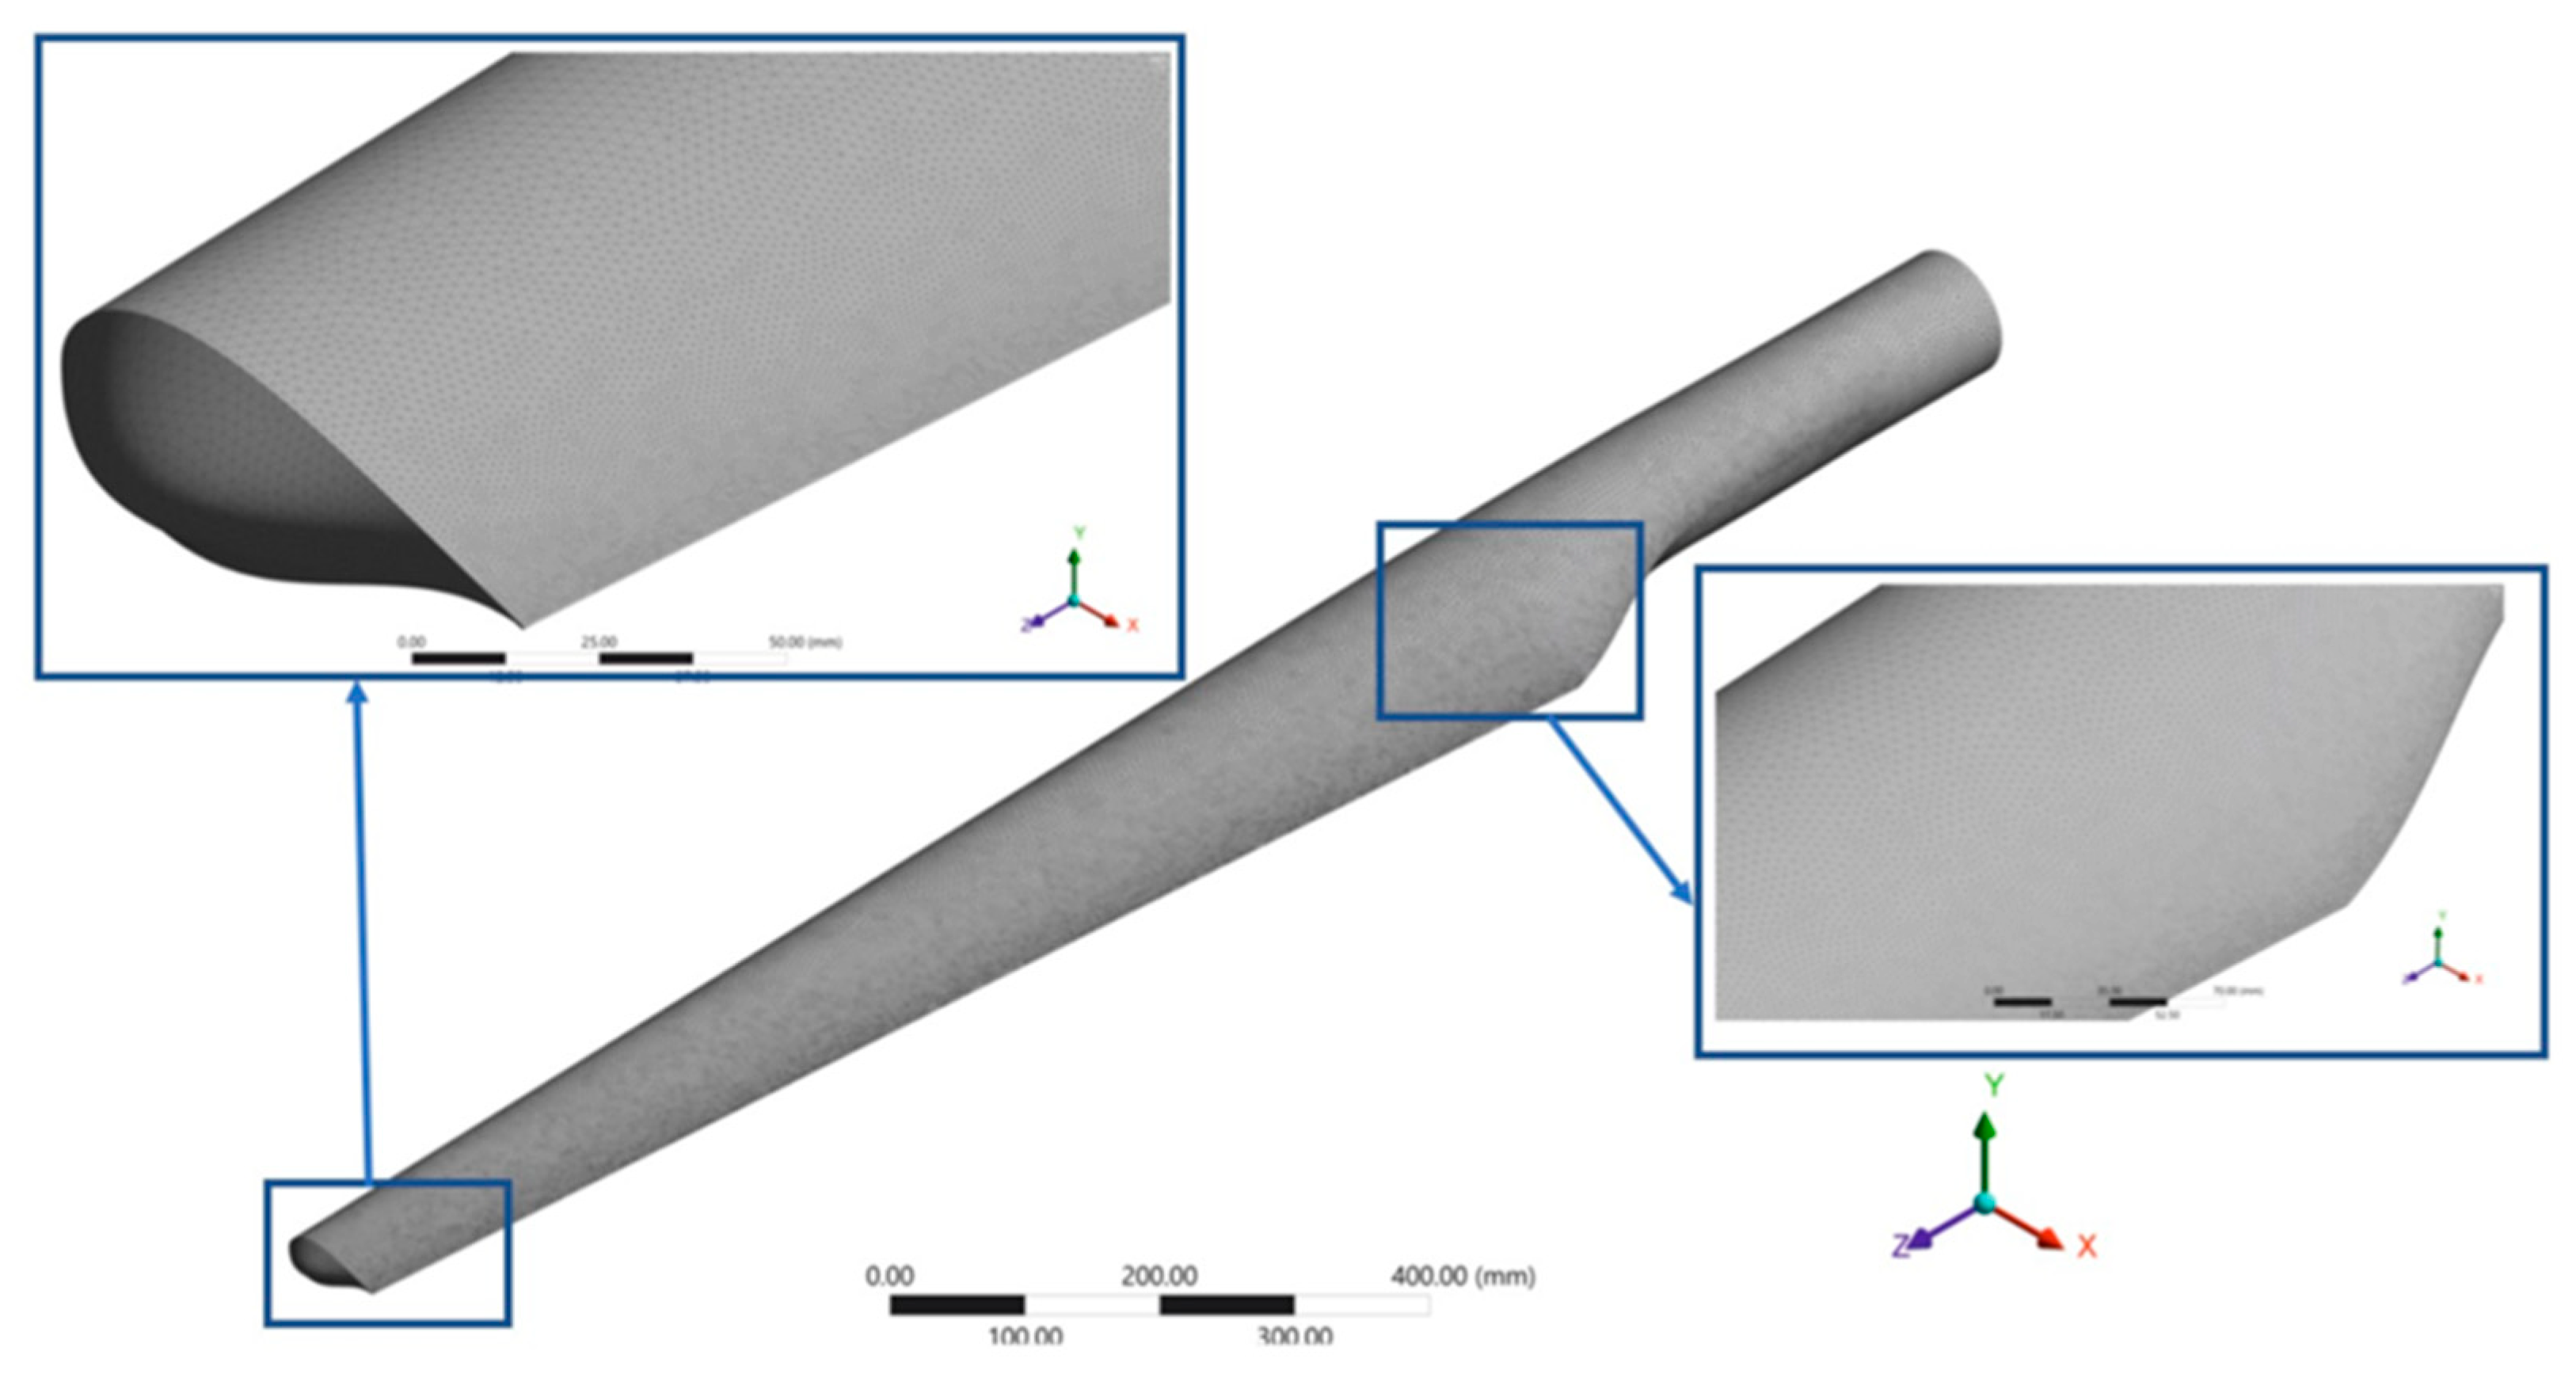
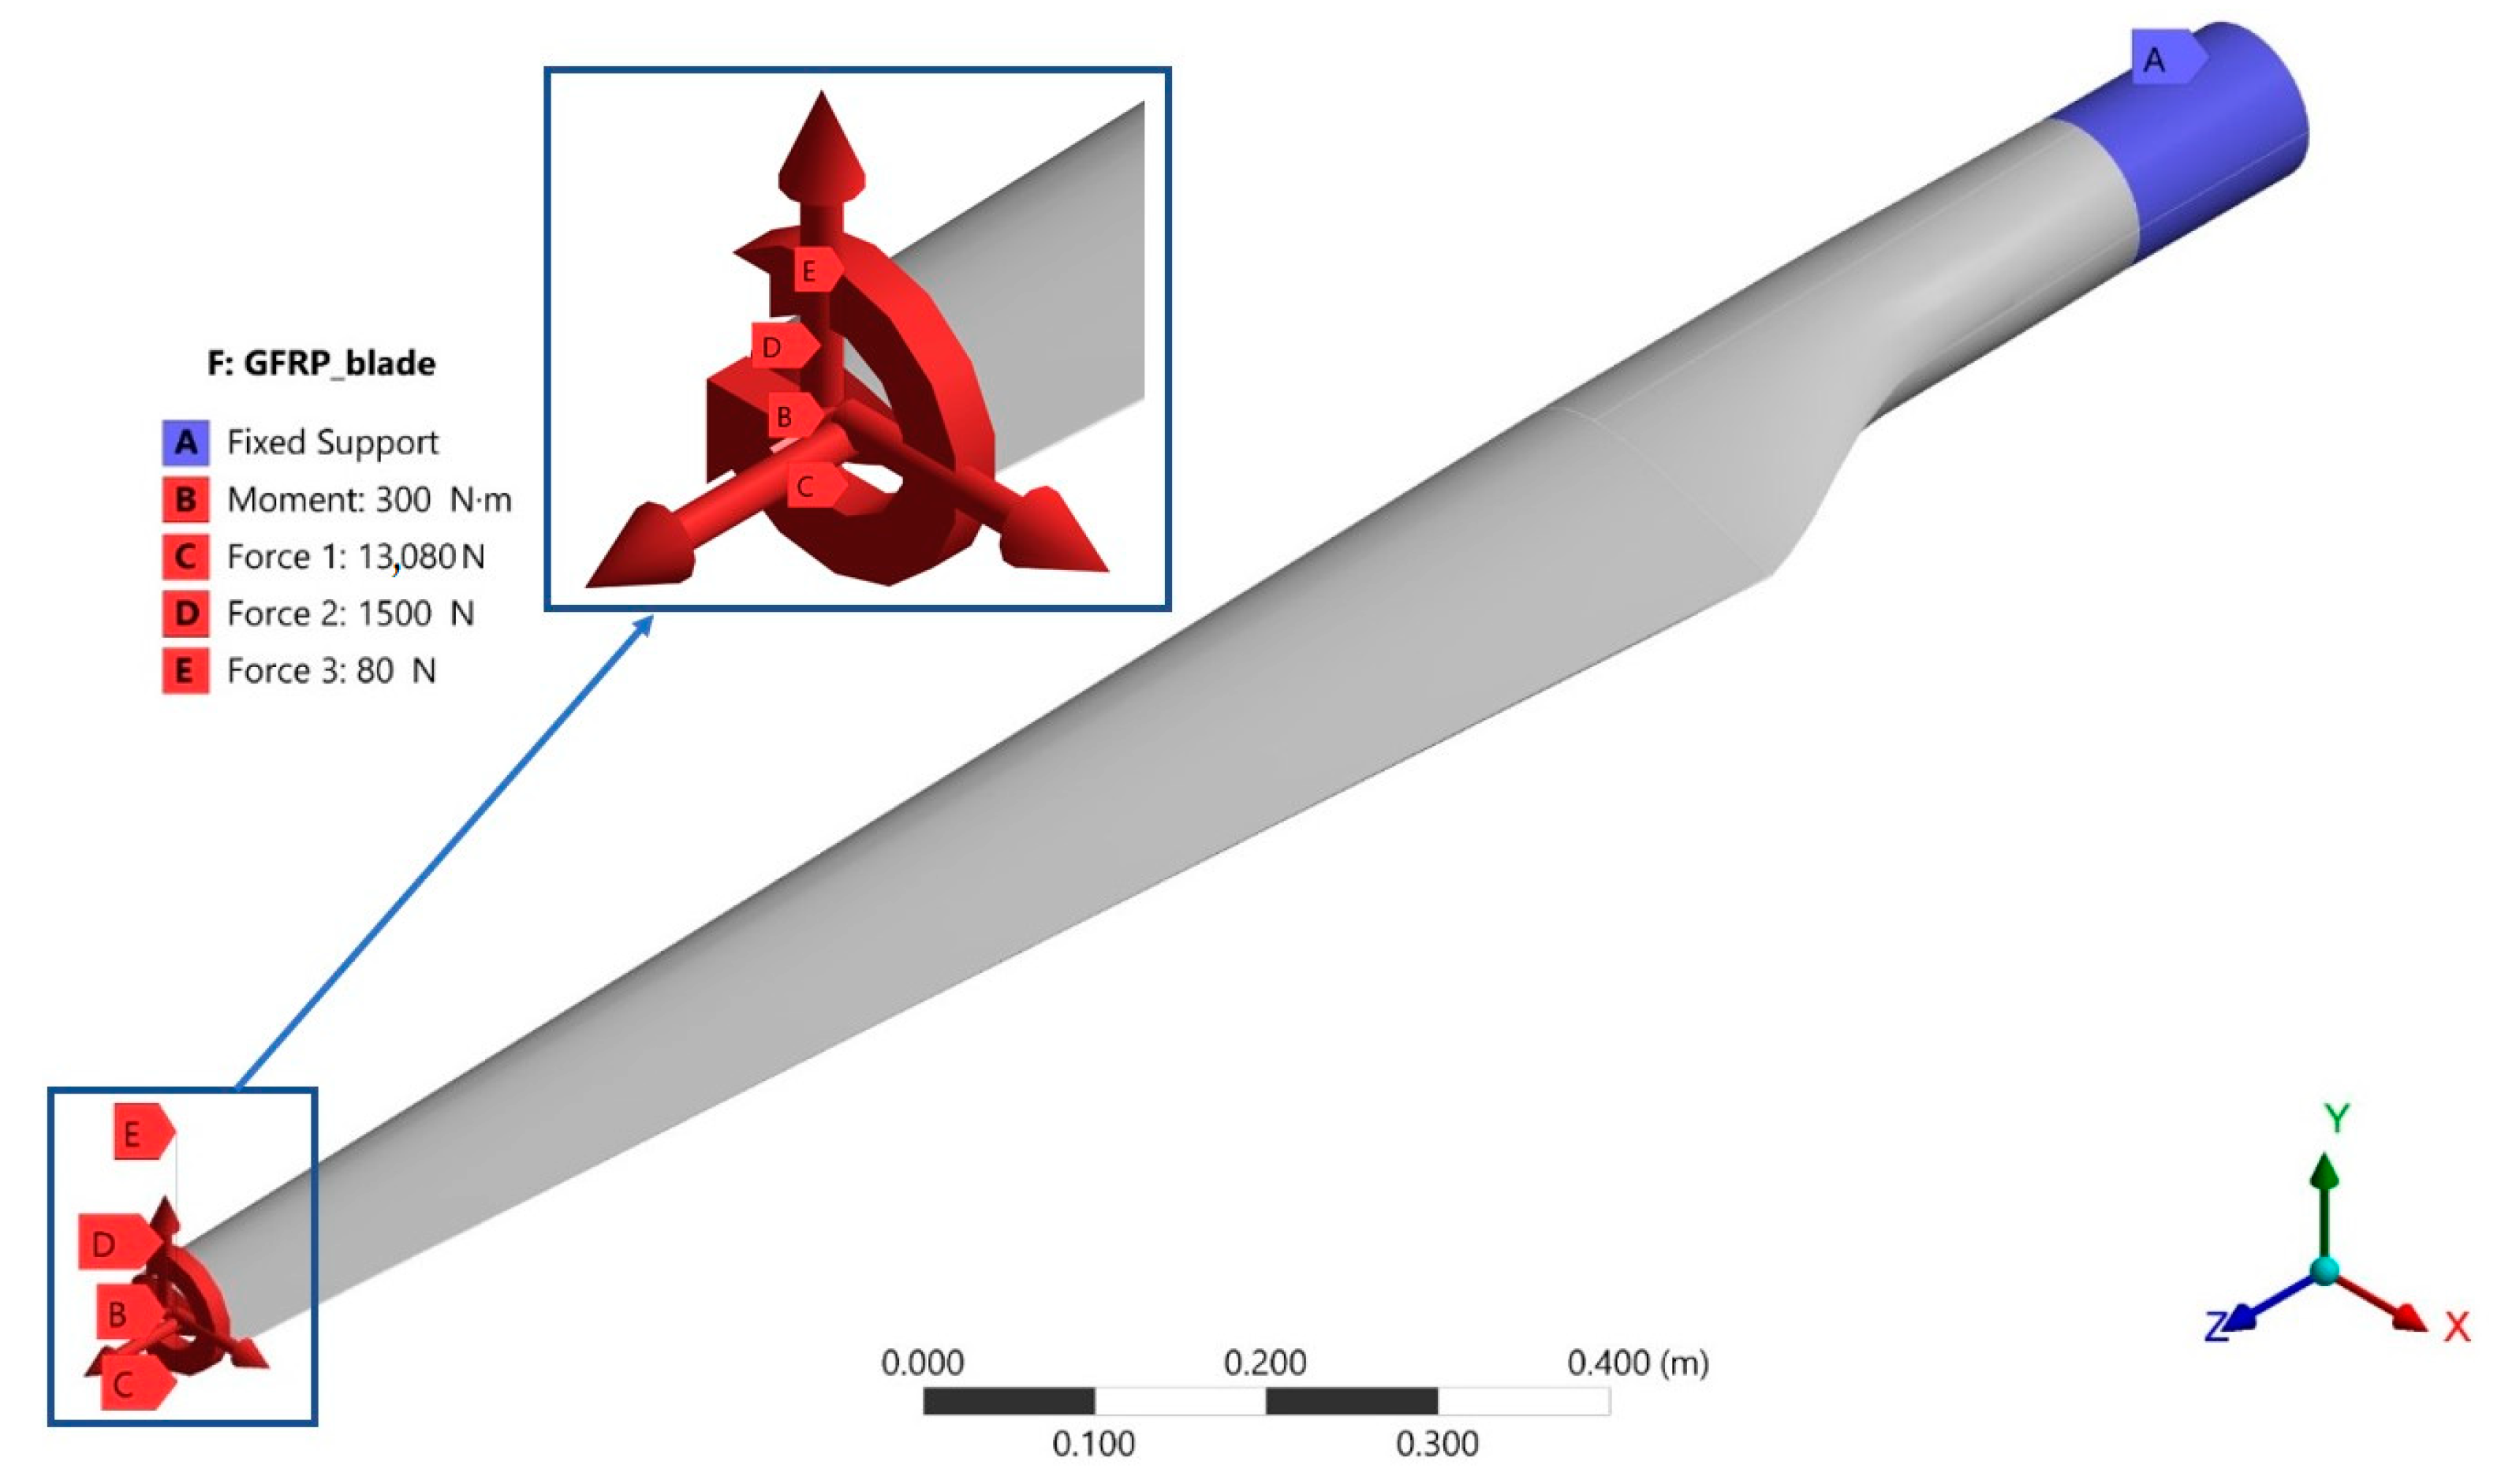
3.5. Finite Element Analysis of a Wind Turbine Blade
- -
- Torque (B) around the Z axis, with a value of 300 Nm;
- -
- Tensile force (C) oriented in the positive direction of the Z axis, which represents the sum of the centrifugal force and the gravitational force, equal to 13,080 N (this value corresponds to the position of the blade below the rotor hub, in the vertical direction);
- -
- A force oriented in the positive direction of the Y axis, which represents the normal component of the aerodynamic force (D), with a value of 1500 N;
- -
- The tangential component of the aerodynamic force (E), oriented in the positive direction of the X axis, with a value of 80 N.
3.6. Turbine Blade Calculation at Static Loading
4. Conclusions
- In tensile tests, the material’s behavior is anisotropic due to the different tensile stresses occurring in all directions on the two-plate GFRP;
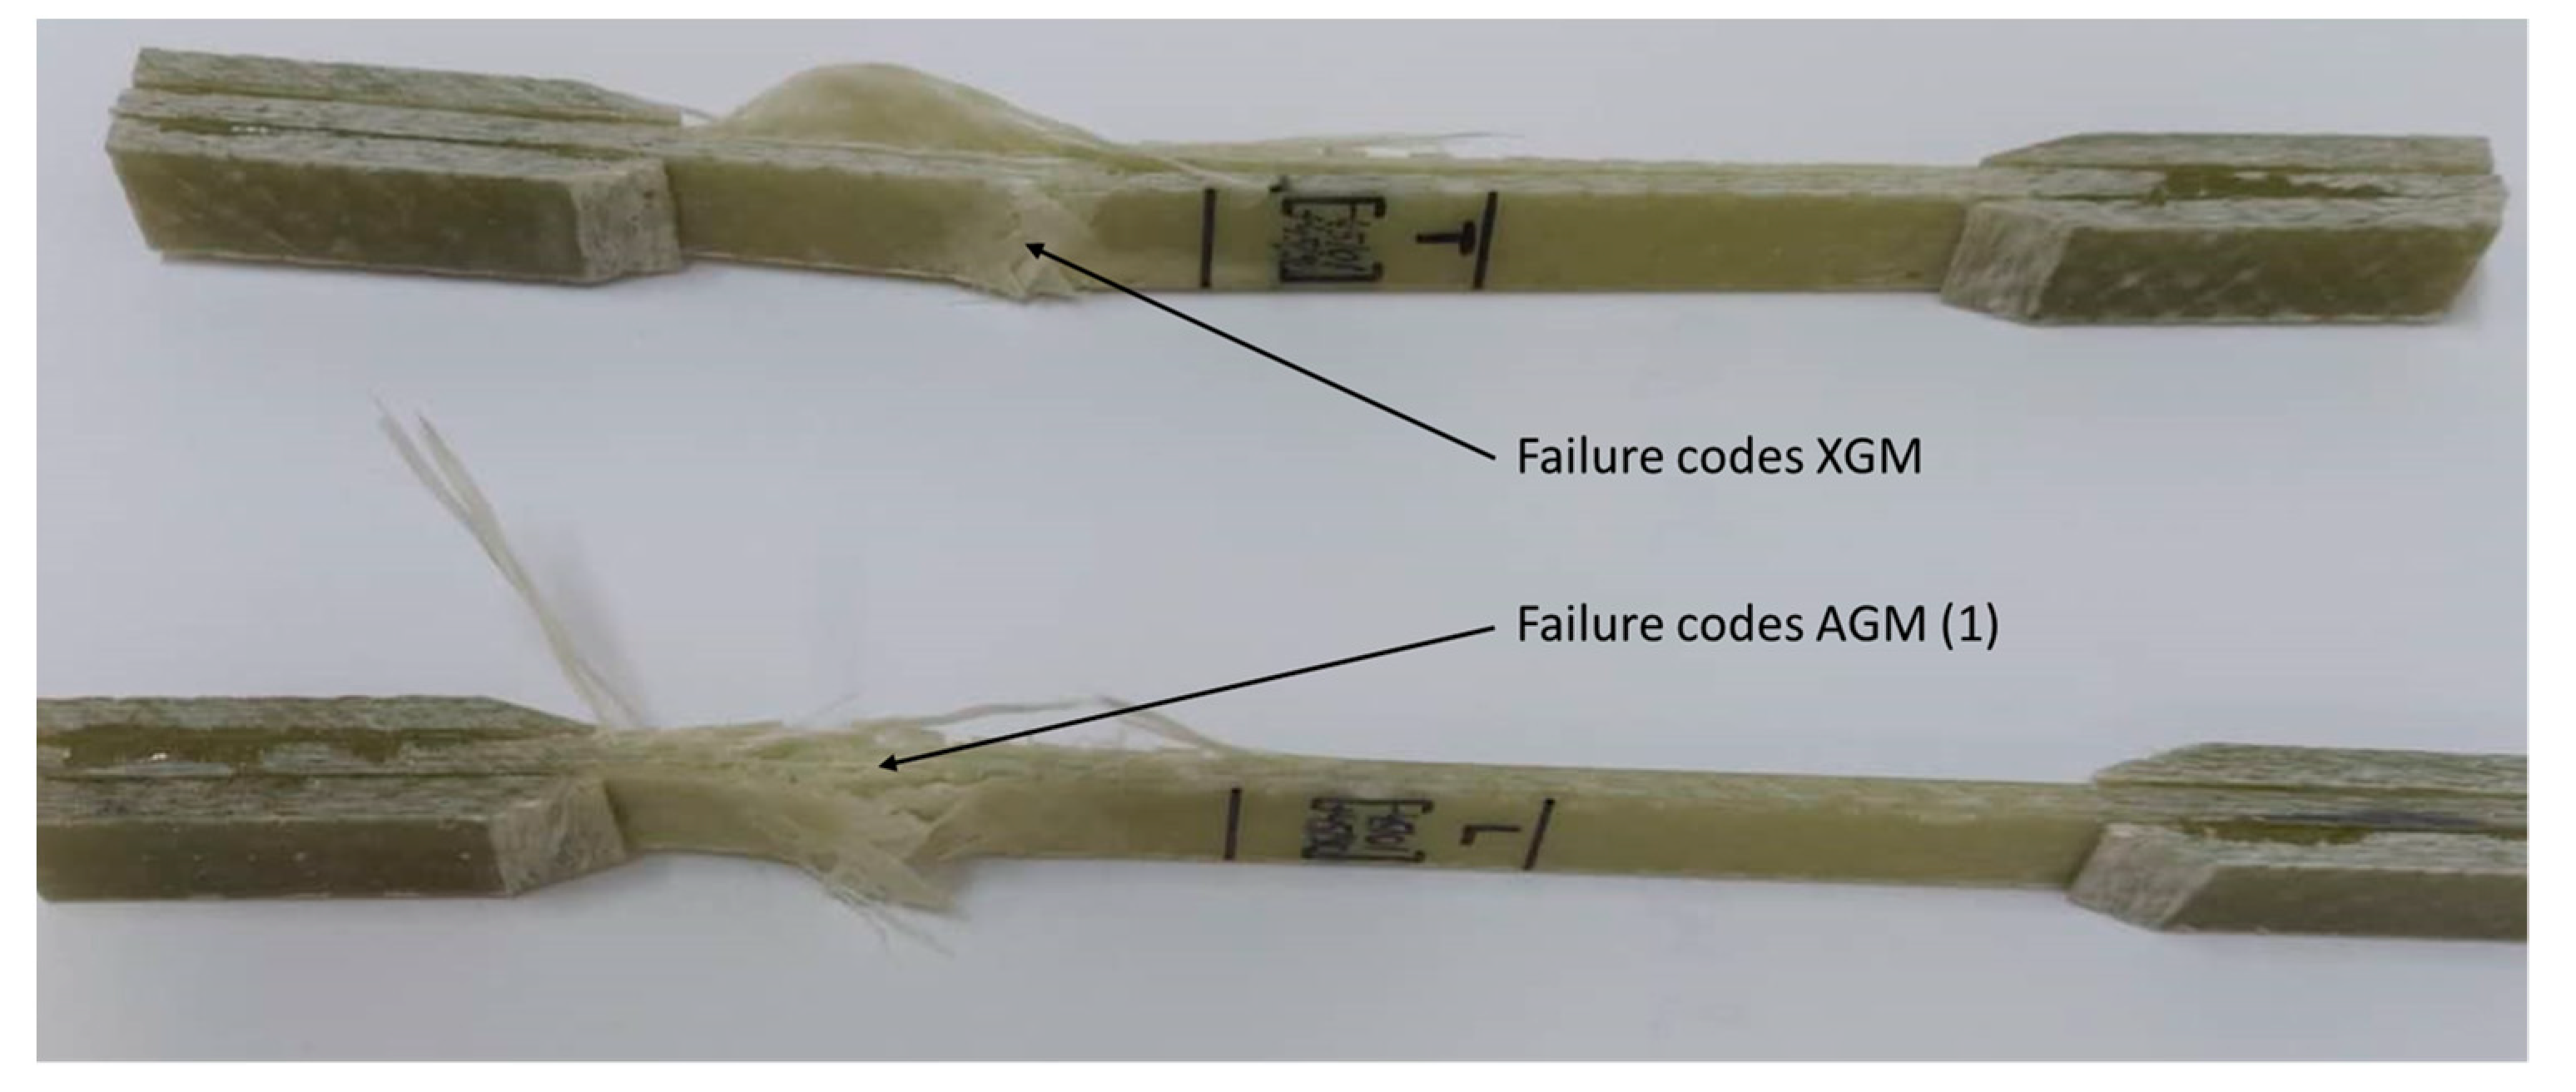
- Samples that were cut from the [0°/90°] plate in the TR direction had the highest resistance to the force applied parallel to the direction of force application. This is mainly caused by the alignment of the reinforcing fibers;
- Tensile loading of the sample cut at 45° from the [0°/90°] plate resulted in much lower ultimate tensile strength values than those obtained by loading in the other two directions. On the other hand, the elongation, and therefore strain, on this sample was much higher than on the other two;
- A different value for Young’s modulus was obtained for the sample loaded and cut at 45° relative to the other two directions, from the plate with the fibers oriented [0°/90°];
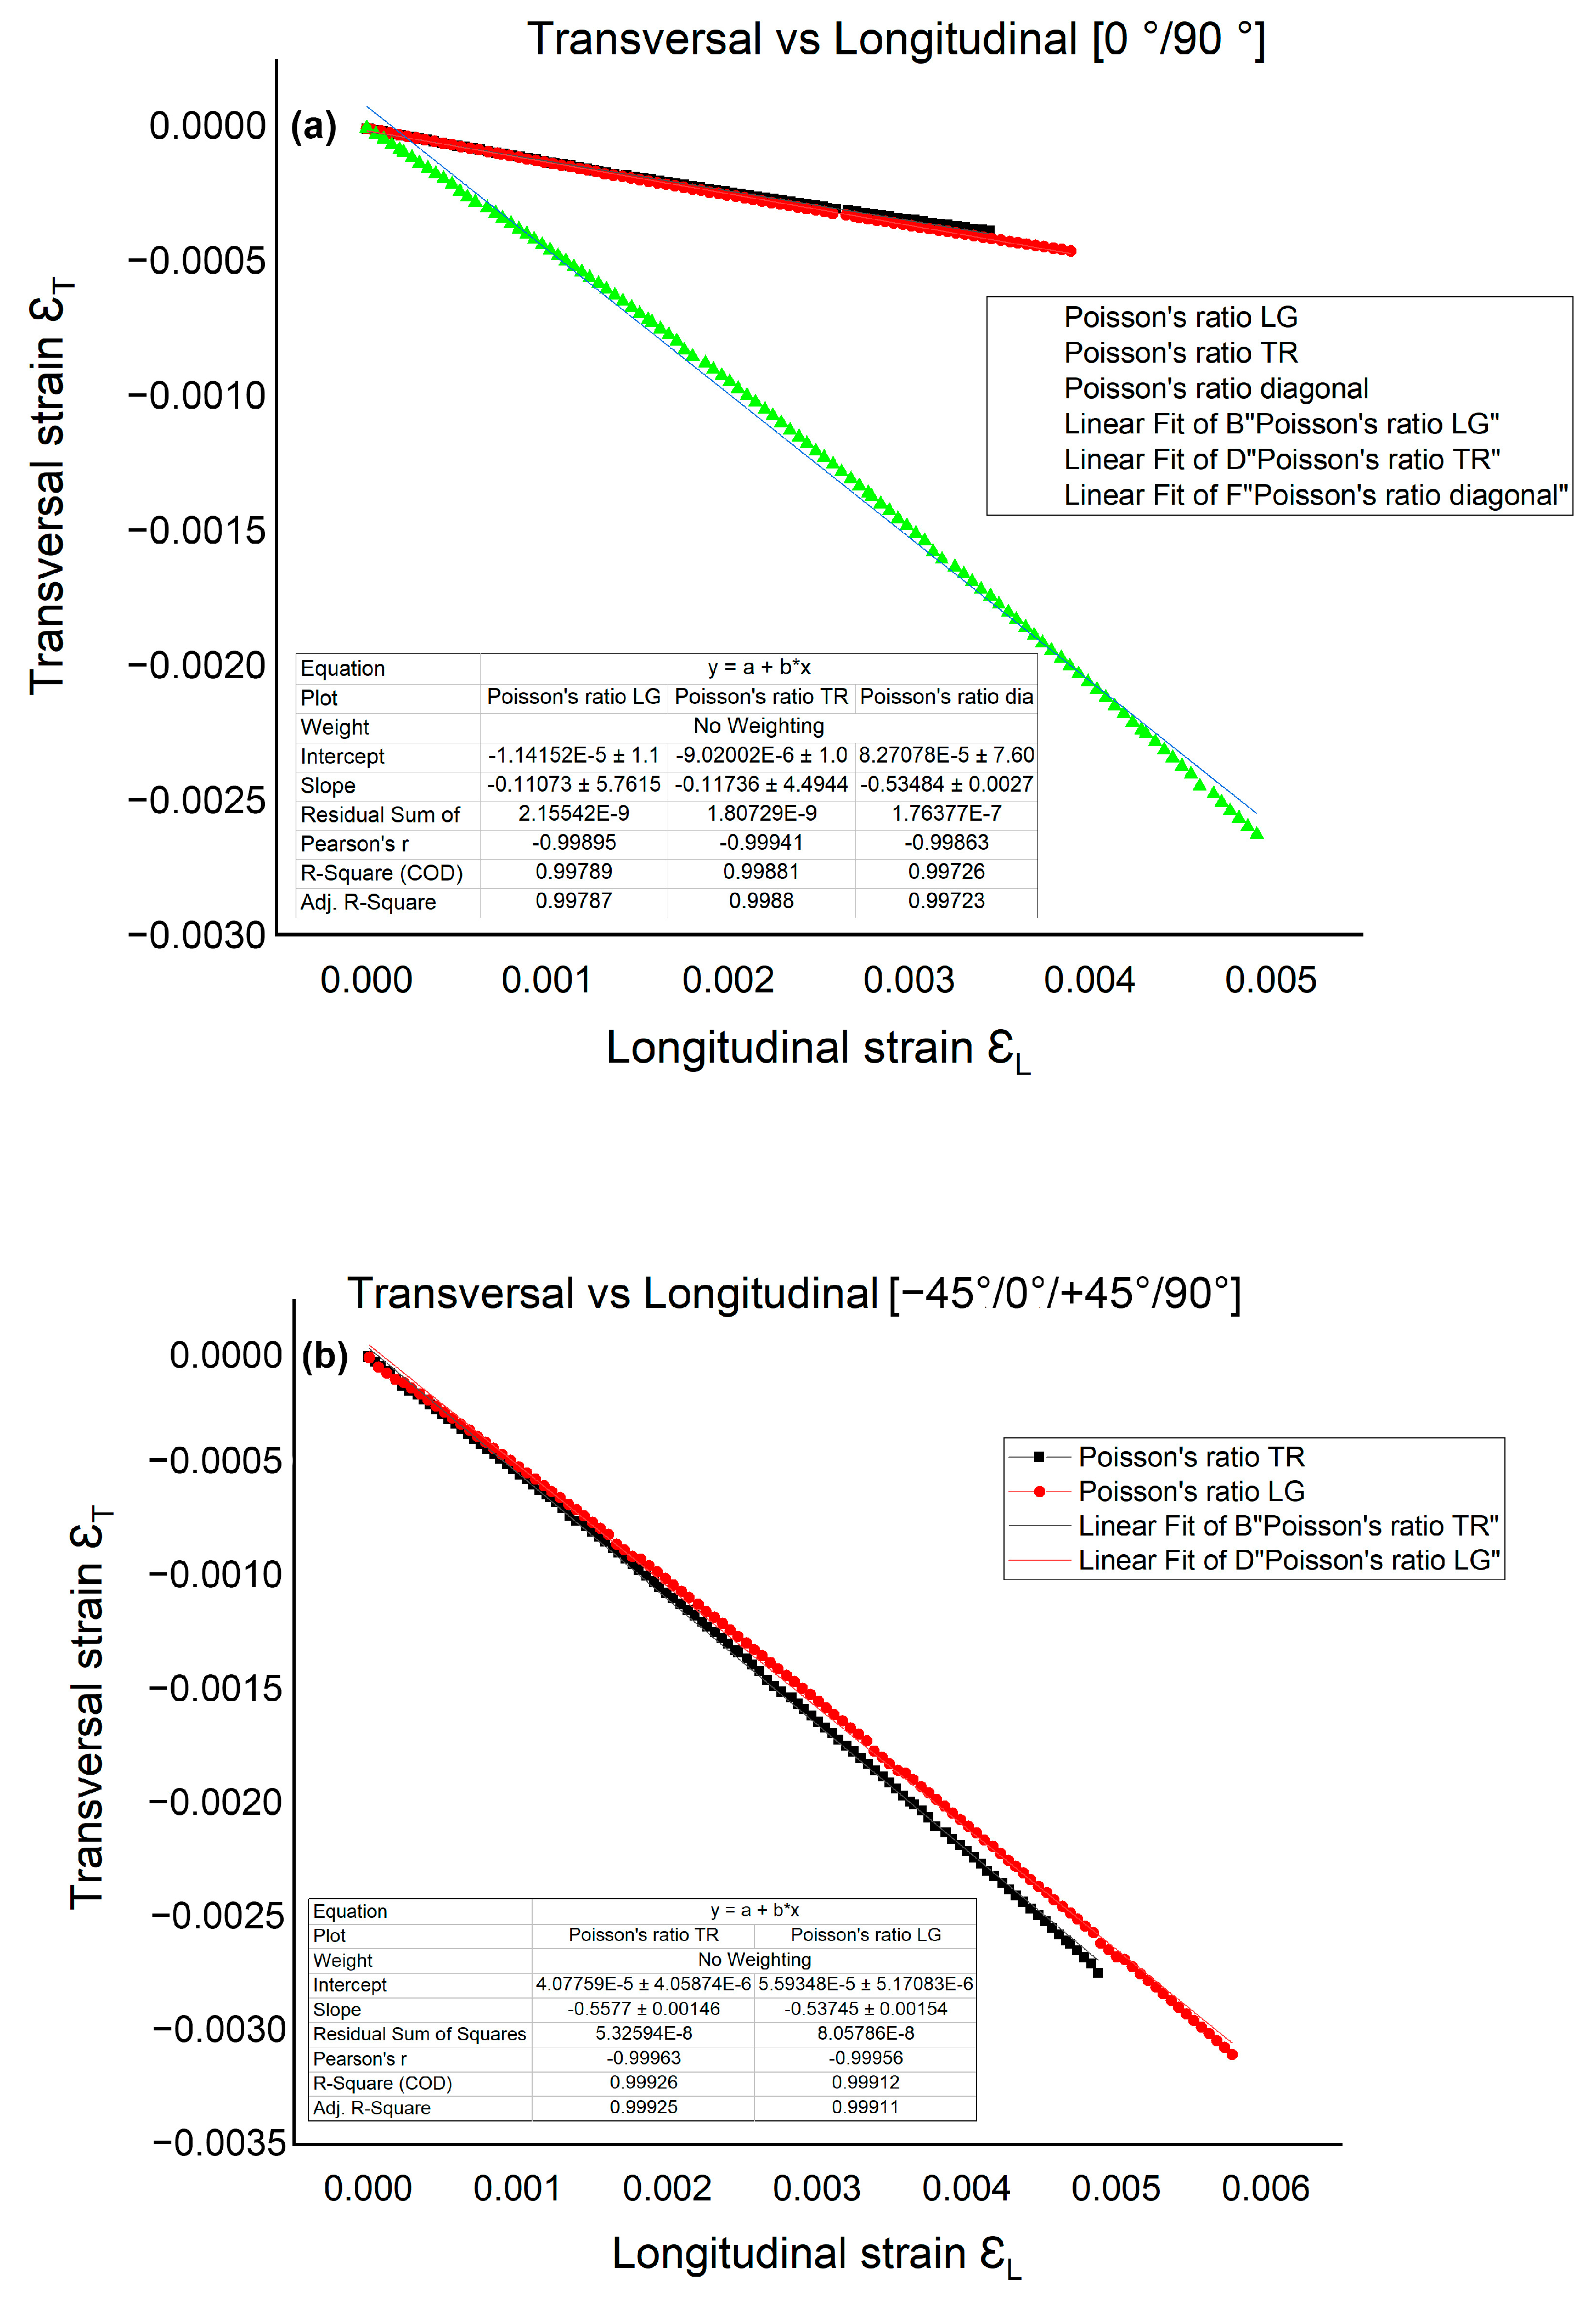
- For the [0°/90°] plate, a much different value of the Poisson ratio was obtained in the 45° loading direction, compared to the other two directions. This difference, as for the difference in Young’s modulus, is explained by the fact that there are no fibers in the loading direction that directly oppose the stress. For the [0°/90°] plate, a much different value of the Poisson ratio was obtained in the 45° loading direction, compared to the other two directions. This difference, as the difference in the Young’s modulus, is explained by the fact that there are no fibers in the loading direction that directly oppose the stress;
- The values for the Poisson ratio for the [−45°/0°/+45°/90°] plate obtained on the two loading directions were similar. However, they are also found to be similar to the value obtained for the [0°/90°] plate cut and loaded at 45°. This is explained by the fact that the two directions in which the plate was cut did not contain fibers that were placed exactly in the direction of the load;
- For the [0°/90°] plate orientation, a fiber break in the transversal direction has been highlighted. Additionally, a delamination at the intermediate layers, with the fracture exhibiting moderate behavior, has been observed. For the [−45°/0°/+45°/90°] transversal plate, a more compact and uniform morphology model of these fibers has been shown, while for the longitudinal plate a more pronounced dislocation has been exhibited;
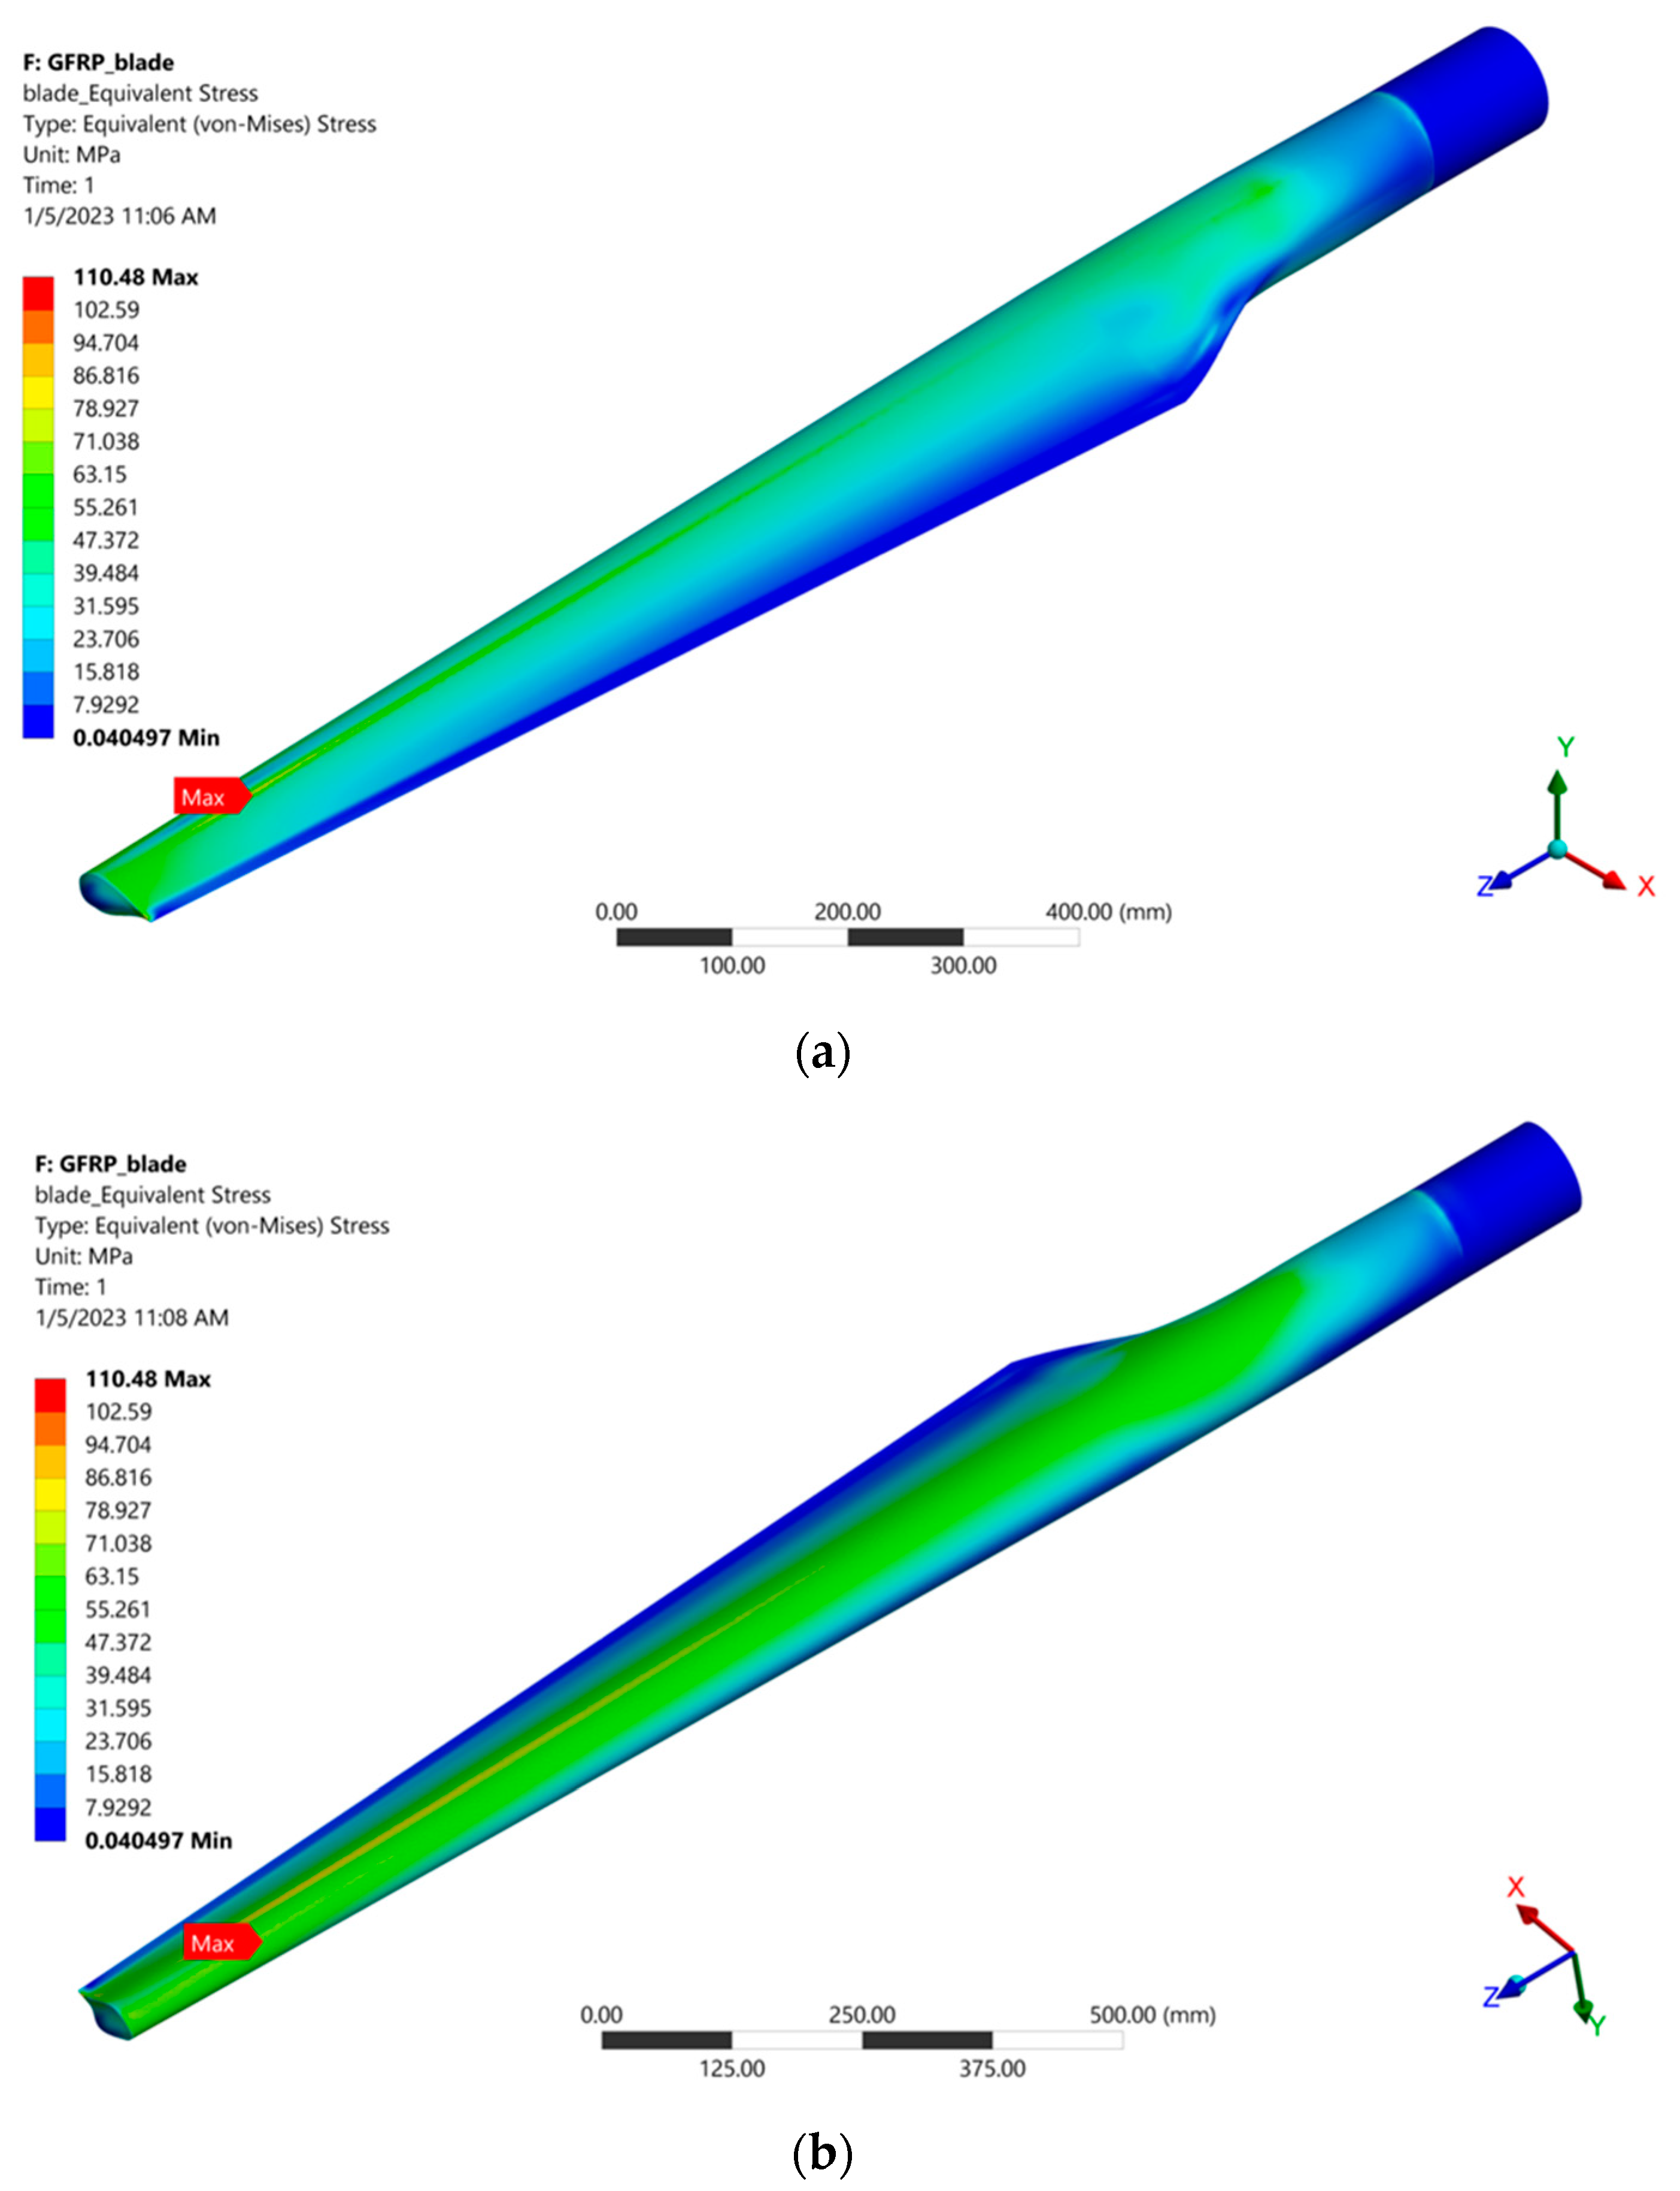
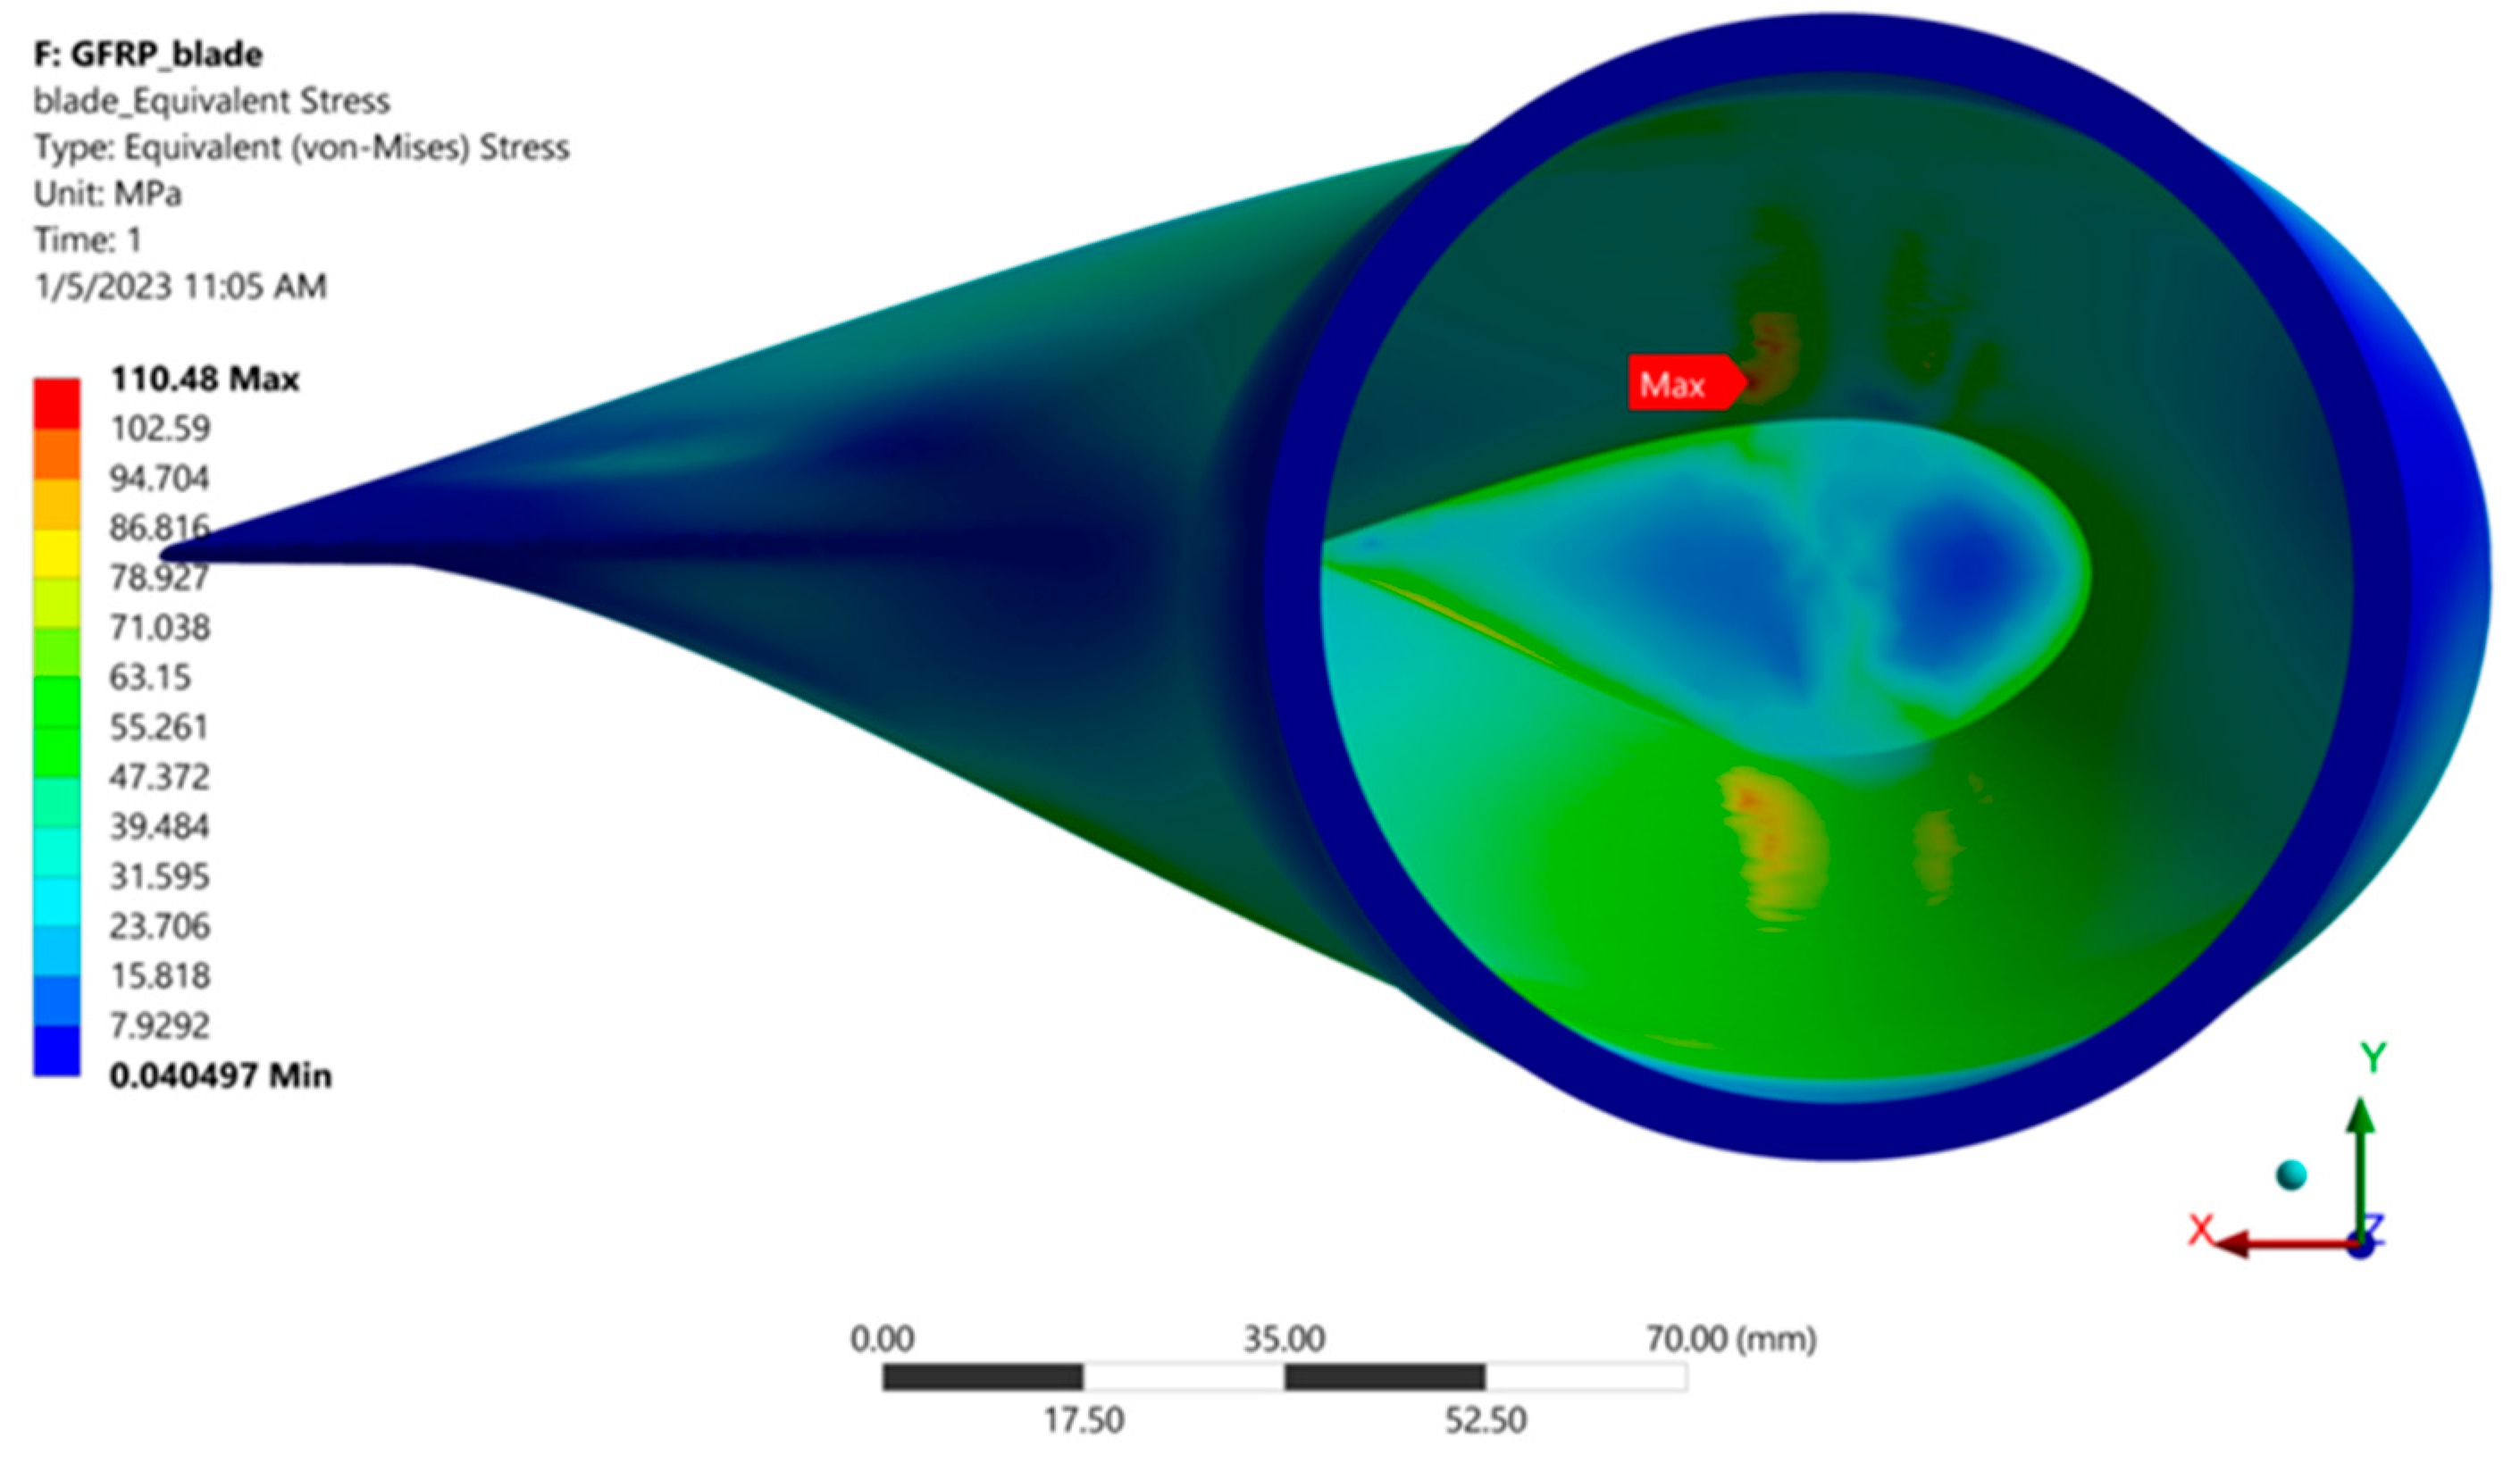
- Using ANSYS Academic R17.2 software, a FEA was undertaken for a wind turbine blade with a diameter of 4 m, considering the static loads applied to the tip of the blade. For this purpose, the elastic characteristics of the material were considered;
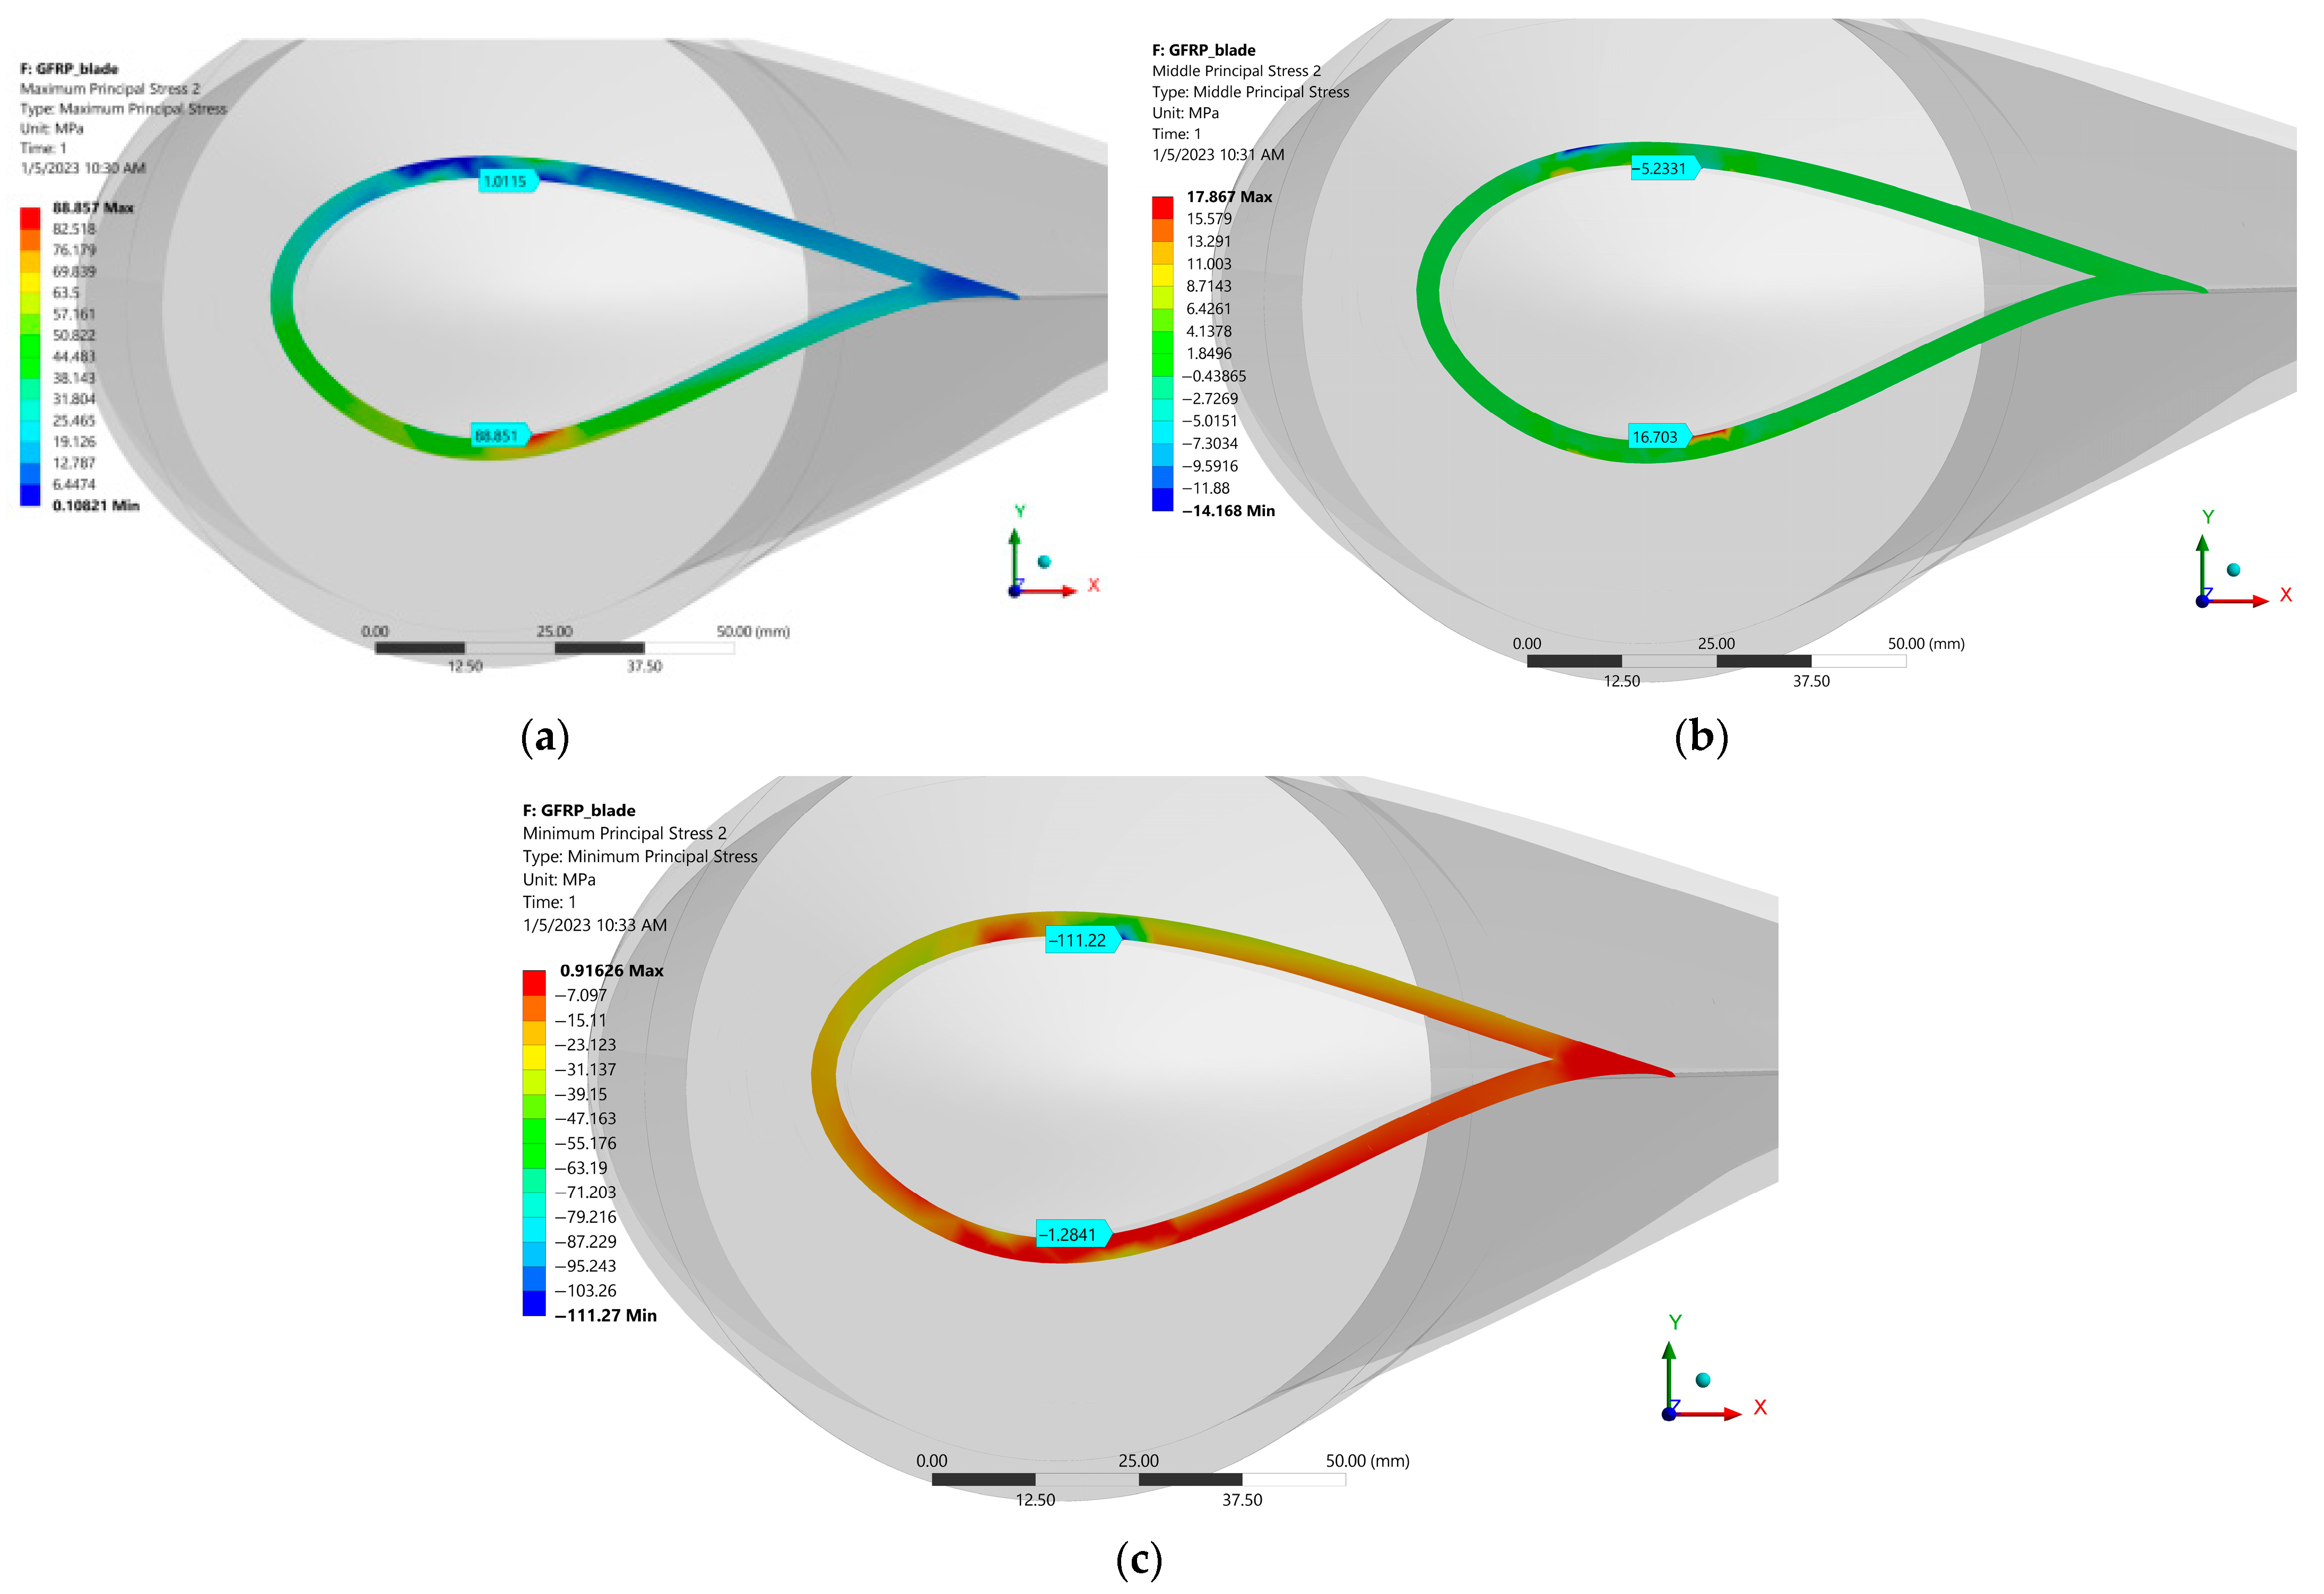
- Using the Tsai–Hill criterion and the mechanical characteristics of the material, the turbine blade was checked for the most dangerous stress states provided by the FEA. After this verification, it turns out that the blade can take on static loads higher than those considered in the article. However, it must be taken into account that the blade must occasionally withstand higher rotational speed, as well as fatigue, creep and warping, and harsh environmental conditions.
- -
- Optimizing the volume of fibers added in relation to their orientation;
- -
- Determinations similar to those carried out in this paper on other types of fiber arrangements;
- -
- Measurements of the turbine blade at full or reduced scale to determine the variation of the direction of the maximum normal and shear stresses in relation to different ratios of tensile and torsional loading.
Author Contributions
Funding
Institutional Review Board Statement
Informed Consent Statement
Data Availability Statement
Conflicts of Interest
References
- Report from the Commission to the European Parliament, the Council, the European Economic and Social Committee and the Committee of the Regions. Available online: https://eur-lex.europa.eu/legal-content/RO/TXT/HTML/?uri=CELEX:52021DC0950&from=EN (accessed on 9 January 2023).
- Yang, B.; Sun, D. Testing, inspecting and monitoring technologies for wind turbine blades: A survey. Renew. Sustain. Energy Rev. 2013, 22, 515–526. [Google Scholar]
- The World’s Most Powerful Turbine Produces Energy for the First Time. Available online: https://interestingengineering.com/innovation/worlds-most-powerful-turbine-produces-power (accessed on 9 January 2023).
- Wind Turbine Accident and Incident Compilation. Available online: http://www.caithnesswindfarms.co.uk/fullaccidents.pdf (accessed on 10 January 2023).
- Steigmann, R.; Savin, A.; Goanta, V.; Barsanescu, P.D.; Leitoiu, B.; Iftimie, N.; Stanciu, M.D.; Curtu, I. Determination of mechanical properties of some glass fiber reinforced plastics suitable to Wind Turbine Blade construction. IOP Conf. Ser. Mater. Sci. Eng. 2016, 147, 012140. [Google Scholar]
- Mishnaevsky, L.; Branner, K.; Petersen, N.H.; Justine Beauson, J.; McGugan, M.; Sørensen, B.F. Materials for Wind Turbine Blades: An Overview. Materials 2017, 10, 1285. [Google Scholar]
- Suteu, D.; Blaga, C.A.; Cimpoesu, R.; Puiţel, C.A.; Farmus, E.R. Composites Based on Natural Polymers and Microbial Biomass for Biosorption of Brilliant Red HE-3B Reactive Dy from Aqueous Solutions. Polymers 2021, 13, 4314. [Google Scholar] [CrossRef]
- Bino, D.; Retnam, S.; Ramachandran, M.; Sivapragash, M. Analysis of mechanical properties of glass and carbon fiber reinforced polymer material. Int. J. Appl. Eng. Res. 2015, 10, 11. [Google Scholar]
- Xiaohan, F.; Sheng, M. Research on Structural Failure Analysis and Strengthening Design of Offshore Wind Turbine Blades. J. Mar. Sci. Eng. 2022, 10, 1661. [Google Scholar]
- Zayas, J.Z.; Dam, C.P.; Chow, R.; Mayda, E. Active Aerodynamic Load Control of Wind Turbine Blades. In Proceedings of the European Wind Energy Conference (EWEC), San Diego, CA, USA, 30 July–2 August 2007. [Google Scholar]
- Haselbach, P.U. An advanced structural trailing edge modelling method for wind turbine blades. Compos. Struct. 2017, 180, 521–530. [Google Scholar]
- Ghafafian, C.; Popiela, B.; Trappe, V. Failure Mechanisms of GFRP Scarf Joints under Tensile Load. Materials 2021, 14, 1806. [Google Scholar] [CrossRef]
- Ahmed, M.M.Z.; Alzahrani, B.; Jouini, N.; Hessien, M.M.; Ataya, S. The Role of Orientation and Temperature on the Mechanical Properties of a 20 Years Old Wind Turbine Blade GFR Composite. Polymers 2021, 13, 1144. [Google Scholar]
- Mazzuca, P.; Firmo, P.J.; Correia, R.J.; Castilho, E. Influence of elevated temperatures on the mechanical properties of glass fibre reinforced polymer laminates produced by vacuum infusion. Constr. Build. Mater. 2022, 345, 128340. [Google Scholar]
- Hussain, S.A.; Pandurangadu, V.; Kumar, P.K. Cutting power prediction model for turning of GFRP composites using response surface methodology. Int. J. Eng. Sci. Technol. 2011, 3, 161–171. [Google Scholar]
- Abd-Ali, K.N.; Madeh, R.A. Effect of Fiber Orientation Angles on Mechanical Behavior of Car Bumper Composite. Kufa J. Eng. 2016, 7, 27–37. [Google Scholar]
- Abburi, L.; Prakash, M. The effect of fiber orientation on mechanical properties and machinability of GFRP composites by end milling using cutting force analysis. Polym. Polym. Compos. 2021, 29, 096739112199128. [Google Scholar]
- Subhedar, M.K.; Chauhan, S.G.; Singh, P.B.; Dhakate, R.S. Effect of fibre orientation on mechanical properties of carbon fibre composites. Indian J. Eng. Mater. Sci. 2020, 27, 1100–1103. [Google Scholar]
- Baosheng, R.; Noda, J.; GODA, K. Effects of Fiber Orientation Angles and Fluctuation on the Stiffness and Strength of Sliver-Based Green Composites. J. Soc. Mater. Sci. Jpn. 2010, 59, 567–574. [Google Scholar]
- Wang, H.W.; Zhou, H.W.; Gui, L.L.; Ji, W.H.; Zhang, C.X. Analysis of effect of fiber orientation on Young’s modulus for unidirectional fiber reinforced composites. Compos. Part B Eng. 2014, 56, 733–739. [Google Scholar]
- Cordin, M.; Bechtold, T.; Pham, T. Effect of fibre orientation on the mechanical properties of polypropylene–lyocell composites. Cellulose 2018, 25, 7197–7210. [Google Scholar]
- Stanciu, M.D.; Drăghicescu, H.T.; Roșca, I.C. Mechanical Properties of GFRPs Exposed to Tensile, Compression and Tensile–Tensile Cyclic Tests. Polymers 2021, 13, 898. [Google Scholar] [CrossRef]
- Ou, Y.; Zhu, D.; Zhang, H.; Huang, L.; Yao, Y.; Li, G.; Mobasher, B. Mechanical Characterization of the Tensile Properties of Glass Fiber and Its Reinforced Polymer (GFRP) Composite under Varying Strain Rates and Temperatures. Polymers 2016, 8, 196. [Google Scholar]
- Jensen, F.M.; Falzon, B.G.; Ankersen, J.; Stang, H. Structural testing and numerical simulation of a 34 m composite wind turbine blade. Compos. Struct. 2006, 76, 52–61. [Google Scholar]
- Jureczko, M.; Pawlak, J.; Mezyk, A. Optimisation of wind turbine blades. J. Mater. Process. Technol. 2005, 167, 463–471. [Google Scholar] [CrossRef]
- Chen, C.P.; Kam, T.Y. Failure Analysis of Small Composite Sandwich Turbine Blade Subjected to Extreme Wind Load. Procedia Eng. 2011, 14, 1973–1981. [Google Scholar]
- Chen, X.; Zhao, X.; Xu, J. Revisiting the structural collapse of a 52.3 m composite wind turbine blade in a full-scale bending test. Wind. Energy 2017, 20, 1111–1127. [Google Scholar]
- EPICOTETM Resin MGS® LR 385. Available online: https://shop.swiss-composite.ch/shop/resources/downloads/t-L-385-e.pdf (accessed on 2 February 2023).
- ASTM D3518/D3518M-18; Standard Test Method for In-Plane Shear Response of Polymer Matrix Composite Materials by Tensile Test of a ±45° Laminate. ASTM International: West Conshohocken, PA, USA, 2018. Available online: https://www.astm.org/d3518_d3518m-18.html (accessed on 8 January 2023).
- ASTM D3039/D3039M-08; Standard Test Method for Tensile Properties of Polymer Matrix Composite Materials. ASTM International: West Conshohocken, PA, USA, 2018. Available online: https://www.astm.org/d3039_d3039m-08.html (accessed on 11 January 2023).
- ASTM D3410/D3410M-16e1; Standard Test Method for Compressive Properties of Polymer Matrix Composite Materials with Unsupported Gage Section by Shear Loading. ASTM International: West Conshohocken, PA, USA, 2018. Available online: https://www.astm.org/d3410_d3410m-16e01.html (accessed on 11 January 2023).
- Morăras, C.I.; Goantă, V.; Istrate, B.; Munteanu, C.; Dobrescu, D.S. Structural Testing by Torsion of Scalable Wind Turbine Blades. Polymers 2022, 14, 3937. [Google Scholar]
- Panaghie, C.; Cimpoeșu, R.; Istrate, B.; Cimpoeșu, N.; Bernevig, A.M.; Zegan, G.; Roman, M.A.; Chelariu, R.; Sodor, A. New Zn3Mg-xY Alloys: Characteristics, Microstructural Evolution and Corrosion Behavior. Materials 2021, 14, 2505. [Google Scholar]
- Morăraș, C.; Tugui, A.C.; Steigmann, R.; Barsanescu, D.P.; Leitoiu, B.; Goanta, V. Mechanical Testing of GFRP Composite Materials Used in Wind Turbine Blades Construction. In Advanced Materials Research; Trans Tech Publications Ltd.: Wollerau, Switzerland, 2020; Volume 1157, pp. 142–148. [Google Scholar]
- A Comparison of Shear Test Methods. Available online: https://www.compositesworld.com/articles/a-comparison-of-shear-test-methods (accessed on 2 February 2023).
- Gasch, R.; Twele, J. Wind Power Plants Fundamentals, Design, Construction and Operation, 2nd ed.; Springer: Berlin, Germany, 2011. [Google Scholar]
- Schepers, J.G.; Boorsma, K.; Cho, T.; Gomez-Iradi, S.; Schaffarczyk, P.; Jeromin, A.; Shen, W.Z.; Lutz, T.; Meister, K.; Stoevesandt, B.; et al. Analysis of Mexico Wind Tunnel Measurements: Final Report of IEA Task 29, Mexnext (Phase 1); ECN-E No. 12-004; Energy Research Centre of The Netherlands (ECN): Petten, The Netherlands, 2012. [Google Scholar]
- Tao, F.; Liu, X.; Du, H.; Tian, S.; Yu, W. Discover failure criteria of composites from experimental data by sparse regression. Compos. Part B Eng. 2022, 239, 109947. [Google Scholar]
- Jiefei, G.; Chen, P.; Su, L.; Li, K. A theoretical and experimental assessment of 3D macroscopic failure criteria for predicting pure inter-fiber fracture of transversely isotropic UD composites. Compos. Struct. 2021, 259, 113466. [Google Scholar]
- Christensen, R.M. Failure criteria for fiber composite materials, the astonishing sixty year search, definitive usable results. Compos. Sci. Technol. 2017, 182, 107718. [Google Scholar]
- Daniel, I.M. Yield and failure criteria for composite materials under static and dynamic loading. Prog. Aerosp. Sci. 2016, 81, 18–25. [Google Scholar]
- Din, U.I.; Hao, P.; Franz, G.G.; Panier, S. Elastoplastic CDM model based on Puck’s theory for the prediction of mechanical behavior of Fiber Reinforced Polymer (FRP) composites. Compos. Struct. 2018, 201, 291–302. [Google Scholar]


| Properties | Units | Value |
|---|---|---|
| Density | [g/cm3] | 1.20 |
| Viscosity | [mPa·s] | 700–1050 |
| Flexural strength | [N/mm2] | 120–130 |
| Modulus of elasticity | [kN/mm2] | 3.3–3.6 |
| Tensile strength | [N/mm2] | 75–85 |
| Compressive strength | [N/mm2] | 120–140 |
| Elongation of break | [%] | 6–8 |
| Impact strength | [KJ/m2] | 45–60 |
| Water absorption at 23 °C in 24 h | [%] | 0.01 |
| Sample No. | σUTS [MPa] | [MPa] | Deviations from the Mean [MPa] | [MPa] | Standard Deviation S [MPa] | Coefficient of Variation CV [%] |
|---|---|---|---|---|---|---|
| 1 | 296.03 | 293.2 | 2.83 | 8.00 | 5.16 | 1.75 |
| 2 | 294.93 | 1.73 | 2.99 | |||
| 3 | 296.37 | 3.17 | 10.04 | |||
| 4 | 285.52 | −7.68 | 58.98 | |||
| Σ= | 1172.8 | 80.01 |
| Sample No. | σUTS [MPa] | [MPa] | Deviations from the Mean [MPa] | [MPa] | Standard Deviation S [MPa] | Coefficient of Variation CV [%] |
|---|---|---|---|---|---|---|
| 1 | 327.47 | 324.19 | 3.28 | 10.75 | 8.92 | 2.75 |
| 2 | 314.27 | −9.92 | 98.04 | |||
| 3 | 320.17 | −4.02 | 16.16 | |||
| 4 | 334.87 | 10.68 | 114.06 | |||
| Σ= | 1296.7 | 239.01 |
| Sample No. | σUTS [MPa] | [MPa] | Deviations from the Mean [MPa] | [MPa] | Standard Deviation S [MPa] | Coefficient of Variation CV [%] |
|---|---|---|---|---|---|---|
| 1 | 91.82 | 89.70 | 2.12 | 4.49 | 2.1 | 2.35 |
| 2 | 89.72 | 0.02 | 0.004 | |||
| 3 | 90.46 | 0.76 | 0.57 | |||
| 4 | 86.82 | −2.88 | 8.29 | |||
| Σ= | 358.82 | 13.35 |
| Sample No. | σUTS [MPa] | [MPa] | Deviations from the Mean [MPa] | [MPa] | Standard Deviation S [MPa] | Coefficient of Variation CV [%] |
|---|---|---|---|---|---|---|
| 1 | 196.17 | 200.1 | −3.93 | 15.44 | 5.95 | 2.97 |
| 2 | 202.62 | 2.52 | 6.35 | |||
| 3 | 207.28 | 7.18 | 51.55 | |||
| 4 | 194.35 | −5.75 | 33.06 | |||
| Σ= | 800.42 | 106.4 |
| Sample No. | σUTS [MPa] | [MPa] | Deviations from the Mean [MPa] | [MPa] | Standard Deviation S [MPa] | Coefficient of Variation CV [%] |
|---|---|---|---|---|---|---|
| 1 | 184.17 | 188.44 | −4.27 | 18.23 | 9.12 | 4.83 |
| 2 | 196.87 | 8.43 | 71.06 | |||
| 3 | 180.45 | −7.99 | 63.84 | |||
| 4 | 198.28 | 9.84 | 96.82 | |||
| Σ= | 753.77 | 249.95 |
| Equivalent (von Mises) Stress | 110.48 MPa |
| Maximum Principal Stress | 1.01 MPa |
| Middle Principal Stress | −5.23 MPa |
| Minimum Principal Stress | −111.22 MPa |
| Equivalent (von-Mises) Stress | 82.62 MPa |
| Maximum Principal Stress | 88.85 MPa |
| Middle Principal Stress | 16.70 MPa |
| Minimum Principal Stress | −1.28 MPa |
Disclaimer/Publisher’s Note: The statements, opinions and data contained in all publications are solely those of the individual author(s) and contributor(s) and not of MDPI and/or the editor(s). MDPI and/or the editor(s) disclaim responsibility for any injury to people or property resulting from any ideas, methods, instructions or products referred to in the content. |
© 2023 by the authors. Licensee MDPI, Basel, Switzerland. This article is an open access article distributed under the terms and conditions of the Creative Commons Attribution (CC BY) license (https://creativecommons.org/licenses/by/4.0/).
Share and Cite
Morăraș, C.I.; Goanță, V.; Husaru, D.; Istrate, B.; Bârsănescu, P.D.; Munteanu, C. Analysis of the Effect of Fiber Orientation on Mechanical and Elastic Characteristics at Axial Stresses of GFRP Used in Wind Turbine Blades. Polymers 2023, 15, 861. https://doi.org/10.3390/polym15040861
Morăraș CI, Goanță V, Husaru D, Istrate B, Bârsănescu PD, Munteanu C. Analysis of the Effect of Fiber Orientation on Mechanical and Elastic Characteristics at Axial Stresses of GFRP Used in Wind Turbine Blades. Polymers. 2023; 15(4):861. https://doi.org/10.3390/polym15040861
Chicago/Turabian StyleMorăraș, Ciprian Ionuț, Viorel Goanță, Dorin Husaru, Bogdan Istrate, Paul Doru Bârsănescu, and Corneliu Munteanu. 2023. "Analysis of the Effect of Fiber Orientation on Mechanical and Elastic Characteristics at Axial Stresses of GFRP Used in Wind Turbine Blades" Polymers 15, no. 4: 861. https://doi.org/10.3390/polym15040861