
Rheological Properties of Non-Adhesive Embolizing Compounds—The Key to Fine-Tuning Embolization Process-Modeling in Endovascular Surgery
 ,
,
Abstract
:
1. Introduction
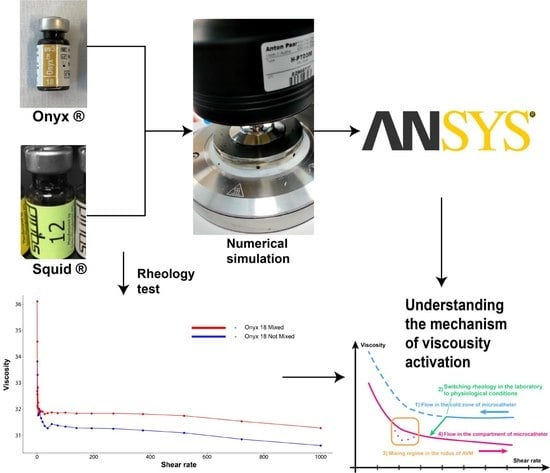
2. Materials and Methods
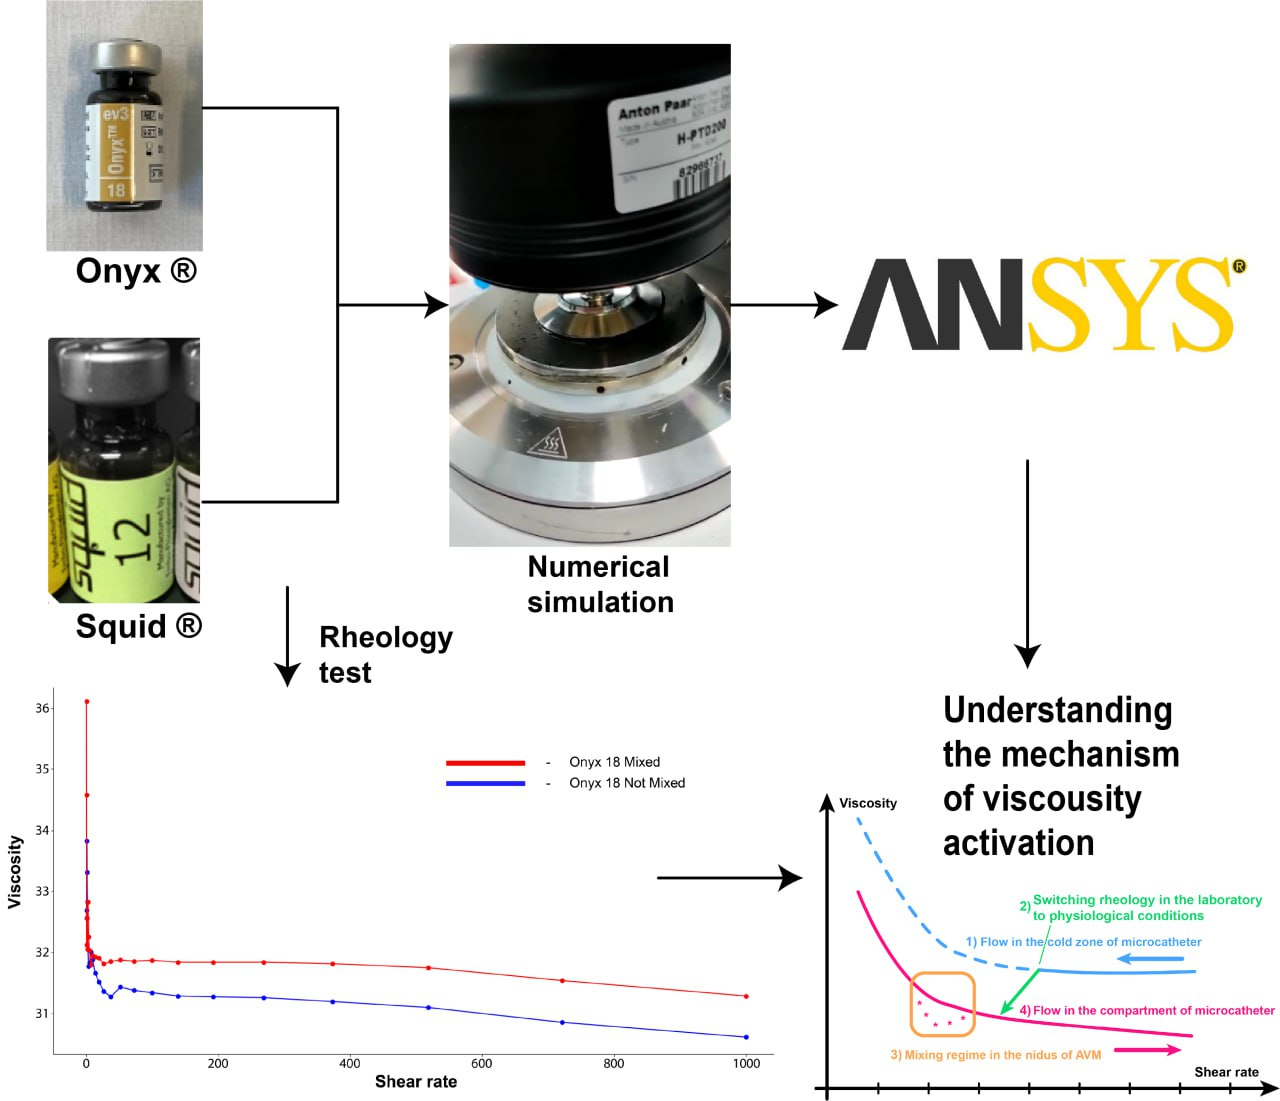
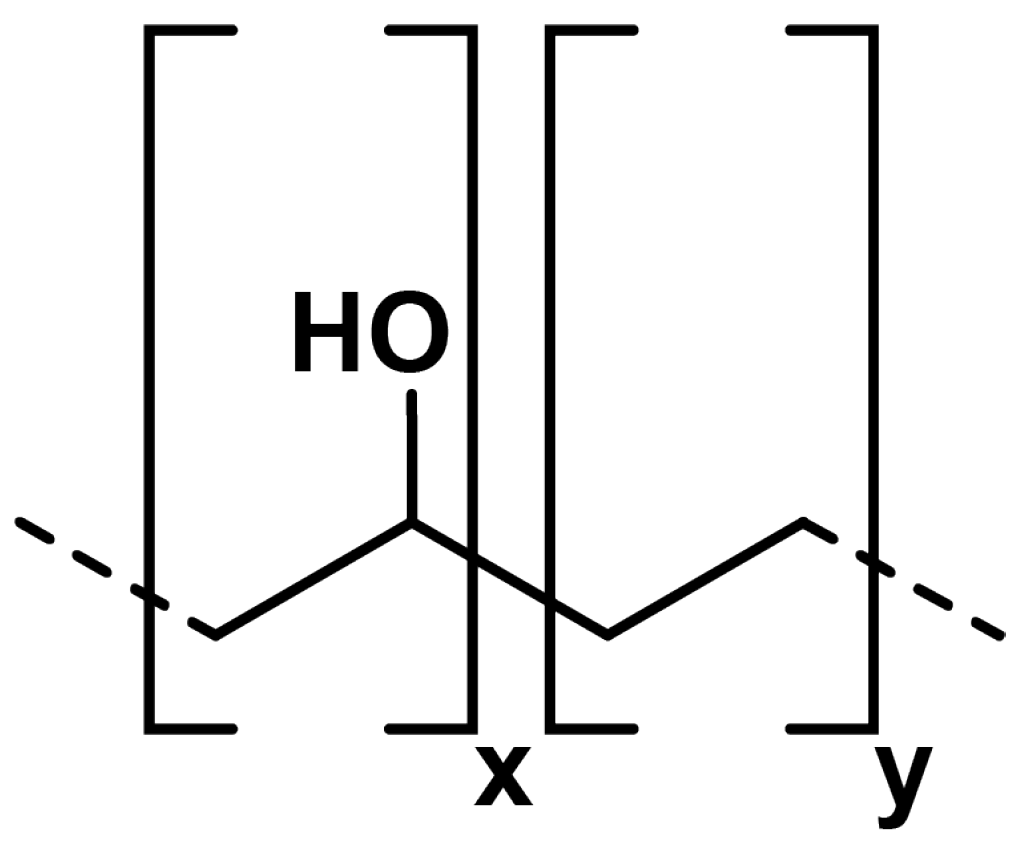
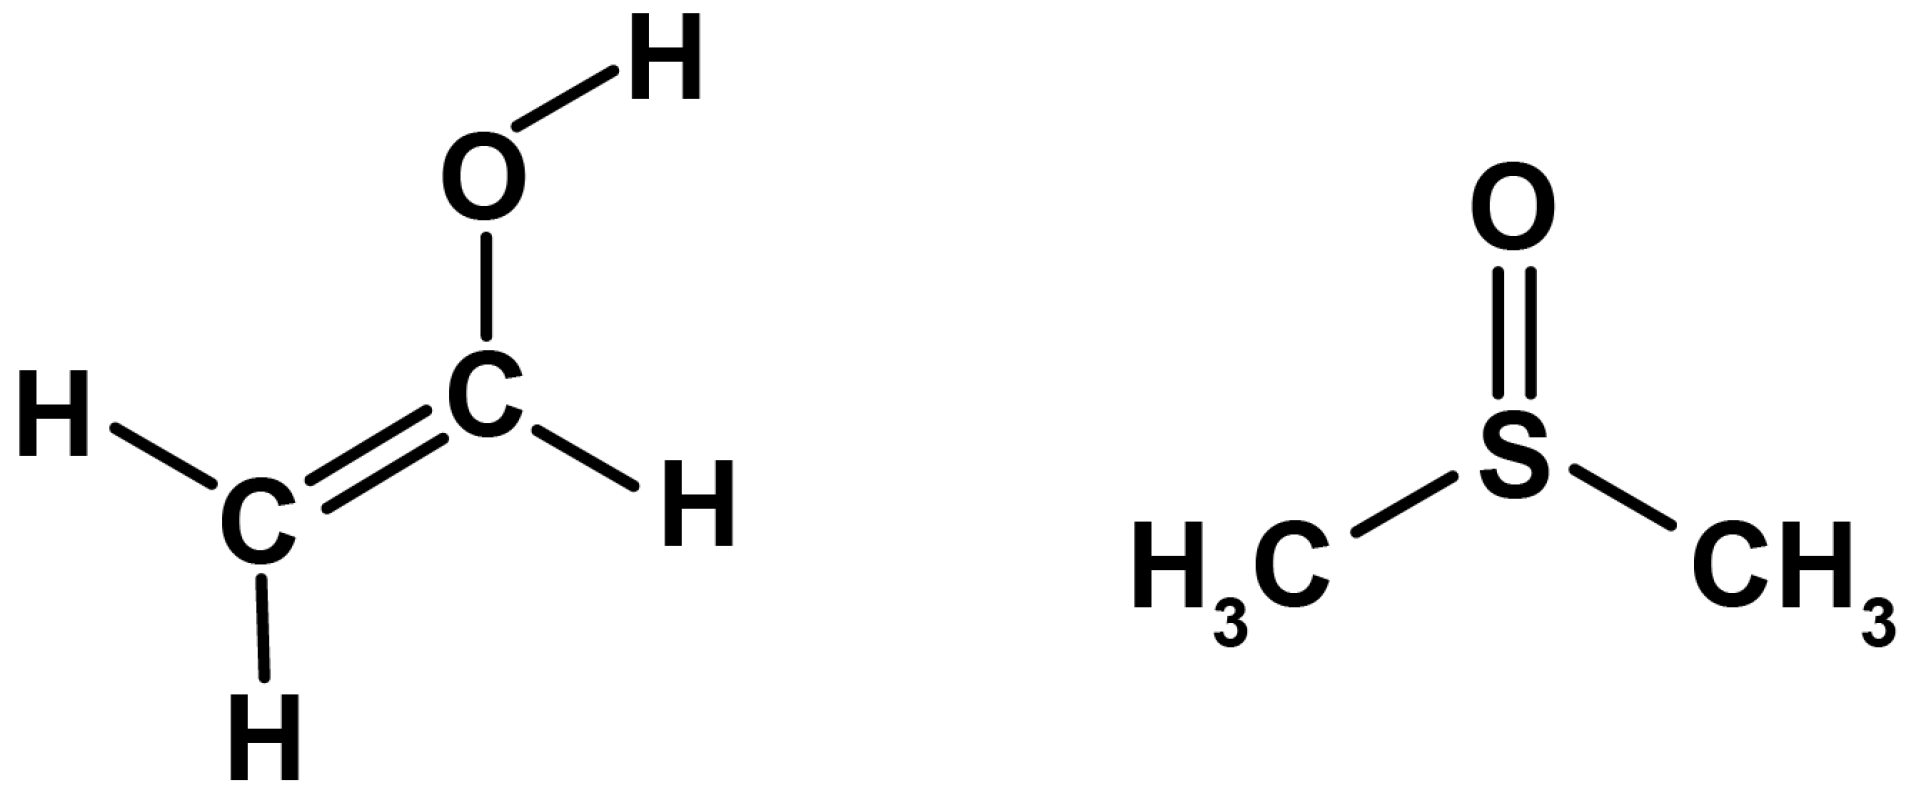
2.1. Materials
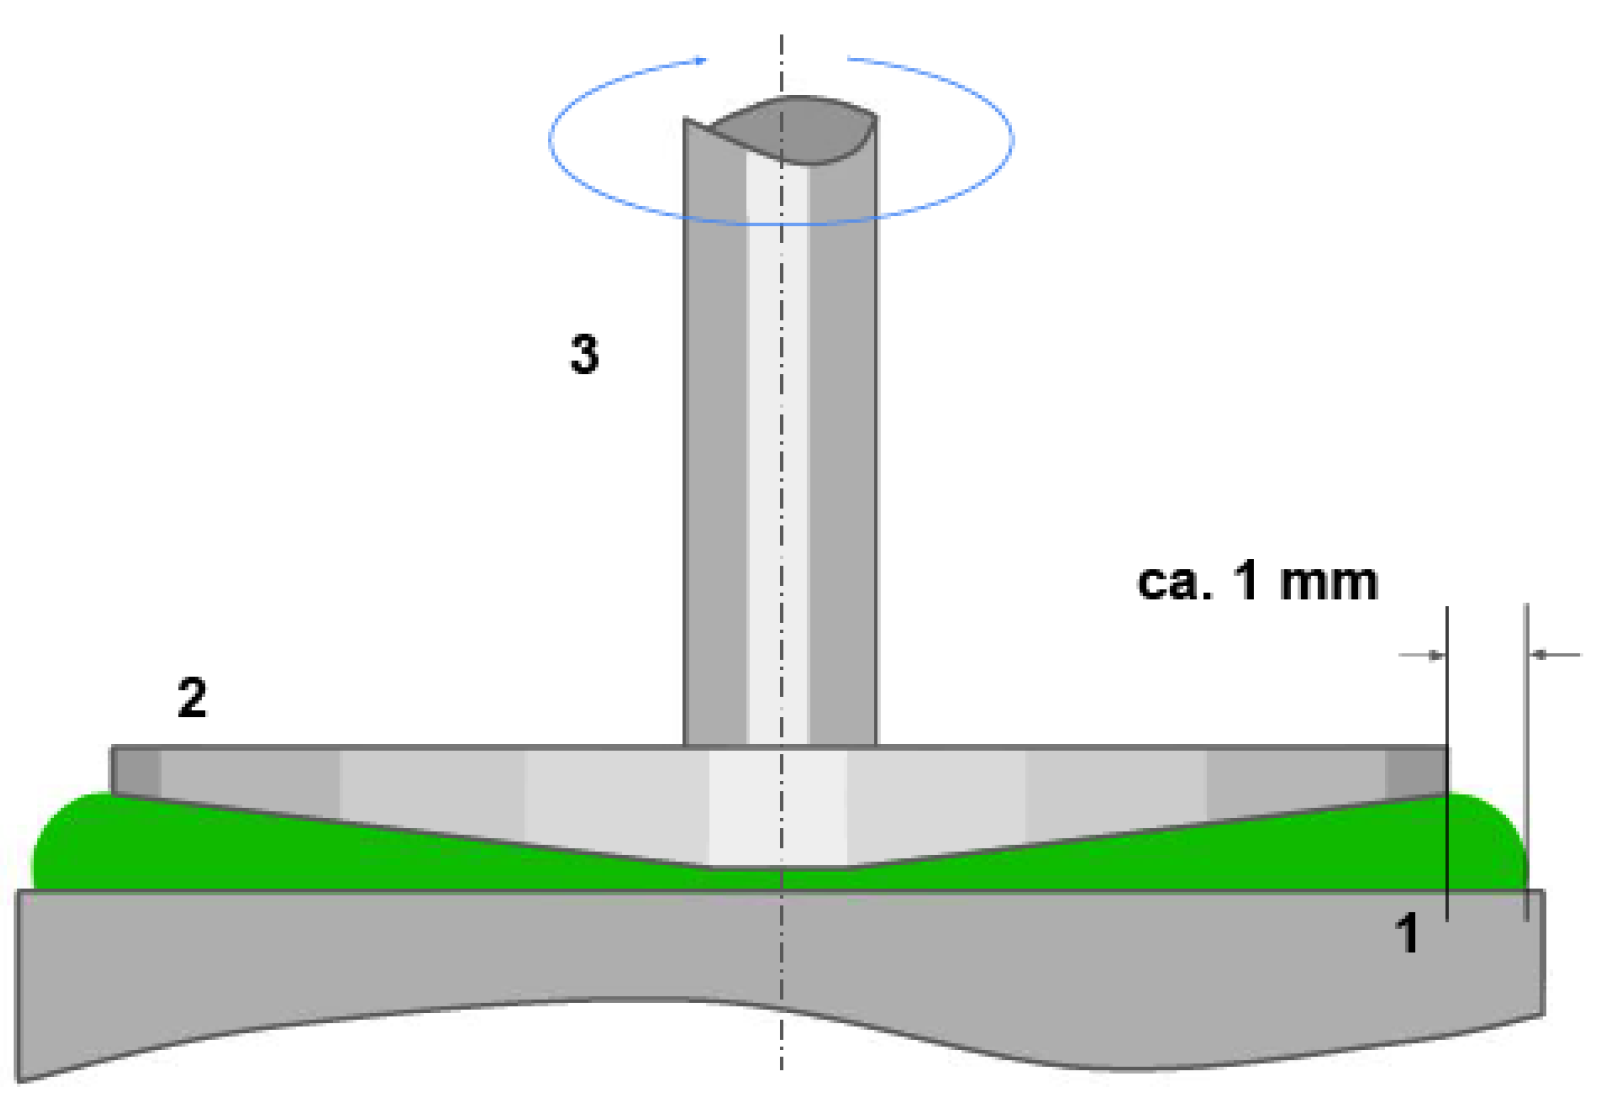
2.2. Experimental Protocol
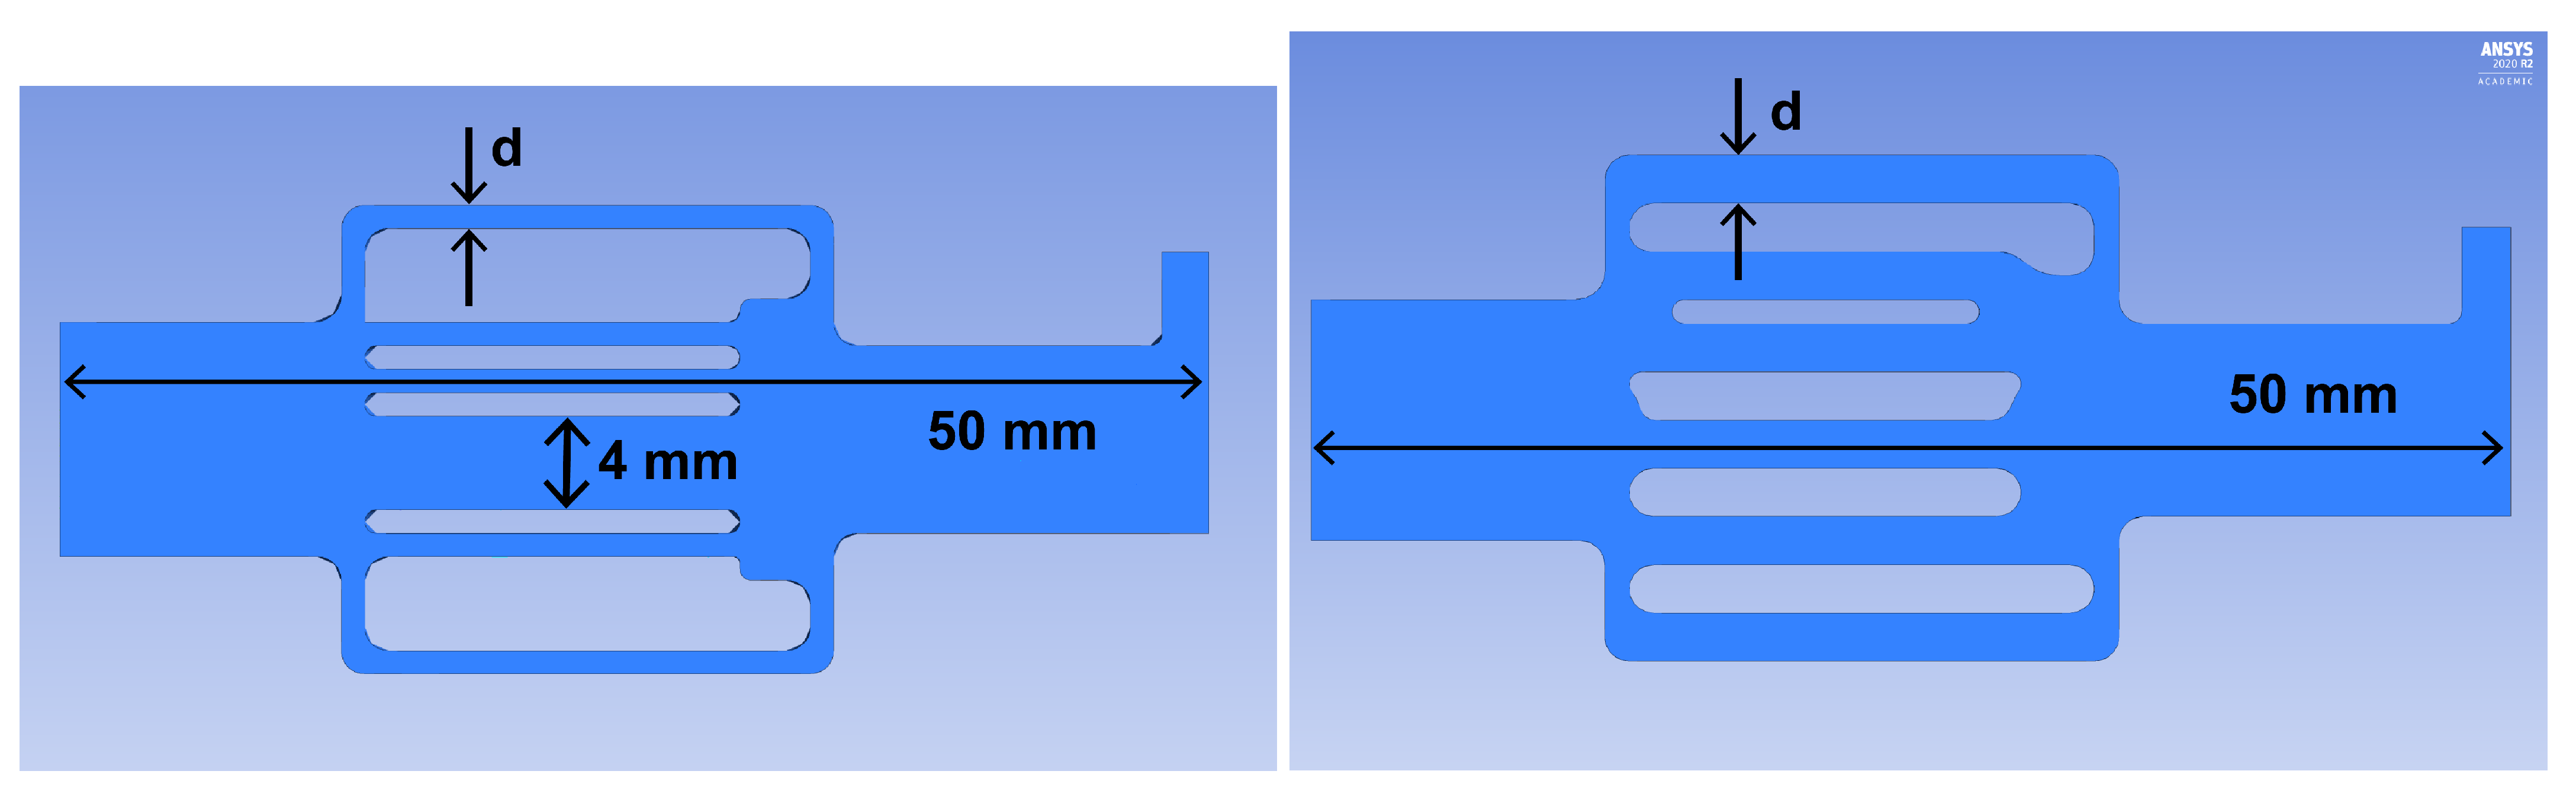
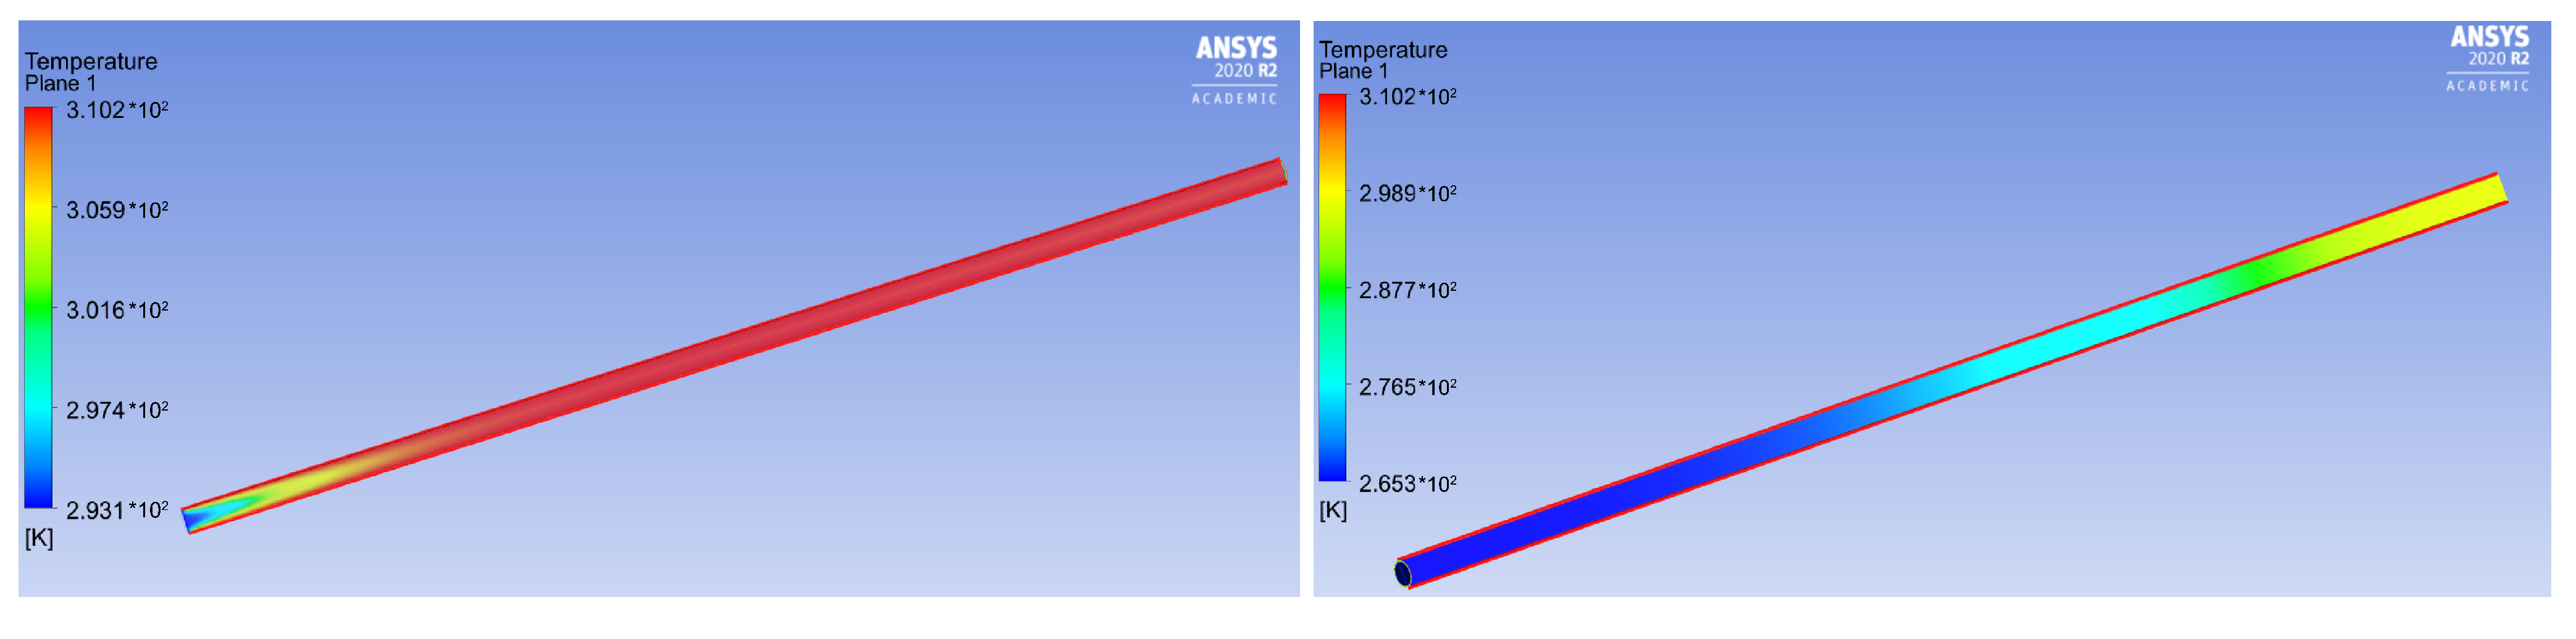
2.3. Numerical Simulations
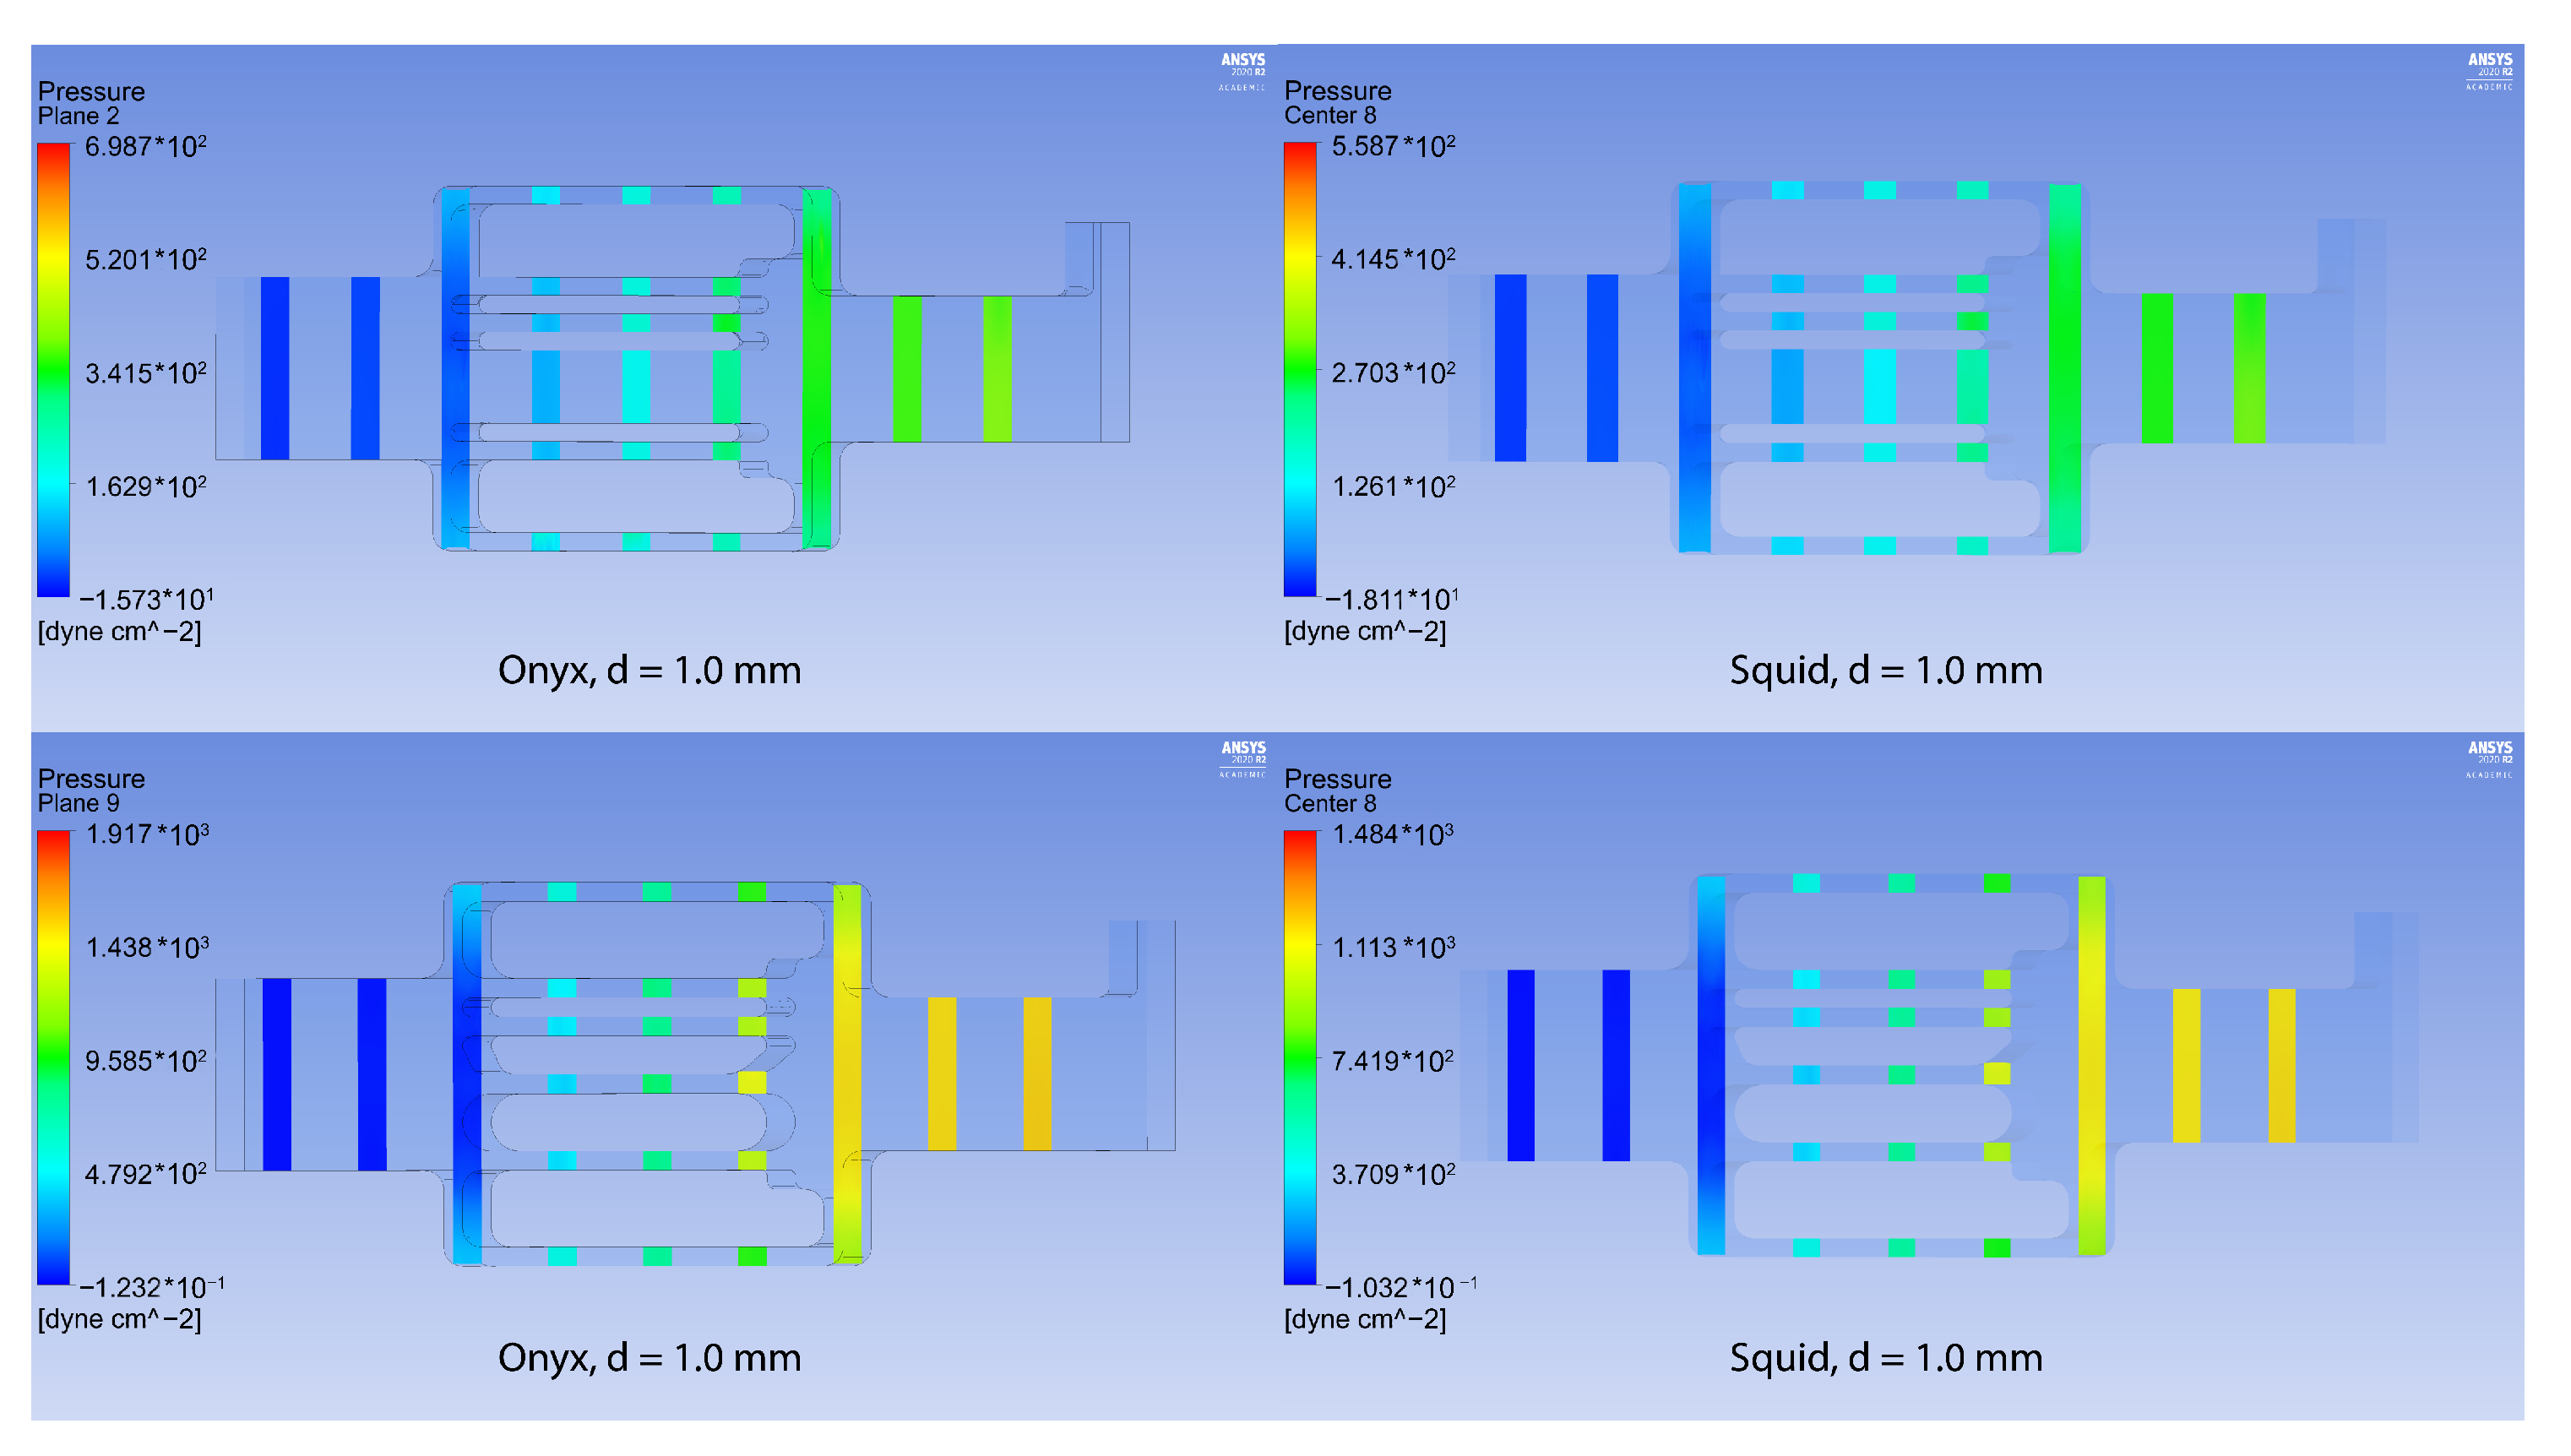
3. Results
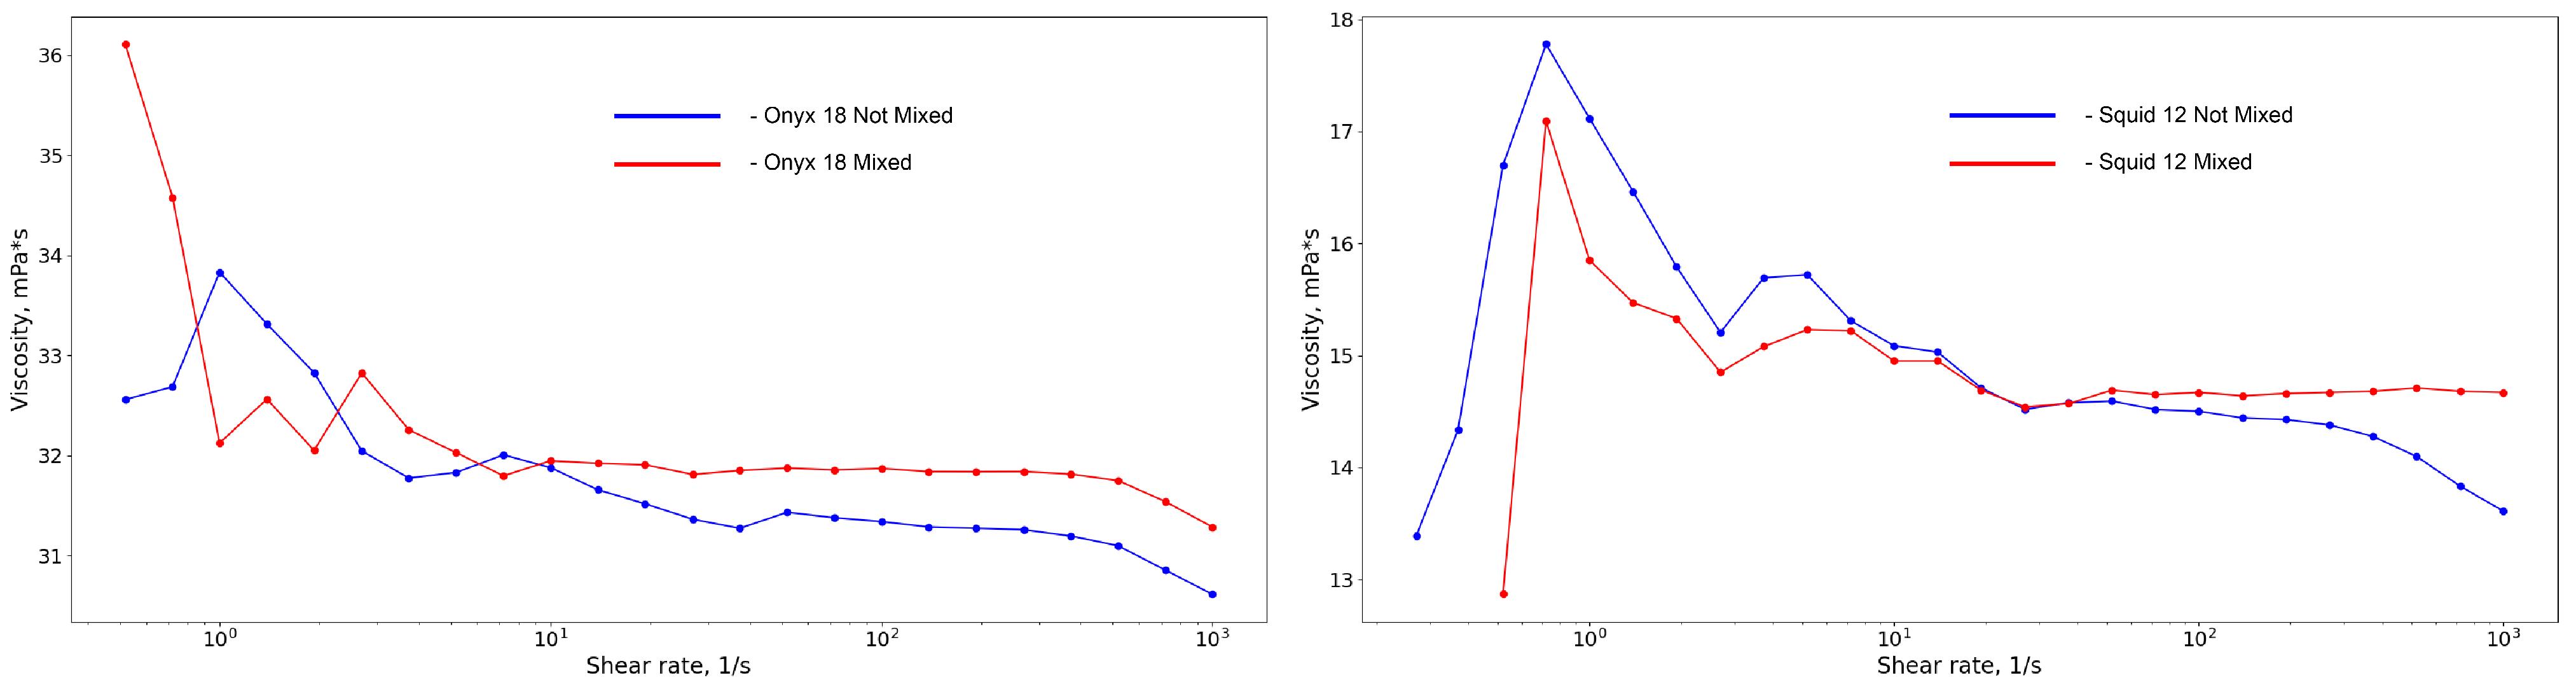
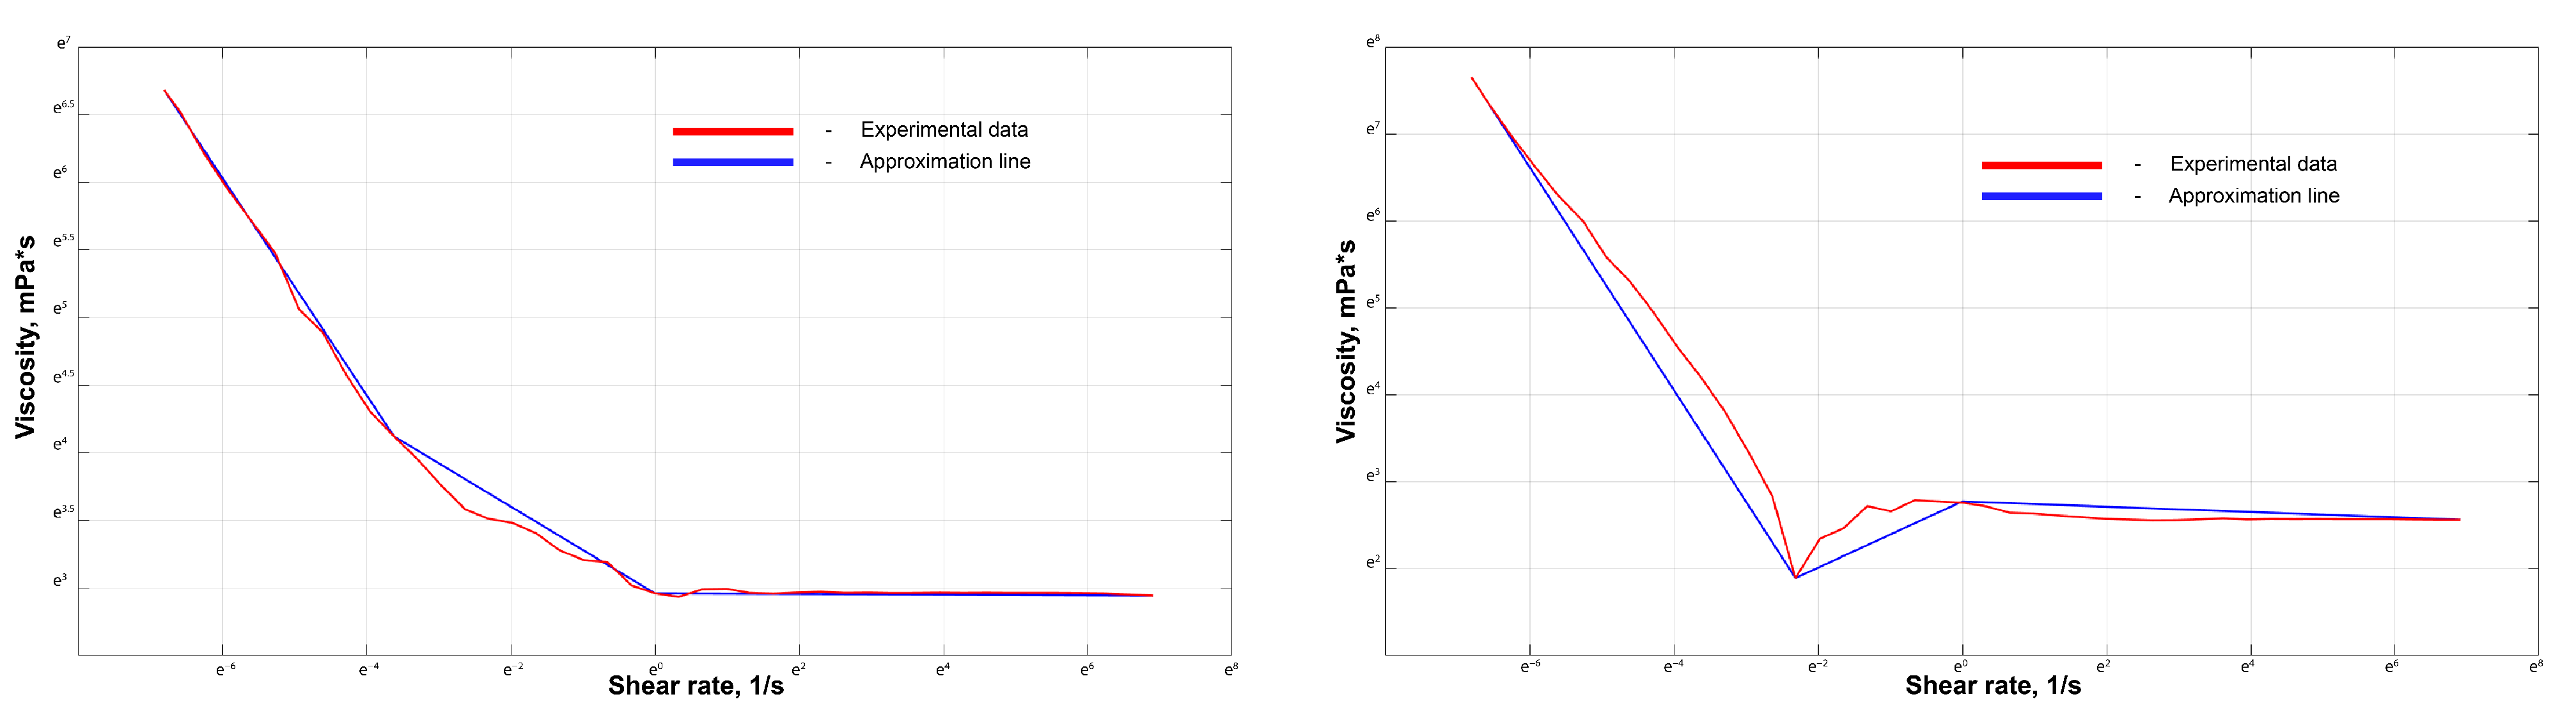
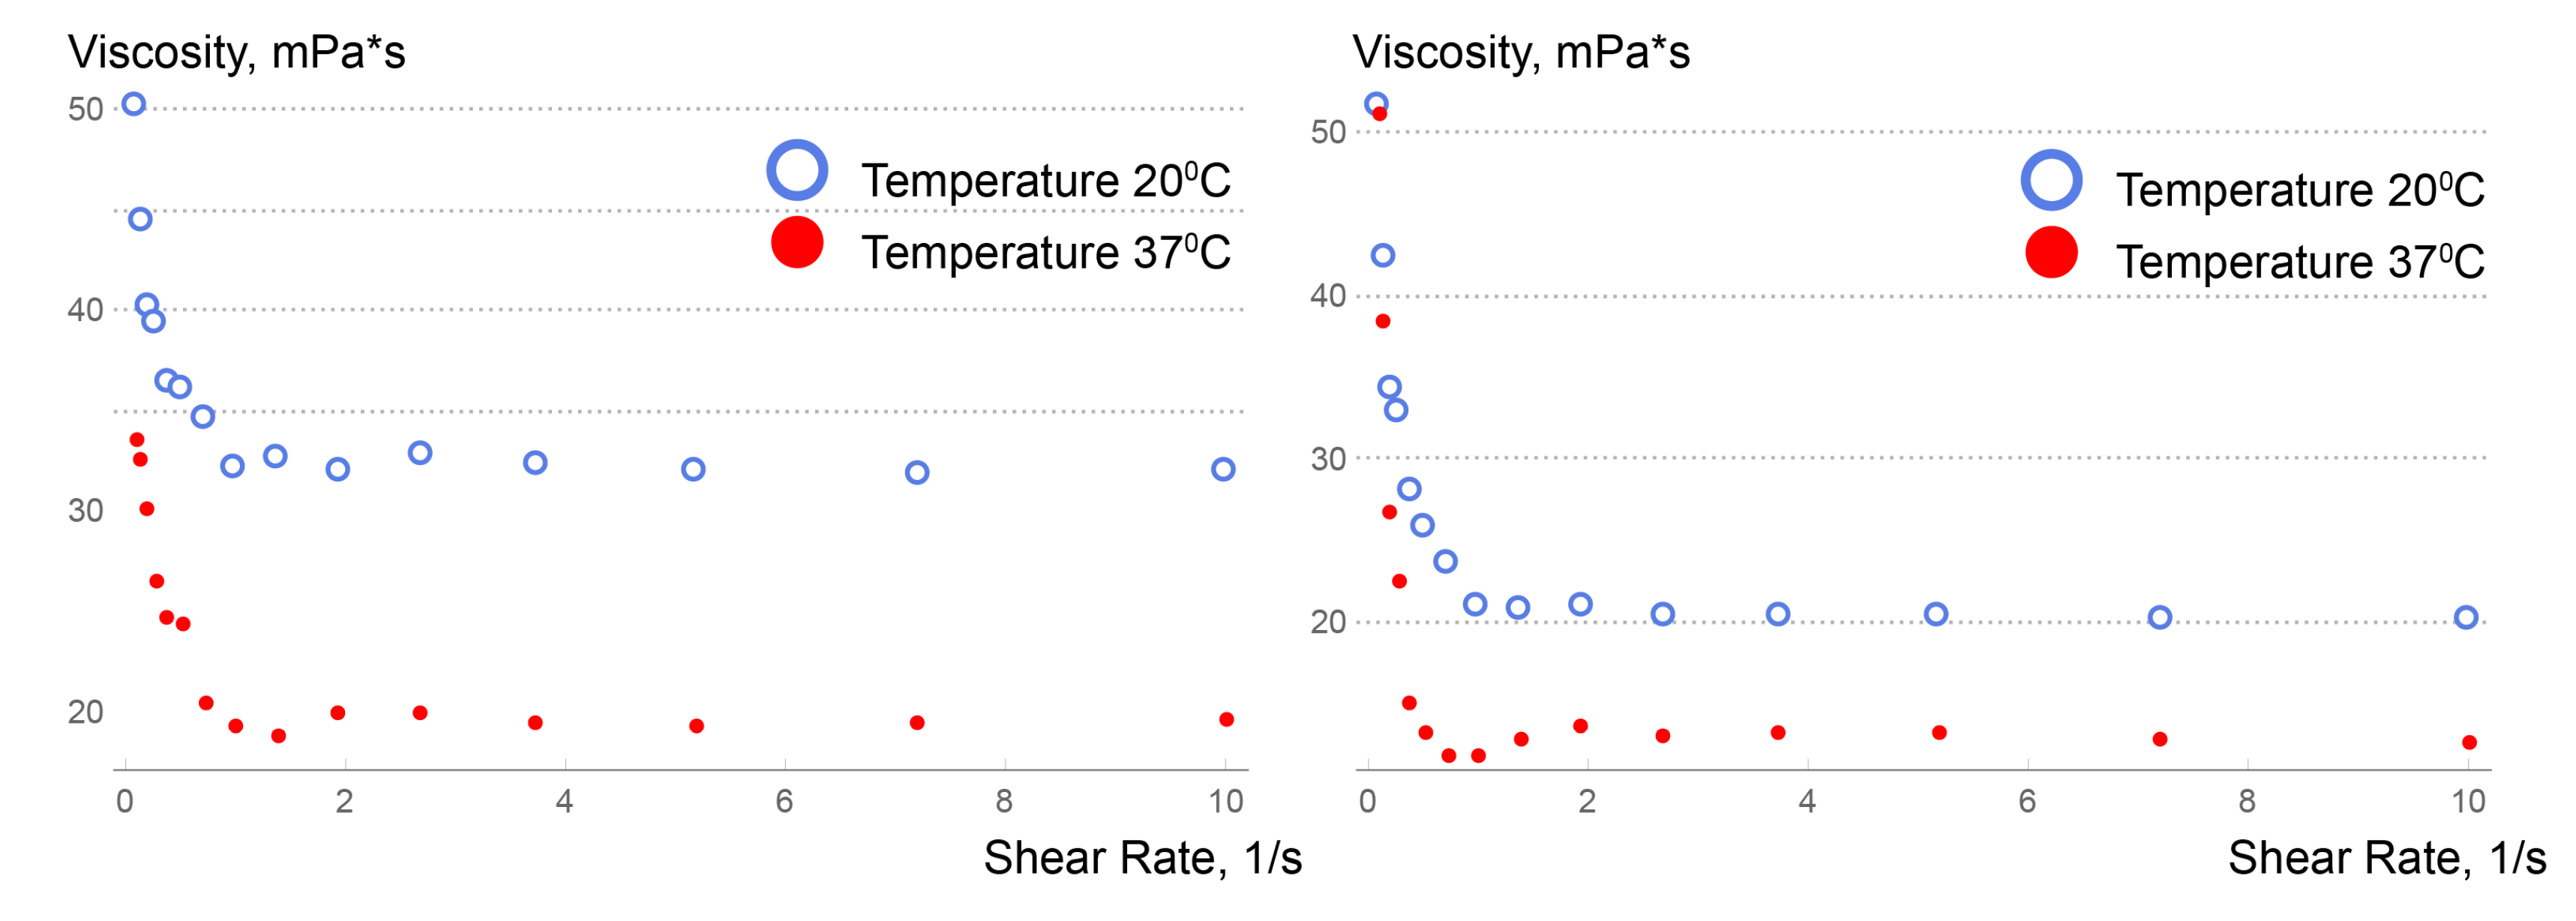
3.1. Experimental Results
3.2. Governing Equations for Viscosity
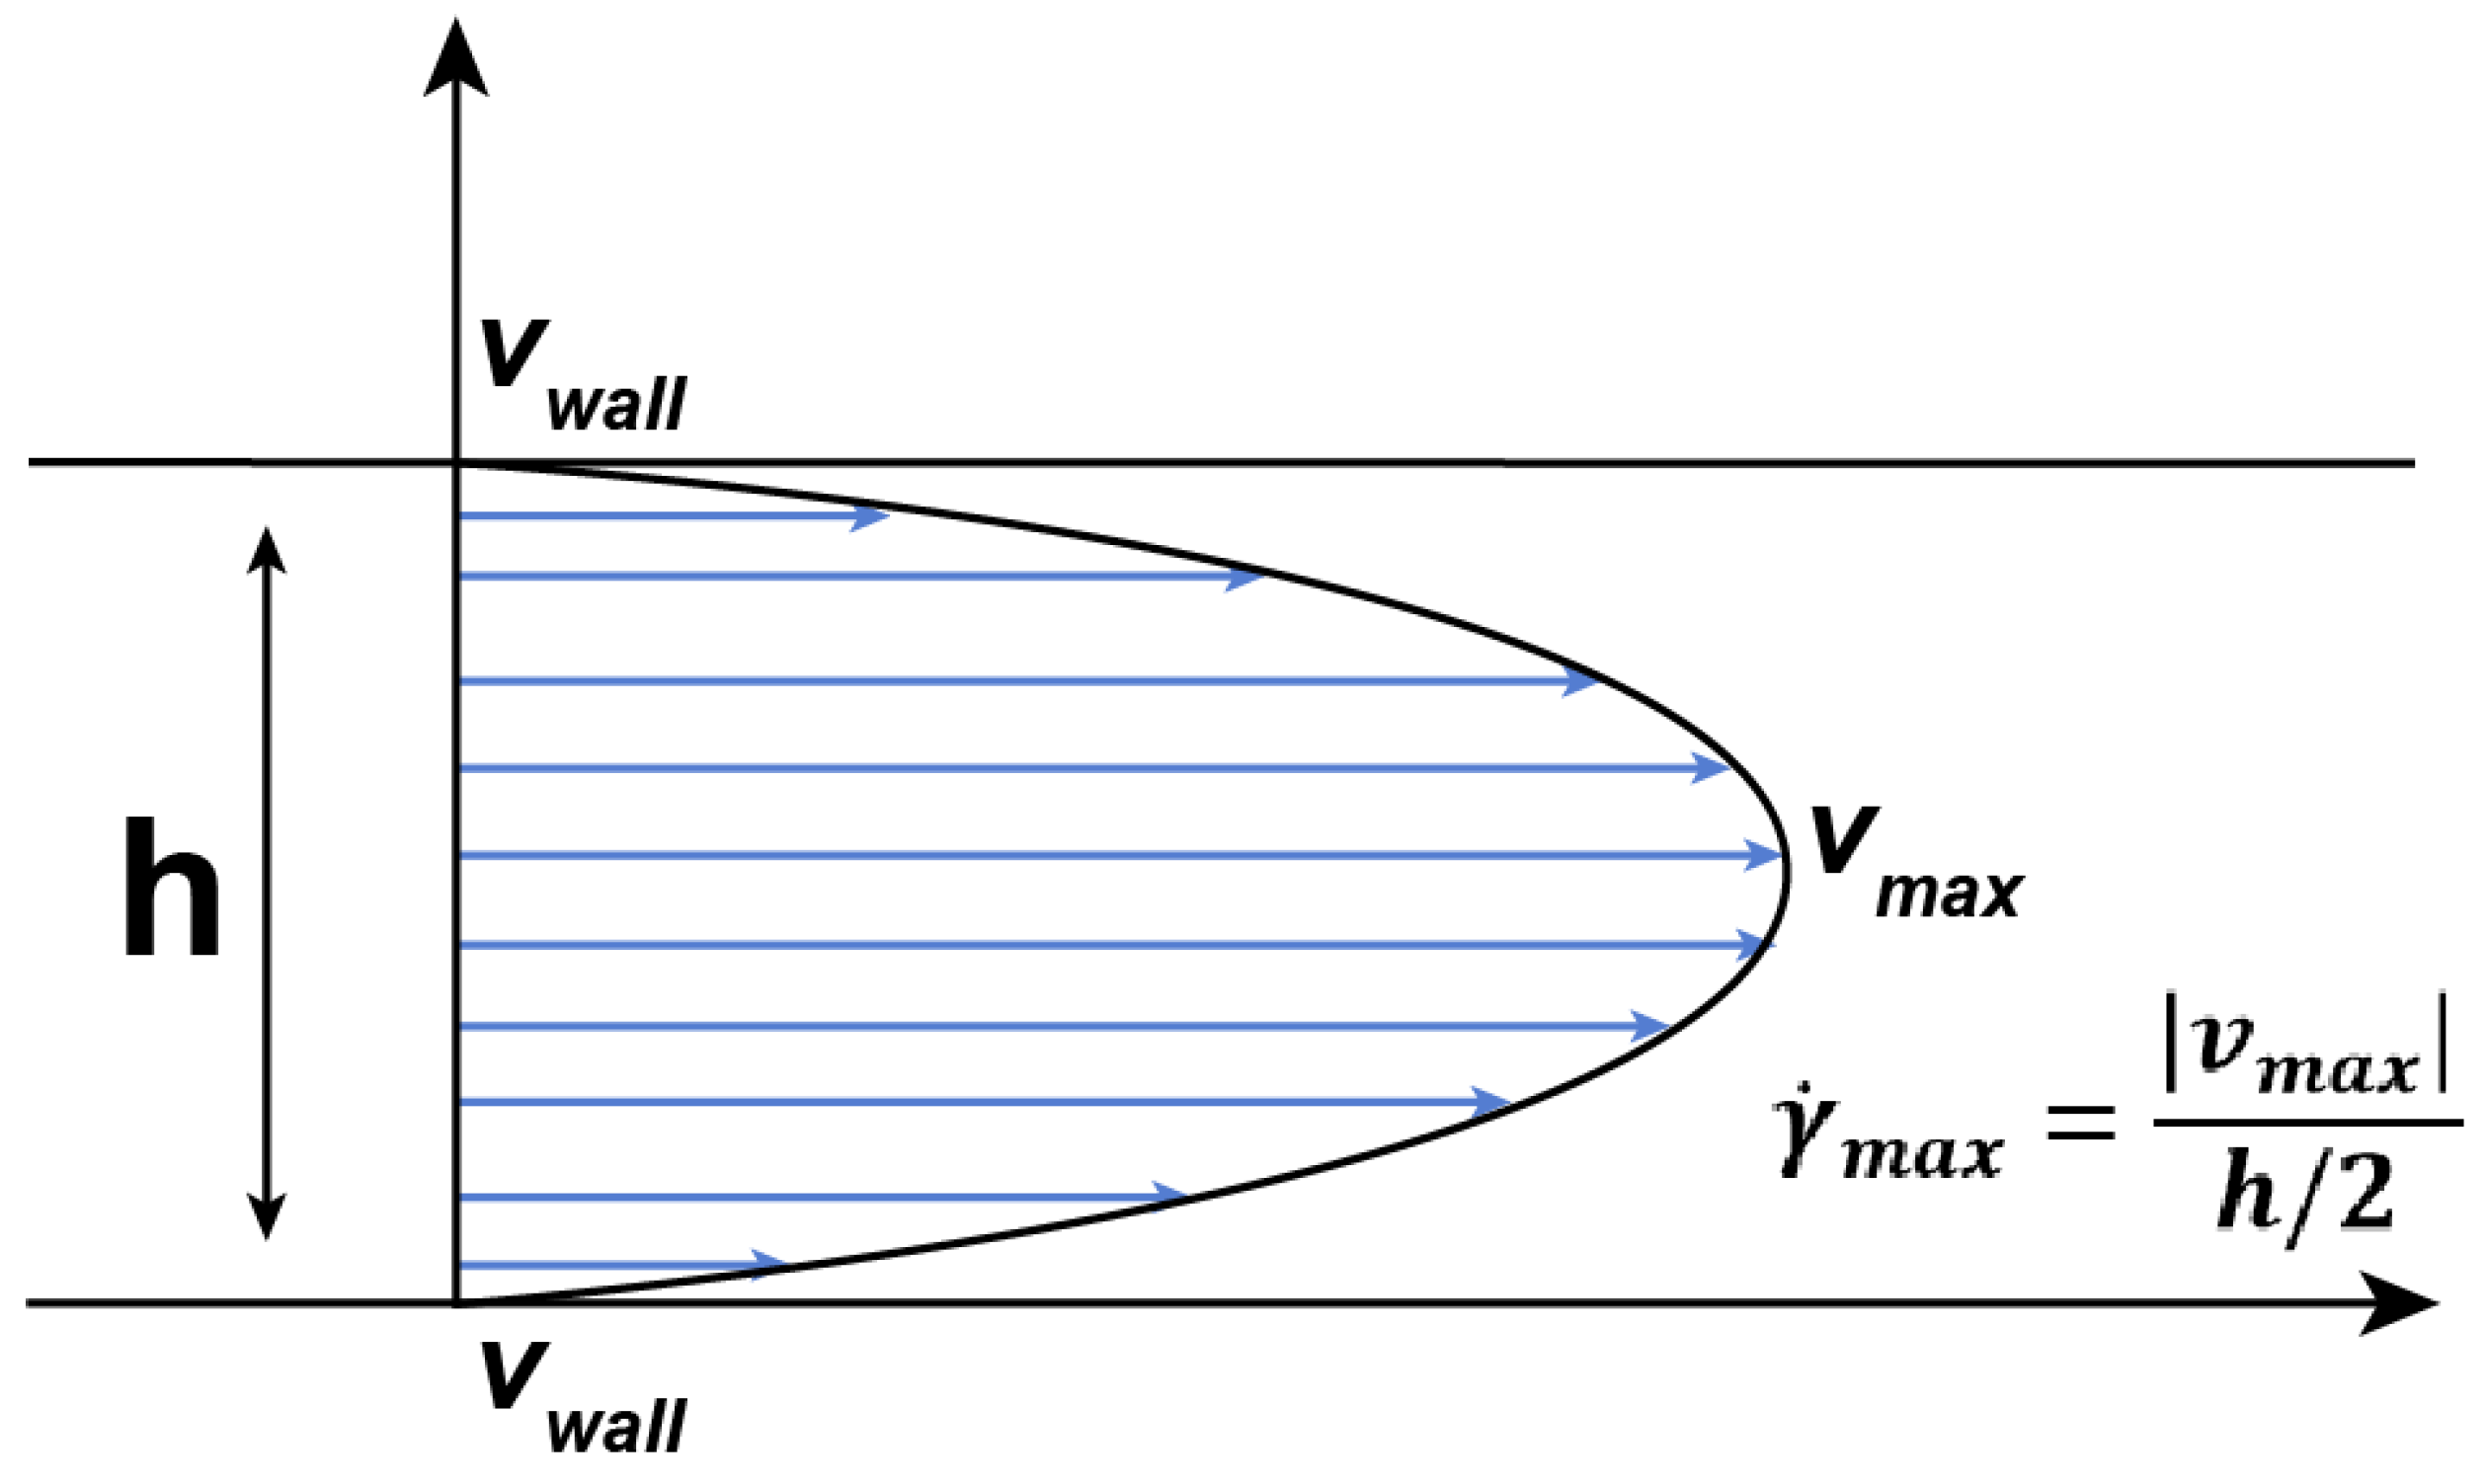
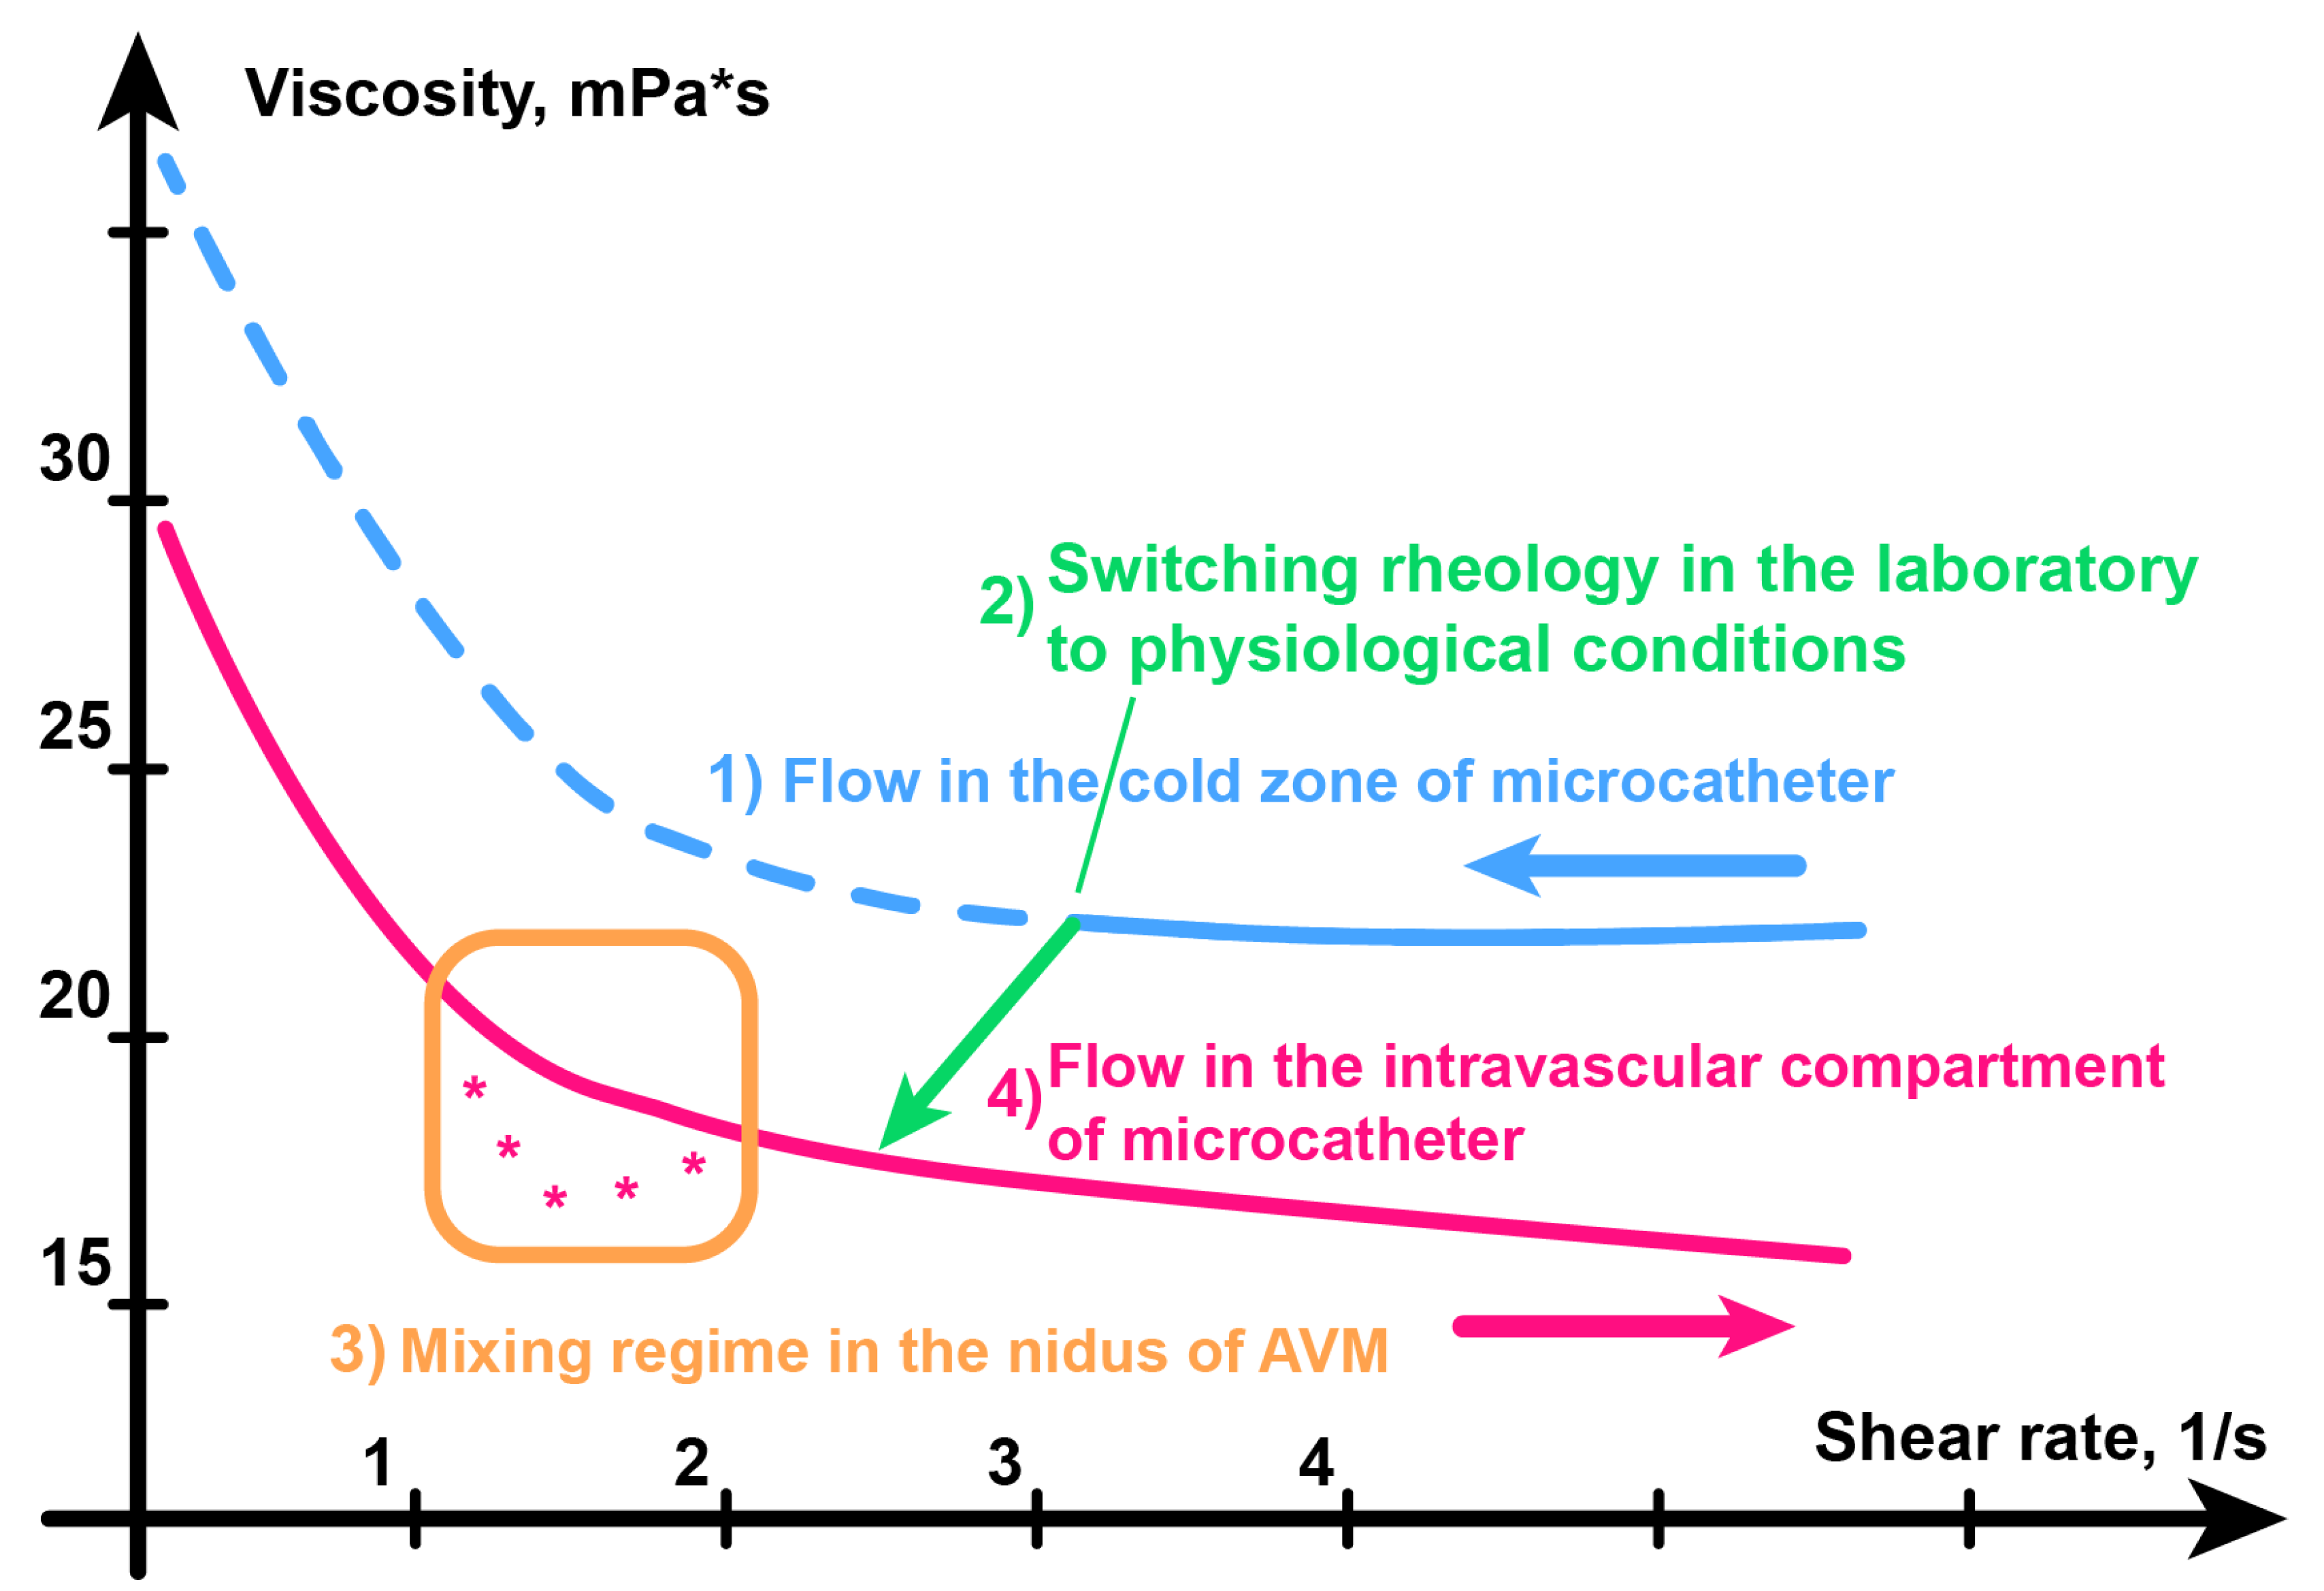
3.3. Understanding of Viscosity Activation Process
4. Discussion
5. Conclusions
Author Contributions
Funding
Data Availability Statement
Acknowledgments
Conflicts of Interest
Abbreviations
| AVM | Arteriovenous malformation |
| CM | Cisco’s model |
| DMSO | Dimethyl sulfoxide |
| DW formula | Darcy–Weisbach formula |
| WSS | Wall shear stress |
References
- Jiang, Y.; Zhang, Y.; Lu, Z.; Wang, X.; Bai, S.; Chen, Y.; Mao, J.; Liu, G. Liquid embolic agents for interventional embolization. Chem. Phys. Mater. 2022, 1, 39–50. [Google Scholar] [CrossRef]
- Lv, X.; Li, Y.; Jiang, C. Percutaneous Transvenous Embolization of Intracranial Dural Arteriovenous Fistulas with Detachable Coils and/or in Combination with Onyx. In Arteriovenous Fistulas—Diagnosis and Management; Tjoumakaris, S., Ed.; IntechOpen: London, UK, 2013. [Google Scholar]
- Oliveri, F.; Bonsignore, C.; Musumeci, I.; Murabito, P.; Scollo, S.; Rosa, V.L.; Terminella, A.; Cusumano, G.; Sofia, V.; Astuto, M. Arteriovenous Malformation Pulmonary (AVM) in a Post-Cesarean Woman: Intensive Care and Urgent Surgery Operation. Eur. J. Mol. Clin. Med. 2018, 5, 46–50. [Google Scholar] [CrossRef] [Green Version]
- Baharvahdat, H.; Blanc, R.; Termechi, R.; Pistocchi, S.; Bartolini, B.; Redjem, H.; Piotin, M. Hemorrhagic complications after endovascular treatment of cerebral arteriovenous malformations. Am. J. Neuroradiol. 2014, 35, 978–983. [Google Scholar] [CrossRef] [Green Version]
- Fennell, V.S.; Martirosyan, N.L.; Atwal, G.S.; Kalani, M.Y.S.; Ponce, F.A.; Lemole, G.M., Jr.; Dumont, T.M.; Spetzler, R.F. Hemodynamics Associated With Intracerebral Arteriovenous Malformations: The Effects of Treatment Modalities. J. Neurosurg. 2018, 83, 611–621. [Google Scholar] [CrossRef] [PubMed]
- Ondra, S.L.; Troupp, H.; George, E.D.; Schwab, K. The natural history of symptomatic arteriovenous malformations of the brain: A 24-year follow-up assessment. J. Neurosurg. 1990, 73, 387–391. [Google Scholar] [CrossRef] [PubMed]
- Papapanayotou, C.J.; Cherruault, Y.; De La Rochefoucauld, B. A mathematical model of the circle of Willis in the presence of an arteriovenous anomaly. Comput. Math. Appl. 1990, 20, 199–206. [Google Scholar] [CrossRef] [Green Version]
- Guglielmi, G. Analysis of the hemodynamic characteristics of brain arteriovenous malformations using electrical models. J. Neurosurg. 2008, 63, 1–11. [Google Scholar]
- Smith, F.T.; Jones, M.A. AVM modelling by multi-branching tube flow: Large flow rates and dual solutions. Math. Med. Biol. Bf. 2003, 20, 183–204. [Google Scholar] [CrossRef] [PubMed]
- Lord, J.; Britton, H.; Spain, S.G.; Lewis, A.L. Advancements in the development on new liquid embolic agents for use in therapeutic embolisation. J. Mater. Chem. 2020, 8, 8207–8218. [Google Scholar] [CrossRef]
- Yang, X.; Wang, S.; Zhang, X.; Ye, C.; Wang, S.; An, X. Development of PVA-based microsphere as a potential embolization agent. Biomat. Adv. 2022, 135, 112677. [Google Scholar] [CrossRef]
- Okada, H.; Hashimoto, T.; Tanaka, Y.; Sakamoto, H.; Kohno, M. Embolization of Skull Base Meningiomas with Embosphere Microspheres: Factors Predicting Treatment Response and Evaluation of Complications. World Neurosurg. 2022, 162, e178–e186. [Google Scholar] [CrossRef]
- Akinduro, O.O.; Mbabuike, N.; ReFaey, K.; Yoon, J.W.; Clifton, W.E.; Brown, B.; Wharen, R.E.; Quinones-Hinojosa, A.; Tawk, R.G. Microsphere Embolization of Hypervascular Posterior Fossa Tumors. World Neurosurg. 2018, 109, 182–187. [Google Scholar] [CrossRef] [PubMed]
- Yeom, Y.K.; Shin, J.H. Complications of Portal Vein Embolization: Evaluation on Cross-Sectional Imaging. Korean J. Radiol. 2015, 16, 1079–1085. [Google Scholar] [CrossRef] [PubMed] [Green Version]
- Gavrilov, S.G.; Mishakina, N.Y.; Efremova, O.I.; Kirsanov, K.V. Complications and Adverse Events of Gonadal Vein Embolization with Coils. J. Pers. Med. 2022, 12, 1933. [Google Scholar] [CrossRef] [PubMed]
- Niimi, Y.; Berenstein, A.; Setton, A. Complications and Their Management during NBCA Embolization of Craniospinal Lesions. Interv. Neuroradiol. 2003, 15, 157–164. [Google Scholar] [CrossRef]
- Kilani, M.S.; Zehtabi, F.; Lerouge, S.; Soulez, G.; Bartoli, J.M.; Vidal, V.; Badran, M.F. New Alcohol and Onyx Mixture for Embolization: Feasibility and Proof of Concept in Both In Vitro and In Vivo Models. Cardiovasc. Intervent. Radiol. 2017, 40, 735–743. [Google Scholar] [CrossRef]
- Elliott, J.P., Jr.; Hageman, J.H.; Szilagyi, E.; Ramakrishnan, V.; Bravo, J.J.; Smith, R.F. Arterial embolization: Problems of source, multiplicity, recurrence, and delayed treatment. Surgery 1980, 88, 833–845. [Google Scholar]
- Orlowski, P.; Summers, P.; Noble, J.A.; Byrne, J.; Ventikos, Y. Computational modelling for the embolization of brain arteriovenous malformations. Med. Eng. Phys. 2012, 34, 873–881. [Google Scholar] [CrossRef]
- Siekmann, R. Basics and Principles in the Application of Onyx LD Liquid Embolic System in the Endovascular Treatment of Cerebral Arteriovenous Malformations. Interv. Neuroradiol. 2005, 5, 131–140. [Google Scholar] [CrossRef] [Green Version]
- FitzGerald, P.F.; Butts, M.D.; Roberts, J.C.; Colborn, R.E.; Torres, A.S.; Lee, B.D.; Yeh, B.M.; Bonitatibus, P.J., Jr. A proposed CT contrast agent using carboxybetaine zwitterionic tantalum oxide nanoparticles: Imaging, biological, and physicochemical performance. Invest. Radiol. 2016, 51, 786–796. [Google Scholar] [CrossRef] [Green Version]
- Khokhlov, A.L.; Kabanov, A.V.; Kozlova, O.G. X-ray contrast media: Focus on safety. Med. Vis. 2018, 5, 94–105. [Google Scholar] [CrossRef]
- GE Healthcare. Omnipaque (Iohexol) Injection; Product label; DailyMed: Bethesda, MD, USA, 2006. [Google Scholar]
- Van Dellen, J.R.; Lipschitz, R. Meglumine iocarmate (Dimer-X) ventriculography. Clin. Radiol. 1973, 24, 449–452. [Google Scholar] [CrossRef] [PubMed]
- Loffroy, R.; Guiu, B.; Cercueil, J.P.; Krausé, D. Endovascular Therapeutic Embolisation: An Overview of Occluding Agents and their Effects on Embolised Tissues. Curr. Vasc. Pharmacol. 2009, 7, 250–263. [Google Scholar] [CrossRef] [PubMed]
- Piacentino, F.; Fontana, F.; Curti, M.; Macchi, E.; Coppola, A.; Ossola, C.; Giorgianni, A.; Marra, P.; Mosconi, C.; Ierardi, A.M.; et al. Non-Adhesive Liquid Embolic Agents in Extra-Cranial District: State of the Art and Review of the Literature. J. Clin. Med. 2021, 10, 4841. [Google Scholar] [CrossRef]
- Anton Paar GmbH. Instruction Manual. MCR Series. Modular Compact Rheometer. MCR 102/MCR 302. SmartPave 102. MCR 502 S; Anton Paar GmbH: Graz, Austria, 2018; p. 51. [Google Scholar]
- Lozovskiy, A.; Olshanskii, M.A.; Vassilevski, Y.V. A finite element scheme for the numerical solution of the Navier–Stokes/Biot coupled problem. Rus. J. Numer. Anal. Math. Model. 2022, 37, 159–174. [Google Scholar] [CrossRef]
- Favre-Marinet, M.; Tardu, S. Convective Heat Transfer; ISTE Ltd.: London, UK, 2009; pp. 1–7. [Google Scholar]
- Zhou, J.C.; Che, Y.Y.; Wu, K.J.; Shen, J.; He, C.H. Thermal Conductivity of DMSO + C2H5OH, DMSO + H2O, and DMSO + C2H5OH + H2O Mixtures at T = (278.15 to 338.15) K. J. Chem. Eng. Data 2013, 58, 663–670. [Google Scholar] [CrossRef]
- ONYX Patent and Methodology Information. Available online: https://www.accessdata.fda.gov/cdrh_docs/pdf3/P030004c.pdf (accessed on 1 January 2020).
- SQUID Methodology and Patent Information. Available online: https://www.debene.com/productos/balt/media/docs/balt_squid_brochure.pdf (accessed on 1 January 2020).
- Saramito, P. Complex Fluids. Modeling and Algorithms; Springer: Berlin, Germany, 2016; pp. 49–56, 64–65. [Google Scholar]
- Matvienko, O.V. Investigation of the stabilized flow of pseudoplastic liquid, described by the Sisco model, in the cylindrical tube. Tomsk. St. Univers. J. Math. Mech. 2018, 55, 99–112. [Google Scholar] [CrossRef]
- Lenton, J.; Kessel, D.; Watkinson, A.F. Embolization of renal angiomyolipoma: Immediate complications and long-term outcomes. Clin. Radiol. 2008, 63, 864–870. [Google Scholar] [CrossRef]
- Rose, S.C.; Kikolski, S.G.; Chomas, J.E. Downstream hepatic arterial blood pressure changes caused by deployment of the surefire antireflux expandable tip. Cardiovasc. Intervent. Radiol. 2013, 36, 1262–1269. [Google Scholar] [CrossRef]
- Chaudhry, M.H. Applied Hydraulic Transients, 3rd ed.; Springer: New York, NY, USA, 2013; pp. 48–49. [Google Scholar]
- Batchelor, G.K. An Introduction to Fluid Dynamics; Cambridge University Press: Cambridge, UK, 2000; pp. 180–181. [Google Scholar]
- Lv, X.; Wu, Z.; Li, Y. Arteriovenous malformation in the brain: A theoretical study explaining the behavior of liquid embolic agents during endovascular treatment. J. Neuroradiol. 2013, 26, 661–668. [Google Scholar] [CrossRef] [Green Version]
- Golovin, S.; Khe, A.; Gadylshina, K. Hydraulic model of cerebral arteriovenous malformations. J. Fluid Mech. 2016, 797, 110–129. [Google Scholar] [CrossRef]
- Cherevko, A.A.; Gologush, T.S.; Petrenko, I.A.; Ostapenko, V.V.; Panarin, V.A. Modelling of the arteriovenous malformation embolization optimal scenario. R. Soc. Open Sci. 2020, 7, 191992. [Google Scholar] [CrossRef] [PubMed]
- Sharifullina, T.; Cherevko, A.; Ostapenko, V. Optimal control problem arising in mathematical modeling of cerebral vascular pathology embolization. Sci. Rep. 2022, 12, 1302. [Google Scholar] [CrossRef] [PubMed]
- Vollherbst, D.F.; Chapot, R.; Bendszus, M.; Möhlenbruch, M.A. Glue, Onyx, Squid or PHIL? Liquid Embolic Agents for the Embolization of Cerebral Arteriovenous Malformations and Dural Arteriovenous Fistulas. Clin. Neuroradiol. 2022, 32, 25–38. [Google Scholar] [CrossRef]
- Venturini, M.; Lanza, C.; Marra, P.; Colarieti, A.; Panzeri, M.; Augello, L.; Gusmini, S.; Salvioni, M.; De Cobelli, F.; Del Maschio, A. Transcatheter embolization with Squid, combined with other embolic agents or alone, in different abdominal diseases: A single-center experience in 30 patients. CVIR Endovasc. 2019, 2, 8. [Google Scholar] [CrossRef] [Green Version]


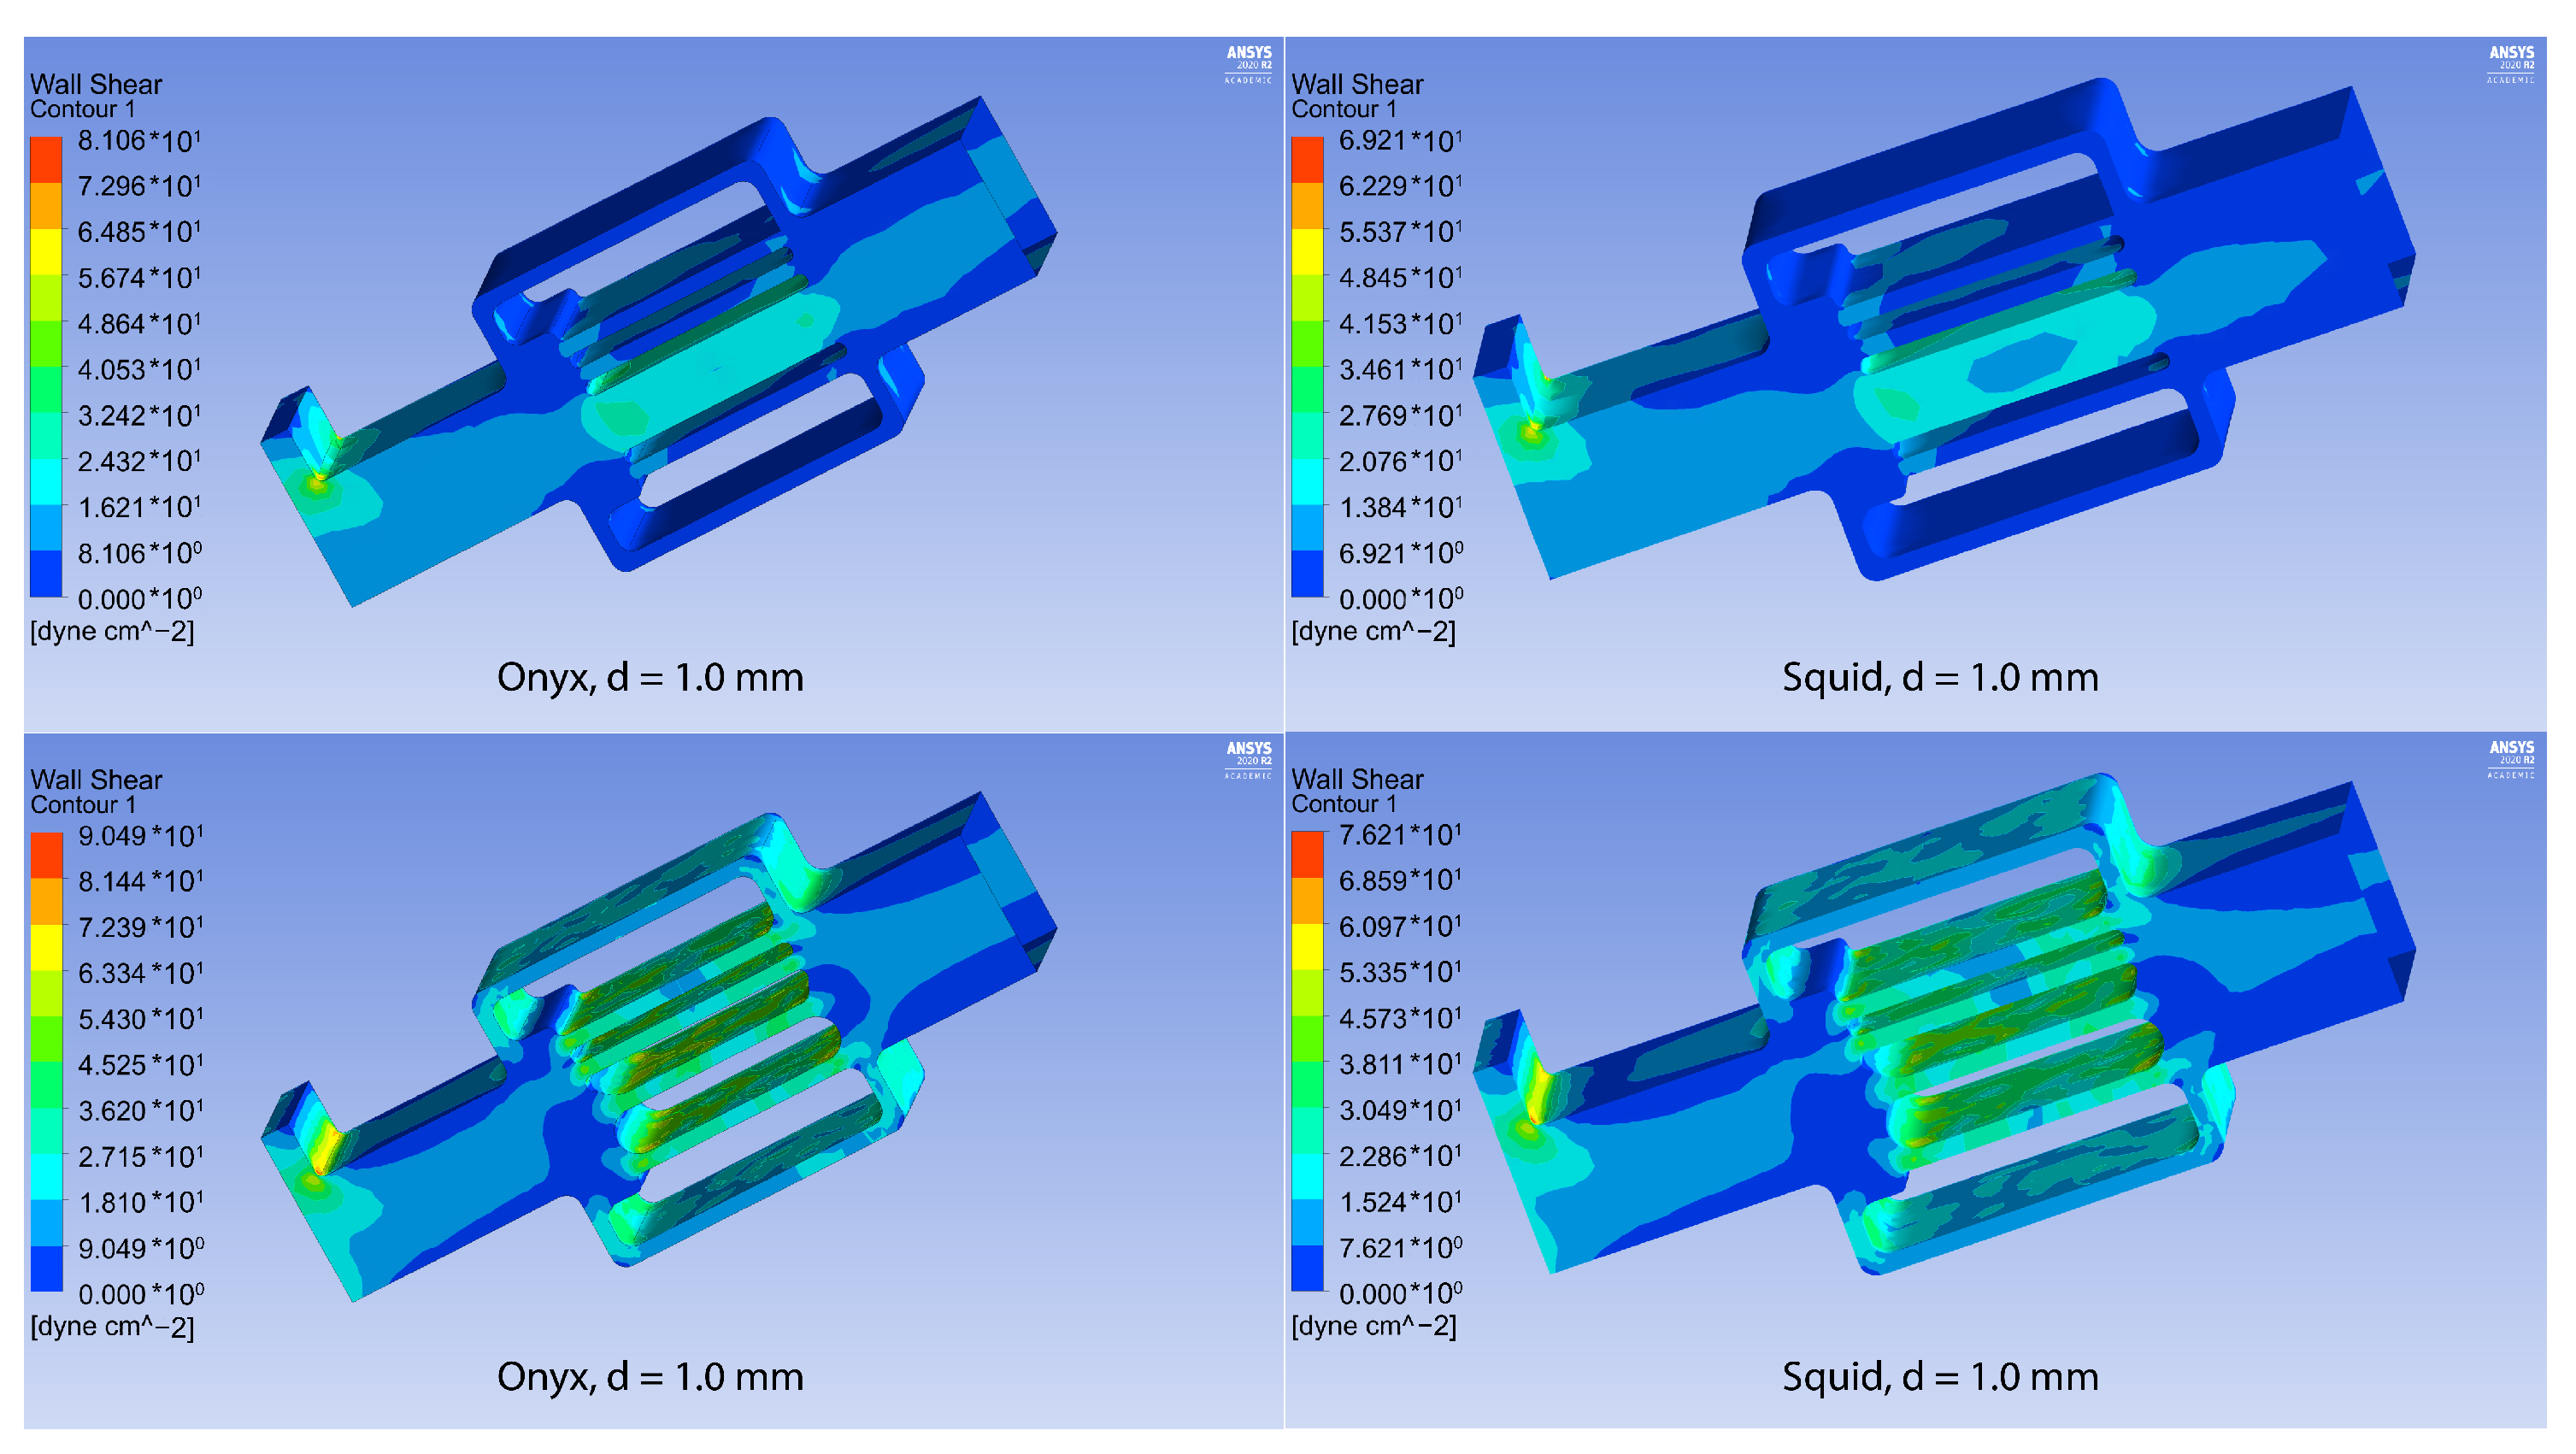
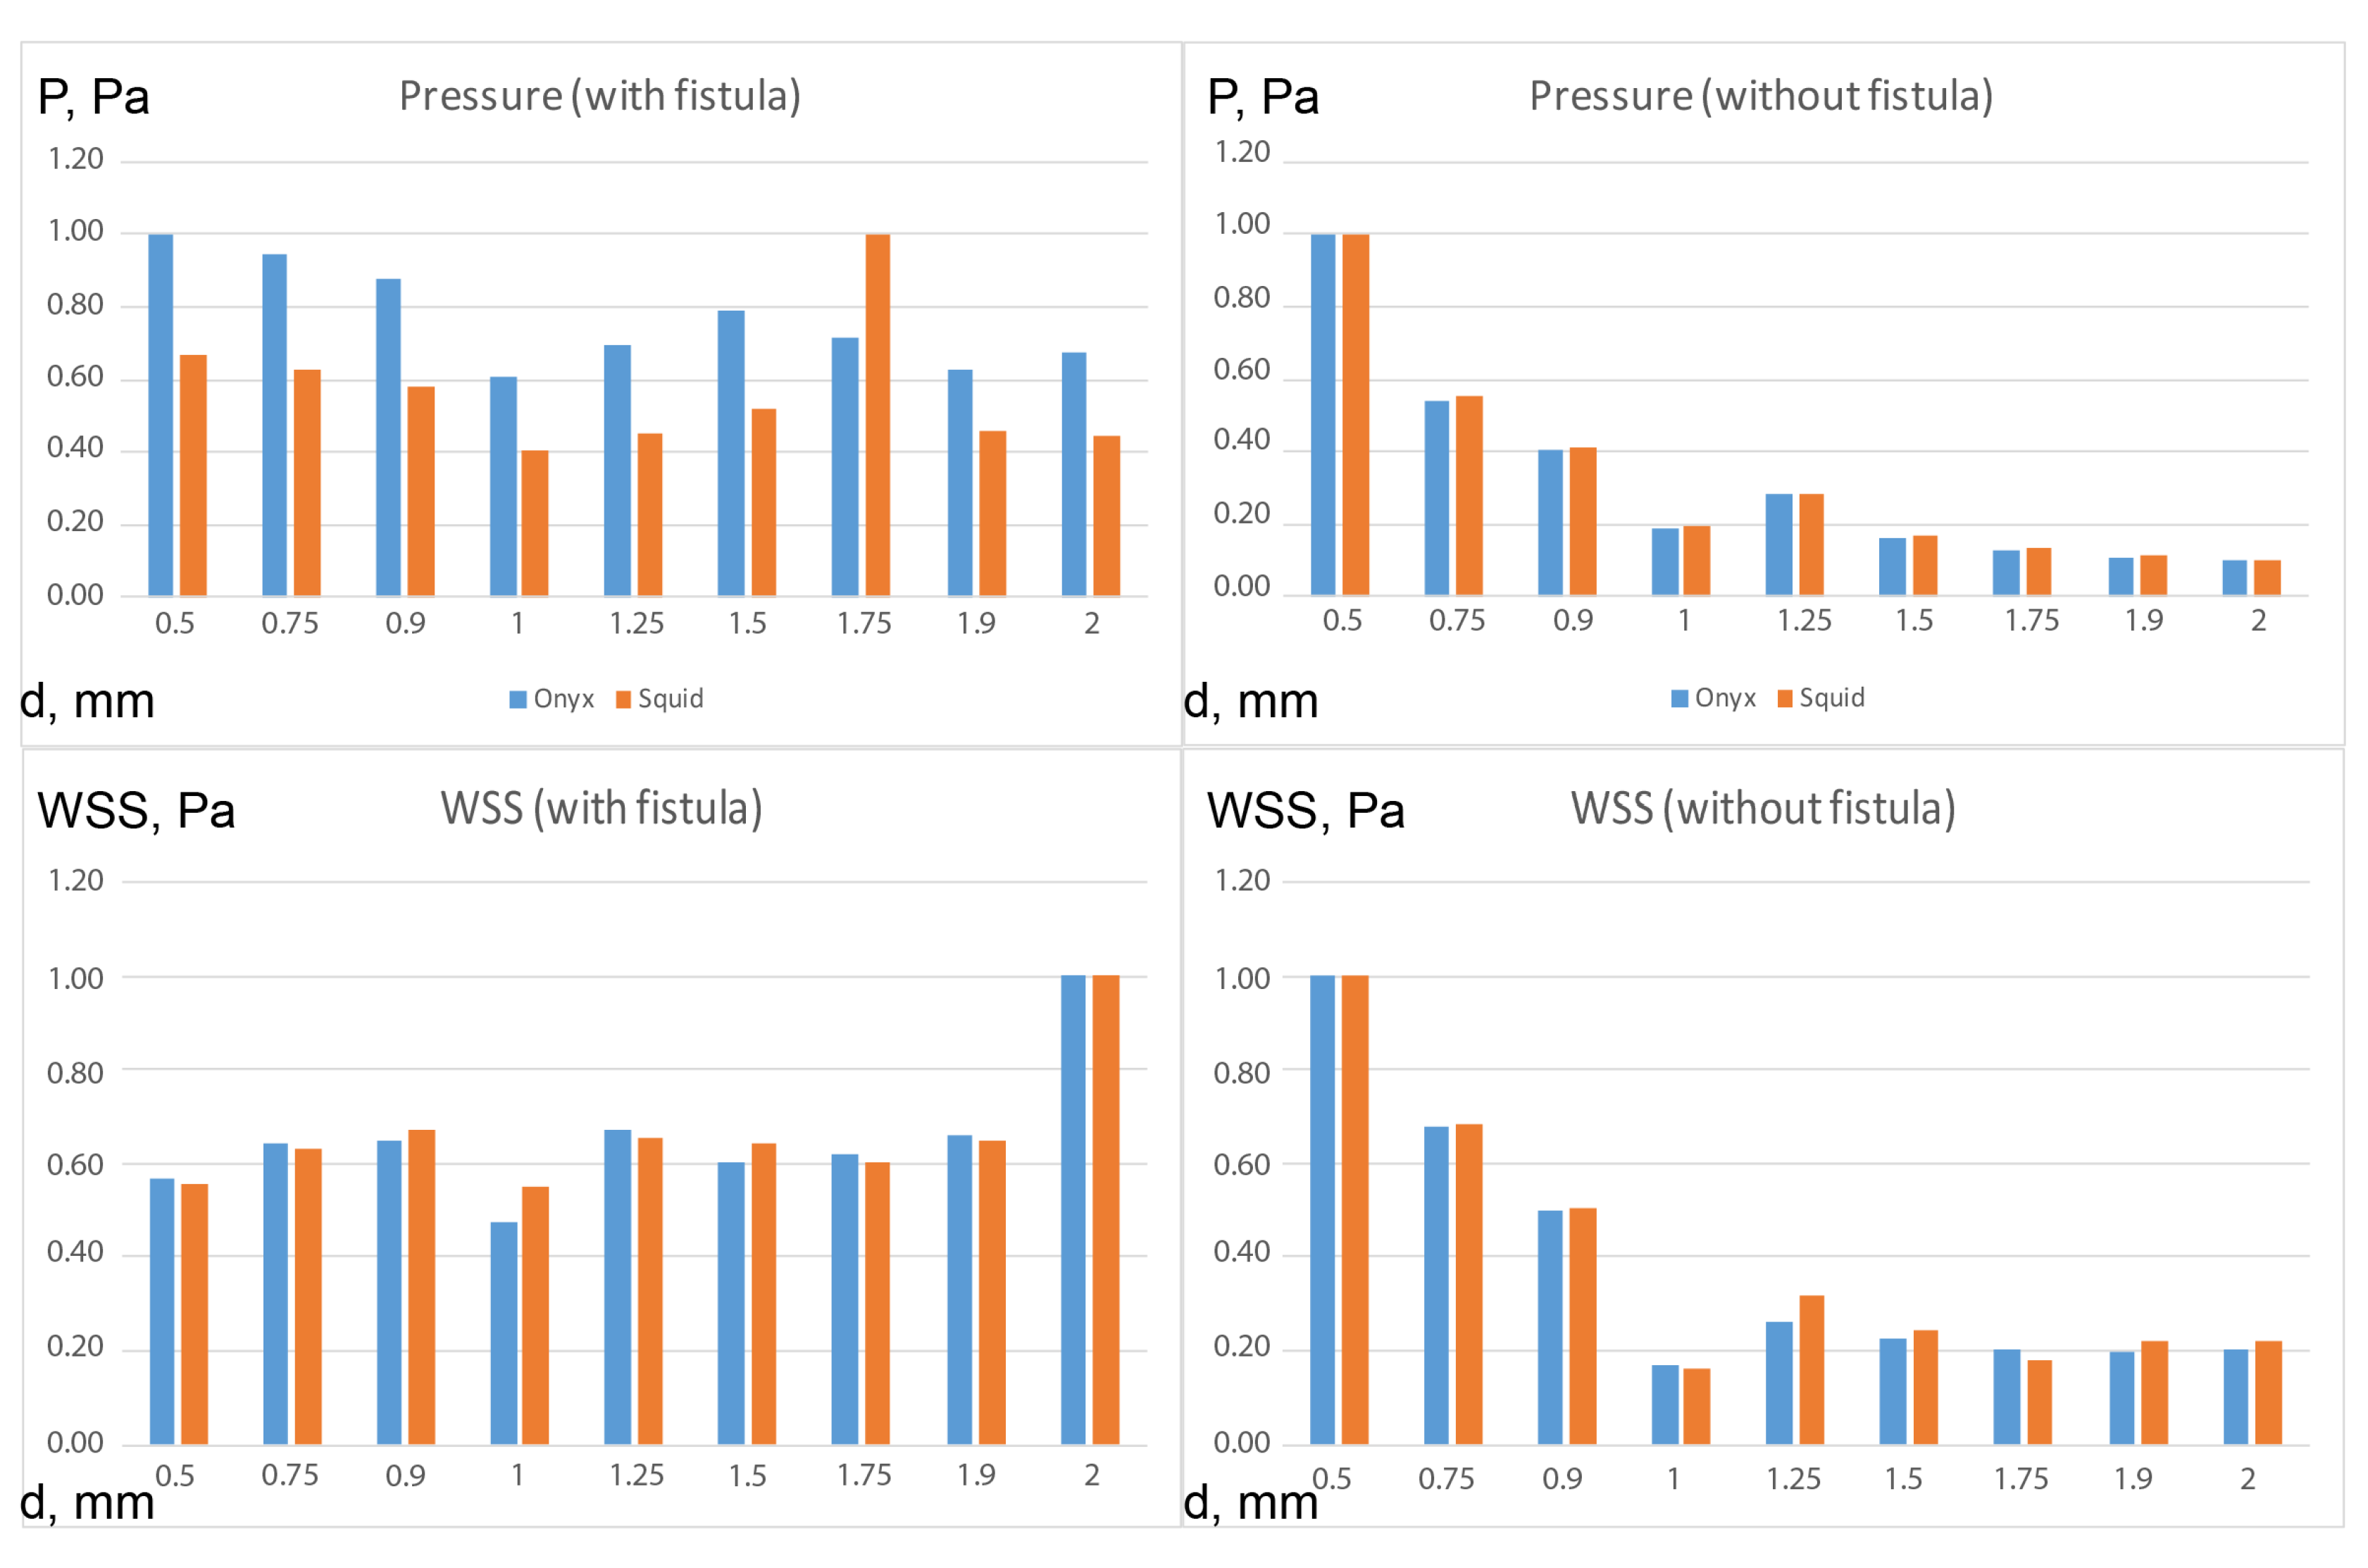
| Diameter of the Vessel Racimous Part, mm | Fistula | Maximum Pressure in Racimous Part, Pa | Maximum WSS in Racimous Part, dyne/cm | ||
|---|---|---|---|---|---|
| Onyx-18 ® | Squid-12 ® | Onyx-18 ® | Squid-12 ® | ||
| 0.5 | − | 7665.17 | 5588.45 | 441.79 | 329.42 |
| 0.75 | − | 4148.71 | 3083.56 | 298.36 | 225.19 |
| 0.9 | − | 3076.53 | 2290.17 | 220.04 | 166.06 |
| 1 | − | 1432.47 | 1083.3 | 74.77 | 54.32 |
| 1.25 | − | 2146.94 | 1590.51 | 115.62 | 105.26 |
| 1.5 | − | 1246.53 | 938.47 | 100.59 | 80.44 |
| 1.75 | − | 970.86 | 735.596 | 89.33 | 59.29 |
| 1.9 | − | 813.85 | 617.49 | 87.04 | 72.96 |
| 2 | − | 743.36 | 565.05 | 89.49 | 73.23 |
| 0.5 | + | 560.99 | 432.79 | 29.61 | 24.05 |
| 0.75 | + | 529.44 | 406.56 | 33.53 | 27.20 |
| 0.9 | + | 492.31 | 376.38 | 33.80 | 28.91 |
| 1 | + | 340.15 | 261.82 | 24.83 | 23.65 |
| 1.25 | + | 389.53 | 294.17 | 34.85 | 28.13 |
| 1.5 | + | 443.49 | 338.72 | 31.43 | 27.85 |
| 1.75 | + | 400.98 | 649.34 | 32.13 | 26.01 |
| 1.9 | + | 351.55 | 295.15 | 34.19 | 28.08 |
| 2 | + | 378.34 | 288.94 | 52.07 | 43.20 |
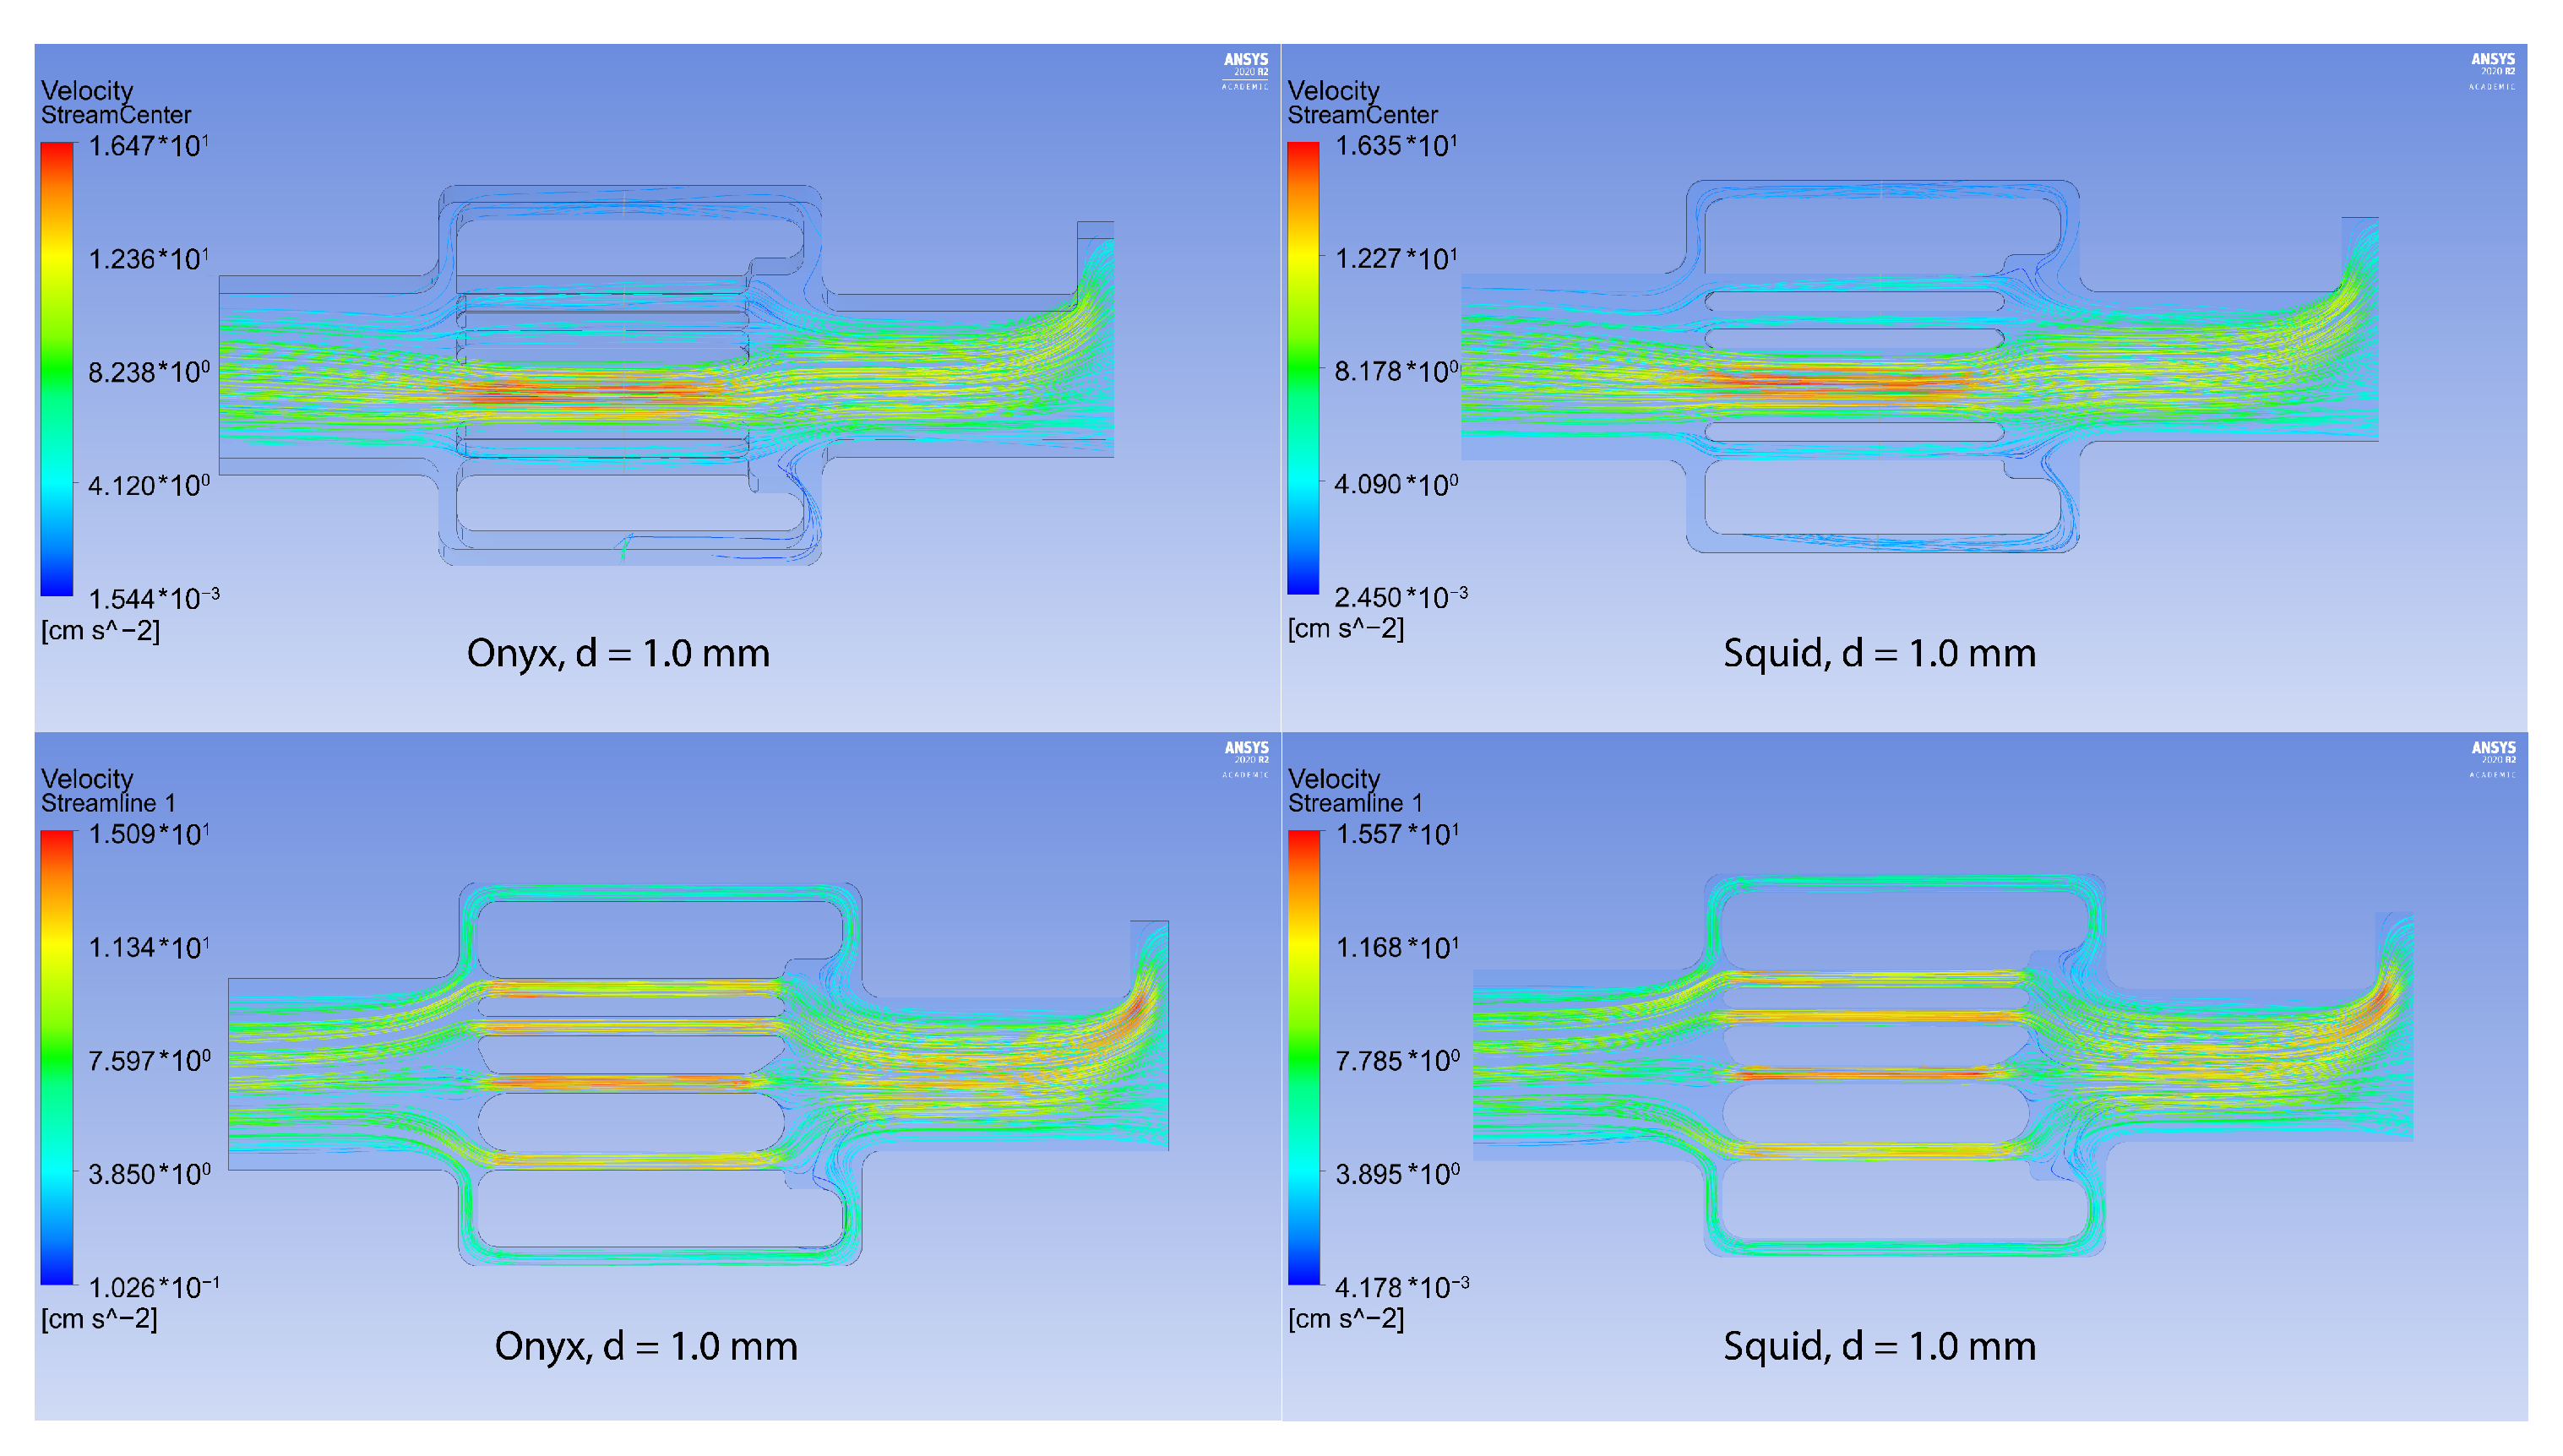
| Onyx-18® | Squid-12® | |||||
|---|---|---|---|---|---|---|
| d = 1 mm | Max Velocity | Min Velocity | Shear Rate | Max Velocity | Min Velocity | Shear Rate |
| Fistula | 0.15 | 1647.78 | 29.62 | 0.24 | 1635.40 | 30.83 |
| Without fistula | 0.25 | 1548.08 | 45.23 | 0.41 | 1556.58 | 46.60 |
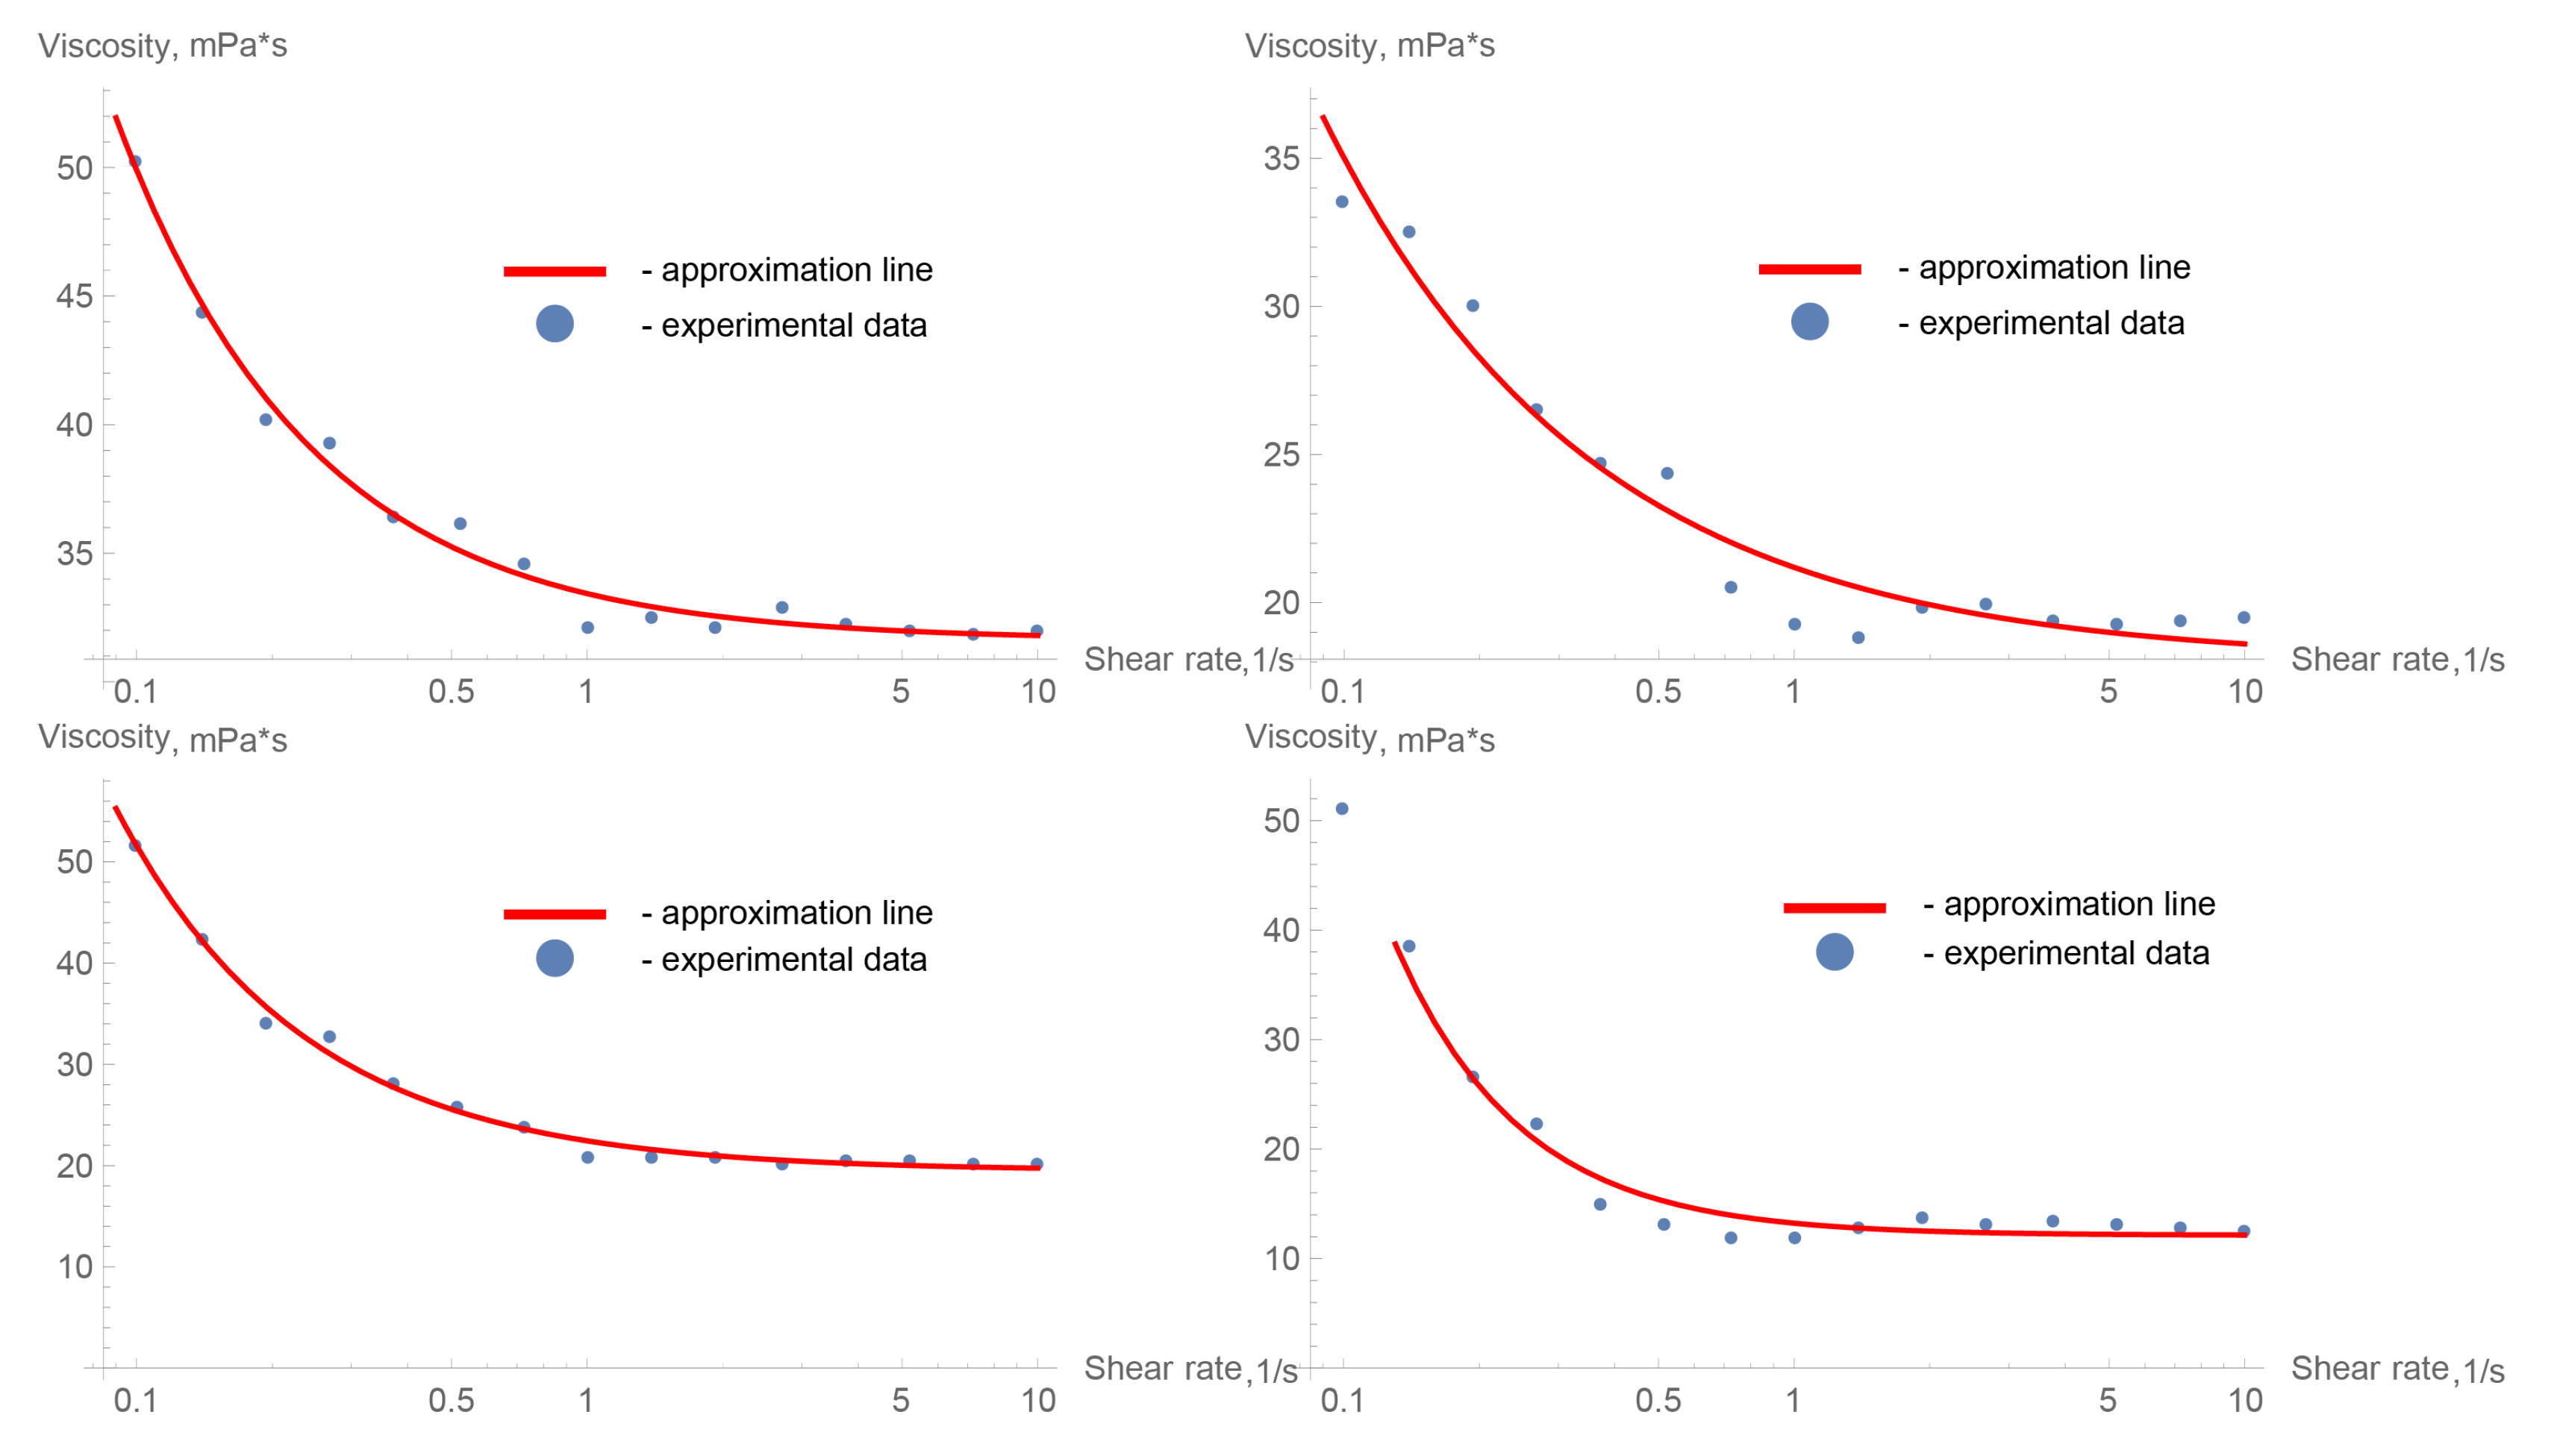
| Embolic Polymer | C | C | ||||
|---|---|---|---|---|---|---|
| k | n | k | n | |||
| Onyx-18® | 31.6187 | 1.80968 | −0.004368 | 18.0138 | 3.17306 | 0.271126 |
| Squid-12® | 19.4711 | 2.9736 | −0.03329 | 12.1248 | 1.10875 | −0.5586 |
Disclaimer/Publisher’s Note: The statements, opinions and data contained in all publications are solely those of the individual author(s) and contributor(s) and not of MDPI and/or the editor(s). MDPI and/or the editor(s) disclaim responsibility for any injury to people or property resulting from any ideas, methods, instructions or products referred to in the content. |
© 2023 by the authors. Licensee MDPI, Basel, Switzerland. This article is an open access article distributed under the terms and conditions of the Creative Commons Attribution (CC BY) license (https://creativecommons.org/licenses/by/4.0/).
Share and Cite
Kuianova, I.; Chupakhin, A.; Besov, A.; Gorbatykh, A.; Kislitsin, D.; Orlov, K.; Parshin, D. Rheological Properties of Non-Adhesive Embolizing Compounds—The Key to Fine-Tuning Embolization Process-Modeling in Endovascular Surgery. Polymers 2023, 15, 1060. https://doi.org/10.3390/polym15041060
Kuianova I, Chupakhin A, Besov A, Gorbatykh A, Kislitsin D, Orlov K, Parshin D. Rheological Properties of Non-Adhesive Embolizing Compounds—The Key to Fine-Tuning Embolization Process-Modeling in Endovascular Surgery. Polymers. 2023; 15(4):1060. https://doi.org/10.3390/polym15041060
Chicago/Turabian StyleKuianova, Iuliia, Alexander Chupakhin, Alexey Besov, Anton Gorbatykh, Dmitry Kislitsin, Kirill Orlov, and Daniil Parshin. 2023. "Rheological Properties of Non-Adhesive Embolizing Compounds—The Key to Fine-Tuning Embolization Process-Modeling in Endovascular Surgery" Polymers 15, no. 4: 1060. https://doi.org/10.3390/polym15041060