

Hydrothermal Carbonization of Cellulose with Ammonium Sulfate and Thiourea for the Production of Supercapacitor Carbon

Abstract
:
1. Introduction
2. Materials and Methods
2.1. Materials
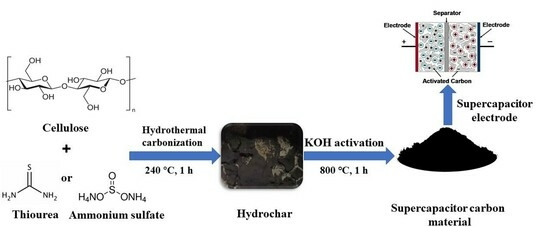
2.2. HTC
2.3. Activation of HC
2.4. Characterization of HC and AHC
2.5. Electrochemical Performance of AHC
3. Results and Discussion
3.1. Yield of the HC and Elemental Analyses of the HC and AHC
3.2. FT-IR and XRD Analyses of HC
3.3. BET Analysis of the AHC
3.4. XPS Analysis of the AHC
3.5. Electrochemical Analysis of the AHC
4. Conclusions
Author Contributions
Funding
Institutional Review Board Statement
Data Availability Statement
Acknowledgments
Conflicts of Interest
References
- Gao, P.; Yue, S.; Chen, H. Carbon emission efficiency of China’s industry sectors: From the perspective of embodied carbon emissions. J. Clean. Prod. 2021, 283, 124655. [Google Scholar] [CrossRef]
- Liu, J. China’s renewable energy law and policy: A critical review. Renew. Sustain. Energy Rev. 2019, 99, 212–219. [Google Scholar] [CrossRef]
- Zeng, S.; Jiang, C.; Ma, C.; Su, B. Investment efficiency of the new energy industry in China. Energy Econ. 2018, 70, 536–544. [Google Scholar] [CrossRef]
- Ahmed, F.E.; Hashaikeh, R.; Hilal, N. Solar powered desalination—Technology, energy and future outlook. Desalination 2019, 453, 54–76. [Google Scholar] [CrossRef]
- Moran, E.F.; Lopez, M.C.; Moore, N.; Muller, N.; Hyndman, D.W. Sustainable hydropower in the 21st century. Proc. Natl. Acad. Sci. USA 2018, 115, 11891–11898. [Google Scholar] [CrossRef]
- Sahu, B.K. Wind energy developments and policies in China: A short review. Renew. Sustain. Energy Rev. 2018, 81, 1393–1405. [Google Scholar] [CrossRef]
- Abouelamaiem, D.I.; He, G.; Parkin, I.; Neville, T.P.; Jorge, A.B.; Ji, S.; Wang, R.; Titirici, M.M.; Shearing, P.R.; Brett, D.J.L. Synergistic relationship between the three-dimensional nanostructure and electrochemical performance in biocarbon supercapacitor electrode materials. Sustain. Energy Fuels 2018, 2, 772–785. [Google Scholar] [CrossRef]
- Bi, Z.; Kong, Q.; Cao, Y.; Sun, G.; Su, F.; Wei, X.; Li, X.; Ahmad, A.; Xie, L.; Chen, C.M. Biomass-derived porous carbon materials with different dimensions for supercapacitor electrodes: A review. J. Mater. Chem. A 2019, 7, 16028–16045. [Google Scholar] [CrossRef]
- Li, Y.; Ou-Yang, W.; Xu, X.; Wang, M.; Hou, S.; Lu, T.; Yao, Y.; Pan, L. Micro-/mesoporous carbon nanofibers embedded with ordered carbon for flexible supercapacitors. Electrochim. Acta 2018, 271, 591–598. [Google Scholar] [CrossRef]
- Xing, L.; Chen, X.; Tan, Z.; Chi, M.; Xie, W.; Huang, J.; Liang, Y.; Zheng, M.; Hu, H.; Dong, H.; et al. Synthesis of porous carbon material with suitable graphitization strength for high electrochemical capacitors. ACS Sustain. Chem. Eng. 2019, 7, 6601–6610. [Google Scholar] [CrossRef]
- Zhang, Y.; Yu, P.; Zheng, M.; Xiao, Y.; Hu, H.; Liang, Y.; Liu, Y.; Dong, H. KCl-assisted activation: Moringa oleifera branch-derived porous carbon for high performance supercapacitor. New J. Chem. 2021, 45, 5712–5719. [Google Scholar] [CrossRef]
- Sharma, P.K.; Arora, A.; Tripathi, S.K. Review of supercapacitors: Materials and devices. J. Energy Storage 2019, 21, 801–825. [Google Scholar]
- Wang, J.; Zhang, X.; Li, Z.; Ma, Y.; Ma, L. Recent progress of biomass-derived carbon materials for supercapacitors. J. Power Sources 2020, 451, 227794. [Google Scholar] [CrossRef]
- Yao, L.; Lin, J.; Chen, Y.; Li, X.; Wang, D.; Yang, H.; Deng, L.; Zheng, Z. Supramolecular-mediated ball-in-ball porous carbon nanospheres for ultrafast energy storage. InfoMat 2021, 4, e12278. [Google Scholar] [CrossRef]
- Jiang, J.; Li, Y.; Liu, J.; Huang, X.; Yuan, C.; Lou, X.W. Recent advances in metal oxide-based electrode architecture design for electrochemical energy storage. Adv. Mater. 2012, 24, 5166–5180. [Google Scholar] [CrossRef]
- Sassoye, C.; Laberty, C.; Khanh, H.L.; Cassaignon, S.; Boissière, C.; Antonietti, M.; Sanchez, C. Block-copolymer-templated synthesis of electroactive RuO2-based mesoporous thin films. Adv. Funct. Mater. 2009, 19, 1922–1929. [Google Scholar] [CrossRef]
- Ramya, R.; Sivasubramanian, R.; Sangaranarayanan, M.V. Conducting polymers-based electrochemical supercapacitors—Progress and prospects. Electrochim. Acta 2013, 101, 109–129. [Google Scholar] [CrossRef]
- Han, J.; Zhang, L.L.; Lee, S.; Oh, J.; Lee, K.S.; Potts, J.R.; Ji, J.Y.; Zhao, X.; Ruoff, R.S.; Park, S. Generation of B-doped graphene nanoplatelets using a solution process and their supercapacitor applications. ACS Nano 2013, 7, 19–26. [Google Scholar] [CrossRef]
- Lee, W.S.V.; Leng, M.; Li, M.; Huang, X.L.; Xue, J.M. Sulphur-functionalized graphene towards high performance supercapacitor. Nano Energy 2015, 12, 250–257. [Google Scholar] [CrossRef]
- Raymundo-Piñero, E.; Cadek, M.; Béguin, F. Tuning carbon materials for supercapacitors by direct pyrolysis of seaweeds. Adv. Funct. Mater. 2009, 19, 1032–1039. [Google Scholar] [CrossRef]
- Wen, Y.; Wang, B.; Huang, C.; Wang, L.; Hulicova-Jurcakova, D. Synthesis of phosphorus-doped graphene and its wide potential window in aqueous supercapacitors. Chemistry 2015, 21, 80–85. [Google Scholar] [CrossRef] [PubMed]
- Yang, Z.; Ren, J.; Zhang, Z.; Chen, X.; Guan, G.; Qiu, L.; Zhang, Y.; Peng, H. Recent advancement of nanostructured carbon for energy applications. Chem. Rev. 2015, 115, 5159–5223. [Google Scholar] [CrossRef] [PubMed]
- Lota, G.; Grzyb, B.; Machnikowska, H.; Machnikowski, J.; Frackowiak, E. Effect of nitrogen in carbon electrode on the supercapacitor performance. Chem. Phys. Lett. 2005, 404, 53–58. [Google Scholar] [CrossRef]
- Salinas-Torres, D.; Shiraishi, S.; Morallón, E.; Cazorla-Amorós, D. Improvement of carbon materials performance by nitrogen functional groups in electrochemical capacitors in organic electrolyte at severe conditions. Carbon 2015, 82, 205–213. [Google Scholar] [CrossRef]
- Wang, H.L.; Kohandehghan, A.; Li, Z.; Cui, K.; Tan, X.H.; Stephenson, T.J.; King’ondu, C.K.; Holt, C.M.B.; Olsen, B.C.; Tak, J.K.; et al. Interconnected carbon nanosheets derived from hemp for ultrafast supercapacitors with high energy. ACS Nano 2013, 7, 5131–5141. [Google Scholar] [CrossRef]
- Hou, J.H.; Idrees, F.; Ma, X.L. Hierarchical porous Nitrogen-doped carbon nanosheets derived from silk for Ultrahigh-capacity battery anodes and supercapacitors. ACS Nano 2015, 9, 2556–2564. [Google Scholar] [CrossRef] [PubMed]
- Lu, C.; Huang, Y.H.; Wu, Y.J.; Li, J.; Cheng, J.P. Camellia pollen-derived carbon for supercapacitor electrode material. J. Power Sources 2018, 394, 9–16. [Google Scholar] [CrossRef]
- Xu, M.; Yu, Q.; Liu, Z.; Lv, J.; Lian, S.; Hu, B.; Mai, L.; Zhou, L. Tailoring porous carbon spheres for supercapacitors. Nanoscale 2018, 10, 21604–21616. [Google Scholar] [CrossRef]
- Yang, Y.; Ma, W.; Zhu, H.; Meng, H.; Wang, C.; Ma, F.; Hu, Z. Graphene covalently functionalized with 2,6-diaminoanthraquinone (DQ) as a high performance electrode material for supercapacitors. New J. Chem. 2020, 44, 16821–16830. [Google Scholar] [CrossRef]
- Zuo, S.; Gao, J.; Wu, F.; Yang, B.; Sun, Y.; Xie, M.; Mi, X.; Wang, W.; Liu, Y.; Yan, J. Dictyophora-derived N-doped porous carbon microspheres for high-performance supercapacitors. New J. Chem. 2020, 44, 15415–15425. [Google Scholar] [CrossRef]
- Jahirul, M.; Rasul, M.; Chowdhury, A.; Ashwath, N. Biofuels production through biomass pyrolysis—A technological review. Energies 2012, 5, 4952–5001. [Google Scholar] [CrossRef]
- Zhang, J.; Liu, J.; Liu, R. Effects of pyrolysis temperature and heating time on biochar obtained from the pyrolysis of straw and lignosulfonate. Bioresour. Technol. 2015, 176, 288–291. [Google Scholar] [CrossRef]
- Brewer, C.; Schmidt-Rohr, K.; Satrio, J.; Brown, R. Characterization of biochar from fast pyrolysis and gasification systems. Environ. Prog. Sustain. Energy 2009, 28, 386–396. [Google Scholar] [CrossRef]
- Mohan, D.; Sarswat, A.; Ok, Y.S.; Pittman, C.U. Organic and inorganic contaminants removal from water with biochar, a renewable, low cost and sustainable adsorbent—A critical review. Bioresour. Technol. 2014, 160, 191–202. [Google Scholar] [CrossRef] [PubMed]
- Deng, J.; Li, M.; Wang, Y. Biomass-derived carbon: Synthesis and applications in energy storage and conversion. Green Chem. 2016, 18, 4824–4854. [Google Scholar] [CrossRef]
- Chen, F.; Zhang, Y.; Zheng, M.; Xiao, Y.; Hu, H.; Liang, Y.; Liu, Y.; Dong, H. Preparation of high-performance porous carbon materials by citric acid-assisted hydrothermal carbonization of bamboo and their application in electrode materials. Energy Fuels 2022, 36, 9303–9312. [Google Scholar] [CrossRef]
- Wang, T.; Zhai, Y.; Zhu, Y.; Li, C.; Zeng, G. A review of the hydrothermal carbonization of biomass waste for hydrochar formation: Process conditions, fundamentals, and physicochemical properties. Renew. Sustain. Energy Rev. 2014, 90, 223–247. [Google Scholar] [CrossRef]
- Jain, A.; Balasubramanian, R.; Srinivasan, M.P. Hydrothermal conversion of biomass waste to activated carbon with high porosity: A review. Chem. Eng. J. 2016, 283, 789–805. [Google Scholar] [CrossRef]
- Susanti, R.F.; Arie, A.A.; Kristianto, H.; Erico, M.; Kevin, G.; Devianto, H. Activated carbon from citric acid catalyzed hydrothermal carbonization and chemical activation of salacca peel as potential electrode for lithium ion capacitor’s cathode. Ionics 2019, 25, 3915–3925. [Google Scholar] [CrossRef]
- Deng, Y.; Xie, Y.; Zou, K.; Ji, X. Review on recent advances in nitrogen-doped carbons: Preparations and applications in supercapacitors. J. Mater. Chem. A 2016, 4, 1144–1173. [Google Scholar] [CrossRef]
- Guo, S.; Gao, Y.; Wang, Y.; Liu, Z.; Wei, X.; Peng, P.; Xiao, B.; Yang, Y. Urea/ZnCl2 in situ hydrothermal carbonization of Camellia sinensis waste to prepare N-doped biochar for heavy metal removal. Environ. Sci. Pollut. Res. Int. 2019, 26, 30365–30373. [Google Scholar] [CrossRef] [PubMed]
- Huang, G.; Wang, Y.; Zhang, T.; Wu, X.; Cai, J. High-performance hierarchical N-doped porous carbons from hydrothermally carbonized bamboo shoot shells for symmetric supercapacitors. J. Taiwan Inst. Chem. E 2019, 96, 672–680. [Google Scholar] [CrossRef]
- Wu, Q.; Li, W.; Liu, S.; Jin, C. Hydrothermal synthesis of N-doped spherical carbon from carboxymethylcellulose for CO2 capture. Appl. Surf. Sci. 2016, 369, 101–107. [Google Scholar] [CrossRef]
- Zhao, Z.; Xiao, Z.; Xi, Y.; Wang, G.; Zhang, Y.; Li, J.; Wei, L. B,N-Codoped porous C with controllable N species as an electrode material for supercapacitors. Inorg. Chem. 2021, 60, 13252–13261. [Google Scholar] [CrossRef] [PubMed]
- Ling, Z.; Wang, G.; Zhang, M.; Fan, X.; Yu, C.; Yang, J.; Xiao, N.; Qiu, J. Boric acid-mediated B,N-codoped chitosan-derived porous carbons with a high surface area and greatly improved supercapacitor performance. Nanoscale 2015, 7, 5120–5125. [Google Scholar] [CrossRef] [PubMed]
- Shan, Y.Q.; Xu, Z.X.; Duan, P.G.; Fan, H.L.; Hu, X.; Luque, R. Nitrogen- and Sulfur-doped carbon obtained from direct hydrothermal carbonization of cellulose and ammonium sulfate for supercapacitor applications. ACS Sustain. Chem. Eng. 2020, 8, 15809–15814. [Google Scholar] [CrossRef]
- Djandja, O.S.; Yin, L.X.; Wang, Z.C.; Duan, P.G.; Xu, D.H.; Kapusta, K. Synthesis of N-doped carbon material via hydrothermal carbonization: Effects of reaction solvent and nitrogen source. J. Energy Storage 2023, 60, 106588. [Google Scholar] [CrossRef]
- Shah, S.S.; Aziz, M.A.; Cevik, E.; Ali, M.; Gunday, S.T.; Bozkurt, A.; Yamani, Z.H. Sulfur nano-confinement in hierarchically porous jute derived activated carbon towards high-performance supercapacitor: Experimental and theoretical insights. J. Energy Storage 2022, 56, 105944. [Google Scholar] [CrossRef]
- Fakkaew, K.; Koottatep, T.; Polprasert, C. Polprasert. Effects of hydrolysis and carbonization reactions on hydrochar production. Bioresour. Technol. 2015, 192, 328–334. [Google Scholar] [CrossRef]
- Guo, Y.; Liu, C.; Yin, L.X.; Zhang, X.X.; Shan, Y.Q.; Duan, P.G. Preparation of supercapacitor carbon materials from food waste via low-temperature pyrolysis. J. Anal. Appl. Pyrolysis 2023, 170, 105880. [Google Scholar] [CrossRef]
- Xu, Z.X.; Deng, X.Q.; Zhang, S.; Shen, Y.F.; Shan, Y.Q.; Zhang, Z.M.; Luque, R.; Duan, P.G.; Hu, X. Benign-by-design N-doped carbonaceous materials obtained from the hydrothermal carbonization of sewage sludge for supercapacitor applications. Green Chem. 2020, 22, 3885–3895. [Google Scholar] [CrossRef]
- Li, G.; Gao, X.; Wang, K.; Cheng, Z. Porous carbon nanospheres with high EDLC capacitance. Diam. Relat. Mater. 2018, 88, 12–17. [Google Scholar] [CrossRef]


| Samples Name | C | H | N | S | O | H/C | O/C |
|---|---|---|---|---|---|---|---|
| CL | 66.61 | 4.44 | 0 | 0 | 28.55 | 0.07 | 0.43 |
| HC-CL | 70.14 | 4.35 | 0 | 0 | 24.07 | 0.06 | 0.34 |
| HC-CL-AS | 69.98 | 5.12 | 3.63 | 0.35 | 19.36 | 0.07 | 0.28 |
| HC-CL-TU | 67.34 | 6.20 | 4.67 | 2.92 | 17.94 | 0.09 | 0.27 |
| HC-CL-AS-BA | 63.21 | 4.66 | 4.92 | 4.54 | 20.81 | 0.07 | 0.33 |
| HC-CL-TU-BA | 69.54 | 4.81 | 4.31 | 0.37 | 20.14 | 0.07 | 0.29 |
| AHC-CL | 76.11 | 1.27 | 0 | 0 | 21.91 | 0.02 | 0.29 |
| AHC-CL-AS | 79.59 | 1.88 | 3.84 | 0.32 | 12.69 | 0.02 | 0.16 |
| AHC-CL-TU | 78.32 | 1.94 | 3.25 | 2.23 | 12.46 | 0.02 | 0.16 |
| AHC-CL-AS-BA | 78.26 | 1.74 | 4.02 | 3.97 | 11.27 | 0.02 | 0.14 |
| AHC-CL-TU-BA | 79.34 | 1.79 | 3.97 | 0.32 | 12.73 | 0.02 | 0.16 |
| Sample Names | C1s | N1s | S2p | O1s | B1s |
|---|---|---|---|---|---|
| AHC-CL-AS | 72.60 | 2.54 | 0.72 | 24.14 | |
| AHC-CL-TU | 68.91 | 3.2 | 3.73 | 24.16 | |
| AHC-CL-AS-BA | 68.98 | 3.33 | 4.10 | 23.19 | 0.39 |
| AHC-CL-TU-BA | 70.49 | 4.33 | 0.93 | 23.44 | 0.80 |
| Raw Materials and Preparation Methods | Advantage | Electrochemical Properties |
|---|---|---|
| Carbonization of freeze-drying chitosan-boric acid aerogel beads [44] | High performance; multiple atomic doping | The specific capacitance was 217 F/g at a current density of 1 A/g. The capacitance retention rate was 95.1% after 10,000 cycles of charge and discharge at a current density of 5 A/g. Energy density was 7.2 Wh/kg at a power density of 4.984 kW/kg. |
| Co-HTC of cellulose and ammonium sulfate [46] | High specific surface area; multiple atomic doping | The specific capacitance at 1 A/g current density was 227.3 F/g, the capacitance retention rate at 20 A/g current density was 76.55%. |
| Co-HTC of cellulose and pyridine [47] | High capacitance retention; two-stage HTC | The specific capacitance is 214.1 F/g at a current density of 1 A/g. After 10,000 charge–discharge cycles at a current density of 5 A/g, the capacitance retention rate is 97.82%. |
| Co-HTC of cellulose and thiourea (This study) | High specific capacitance; high cycle retention rate; simple process | The specific capacitance reached 235.8 F/g at a current density of 1 A/g. After 20,000 charge and discharge cycles at a high current density of 10 A/g, the capacitance retention rate was 99.96%. Energy density was 29.24 Wh/kg at a power density of 0.5 kW/kg. |
Disclaimer/Publisher’s Note: The statements, opinions and data contained in all publications are solely those of the individual author(s) and contributor(s) and not of MDPI and/or the editor(s). MDPI and/or the editor(s) disclaim responsibility for any injury to people or property resulting from any ideas, methods, instructions or products referred to in the content. |
© 2023 by the authors. Licensee MDPI, Basel, Switzerland. This article is an open access article distributed under the terms and conditions of the Creative Commons Attribution (CC BY) license (https://creativecommons.org/licenses/by/4.0/).
Share and Cite
Liu, C.; Wang, K.; Du, Y.; Shan, Y.; Duan, P.; Ramzan, N. Hydrothermal Carbonization of Cellulose with Ammonium Sulfate and Thiourea for the Production of Supercapacitor Carbon. Polymers 2023, 15, 4478. https://doi.org/10.3390/polym15234478
Liu C, Wang K, Du Y, Shan Y, Duan P, Ramzan N. Hydrothermal Carbonization of Cellulose with Ammonium Sulfate and Thiourea for the Production of Supercapacitor Carbon. Polymers. 2023; 15(23):4478. https://doi.org/10.3390/polym15234478
Chicago/Turabian StyleLiu, Chang, Kun Wang, Yuhan Du, Yaqi Shan, Peigao Duan, and Naveed Ramzan. 2023. "Hydrothermal Carbonization of Cellulose with Ammonium Sulfate and Thiourea for the Production of Supercapacitor Carbon" Polymers 15, no. 23: 4478. https://doi.org/10.3390/polym15234478