
Adsorption and Recognition Property of Tyrosine Molecularly Imprinted Polymer Prepared via Electron Beam Irradiation

Abstract
:1. Introduction
2. Materials and Methods
2.1. Materials
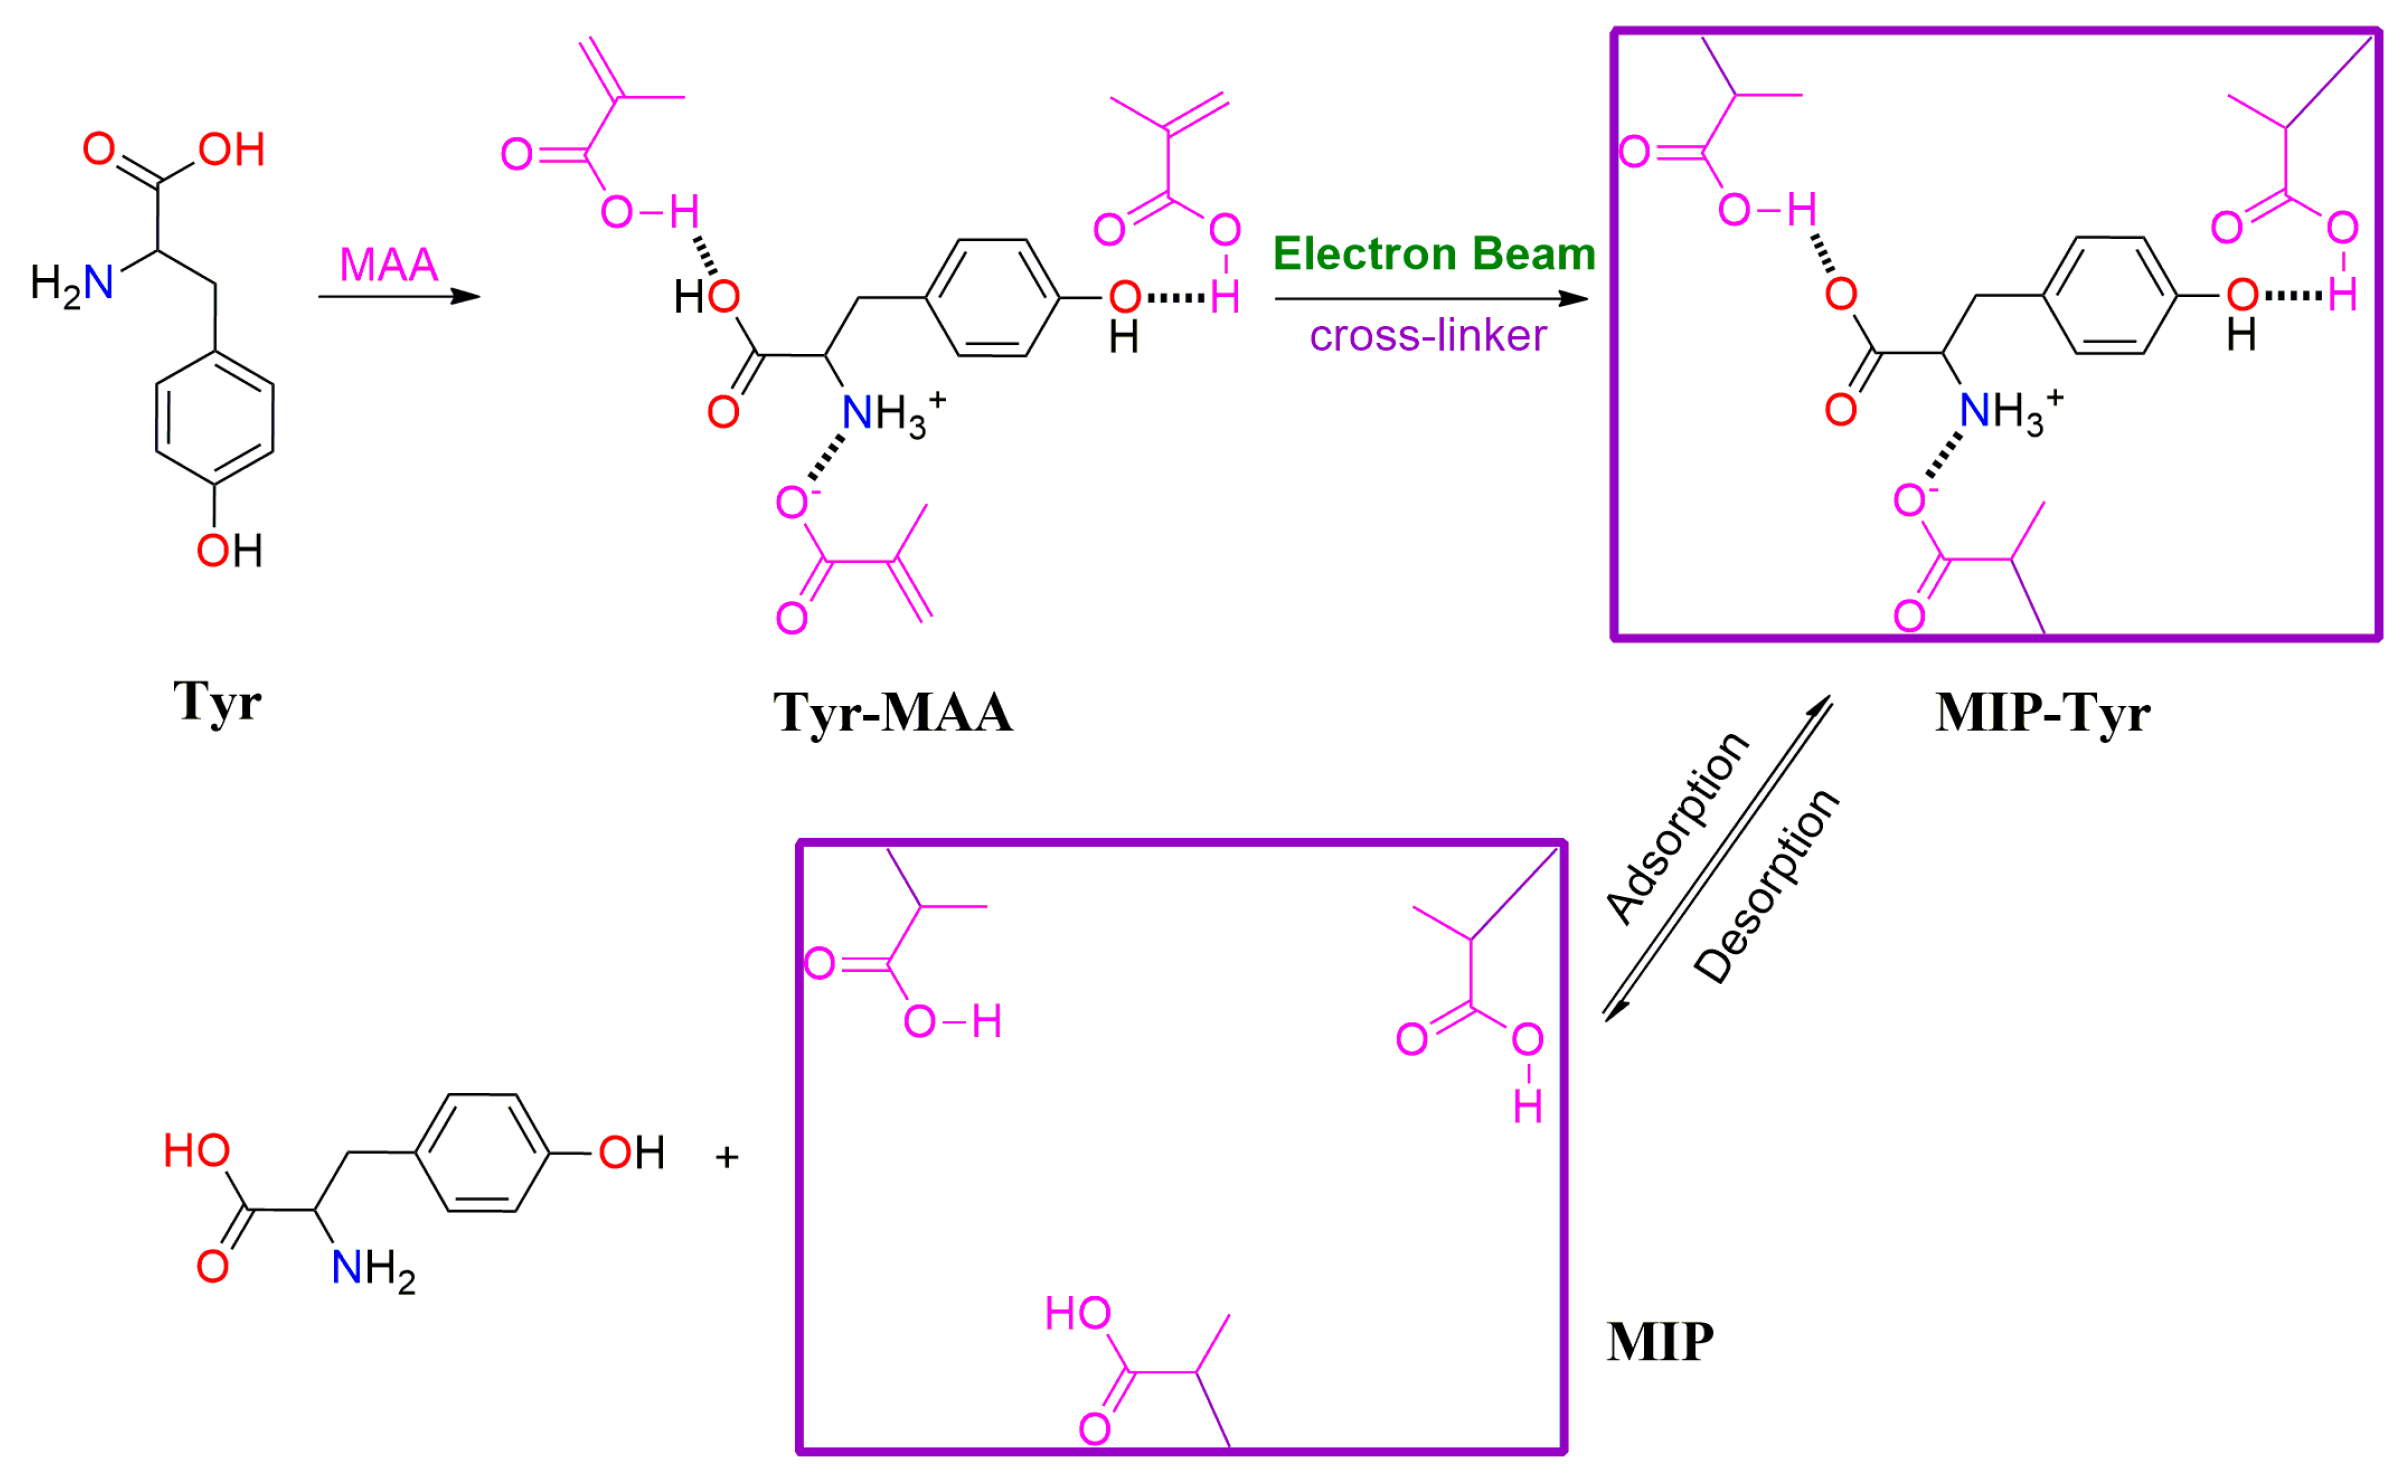
2.2. Fabrication of L-Tyr MIPs
2.3. Characterization
2.4. Adsorption and Recognition Experiment
2.4.1. Effect of Irradiation and Temperature
2.4.2. Adsorption Kinetics
2.4.3. Specific Adsorption
3. Results
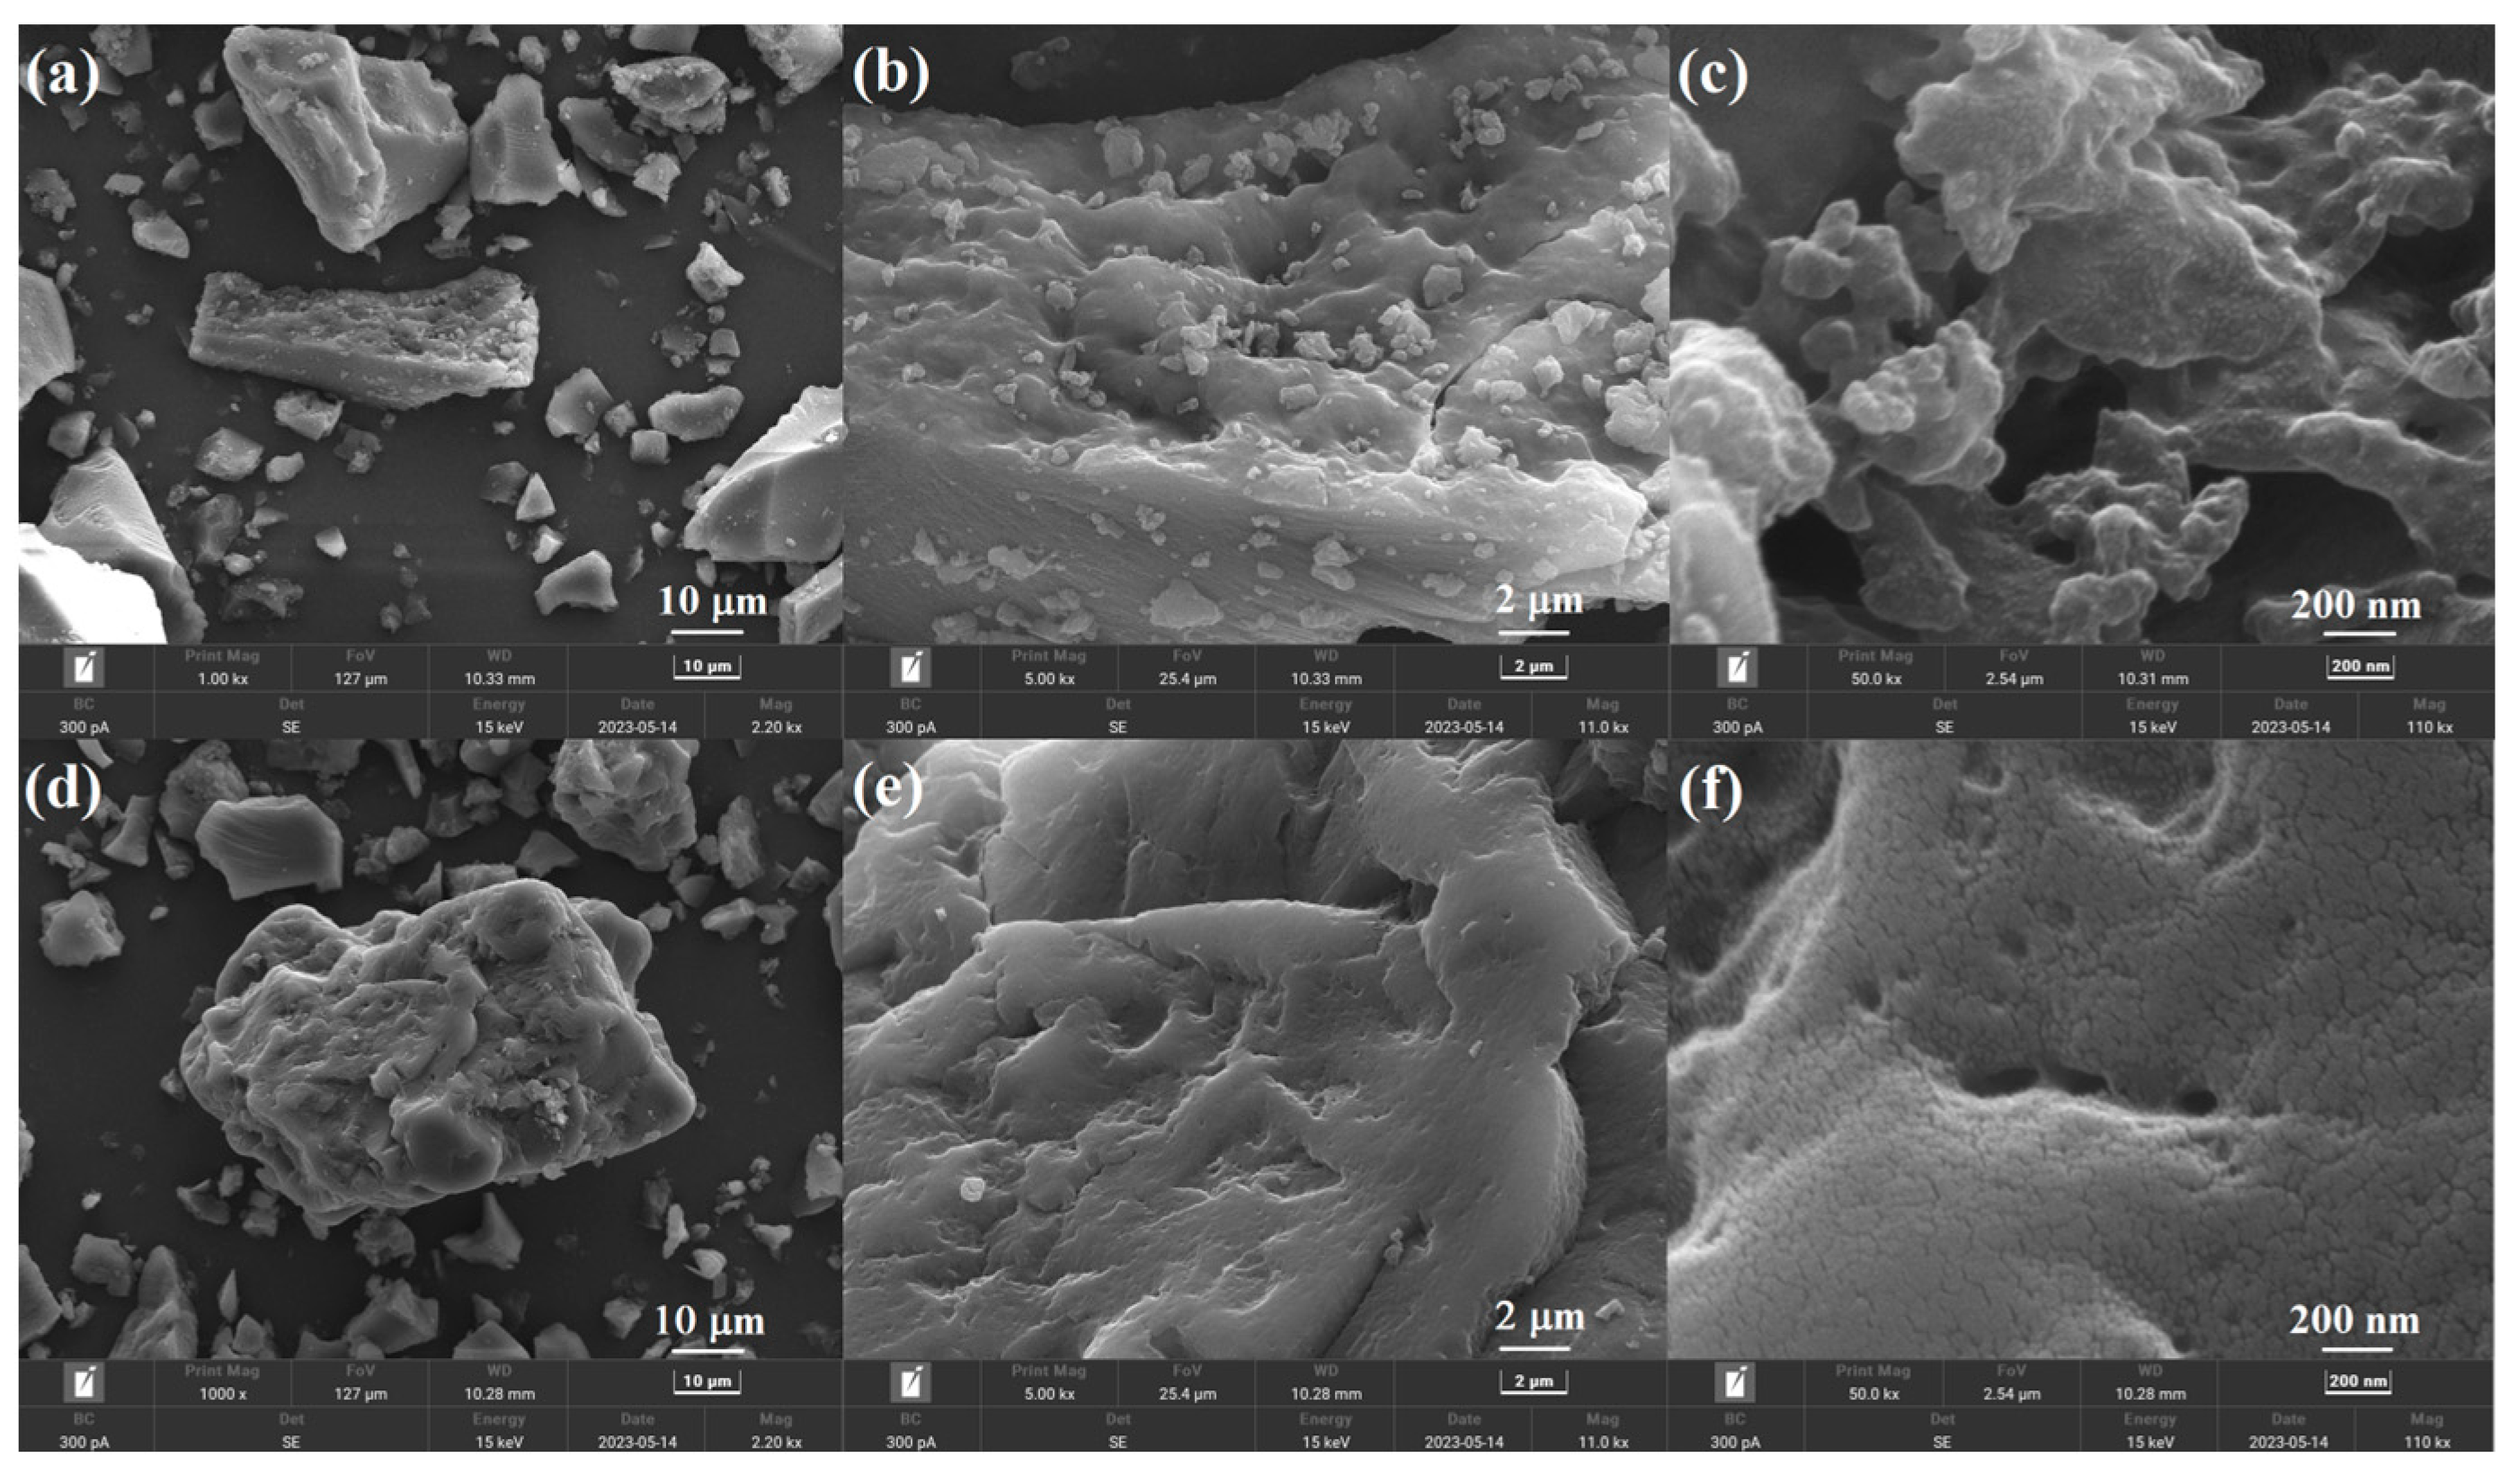
3.1. Morphology Analysis
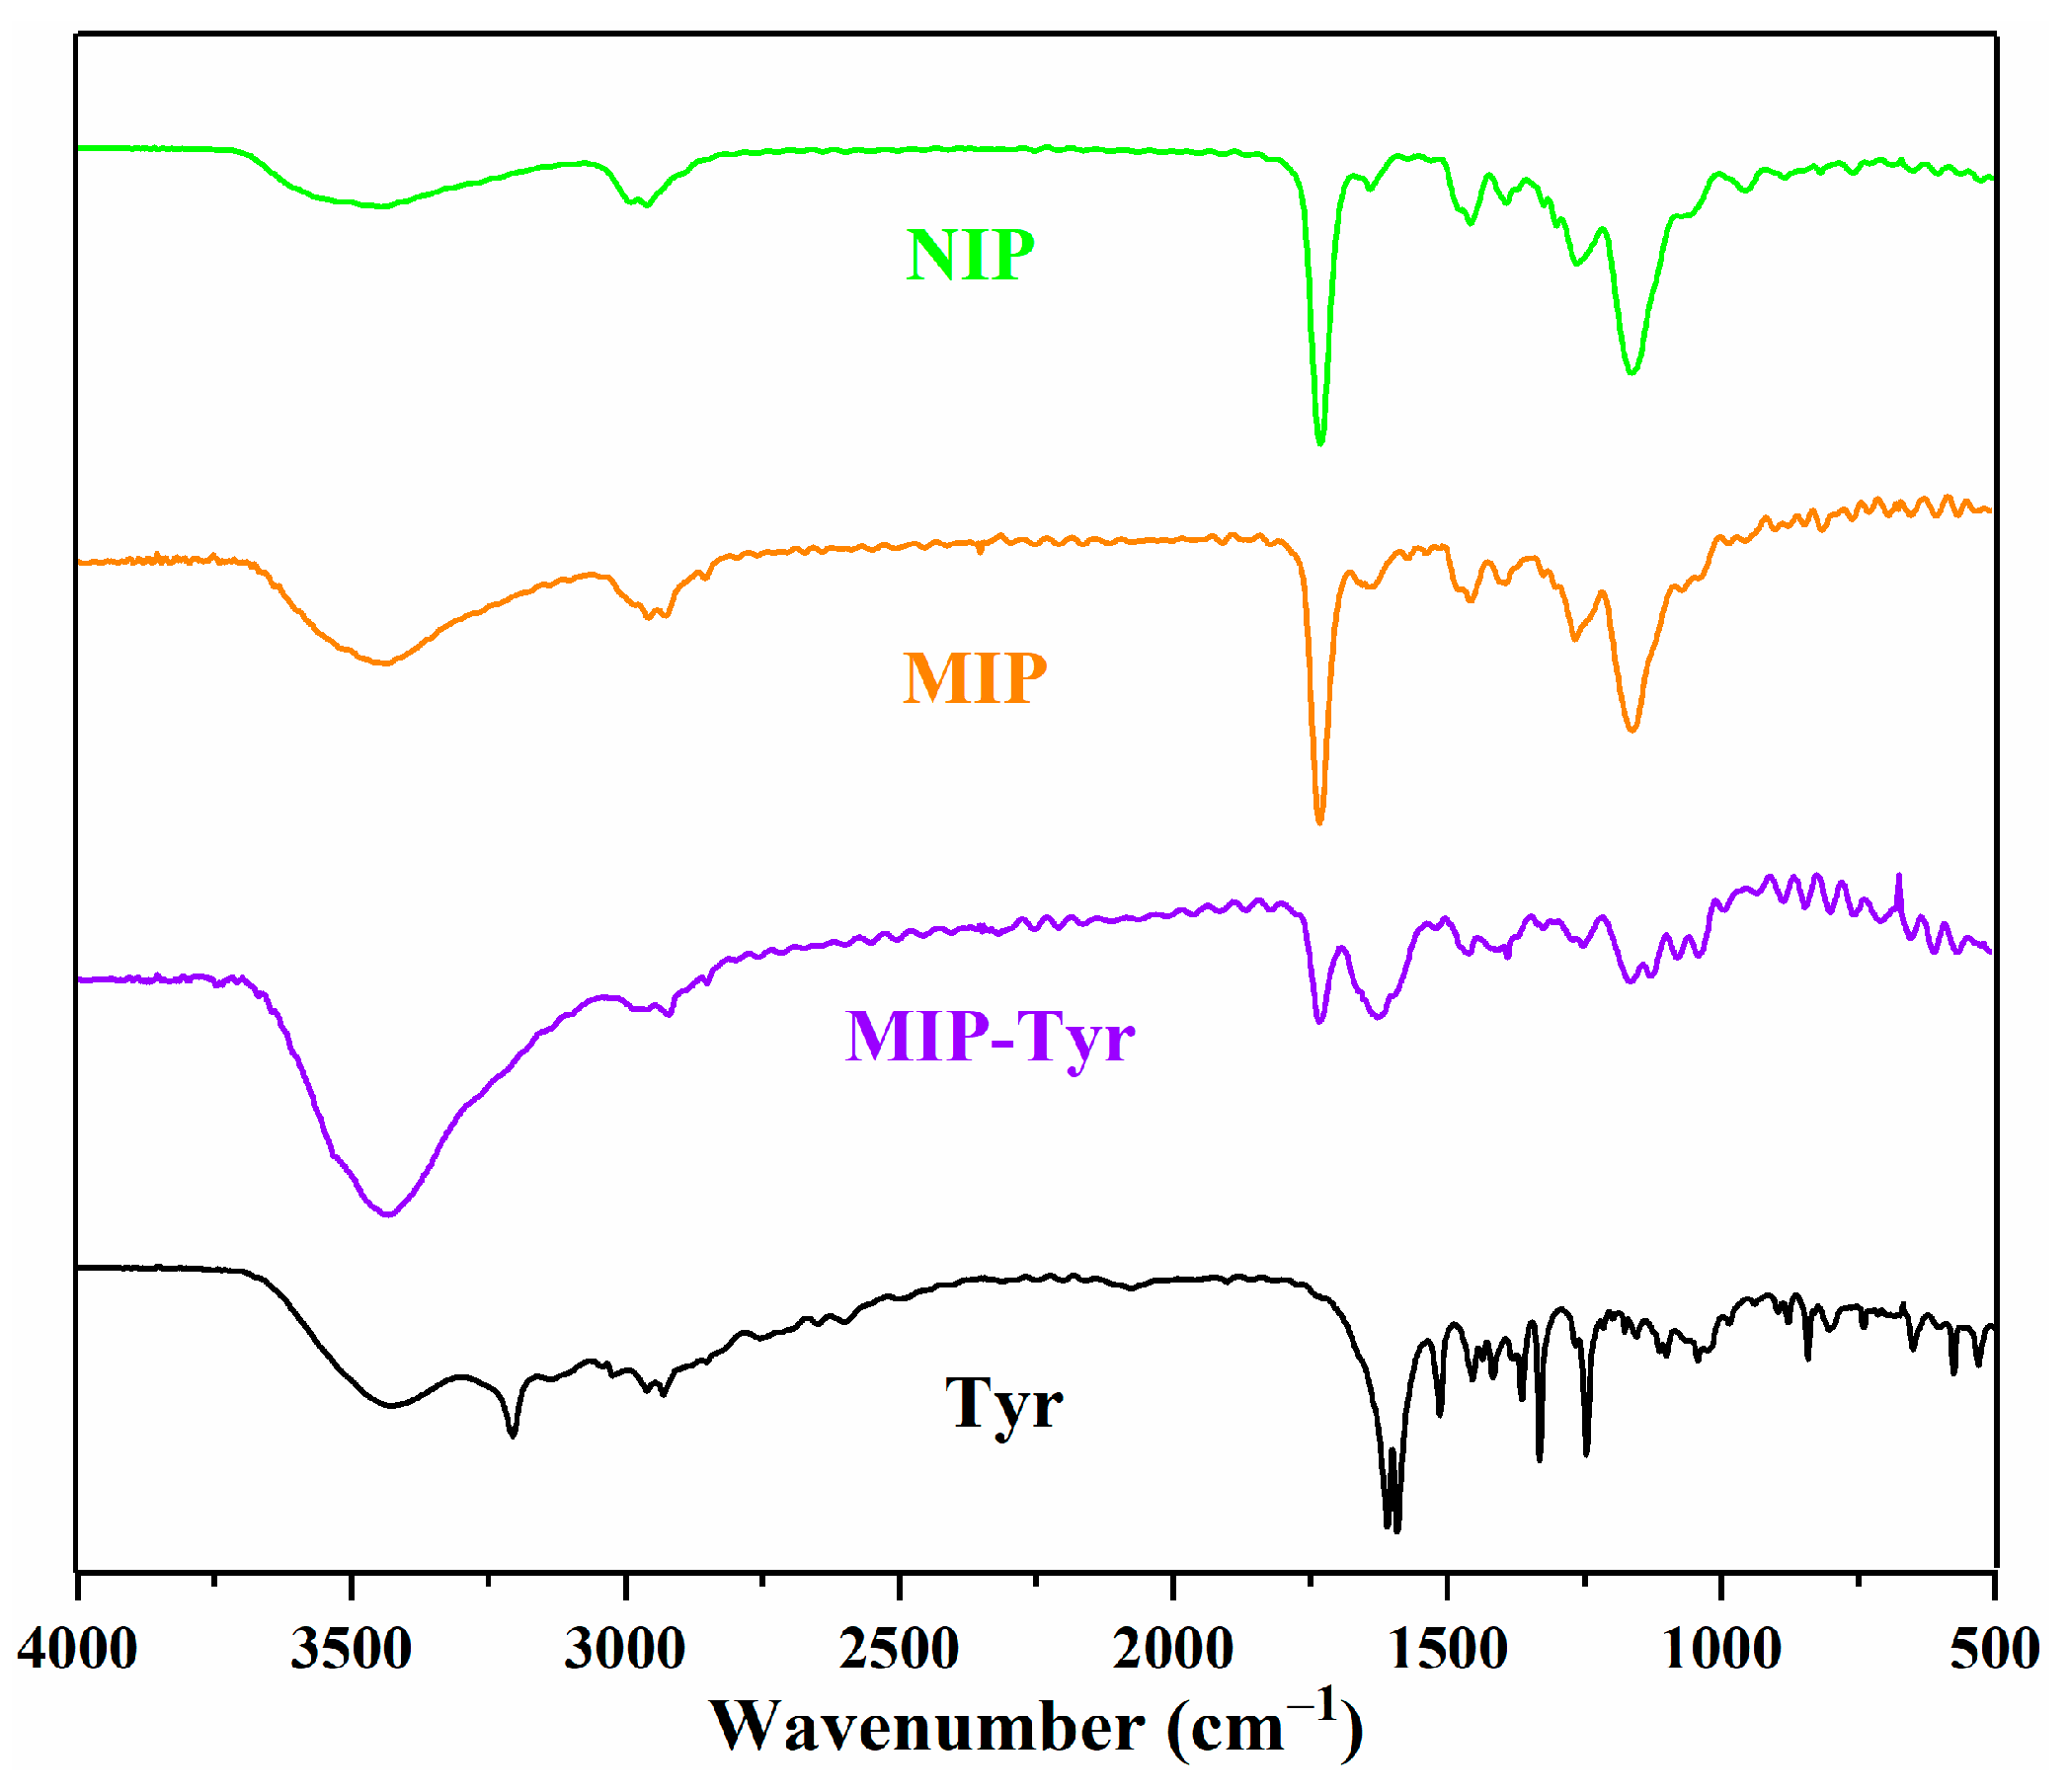
3.2. FTIR Analysis
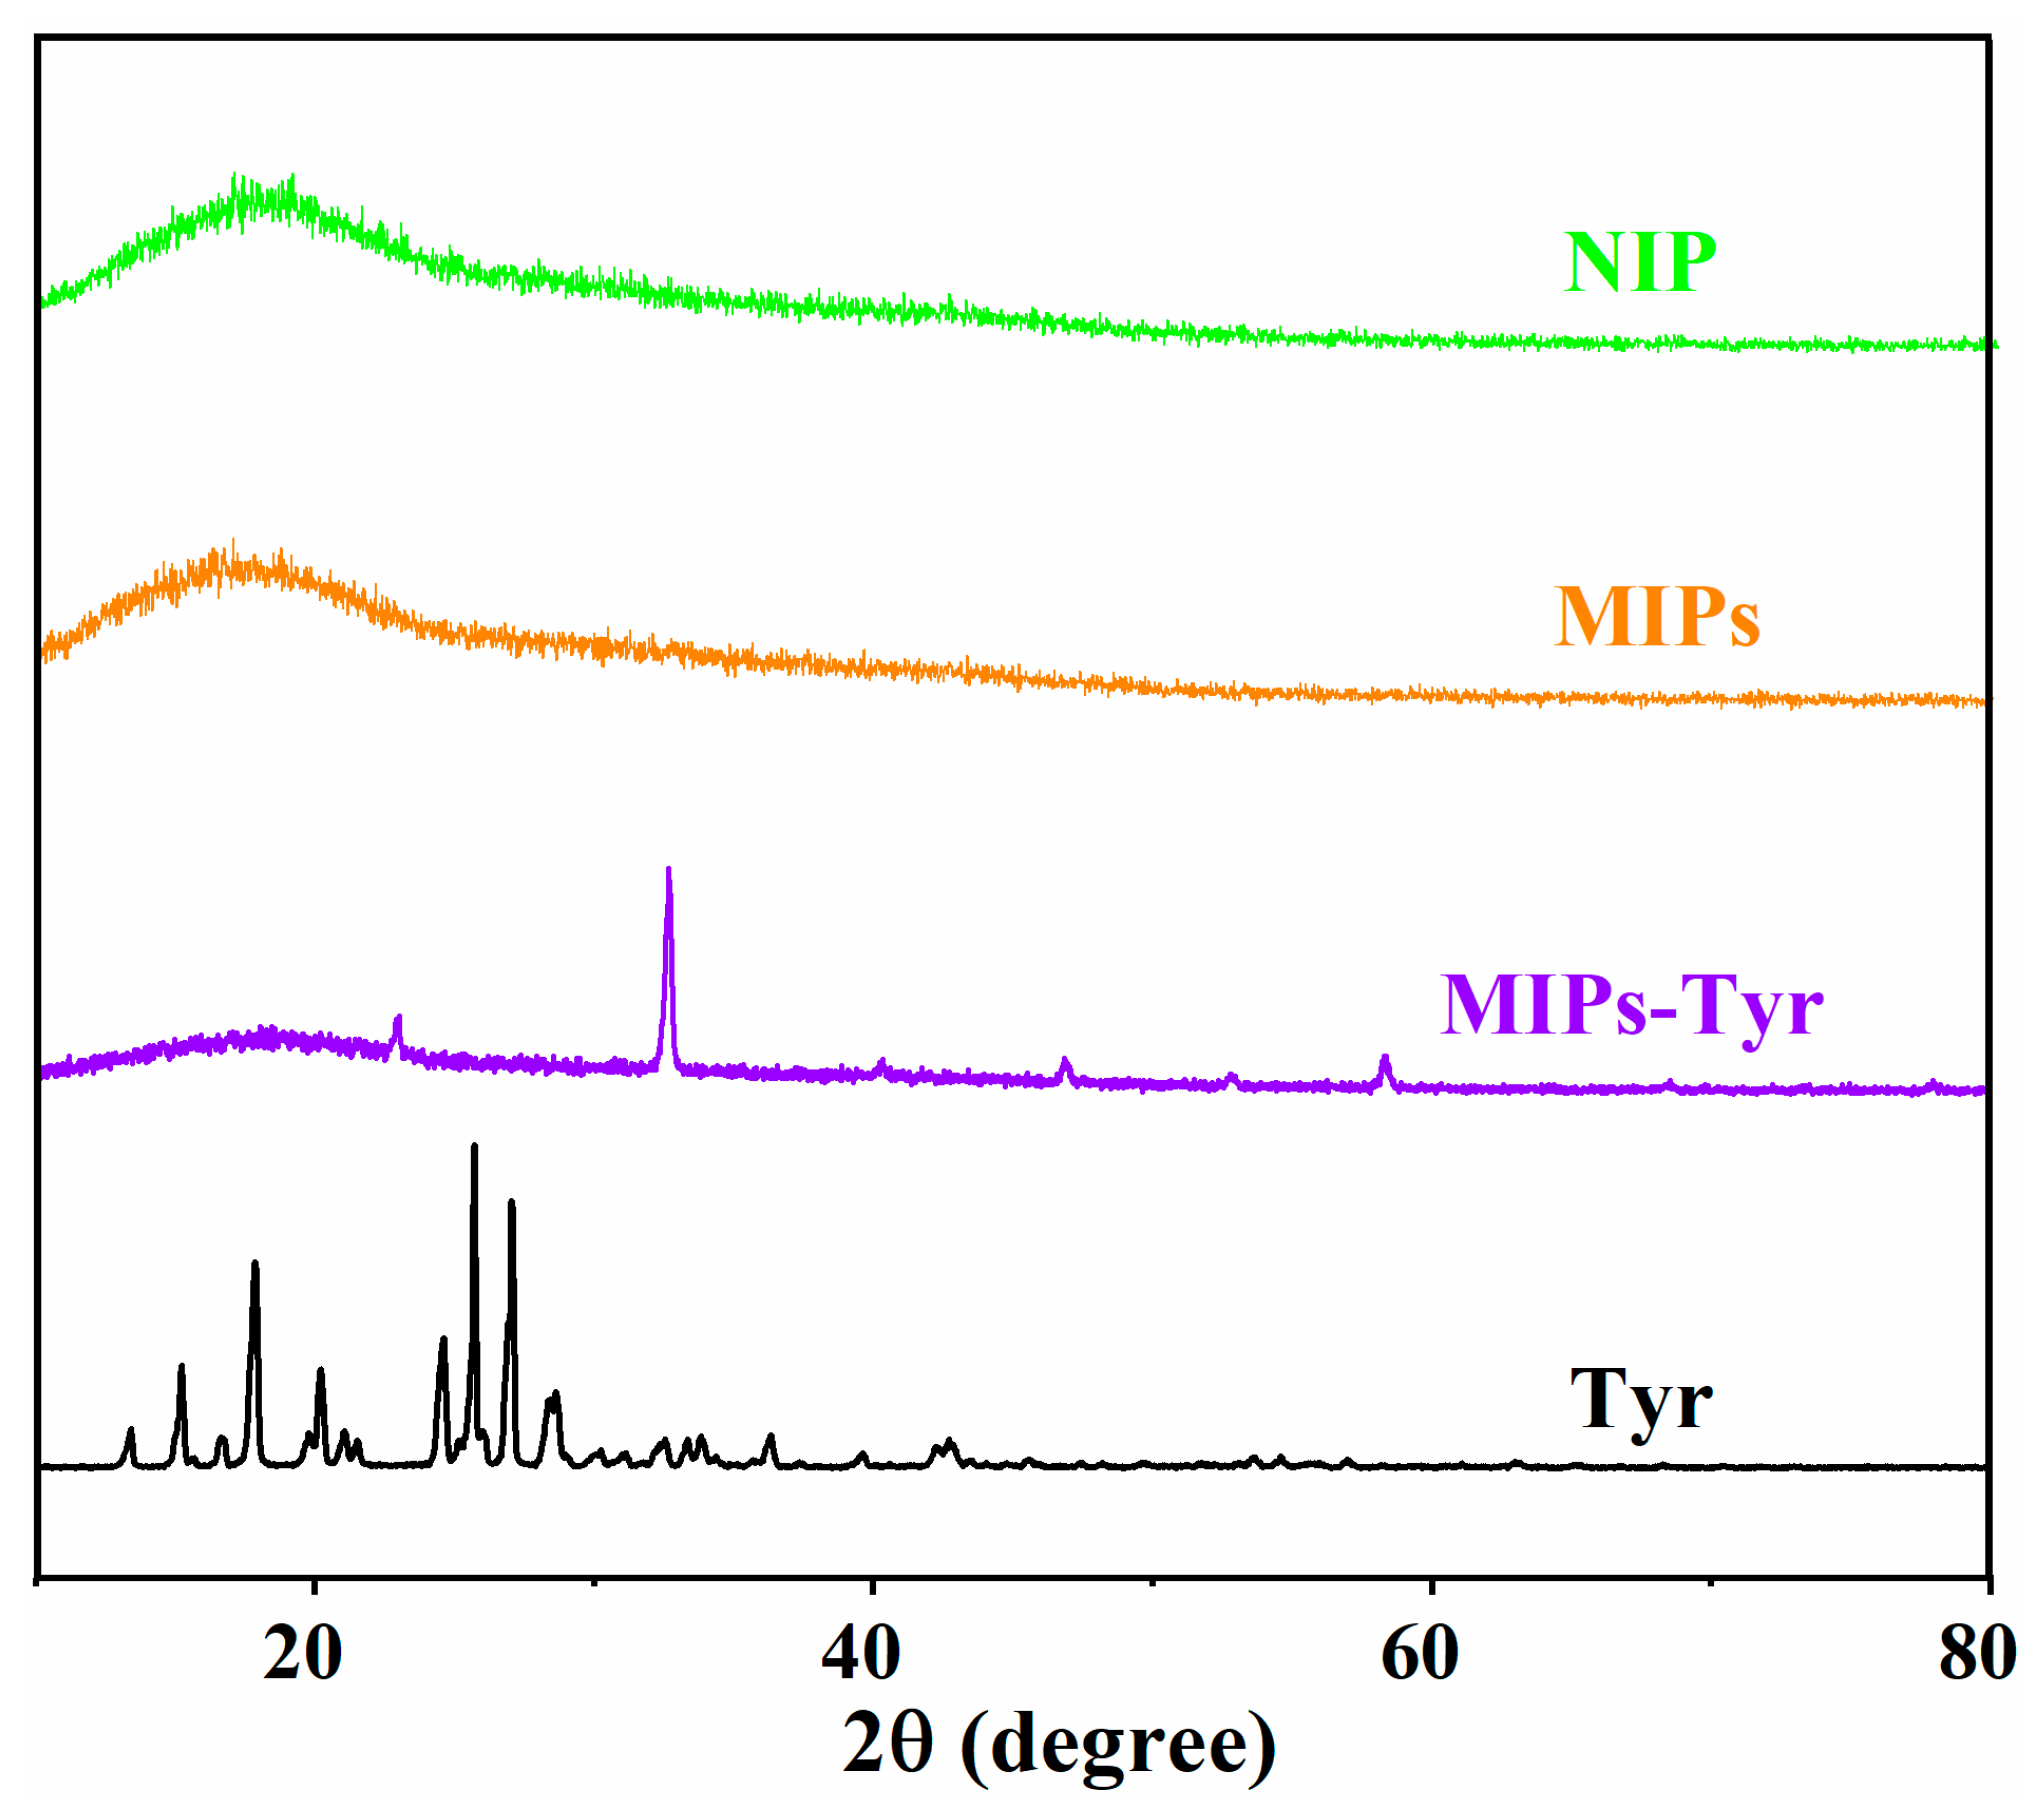
3.3. XRD Analysis
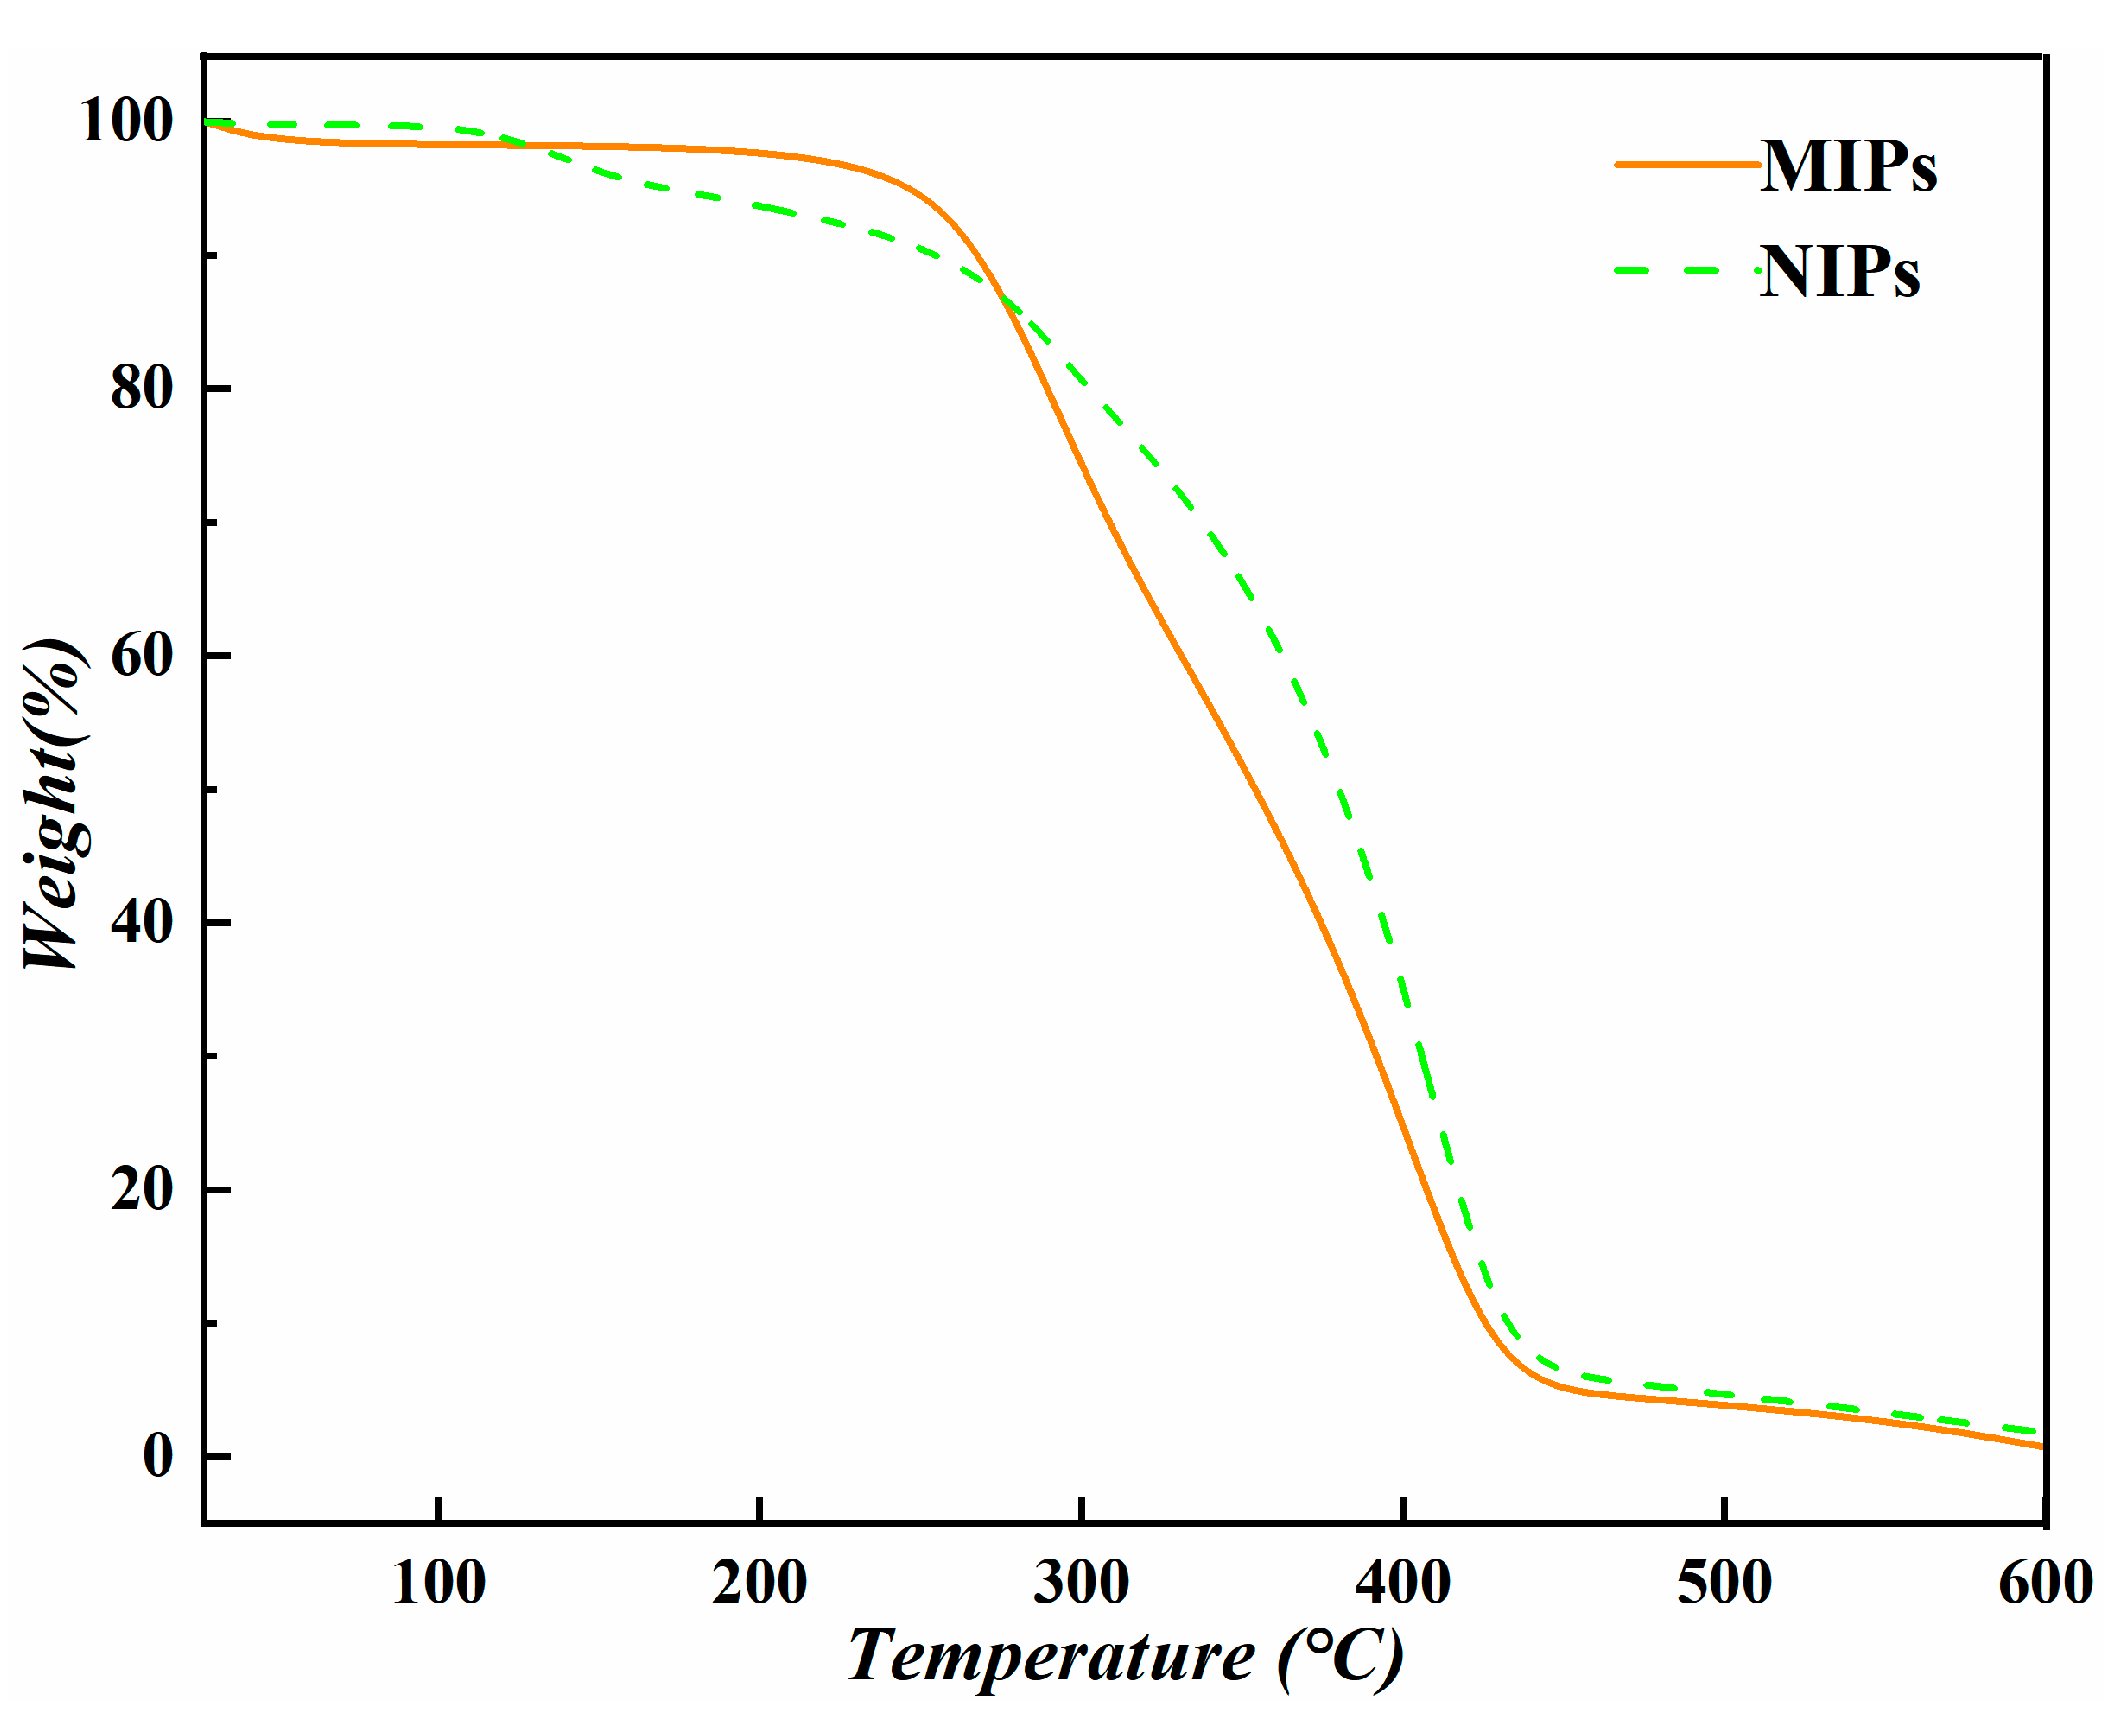
3.4. TG Analysis
3.5. Adsorption and Recognition Analysis
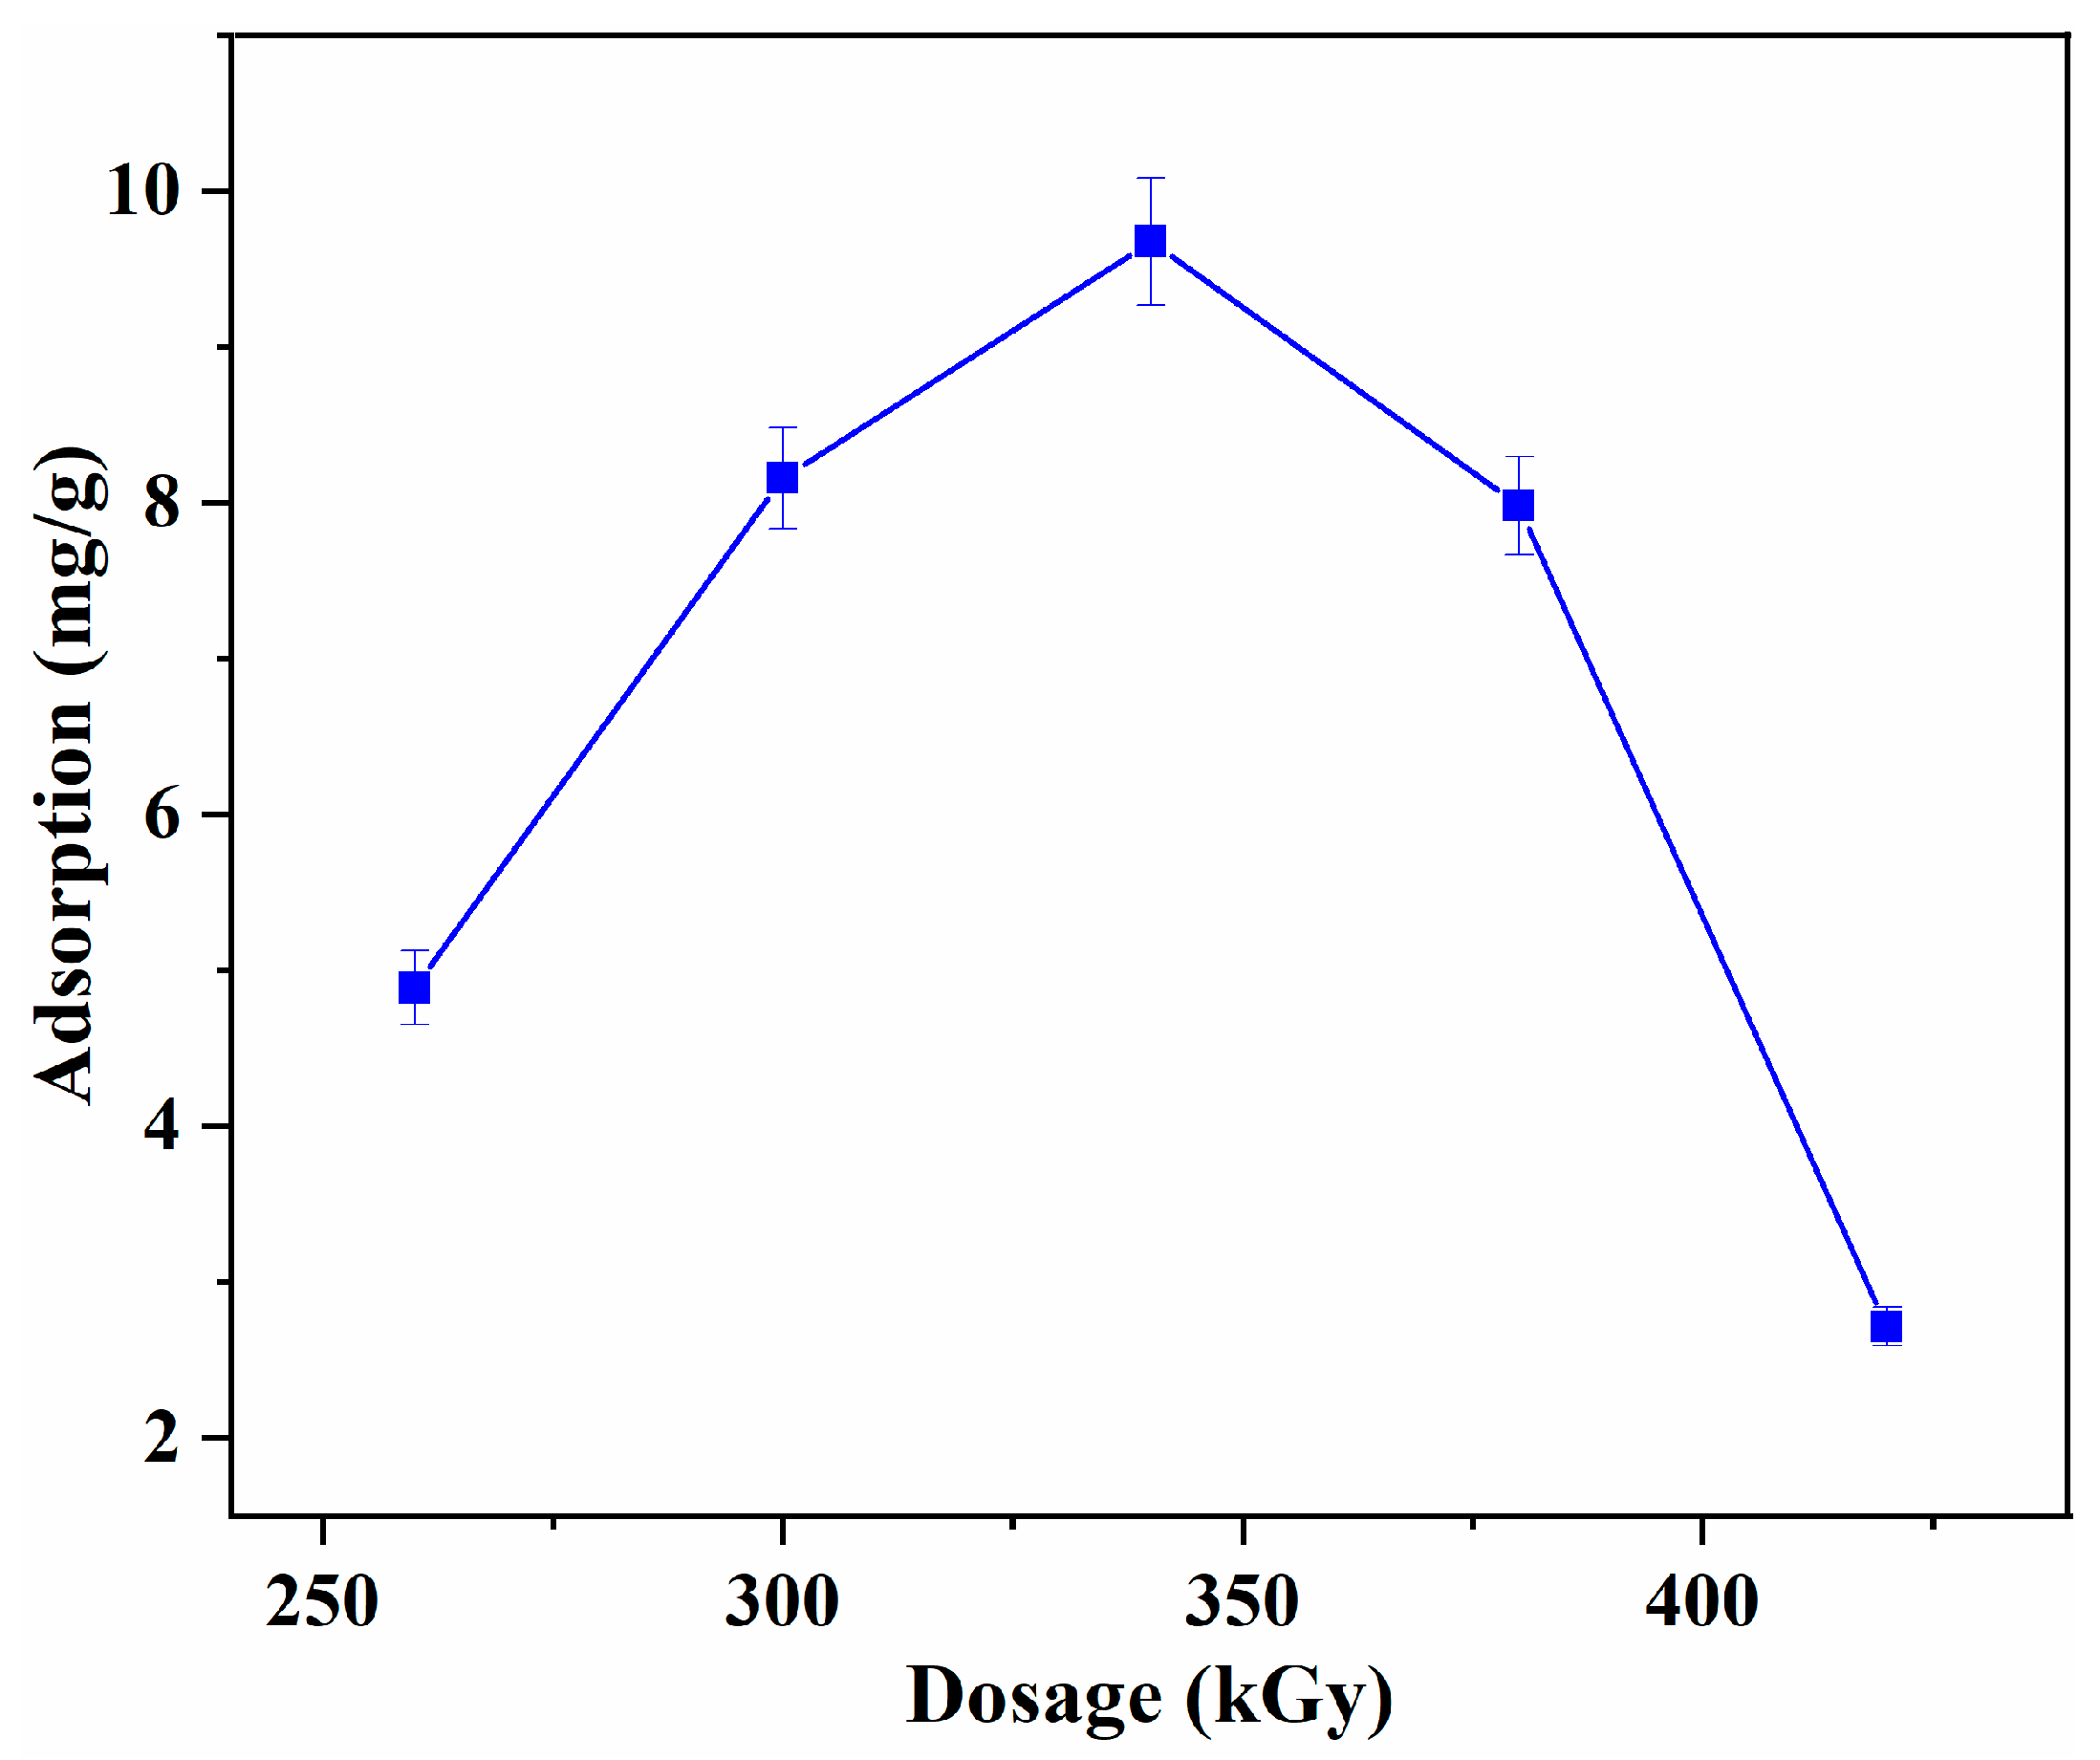
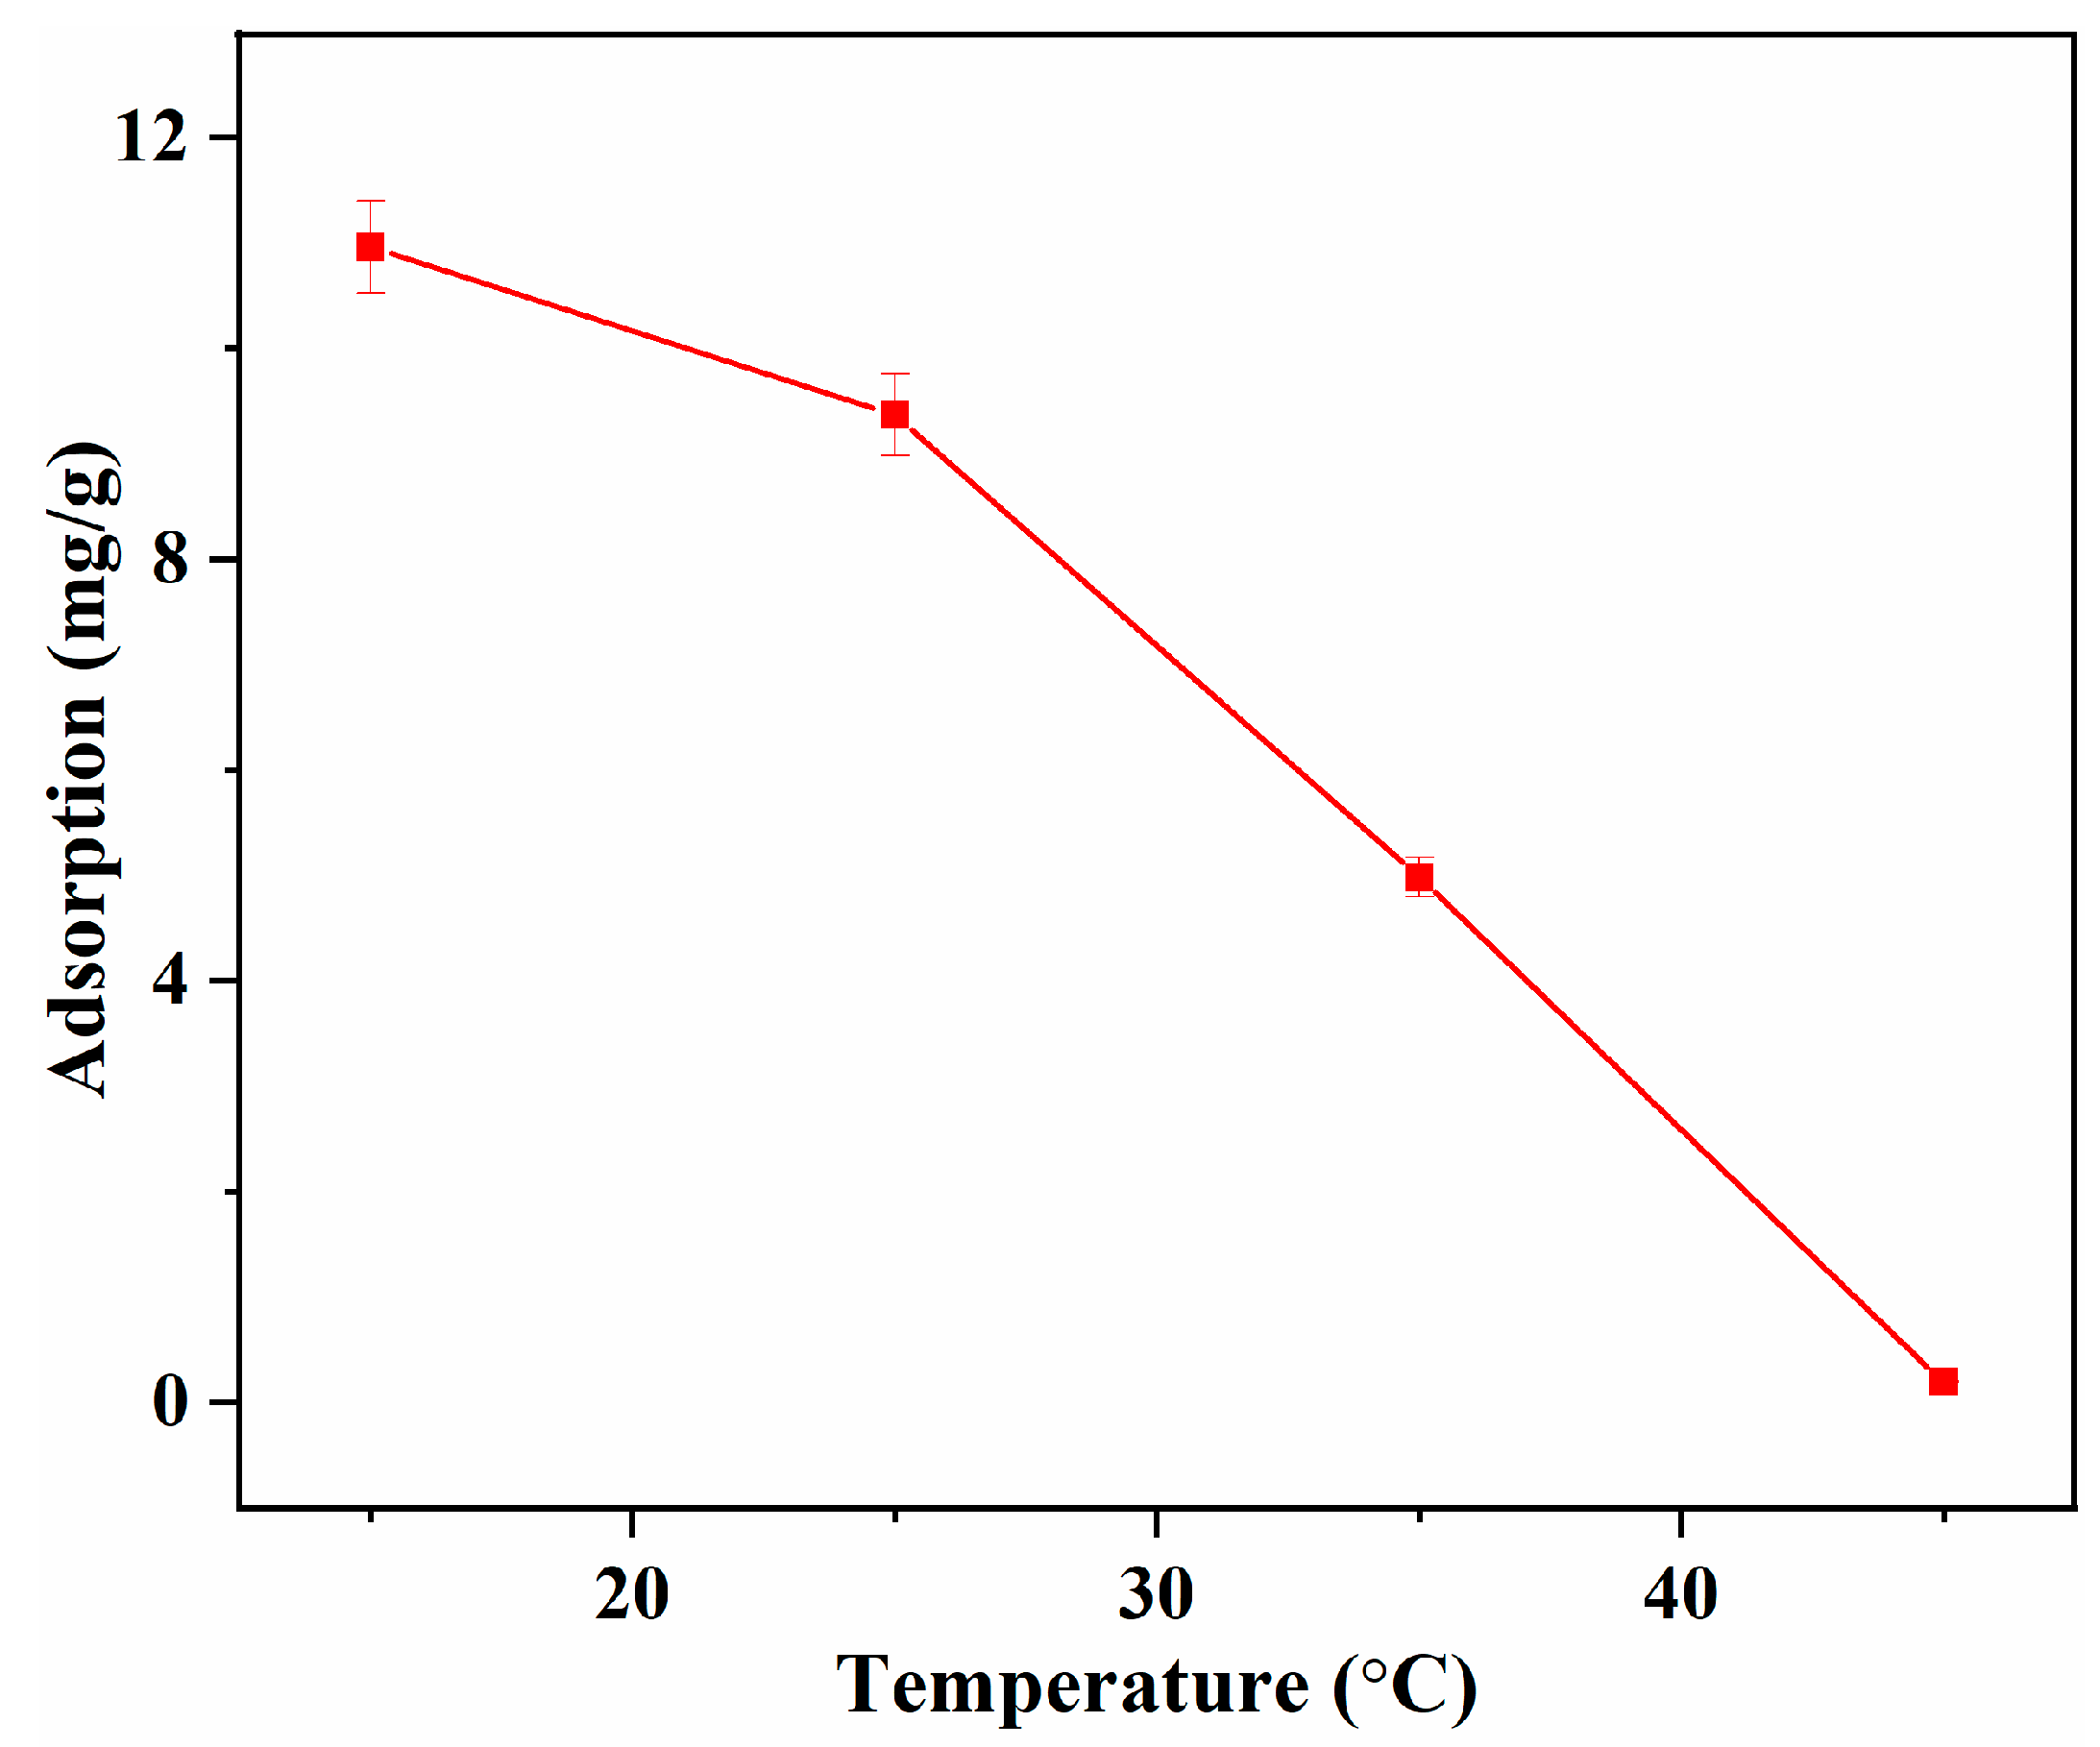
3.5.1. Effect of Irradiation and Temperature
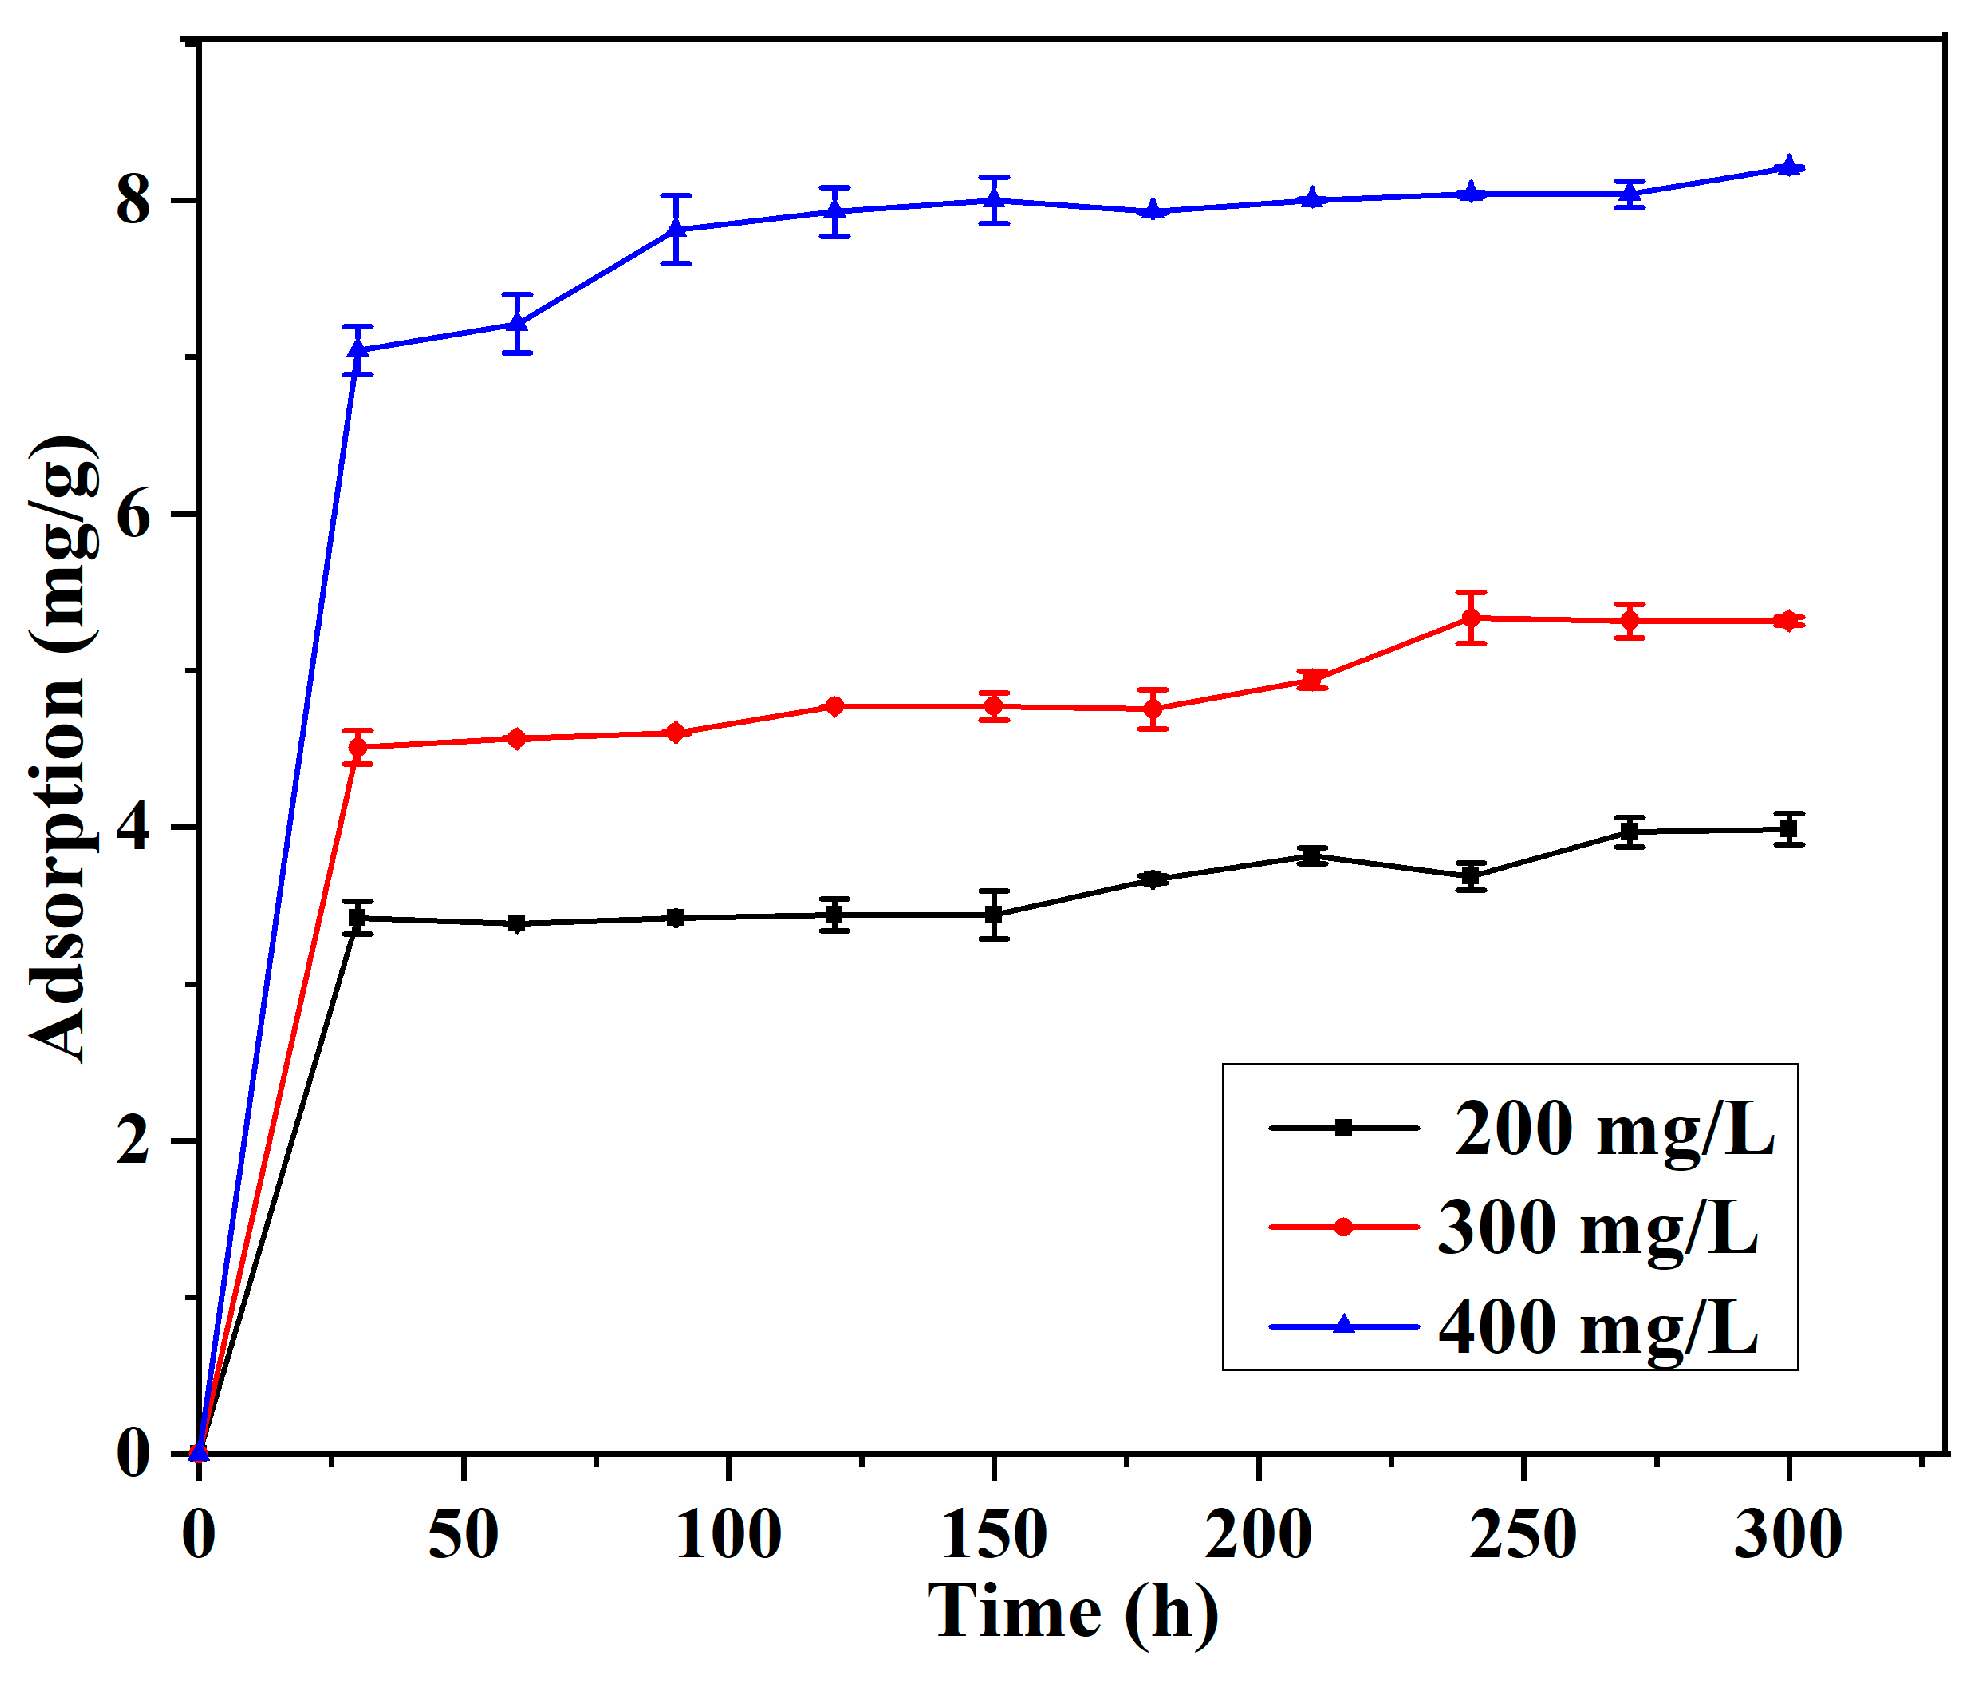
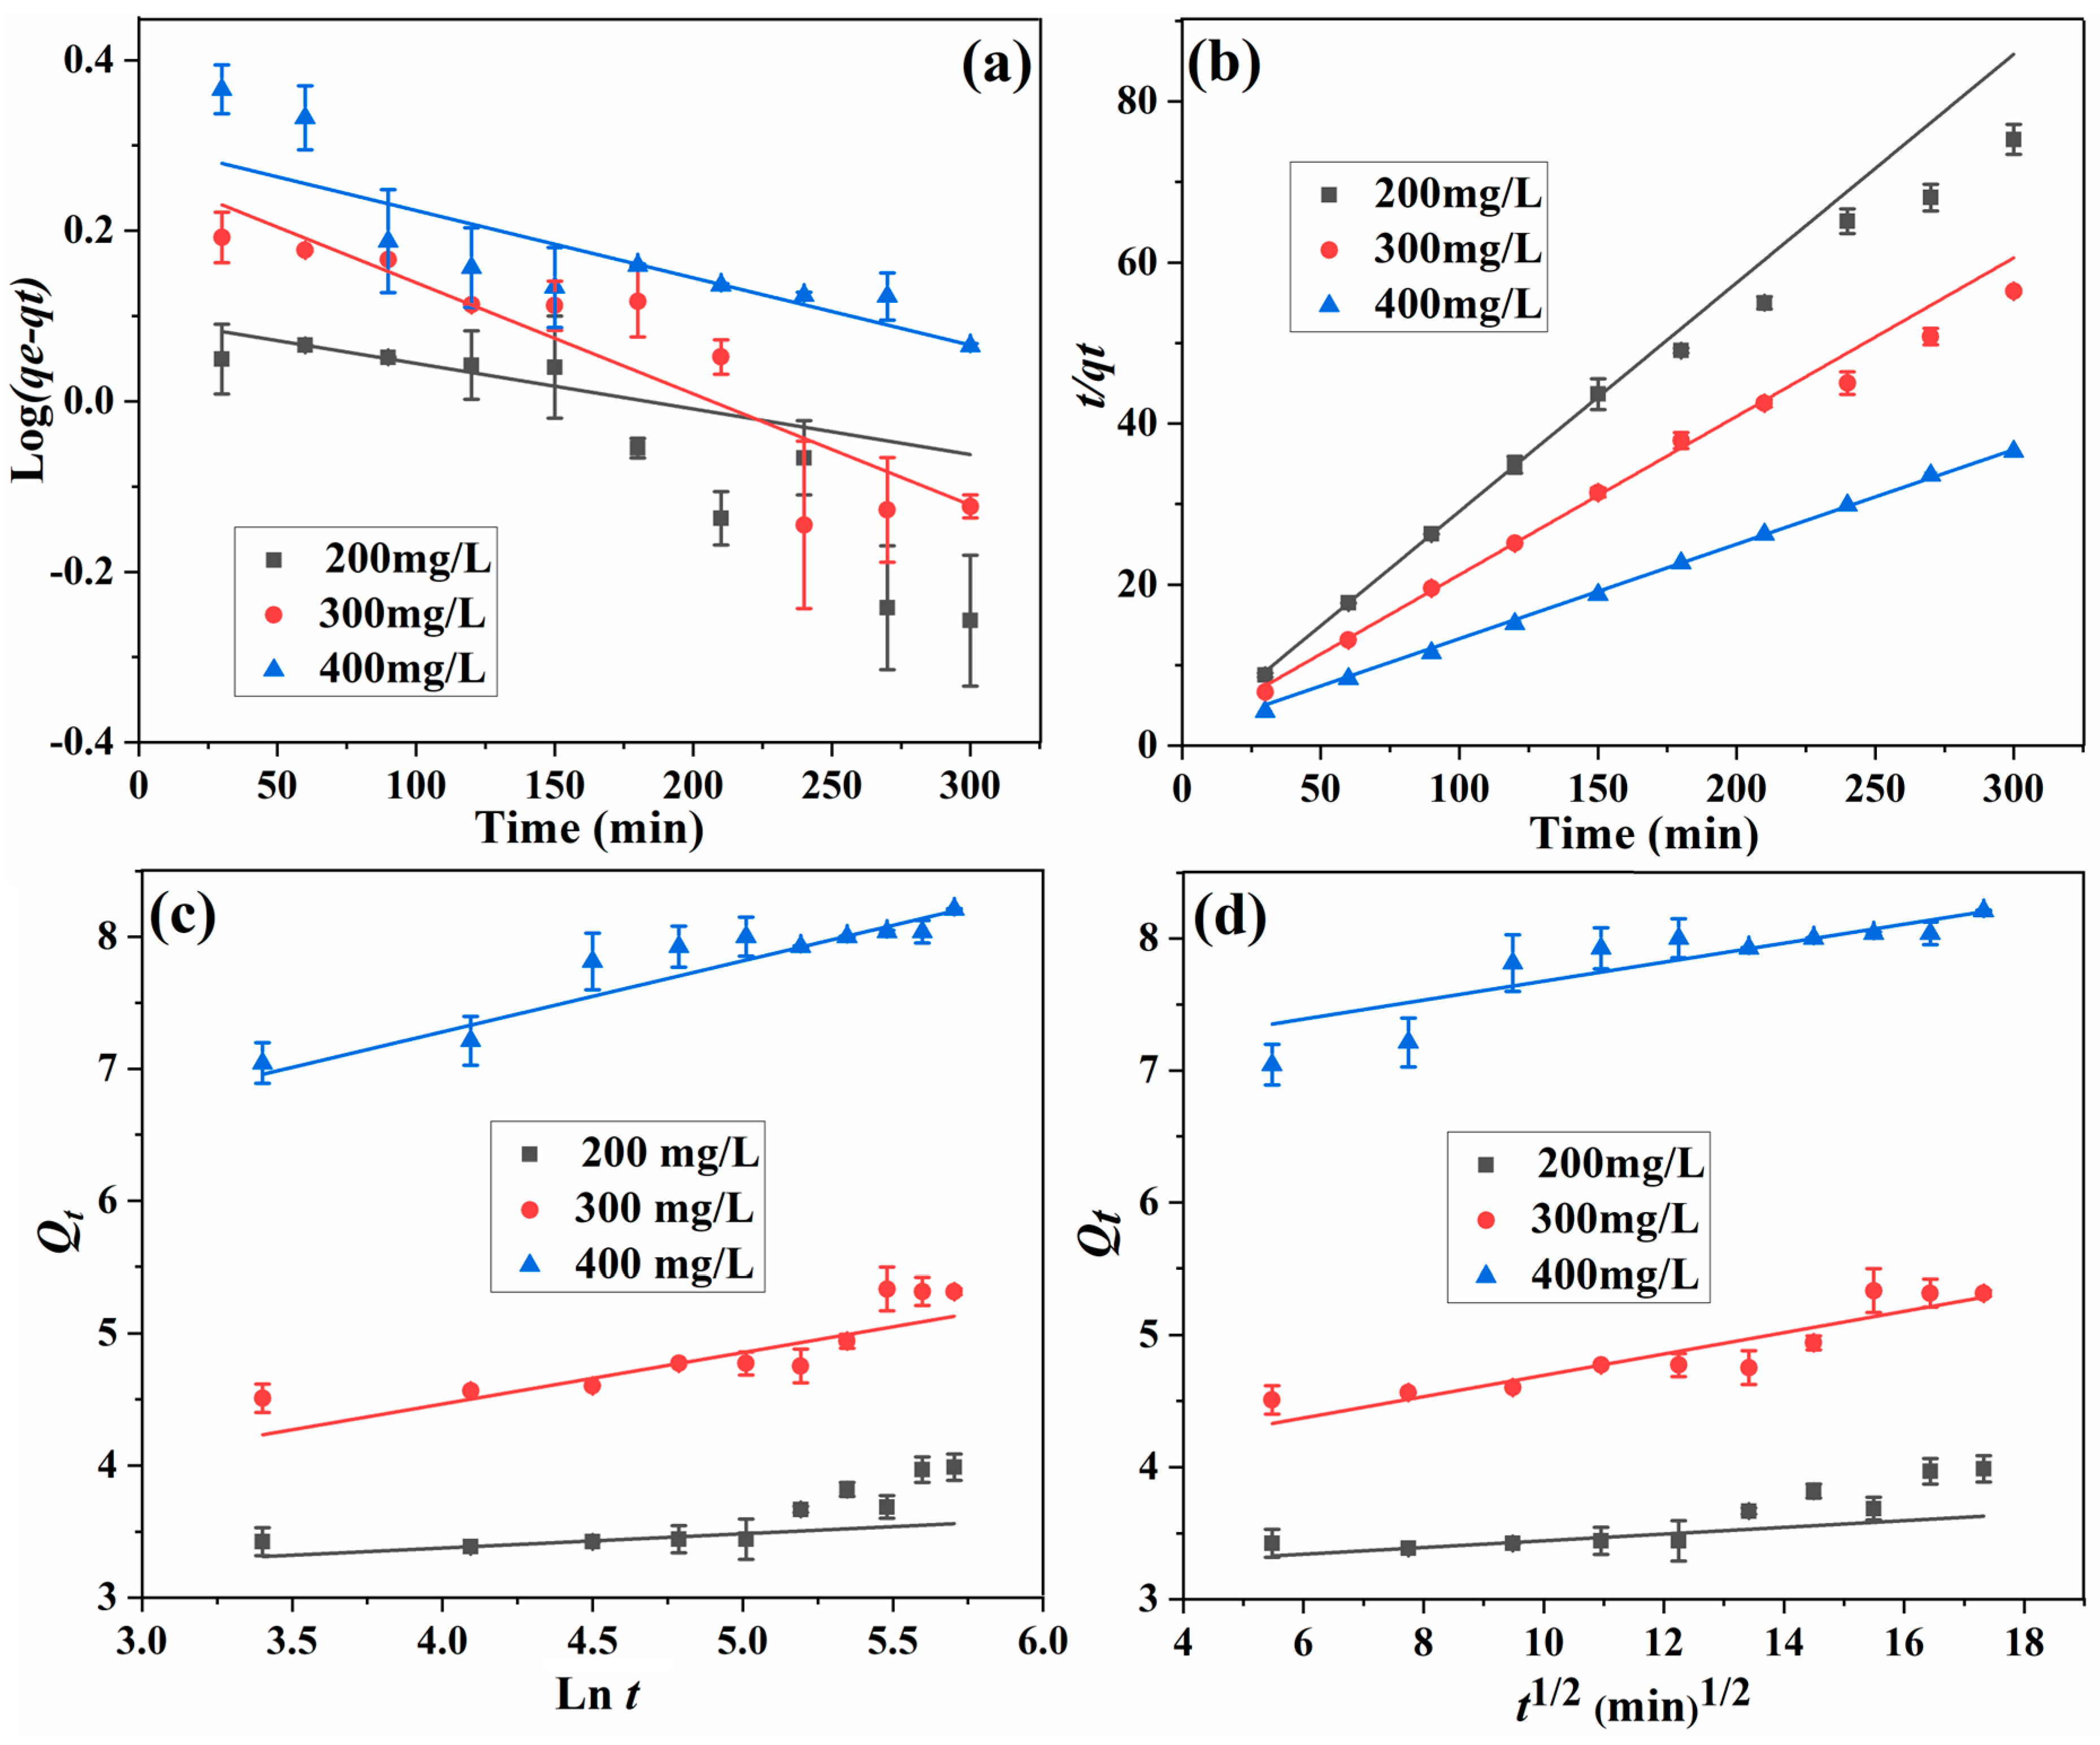
3.5.2. Adsorption Kinetics
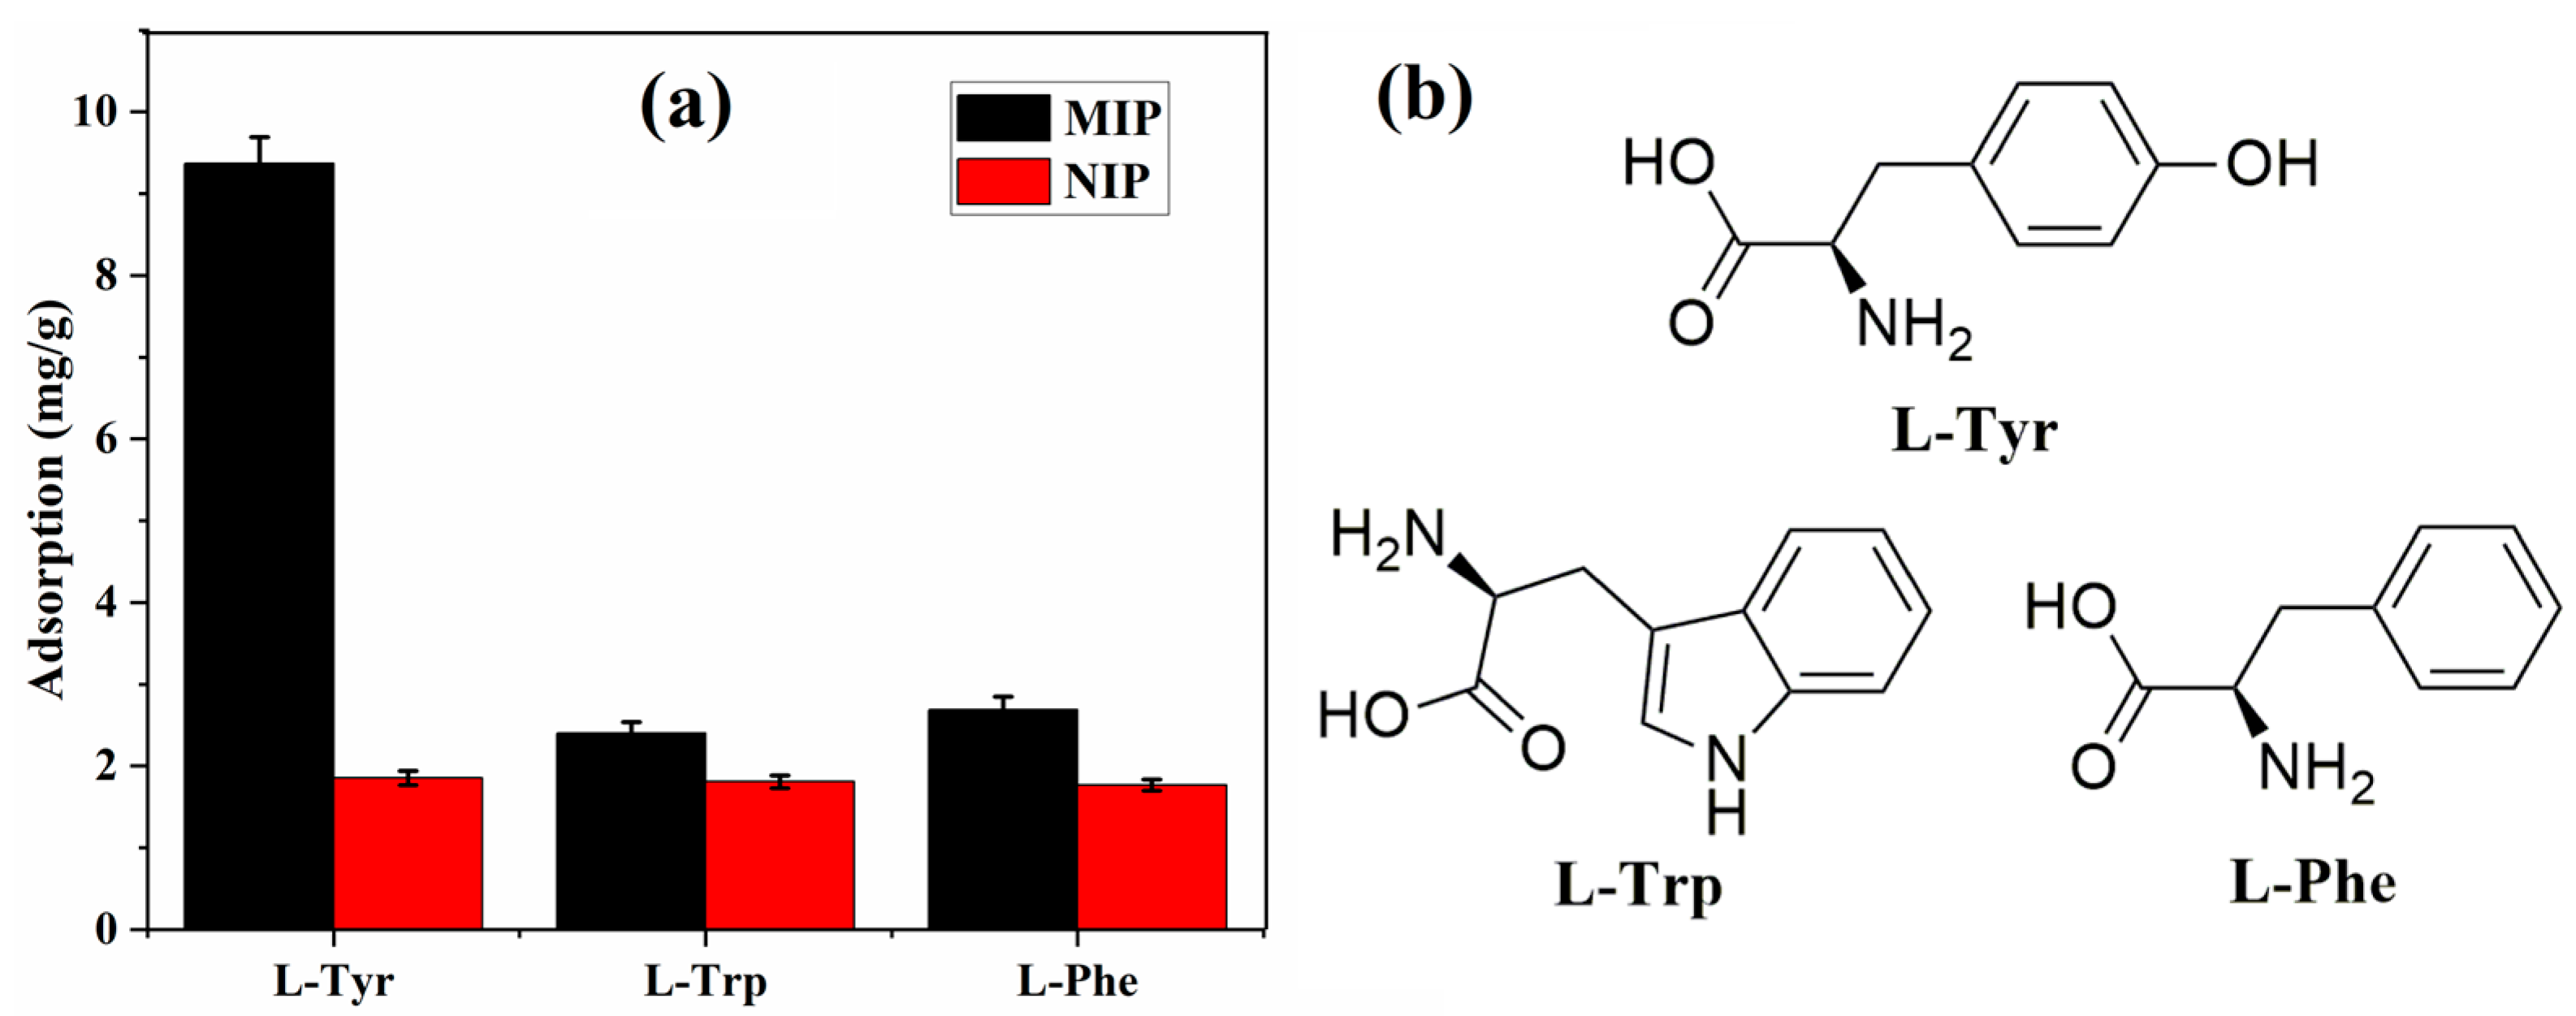
3.5.3. Specific Adsorption
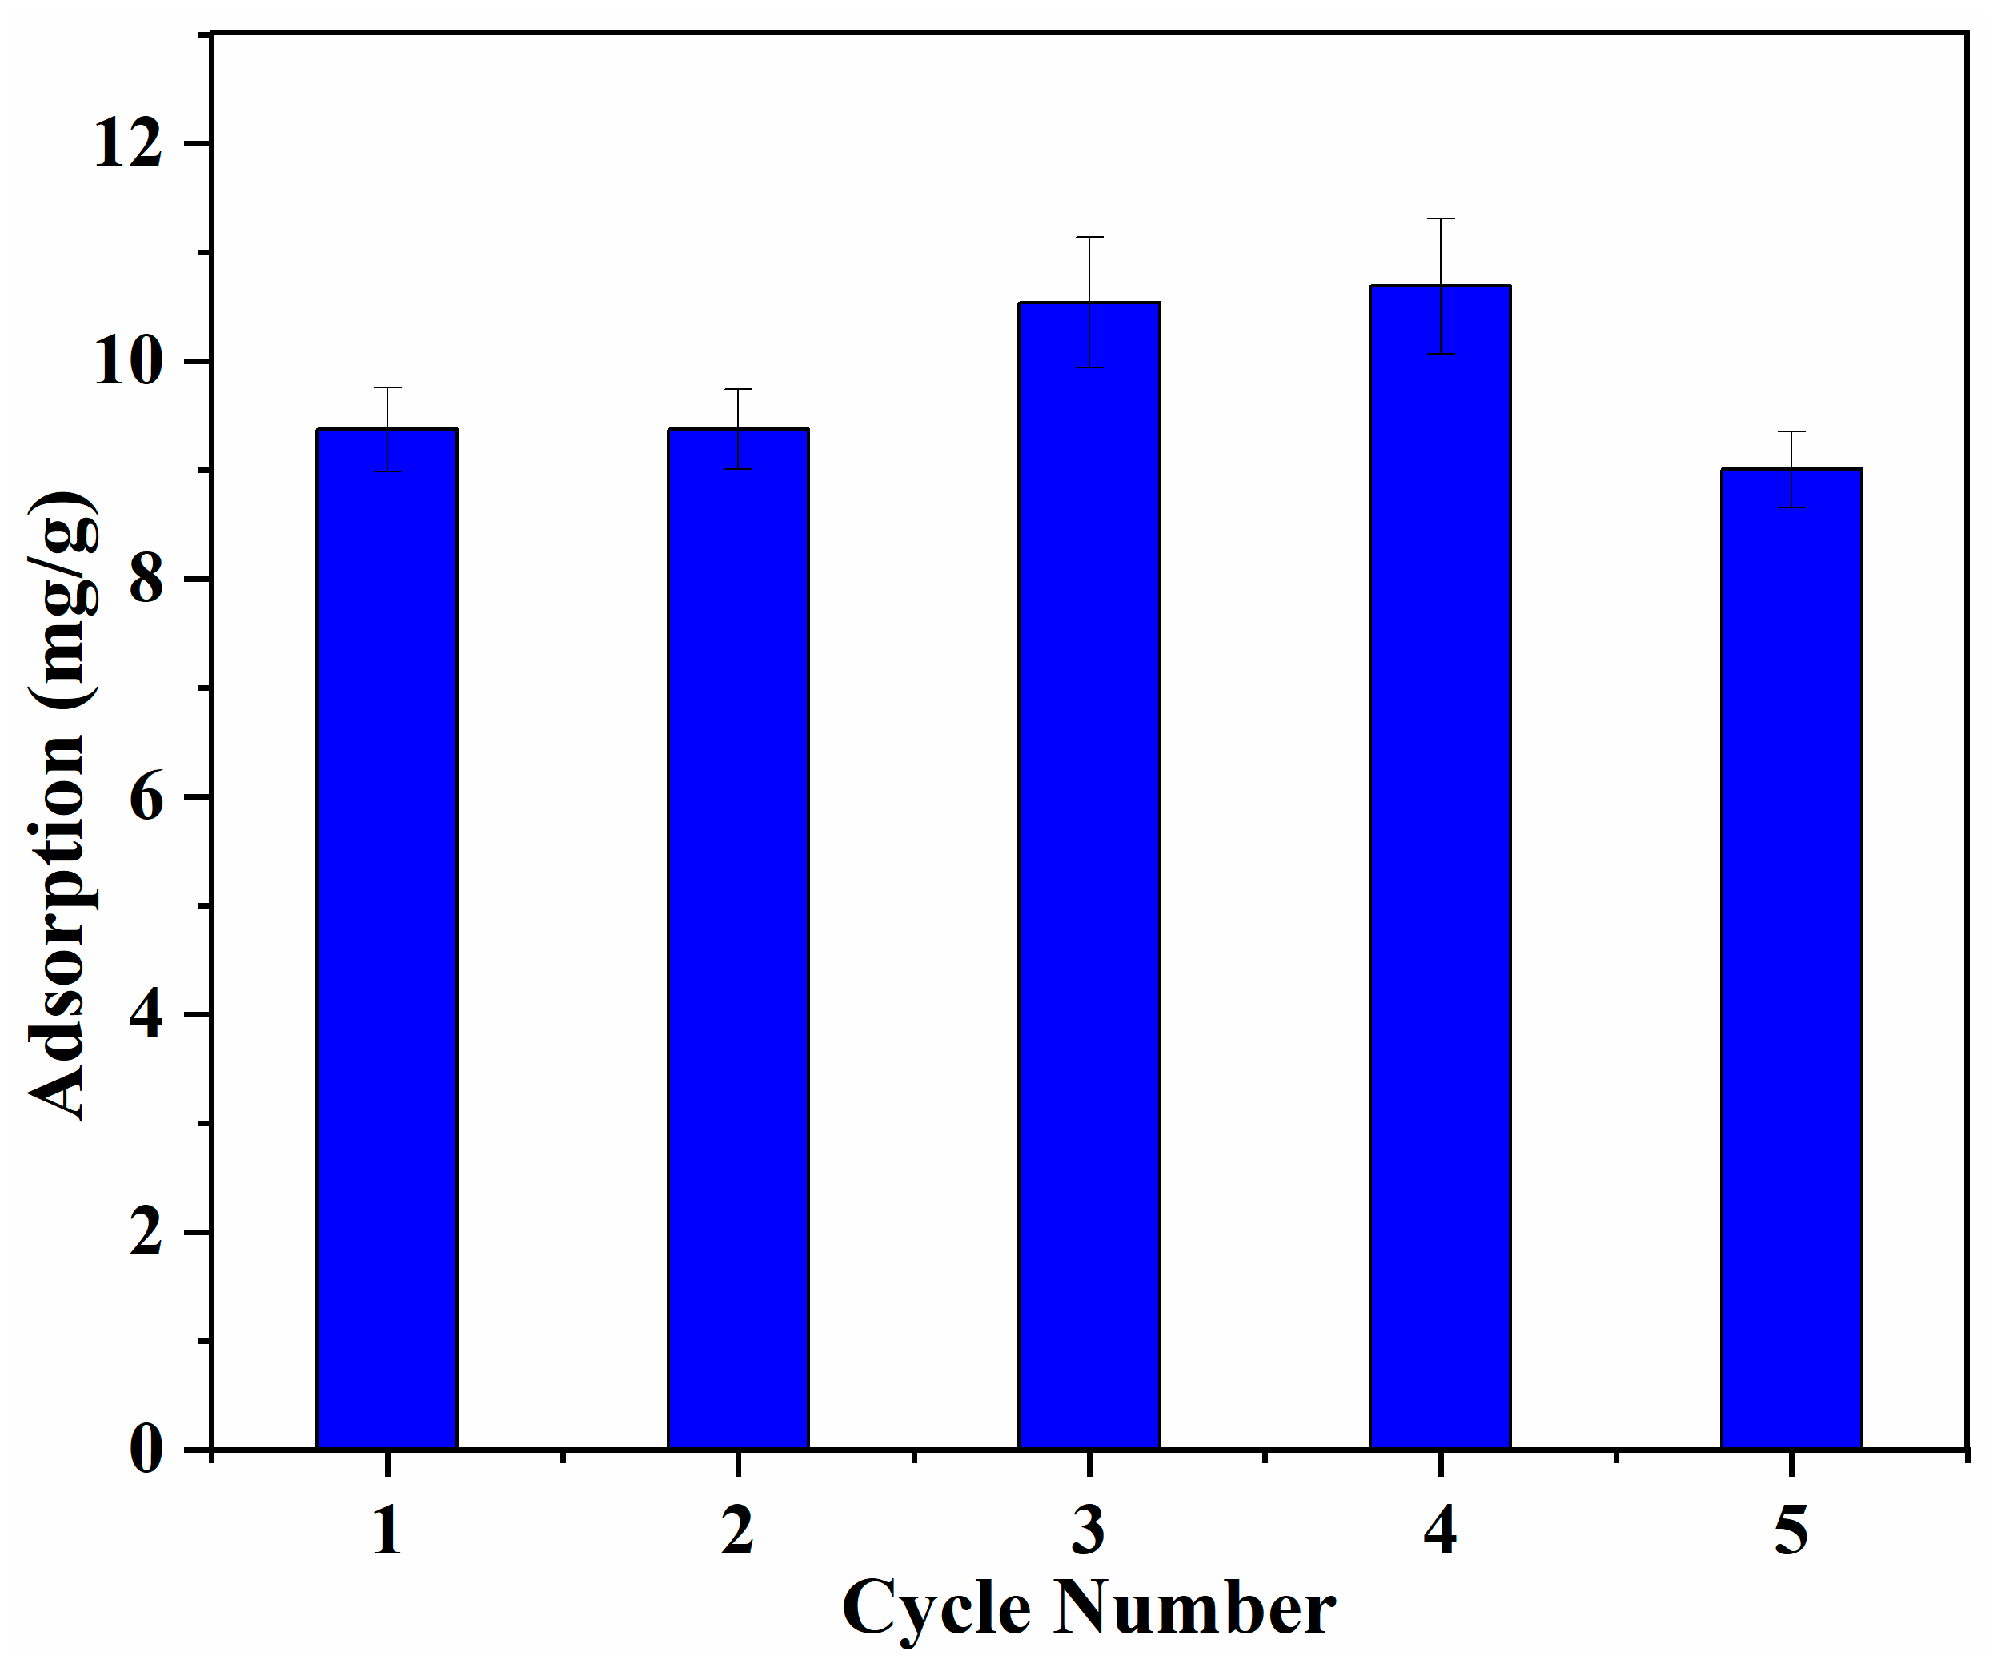
3.5.4. Regeneration Property
4. Conclusions
Author Contributions
Funding
Institutional Review Board Statement
Informed Consent Statement
Data Availability Statement
Conflicts of Interest
References
- Tan, X.; Song, W.; Chen, X.L.; Liu, L.M.; Wu, J. Recent advances in biocatalytic derivatization of L-tyrosine. Appl. Microbiol. Biotechnol. 2020, 104, 9907–9920. [Google Scholar] [CrossRef] [PubMed]
- Eversloh, T.L.; Santos, C.N.; Stephanopoulos, G. Perspectives of biotechnological production of L-tyrosine and its applications. Appl. Microbiol. Biotechnol. 2007, 77, 751–762. [Google Scholar] [CrossRef] [PubMed]
- Béjar, M.I.; Viveros, J.L.; Martínez, A.; Bolívar, F.; Gosset, G. Biotechnological production of l-tyrosine and derived compounds. Process Biochem. 2012, 47, 1017–1026. [Google Scholar] [CrossRef]
- Alia, K.B.; Nadeem, H.; Rasul, I.; Azeem, F.; Hussain, S.; Siddique, M.H.; Muzammil, S.; Riaz, M.; Nasir, S. Separation and purification of amino acids. In Applications of Ion Exchange Materials in Biomedical Industries; Inamuddin, Ed.; Springer Nature: Cham, Switzerland, 2019; pp. 1–11. [Google Scholar] [CrossRef]
- Li, H.J.; Li, Y.; Wang, D.D.; Wang, J.F.; Zhang, J.Y.; Jiang, W.; Zhou, T.Y.; Liu, C.B.; Che, G.B. Synthesis of hydrophilic SERS-imprinted membrane based on graft polymerization for selective detection of L-tyrosine. Sensor. Actuat. B-Chem. 2021, 340, 129955. [Google Scholar] [CrossRef]
- Liang, H.J.; Ling, T.R.; Rick, J.F.; Chou, T.C. Molecularly imprinted electrochemical sensor able to enantroselectivly recognized and L-tyrosine. Anal. Chim. Acta 2005, 542, 83–89. [Google Scholar] [CrossRef]
- Belbruno, J.J. Molecularly imprinted polymers. Chem. Rev. 2019, 119, 94–119. [Google Scholar] [CrossRef]
- Shen, Y.S.; Miao, P.P.; Liu, S.C.; Gao, J.; Han, X.B.; Zhao, Y.; Chen, T. Preparation and application progress of imprinted polymers. Polymers 2023, 15, 2344. [Google Scholar] [CrossRef]
- Viveiros, R.; Rebocho, S.; Casimiro, T. Green strategies for molecularly imprinted polymer development. Polymers 2018, 10, 306. [Google Scholar] [CrossRef]
- Pichon, V.; Delaunay, N.; Combés. Sample preparation using molecularly imprinted polymers. Anal. Chem. 2020, 92, 16–33. [Google Scholar] [CrossRef]
- Zheng, X.F.; Lian, Q.; Wu, H.X.; Liu, H.M.; Song, S.T. Molecularly imprinted polymer for L-tyrosine recognition and controlled release. Russ. J. Appl. Chem. 2015, 88, 160–1668. [Google Scholar] [CrossRef]
- Bakhshpour, M.; Göktürk, I.; Bereli, N.; Denizli, A. Molecularly imprinted cryogel cartridges for the selective recognition of tyrosine. Biotechnol. Process. 2020, 36, e3006. [Google Scholar] [CrossRef] [PubMed]
- Zhang, L.Y.; Cheng, G.X.; Fu, C.; Liu, X.H. Tyrosine imprinted polymer beads with different functional monomers via seed swelling and suspension polymerization. Polym. Eng. Sci. 2003, 43, 965–974. [Google Scholar] [CrossRef]
- Zheng, X.F.; Lian, Q.; Yang, H. Synthesis of chitosan-gelatin molecularly imprinted membranes for extraction of L-tyrosine. RSC Adv. 2014, 4, 42478–42485. [Google Scholar] [CrossRef]
- Ferreira, V.R.; Azenha, M.A.; Pereira, C.M.; Silva, A.F. Molecularly imprinted polymers for enhanced impregnation and controlled release of L-tyrosine. React. Funct. Polym. 2018, 131, 283–292. [Google Scholar] [CrossRef]
- Ying, X.G.; Zhu, X.M.; Kang, A.S.; Li, X. Molecular imprinted electrospun chromogenic membrane for L-tyrosine specifc recognition and visualized detection. Talanta 2019, 204, 647–654. [Google Scholar] [CrossRef]
- Öztürk, G.; Saylan, Y.; Denizli, A. Designing composite cryogel carriers for tyrosine adsorption. Sep. Purif. Technol. 2021, 254, 117622. [Google Scholar] [CrossRef]
- Liu, J.; Yuan, F.K.; Liu, J.H. Preparation of sulfamethazine molecularly imprinted polymer by electron beam irradiation polymerization. IOP Conf. Ser. Earth Environ. Sci. 2021, 702, 012050. [Google Scholar] [CrossRef]
- Liu, J.; Wang, B.; Shan, J.J. Precipitate preparation of chloramphenicol molecularly imprinted nanospheres by electron beam radiation. Polym. Mater. Sci. Eng. 2014, 30, 143–148. (In Chinese) [Google Scholar]
- Liu, W.; Wei, J.F.; Wang, B. The radiation polymerization method for preparing baicalein molecularly imprinted polymer. Funct. Mater. 2013, 44, 112–115. (In Chinese) [Google Scholar] [CrossRef]
- Chen, T.; Liu, H.C.; Gao, J.; Hu, G.W.; Zhao, Y.; Tang, X.Q.; Han, X.B. Efficient removal of methylene blue by bio-based sodium alginate/lignin composite hydrogel beads. Polymers 2022, 14, 2917. [Google Scholar] [CrossRef]
- Gao, J.; Li, Z.Z.; Wang, Z.W.; Chen, T.; Hu, G.W.; Zhao, Y.; Han, X.B. Facile synthesis of sustainable tannin/sodium alginatecomposite hydrogel beads for efficient removal of methylene blue. Gels 2022, 8, 486. [Google Scholar] [CrossRef] [PubMed]
- Júnior, J.M.; Mattos, F.R.; Costa, G.; Zurlo, A.B.R.; Lafuente, R.F.; Mendes, A.A. Improved catalytic performance of lipase eversa® transform 2.0 via immobilization for the sustainable production of flavor esters-adsorption process and environmental assessment studies. Catalysts 2022, 12, 1412. [Google Scholar] [CrossRef]
- Wu, F.C.; Tseng, R.L.; Juang, R.S. Initial behavior of intraparticle diffusion model used in the description of adsorption kinetics. Chem. Eng. J. 2009, 153, 1–8. [Google Scholar] [CrossRef]
- Contreras, C.D.; Ledesma, A.E.; Lanús, H.E.; Zinczuk, J.; Brandán, S.A. Hydration of l-tyrosine in aqueous medium. An experimental and theoretical study by mixed quantum mechanical/molecular mechanics methods. Vib. Spectrosc. 2011, 57, 108–115. [Google Scholar] [CrossRef]
- Bhat, S.A.; Ahmad, S. FTIR, FT-Raman and UV-Vis spectral studies of D-tyrosine molecule. J. Mol. Struct. 2016, 1105, 169–177. [Google Scholar] [CrossRef]
- Zhao, X.Y.; Mai, Y.L.; Chen, D.C.; Zhang, M.; Hu, H.W. Selective enrichment of clenbuterol onto molecularly imprinted polymer microspheres with tailor-made structure and oxygen functionalities. Polymers 2019, 11, 1635. [Google Scholar] [CrossRef]
- Smalley, C.J.; Hoskyns, H.E.; Hughes, C.E.; Johnstone, D.N.; Willhammar, T.; Young, M.T.; Pickard, C.J.; Logsdail, A.J.; Midgley, P.A.; Harris, D.M. A structure determination protocol based on combined analysis of 3D-ED data, powder XRD data, solid-state NMR data and DFT-D calculations reveals the structure of a new polymorph of L-tyrosine. Chem. Sci. 2022, 13, 5277. [Google Scholar] [CrossRef]
- Liu, Z.M.; Li, C. Solvent-free crystallizations of amino acids: The effects of the hydrophilicity/hydrophobicity of side-chains. Biophys. Chem. 2008, 138, 115–119. [Google Scholar] [CrossRef]
- Sang, Y.N.; Miao, P.P.; Chen, T.; Zhao, Y.; Chen, L.F.; Tian, Y.Y.; Han, X.B. Fabrication and evaluation of graphene oxide/hydroxypropyl cellulose/chitosan hybrid aerogel for 5-fluorouracil release. Gels 2022, 8, 649. [Google Scholar] [CrossRef]
- Sajini, T.; Gigimol, M.G.; Mathew, B. Kinetic and thermodynamic studies of molecularly imprinted polymers for the selective adsorption and specific enantiomeric recognition of D-mandelic acid. J. Polym. Res. 2019, 26, 88. [Google Scholar] [CrossRef]
- Segatelli, M.G.; Santos, V.S.; Presotto, A.B.T.; Yoshida, I.V.P.; Tarley, C.R.T. Cadmium ion-selective sorbent preconcentration method using ion imprinted poly(ethylene glycol dimethacrylate-co-vinylimidazole). React. Funct. Polym. 2010, 70, 325–333. [Google Scholar] [CrossRef]
- Wang, W.W.; Luo, Z.M.; Guo, P.Q.; Zhou, H.Y.; Fu, Q.; Chang, C. Selective preconcentration of mezlocillin from eggs by molecularly imprinted polymers on silica. Anal. Lett. 2017, 50, 1276–1291. [Google Scholar] [CrossRef]
- Li, X.J.; Chen, X.X.; Sun, G.Y.; Zhao, Y.X.; Liu, Z.S.; Aisa, H.A. Green synthesis and evaluation of isoquercitrin imprinted polymers for class-selective separation and purification of flavonol glycosides. Anal. Methods 2015, 7, 4717–4724. [Google Scholar] [CrossRef]
- Sadia, M.; Ahmad, I.; Ali, F.; Zahoor, M.; Ullah, R.; Khan, F.A.; Ali, E.A.; Sohail, A. Selective removal of the emerging dye basic blue 3 via molecularly imprinting technique. Molecules 2022, 27, 3276. [Google Scholar] [CrossRef]
- Zhong, D.D.; Huang, Y.P.; Xin, X.L.; Liu, Z.S.; Aisa, H.A. Preparation of metallic pivot-based imprinted monolith for polar template. J. Chromatogr. B 2013, 94, 109–116. [Google Scholar] [CrossRef] [PubMed]
- Zhang, W.; She, X.H.; Wang, L.P.; Fan, H.J.; Zhou, Q.; Huang, X.W.; Tang, J.Z. Preparation, characterization and application of a molecularly imprinted polymer for selective recognition of sulpiride. Materials 2017, 10, 475. [Google Scholar] [CrossRef]
- Zhi, K.K.; Li, Z.; Luo, H.; Ding, Y.T.; Chen, F.Y.; Tan, Y.X.; Liu, H.R. Selective adsorption of quercetin by the sol-gel surface molecularly imprinted polymer. Polymers 2023, 15, 905. [Google Scholar] [CrossRef]
- Chi, D.; Wang, W.; Mu, S.Y.; Chen, S.L.; Zhang, K.K. Computer-aided prediction, synthesis, and characterization of magnetic molecularly imprinted polymers for the extraction and determination of tolfenpyrad in lettuce. Foods 2023, 12, 1045. [Google Scholar] [CrossRef]
- Shen, D.L.; Yan, Y.; Hu, X.P.; Zhong, Y.J.; Li, Z.Y.; Guo, Y.P.; Xie, L.W.; Yuan, D.Y. Deep-eutectic-solvent-based mesoporous molecularly imprinted polymers for purification of gallic acid from camellia spp. fruit shells. Int. J. Mol. Sci. 2022, 23, 13089. [Google Scholar] [CrossRef]
- Simonin, J.P. On the comparison of pseudo-first order and pseudo-second order rate laws in the modeling of adsorption kinetics. Chem. Eng. J. 2016, 300, 254–263. [Google Scholar] [CrossRef]
- Sun, P.J.; Wang, Y.P.; Yang, S.; Sun, X.H.; Peng, B.; Pan, L.N.; Jia, Y.Z.; Zhang, X.B.; Nie, C. Molecularly imprinted polymer nanospheres with hydrophilic shells for efficient molecular recognition of heterocyclic aromatic amines in aqueous solution. Molecules 2023, 28, 2052. [Google Scholar] [CrossRef] [PubMed]


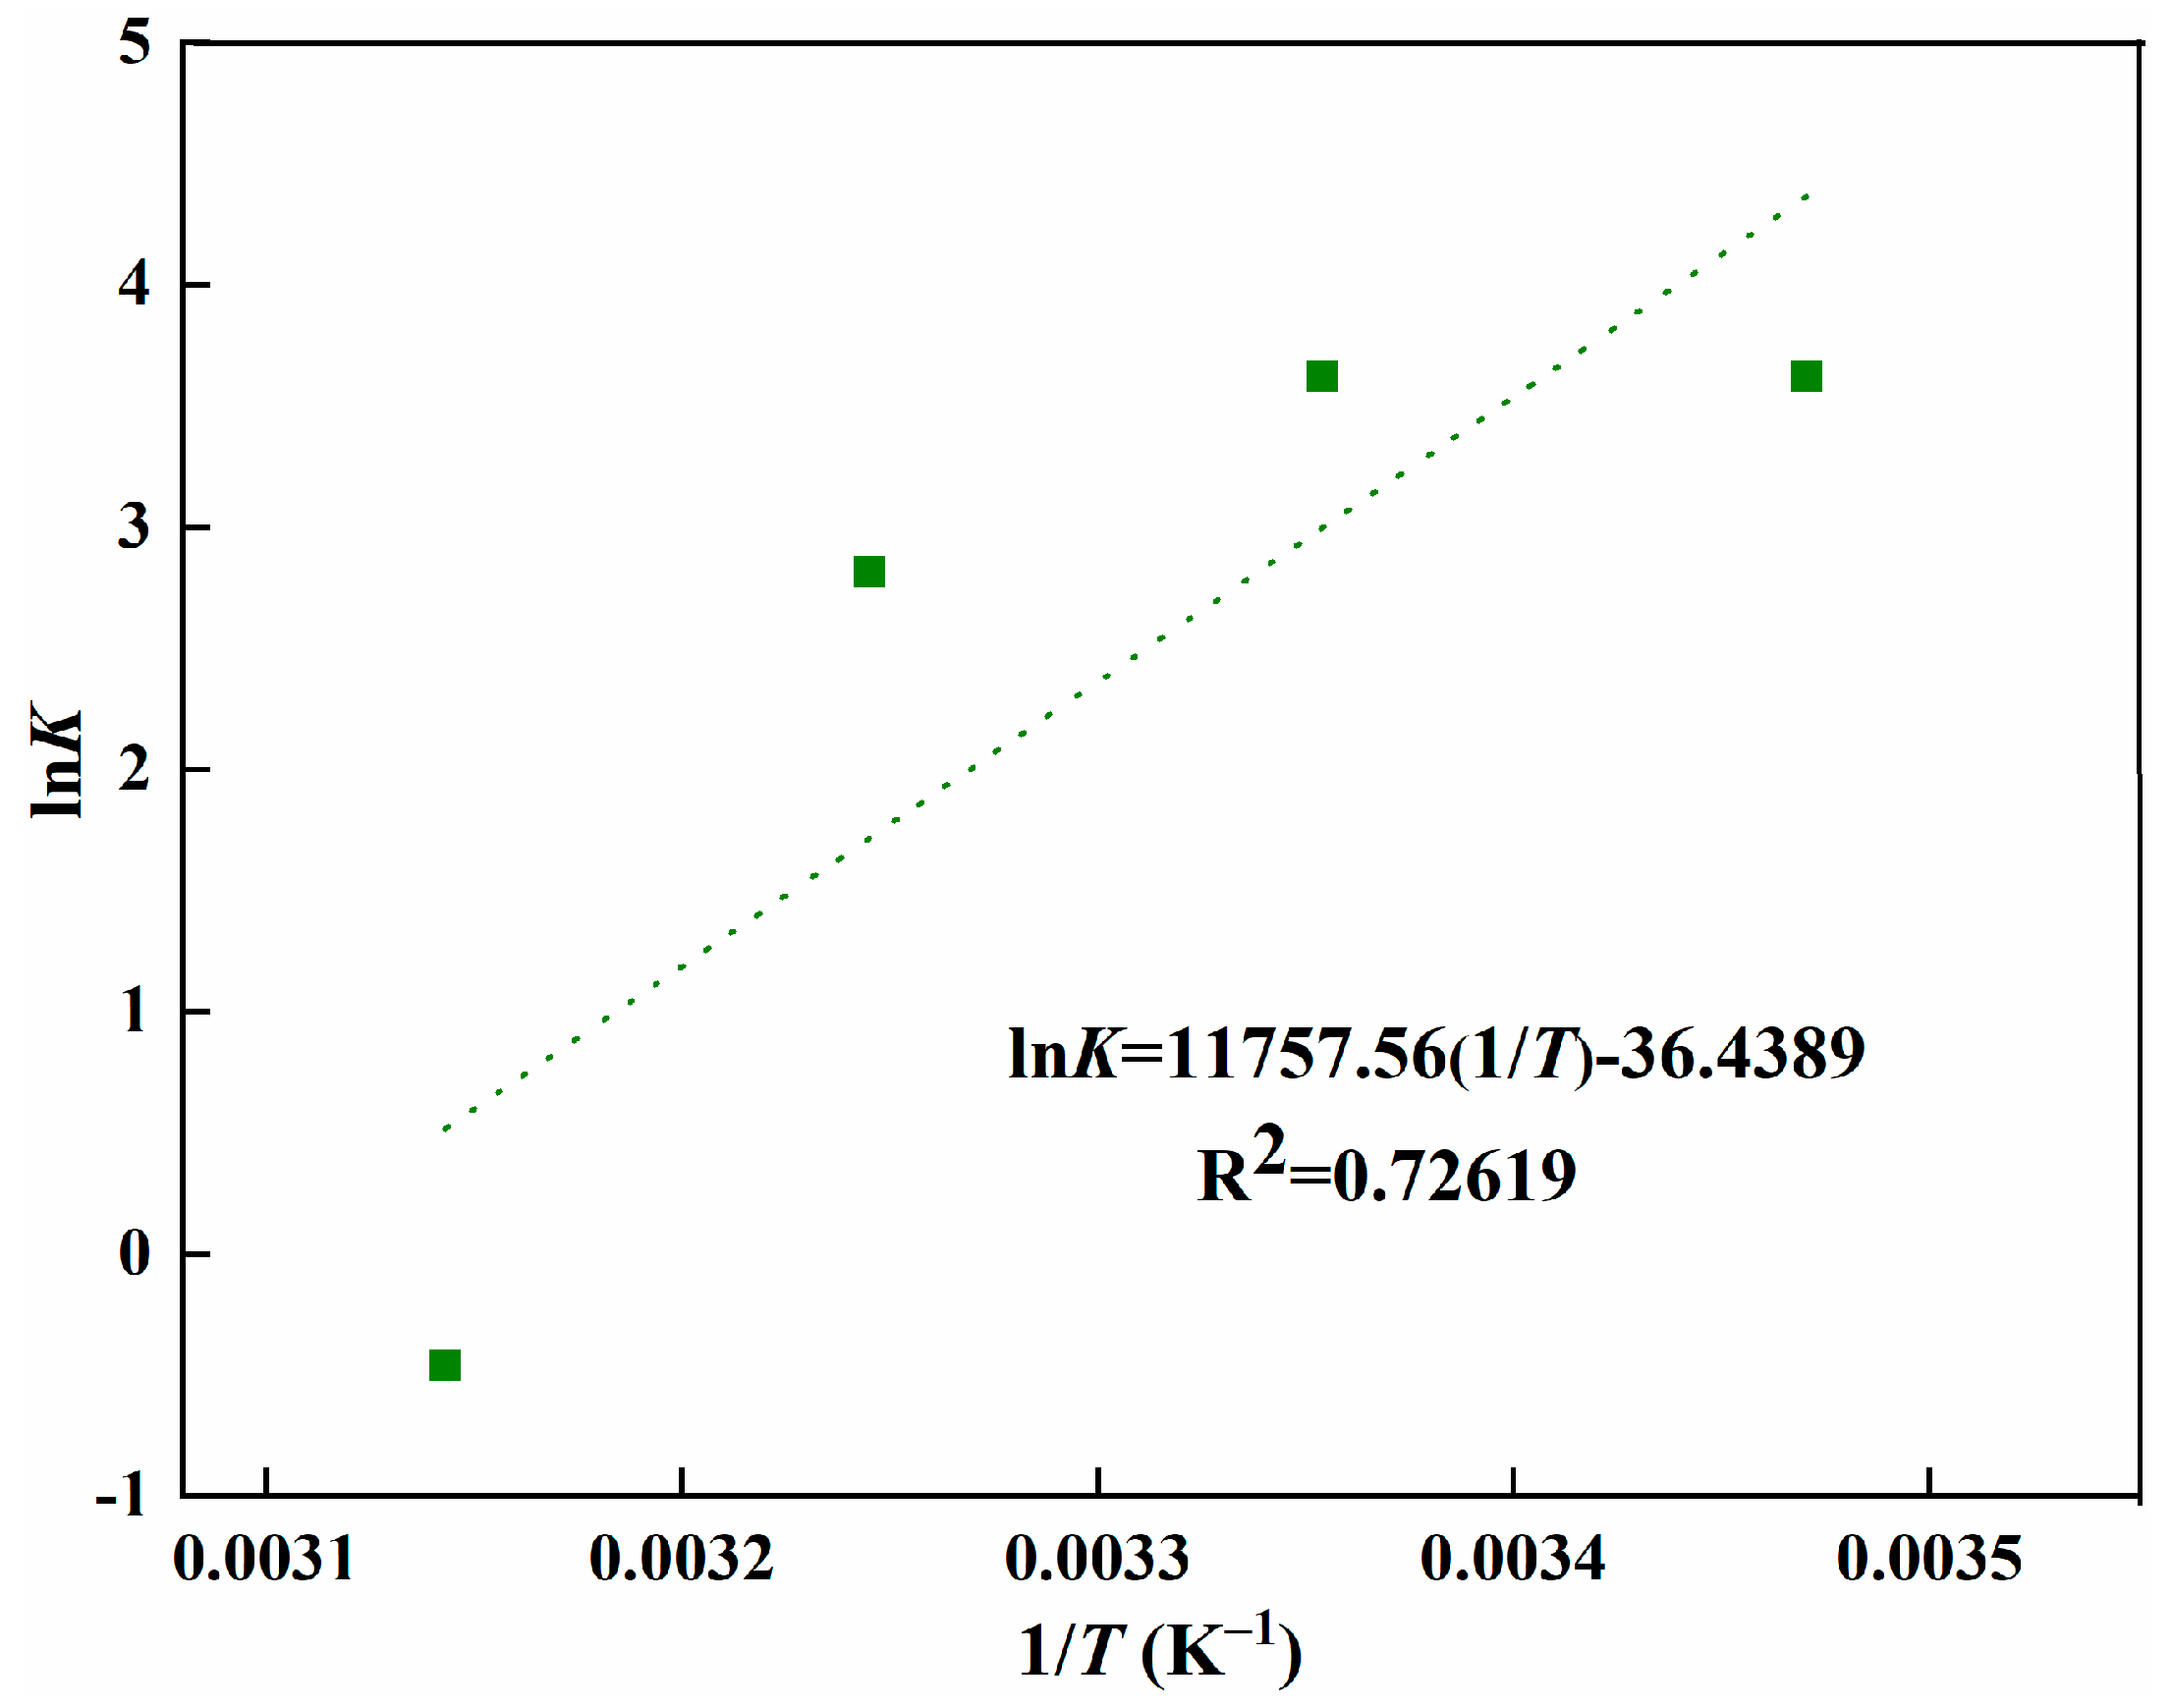
| Temperature (K) | ΔG0 (kJ/mol) | ΔH0 (kJ/mol) | ΔS0 (kJ/mol·k) |
|---|---|---|---|
| 288 | −8.67 | −99.79 | −0.31 |
| 298 | −8.54 | ||
| 308 | −7.21 | ||
| 318 | 1.22 |
| Kinetic Models | Coefficients | 200 mg/L | 300 mg/L | 400 mg/L |
|---|---|---|---|---|
| PFO | qe,cal (mg/g) | 1.253 | 1.861 | 2.008 |
| k1 (min−1) | 5.34 × 10⁻⁴ | 1.3 × 10⁻³ | 7.89 × 10⁻⁴ | |
| R2 | 0.8735 | 0.9320 | 0.9685 | |
| PSO | qe,cal (mg/g) | 3.522 | 5.080 | 8.518 |
| k2 (g/mg min) | 9.21 × 10⁻² | 2.30 × 10⁻² | 9.63 × 10⁻³ | |
| R2 | 0.9993 | 0.9987 | 0.9992 | |
| Elovich | qe,cal (mg/g) | 3.560 | 3.524 | 5.7411 |
| α (mg/g min) | 7.47 × 10¹⁰ | 6.83 × 10² | 7.29 × 10³ | |
| β (g/min) | 9.2601 | 2.5685 | 1.8562 | |
| R2 | 0.7688 | 0.8756 | 0.9770 | |
| IPD | qe,cal (mg/g) | 3.628 | 5.285 | 8.204 |
| kp (g/kg min1/2) | 0.0253 | 0.0806 | 0.0719 | |
| C (g/kg) | 3.1896 | 3.8886 | 6.9572 | |
| R2 | 0.8250 | 0.9181 | 0.9774 |
| Sample | α | β |
|---|---|---|
| L-Tyr | / | 5.1 |
| L-Trp | 3.9 | 1.3 |
| L-Phe | 3.5 | 1.5 |
Disclaimer/Publisher’s Note: The statements, opinions and data contained in all publications are solely those of the individual author(s) and contributor(s) and not of MDPI and/or the editor(s). MDPI and/or the editor(s) disclaim responsibility for any injury to people or property resulting from any ideas, methods, instructions or products referred to in the content. |
© 2023 by the authors. Licensee MDPI, Basel, Switzerland. This article is an open access article distributed under the terms and conditions of the Creative Commons Attribution (CC BY) license (https://creativecommons.org/licenses/by/4.0/).
Share and Cite
Miao, P.; Sang, Y.; Gao, J.; Han, X.; Zhao, Y.; Chen, T. Adsorption and Recognition Property of Tyrosine Molecularly Imprinted Polymer Prepared via Electron Beam Irradiation. Polymers 2023, 15, 4048. https://doi.org/10.3390/polym15204048
Miao P, Sang Y, Gao J, Han X, Zhao Y, Chen T. Adsorption and Recognition Property of Tyrosine Molecularly Imprinted Polymer Prepared via Electron Beam Irradiation. Polymers. 2023; 15(20):4048. https://doi.org/10.3390/polym15204048
Chicago/Turabian StyleMiao, Pengpai, Yanan Sang, Jie Gao, Xiaobing Han, Yuan Zhao, and Tao Chen. 2023. "Adsorption and Recognition Property of Tyrosine Molecularly Imprinted Polymer Prepared via Electron Beam Irradiation" Polymers 15, no. 20: 4048. https://doi.org/10.3390/polym15204048