
Special Aspects of Nitrocellulose Molar Mass Determination by Dynamic Light Scattering


Abstract
:1. Introduction
2. Materials and Methods
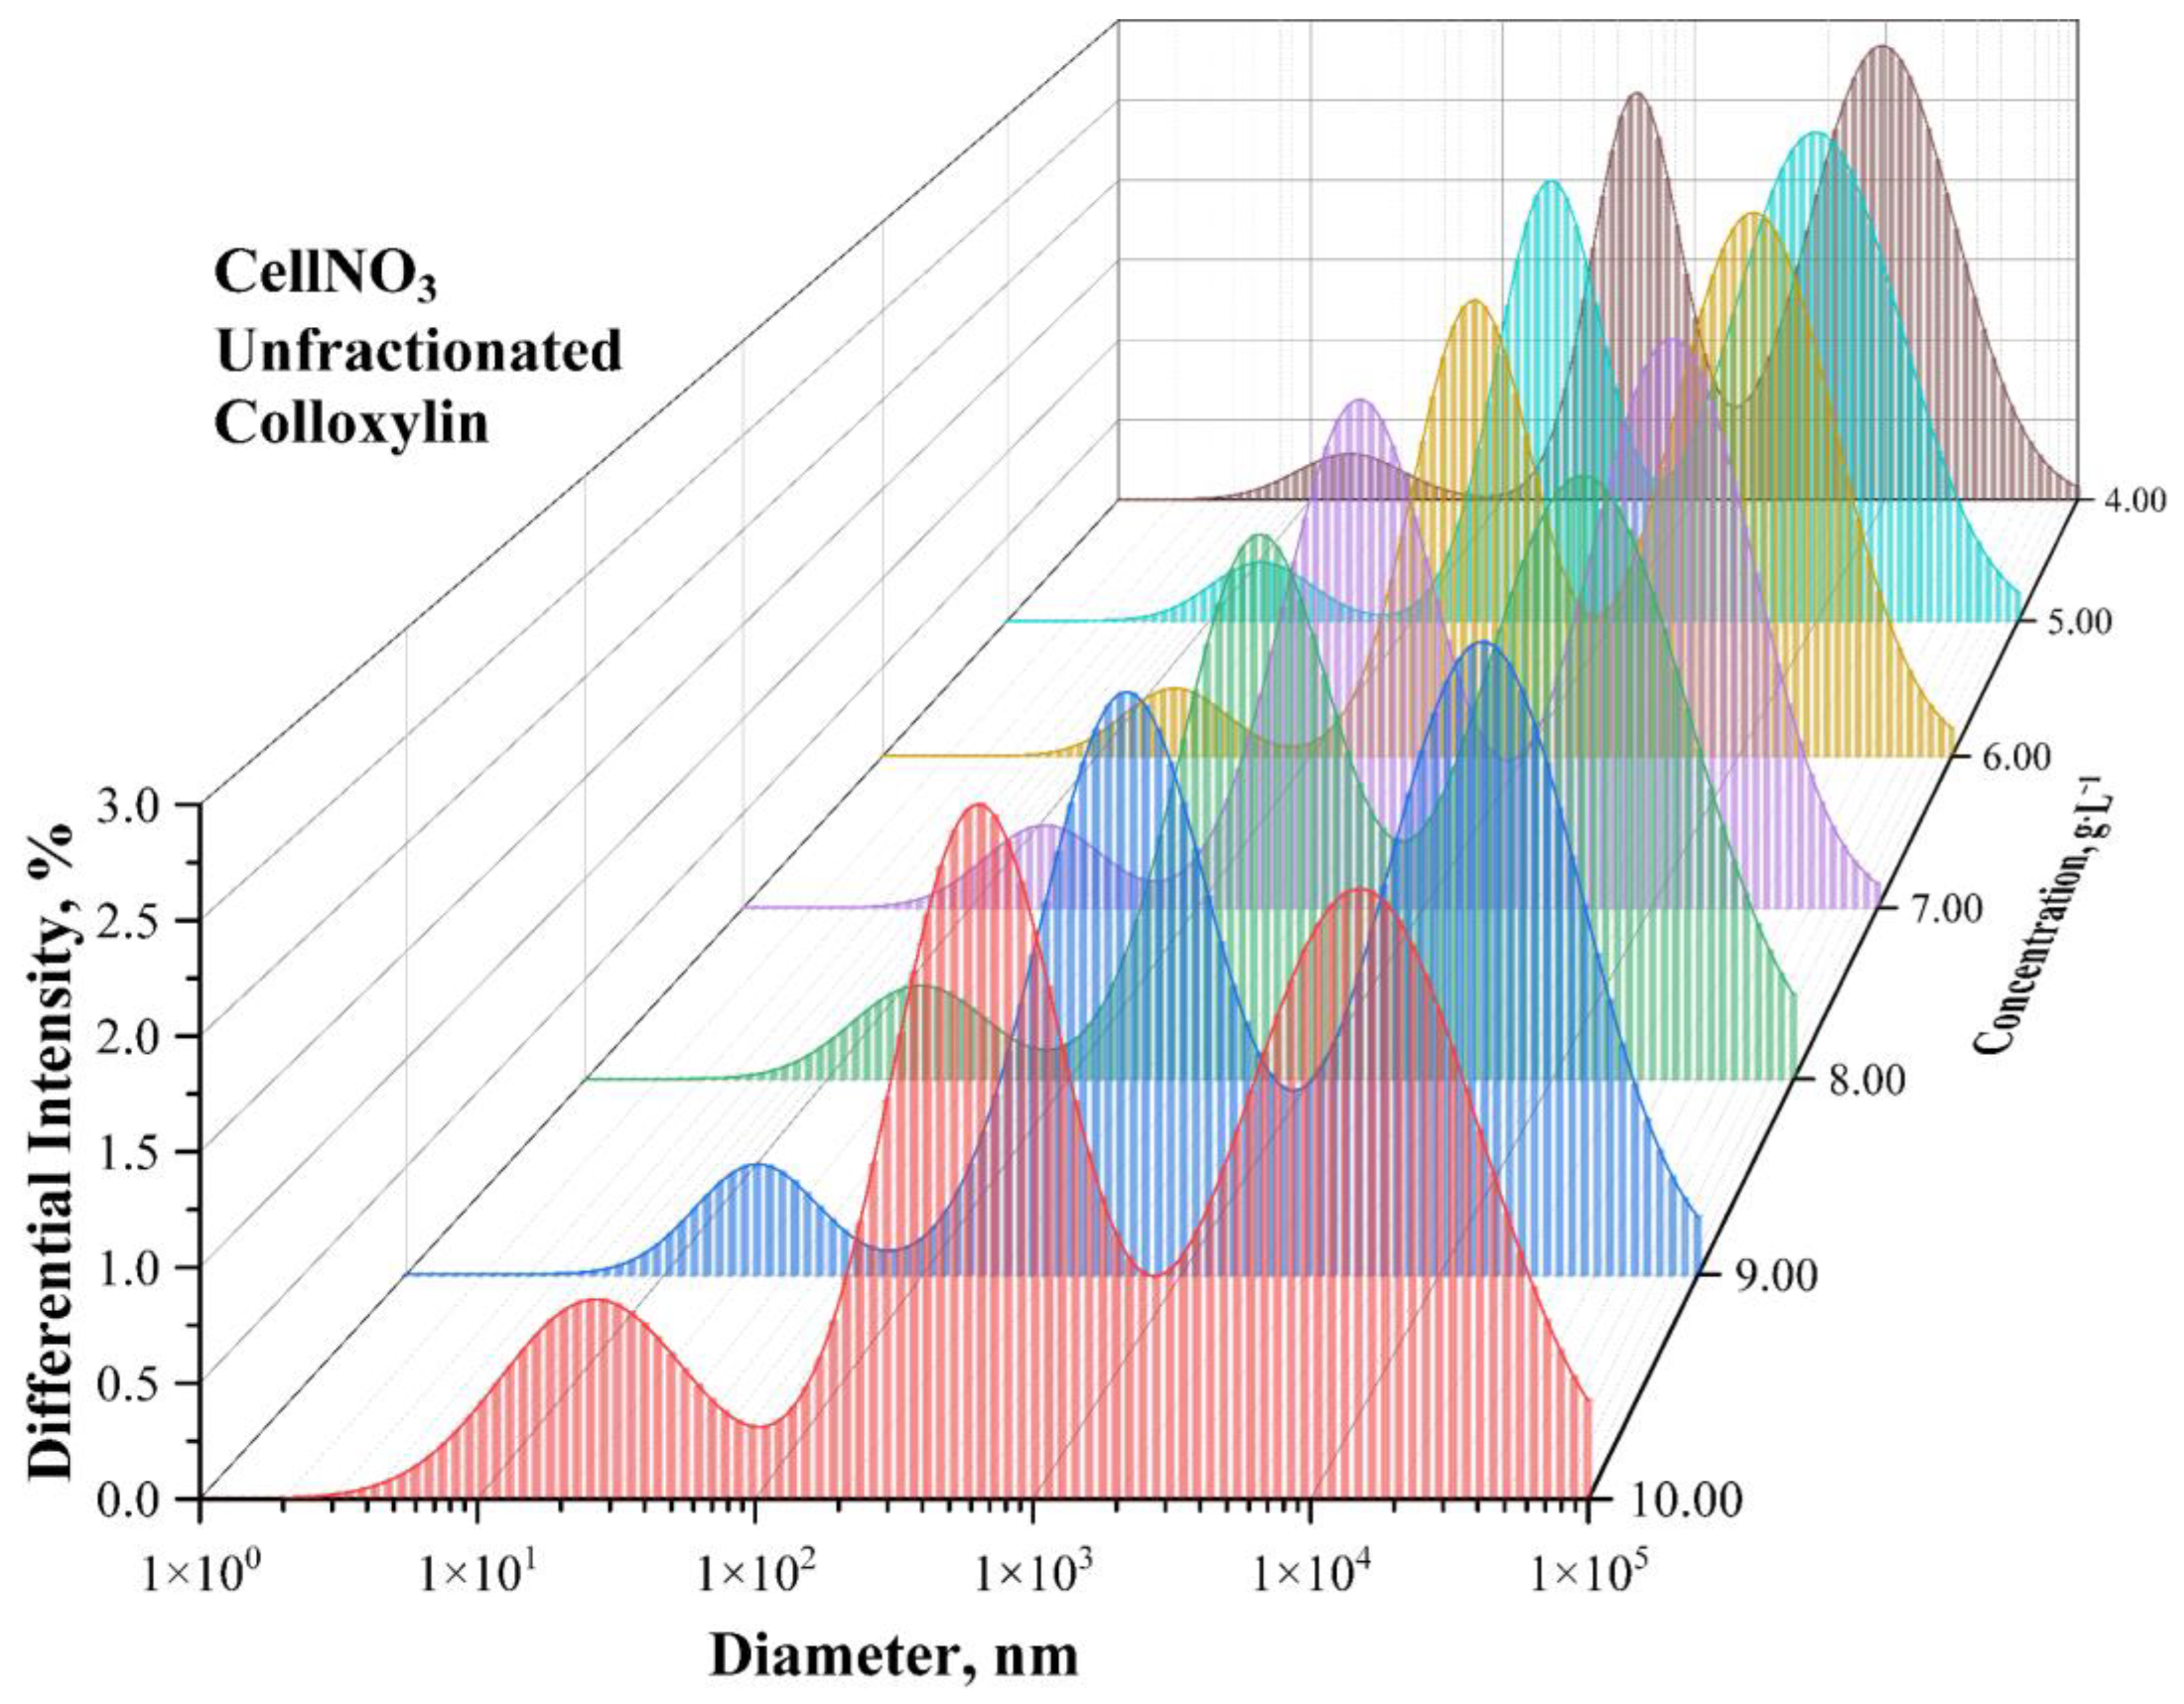
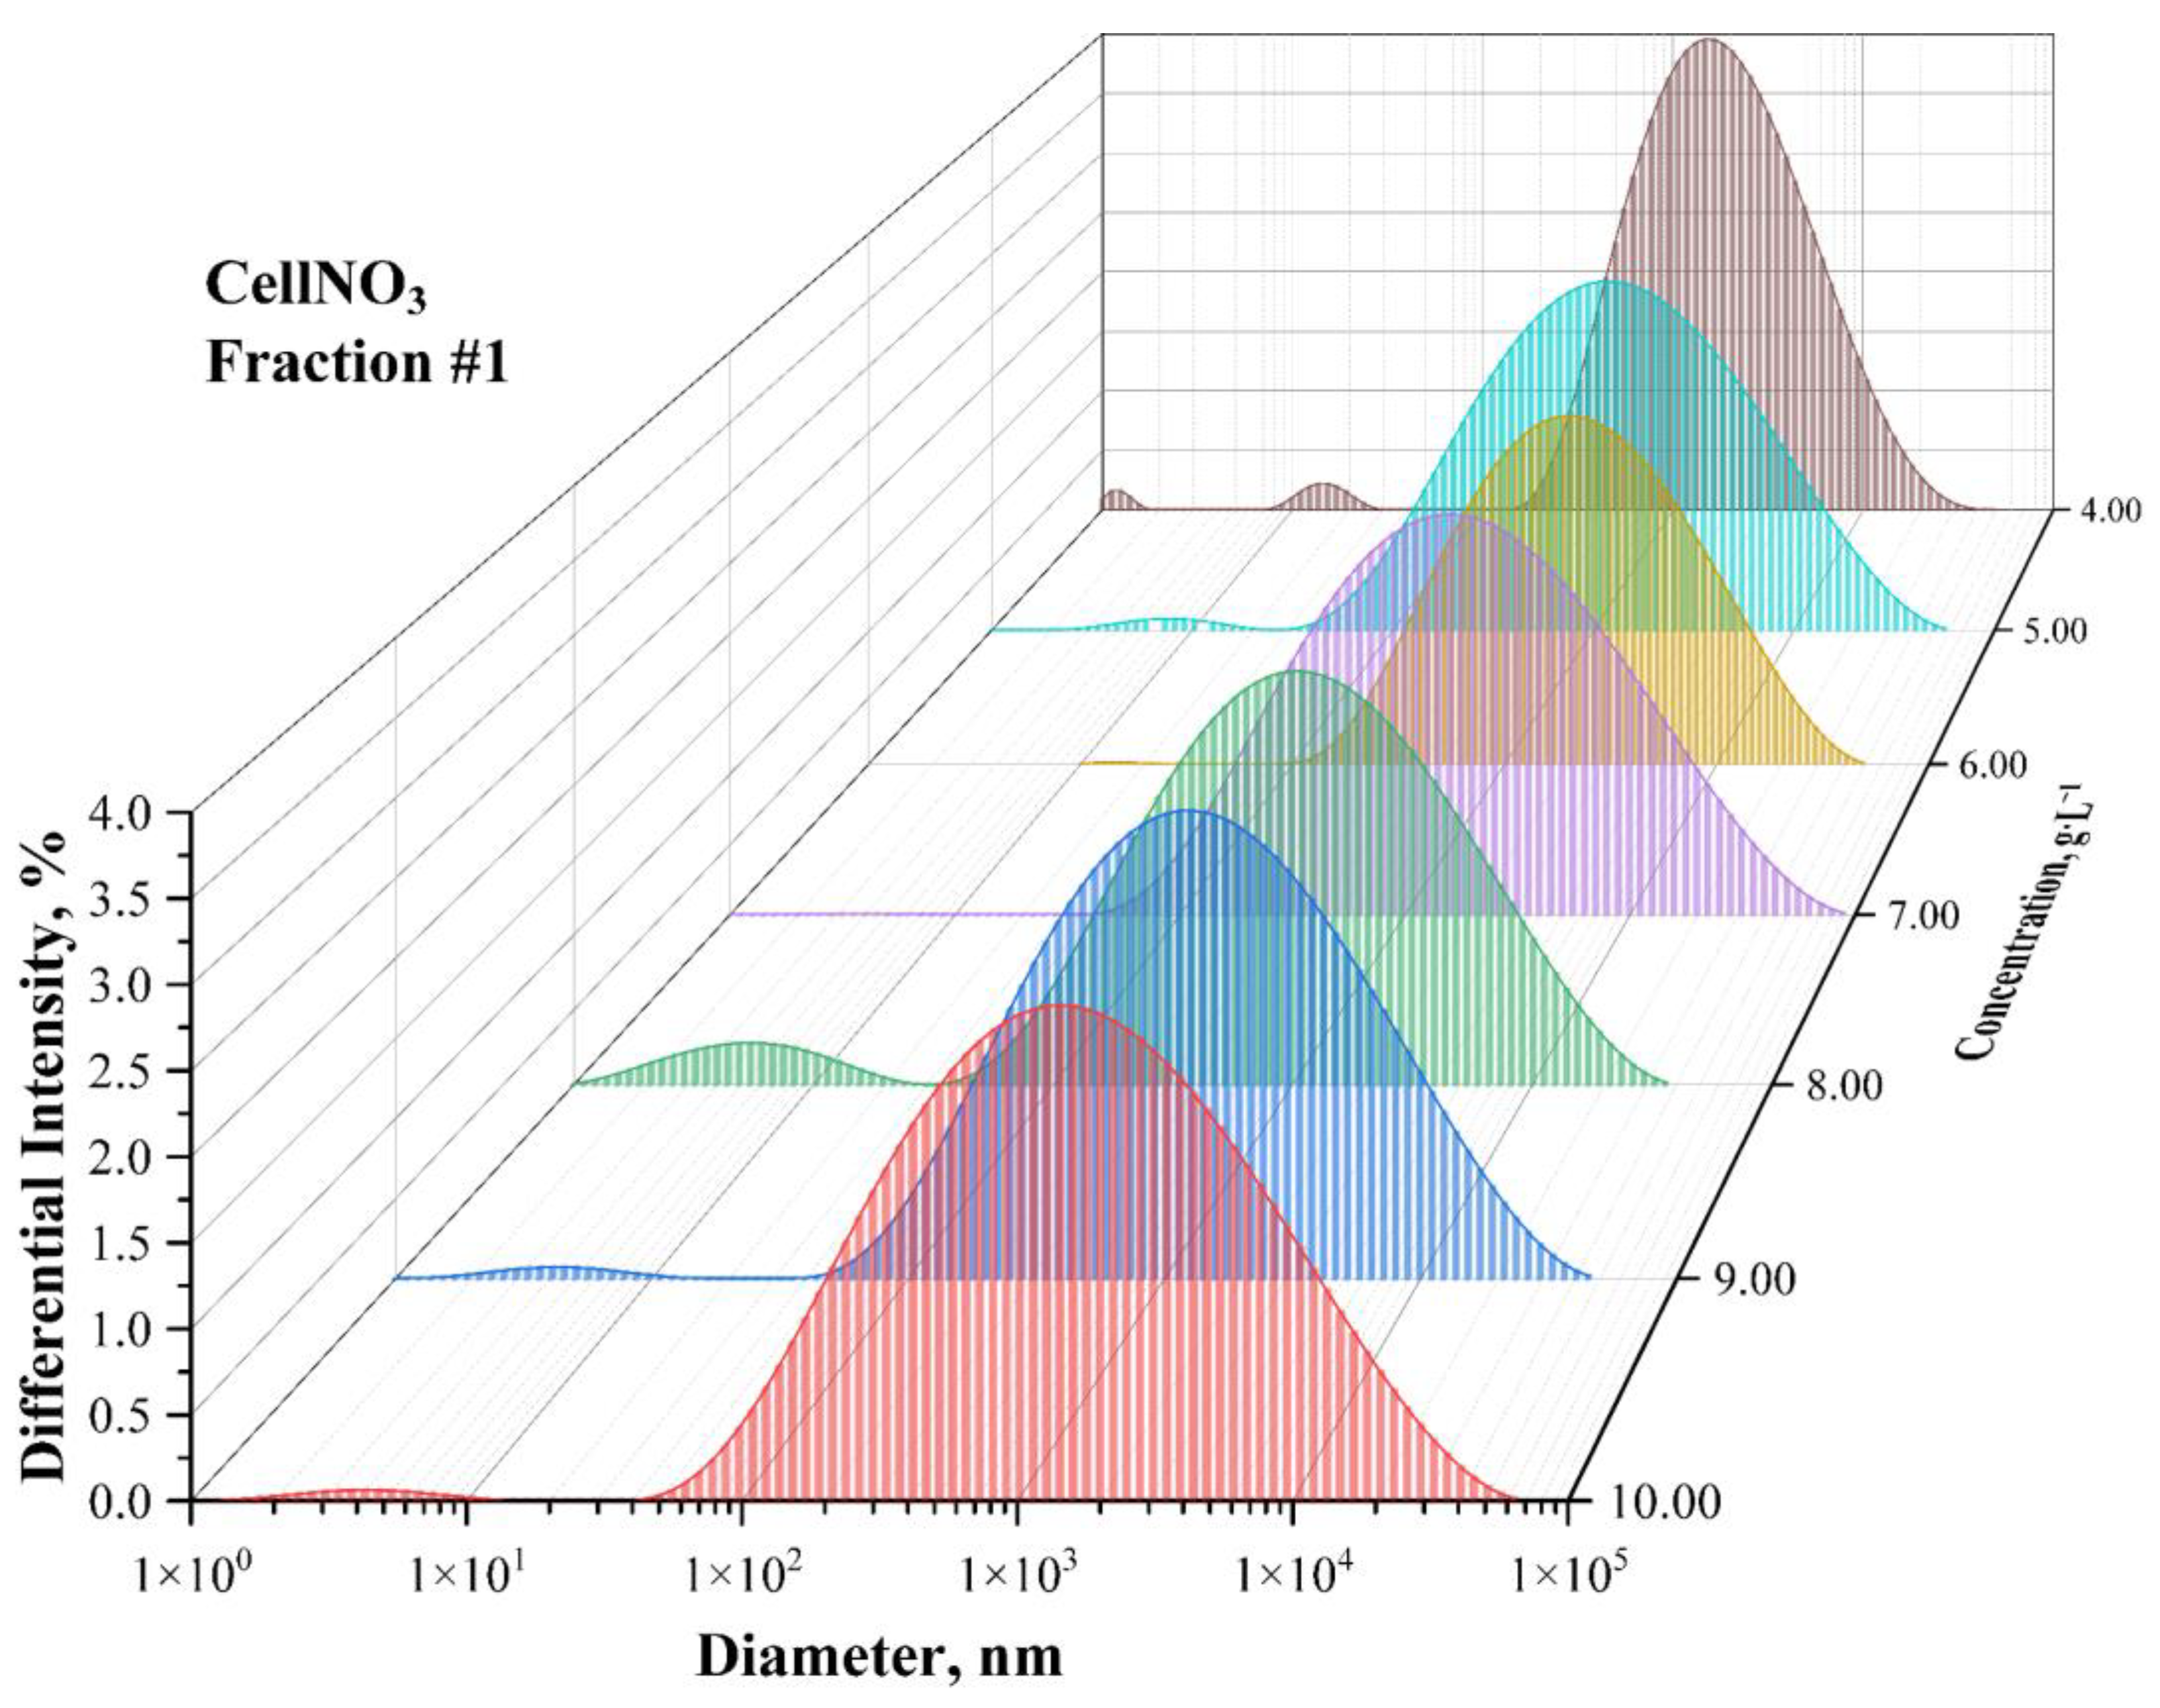
3. Results and Discussions
4. Conclusions
Supplementary Materials
Author Contributions
Funding
Institutional Review Board Statement
Informed Consent Statement
Data Availability Statement
Conflicts of Interest
References
- Saunders, C.W.; Taylor, L.T. A Review of the Synthesis, Chemistry and Analysis of Nitrocellulose. J. Energ. Mater. 1990, 8, 149–203. [Google Scholar] [CrossRef]
- Tkacheva, N.I.; Morozov, S.V.; Grigor’ev, I.A.; Mognonov, D.M.; Kolchanov, N.A. Modification of Cellulose as a Promising Direction in the Design of New Materials. Polym. Sci. Ser. B 2013, 55, 409–429. [Google Scholar] [CrossRef]
- Kennedy, J.F.; Phillips, G.; Wedlock, D.; Williams, P.A. Cellulose and Its Derivatives: Chemistry, Biochemistry a. Applications; Wiley: New York, NY, USA, 1985; Volume 551. [Google Scholar]
- Kostochko, A.V.; Valishina, Z.T.; Shipina, O.T. Features of the Structure and Rheology of Nitrocellulose Solutions. Int. Polym. Sci. Technol. 2013, 40, 27–32. [Google Scholar] [CrossRef]
- Fernández de la Ossa, M.Á.; López-López, M.; Torre, M.; García-Ruiz, C. Analytical Techniques in the Study of Highly-Nitrated Nitrocellulose. TrAC Trends Anal. Chem. 2011, 30, 1740–1755. [Google Scholar] [CrossRef]
- Golubev, A.E.; Kuvshinova, S.A.; Burmistrov, V.A.; Koifman, O.I. Modern Advances in the Preparation and Modification of Cellulose Nitrates. Russ. J. Gen. Chem. 2018, 88, 368–381. [Google Scholar] [CrossRef]
- Mizuguchi, J. Dependence of the Diffusion Current on the Degree of Polymerization of Nitrocellulose in Acetone-Isopropyl Alcohol. J. Electrochem. Soc. 1982, 129, 1520–1523. [Google Scholar] [CrossRef]
- Sovizi, M.R.; Hajimirsadeghi, S.S.; Naderizadeh, B. Effect of Particle Size on Thermal Decomposition of Nitrocellulose. J. Hazard. Mater. 2009, 168, 1134–1139. [Google Scholar] [CrossRef]
- McKeen, L. The Effect of Sterilization on Plastics and Elastomers; Elsevier: Boston, MA, USA, 2012; ISBN 9781455728053. [Google Scholar]
- Shokri, J.; Adibki, K. Application of Cellulose and Cellulose Derivatives in Pharmaceutical Industries. In Cellulose-Medical, Pharmaceutical and Electronic Applications; InTech: London, UK, 2013. [Google Scholar]
- Chen, P.; Gates-Hollingsworth, M.; Pandit, S.; Park, A.; Montgomery, D.; AuCoin, D.; Gu, J.; Zenhausern, F. Paper-Based Vertical Flow Immunoassay (VFI) for Detection of Bio-Threat Pathogens. Talanta 2019, 191, 81–88. [Google Scholar] [CrossRef]
- Chi, J.; Ma, B.; Dong, X.; Gao, B.; Elbaz, A.; Liu, H.; Gu, Z. A Bio-Inspired Photonic Nitrocellulose Array for Ultrasensitive Assays of Single Nucleic Acids. Analyst 2018, 143, 4559–4565. [Google Scholar] [CrossRef]
- Luo, Y.; Nartker, S.; Wiederoder, M.; Miller, H.; Hochhalter, D.; Drzal, L.T.; Alocilja, E.C. Novel Biosensor Based on Electrospun Nanofiber and Magnetic Nanoparticles for the Detection of E. Coli O157:H7. IEEE Trans. Nanotechnol. 2012, 11, 676–681. [Google Scholar] [CrossRef]
- Santamaría, B.; Laguna, M.; López-Romero, D.; Hernandez, A.; Sanza, F.; Lavín, Á.; Casquel, R.; Maigler, M.; Espinosa, R.; Holgado, M. Development towards Compact Nitrocellulose-Based Interferometric Biochips for Dry Eye MMP9 Label-Free In-Situ Diagnosis. Sensors 2017, 17, 1158. [Google Scholar] [CrossRef]
- Nartker, S.; Hassan, M.; Stogsdill, M. Electrospun Cellulose Nitrate and Polycaprolactone Blended Nanofibers. Mater. Res. Express 2015, 2, 035401. [Google Scholar] [CrossRef]
- Yew, C.-H.T.; Azari, P.; Choi, J.R.; Li, F.; Pingguan-Murphy, B. Electrospin-Coating of Nitrocellulose Membrane Enhances Sensitivity in Nucleic Acid-Based Lateral Flow Assay. Anal. Chim. Acta 2018, 1009, 81–88. [Google Scholar] [CrossRef]
- Mansfield, M.A. Nitrocellulose Membranes for Lateral Flow Immunoassays: A Technical Treatise. In Lateral Flow Immunoassay; Humana Press: Totowa, NJ, USA, 2009; pp. 1–19. [Google Scholar]
- Sun, S.; Feng, S.; Ji, C.; Shi, M.; He, X.; Xu, F.; Lu, T.J. Microstructural Effects on Permeability of Nitrocellulose Membranes for Biomedical Applications. J. Memb. Sci. 2020, 595, 117502. [Google Scholar] [CrossRef]
- Elmaghraby, N.A.; Omer, A.M.; Kenawy, E.-R.; Gaber, M.; El Nemr, A. Fabrication of Cellulose Acetate/Cellulose Nitrate/Carbon Black Nanofiber Composite for Oil Spill Treatment. Biomass Convers. Biorefinery 2022, 2022, 1–19. [Google Scholar] [CrossRef]
- Li, A.; Wang, Y.; Deng, L.; Zhao, X.; Yan, Q.; Cai, Y.; Lin, J.; Bai, Y.; Liu, S.; Zhang, Y. Use of Nitrocellulose Membranes as a Scaffold in Cell Culture. Cytotechnology 2013, 65, 71–81. [Google Scholar] [CrossRef] [Green Version]
- Mischnick, P.; Momcilovic, D. Chemical Structure Analysis of Starch and Cellulose Derivatives. Adv. Carbohydr. Chem. Biochem. 2010, 64, 117–210. [Google Scholar] [CrossRef]
- Moore, W.R. Thermodynamic Properties of Dilute Solutions of Cellulose Derivatives. Text. Res. J. 1960, 30, 965–976. [Google Scholar] [CrossRef]
- Gensh, K.V.; Kolosov, P.V.; Bazarnova, N.G. Quantitative Analysis of Cellulose Nitrates by Fourier Transform Infrared Spectroscopy. Russ. J. Bioorganic Chem. 2011, 37, 814–816. [Google Scholar] [CrossRef]
- Kovalenko, V.I. Inhomogeneity in the Molecular Structure of Cellulose Nitrates. Russ. Chem. Rev. 1995, 64, 753–766. [Google Scholar] [CrossRef]
- Sakovich, G.V.; Mikhailov, Y.M.; Budaeva, V.V.; Korchagina, A.A.; Gismatulina, Y.A.; Kozyrev, N.V. Cellulose Nitrates from Unconventional Feedstocks. Dokl. Chem. 2018, 483, 287–291. [Google Scholar] [CrossRef]
- Gismatulina, Y.A.; Gladysheva, E.K.; Budaeva, V.V.; Sakovich, G.V. Synthesis of Bacterial Cellulose Nitrates. Russ. Chem. Bull. 2019, 68, 2130–2133. [Google Scholar] [CrossRef]
- Curran, K.; Možir, A.; Underhill, M.; Gibson, L.T.; Fearn, T.; Strlič, M. Cross-Infection Effect of Polymers of Historic and Heritage Significance on the Degradation of a Cellulose Reference Test Material. Polym. Degrad. Stab. 2014, 107, 294–306. [Google Scholar] [CrossRef] [Green Version]
- Mishta, P.V.; Vershinina, I.P.; Shchukina, A.G.; Ryabchuk, G.V. Experimental Study of the Flow of Solutions of Cellulose Nitrate in a Tube Rotating about Its Own Axis. Chem. Pet. Eng. 2012, 48, 499–502. [Google Scholar] [CrossRef]
- Louvet, A.; Lavedrine, B.; Flieder, F. Size Exclusion Chromatography and Mass Spectrometry of Photographic Bases in Cellulose Nitrate Degradation. J. Photogr. Sci. 1995, 43, 30–35. [Google Scholar] [CrossRef]
- Soubelet, O.; Presta, M.A.; Marx-Figini, M. SEC on Cellulose Nitrate: DP-Ve Relationship and Evaluation of Different Methods to Determine the Calibration Parameters. Die Angew. Makromol. Chem. 1990, 175, 117–128. [Google Scholar] [CrossRef]
- Mazurek, J.; Laganà, A.; Dion, V.; Etyemez, S.; Carta, C.; Schilling, M.R. Investigation of Cellulose Nitrate and Cellulose Acetate Plastics in Museum Collections Using Ion Chromatography and Size Exclusion Chromatography. J. Cult. Herit. 2019, 35, 263–270. [Google Scholar] [CrossRef]
- Schelosky, N.; Roder, T.; Baldinger, T. Molecular Mass Distribution of Cellulosic Products by Size Exclusion Chromatography in DMAc/LiCl. Papier 1999, 53, 728–738. [Google Scholar]
- Henniges, U.; Vejdovszky, P.; Siller, M.; Jeong, M.-J.; Rosenau, T.; Potthast, A. Finally Dissolved! Activation Procedures to Dissolve Cellulose in DMAc/LiCl Prior to Size Exclusion Chromatography Analysis–A Review. Curr. Chromatogr. 2014, 1, 52–68. [Google Scholar] [CrossRef]
- Brooks, M.C.; Badger, R.M. Partition Systems for the Fractionation of Nitrocellulose with Respect to Molecular Weight 1,2. J. Am. Chem. Soc. 1950, 72, 1705–1709. [Google Scholar] [CrossRef]
- Liu, J. Nitrocellulose. In Nitrate Esters Chemistry and Technology; Springer Singapore: Singapore, 2019; pp. 469–580. [Google Scholar]
- Büchner, E.H.; Samwel, P.J.P. The Molecular Weight of Acetocellulose and Nitrocellulose. Trans. Faraday Soc. 1933, 29, 32–40. [Google Scholar] [CrossRef]
- Spurlin, H.M. Homogeneity and Properties of Nitrocellulose. Ind. Eng. Chem. 1938, 30, 538–542. [Google Scholar] [CrossRef]
- Mitchell, R.L. Precipitation Fractionation of Cellulose Nitrate. Ind. Eng. Chem. 1953, 45, 2526–2531. [Google Scholar] [CrossRef]
- Lindsley, C.H.; Frank, M.B. Intrinsic Viscosity of Nitrocellulose. Ind. Eng. Chem. 1953, 45, 2491–2497. [Google Scholar] [CrossRef]
- Oberlerchner, J.; Rosenau, T.; Potthast, A. Overview of Methods for the Direct Molar Mass Determination of Cellulose. Molecules 2015, 20, 10313–10341. [Google Scholar] [CrossRef]
- Siochi, E.J.; Ward, T.C. Absolute Molecular Weight Distribution of Nitrocellulose. J. Macromol. Sci. Part C Polym. Rev. 1989, 29, 561–657. [Google Scholar] [CrossRef]
- Sedlák, M. Large-Scale Supramolecular Structure in Solutions of Low Molar Mass Compounds and Mixtures of Liquids: I. Light Scattering Characterization. J. Phys. Chem. B 2006, 110, 4329–4338. [Google Scholar] [CrossRef]
- Ewart, R.H.; Roe, C.P.; Debye, P.; McCartney, J.R. The Determination of Polymeric Molecular Weights by Light Scattering in Solvent-Precipitant Systems. J. Chem. Phys. 1946, 14, 687–695. [Google Scholar] [CrossRef]
- Vshivkov, S.A.; Safronov, A.P.; Rusinova, E.V.; Adamova, L.V.; Lvovich, A.N.; Stepanovna, T.I.; Vyacheslavovna, T.T.; Gennadyevich, G.A. Methods of Investigation of Polymer Systems; Ural University Publishing House: Ekaterinburg, Russia, 2016. [Google Scholar]
- Blaker, R.H.; Badger, R.M. A Study of the Interaction of Nitrocellulose with Some Solvents and Non-Solvents by the Light-Scattering Method 1. J. Am. Chem. Soc. 1950, 72, 3129–3132. [Google Scholar] [CrossRef]
- Fan, W.; Zhou, J.; Ding, Y.; Xiao, Z. Fabrication and Mechanism Study of the Nitrocellulose Aqueous Dispersions by Solvent Displacement Method. J. Appl. Polym. Sci. 2023, 140, e53290. [Google Scholar] [CrossRef]
- Stetefeld, J.; McKenna, S.A.; Patel, T.R. Dynamic Light Scattering: A Practical Guide and Applications in Biomedical Sciences. Biophys. Rev. 2016, 8, 409–427. [Google Scholar] [CrossRef] [PubMed]
- Zakharov, P.; Scheffold, F. Advances in Dynamic Light Scattering Techniques. In Light Scattering Reviews 4; Springer: Berlin/Heidelberg, Germany, 2009; pp. 433–467. [Google Scholar]
- Murphy, R.M. Static and Dynamic Light Scattering of Biological Macromolecules: What Can We Learn? Curr. Opin. Biotechnol. 1997, 8, 25–30. [Google Scholar] [CrossRef] [PubMed]
- Goldburg, W.I. Dynamic Light Scattering. Am. J. Phys. 1999, 67, 1152–1160. [Google Scholar] [CrossRef] [Green Version]
- Huque, M.M.; Goring, D.A.I.; Mason, S.G. Molecular Size and Configuration of Cellulose Trinitrate in Solution. Can. J. Chem. 1958, 36, 952–969. [Google Scholar] [CrossRef] [Green Version]
- Litmanovich, E.A.; Ivleva, E.M. The Problem of Bimodal Distributions in Dynamic Light Scattering: Theory and Experiment. Polym. Sci. Ser. A 2010, 52, 671–678. [Google Scholar] [CrossRef]
- Fengl, R. Cellulose Esters, Inorganic Esters. In Kirk-Othmer Encyclopedia of Chemical Technology; John Wiley & Sons, Inc.: Hoboken, NJ, USA, 2000; pp. 394–408. [Google Scholar]
- Imashevna, S.R. Chemistry of Nitrate Ethers of Cellulose; Frunze: Ilim, Kyrgyzstan, 1985. [Google Scholar]
- Pozharsky, A.F.; Anisimova, V.A.; Tsupak, E.B. Practical Work on the Chemistry of Heterocycles; Forest Industry: Moscow, Russia, 1988. [Google Scholar]
- Nikitin, V.M.; Obolenskaya, A.V.; Shchegolev, V.P. Chemicals Woods and Cellulose; Forest Industry: Moscow, Russia, 1978. [Google Scholar]
- Itakura, M.; Shimada, K.; Matsuyama, S.; Saito, T.; Kinugasa, S. A Convenient Method to Determine the Rayleigh Ratio with Uniform Polystyrene Oligomers. J. Appl. Polym. Sci. 2006, 99, 1953–1959. [Google Scholar] [CrossRef]
- Itakura, M.; Sato, K.; Lusenkova, M.A.; Matsuyama, S.; Shimada, K.; Saito, T.; Kinugasa, S. Molecular Weight Dependency of Refractive Index Increment of Polystyrene Determined by Uniform Oligomers. J. Appl. Polym. Sci. 2004, 94, 1101–1106. [Google Scholar] [CrossRef]
- Tanford, C. Physical Chemistry of Macromolecules; John Wiley & Sons, Inc.: New York, NY, USA, 1961; ISBN 0-471-84447-0. [Google Scholar]
- Debye, P. Light Scattering in Solutions. J. Appl. Phys. 1944, 15, 338–342. [Google Scholar] [CrossRef]
- Zimm, B.H. Molecular Theory of the Scattering of Light in Fluids. J. Chem. Phys. 1945, 13, 141–145. [Google Scholar] [CrossRef]
- Saldívar-Guerra, E.; Vivaldo-Lima, E. (Eds.) Handbook of Polymer Synthesis, Characterization, and Processing; John Wiley & Sons, Inc.: Hoboken, NJ, USA, 2013; ISBN 9781118480793. [Google Scholar]
- Kolmakov, K.M.; Kozlov, G.V.; Rozen, A.E.; Roshchin, A.V.; Bloshenko, A.V. Chemical Recycling of Cellulose Nitrate Waste. Russ. J. Phys. Chem. B 2017, 11, 691–696. [Google Scholar] [CrossRef]


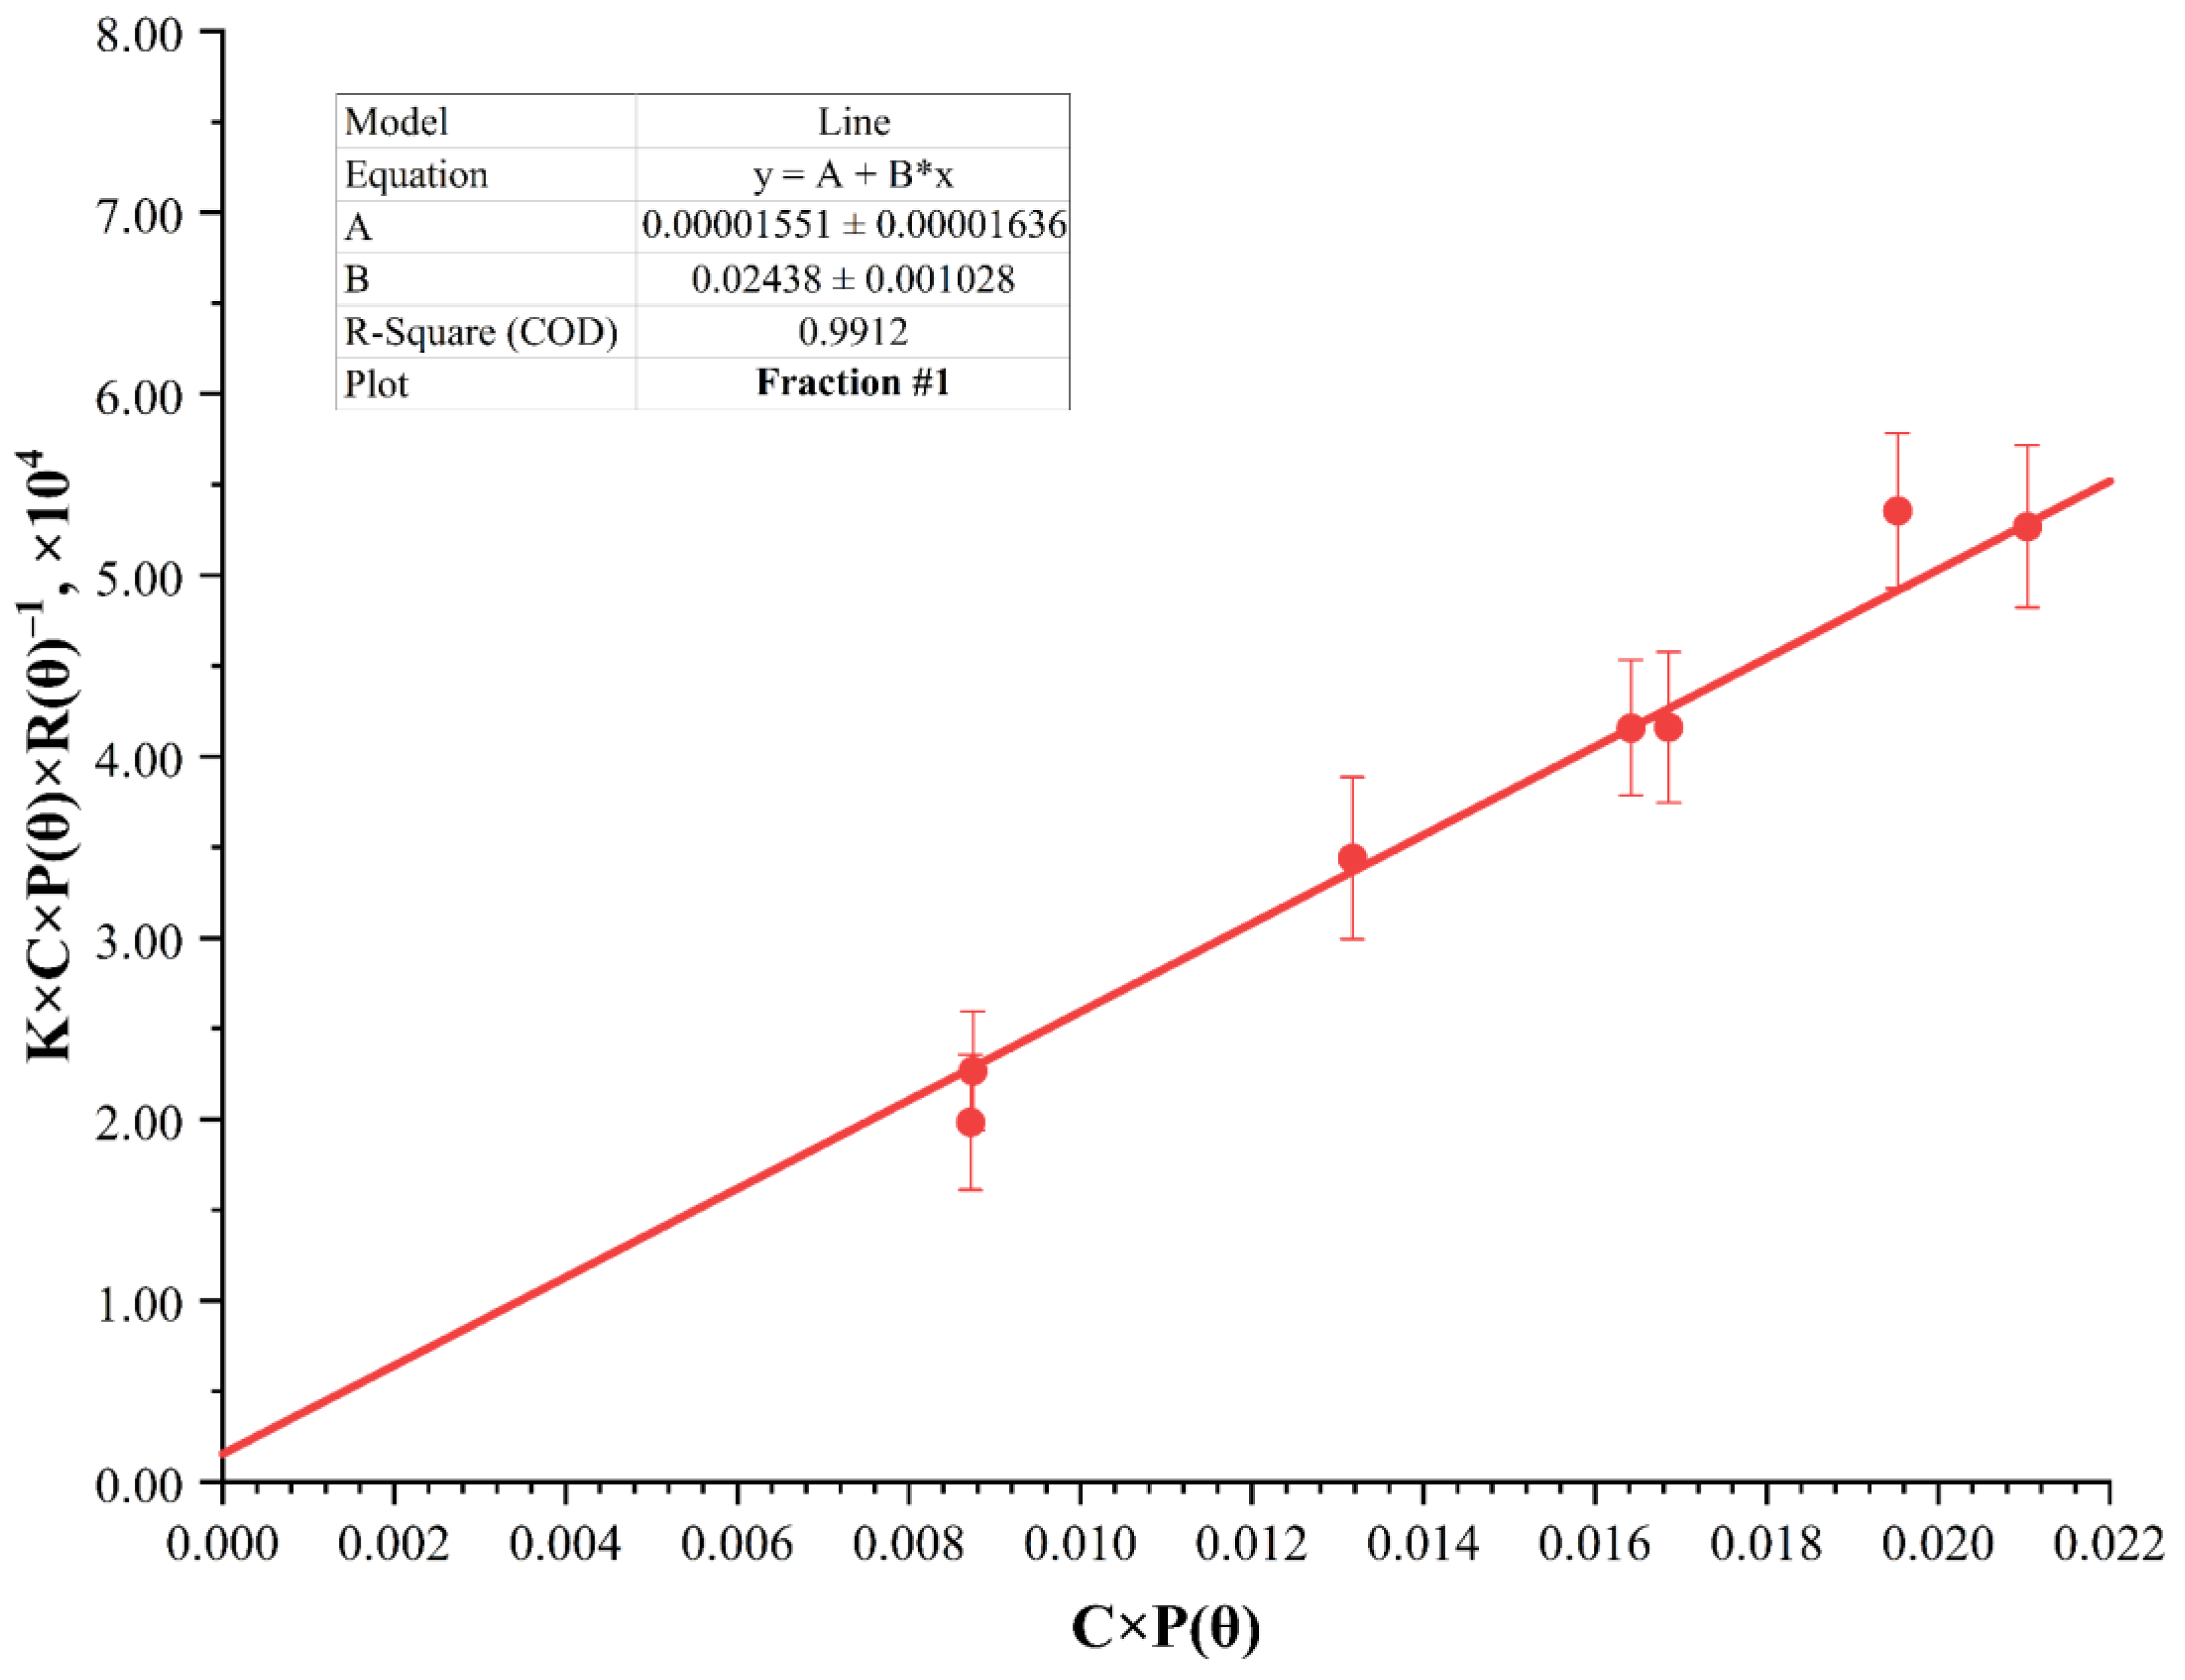
| C, g/100 mL | I(X), % | D, nm | P(θ) | R(θ) | K | C·P(θ) | K·C·P(θ)·R(θ)−1 × 10⁴ |
|---|---|---|---|---|---|---|---|
| 0.0100 | 2.879 | 1425 | 2.104 | 85.26 | 2.135 | 0.02104 | 5.27 ± 0.45 |
| 0.00900 | 2.920 | 1267 | 1.873 | 86.48 | 2.135 | 0.01686 | 4.16 ± 0.42 |
| 0.00800 | 2.760 | 1090 | 1.646 | 81.74 | 2.135 | 0.01317 | 3.44 ± 0.45 |
| 0.00700 | 2.847 | 1573 | 2.345 | 84.31 | 2.135 | 0.01642 | 4.16 ± 0.37 |
| 0.00600 | 2.628 | 2036 | 3.254 | 77.84 | 2.135 | 0.01952 | 5.35 ± 0.43 |
| 0.00500 | 2.781 | 1174 | 1.749 | 82.36 | 2.135 | 0.008745 | 2.27 ± 0.33 |
| 0.00400 | 3.958 | 1473 | 2.179 | 117.2 | 2.135 | 0.008717 | 1.98 ± 0.37 |
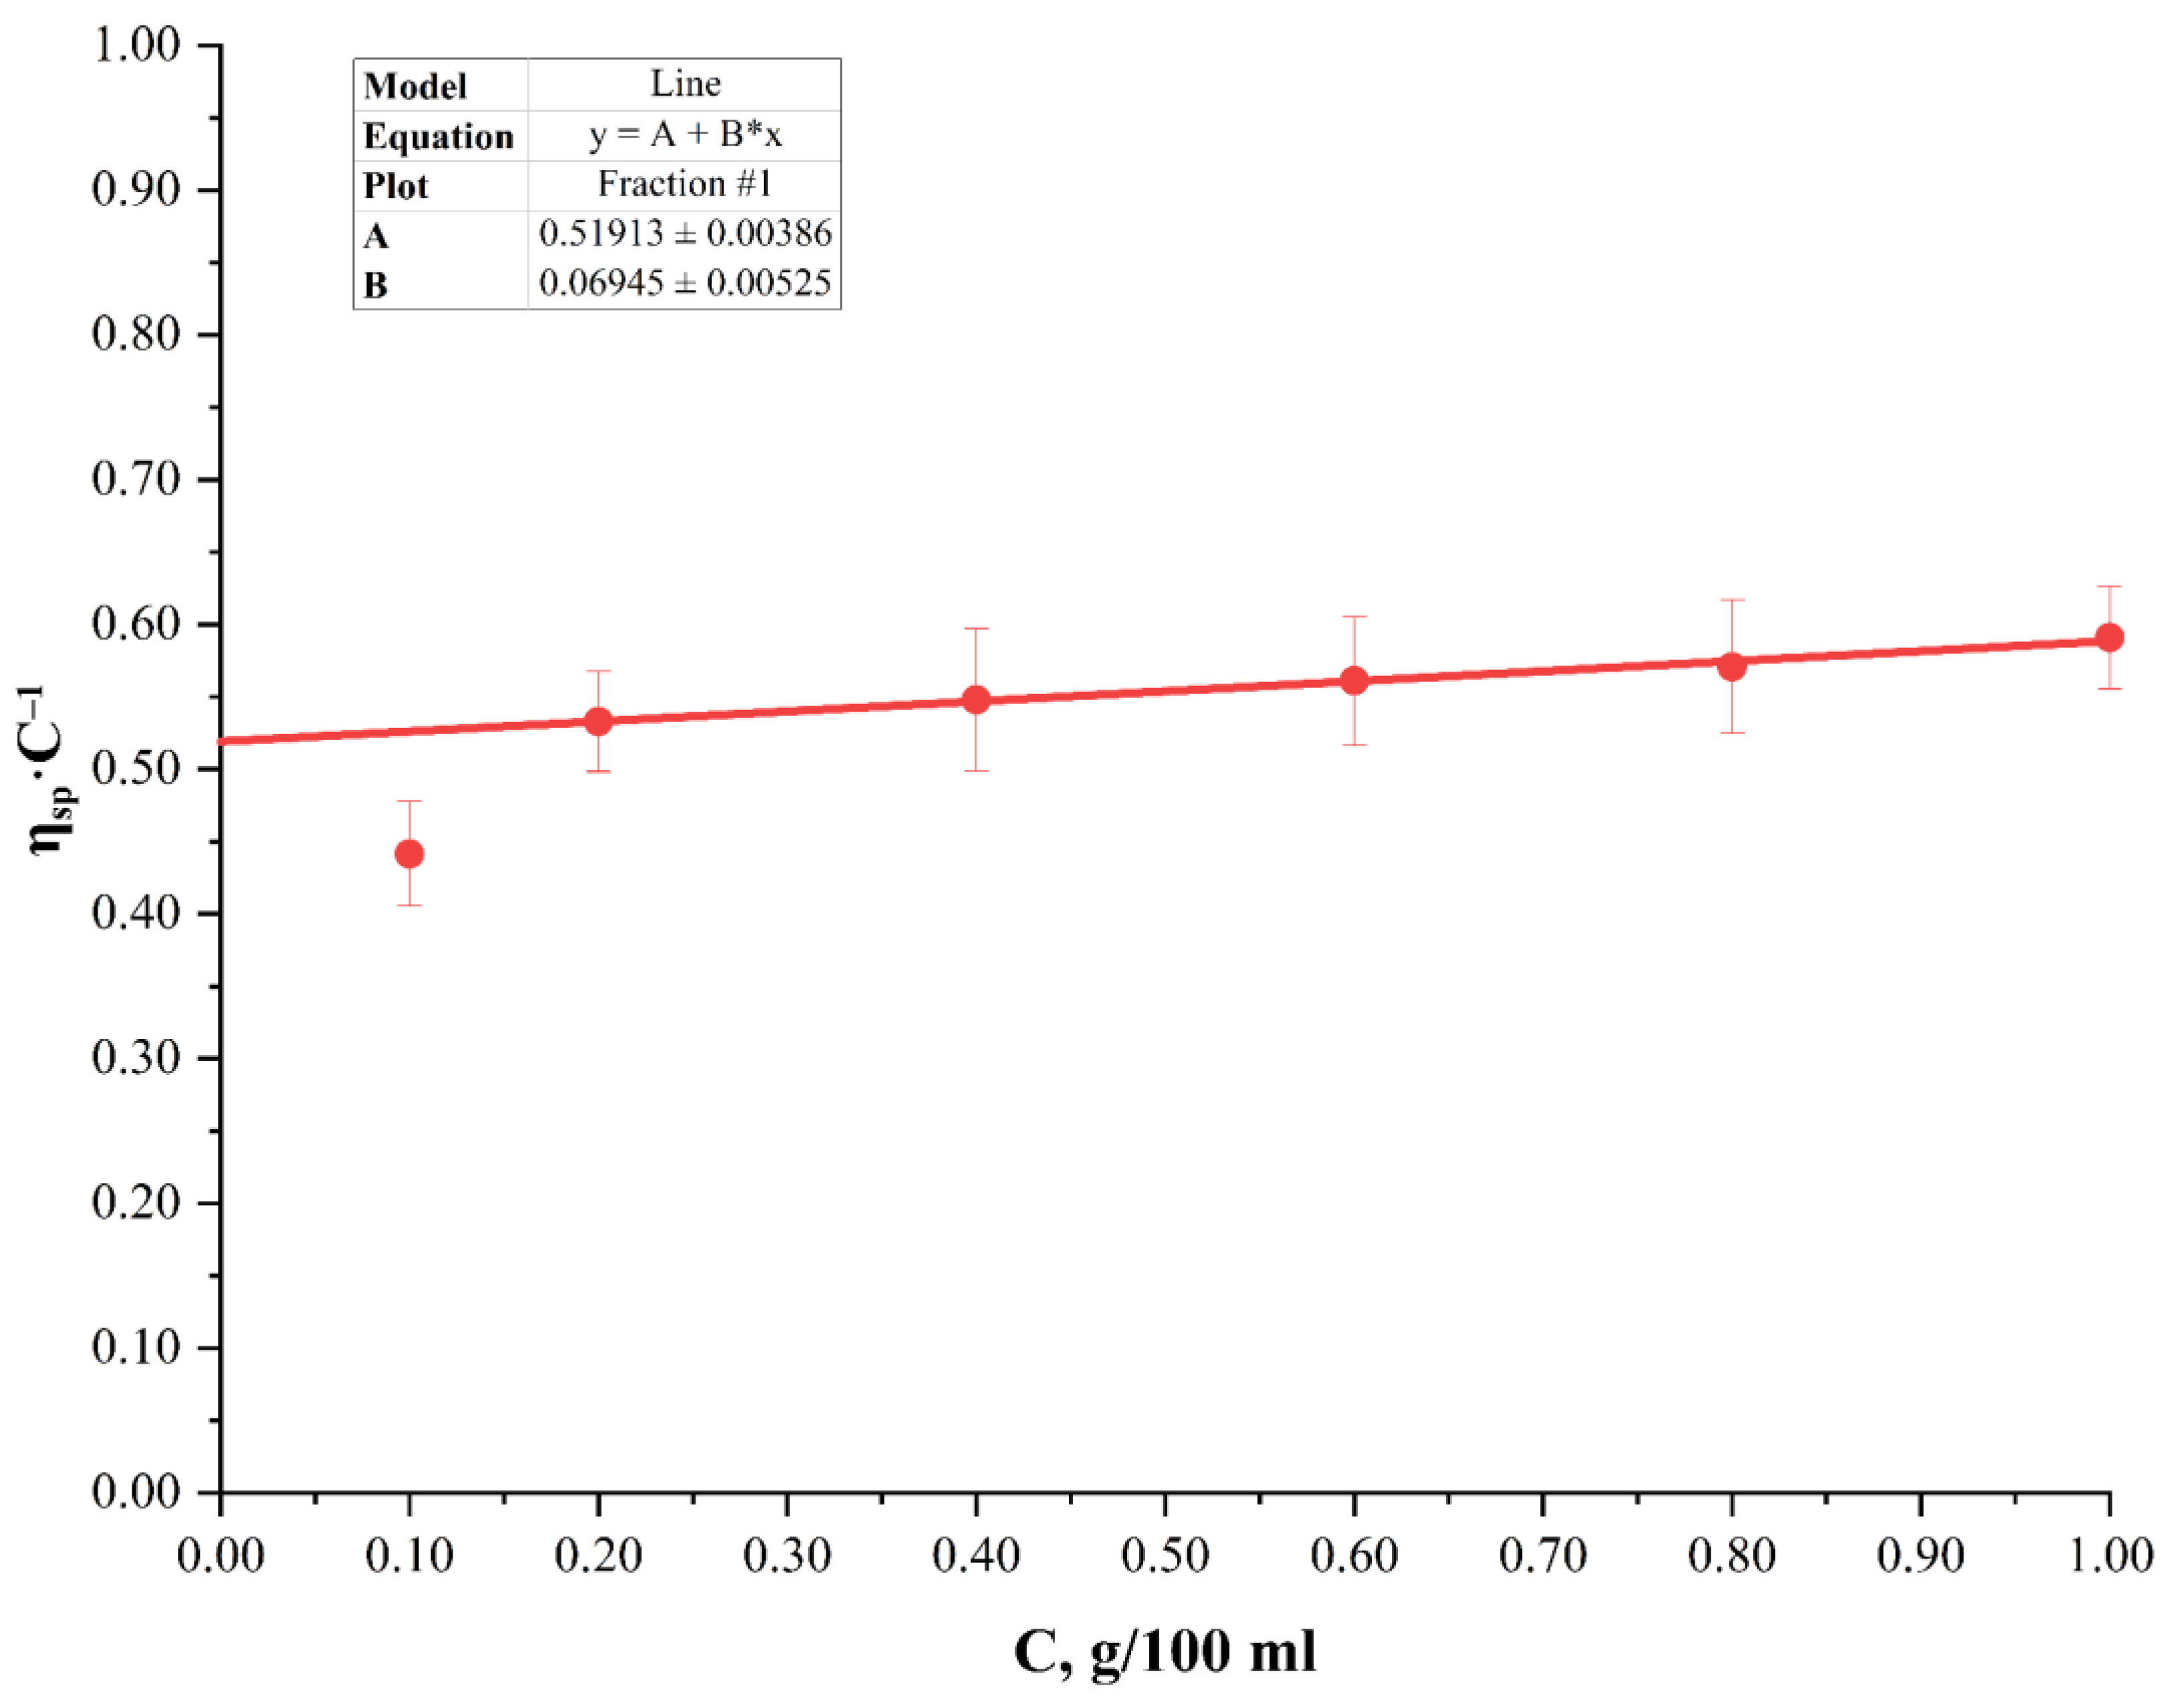
| Fraction | Nitrogen Content in CellNO3, % by Weight | Specific Viscosity [η]sp | Coefficient Rω(N)13.6 | Corrected Intrinsic Viscosity [η]13.6 | Degree of Polymerization Pη |
|---|---|---|---|---|---|
| 1 | 8.39 ± 0.46 | 0.5191 | 5.090 | 2.643 | 264 |
| 2 | 9.60 ± 0.55 | 0.3936 | 3.513 | 1.383 | 138 |
| 3 | 9.68 ± 0.58 | 0.3462 | 3.426 | 1.186 | 119 |
| 4 | 9.27 ± 0.44 | 0.1903 | 3.881 | 0.7384 | 73.8 |
| 5 | 9.66 ± 0.40 | 0.1796 | 3.448 | 0.6195 | 61.9 |
| 6 | 9.87 ± 0.47 | 0.09024 | 3.227 | 0.2912 | 29.1 |
| Molecular Formula of Nitrocellulose | Molar Mass of CellNO3, Da | Nitrogen Content in CellNO3, % by Weight | Mass Average Molar Mass of CellNO3 Monomer Unit, Da |
|---|---|---|---|
| C24H28O8(NO3)12 | 1188.5 | 14.14 | 297.1 |
| C24H29O9(NO3)11 | 1143.5 | 13.47 | 285.9 |
| C24H30O10(NO3)10 | 1098.5 | 12.75 | 274.6 |
| C24H31O11(NO3)9 | 1053.5 | 11.97 | 263.4 |
| C24H32O12(NO3)8 | 1008.5 | 11.11 | 252.1 |
| C24H33O13(NO3)7 | 963.5 | 10.18 | 240.9 |
| C24H34O14(NO3)6 | 918.5 | 9.15 | 229.6 |
| C24H35O15(NO3)5 | 873.5 | 8.02 | 218.4 |
| C24H36O16(NO3)4 | 828.6 | 6.76 | 207.1 |
| C24H37O17(NO3)3 | 783.6 | 5.36 | 195.9 |
| C24H38O18(NO3)2 | 738.6 | 3.79 | 184.6 |
| Fraction | Nitrogen Content in CellNO3, % by Weight | Viscosity-Average Degree of Polymerization Pη | Mass Average Molar Mass of a CellNO3 Molecular Unit, Da | Viscosity-Average Molar Mass Mη, kDa | Mass Average Molar Mass Determined by the Dynamic Light Scattering Method, MW, kDa |
|---|---|---|---|---|---|
| 1 | 8.39 ± 0.46 | 264 | 222.0 | 58.7 ± 11.3 | 64.5 ± 17.0 |
| 2 | 9.60 ± 0.55 | 138 | 234.4 | 32.4 ± 6.1 | 37.0 ± 8.6 |
| 3 | 9.68 ± 0.58 | 119 | 235.3 | 27.9 ± 4.7 | 29.4 ± 9.9 |
| 4 | 9.27 ± 0.44 | 73.8 | 230.9 | 17.1 ± 1.8 | 22.2 ± 5.6 |
| 5 | 9.66 ± 0.40 | 61.9 | 235.1 | 14.6 ± 2.2 | 18.8 ± 6.3 |
| 6 | 9.87 ± 0.47 | 29.1 | 237.4 | 6.92 ± 1.10 | 7.98 ± 3.13 |
Disclaimer/Publisher’s Note: The statements, opinions and data contained in all publications are solely those of the individual author(s) and contributor(s) and not of MDPI and/or the editor(s). MDPI and/or the editor(s) disclaim responsibility for any injury to people or property resulting from any ideas, methods, instructions or products referred to in the content. |
© 2023 by the authors. Licensee MDPI, Basel, Switzerland. This article is an open access article distributed under the terms and conditions of the Creative Commons Attribution (CC BY) license (https://creativecommons.org/licenses/by/4.0/).
Share and Cite
Solovov, R.; Kazberova, A.; Ershov, B. Special Aspects of Nitrocellulose Molar Mass Determination by Dynamic Light Scattering. Polymers 2023, 15, 263. https://doi.org/10.3390/polym15020263
Solovov R, Kazberova A, Ershov B. Special Aspects of Nitrocellulose Molar Mass Determination by Dynamic Light Scattering. Polymers. 2023; 15(2):263. https://doi.org/10.3390/polym15020263
Chicago/Turabian StyleSolovov, Roman, Anfisa Kazberova, and Boris Ershov. 2023. "Special Aspects of Nitrocellulose Molar Mass Determination by Dynamic Light Scattering" Polymers 15, no. 2: 263. https://doi.org/10.3390/polym15020263