
Investigation of the Conditions for the Synthesis of Poly(3,4-ethylenedioxythiophene) ATRP Macroinitiator
 , and
, and
Abstract
:1. Introduction
2. Materials and Methods
2.1. Materials
2.2. Synthetic Procedures
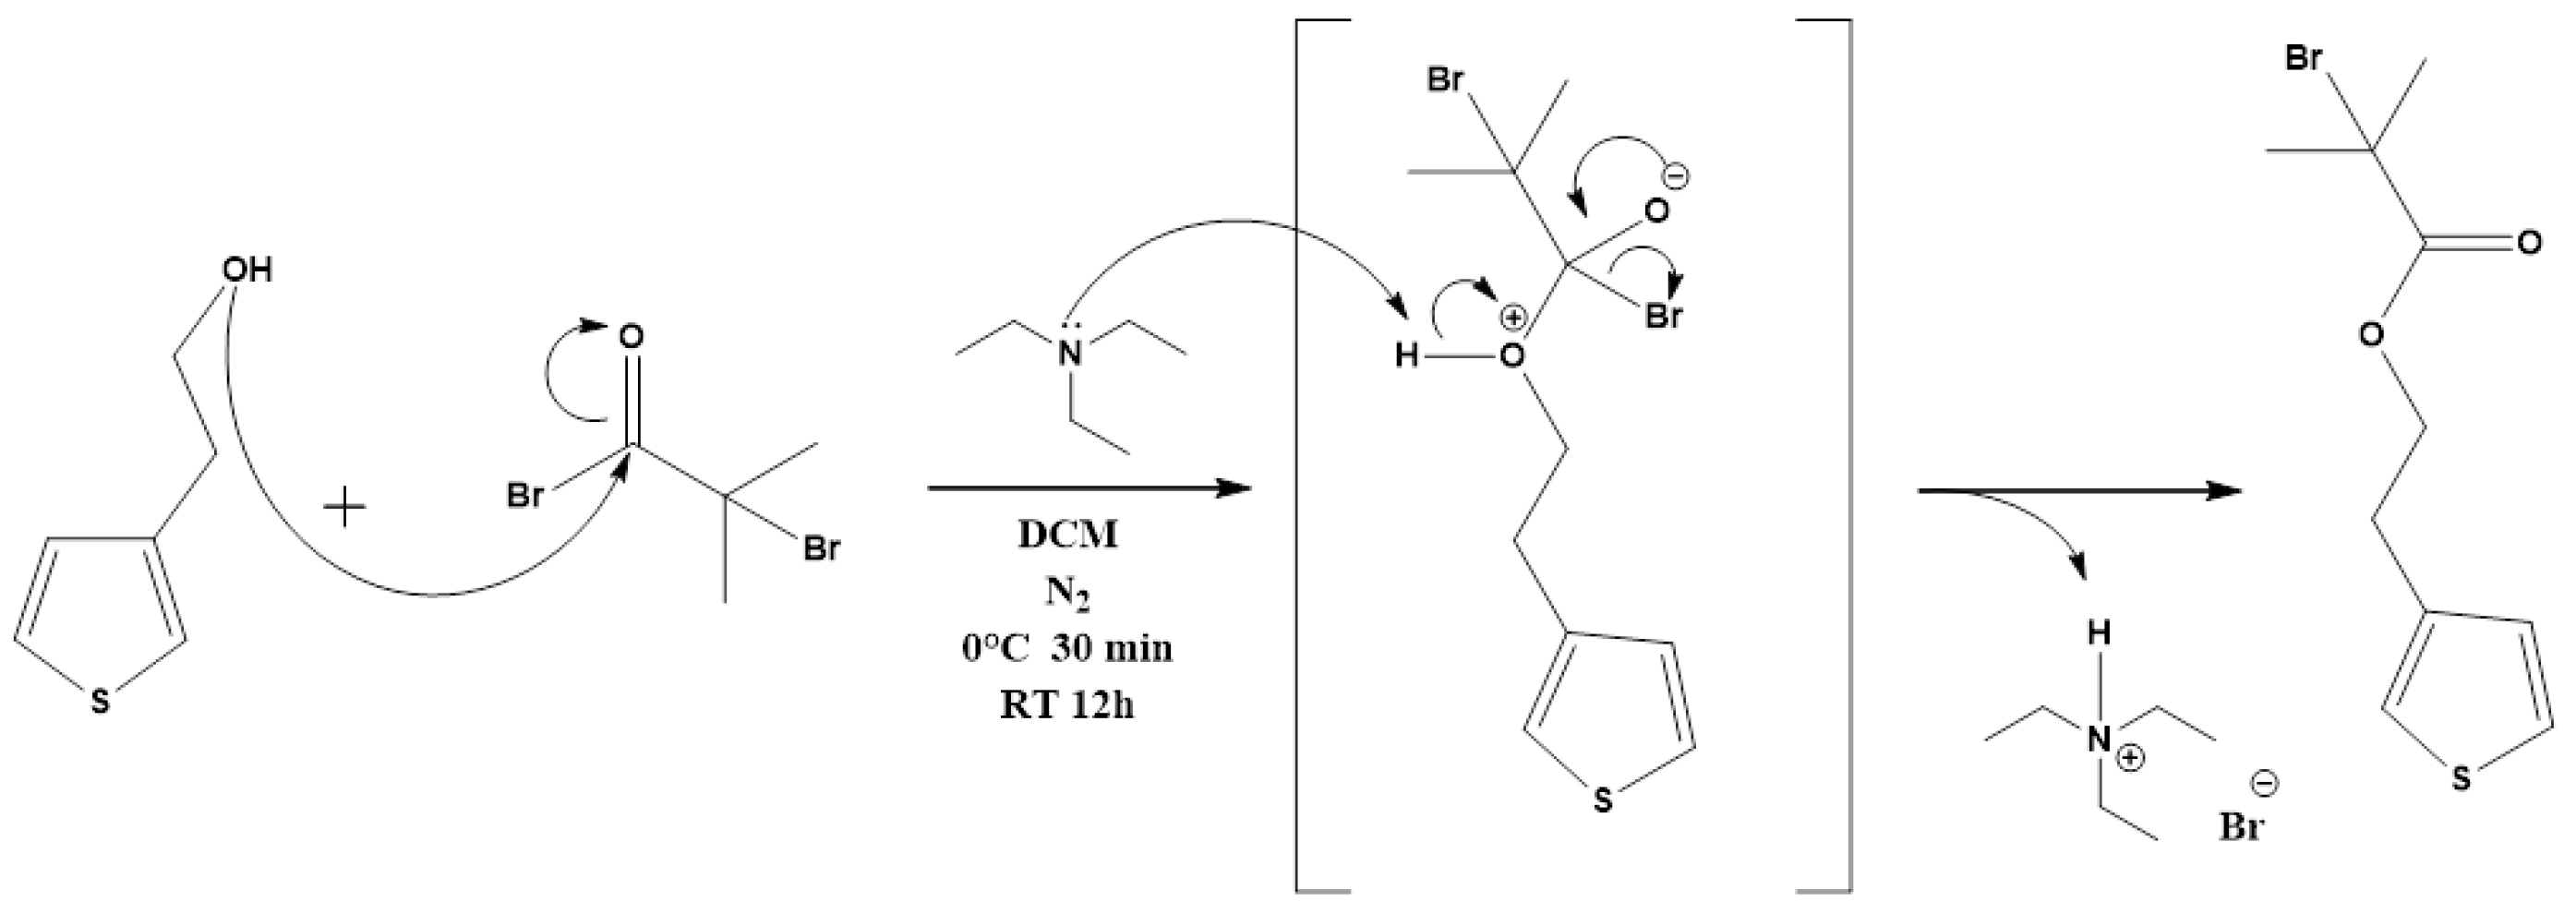
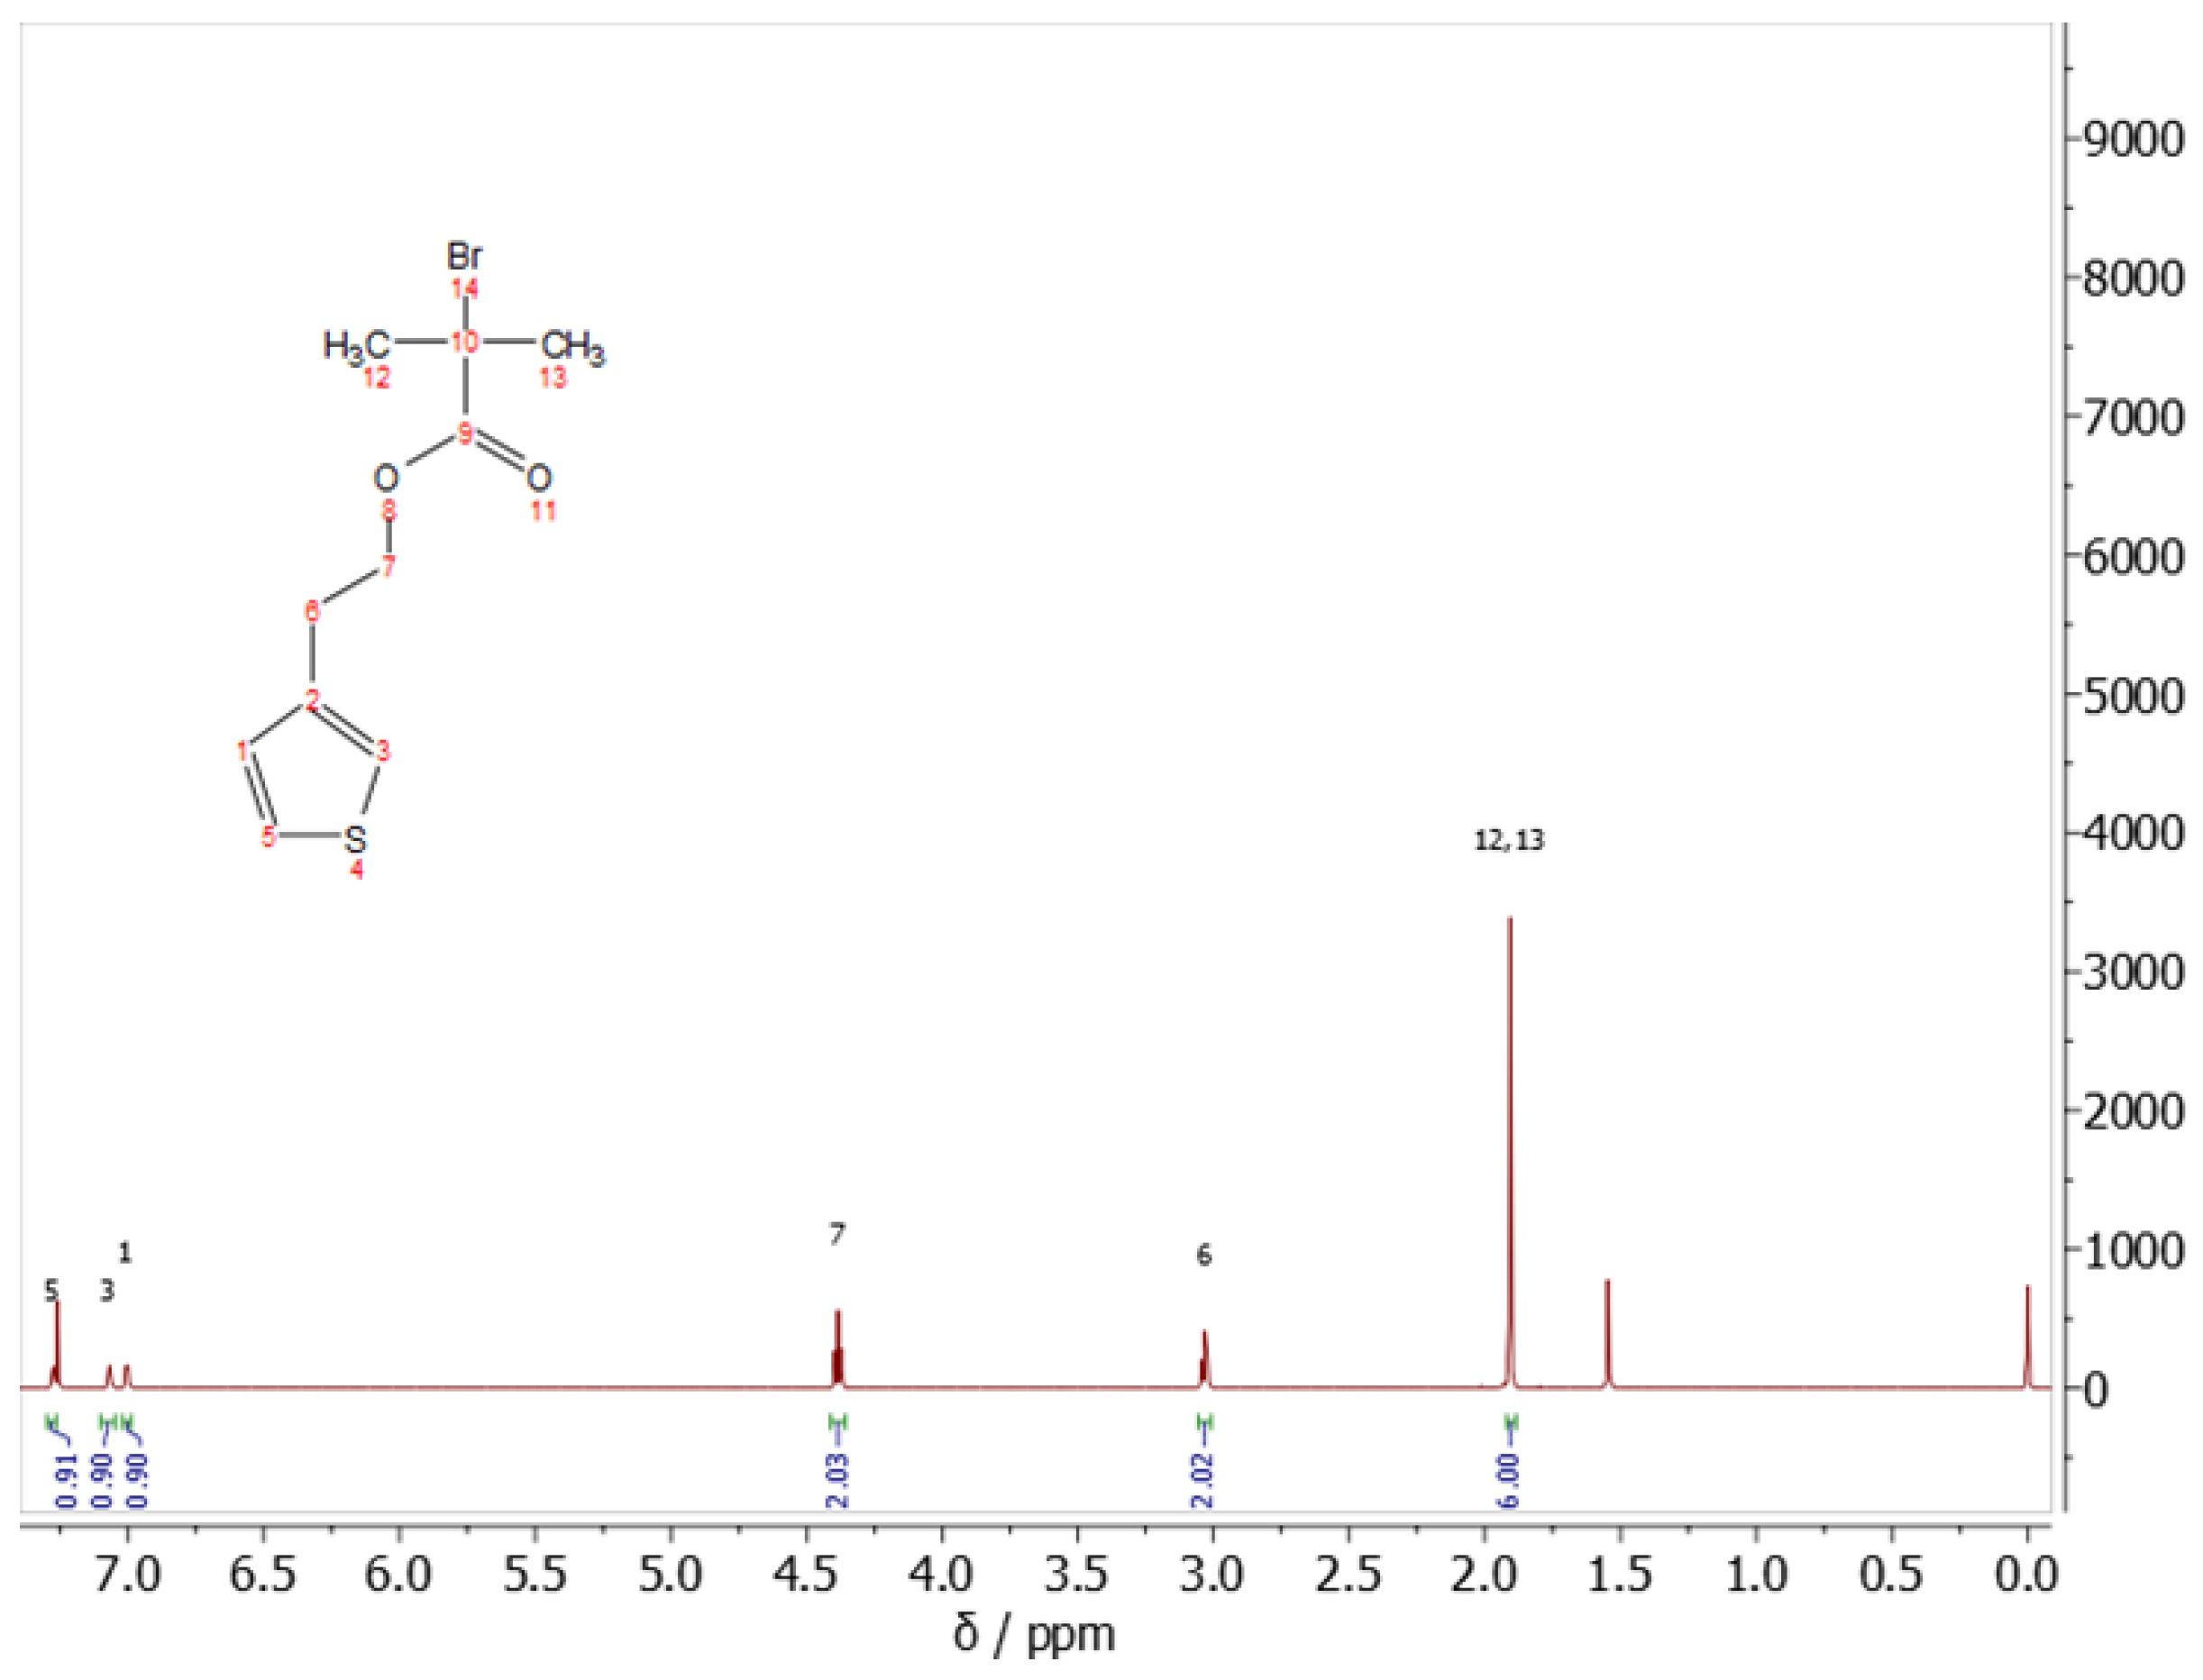
2.2.1. Synthesis of 2-(Thiophene-3-yl)ethyl 2-Bromo2-methylpropanoate (ThBr) Monomer
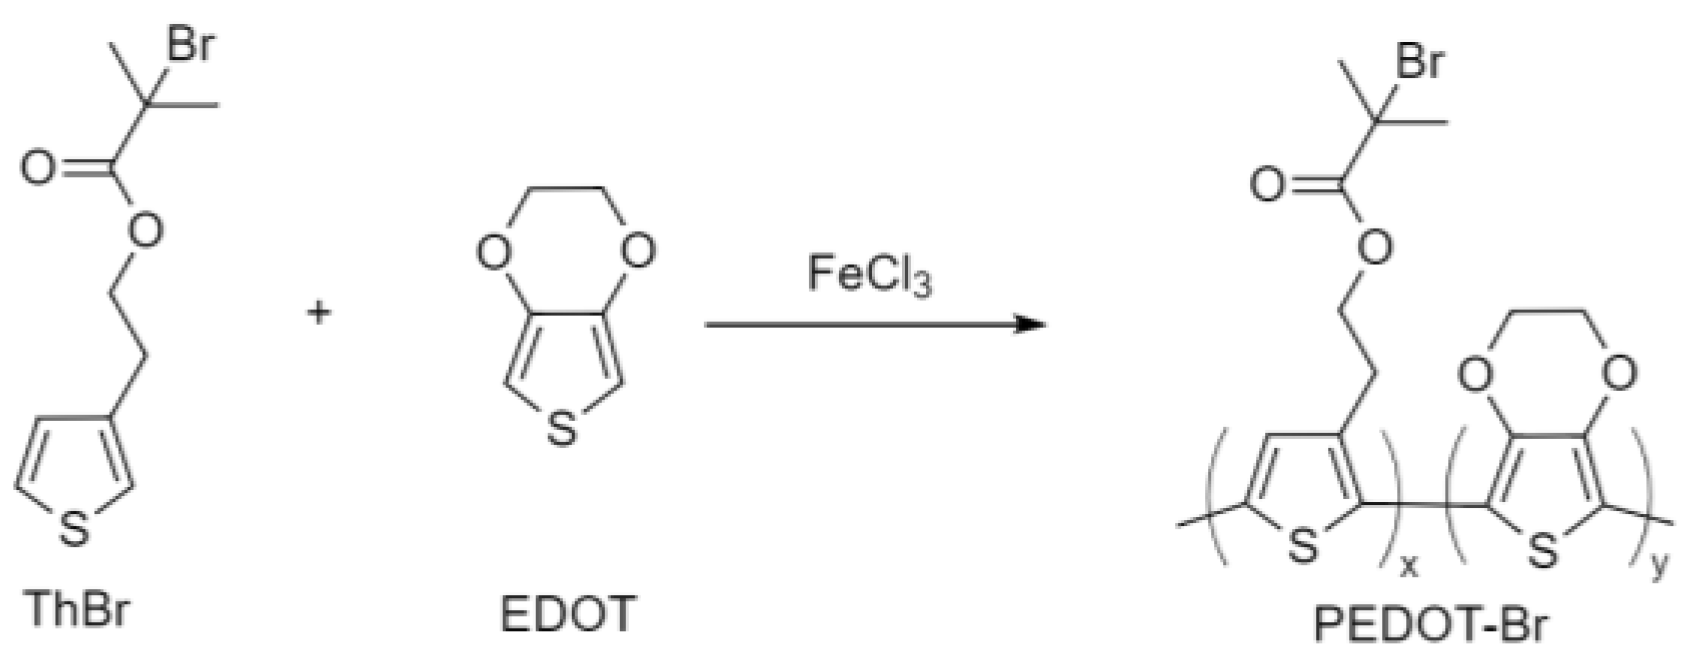
2.2.2. Synthesis of PEDOT-Br Macroinitiator with Different Synthesis Time
2.2.3. Synthesis of PEDOT-Br Macroinitiator with Different Monomer Ratios
2.3. Characterization and Instruments
2.3.1. Thermogravimetric Analysis (TGA)
2.3.2. Gel Permeation Chromatography (GPC)
2.3.3. Fourier-Transform Infrared Spectroscopy (FTIR)
2.3.4. X-ray Diffraction (XRD)
2.3.5. Nuclear Magnetic Resonances (NMR)
2.3.6. Scanning Electron Microscopy (SEM)
2.3.7. Four-Point Probe Method (4PP)
3. Results and Discussion
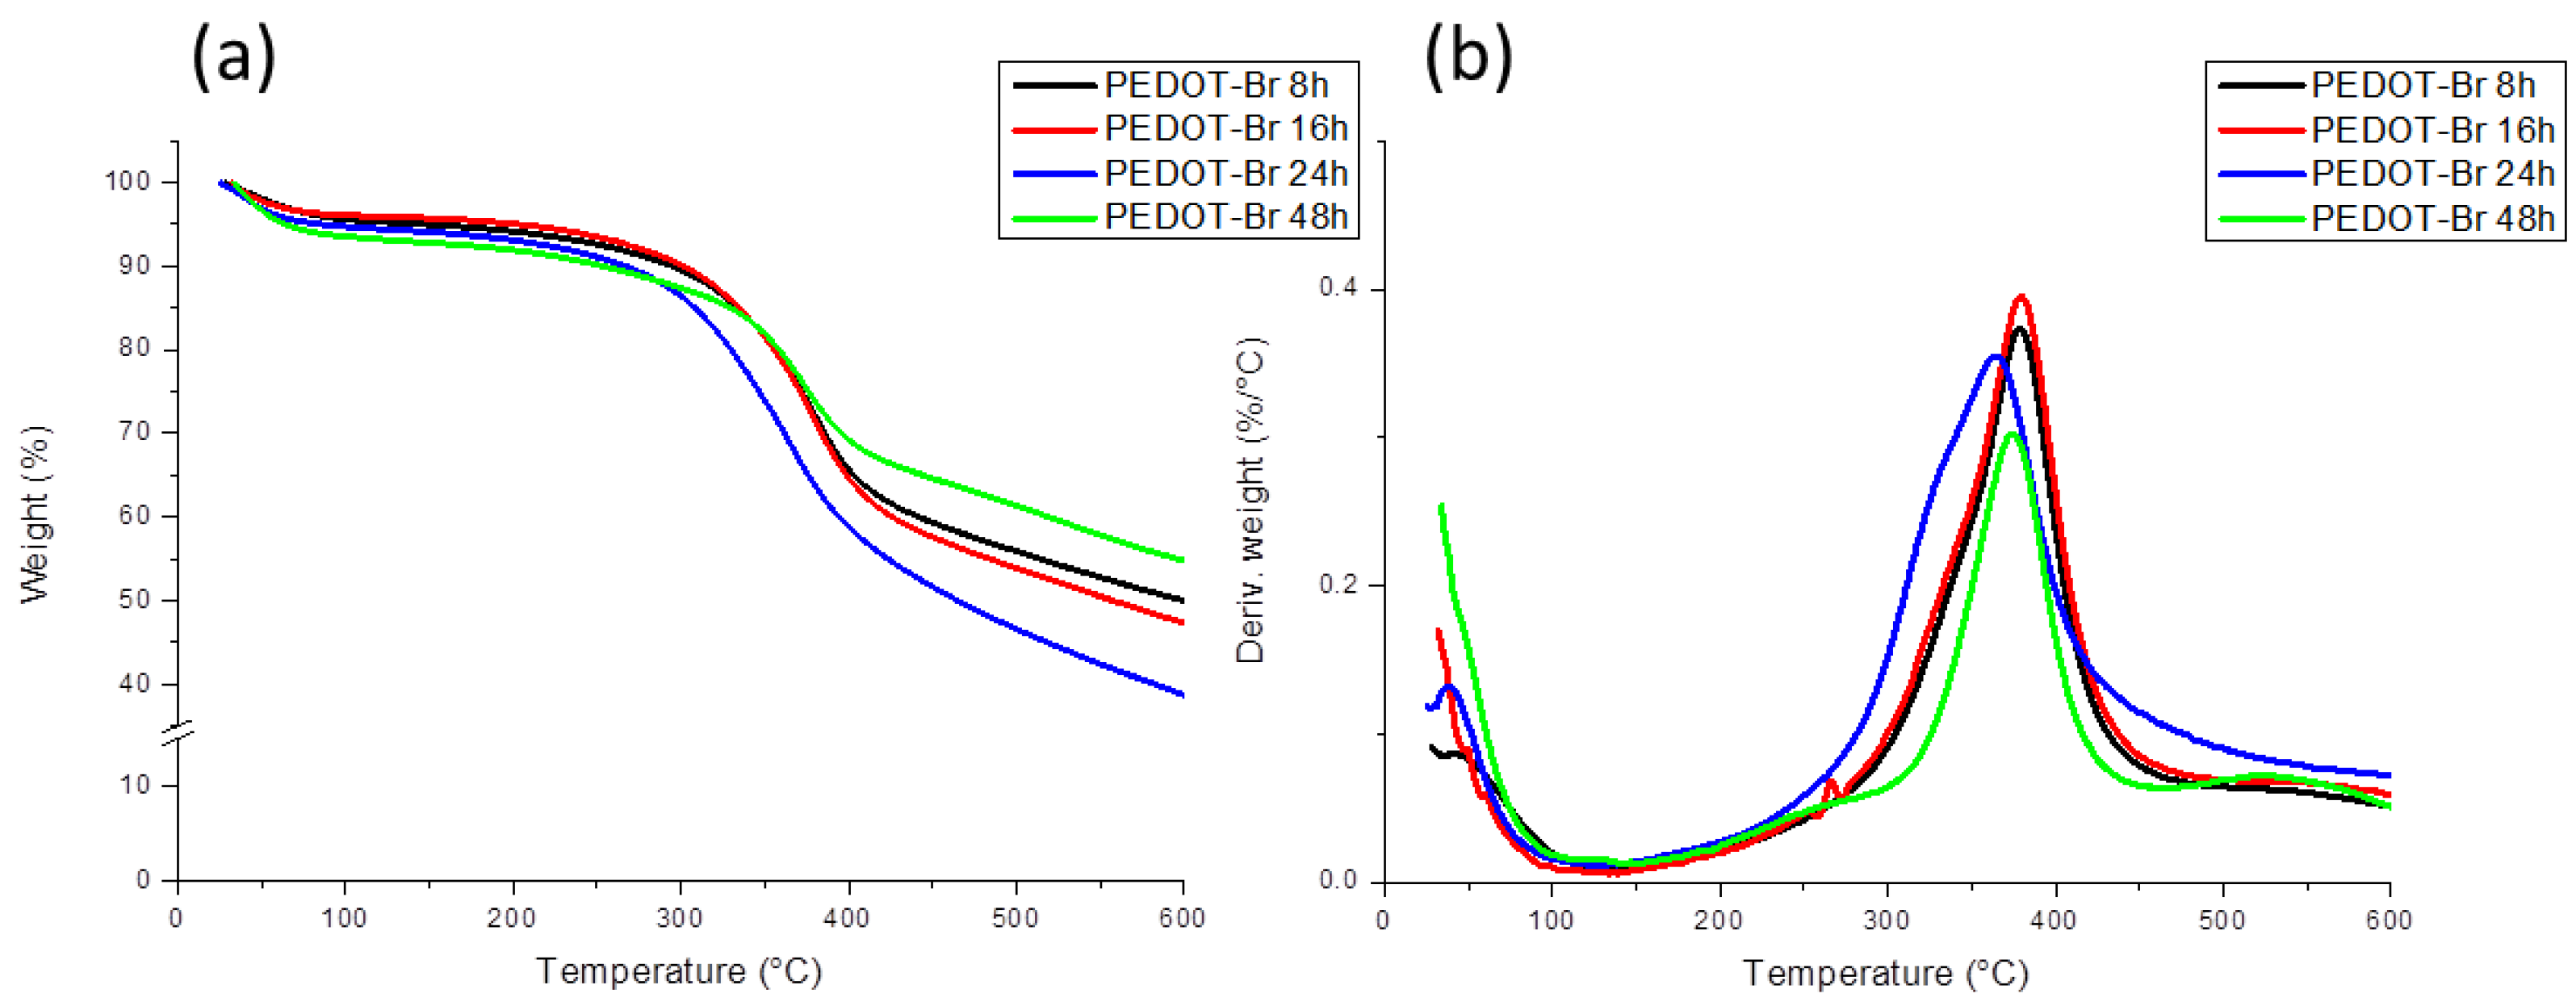
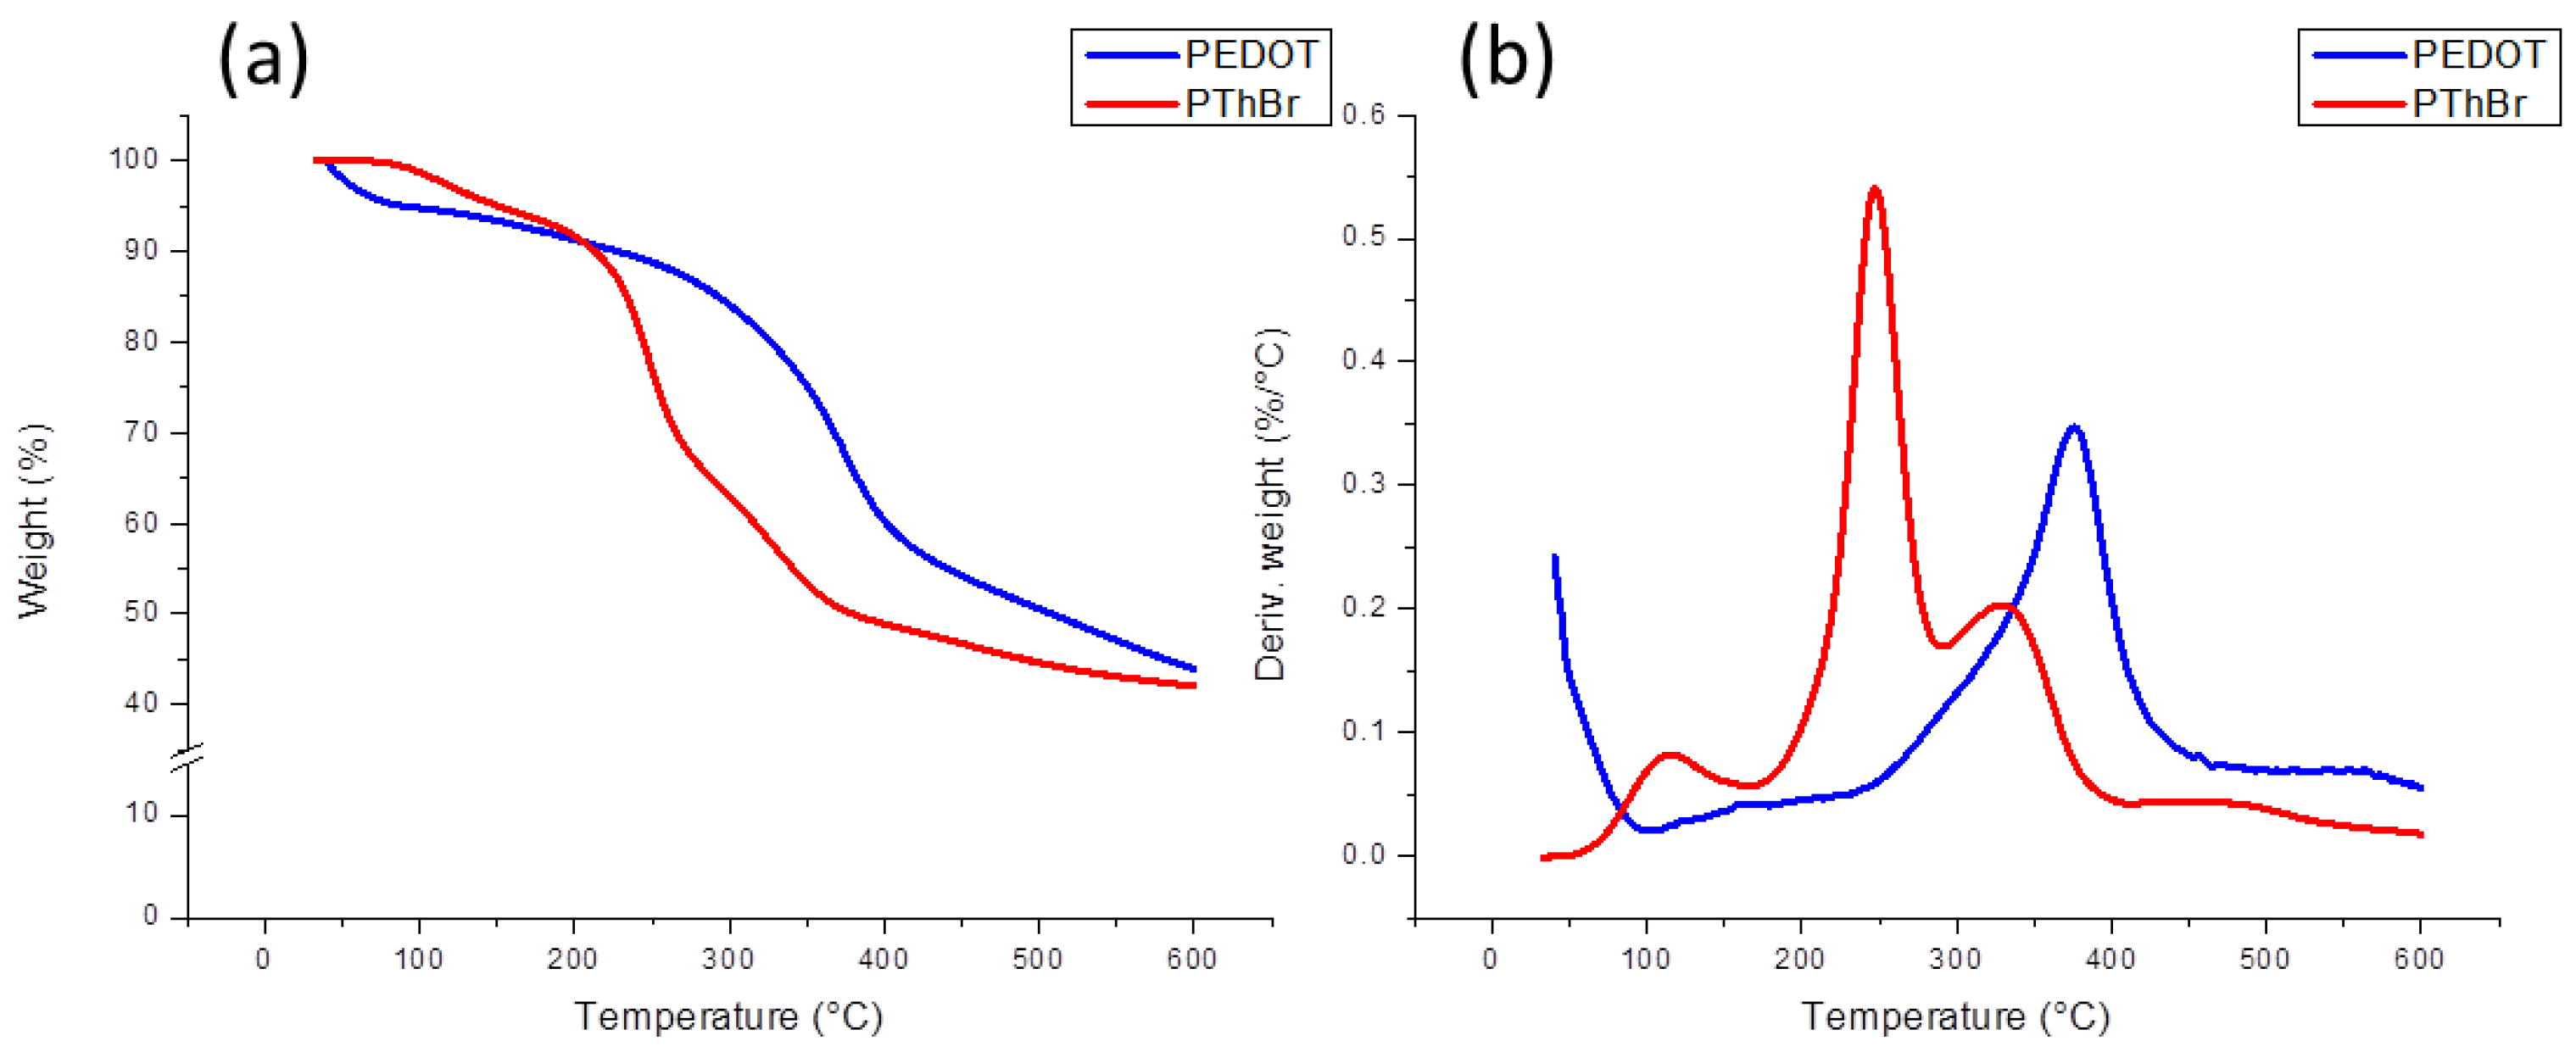
3.1. Thermogravimetric Analysis (TGA)
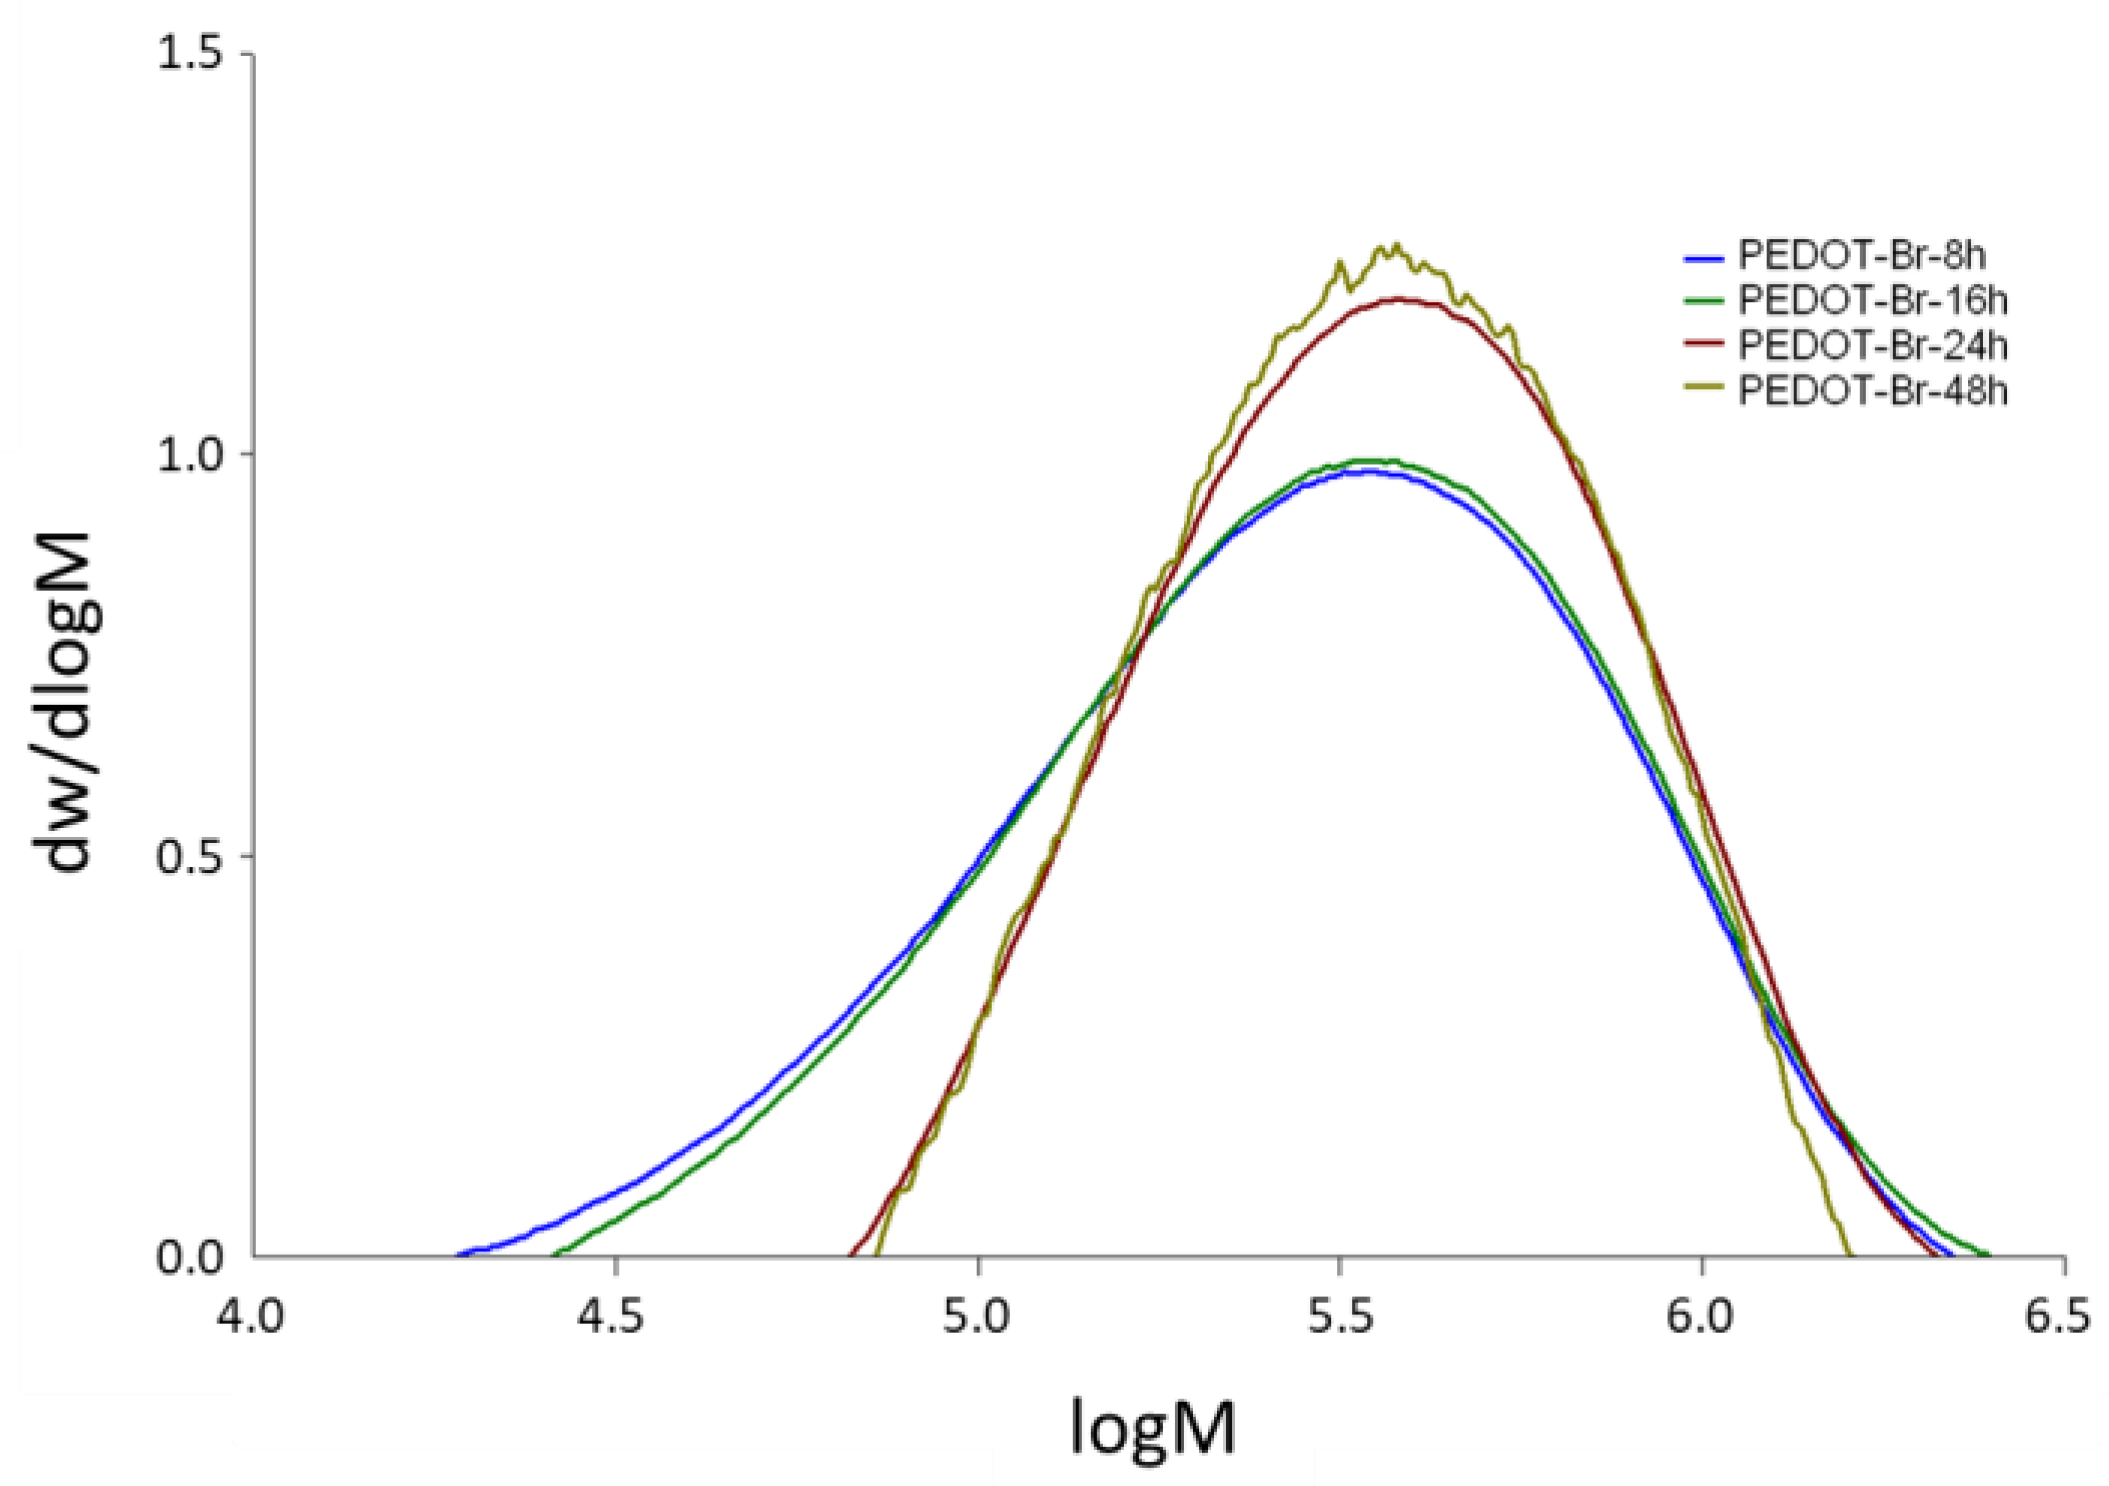
3.2. Gel Permeation Chromatography (GPC)
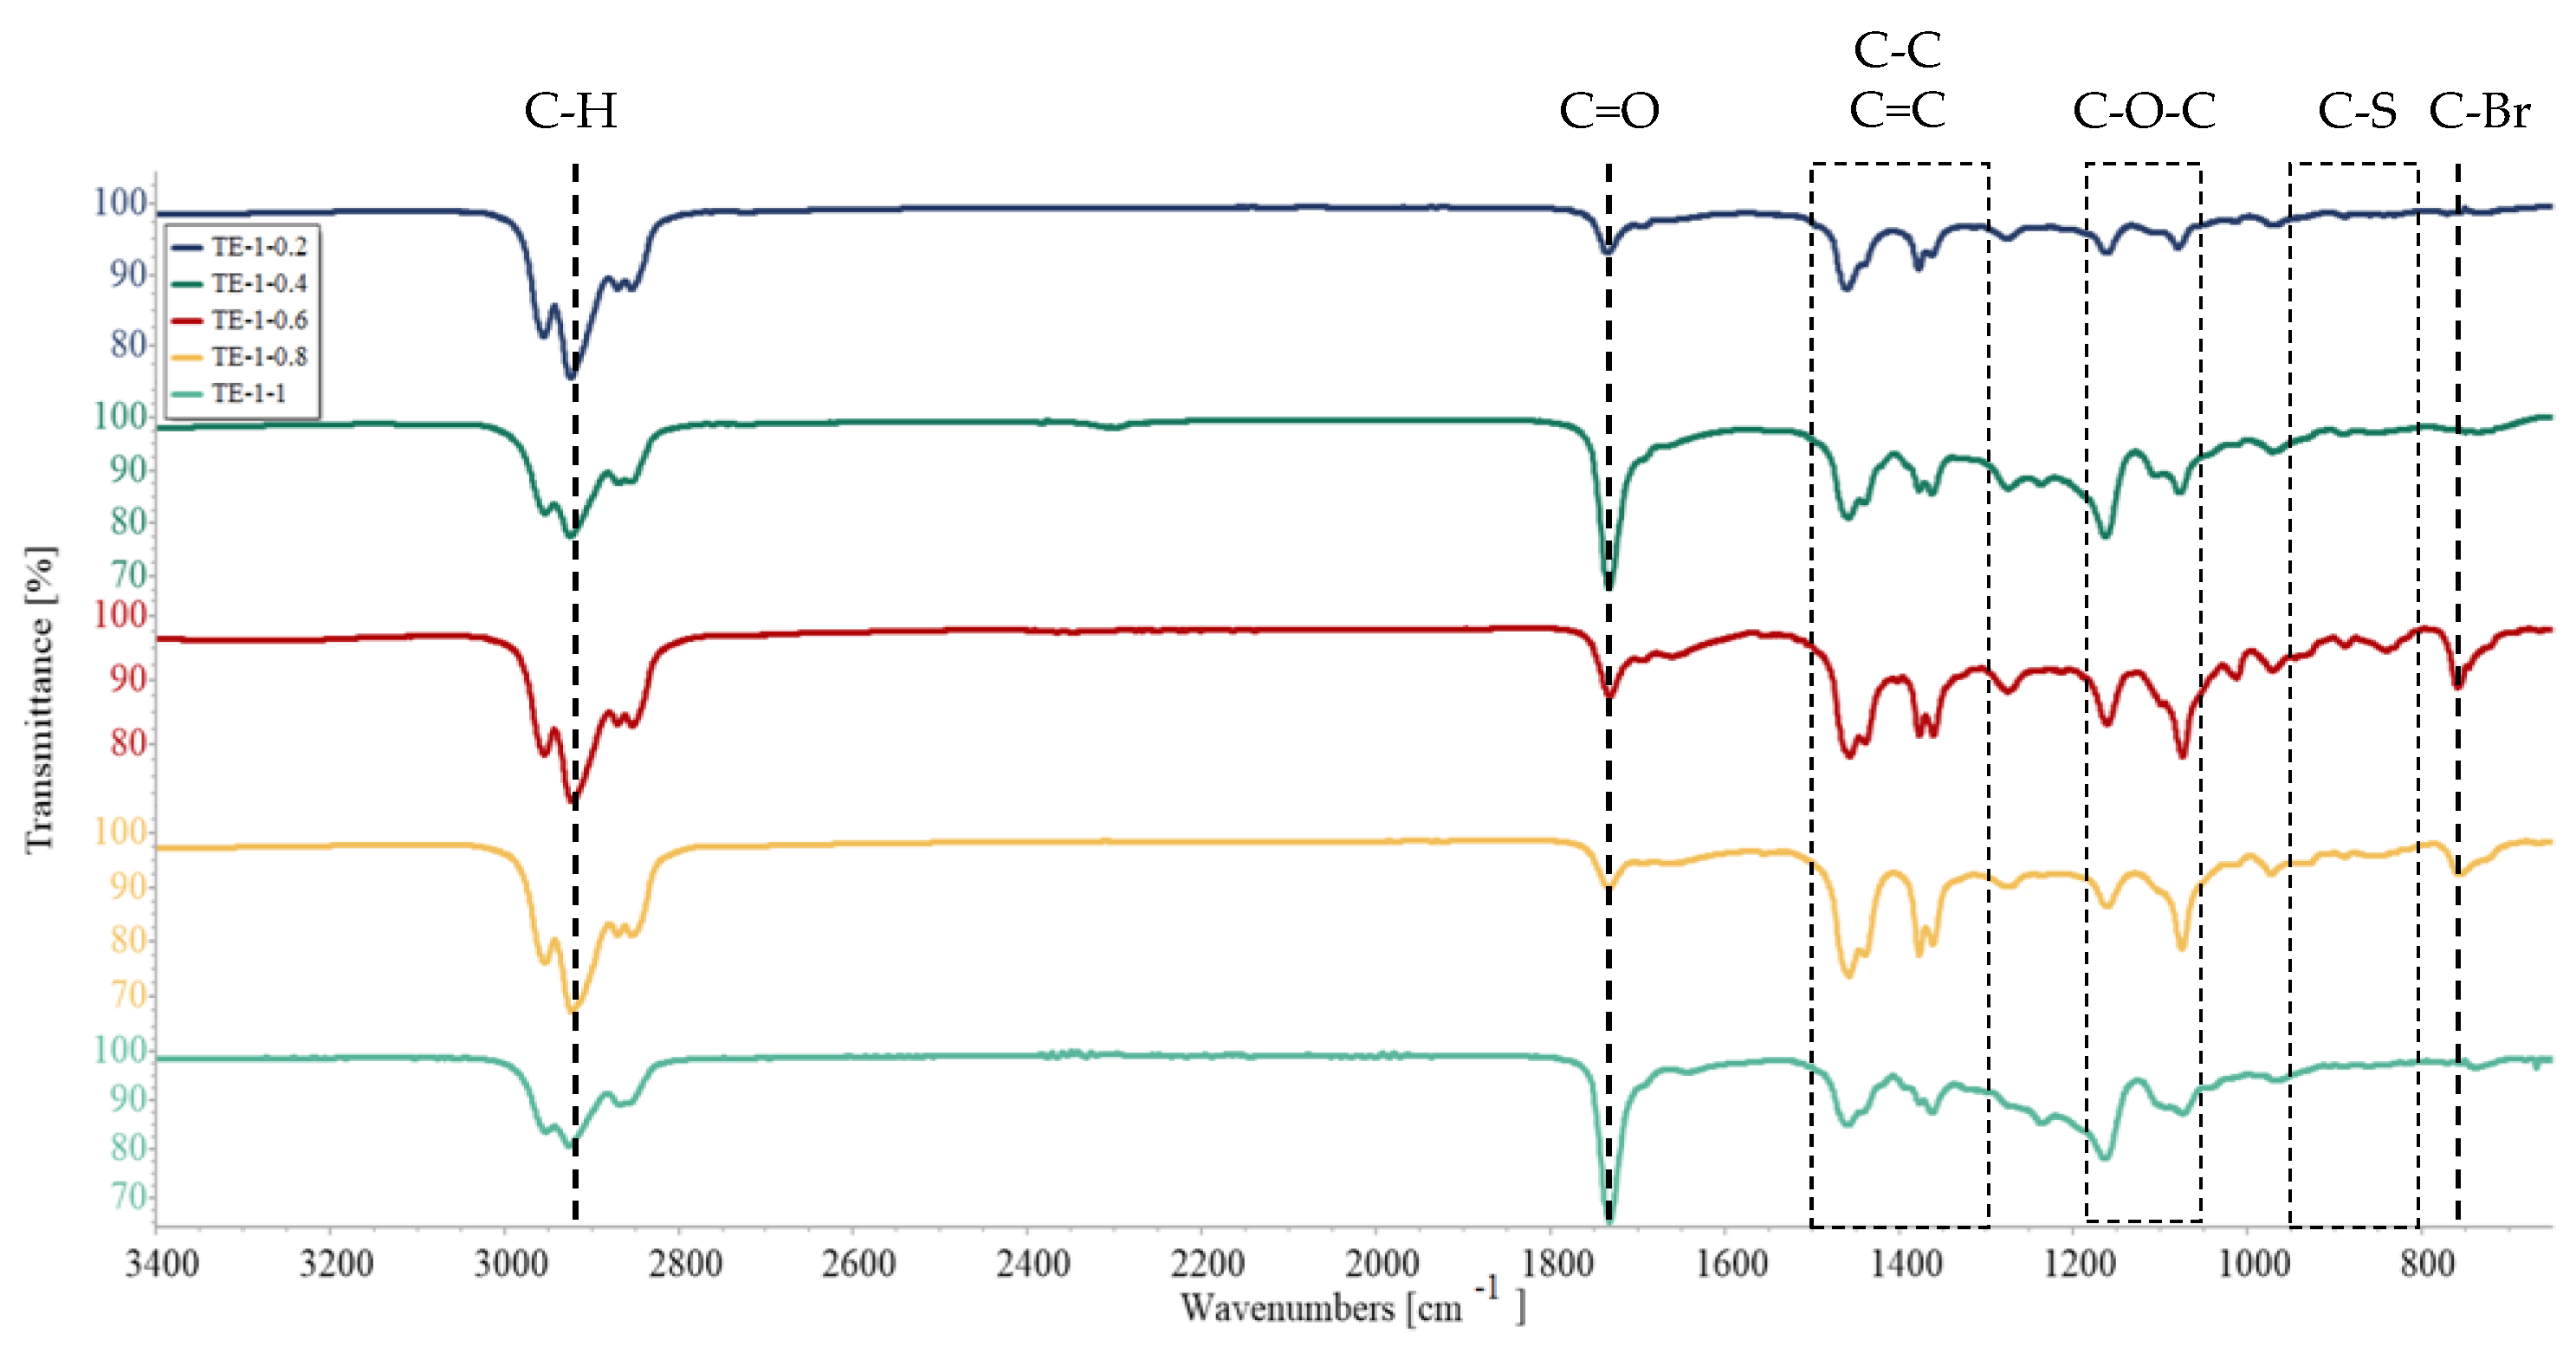
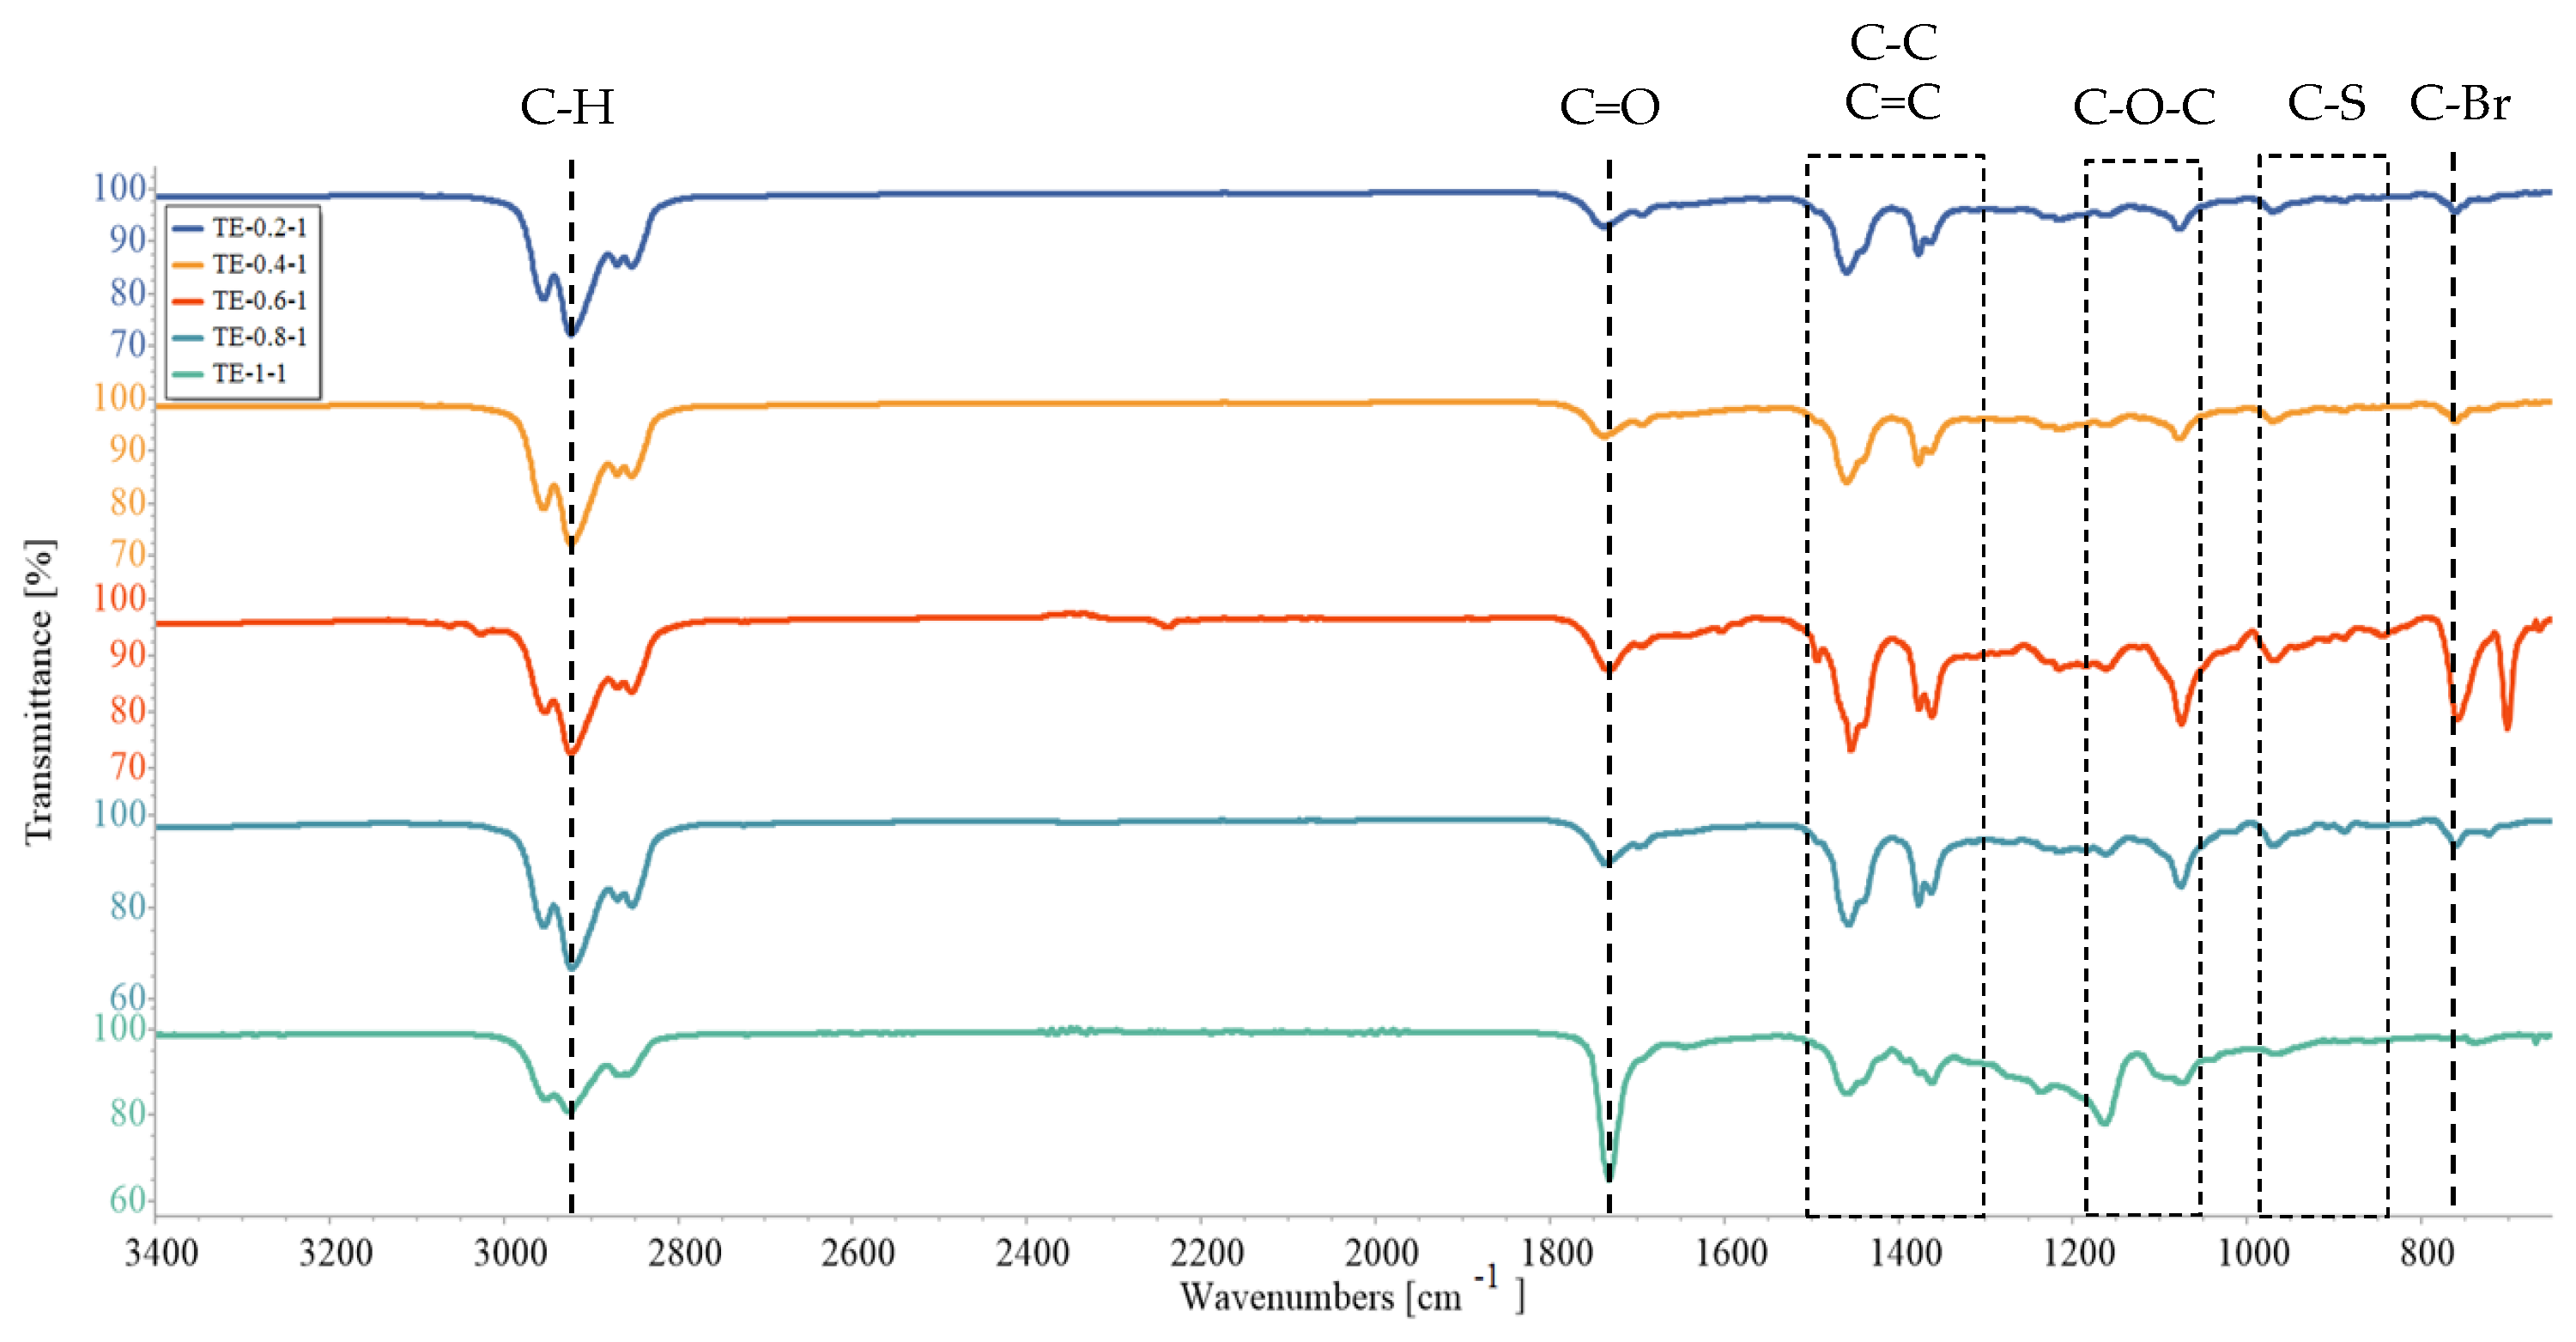
3.3. Fourier-Transform Infrared Spectroscopy (FTIR)
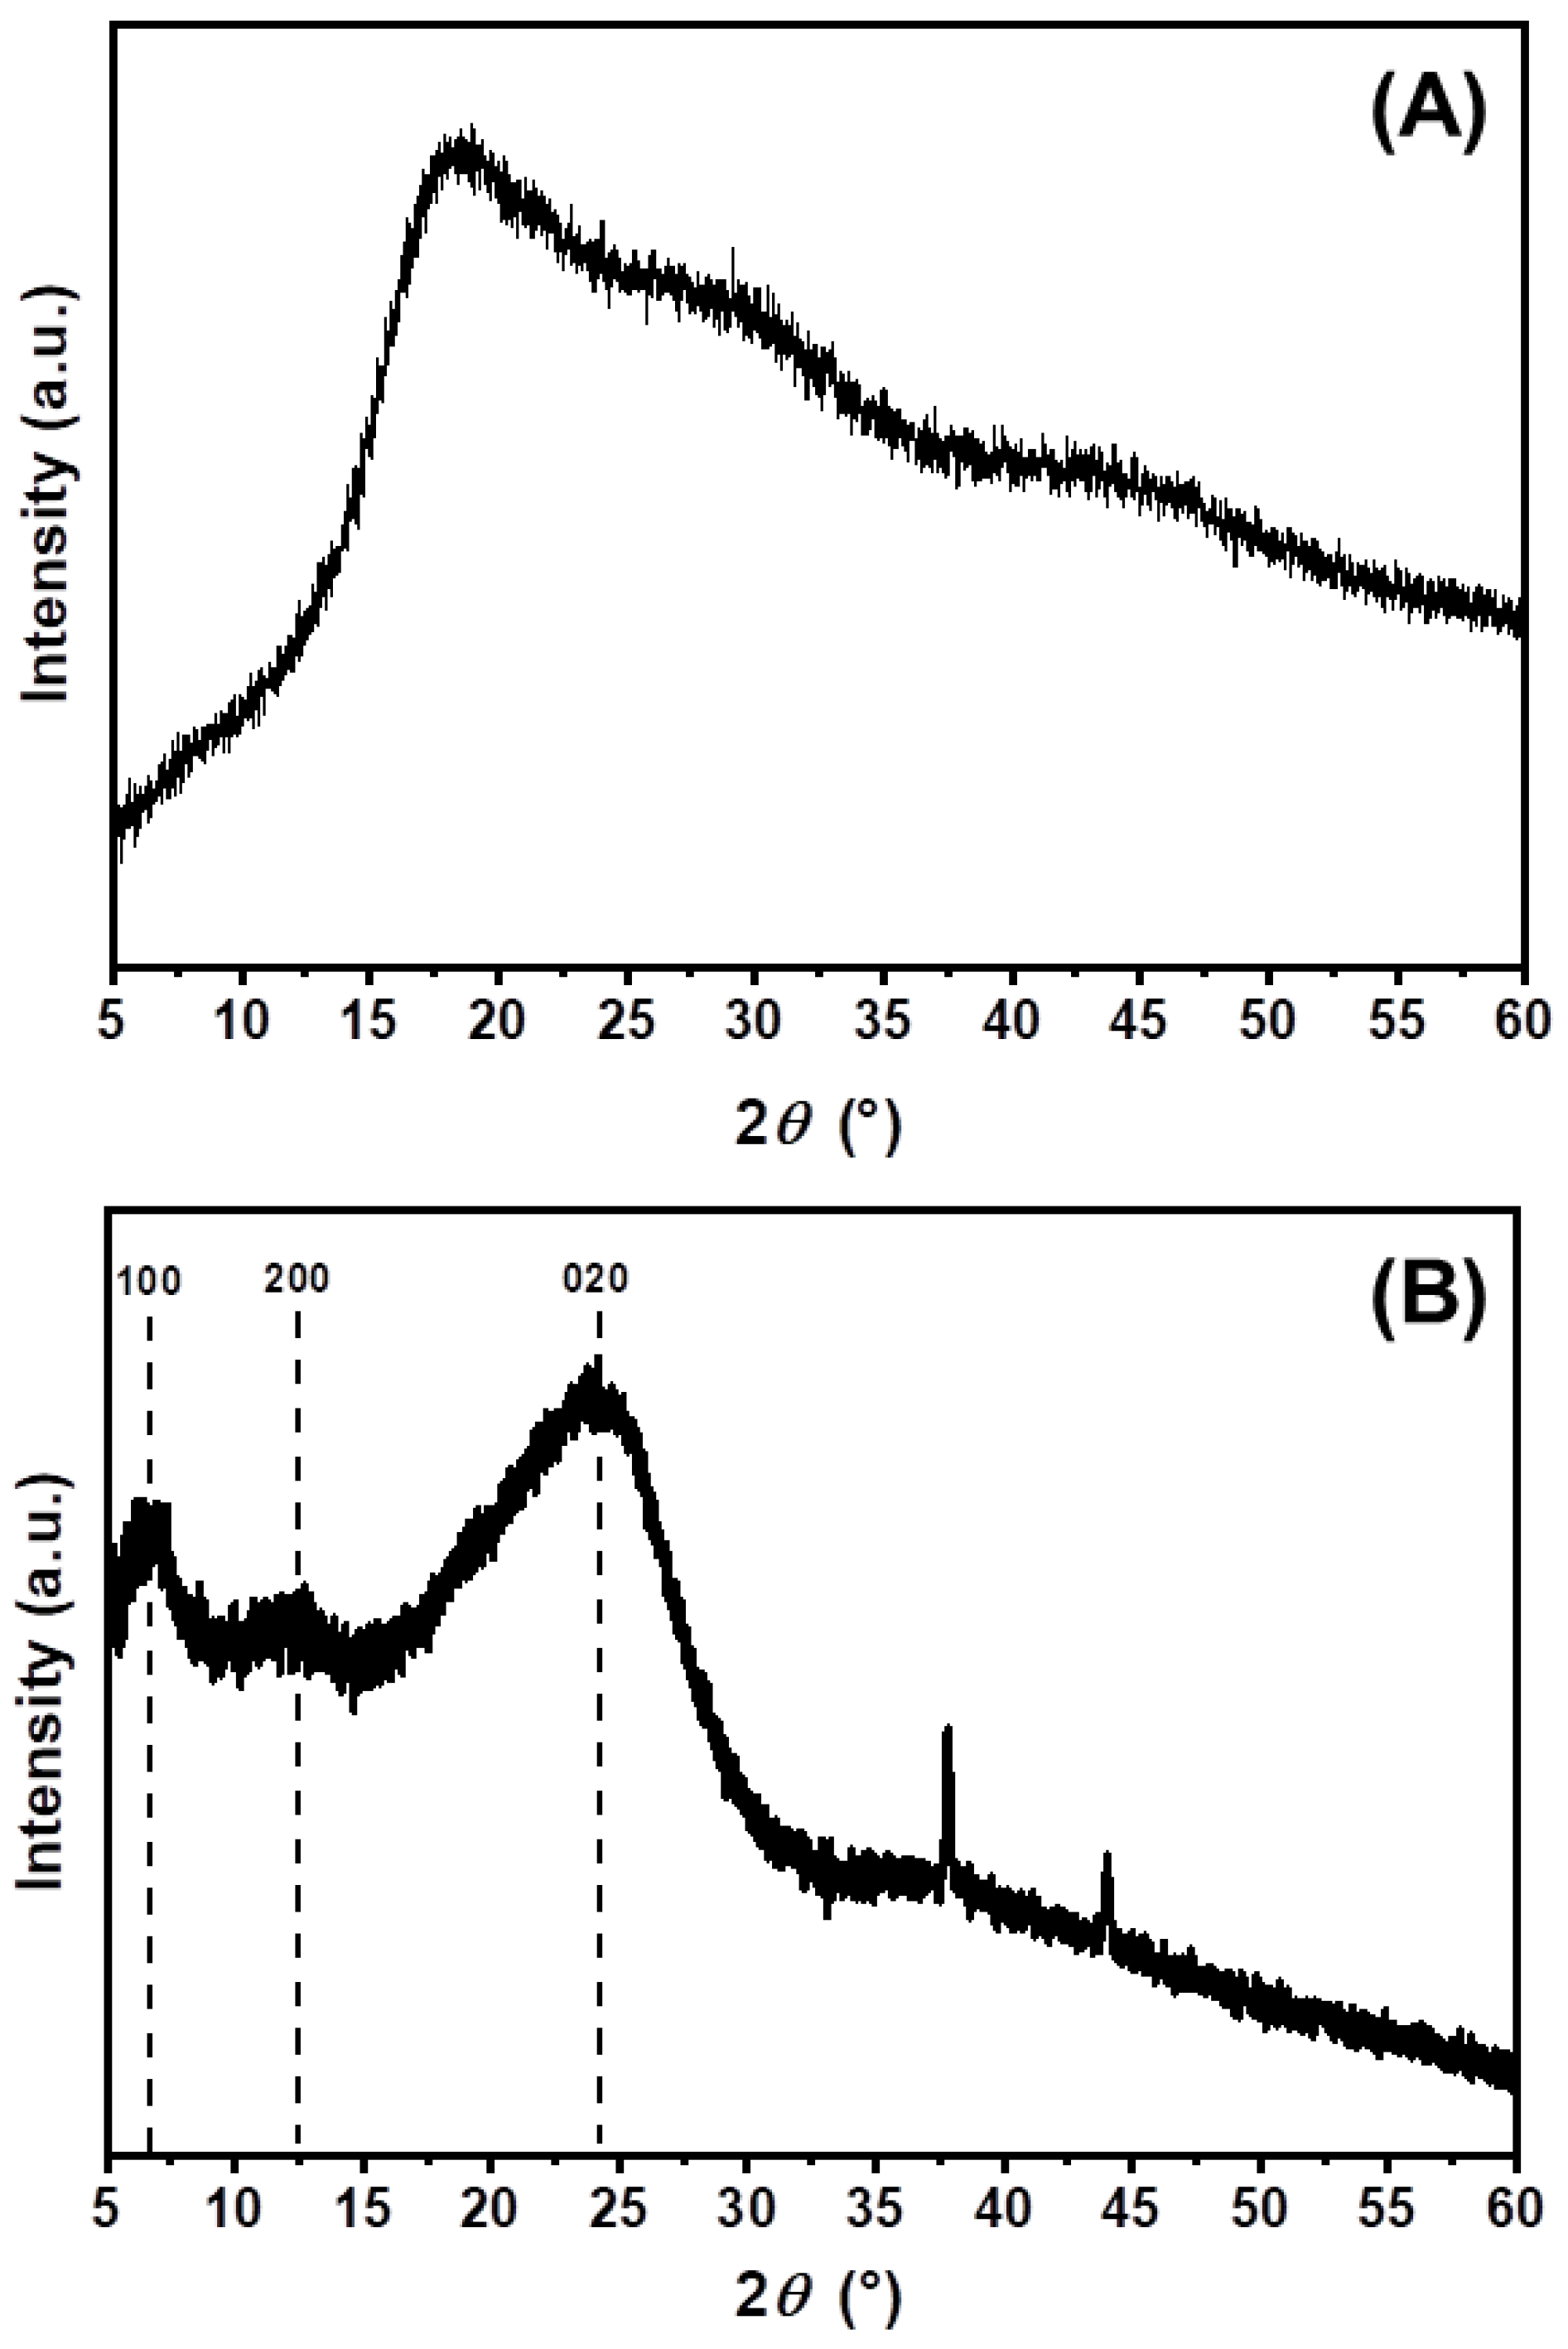
3.4. X-ray Diffraction (XRD)
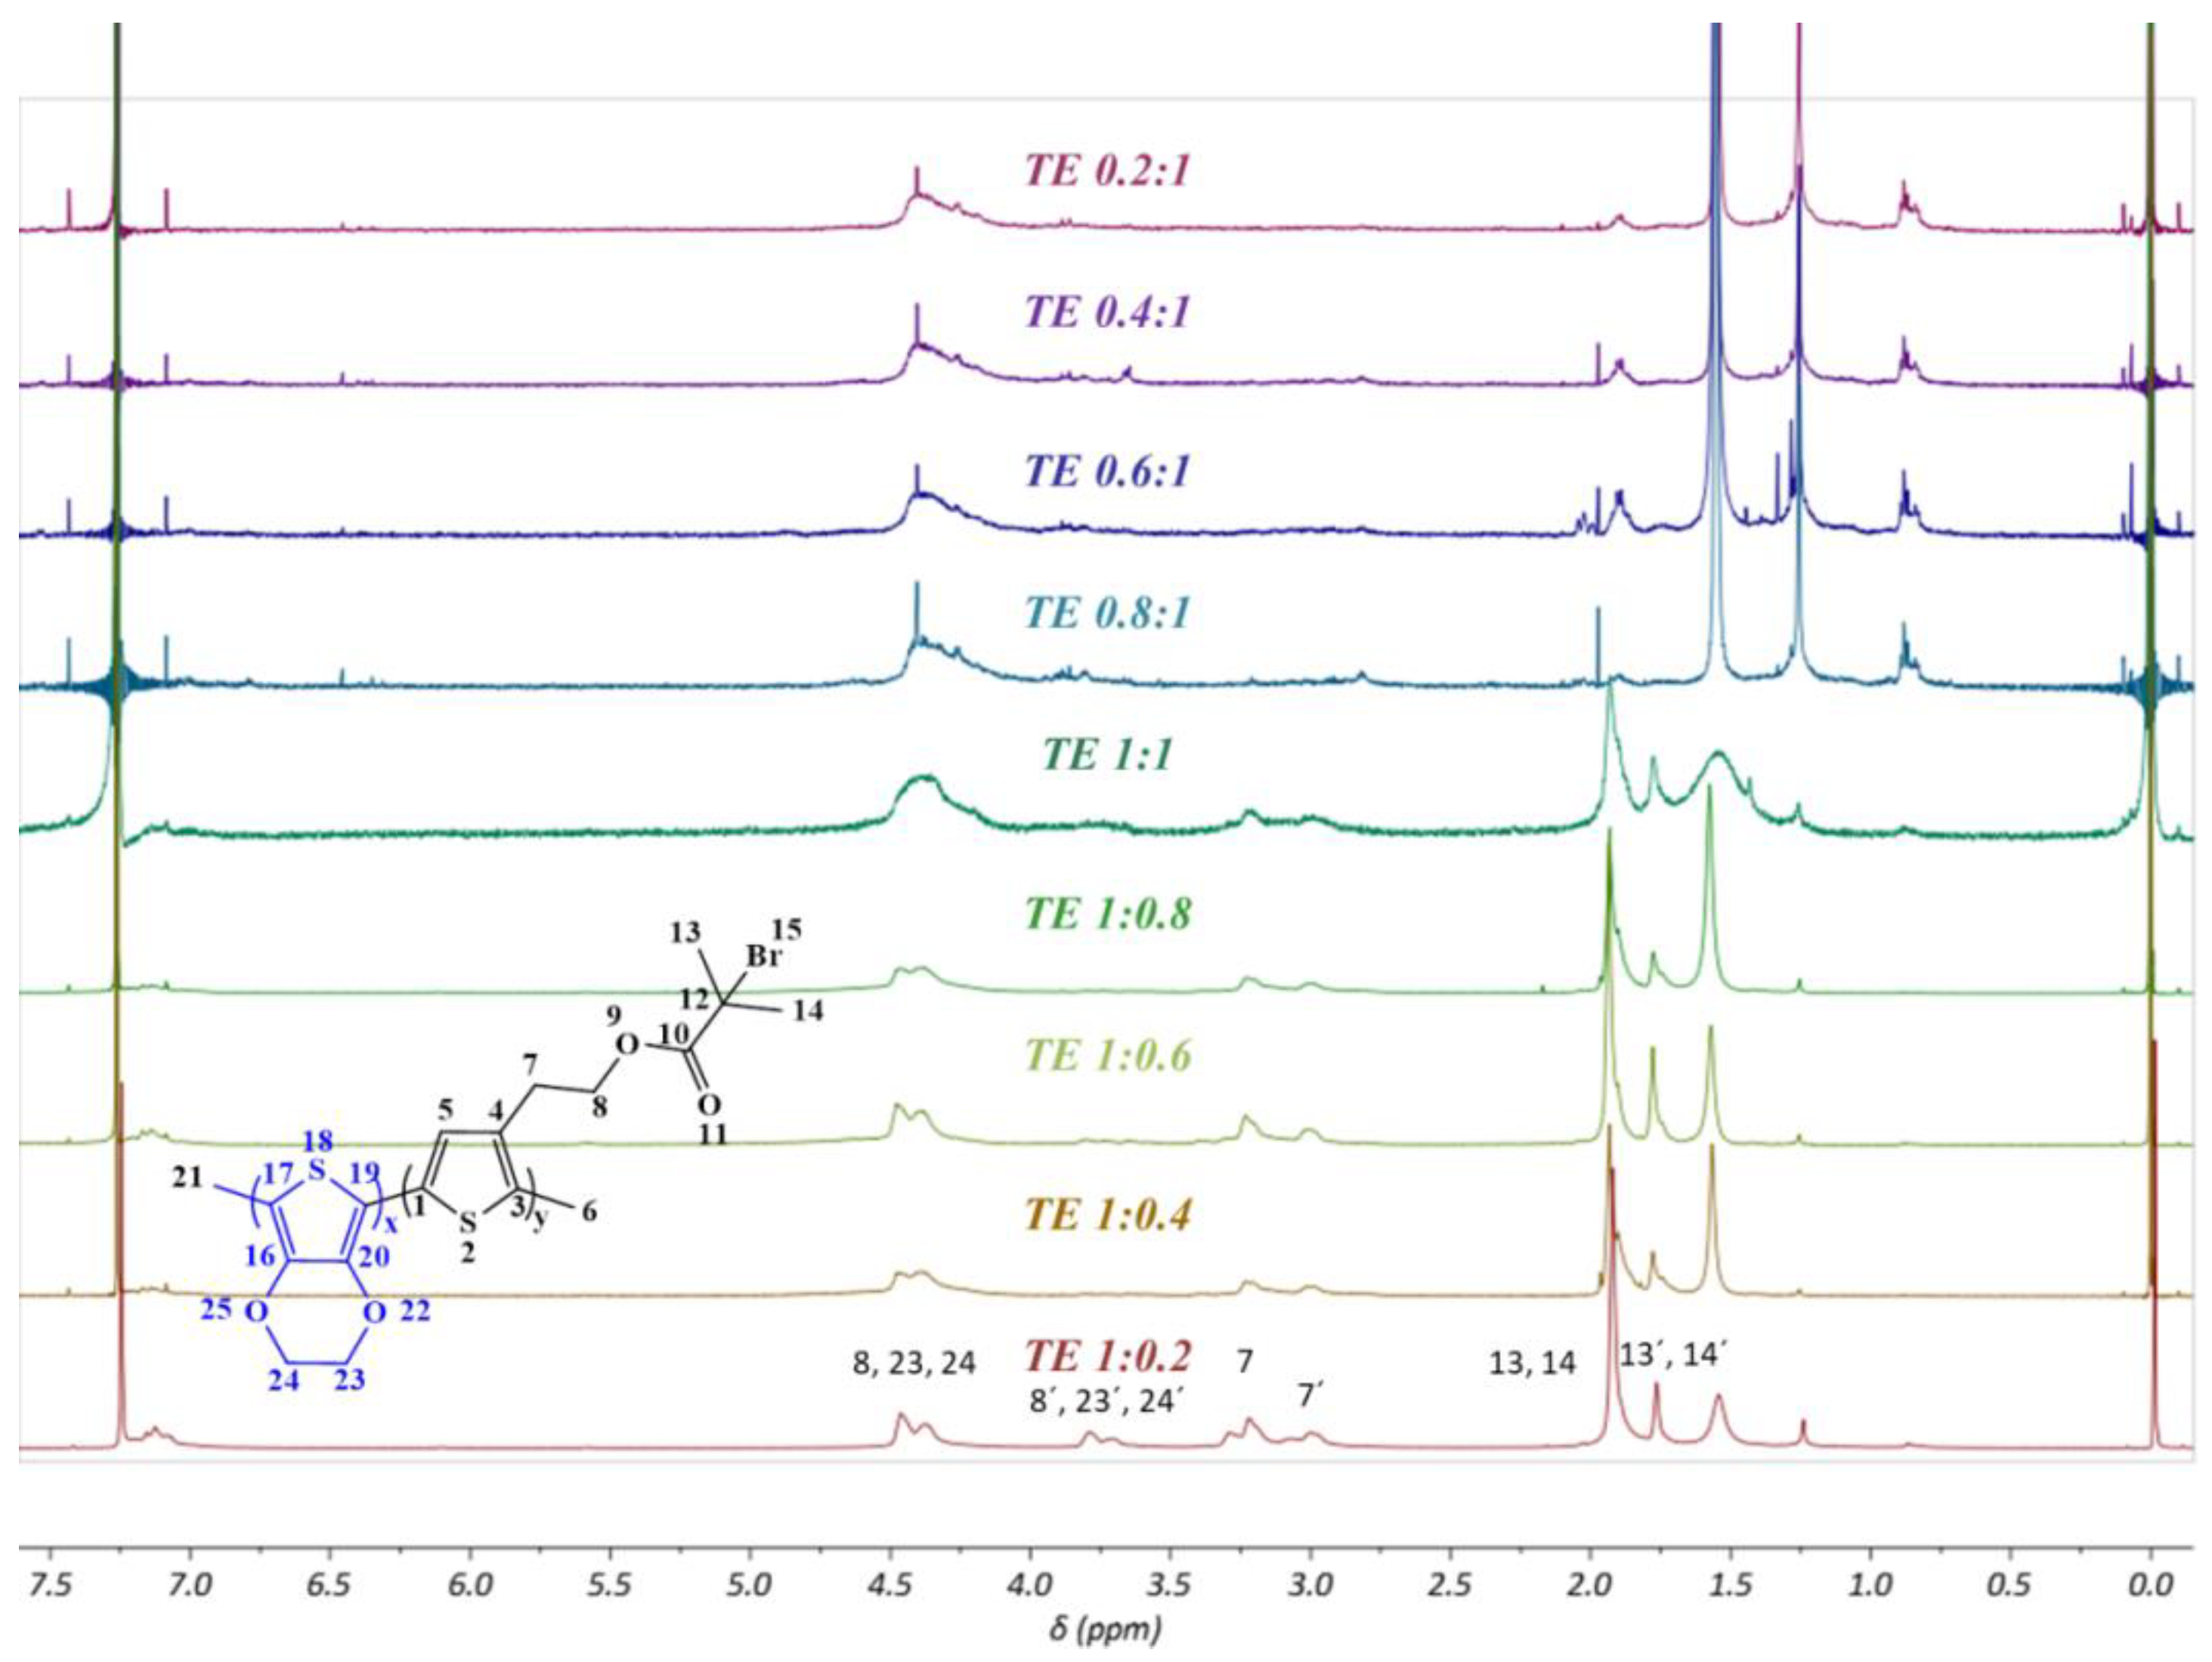
3.5. Nuclear Magnetic Resonance (NMR)
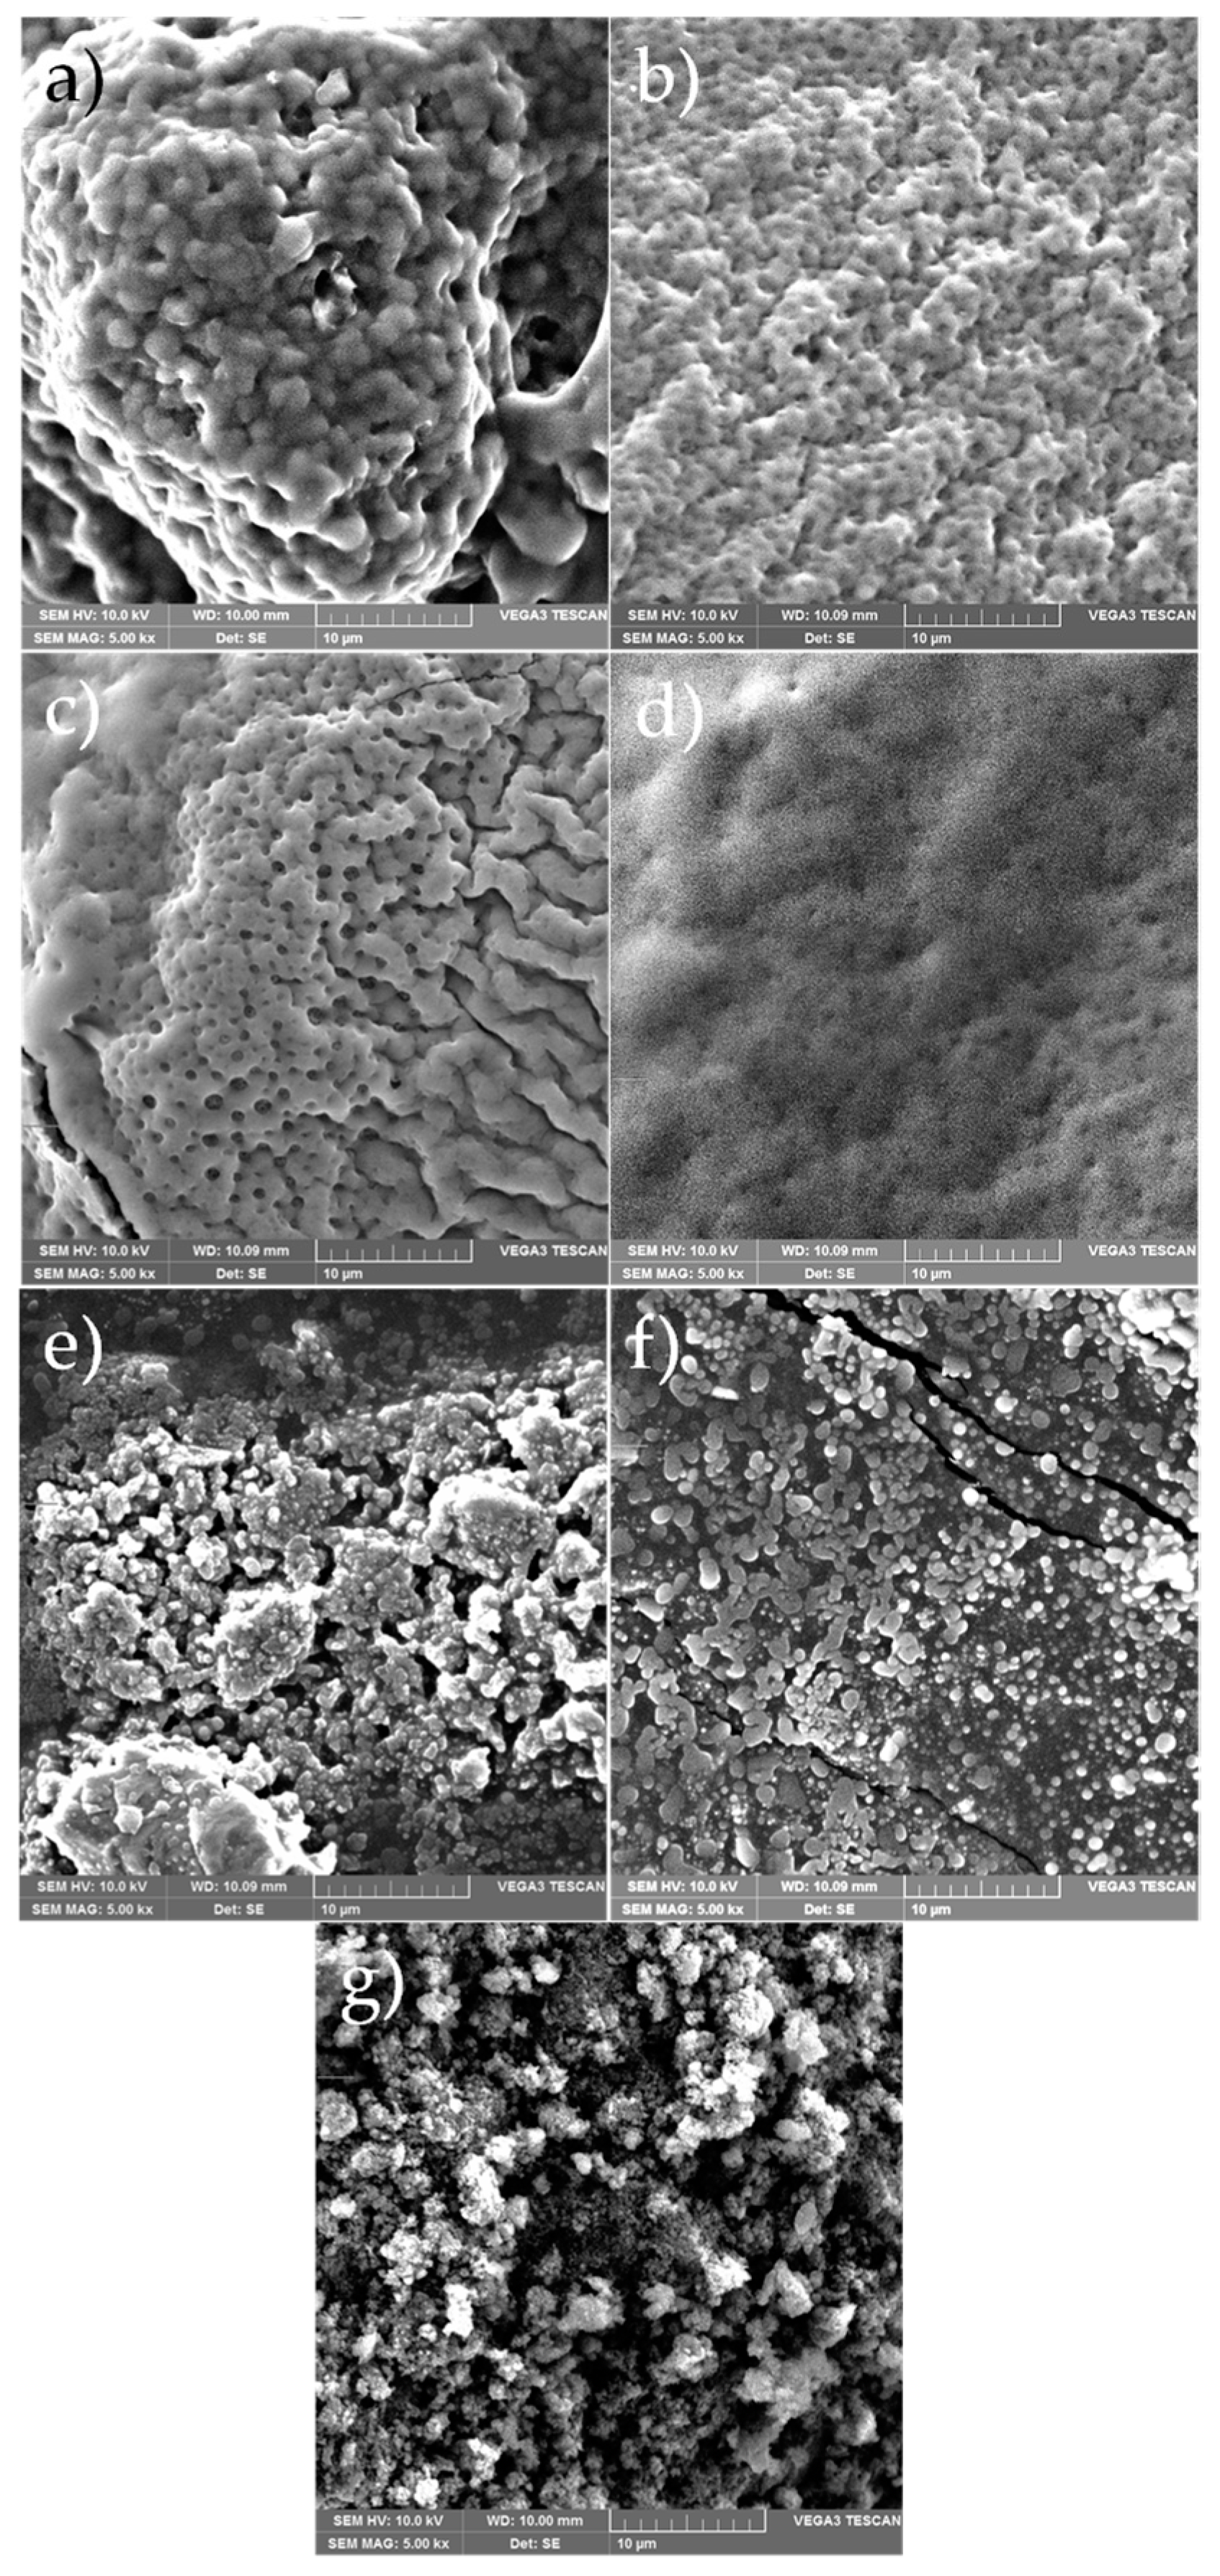
3.6. Scanning Electron Microscopy (SEM)
3.7. Electrical Conductivity
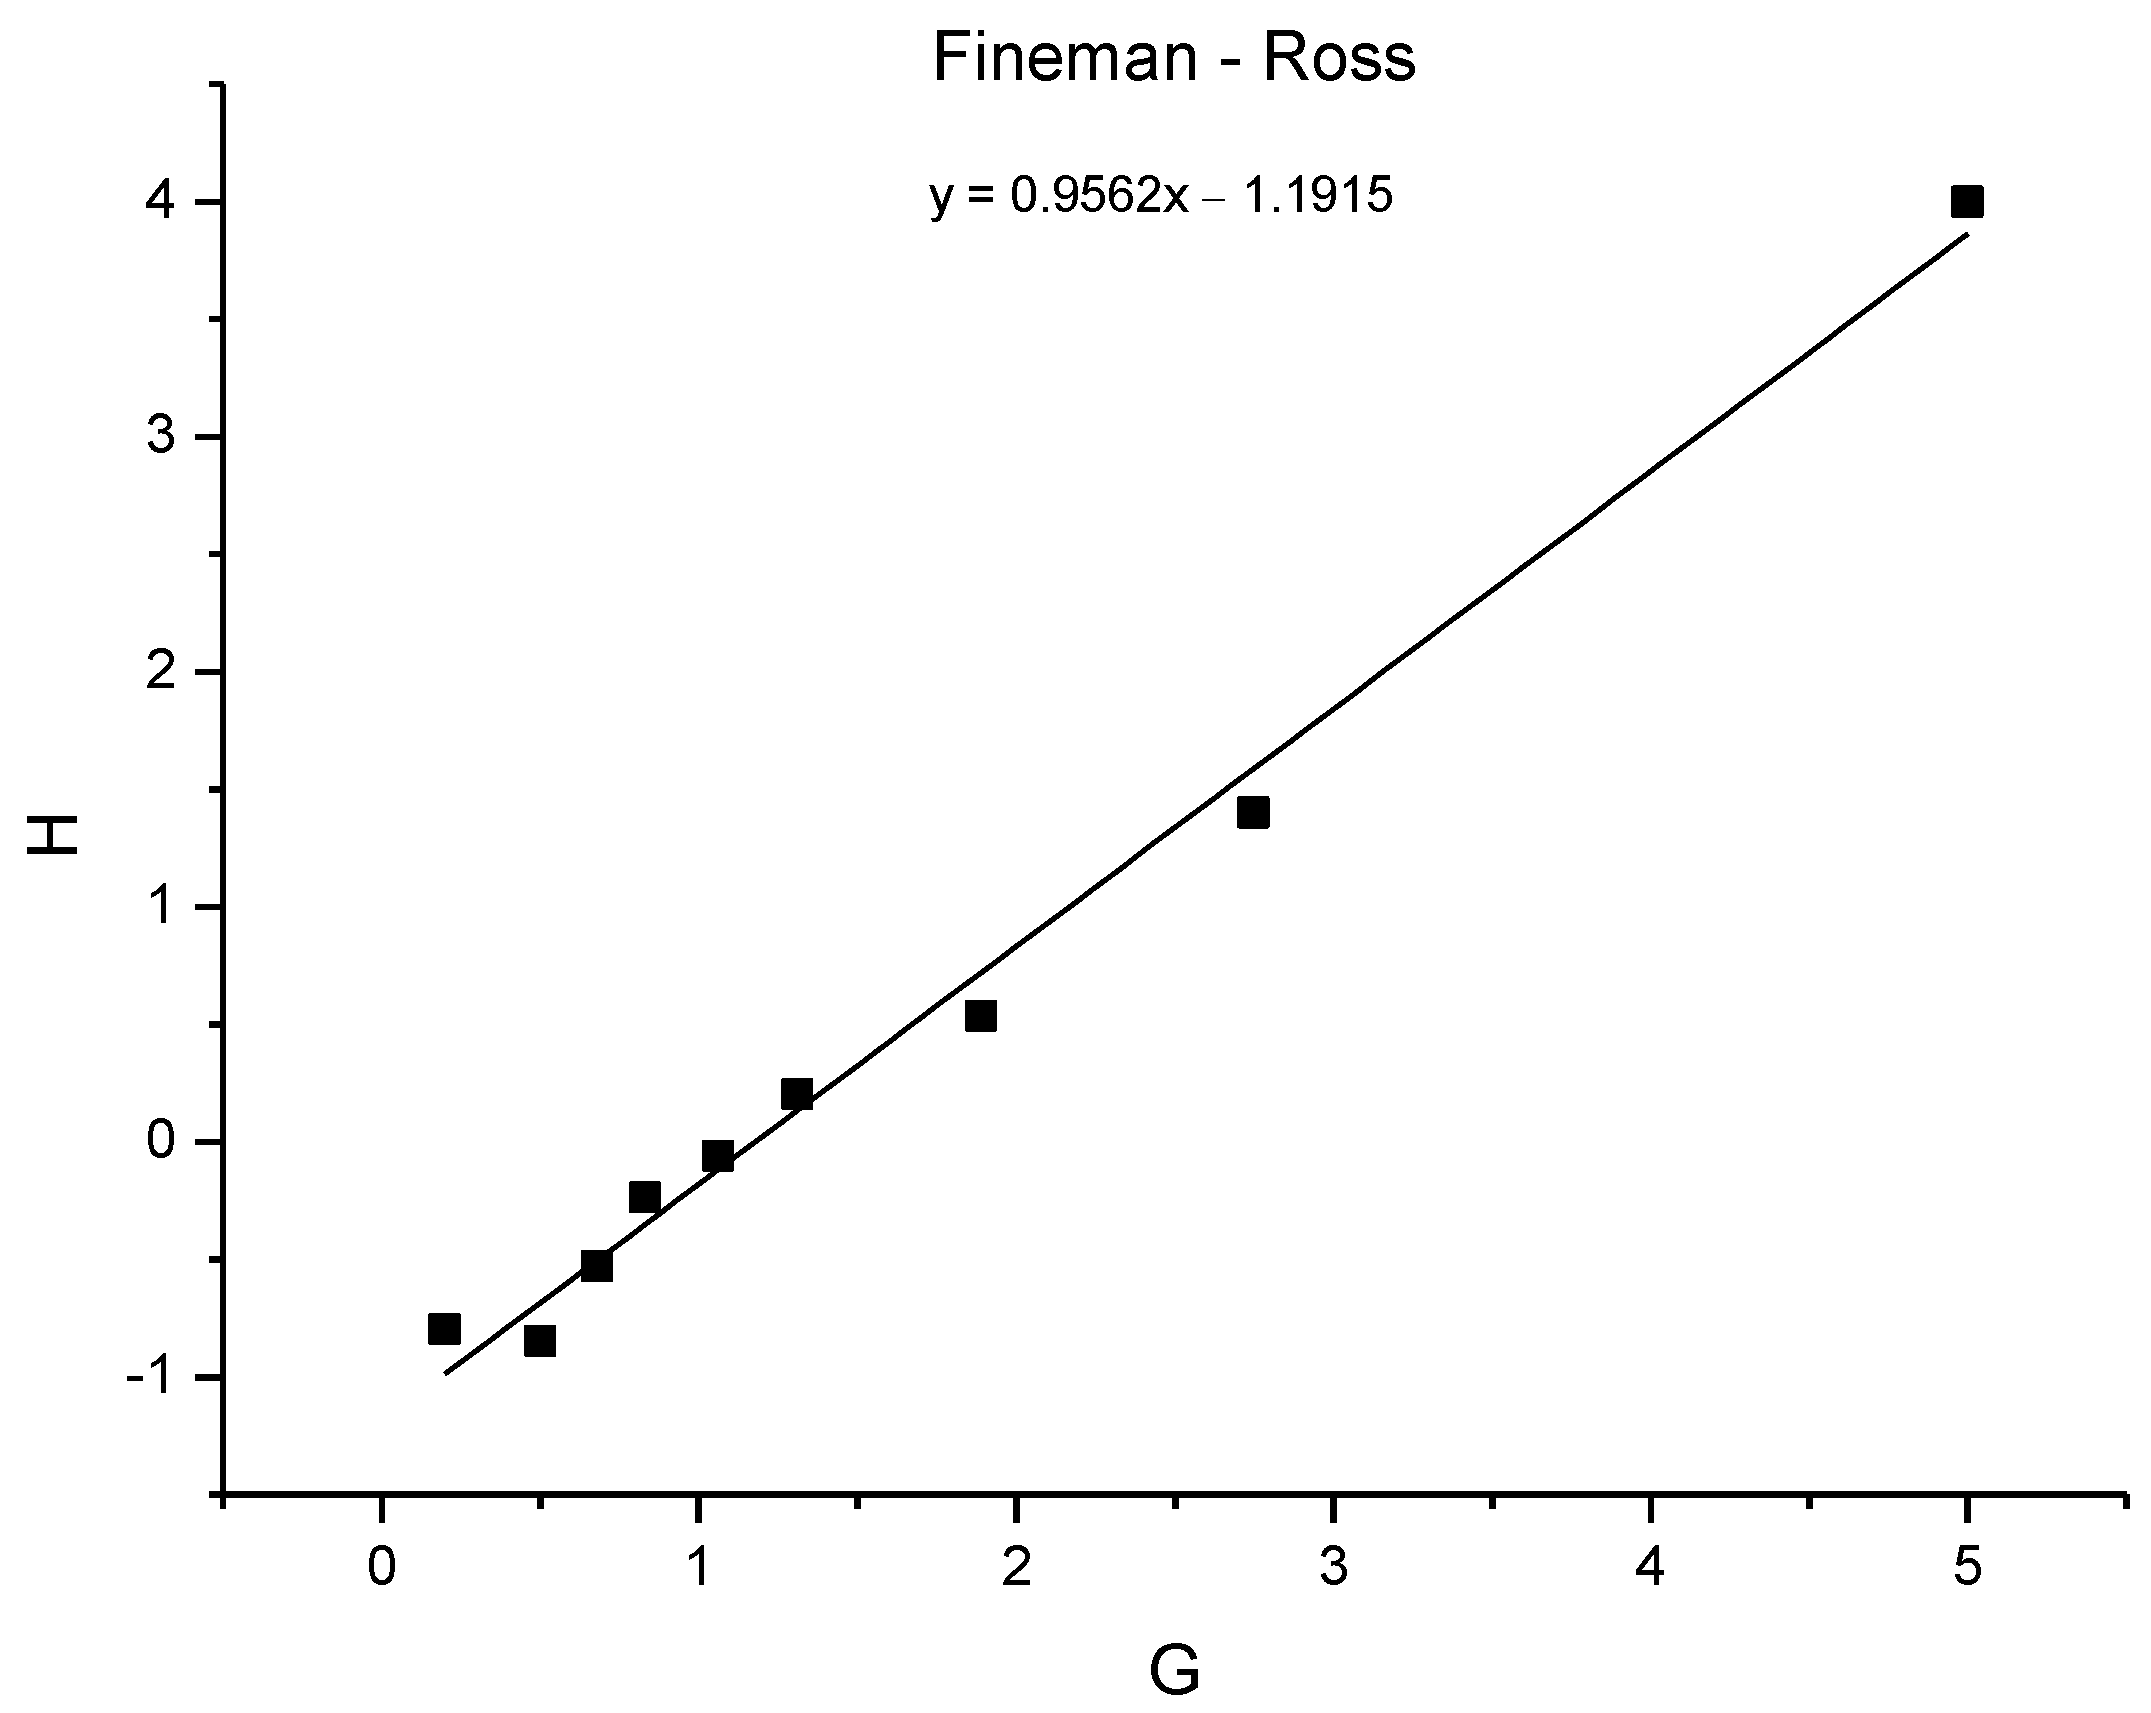
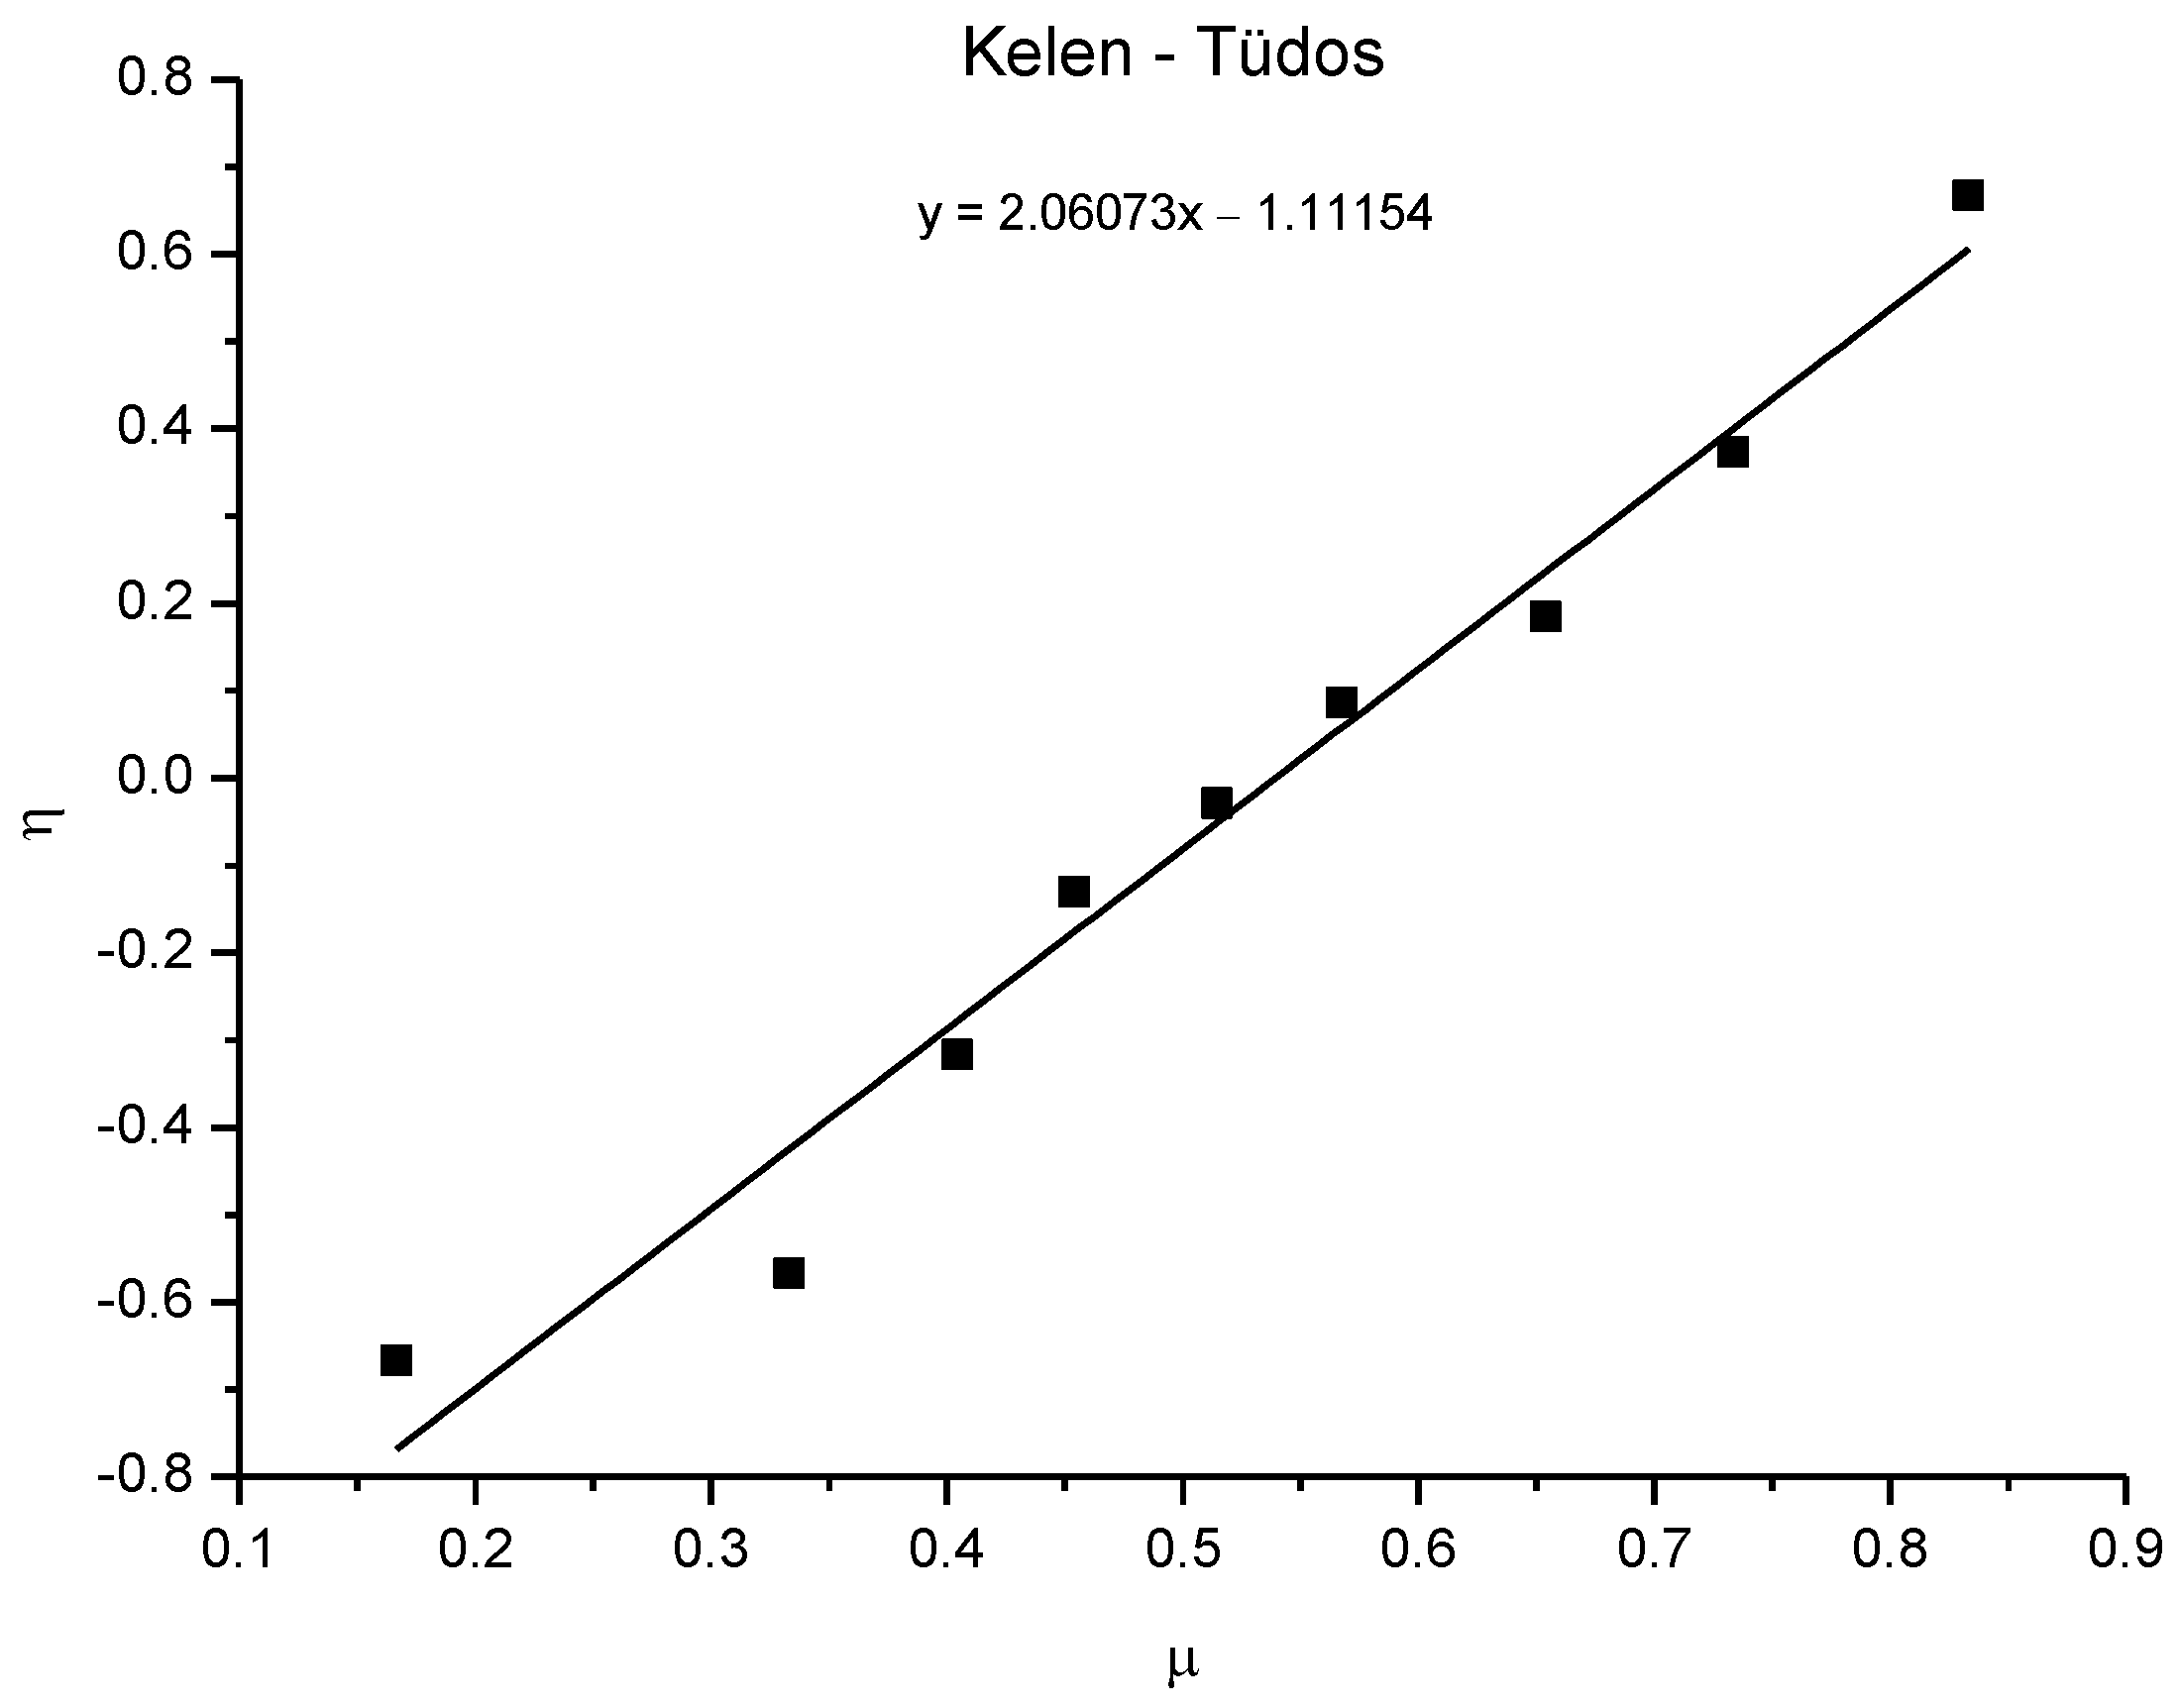
3.8. Copolymerization Reactivity
4. Conclusions
Supplementary Materials
Author Contributions
Funding
Institutional Review Board Statement
Informed Consent Statement
Data Availability Statement
Conflicts of Interest
References
- Grubbs, R.B.; Grubbs, R.H. 50th Anniversary Perspective: Living Polymerization- emphasizing the Molecule in Macromolecules. Macromolecules 2017, 50, 6979–6997. [Google Scholar] [CrossRef]
- Parkatzidis, K.; Rolland, M.; Truong, N.P.; Anastasaki, A. Tailoring polymer dispersity by mixing ATRP initiators. Polym. Chem. 2021, 12, 5583–5588. [Google Scholar] [CrossRef]
- Wang, Y.; Matyjaszewski, K. Hairy nanoparticles by atom transfer radical polymerization in miniemulsion. React. Funct. Polym. 2021, 170, 105104. [Google Scholar] [CrossRef]
- Wang, J.-S.; Matyjaszewski, K. Controlled/“living”radical polymerization. Atom transfer radical polymerization in the presence of transition-metal complexes. J. Am. Chem. Soc. 1995, 117, 5614–5615. [Google Scholar] [CrossRef]
- Kato, M.; Kamigaito, M.; Sawamoto, M.; Higashimura, T. Polymerization of Methyl Metacrylate with the Carbon Tetrachloride / Dichlorotris-(triphenylphosphine)ruthenium(II)/Methylaluminum Bis(2,6-di-tert-butylphenoxide) Initiating System: Possi-bility of Living Radical Polymerization. Macromolecules 1995, 28, 1721–1723. [Google Scholar] [CrossRef]
- Polanowski, P.; Jeszka, J.K.; Matyjaszewski, K. Polymer brushes in pores by ATRP: Monte Carlo simulations. Polymer 2020, 211, 123124. [Google Scholar] [CrossRef]
- Aguilar-Bolados, H.; Yazdani-Pedram, M.; Quinteros-Jara, E.; Cuenca-Bracamonte, Q.; Quijada, R.; Carretero-González, J.; Avilés, F.; Lopez-Manchado, M.A.; Verdejo, R. Synthesis of sustainable, lightweight and electrically conductive polymer brushes grafted multi-layer graphene oxide. Polym. Test. 2021, 93, 106986. [Google Scholar] [CrossRef]
- Kopeć, M.; Pikiel, M.; Vancso, G.J. Surface-grafted polyacrylonitrile brushes with aggregation-induced emission properties. Polym. Chem. 2019, 11, 669–674. [Google Scholar] [CrossRef] [Green Version]
- Wufang, Y.; Feng, Z. Polymer brushes for antibiofouling and lubrication. Biosurface Biotribology 2017, 3, 97–114. [Google Scholar]
- Guo, P.F.; Gong, H.Y.; Zheng, H.W.; Chen, M.L.; Wang, J.H.; Ye, L. Iron-chelated thermoresponsive polymer brushes on bis-muth titanate nanosheets for metal affinity separation of phosphoproteins. Colloids Surf. B: Biointerfaces 2020, 196, 111282. [Google Scholar] [CrossRef]
- Rüttiger, C.; Pfeifer, V.; Rittscher, V.; Stock, D.; Scheid, D.; Vowinkel, S.; Roth, F.; Didzoleit, H.; Stühn, B.; Elbert, J.; et al. One for all: Cobalt-containing polymethacrylates for magnetic ceramics, block copolymerization, unexpected electrochemistry, and stimuli-responsiveness. Polym. Chem. 2015, 7, 1129–1137. [Google Scholar] [CrossRef]
- Stevens, C.A.; Kaur, K.; Klok, H.-A. Self-assembly of protein-polymer conjugates for drug delivery. Adv. Drug Deliv. Rev. 2021, 174, 447–460. [Google Scholar] [CrossRef] [PubMed]
- Wang, C.; Deng, H.; Zhao, H. ICAR ATRP-induced surface self-assembly in the fabrication of the surface nanostructures. Giant 2022, 11, 100114. [Google Scholar] [CrossRef]
- Li, S.; Liu, T.; Yan, J.; Flum, J.; Wang, H.; Lorandi, F.; Wang, Z.; Fu, L.; Hu, L.; Zhao, Y.; et al. Grafting polymer from oxygen-vacancy-rich nanoparticles to enable protective layers for stable lithium metal anode. Nano Energy 2020, 76, 105046. [Google Scholar] [CrossRef]
- Nedestedt, H.; Jannasch, P. Poly(p-terphenyl alkylene)s grafted with highly acidic sulfonated polypentafluorostyrene side chains for proton exchange membranes. J. Membr. Sci. 2022, 647, 120270. [Google Scholar] [CrossRef]
- Mandal, J.; Arcifa, A.; Spencer, N.D. Synthesis of acrylamide-based block-copolymer brushes under flow: Monitoring real-time growth and surface restructuring upon drying. Polym. Chem. 2020, 11, 3209–3216. [Google Scholar] [CrossRef]
- Baek, P.; Aydemir, N.; An, Y.; Chan, E.W.C.; Sokolova, A.; Nelson, A.; Mata, J.P.; McGillivray, D.; Barker, D.; Travas-Sejdic, J. Molecularly Engineered Intrinsically Healable and Stretchable Conducting Polymers. Chem. Mater. 2017, 29, 8850–8858. [Google Scholar] [CrossRef]
- Zhu, X.; Han, X.; Guo, R.; Yuan, P.; Dang, L.; Liu, Z.; Lei, Z. Vapor-phase polymerization of fibrous PEDOT on carbon fibers film for fast pseudocapacitive energy storage. Appl. Surf. Sci. 2022, 597, 153684. [Google Scholar] [CrossRef]
- Kumar, A.M.; Khan, A.; Hussein, M.A.; Khan, M.Y.; Dafalla, H.; Suresh, B.; Ramakrishna, S. Hybrid nanocomposite coatings from PEDOT and BN-TiO2 nanosheets: Enhanced invitro corrosion resistance, wettability and biocompatibility for biomedical applications. Prog. Org. Coat. 2022, 170, 106946. [Google Scholar] [CrossRef]
- Cui, Y.; Jiang, Z.; Zheng, G.; Wang, W.; Zhou, M.; Wang, P.; Yu, Y.; Wang, Q. Green preparation of PEDOT-based composites with outstanding electrothermal heating and durable rapid-response sensing performance for smart healthcare textiles. Chem. Eng. J. 2022, 446 Pt 4, 137189. [Google Scholar] [CrossRef]
- Khasim, S.; Pasha, A.; Lakshmi, M.; Chellasamy, P.; Kadarkarai, M.; Darwish, A.A.A.; Hamdalla, T.A.; Al-Ghamdi, S.A.; Alfadhli, S. Post treated PEDOT-PSS films with excellent conductivity and optical properties as multifunctional flexible elec-trodes for possible optoelectronic and energy storage applications. Opt. Mater. 2022, 125, 112109. [Google Scholar] [CrossRef]
- Vu, S.; Nagesh, G.; Yousefi, N.; Trant, J.F.; Ting, D.S.-K.; Ahamed, M.J.; Rondeau-Gagné, S. Fabrication of an autonomously self-healing flexible thin-film capacitor by slot-die coating. Mater. Adv. 2021, 2, 6676–6683. [Google Scholar] [CrossRef]
- Li, Y.; Li, X.; Zhang, S.; Liu, L.; Hamad, N.; Bobbara, S.R.; Pasini, D.; Cicoira, F. Autonomic Self-Healing of PEDOT:PSS Achieved Via Polyethylene Glycol Addition. Adv. Funct. Mater. 2020, 30, 2002853. [Google Scholar] [CrossRef]
- Zhou, X.; Rajeev, A.; Subramanian, A.; Li, Y.; Rossetti, N.; Natale, G.; Lodygensky, G.A.; Cicoira, F. Self-healing, stretchable, and highly adhesive hydrogels for epidermal patch electrodes. Acta Biomater. 2021, 139, 296–306. [Google Scholar] [CrossRef]
- Wang, M.; Kee, S.; Barker, D.; Travas-Sejdic, J. Highly stretchable, solution-processable, and crosslinkable poly(3,4-ethylenedioxithiophene)-based conjugated polymers. Eur. Polym. J. 2020, 125, 109508. [Google Scholar] [CrossRef]
- Fiket, L.; Božičević, M.; Brkić, L.; Žagar, P.; Horvat, A.; Katančić, Z. Intrinsically Stretchable Poly(3,4-ethylenedioxythiophene) Conducting Polymer Film for Flexible Electronics. Polymers 2022, 14, 2340. [Google Scholar] [CrossRef]
- Yuk, H.; Zhang, T.; Lin, S.; Parada, G.A.; Zhao, X. Tough bonding of hydrogels to diverse non-porous surfaces. Nat. Mater. 2015, 15, 190–196. [Google Scholar] [CrossRef] [Green Version]
- Tait, P.J.T.; Berry, I.G. Monoalkene Polymerization: Copolymerization in Comprehensive Polymer Science and Supplements; Geoffrey, A.G., John, C.B., Eds.; Elsevier: Amsterdam, The Netherlands, 1989; Volume 4, pp. 575–584. [Google Scholar]
- Ramírez-Gómez, M.A.; Guzmán-Rabadán, K.K.; González-Juárez, E.; Güizado-Rodríguez, M.; Ramos-Ortiz, G.; Alba-Rosales, J.E.; Panzo-Medrano, H.; Barba, V.; Rodríguez, M.; Maldonado, J.L.; et al. Physicochemical and Luminescent Properties of Copolymers Composed of Three Monomers: Polythiophenes Based on 3-Hexylthiophene and 3,4-Ethylenedioxythiophene. Int. J. Polym. Sci. 2017, 2017, 1918602. [Google Scholar] [CrossRef] [Green Version]
- Kim, E.-G.; Brédas, J.-L. Electronic Evolution of Poly(3,4-ethylenedioxythiophene) (PEDOT): From the Isolated Chain to the Pristine and Heavily Doped Crystals. J. Am. Chem. Soc. 2008, 130, 16880–16889. [Google Scholar] [CrossRef]
- Raić, M.; Sačer, D.; Rokovic, M.K. Structural and Capacitive Properties of Graphene Obtained by a Green Method of Graphene Oxide Reduction. Chem. Biochem. Eng. Q. 2019, 33, 385–393. [Google Scholar] [CrossRef]
- Katančić, Z.; Gavran, I.; Smolković, J.; Hrnjak-Murgić, Z. Fly ash supported photocatalytic nanocomposite poly(3,4-ethylenedioxythiophene)/TiO2 for azo dye removal under simulated solar irradiation. J. Appl. Polym. Sci. 2018, 135, 46316. [Google Scholar] [CrossRef]
- Choi, J.W.; Han, M.G.; Kim, S.Y.; Oh, S.G.; Im, S.S. Poly(3,4-ethylenedioxythiophene) nanoparticles prepared in aqueous DBSA solutions. Synth. Met. 2004, 141, 293–299. [Google Scholar] [CrossRef]
- Singh, R.K.; Kumar, A.; Agarwal, K.; Dwivedi, D.; Sood, K.N.; Singh, R. Influence of Binary Oxidant (FeCl3:APS) Ratio on the Spectroscopic and Microscopic Properties of Poly(2,5-Dimethoxyaniline). Open J. Polym. Chem. 2012, 2, 105–112. [Google Scholar] [CrossRef] [Green Version]
- IR Spectrum Table and Chart. Available online: https://www.sigmaaldrich.com/HR/en/technical-documents/technical-article/analytical-chemistry/photometry-and-reflectometry/ir-spectrum-table (accessed on 29 August 2022).
- Infrared Spectroscopy Absorption Table. Available online: https://chem.libretexts.org/Ancillary_Materials/Reference/Reference_Tables/Spectroscopic_Parameters/Infrared_Spectroscopy_Absorption_Table (accessed on 29 August 2022).
- Hosseini, E.; Kollath, V.O.; Karan, K. The key mechanism of conductivity in PEDOT:PSS thin films exposed by anomalous conduction behaviour upon solvent-doping and sulfuric acid post-treatment. J. Mater. Chem. C 2019, 8, 3982–3990. [Google Scholar] [CrossRef]
- Hosseini, E.; Arjmand, M.; Sundararaj, U.; Karan, K. Filler-Free Conducting Polymers as a New Class of Transparent Electromagnetic Interference Shields. ACS Appl. Mater. Interfaces 2020, 12, 28596–28606. [Google Scholar] [CrossRef]
- Bahry, T.; Cui, Z.; Deniset-Besseau, A.; Gervais, M.; Sollogoub, C.; Bui, T.-T.; Remita, S. An alternative radiolytic route for synthesizing conducting polymers in an organic solvent. New J. Chem. 2018, 42, 8704–8716. [Google Scholar] [CrossRef]
- Aasmundtveit, K.; Samuelsen, E.; Pettersson, L.; Inganäs, O.; Johansson, T.; Feidenhans’L, R. Structure of thin films of poly(3,4-ethylenedioxythiophene). Synth. Met. 1999, 101, 561–564. [Google Scholar] [CrossRef]
- Tran-Van, F.; Garreau, S.; Louarn, G.; Froyer, G.; Chevrot, C. Fully undoped and soluble oligo(3,4-ethylenedioxythiophene)s: Spectroscopic study and electrochemical characterization. J. Mater. Chem. 2001, 11, 1378–1382. [Google Scholar] [CrossRef]
- Zhang, Y.; Xin, M.; Lin, W.; Yu, Z.; Peng, J.; Xu, K.; Chen, M. Synthesis and characterization of PEDOT particles in aqueous dispersion of π-conjugated polyelectrolyte. Synth. Met. 2014, 193, 8–16. [Google Scholar] [CrossRef]
- Fulmer, G.R.; Miller, A.J.M.; Sherden, N.M.; Gottlieb, H.E.; Nudelman, A.; Stoltz, B.M.; Bercaw, J.E.; Goldberg, K.I. NMR Chemical Shifts of Trace Impurities: Common Laboratory Solvents, Organics, and Gases in Deuterated Solvents Relevant to the Organometallic Chemist. Organometallics 2010, 29, 2176–2179. [Google Scholar] [CrossRef] [Green Version]
- Ding, Y.; Xu, W.; Wang, W.; Fong, H.; Zhu, Z. Scalable and Facile Preparation of Highly Stretchable Electrospun PE-DOT:PSS@PU Fibrous Nonwovens toward Wearable Conductive Textile Applications. ACS Appl. Mater. Interfaces 2017, 9, 30014–30023. [Google Scholar] [CrossRef] [PubMed]
- Fazakas-Anca, I.S.; Modrea, A.; Vlase, S. Determination of Reactivity Ratios from Binary Copolymerization Using the k-Nearest Neighbor Non-Parametric Regression. Polymers 2021, 13, 3811. [Google Scholar] [CrossRef] [PubMed]


| Sample | m (ThBr)/mg | m (EDOT)/mg | m (FeCl3)/mg |
|---|---|---|---|
| TE-1:0.2 | 208 | 21 | 583.9 |
| TE-1:0.4 | 208 | 43 | 681.3 |
| TE-1:0.6 | 208 | 64 | 778.7 |
| TE-1:0.8 | 208 | 86 | 876.1 |
| TE-1:1 | 200 | 102 | 930.7 |
| TE-0.8:1 | 160 | 102 | 837.6 |
| TE-0.6:1 | 120 | 102 | 744.5 |
| TE-0.4:1 | 80 | 102 | 651.4 |
| TE-0.2:1 | 40 | 102 | 558.3 |
| Sample Name | Mn | Mw | Ð |
|---|---|---|---|
| g mol−1 | |||
| PEDOT-Br 8 h | 1.863 × 10⁵ | 4.002 × 10⁵ | 2.15 |
| PEDOT-Br 16 h | 2.030 × 10⁵ | 4.169 × 10⁵ | 2.05 |
| PEDOT-Br 24 h | 2.941 × 10⁵ | 4.636 × 10⁵ | 1.58 |
| PEDOT-Br 48 h | 2.900 × 10⁵ | 4.376 × 10⁵ | 1.51 |
| Starting Ratio | NMR Ratio | |||
|---|---|---|---|---|
| Sample | ThBr | EDOT | ThBr | EDOT |
| TE 1:0.2 | 1 | 0.2 | 1 | 0.20 |
| TE 1:0.4 | 1 | 0.4 | 1 | 0.44 |
| TE 1:0.6 | 1 | 0.6 | 1 | 0.68 |
| TE 1:0.8 | 1 | 0.8 | 1 | 0.84 |
| TE 1:1 | 1 | 1 | 1 | 1.06 |
| TE 0.2:1 | 0.2 | 1 | 0.20 | 1 |
| TE 0.4:1 | 0.4 | 1 | 0.32 | 1 |
| TE 0.6:1 | 0.6 | 1 | 0.53 | 1 |
| TE 0.8:1 | 0.8 | 1 | 0.77 | 1 |
| Sample Name | R (Ω) | ρ (Ω cm) | σ (S cm−1) |
|---|---|---|---|
| PEDOT | 1916 | 722 | 1.39 × 10⁻³ |
| T:E 0.6:1 | 2752 | 694 | 1.44 × 10⁻³ |
| T:E 1:1 | 5630 | 1372 | 0.73 × 10⁻³ |
| T:E 1:0.6 | 4875 | 3555 | 0.28 × 10⁻³ |
| PThBr | 20,167 | 6977 | 0.14 × 10⁻³ |
| Starting Monomer Ratio | Monomer Ratio in Copolymer | Fineman–Ross | Kelen–Tüdos | |||||||
|---|---|---|---|---|---|---|---|---|---|---|
| Sample | M1 | M(1+2) | f1 | M1* | M(1+2*) | F1 | H | G | η | µ |
| TE 1:0.2 | 1.00 | 1.20 | 0.83 | 1.00 | 1.20 | 0.83 | 5.00 | 4.00 | 0.67 | 0.83 |
| TE 1:0.4 | 1.00 | 1.40 | 0.71 | 1.00 | 1.44 | 0.69 | 2.75 | 1.40 | 0.37 | 0.73 |
| TE 1:0.6 | 1.00 | 1.60 | 0.63 | 1.00 | 1.68 | 0.60 | 1.89 | 0.53 | 0.18 | 0.65 |
| TE 1:0.8 | 1.00 | 1.80 | 0.56 | 1.00 | 1.84 | 0.54 | 1.31 | 0.20 | 0.09 | 0.57 |
| TE 1:1 | 1.00 | 2.00 | 0.50 | 1.00 | 2.06 | 0.49 | 1.06 | −0.06 | −0.03 | 0.51 |
| TE 0.8:1 | 0.80 | 1.80 | 0.44 | 0.77 | 1.77 | 0.44 | 0.83 | −0.24 | −0.13 | 0.45 |
| TE 0.6:1 | 0.60 | 1.60 | 0.38 | 0.53 | 1.53 | 0.35 | 0.68 | −0.53 | −0.32 | 0.40 |
| TE 0.4:1 | 0.40 | 1.40 | 0.29 | 0.32 | 1.32 | 0.24 | 0.50 | −0.85 | −0.57 | 0.33 |
| TE 0.2:1 | 0.20 | 1.20 | 0.17 | 0.20 | 1.20 | 0.17 | 0.20 | −0.80 | −0.67 | 0.17 |
Disclaimer/Publisher’s Note: The statements, opinions and data contained in all publications are solely those of the individual author(s) and contributor(s) and not of MDPI and/or the editor(s). MDPI and/or the editor(s) disclaim responsibility for any injury to people or property resulting from any ideas, methods, instructions or products referred to in the content. |
© 2023 by the authors. Licensee MDPI, Basel, Switzerland. This article is an open access article distributed under the terms and conditions of the Creative Commons Attribution (CC BY) license (https://creativecommons.org/licenses/by/4.0/).
Share and Cite
Božičević, M.; Fiket, L.; Vujasinović, M.; Blažic, R.; Kovačić, M.; Katančić, Z. Investigation of the Conditions for the Synthesis of Poly(3,4-ethylenedioxythiophene) ATRP Macroinitiator. Polymers 2023, 15, 253. https://doi.org/10.3390/polym15020253
Božičević M, Fiket L, Vujasinović M, Blažic R, Kovačić M, Katančić Z. Investigation of the Conditions for the Synthesis of Poly(3,4-ethylenedioxythiophene) ATRP Macroinitiator. Polymers. 2023; 15(2):253. https://doi.org/10.3390/polym15020253
Chicago/Turabian StyleBožičević, Marin, Lucija Fiket, Magdalena Vujasinović, Roko Blažic, Marin Kovačić, and Zvonimir Katančić. 2023. "Investigation of the Conditions for the Synthesis of Poly(3,4-ethylenedioxythiophene) ATRP Macroinitiator" Polymers 15, no. 2: 253. https://doi.org/10.3390/polym15020253