Article

Effect of Cooling Temperature on Crystalline Behavior of Polyphenylene Sulfide/Glass Fiber Composites

Chemical Materials R&D Department, Chassis & Materials Research Laboratory, Korea Automotive Technology Institute, 303 Pungse-ro, Pungse-myeon, Dongnam-gu, Cheonan-si 31214, Republic of Korea
*
Author to whom correspondence should be addressed.
Polymers 2023, 15(15), 3179; https://doi.org/10.3390/polym15153179
Submission received: 7 July 2023 / Revised: 23 July 2023 / Accepted: 24 July 2023 / Published: 26 July 2023
(This article belongs to the Special Issue Advances in Structure-Property Relationship of Polymer Materials)

Abstract

:
Poly (phenylene sulfide) (PPS) is a super engineering plastic that has not only excellent rigidity and high chemical resistance but also excellent electrical insulation properties; therefore, it can be applied as an electronic cover or an overheating prevention component. This plastic has been extensively applied in the manufacture of capacitor housing as, in addition to being a functional and lightweight material, it has a safety feature that can block the electrical connection between the electrolyte inside and outside the capacitor. Moreover, the fabrication of PPS composites with high glass fiber (GF) content facilitates the development of lightweight and excellent future materials, which widens the scope of the application of this polymer. However, the crystallinity and mechanical properties of PPS/GF composites have been found to vary depending on the cooling temperature. Although extensive studies have been conducted on the influence of cooling temperature on the crystalline behavior of PPS-based composites, there has been limited research focused particularly on PPS/GF composites for capacitor housing applications. In this study, to apply PPS/GF composites as film capacitor housings, specimens were prepared via injection molding at different cooling temperatures to investigate the composites’ tensile, flexural, and impact energy absorption properties resulting in increases in mechanical properties at high cooling mold temperature. Fracture surface analysis was also performed on the fractured specimens after the impact test to confirm the orientation of the GF and the shape of the micropores. Finally, the crystallinity of the composites increased with higher cooling temperatures due to the extended crystallization time.

1. Introduction

Polyphenylene sulfide (PPS) is a high-performance thermoplastic polymer with excellent mechanical, thermal, and chemical properties, making it suitable for a wide range of industrial applications [1,2]. It exhibits excellent dimensional stability, flame resistance, and resistance to chemicals, solvents, and high temperatures. These properties make it a favored choice in various sectors, including the automotive, aerospace, electrical, and electronics industries [3,4].
PPS-based composites reinforced with glass fibers (GF) have garnered significant attention in recent years owing to their enhanced mechanical strength and dimensional stability [5,6,7]. These composites combine the desirable properties of PPS with the added reinforcement provided by GF, resulting in an improved performance [6,8]. Notably, PPS/GF composites have been extensively applied in the manufacturing of capacitor housings.
The crystalline structure of the PPS/GF composites plays a pivotal role in determining their properties [7,9]. The arrangement and morphology of the crystalline phase significantly affect various characteristics, including mechanical strength, electrical properties, and thermal stability [1,10,11]. Consequently, understanding the crystalline behavior of PPS/GF composites is essential to optimizing their processing conditions and tailoring their properties to satisfy specific application requirements.
Although the influence of cooling temperature on the crystalline behavior of PPS-based composites has been explored in previous studies, limited research has focused specifically on PPS/GF composites for capacitor housing applications [12,13,14,15,16].
Preliminary research on PPS/GF composites demonstrated the significance of their crystalline behavior concerning their properties. Jeong et al., investigated the effect of cooling temperature on the crystallinity and mechanical properties of PPS/GF composites and found that variations in cooling temperature led to changes in the degree of crystallinity and, consequently, affected the mechanical strength of the composites [17]. Similarly, Zuo et al., examined the influence of cooling rate on the crystalline structure and physical properties of PPS/GF composites, highlighting the importance of crystalline behavior in determining the physicochemical properties of the materials [18].
However, despite these valuable contributions, a comprehensive understanding of the crystalline behavior of PPS/GF composites in capacitor housing applications is still lacking. Thus, further investigation into the effect of the cooling temperature on the crystalline behavior of these composites is warranted to fill this research gap. Such knowledge is essential for optimizing the processing conditions and tailoring the properties of PPS/GF composites to meet the specific requirements of capacitor housing.
This study aims to bridge this gap by investigating the crystalline behavior of PPS/GF composites for capacitor housing applications, specifically focusing on the influence of cooling temperature. X-ray diffraction (XRD) and differential scanning calorimetry (DSC) were used to analyze the crystalline structure of the composites, including the degree of crystallinity, crystalline phase content, and crystal size. Additionally, the mechanical properties of the composites, including the tensile strength, flexural strength, impact absorbed energy, dynamic mechanical properties, and fiber alignment in the matrix, were evaluated to establish correlations with the observed crystalline behavior.
The findings of this study, coupled with preliminary research, contribute to a comprehensive understanding of the processing–structure–property relationships of PPS/GF composites for capacitor housing applications. This knowledge will facilitate the development of high-performance composites tailored to satisfy the stringent requirements of the electronics industry.

2. Materials and Methods

2.1. Preparation of PPS/GF Composites

The PPS compounds reinforced with a 55% weight fraction of short glass fibers, which is currently being applied in electric vehicle (EV) capacitor housings, were supplied by Toray Advanced Composites Corporation (Tokyo, Japan). The plate samples were manufactured with the barrel set at 300 °C by injection molding as shown in Figure 1. By varying the injection mold temperature, which can be called the cooling temperature, an independent variable, the changes in the specific properties of the specimens according to the mold temperature were analyzed for the PPS/GF 55 wt.% composites. Importantly, the mold temperatures were set at 80, 100, 120, 140, and 160 °C, indicating that the injected polymer resin was cooled at these respective temperatures. Furthermore, insulation plates and a temperature control system were installed to stabilize the mold temperature. The molded product is shown in Figure 1a,b. Dog-bond-shaped and rectangular plate specimens were prepared for tensile, flexural, Izod, and drop-weight impact tests.

2.2. Characterization

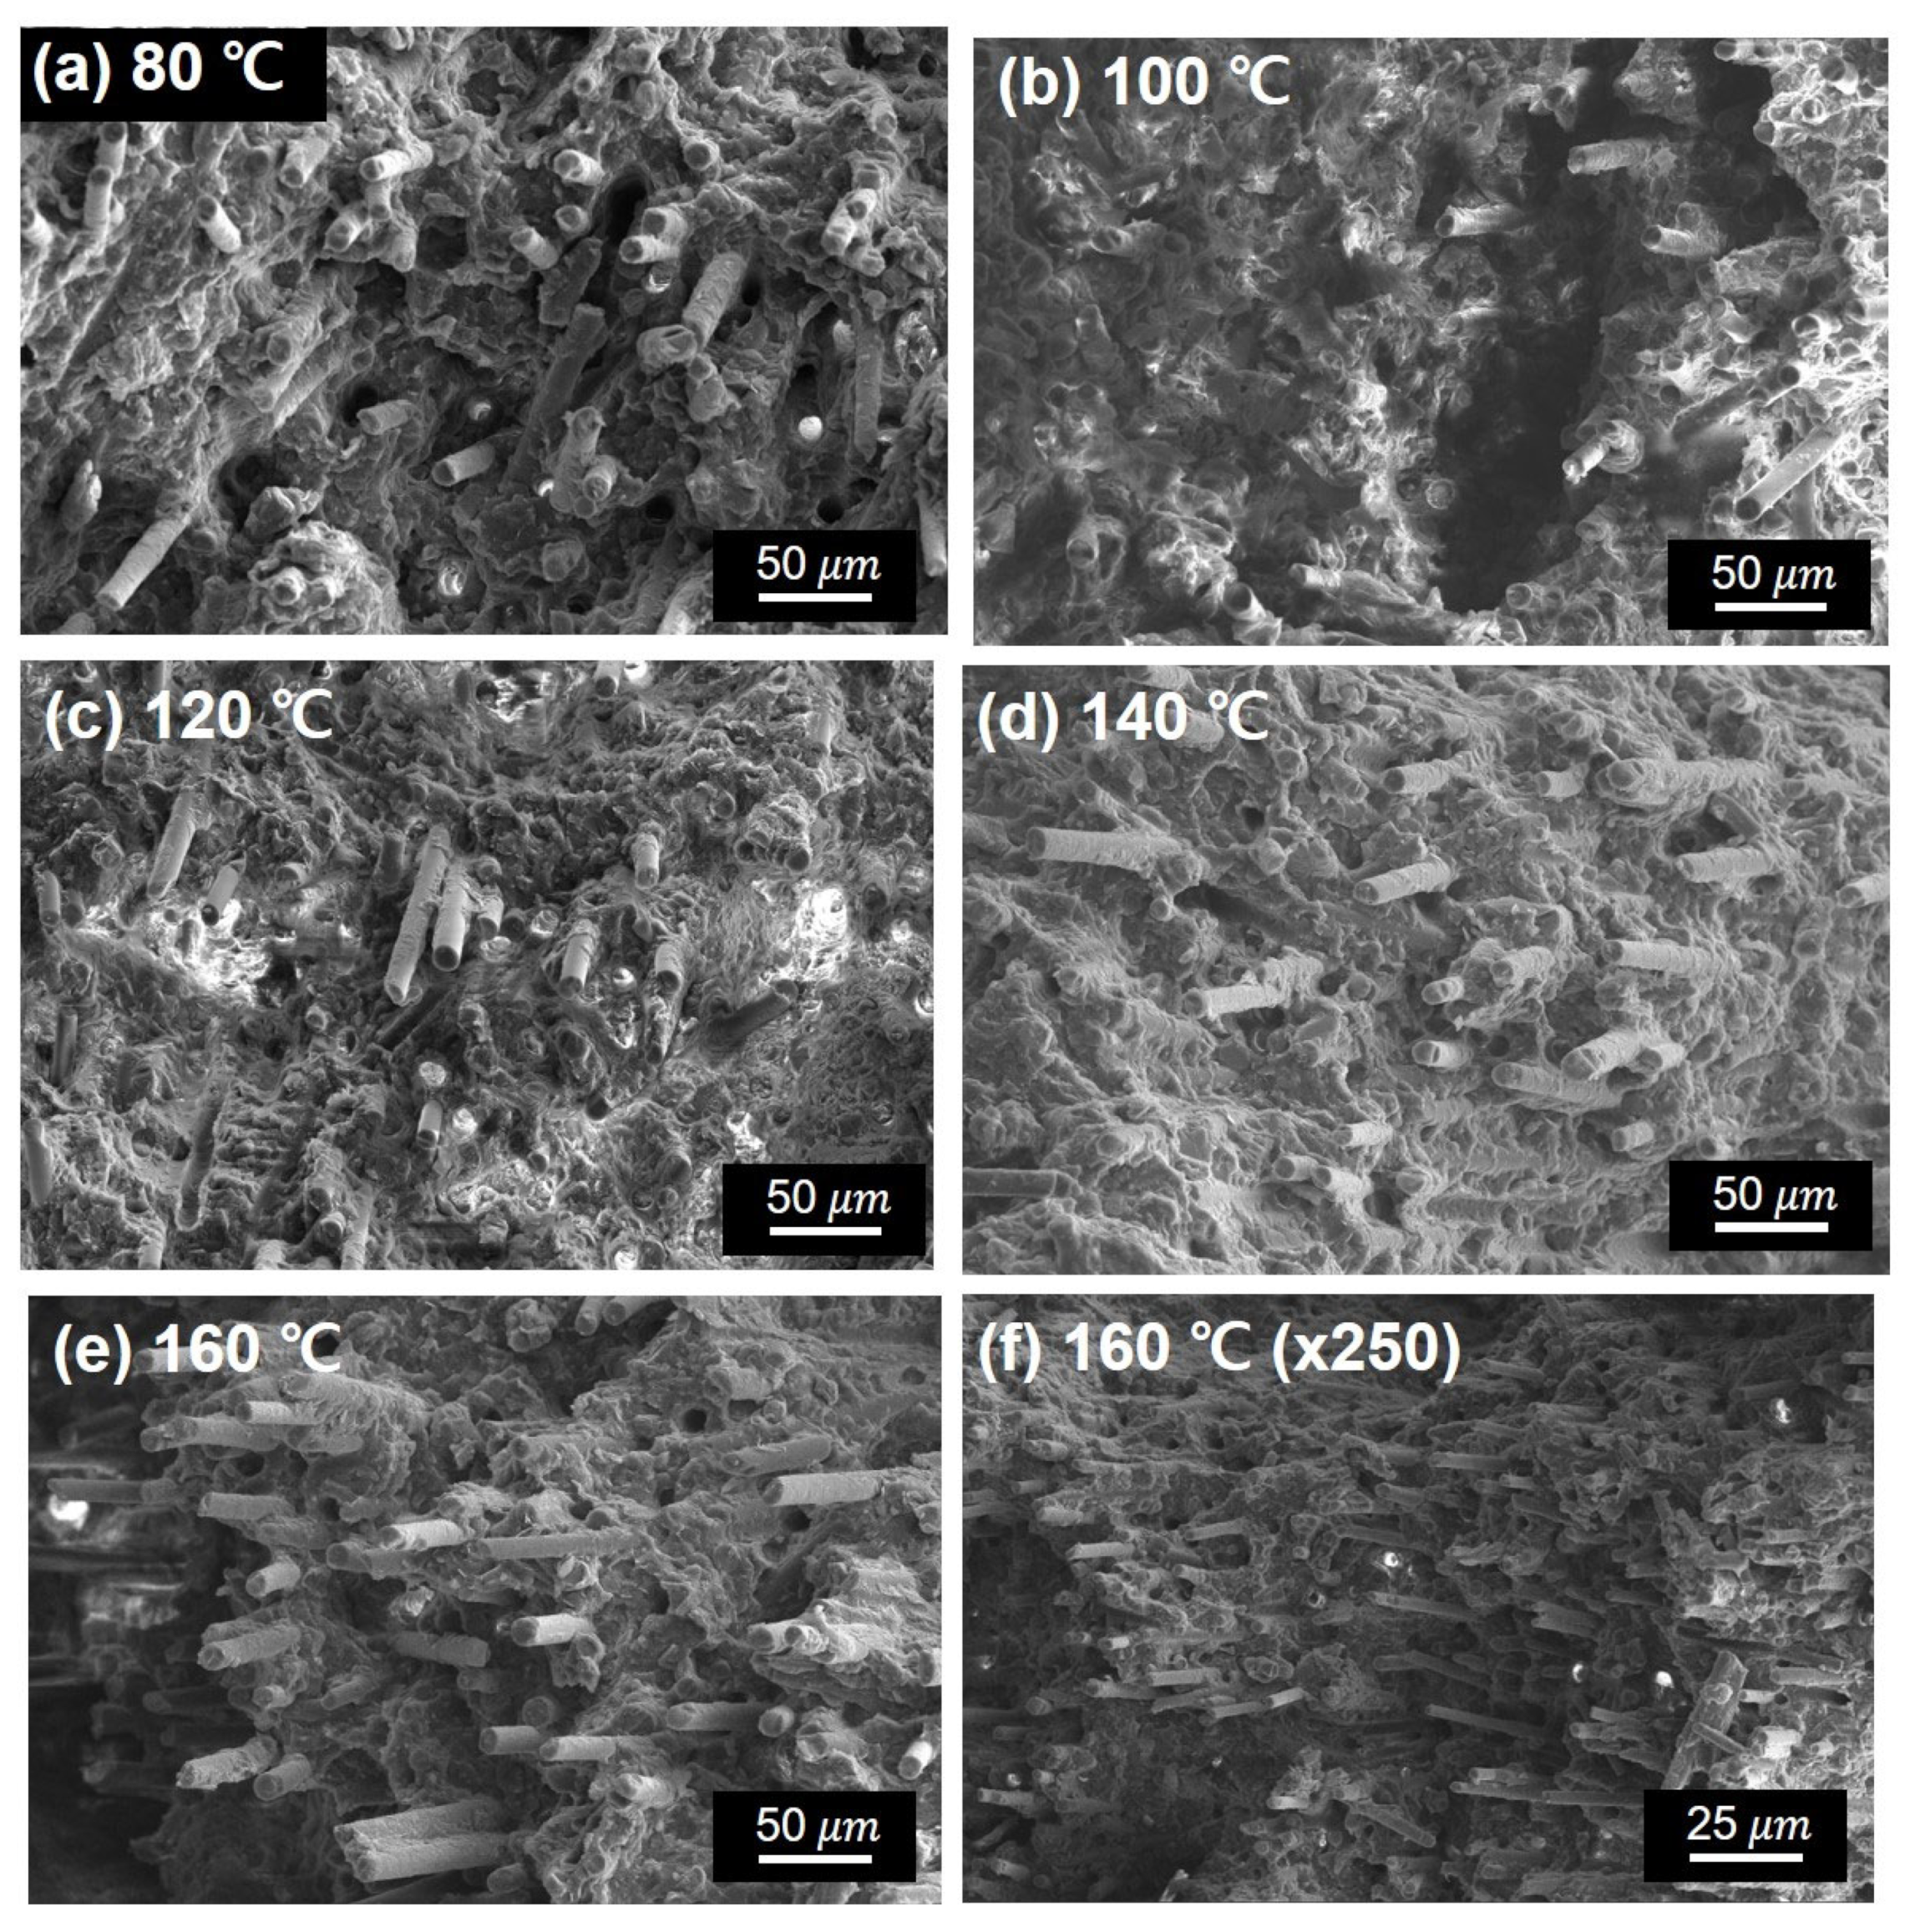
2.2.1. Morphology Analysis

The cross-sectional morphologies and orientation of GF in the composites were investigated using field-emission scanning electron microscopy (FE-SEM) (Helios 5 Hydra, Thermo Fisher Scientific, Waltham, MA, USA) at an accelerating voltage of 20 kV. The fractured tips were cut from the drop-weight impact-tested specimen for the fracture surface analysis. A cross-sectional surface analysis was performed by fracturing the samples after ultrasonic cleaning and coating them with Pt.

2.2.2. Crystallographic Analysis

The crystallization behavior of PPS in the composites was analyzed via X-ray diffraction (XRD). XRD patterns of the PPS/GF composites were obtained in the 2θ range 5–50° at a rate of 5°/min, using the high-resolution X-ray diffractometer (MiniFlex600, Rigaku, Tokyo, Japan) with the Cu Kα target at 40 kV and 20 mA. The crystallite size of the composites at different reflection planes (110, 200) was calculated using Scherrer’s equation as follows:
H = 0.9 λ β c o s θ
where H is the height of the stacking layers, λ is the wavelength of the X-rays, and β is the full width at half maximum (2θ). Furthermore, the crystallinity index (CI) of the films was calculated using the following equation:
CI = A c A c + A a
where Ac is the integrated area of the crystalline peaks, and Aa is the integrated area under the amorphous halo. Thermal studies were conducted by differential scanning calorimetry (DSC) (DSC400, Perkin Elmer, Waltham, MA, USA). Nitrogen gas was purged into the chamber at a 20 mL/min flow rate during the DSC measurements. The crystallization isotherms of the samples were investigated by completing a heating–cooling cycle, where the samples were first heated from 30 °C to 350 °C at a ramping rate of 10 °C/min and then cooled to 30 °C at a ramping rate of 10 °C/min. The third scan was performed from 30 °C to 350 °C at a rate of 10 °C/min, during which the melting endotherms were identified. The degree of crystallinity (Χc) was calculated as follows:
X c = Δ H m Δ H 0 m × 100 %
where ΔHm and ΔH0m (150.4 J/g) are the enthalpies of the pure PPS matrix [15,19].

2.2.3. Thermal Analysis

The thermal stabilities of the PPS/GF composites at different cooling temperatures were investigated using thermogravimetric analysis (TGA) (TGA4000, Perkin Elmer, Waltham, MA, USA) in a nitrogen environment at a flow rate of 20 mL/min. The samples were heat-treated from 30 °C to 850 °C at a ramp rate of 10 °C/min.

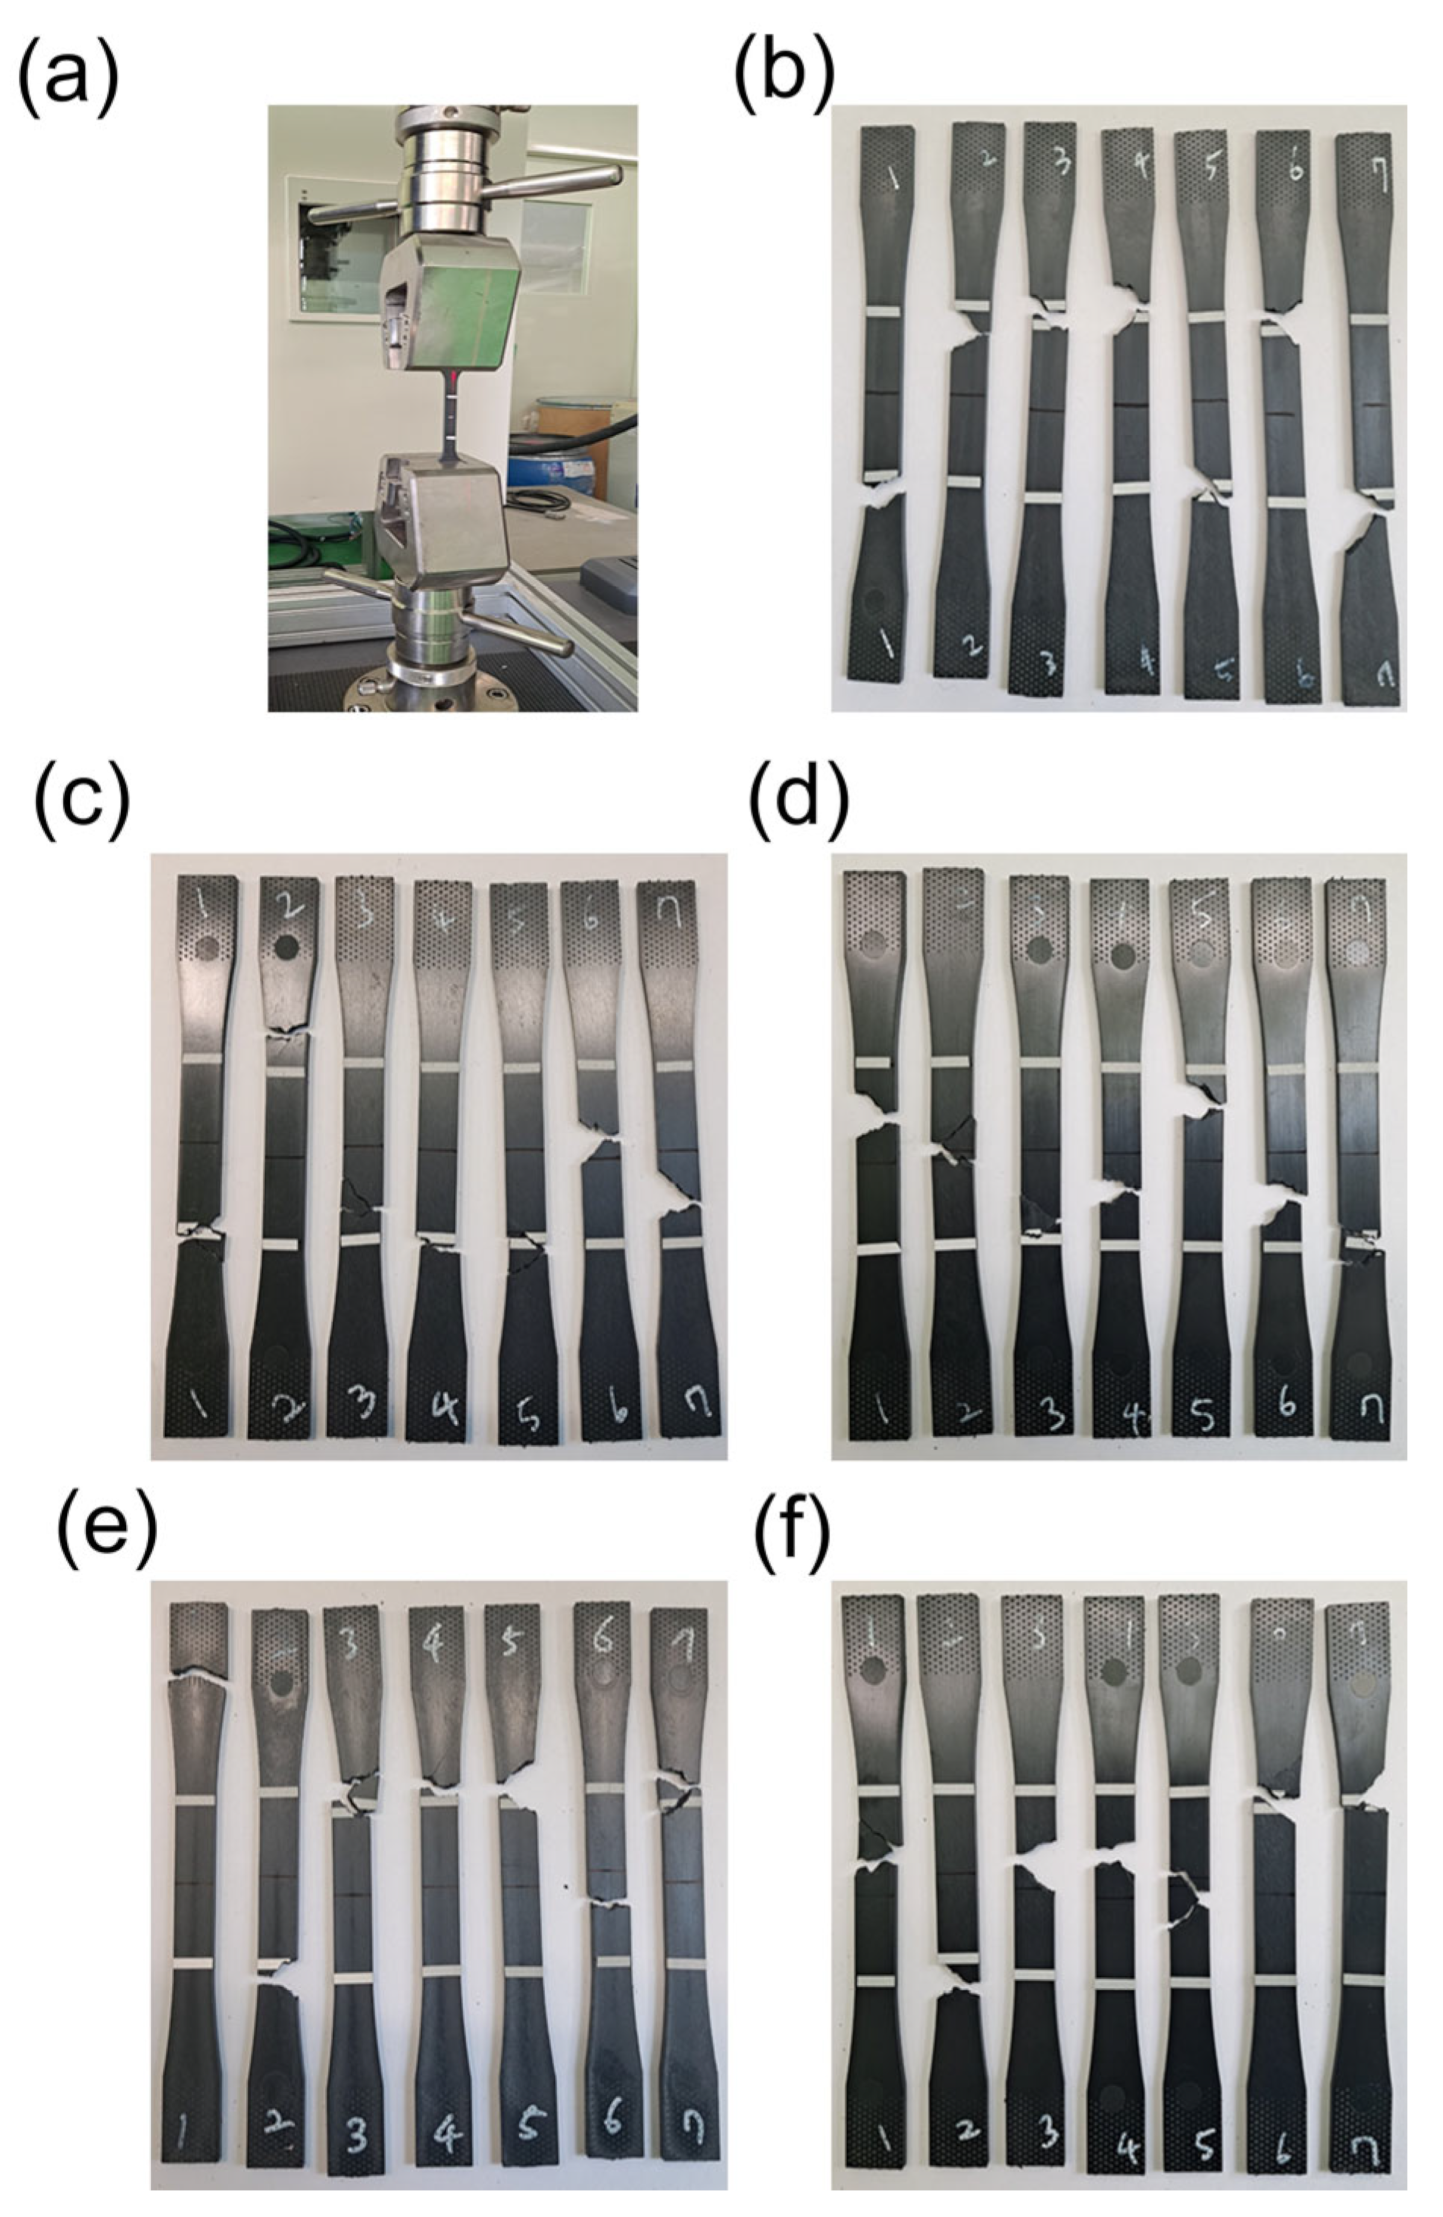
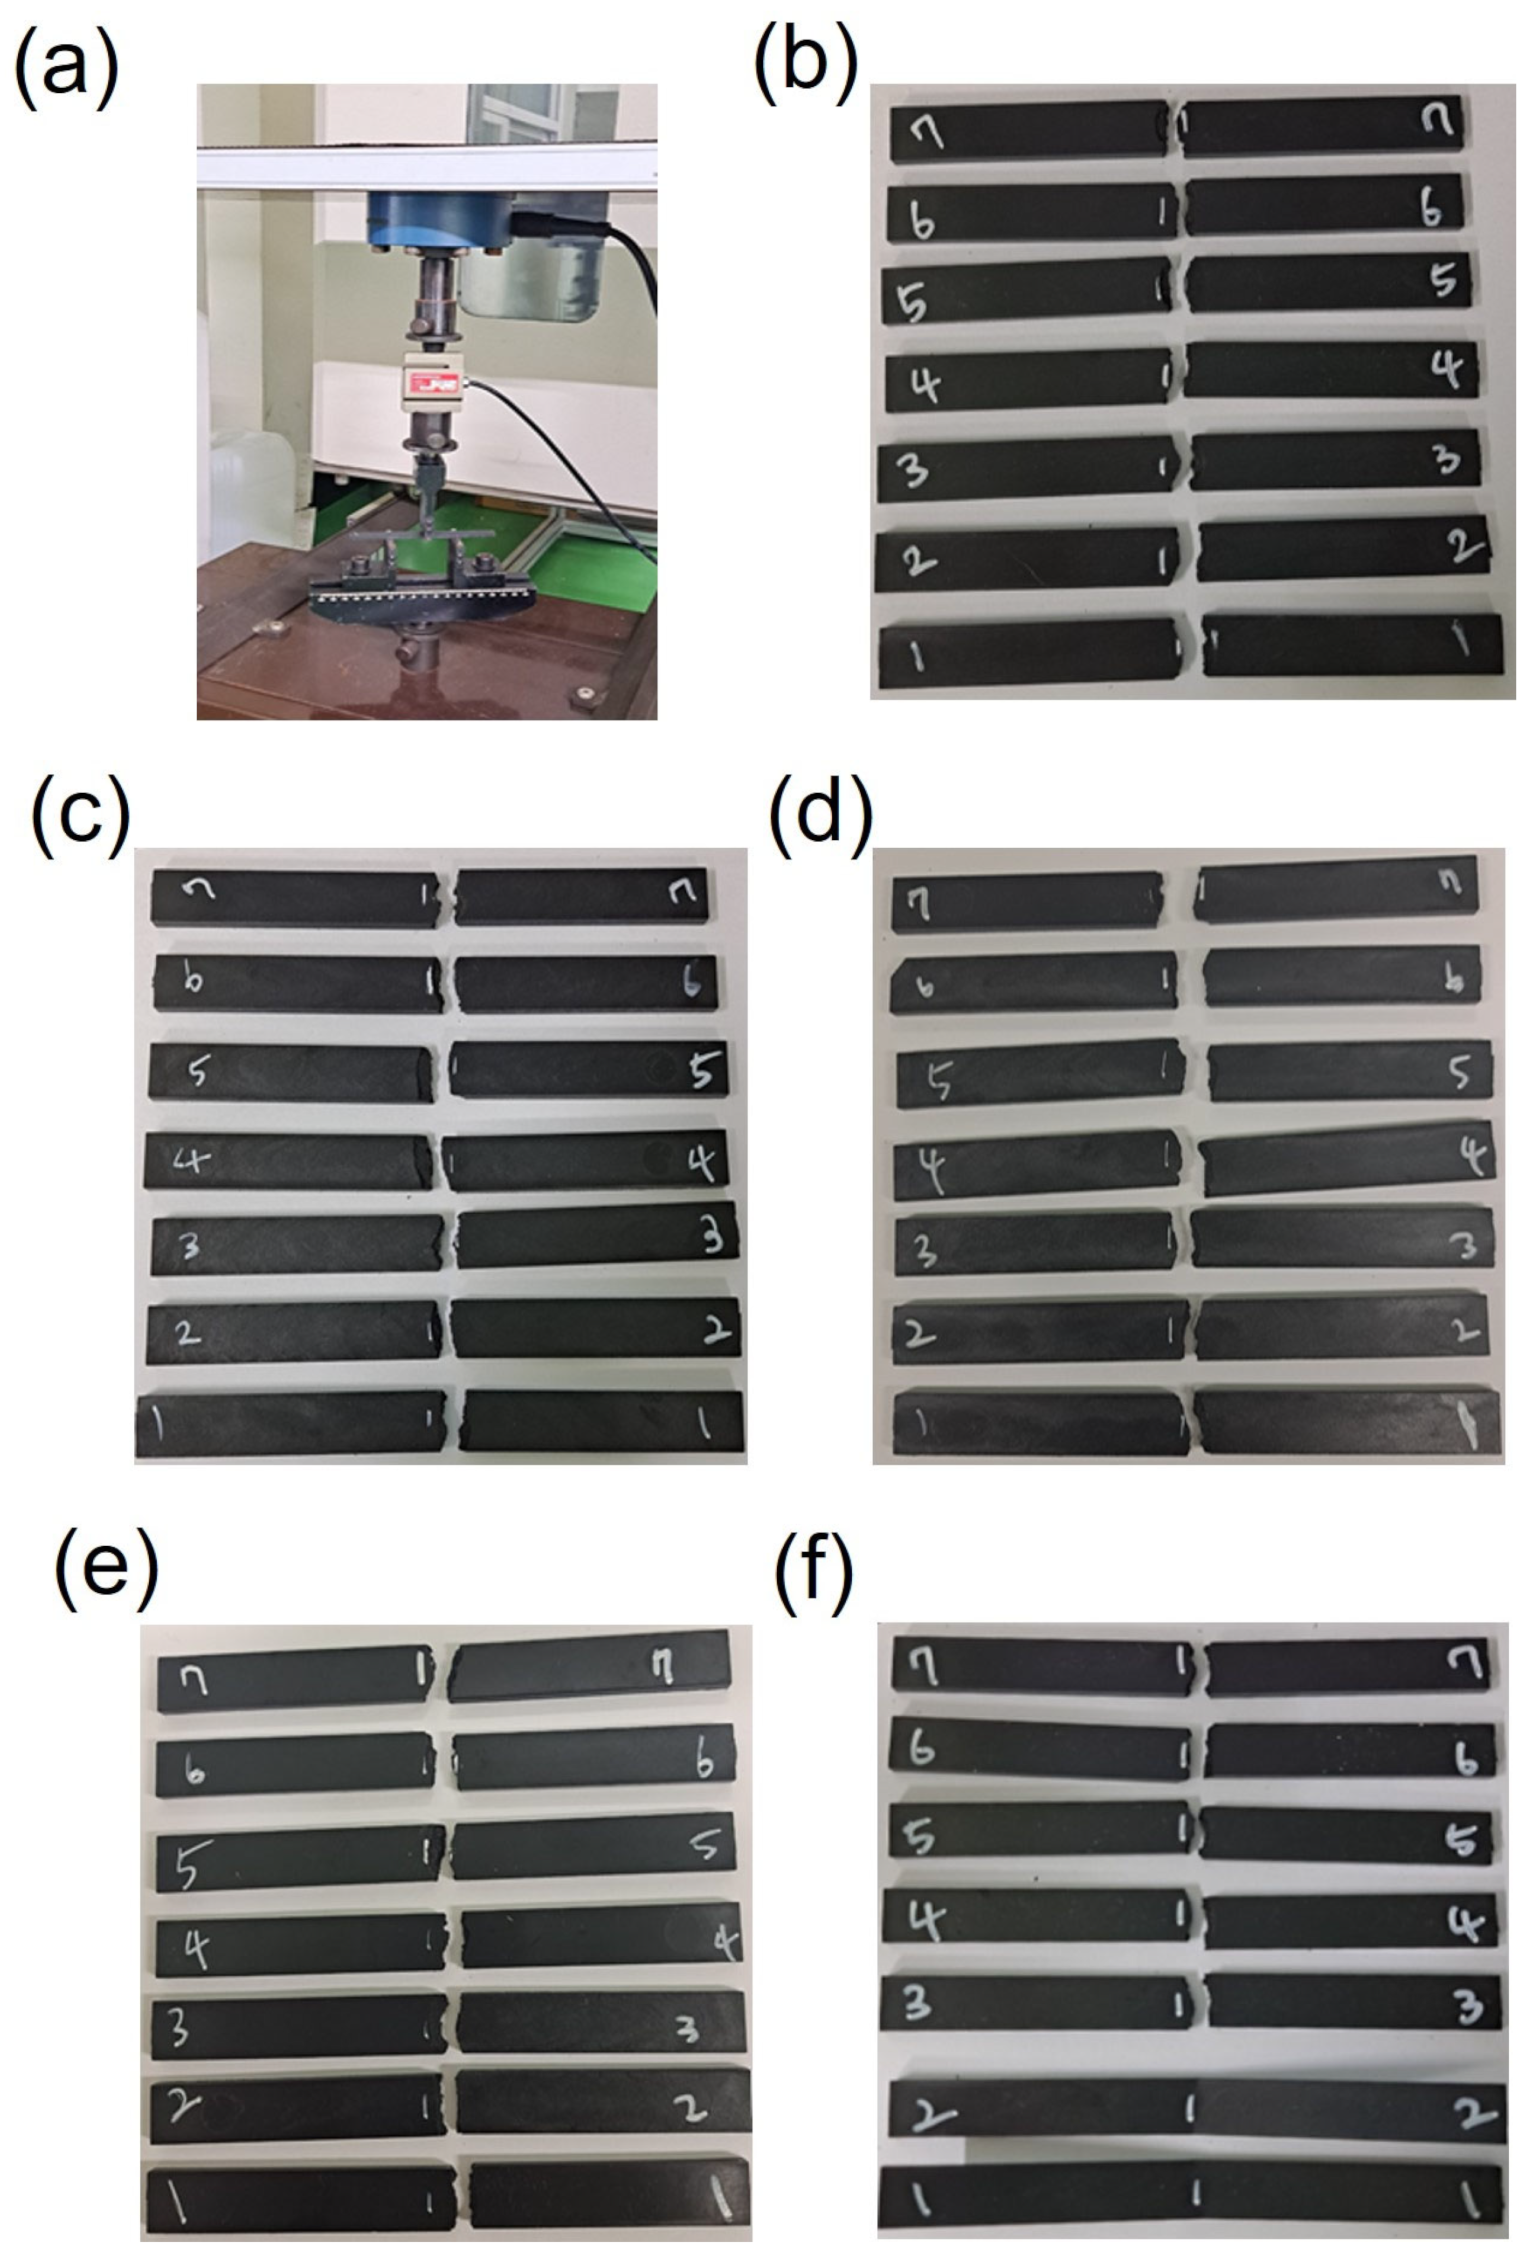
2.2.4. Mechanical Testing

The tensile properties of the composites were measured using a tensile test machine (MINOS-300, MTDI, Daejeon, Republic of Korea) at a crosshead speed of 5 mm/min in accordance with the ASTM D638 standard [20]. The tensile strengths, strains, and elastic moduli of the specimens were evaluated seven times. Flexural tests of the composites were conducted based on the three-point bending mode according to ASTM D790 standards [21] (80 × 10 × 4 mm3 with a support span length of 52 mm). A constant crosshead speed of 2.8 mm/min was used for the bending tests of all samples. Flexural strength was calculated using the following equation:
Fs = 3 PL 2 b d 2
where Fs is the flexural strength, P is the maximum load, L is the length of the support span; b is the width, and d is the specimen thickness. Furthermore, the hardness of the composites was investigated using Rockwell and Shore D tests in accordance with the ASTM D785 and D2240 standards (100 × 100 ×   3 mm3), respectively. The dynamic mechanical behavior of the composites was analyzed using dynamic mechanical analysis equipment (DMA8000, Perkin Elmer, Waltham, MA, USA) in accordance with the ASTM D4065 standard. The measurements were carried out in multi-frequency strain mode using a 3-point bending clamp within the temperature range from 30 °C to 200 °C, with a heating rate of 3 °C/min at 1 Hz. Finally, a drop-weight impact test was conducted to investigate the absorbed energy of the PPS/GF composites using a drop tower high-velocity impact tester (Instron, CEAST 9450, Norwood, MA, USA) with an impact speed of 2.72 m/s and an impact energy of 20 J in accordance with ASTM D7136 standards [22] (100 × 100 × 3 mm3).

3. Results

3.1. Crystallization Behavior of PPS/GF Composites

As shown in Figure 2, the representative peak at ~20 ° is ascribed to the (110) and (200) crystalline planes of PPS [23,24]. As the cooling temperature increases from 80 °C to 160 °C, the peak intensity increases, showing a sharper peak than that at 80 °C; there is no crystalline peak at 20 ° , meaning that crystallization of PPS has not yet progressed at 80 °C. In other words, because the cooling temperature was relatively low, there was insufficient time for PPS crystallization to proceed. Therefore, as the cooling temperature gradually increases, the PPS peak intensifies and becomes most active at 160 °C; hence, there is sufficient time for the PPS chain to crystallize at a cooling temperature of 160 °C. Accordingly, the crystallinity (CI) and crystallite size of the PPS/GF composites increases by 100% and 353%, gradually as cooling the temperature increases from 80 °C to 160 °C, as listed in Table 1. In other words, the higher the cooling temperature, the more time it takes for the PPS chain to crystallize, which can result in an increase in crystallinity. In addition, an increase in the cooling temperature was confirmed to affect the crystallization of PPS through the behavior of the crystal size. Meanwhile, the two strong peaks at 28 ° and 30 ° , which are related to quartz (101) crystalline plane and hexagonal calcite (104) crystalline planes of calcium carbonate, respectively, can be seen in all cases as having a stable initial shape [25,26,27]. In addition, the 48 ° peak is related to the (116) calcite plane. Calcium carbonate is widely used as a filler for surface coatings, leading to hydrophobicity or mechanical and thermal properties, particularly non-flammability, in polymer composites.

3.2. Thermal Properties of PPS/GF Composites

The crystallization behavior of the PPS/GF composites resulting from their thermal properties was investigated via DSC analysis and compared with the XRD results (Figure 3 and Table 2). The melting (Tm) and crystallization temperatures (Tc) were measured by increasing the temperature for two cycles, and the degree of crystallinity (%Xc) was calculated from the exothermic heat–flow curve of the DSC results to conduct a comparative analysis of the relative crystallinity. As shown in Figure 3, the melting points (Tm) and crystallization temperatures (Tc) of the PPS composites at each cooling temperature exhibited similar trends and gradually increased. The higher the cooling temperature, the finer were the densely stacked crystals; moreover, the melting enthalpy increases, resulting in an increase in crystallinity [11,28,29,30]. This is consistent with the XRD analysis of the crystallization behavior of the PPS/GF composites at different cooling temperatures. Accordingly, 160 °C was concluded to be the appropriate temperature for the injection mold temperature for the PPS composites, including 55 wt.% of GF with high crystallinity.
The thermal degradation behavior of the PPS/GF composites was investigated by TGA (Figure 3d and Table 3). The 5% weight loss (TD95%) temperature of the PPS/GF composites for each cooling temperature slightly increases as the cooling temperature increases, indicating high thermal stability owing to high chain stacking density and crystallinity. Furthermore, the temperature at which the first decomposition occurs (TD1) is between 417 and 426 °C, and the temperature at which PPS, the matrix, is decomposed (TD2) was confirmed to be approximately 578 °C on average. Conclusively, at a cooling temperature of 160 °C, the thermal decomposition temperature is the highest overall; thermal stability is also high. Moreover, over all conditions ramping the temperature to 900 °C, approximately 13% of inorganic materials, except for 55 wt.% of GF, remained.

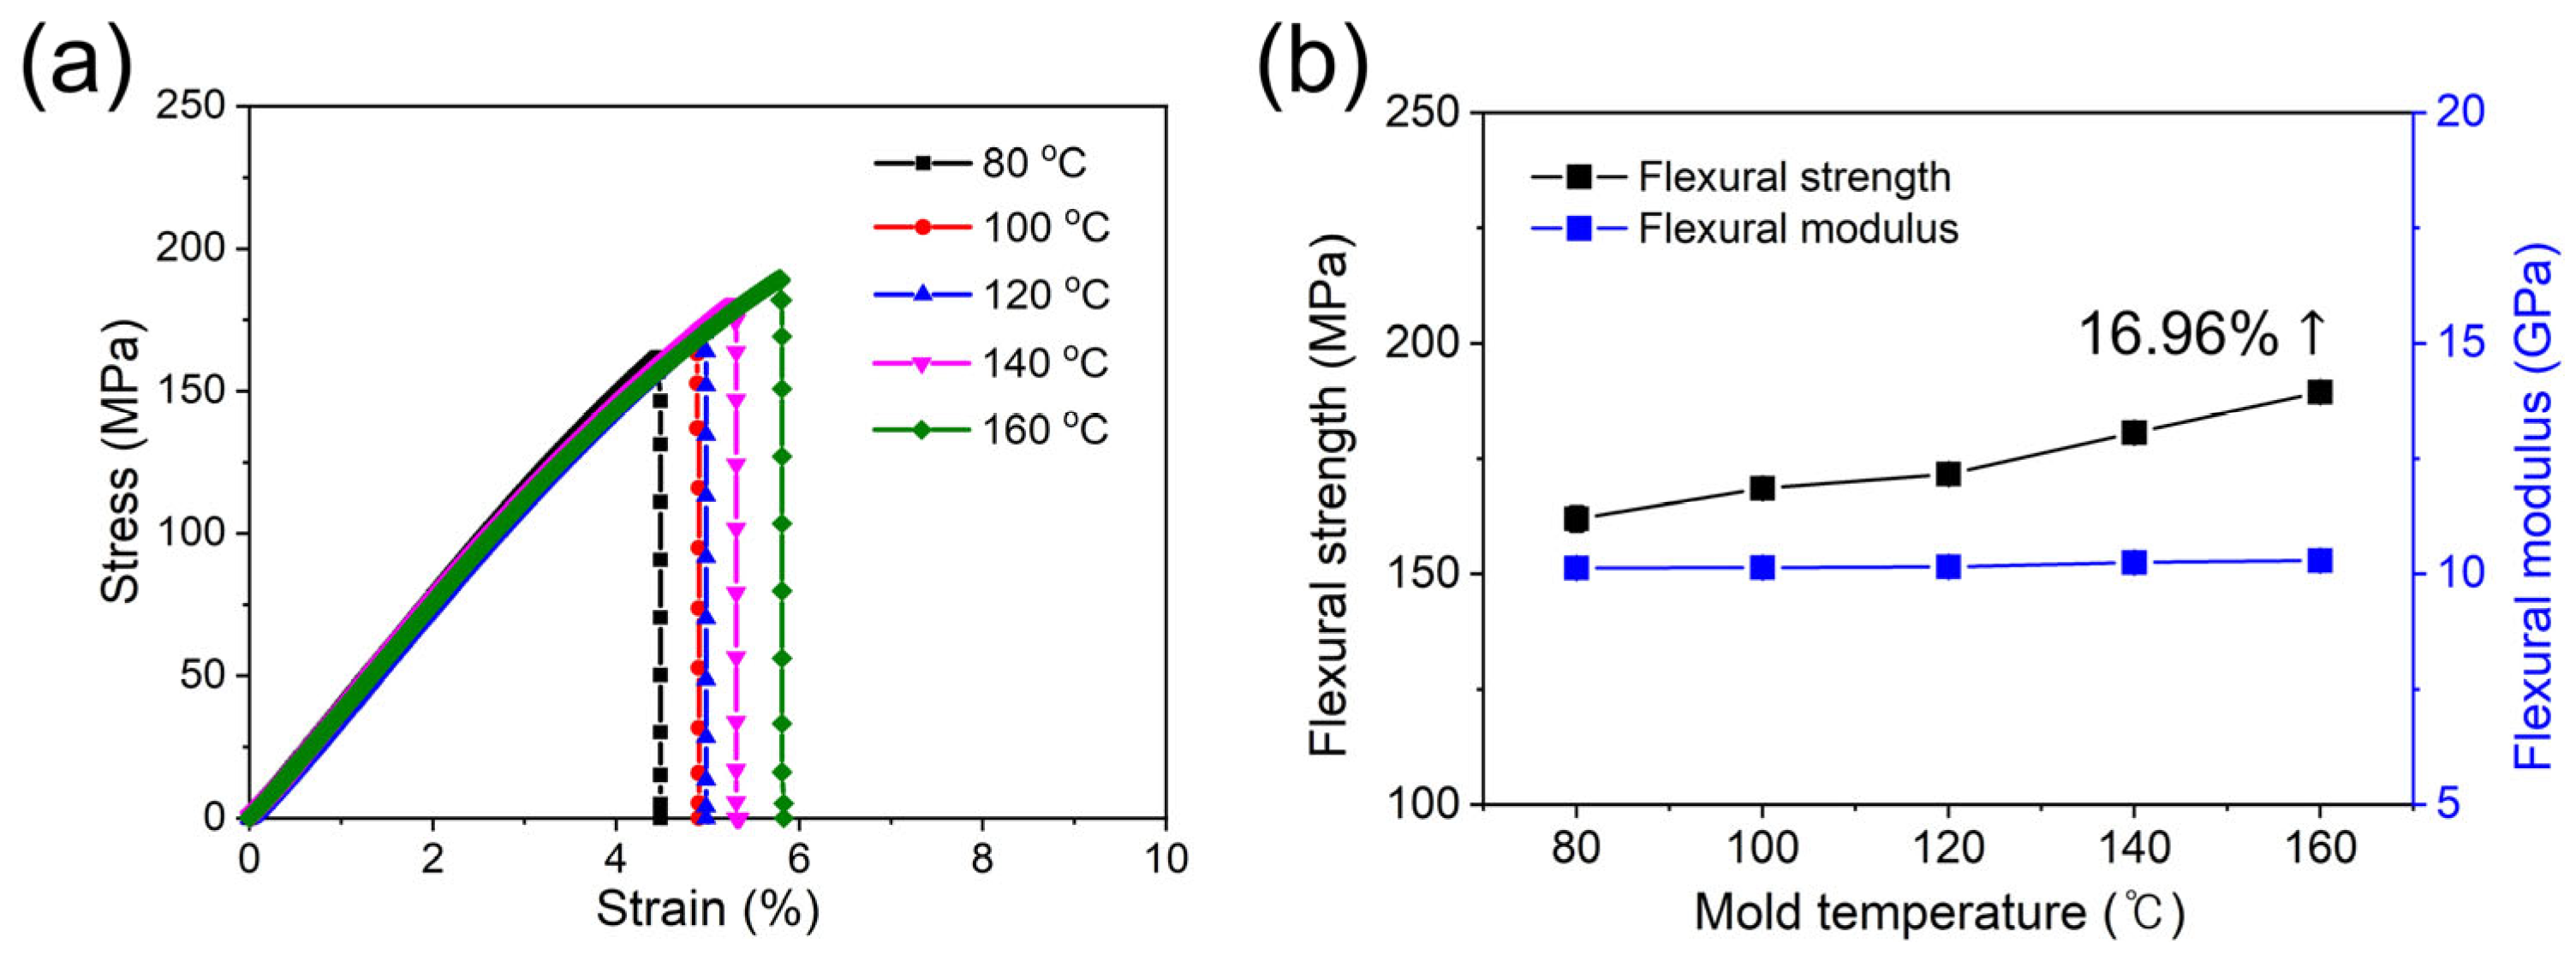
3.3. Mechanical Properties

The tensile properties of the PPS/GF composites, which were injection-molded at different cooling temperatures, were investigated via tensile tests in accordance with ASTM D638 standards using a 100 kN load cell. Seven tests were performed for each case. As shown in Figure 4, the 55 wt.% composites show no visible differences in the fractured shape after the tensile test as the injection cooling temperature increases. However, as shown in Figure 5 and Table 4, as the cooling temperature increases, the tensile strength increases by approximately 10.24%: from 127 MPa at a cooling temperature of 80 °C to 140 MPa at 160 °C. Similarly, the tensile elastic modulus increases by 24.36%: from 11 GPa at a cooling temperature of 80 °C to 14 GPa at 160 °C. Thus, the PPS, a super engineering plastic with a higher processing temperature of 300 °C, exhibits excellent tensile properties at a cooling temperature of 160 °C. The elongation at break also shows a slight increase with an increase in cooling temperature.
The flexural strengths of the composites were determined using a 3-point bending test according to the ASTM D790 standard. As shown in Figure 6, the fractured sample with a cooling temperature of 160 °C shows that it withstands the bending load without fracture. As the injection cooling temperature increases for the PPS/GF 55 wt.% composites, the flexural strength initially exhibited a value of 162 MPa and increased gradually (Figure 7 and Table 5). However, cooling temperatures of 80 °C and 100 °C can cause defects in the composites due to the instability of the injection process for PPS, which has a glass transition temperature (Tg) of approximately 120 °C. As a result, there is a low reproducibility of mechanical properties in the composites injected with a cooling temperature lower than 120 °C. The flexural behavior is consistent with the results of the tensile strength, showing an increasing trend with an increase in cooling temperature (162 MPa for the 80 °C case and 189 MPa for the 160 °C case, which is a 16.96% increase). However, the flexural moduli exhibited similar values for all conditions.
The hardness of the composites was investigated using the Rockwell and Shore hardness instruments. The Rockwell method was used to measure the hardness of the specimens by applying a constant load using a specified indenter and measuring the depth or area of the indentation. It is commonly used in plastic material testing with an R scale. Under the initial cooling temperature condition of 80 °C, the hardness value was approximately 118; while at a cooling temperature of 160 °C (twice the initial temperature), it slightly increased to 120 (Figure 8a). As the cooling temperature increases, the PPS crystalline structure is expected to become finer and harder, resulting in increased hardness. The Shore-D hardness testing method was used to evaluate the surface hardness of the plastics, with higher values indicating harder plastics. Similar to the Rockwell results, the hardness of the PPS/GF composites increased with increasing injection cooling temperature, as shown in Figure 8b. At the initial cooling temperature condition of 80 °C, a hardness value of 88.4 was obtained, while at 160 °C, it showed an increasing trend, reaching 91.2. This indicated an increase in the surface hardness as the polymer crystallinity increased.
Dynamic mechanical analysis (DMA) of the PPS/GF composites was conducted to analyze their elastic stiffness as a function of temperature. This method enables the investigation of the changes in the elastic and viscous properties of the PPS/GF composites during annealing, providing a qualitative comparison of the crystallization behavior resulting from polymer chain mobility [31]. As shown in Figure 9, the PPS/GF composites exhibit an increase in the storage modulus E′ (elasticity) with increasing cooling temperature, leading to a decrease in tan delta. This trend is particularly significant at the 160 °C condition showing E′ of 10.85 GPa, representing a 30% improvement compared to the 80 °C case (8.36 GPa). Additionally, the glass transition temperature (Tg) measured at the peak of the tan delta curve showed a gradual increase with increasing cooling temperature (Figure 9c and Table 6). Similar to the DSC results, it can be inferred that as the cooling temperature increased, the fine crystalline structure restricted the mobility of the polymer chains, resulting in increased matrix rigidity. Therefore, the optimal injection cooling (mold) temperature for the mechanical properties of the PPS/GF 55 wt.% composites is 160 °C.
Furthermore, Figure 10 shows photographs of the fractured PPS/GF composites after the drop-weight impact test. The impact test results show that the composites exhibited severe penetration in all test cases. The absorbed energy behaviors of the composites were analyzed using a drop-weight impact test, as shown in Figure 11. The combination of the elastic portion caused by a high GF load, the interface between the PPS matrix and GFs, and the matrix itself being prone to fracture contributed to the observed fluctuation curves in all cases (Figure 11a). In particular, the sample under the 160 °C cooling temperature exhibits a characteristic behavior of a material with higher elasticity than the other samples. Thus, as the cooling temperature increases, the absorbed energy also increases. There is an approximately 37% increase in absorbed energy from the 80 °C case to the 160 °C case. Hence, it is necessary to select a higher cooling temperature for stable injection molding of PPS, including 55 wt.%, as it has been observed that as the injection cooling temperature increases up to 160 °C, there is an overall improvement in energy absorption behavior without any injection error.

3.4. Fractured Morphology Analysis of PPS/GF Composites

The FE-SEM images (Figure 12) show the cross-sectional morphologies of the fractured PPS/GF composites. SEM analysis of the fracture surface after drop weight impact testing revealed that under the low injection cooling temperature of 80 °C, the PPS composite could have a relatively short cooling time. This led to a loosely formed crystalline structure because the PPS resin had limited time to cool and crystallize. Additionally, a lower orientation of the GF was observed, and the resin impregnation state was relatively poor, resulting in fiber pull-out behavior. In other words, as the injection cooling temperature increased, the orientation of the chopped GF also increased. This resulted in improved resin impregnation and relatively slower crystallization of PPS. The increased cooling temperature provides sufficient time for the polymer chains to crystallize, which can contribute to the enhancement of the mechanical properties of the composites, particularly by strengthening the interphase between the fiber and resin.

4. Conclusions

In this study, the correlation between the crystallinity behavior of PPS in the composites and the mechanical properties of the composites according to the cooling temperature for injection molding of the PPS/GF 55 wt.% composites was investigated. Increasing the injection cooling temperature enhanced the degree of crystallization in the PPS matrix. This phenomenon is attributed to the crystallization of the polymer chains, which can improve the mechanical properties of the composite. Furthermore, the alignment of the chopped GF also increased, leading to enhanced interfacial reinforcement between the fibers and the matrix, thereby improving the overall quality of the molded parts. Lower cooling temperatures result in shorter cooling times for the resin, leading to loosely formed crystalline structures. This was observed to negatively impact the resin impregnation and contribute to the fiber pull-out behavior. In conclusion, by controlling the appropriate cooling temperature for the injection molding process, it is possible to promote interfacial reinforcement between the fibers and the matrix and facilitate resin crystallization, thereby achieving superior mechanical performance. These findings provide insights into the correlation between the cooling temperature during injection molding and the mechanical properties of the PPS/GF 55 wt.% composite, aiding in the optimization of the injection molding process.

Author Contributions

Conceptualization, B.-G.C.; methodology, B.-G.C.; validation, B.-G.C.; formal analysis, B.-G.C. and S.-H.H.; investigation, B.-G.C. and S.-H.H.; data curation, B.-G.C. and S.-H.H.; writing—original draft preparation, B.-G.C.; writing—review and editing, B.-G.C.; supervision, B.-G.C.; funding acquisition, B.-G.C. All authors have read and agreed to the published version of the manuscript.

Funding

This research was funded by the Ministry of Trade, Industry, and Energy (MOTIE) of the Republic of Korea (grant number 20019105; Development of high-durability film capacitors for green car power conversion system).

Institutional Review Board Statement

Not applicable.

Data Availability Statement

All data used during the study appear in the submitted article.

Conflicts of Interest

The authors declare no conflict of interest. The funders had no role in the study design; collection, analyses, or interpretation of data; writing of the manuscript; or decision to publish the results.

References

  1. Zhao, L.; Yu, Y.; Huang, H.; Yin, X.; Peng, J.; Sun, J.; Huang, L.; Tang, Y.; Wang, L. High-performance polyphenylene sulfide composites with ultra-high content of glass fiber fabrics. Compos. B Eng. 2019, 174, 106790. [Google Scholar] [CrossRef]
  2. Manjunath, A.; Manjushree, H.; Nagaraja, K.C.; Pranesh, K.G. Role of E-glass fiber on mechanical, thermal and electrical properties of polyphenylene sulfide (PPS) composites. Mater. Today Proc. 2022, 62, 5439–5443. [Google Scholar] [CrossRef]
  3. Quan, D.; Liu, J.; Yao, L.; Dransfeld, C.; Alderliesten, R.; Zhao, G. Interlaminar and intralaminar fracture resistance of recycled carbon fibre/PPS composites with tailored fibre/matrix adhesion. Compos. Sci. Technol. 2023, 239, 110051. [Google Scholar] [CrossRef]
  4. Heo, K.-Y.; Park, S.-M.; Lee, E.-S.; Kim, M.-S.; Sim, J.-H.; Bae, J.-S. A study on properties of the glass fiber reinforced PPS composites for automotive headlight source module. Compos. Res. 2016, 29, 293–298. [Google Scholar] [CrossRef] [Green Version]
  5. Isaincu, A.; Mardavina, D.M.L. On the fracture toughness of PPS and PPA reinforced with Glass Fiber. Procedia Struct Intrgrity 2022, 41, 646–655. [Google Scholar] [CrossRef]
  6. Barbosa, L.C.M.; de Souza, S.D.B.; Botelho, E.C.; Cândido, G.M.; Rezende, M.C. Fractographic evaluation of welded joints of PPS/glass fiber thermoplastic composites. Eng. Fail Anal. 2019, 102, 60–68. [Google Scholar] [CrossRef]
  7. Ricotta, M.; Sorgato, M.; Zappalorto, M. Tensile and compressive quasi-static behaviour of 40% short glass fibre—PPS reinforced composites with and without geometrical variations. Theor. Appl. Fract. Mech. 2021, 114, 102990. [Google Scholar] [CrossRef]
  8. Deng, J.; Song, Y.; Xu, Z.; Nie, Y.; Lan, Z. Thermal aging effects on the mechanical behavior of glass-fiber-reinforced polyphenylene sulfide composites. Polymers 2022, 14, 1275. [Google Scholar] [CrossRef]
  9. Solfiti, E.; Solberg, K.; Gagani, A.; Landi, L.; Berto, F. Static and fatigue behavior of injection molded short-fiber reinforced PPS composites: Fiber content and high temperature effects. Eng. Fail Anal. 2021, 126, 105429. [Google Scholar] [CrossRef]
  10. Zuo, P.; Benevides, R.C.; Laribi, M.A.; Fitoussi, J.; Shirinbayan, M.; Bakir, F.; Tcharkhtchi, A. Multi-scale analysis of the effect of loading conditions on monotonic and fatigue behavior of a glass fiber reinforced polyphenylene sulfide (PPS) composite. Compos. B Eng. 2018, 145, 173–181. [Google Scholar] [CrossRef]
  11. Zuo, P.; Tcharkhtchi, A.; Shirinbayan, M.; Fitoussi, J.; Bakir, F. Effect of thermal aging on crystallization behaviors and dynamic mechanical properties of glass fiber reinforced polyphenylene sulfide (PPS/GF) composites. J. Polym. Res. 2020, 27, 77. [Google Scholar] [CrossRef]
  12. Chen, G.; Mohanty, A.K.; Misra, M. Progress in research and applications of Polyphenylene sulfide blends and composites with carbons. Compos. B Eng. 2021, 209, 108553. [Google Scholar] [CrossRef]
  13. Montagna, L.S.; Kondo, M.Y.; Callisaya, E.S.; Mello, C.; Souza, B.R.D.; Lemes, A.P.; Botelho, E.C.; Costa, M.L.; Alves, M.C.d.S.; Ribeiro, M.V.; et al. A review on research, application, processing, and recycling of PPS based materials. Polímeros 2022, 32, e2022005. [Google Scholar] [CrossRef]
  14. Seki, Y.; Kizilkan, E.; Leşkeri, B.M.; Sarikanat, M.; Altay, L.; Isbilir, A. Comparison of the Thermal and Mechanical Properties of poly(phenylene sulfide) and poly(phenylene sulfide)-Syndiotactic polystyrene-Based Thermal Conductive Composites. ACS Omega 2022, 7, 45518–45526. [Google Scholar] [CrossRef]
  15. Oshima, S.; Higuchi, R.; Kato, M.; Minakuchi, S.; Yokozeki, T.; Aoki, T. Cooling rate-dependent mechanical properties of polyphenylene sulfide (PPS) and carbon fiber reinforced PPS (CF/PPS). Compos. A 2023, 164, 107250. [Google Scholar] [CrossRef]
  16. Vieille, B.; Ernault, E.; Delpouve, N.; Gonzalez, J.P.; Esposito, A.; Dargent, E.; Le Pluart, L.; Delbreilh, L. On the improvement of thermo-mechanical behavior of carbon/polyphenylene sulfide laminated composites upon annealing at high temperature. Compos. B Eng. 2021, 216, 108858. [Google Scholar] [CrossRef]
  17. Do Yeon Jeong, S.Y.Y.; Jung, C.-G.; Lee, J.; Kim, S.H.; Lee, P.-C.; Lee, H.W.; Ha, J.U. Comparison of polyphenylene sulfide composites having different processing temperatures and glass fibers. Elastomers Compos. 2019, 54, 308–312. [Google Scholar]
  18. Zuo, P.; Tcharkhtchi, A.; Shirinbayan, M.; Fitoussi, J.; Bakir, F. Multiscale physicochemical characterization of a short glass fiber-reinforced polyphenylene sulfide composites under aging and its thermo-oxidative mechanism. Polym. Adv. Technol. 2019, 30, 584–597. [Google Scholar] [CrossRef] [Green Version]
  19. Risteska, S.; Petkoska, A.T.; Samak, S.; Drienovsky, M. Annealing Effects on the Crystallinity of Carbon Fiber-Reinforced Polyetheretherketone and Polyohenylene Laminate Composites Manufactured by Laser Automatic Tape Placement. Mater. Sci. 2020, 26, 308–316. [Google Scholar] [CrossRef] [Green Version]
  20. ASTM Standard D638; Standard Test Method for Tensile Properties of Plastics. ASTM International: West Conshohocken, PA, USA, 2014. [CrossRef]
  21. ASTM Standard D790; Standard Test Methods for Flexural Properties of Unreinforced and Reinforced Plastics and Electrical Insulating Materials. ASTM International: West Conshohocken, PA, USA, 2017. [CrossRef]
  22. ASTM Standard D7136; Standard Test Method for Measuring the Damage Resistance of a Fiber-Reinforced Polymer Matrix Composite to a Drop-Weight Impact Event. ASTM International: West Conshohocken, PA, USA, 2020. [CrossRef]
  23. Batista, N.L.; Rezende, M.C.; Botelho, E.C. Effect of crystallinity on CF/PPS performance under weather exposure: Moisture, salt fog and UV radiation. Polym. Degrad. Stab. 2018, 153, 255–261. [Google Scholar] [CrossRef] [Green Version]
  24. Kwang Hee Lee, M.P.; Kim, Y.C.; Choe, C.R. Crystallization behavior of Polyphenyele sulfide (PPS) and PPS/carbon fiber composites. Polym. Bull. 1993, 30, 469–475. [Google Scholar] [CrossRef]
  25. Zhang, M.; Wang, X.; Bai, Y.; Li, Z.; Cheng, B. C(60) as fine fillers to improve poly(phenylene sulfide) electrical conductivity and mechanical property. Sci. Rep. 2017, 7, 4443. [Google Scholar] [CrossRef] [PubMed]
  26. Hu, Z.; Li, L.; Sun, B.; Meng, S.; Chen, L.; Zhu, M. Effect of TiO2@SiO2 nanoparticles on the mechanical and UV-resistance properties of polyphenylene sulfide fibers. Prog. Nat. Sci. Mater. Int. 2015, 25, 310–315. [Google Scholar] [CrossRef] [Green Version]
  27. Li, B.; Tao, X.; Kasai, H.; Oikawa, H.; Nakanishi, H. Size control for fullerene C60 nanocrystals during the high temperature and high pressure fluid crystallization process. Mater. Lett. 2007, 61, 1738–1741. [Google Scholar] [CrossRef]
  28. Lee, S.; Kim, D.-H.; Park, J.-H.; Park, M.; Joh, H.-I.; Ku, B.-C. Effect of curing poly(p-Phenylene sulfide) on thermal properties and crystalline morphologies. Adv. Chem. Eng. Sci. 2013, 03, 145–149. [Google Scholar] [CrossRef] [Green Version]
  29. Nohara, L.B.; Nohara, E.L.; Moura, A.; Costa, M.L. Study of crystallization behavior of poly(phenylene sulfide). Polim. Cienica Tecnol. 2006, 16, 104–110. [Google Scholar] [CrossRef]
  30. Zhang, X.; Chen, F.; Su, Z.; Xie, T. Effect of radiation-induced cross-linking on thermal aging properties of ethylene-tetrafluoroethylene for aircraft cable materials. Materials 2021, 14, 257. [Google Scholar] [CrossRef]
  31. Liu, P.; Dinwiddie, R.B.; Keum, J.K.; Vasudevan, R.K.; Jesse, S.; Nguyen, N.A.; Lindahl, J.M.; Kunc, V. Rheology, crystal structure, and nanomechanical properties in large-scale additive manufacturing of polyphenylene sulfide/carbon fiber composites. Compos. Sci. Technol. 2018, 168, 263–271. [Google Scholar] [CrossRef]
Figure 1. Photographs of (a) the steel mold for manufacturing of specimens to evaluate mechanical properties via injection molding process, (b) the resultant specimens after injection molding, and the PPS/GF 55 wt.% composites with different cooling temperatures are separated as shown in (c).
Polymers 15 03179 g001
Figure 2. (a) XRD patterns of PPS/GF composites showing characteristic peaks at around 20° (110, 200 plane) corresponding to PPS peak; (b) shows crystallinity and crystallite size corresponding to the (110, 200) reflection plane of the PPS/GF composites with different cooling temperatures from XRD patterns.
Polymers 15 03179 g002
Figure 3. Non-isothermal DSC scans of (a) first cooling exotherm curves and (b) second heating exotherm curves of PPS/GF composites. (c) Calculated crystallinity of the PPS/GF composites from the DSC scan. (d) TGA thermographs of PPS/GF composites with different cooling temperatures.
Polymers 15 03179 g003
Figure 4. Photographs of (a) tensile test set up for PPS/GF composites and fractured specimen with different cooling temperatures of (b) 80 °C, (c) 100 °C, (d) 120 °C, (e) 140 °C, and (f) 160 °C, respectively.
Polymers 15 03179 g004
Figure 5. (a) Tensile stress–strain curves and (b) tensile strength, modulus, and elongation at break of PPS/GF composites with different cooling temperatures.
Polymers 15 03179 g005
Figure 6. Photographs of (a) 3-point test set up for PPS/GF composites and fractured specimen with different cooling temperatures of (b) 80 °C, (c) 100 °C, (d) 120 °C, (e) 140 °C, and (f) 160 °C, respectively.
Polymers 15 03179 g006
Figure 7. (a) Flexural stress–strain curves and (b) flexural strength, modulus of PPS/GF composites with different cooling temperatures.
Polymers 15 03179 g007
Figure 8. Hardness of PPS/GF composites with different cooling temperatures via (a) Rockwell method and (b) Shore method.
Polymers 15 03179 g008
Figure 9. (a) Storage modulus (E′), (b) loss modulus (E″), (c) tan δ and (d) complex viscosity of the PPS/GF composites with different cooling temperatures.
Polymers 15 03179 g009
Figure 10. Photographs fractured PPS/GF composite specimen through drop-weight impact test with different cooling temperatures of (a) 80 °C, (b) 100 °C, (c) 120 °C, (d) 140 °C and (e) 160 °C, respectively.
Polymers 15 03179 g010
Figure 11. Impact behavior of the PPS/GF composites: (a) load vs. displacement curve resulting in (b) 37% increase in energy absorption compared with the control sample.
Polymers 15 03179 g011
Figure 12. Cross-section SEM images of fractured PPS/GF composites with different cooling temperatures of (a) 80 °C, (b) 100 °C, (c) 120 °C, (d) 140 °C, (e) 160 °C, and (f) ×250 low magnified of (e).
Polymers 15 03179 g012
Table 1. Crystallization properties of the (110, 200) reflections in PPS/GF composites with different cooling temperatures based on XRD analysis.
Cooling Temperature (°C) 2 θ
(110, 200)
FWHM
(110, 200)
Crystallite Size (nm)CI a (%)
8019.16.381.3218.76
10020.13.172.6622.88
12020.41.412.8725.46
14020.31.543.9627.54
16020.32.125.9836.94
a Calculated using Equation (2).
Table 2. DSC data and crystallinities of PPS/GF composites with different cooling temperatures.
Cooling Temperature (°C)Tm (°C)ΔHm b (J/g)Tc (°C)ΔHc b (J/g)Χc c (%)
80281.6716.65233.5118.6724.6
100281.8317.86233.8820.1026.4
120281.6715.92233.0117.5723.4
140283.5016.76234.5218.9424.8
160282.5119.34234.1920.3928.6
b Enthalpies of the PPS/GF composites from DSC analysis software. c Calculated using Equation (3).
Table 3. 5 wt.% loss and degradation temperature of PPS/GF composites with different cooling temperatures.
Cooling Temperature (°C)5% Weight Loss Temperature, TD5%
(℃)
TD1 (°C)TD2 (°C)
80500.72417.75574.31
100505.32420.56577.84
120503.41421.79577.84
140509.08421.84583.70
160512.87426.95583.97
Table 4. Tensile strength and modulus of PPS/GF composites with different cooling temperatures.
Cooling Temperature (°C)Tensile Strength (MPa)Tensile Modulus (GPa)Elongation @ Break (%)
80127.29 ± 4.3411.33 ± 0.744.87
100129.51 ± 2.2312.21 ± 1.475.11
120133.35 ± 2.1412.66 ± 0.605.58
140135.73 ± 2.3413.59 ± 1.455.66
160140.32 ± 2.3014.09 ± 1.626.09
Table 5. Flexural strength and modulus of PPS/GF composites with different cooling temperatures.
Cooling Temperature (°C)Flexural Strength (MPa)Flexural Modulus (GPa)
80161.95 ± 2.7710.13 ± 0.19
100168.52 ± 0.1210.14 ± 0.13
120171.68 ± 1.3810.15 ± 0.03
140180.63 ± 1.3710.25 ± 0.06
160189.42 ± 1.5410.29 ± 0.18
Table 6. Storage modulus (E′) and tan δ analysis of PPS/GF composites with different cooling temperatures.
Cooling Temperature (°C)E′ at 40 °C (GPa)Tg (°C) tan δ max
808.36122.810.094
1009.05127.730.088
1208.25119.760.085
1408.81124.480.088
16010.85128.250.080
Disclaimer/Publisher’s Note: The statements, opinions and data contained in all publications are solely those of the individual author(s) and contributor(s) and not of MDPI and/or the editor(s). MDPI and/or the editor(s) disclaim responsibility for any injury to people or property resulting from any ideas, methods, instructions or products referred to in the content.

