Article

Textured Polyester Fiber in Three-Dimensional (3D) Carpet Structure Application: Experimental Characterizations under Compression–Bending–Abrasion–Rubbing Loading

1
Department of Textile Engineering, Faculty of Engineering, Erciyes University, Talas, Kayseri 38039, Turkey
2
Uniteks Tekstil, Atatürk Organize Sanayi Bölgesi, 10039 sokak, No. 26, Çiğli, İzmir 35620, Turkey
3
Nanotechnology Application and Research Centre (ERNAM), Erciyes University, Talas9, Kayseri 3803, Turkey
*
Author to whom correspondence should be addressed.
Polymers 2023, 15(14), 3006; https://doi.org/10.3390/polym15143006
Submission received: 15 June 2023 / Revised: 26 June 2023 / Accepted: 3 July 2023 / Published: 11 July 2023
(This article belongs to the Collection Progress in Polymer Applications)

Abstract

:
In this article, textured polyester fiber was used as pile yarn in three-dimensional woven carpet structures. The properties of developed polyester carpets under various mechanical loading were studied. A statistical method was used to analyze the experimental data. Regression models were proposed to explain the relationships between carpet pile height and density. The study showed that the bending rigidity and curvature of dry and wet polyester pile fiber carpets were influenced by pile height and pile density (indirectly weft density) in that the downward concave large bending curvature was obtained from very dense carpet structures. In addition, the average dry bending rigidity of the carpet was over eight times higher than the average wet bending rigidity of the carpet. The thickness loss (%) and resilience (%) for each recovery period of various polyester carpets were proportional depending on the pile density. It was broadly decreased when the pile density was increased due to the compression load carrying capacity per polyester fiber knot, which was higher in carpets having dense knots compared to sparse knots per area. On the other hand, the polyester pile density and height largely affected the carpet mass losses (%) of all textured polyester carpets under an abrasion load. The number of strokes received after completely fractured polyester pile yarns during a rubbing test were increased when the pile heights for each pile density were increased. Findings from the study can be useful for polyester carpet designers and three-dimensional dry or impregnate polyester fiber-based preform designers in particularly complex shape molding part manufacturing.

1. Introduction

Polyester carpet can be considered a three-dimensional (3D) structure due to the three yarn sets that are mainly employed as warp for the substrate, including interlaced warp and straight warp (stuffer), filling (interlaced or chain), and pile yarn (Z-yarn). It is called a 3D carpet structure, which is an analogy from 3D preform structures for composite applications in which they have mainly orthogonally interlaced three yarn sets as warp, filling, and z-yarn (binding). One of the main carpet types is a face-to-face carpet structure. It involves four methods: Wilton-type carpet, Brussels-type carpet, Goblen-type carpet, and Axminster carpet. Carpet is one of the most widely used flooring coverings in both residences and workplaces because of its comfort, thermal, sound insulation, and aesthetic properties. Various natural fibers, including protein-based wool, cellulose-based cotton, synthetic-based polyester, polypropylene, acrylic and nylon fibers, or a combination of these materials, can be utilized as pile yarn in carpets [1]. On the other hand, cotton, jute, or a blend of natural fibers in the 3D carpet substrate are commonly used for warp and weft yarns [2].
Poly(ethylene terephthalate) (PET) is the polyester polymer used for fiber production [3]. It is the largest volume of synthetic fiber and over 50 million tons are produced worldwide [4]. Polyester generally has continuous, staple twisted, or crimped yarn forms [5] in use in apparel and interior floor covering textiles such as carpets [6]. On the other hand, recycled polyester from various textile applications is also utilized to make reinforced composites [7]. The critical parameters of polyester fiber are low cost, convenient processability, ease of blending with natural fibers, convenient recyclability, and tailorable performance [8]. Moreover, fiber morphology allows for the balance of dimensional stability, thermal, transport, and mechanical properties [8]. It shows high tenacity and low creep deformation under cyclic loading [9] and good resistance to strain and deformation [6]. It is also identified that fiber cross-section affects its mechanical properties in that full polyester fibers are tough and ductile, whereas hollow fibers are stiffer and more resistant to plastic deformation [10]. Further, it is less fire-resistant and can melt when ignited [11]. In addition, polyester fibers are hydrophobic and do not transport aqueous fluids [6]. In order to increase moisture regain, hydrophilic finishing can be used [12].
Research on carpets is generally aimed at designing carpets for particular end uses and providing guidance for the selection of structural and processing parameters [13,14,15,16]. On the other hand, the characterization of polyester carpets is crucial for identifying their physical, mechanical-thermal, acoustic, appearance retention, and durability properties during service life [17,18,19,20,21,22,23]. For instance, polyester carpet comfort during standing and walking was studied, considering complex biomechanical and psychophysical properties. This could help in the design of more compliant carpets, especially for residential end use [24,25]. Moreover, it was observed that pile length and density were effective for thermal conductivity and sound absorption in polypropylene face-to-face carpets, in which shorter piles and dense loops provided improvement in sound absorption [26,27].
The bending behavior of textile yarn and fabrics, in particular, in polymer-based polyester fibers, was investigated by several researchers to design fabric for apparel and upholstery applications [28,29,30,31,32,33,34,35]. Yarn bending rigidity was obtained from the tensile modulus of its constituent fibers and yarn geometry and structural parameters. It was reported that the yarn bending rigidity decreased as the surface helix angle of yarn and the ratio of tensile-to-shear modulus of the constituent fibers increased [36]. Fabric density and crimp ratio influenced the bending rigidity of single-layer fabric. The flexural rigidities of multi-layered structures depend on the number of fabric layers [37]. Carpet stiffness considering flexural length is an important parameter that is affected by carpet construction, pile density, and pile fiber properties, including fiber type, number of plies, and amount of twist. It was noted that the flexural length of the carpet in the warp and weft after washing decreased significantly [38]. The shifting-point flexure model (SBM) and the fixed-point flexure model (FBM), based on Timoshenko’s elastic theorem, were developed to obtain the flexural rigidity of yarn and fabric structures [39,40]. On the other hand, a polynomial approximation model was proposed to predict the flexural rigidity and flexure length directly via nondimensional parameters as a function of the height-to-length ratio [41].
Carpet structure under a static compression load showed three deformation stages: flexural deformation, mixed deformation including bending and compressive deformations, and compressive deformation in which all fiber piles were affected in the loading zone [42,43]. The effect of structural parameters on face-to-face cut pile carpets under static compression load was studied. It was found that both pile density and pile height influenced the elastic and unrecovered deformation properties of carpet during static loading [44,45,46]. Elastic deformation, especially on polymeric fiber, depended on pile density, whereas unrecovered deformation was mostly related to pile density when the pile height was low [47]. It was demonstrated that through increasing the temperature in the twist heat-setting of air-jet textured polyester pile yarns at the autoclave process, carpet static recovery increased [48,49]. It was experimentally found that carpets with high pile height (16 mm) and high density (3120 piles/dm2) exhibited favorable texture retention after static compression loading [50]. It was shown that carpet toughness was highly sensitive towards pile compression resistance and pile interlacement with the substrate, in which pile interlacement may be defined as a function of pile pull-out resistance and friction between yarn sets as well as fiber-to-fiber cohesion [51]. The recovery properties of acrylic polymer carpet after ultraviolet (UV) exposure were investigated. It was shown that UV radiation caused a significant increase in thickness loss [52].
Mathematical models based on probability fracture mechanics considering the Weibull distribution were developed to predict the wear life of wool cut pile carpet [53,54,55]. Generally, models allowed arbitrary initial conditions, life distribution of single fibers, and fatigue site distribution along a fiber for improving fiber properties, carpet constructions, and test methods [56,57,58,59]. Another proposed energy-based model calculated the total energy involved in pile deformation in face-to-face polymeric carpets. This included the bending energy resulting from pile deformation, the energy loss due to sliding pile yarns causing friction, and the energy associated with piles getting jammed at the end of the deformation process. It was found that bending energy was significant compared to frictional and jamming components [60,61]. In their work, Hersh and El-Shiekh (1972) presented a mechanical model to analyze the bending deformation of piles. They focused on calculating the total stored elastic energy associated with bending. They also suggested that considering a non-linear trend for the bending behavior of pile yarns could be reasonable, given the effects of slippage and friction between the fibers within the pile yarns [62]. A novel theoretical approach was introduced for the compression of cut-pile carpets, which relied on the concept of elastic-stored bending energy. The study revealed that the overall energy associated with pile deformation was influenced by both the geometrical and mechanical characteristics of the yarn, as well as the applied compressive load [61,63]. A viscoelastic model based on nonlinear three-element models was applied to the recovery of carpet after static compression loading. It was found that the recovery properties of polyester cut pile yarns was well explained due to plastic deformation as a form of creep, and residual deformation was considered by the model [64,65].
Abrasion is one of the complex loads to degrade the carpet surface during service life, mainly from foot traffic, and it ultimately affects the appearance of the carpet surface due to fiber-to-fiber friction, fiber slippage, and fiber breakages in pile yarns during indoor or outdoor environments [66,67]. The critical parameters related to abrasion can be considered as fiber material and finesses, pile yarn properties including ply number and twist, carpet structural properties such as weave design, interlacement between pile yarn and substrate yarns, and out-of-plane pile length and density [68,69]. The abrasion behavior of carpets is collectively influenced by fiber, yarn, and carpet constructional parameters [2]. Onder and Berkalp (2001) found that abrasion resistance of face-to-face acrylic/wool/polypropylene blended carpet was related to pile yarn and carpet structural parameters considering substrate (warp, weft, and stuffer), pile height, and pile density [70]. Another study was carried out on the abrasion resistance of flocked fabric by Bilisik and Yolacan (2009). It was obtained that the flock fiber density and fiber length influenced the abrasion properties of laminated flock fabric, in which dense and short polyamide flock fiber showed better abrasion resistance due to large fiber surface area and flexure rigidity [71]. It was also obtained that the abrasion loss increased with an increase in fiber diameter [72].
Token rubbing test on flocked fabrics exhibited that their warp and weft tearing strengths in a wet state were slightly higher than those of the dry state due to the existence of cotton fiber and the lubrication effect of acrylic adhesive in fabrics [73]. As the stroke number increased, there was an ordinary decrease in the warp and weft directional tensile strength and an elongation of flocked fabric. Moreover, the stroke number of a flocked fabric in its wet form, compared to its dry form, exhibited lower values. This can be attributed to the poor wet properties of the acrylic adhesive, which was the main factor responsible for this effect [74]. Furthermore, polyamide (nylon) pile fiber carpet inkjet printing with printing ink with a low thickener concentration has good rubbing fastness and color yield [75].
The purpose of this study was to experimentally determine the static loading, bending rigidity, abrasion, and rubbing properties of textured polyester woven carpet structures. Moreover, generated experimental data were also statistically analyzed for possible improvement on the design of carpet structures.

2. Materials and Methods

2.1. Carpet Structure

Polyester carpet samples were obtained from Gumussuyu Halı Inc. (Kayseri, Turkey) subsidiary of Erciyes Anadolu Holding (Kayseri, Turkey). Carpets were fabricated using the Wilton face-to-face carpet weaving principle on a Van De Wiele carpet loom with three rapiers. They were designed using the Weaving and Booria programs compatible with the loom. Carpet samples were made as 2/2 V and 1 + 2/3 V weave constructions. They are illustrated in Figure 1a,b. Both polyester woven carpet structures have noninterlaced stuffer and interlaced warp (80/20% polyester/cotton blended yarn), weft (100% jute), and colored pile yarns (100% polyester). Table 1 presents specifications of the fiber, yarn, and substrate properties of the carpets.
Three different density carpet samples were made as 48 warp × 48 weft (loose), 48 warp × 55 weft (dense), and 48 warp × 70 weft (very dense) ends/10 cm. Each of them were made with three distinct pile heights at 3.34–3.54 mm (short), 4.21–4.83 mm (medium), and 5.88–6.46 mm (long). In addition, loose and medium density carpet structures were made with a 2/2 V weave pattern, whereas dense carpet was constructed using a 1 + 2/3 V pattern. The pile yarn in each carpet was textured polyester fiber and its yarn linear density was 165 tex. It was composed of a continuous bundle of filaments and had no twist. Pile weight and carpet weight varied between 954–1981 g/m2 and 1797–2877 g/m2, respectively. Measured pile height and carpet thickness were varied: 3.34–6.46 mm and 5.91–9.65 mm, respectively. Table 2 shows polyester pile yarn and carpet structure properties. All data generated on carpet samples were average values.

2.1.1. Bending (Flexure) Test

A modified bending test instrument was used based on the fixed-angle flexometer method as explained in ISO 4604 test standards [77]. The fixed-angle flexometer method or inclined plane method principally originated from the Peirce cantilever test [78,79]. The bending angle in the cantilever base test devise was θ = 41.5°. The fabric sample was placed on a smooth horizontal platform, where one end of the sample was aligned with the edge of the platform. A glass plate was positioned on top of the fabric sample, aligning the zero point of the slide rule with the starting point. The slide rule was gradually moved to facilitate the bending of the sample under its own weight. The bending test was performed until the sample made contact with the inclined platform at its end. At the conclusion of the test, the bending length was determined through measuring from the starting point on the slide rule. Figure 2a–c depicts the bending test instrument utilized during the bending test. The sample sizes of carpet were 2.5 cm (width) × 15 cm (length) for apparel fabric [80,81] and 30 cm (width) × 30 cm (length) for technical fabric [77]. Warp directional flexural tests on carpet samples were conducted for dry and wet forms and repeated four times.
A digital camera (CANON PowerShot SX30 IS, Tokyo, Japan) was integrated with an in-house-developed flexure test instrument. It recorded the sample curvature end of the testing (Figure 2a) and the image was uploaded to the SnagIt drawing program to find the bending curvature (Figure 2c) [82]. The bending curvature regression equations were determined using the image received from the drawing program. It was computed within MATLAB R2016a [83]. This was achieved using MATLAB’s numerical integration and standard plotting tools. Bending length and bending rigidity for apparel and technical fabrics were computed following Equations (1)–(3).
c = l 2
G 1 = 0 . 1 × m × c 3
G 2 = 9 . 81 × m × l 2 3
where m is the fabric unit areal weight (g.m−2); l is the fabric length of overhang (apparel fabric, cm; technical fabric, m); c is the bending length (cm, m); G1 and G2 are the bending rigidity of apparel (mg.cm) and technical fabrics (mN.m), respectively; 9.81 is the gravitational constant (m.s−2).

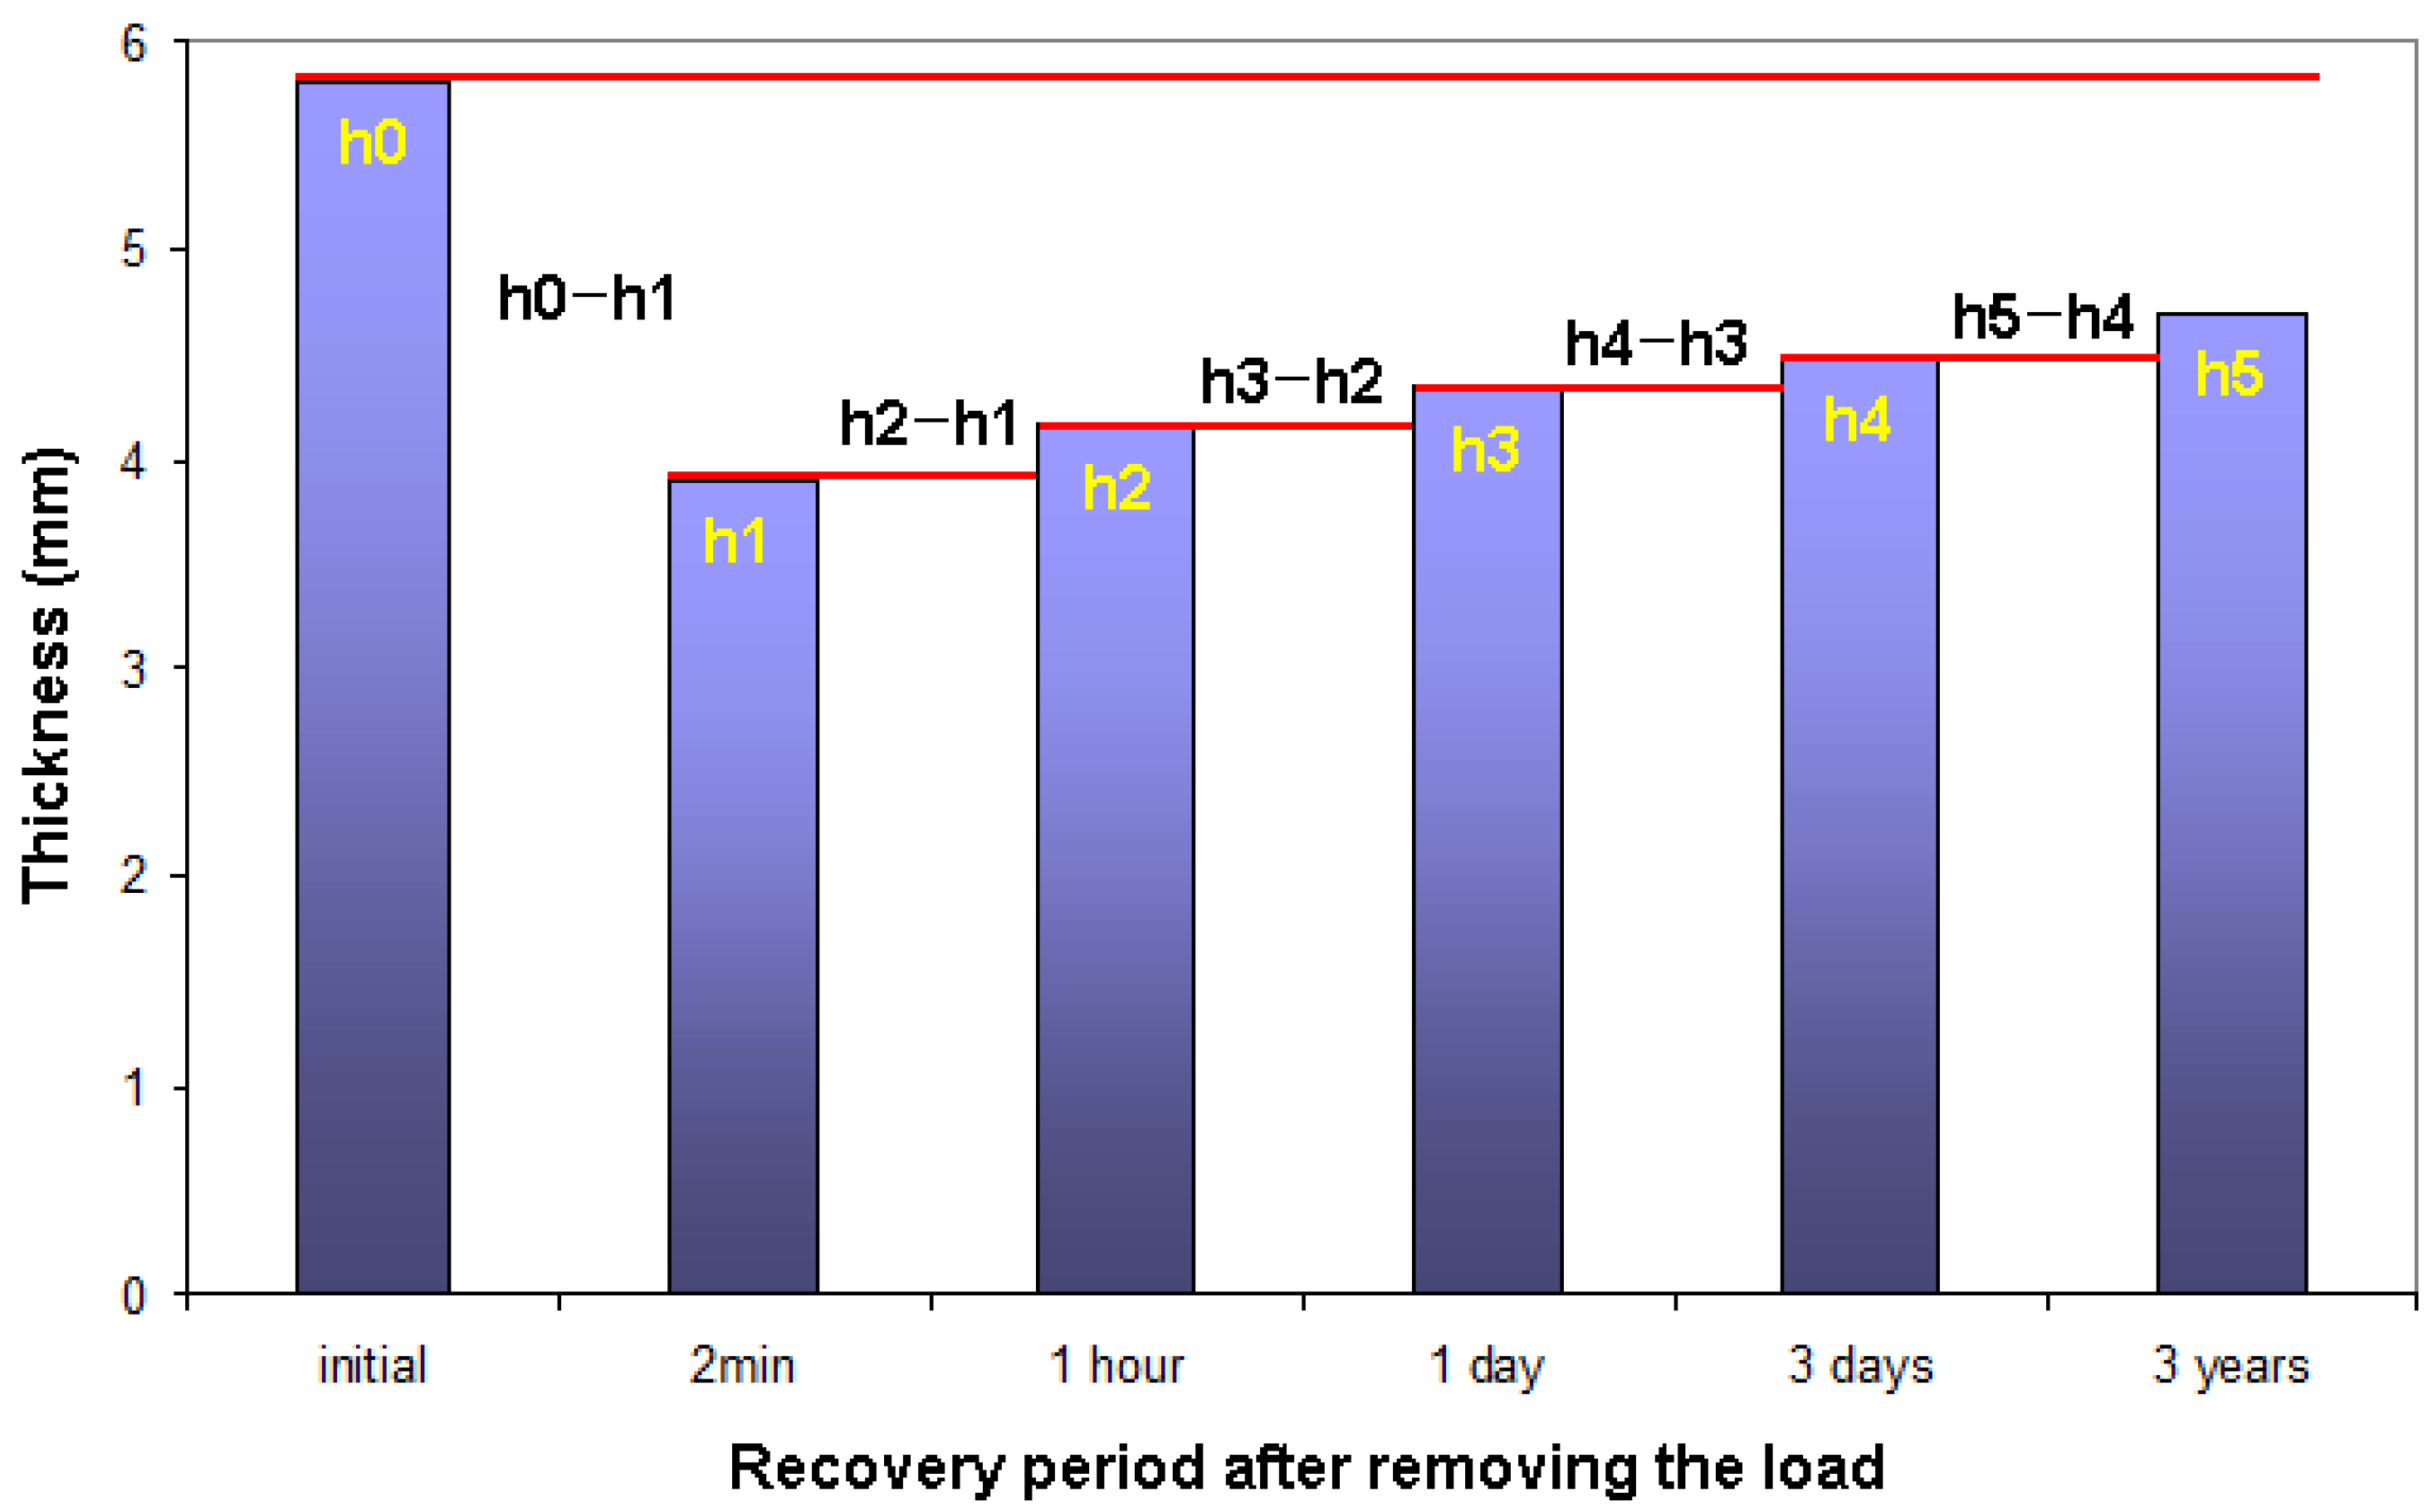
2.1.2. Static Loading Test

A static loading test on face-to-face woven carpet samples was ordinarily carried out following BS 4939 [84] and ISO 3416 [85] test standards. The sample sizes of carpet for static loading were 10 cm × 10 cm. Before starting the test, sample initial thickness (h0) was measured. Later, it was uploaded in the test instrument where pressure on the sample was applied (7 kg/cm2, 0.687 MPa) via dead weight (10 kg). The samples under static loading were held 24 h (h). After that, the thickness loss on the sample was measured according to short (2 min and 1 h), medium (1 day and 3 days), and long (3 years) time periods. The test was repeated twice due to limited samples. Figure 3a–e shows the actual and schematic static loading instrument during testing of the carpet structure, and failed carpet samples.
The thickness loss and resilience of the carpet after prolonged heavy static load were determined using the following Equations (4)–(13). The relations are also presented in graphical form as exhibited in Figure 4 [46].
TL 2 min   ( % ) = h 0 h 1 h 0 × 100
TL 1 h ( % ) = h 0 h 2 h 0 × 100
TL 1 d ( % ) = h 0 h 3 h 0 × 100
TL 3 d ( % ) = h 0 h 4 h 0 × 100
TL 3 y ( % ) = h 0 h 5 h 0 × 100
R   ( % ) = h h 1 h 0 h 1 × 100
R 1 h ( % ) = h 2 h 1 h 0 h 1 × 100
R 1 d ( % ) = h 3 h 1 h 0 h 1 × 100
R 3 d ( % ) = h 4 h 1 h 0 h 1 × 100
R 3 y ( % ) = h 5 h 1 h 0 h 1 × 100
where h0 is the initial thickness (mm), h1 is the thickness after 24 h compression (after 2 min recovery time) (mm), h2 is the thickness after 1 h recovery time, h3 is the thickness after 1 day (24 h) recovery time, h4 is the thickness after 3 days recovery time, h5 is the thickness after 3 years recovery time, TL is the thickness loss (%), TL1h is the thickness loss after 1 h (%), TL1d is the thickness loss after 1 day (%), TL3d is the thickness loss after 3 days (%), TL3y is the thickness loss after 3 years (%), R is the resilience (%), R1h is the resilience after 1 h, R1d is the resilience after 1 day (24 h), R3d is the resilience after 3 days, and R3y is the resilience after 3 years.

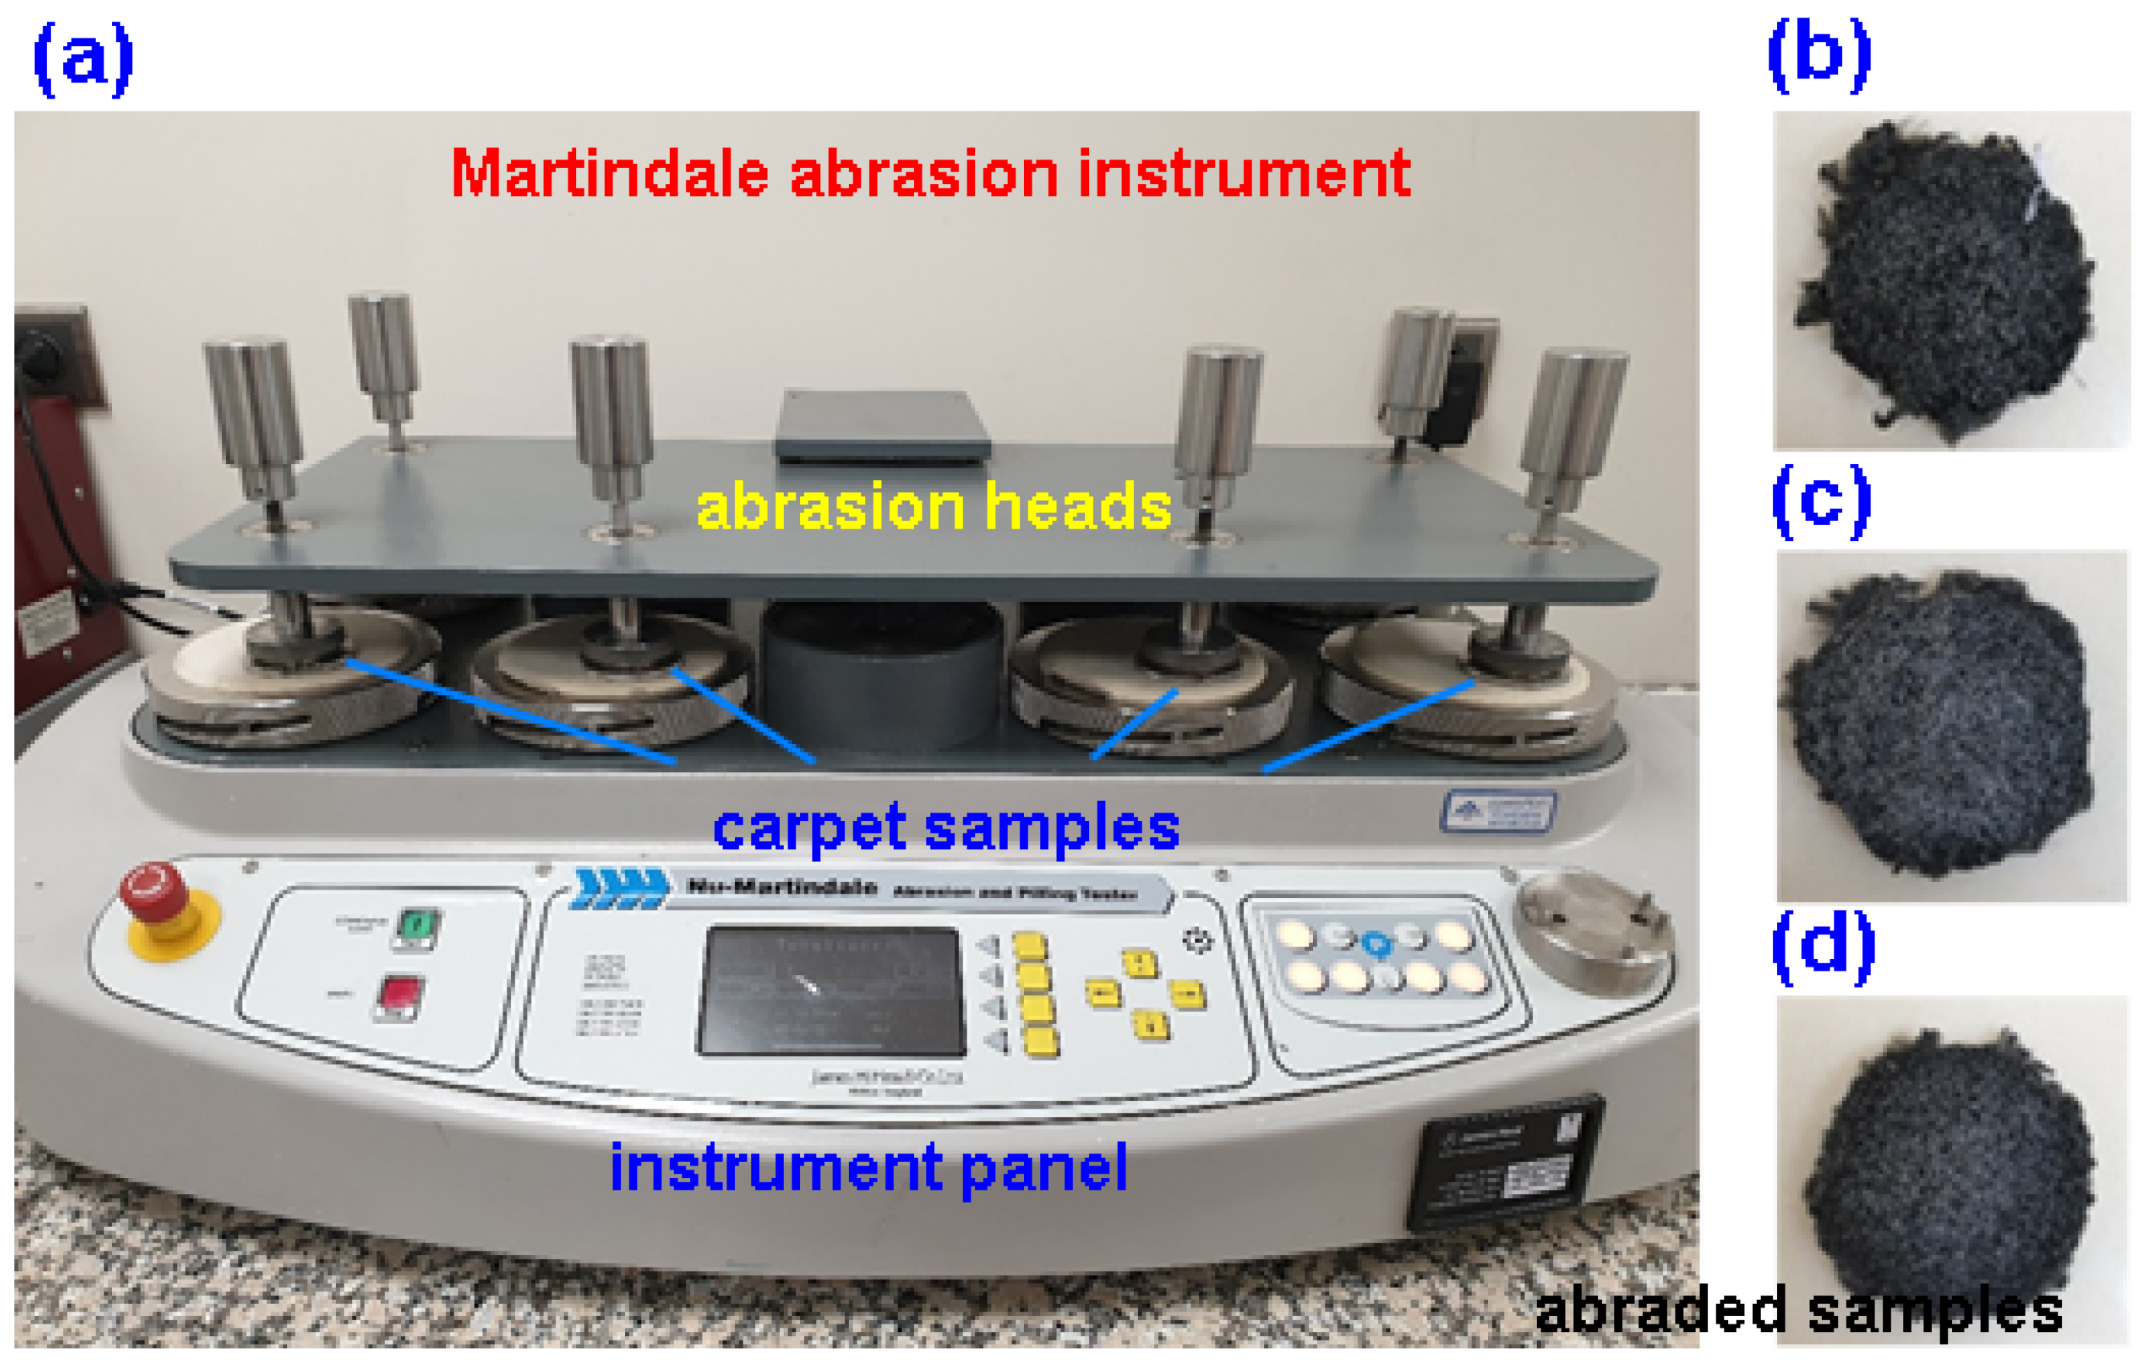
2.1.3. Abrasion (Martindale) Test

The abrasion properties of the polyester carpet structures were determined using the Martindale abrasion test method (ISO 12947-3) [86]. A Nu-Martindale Abrasion Test instrument (James H Heal, Halifax, UK) was used to evaluate the mass loss of carpet after abrasion in compliance with the TS EN ISO 12947-3 standards, as shown in Figure 5a–d. Mass loss values were recorded at the end of each 5000-, 10,000-, 20,000-, 30,000-, 40,000-, and 50,000-abrasion cycle. Standard wool fabric was used for abrasion and the pile surface of the carpet samples were abraded under pressure (12 KPa). Thickness measurements were also performed, since the carpet sample had a thickness loss tendency after abrasion cycles, using a thickness gauge (Elastocon EV 07, Bramhult, Sweden) [71]. The experiment was repeated twice due to limited test materials.

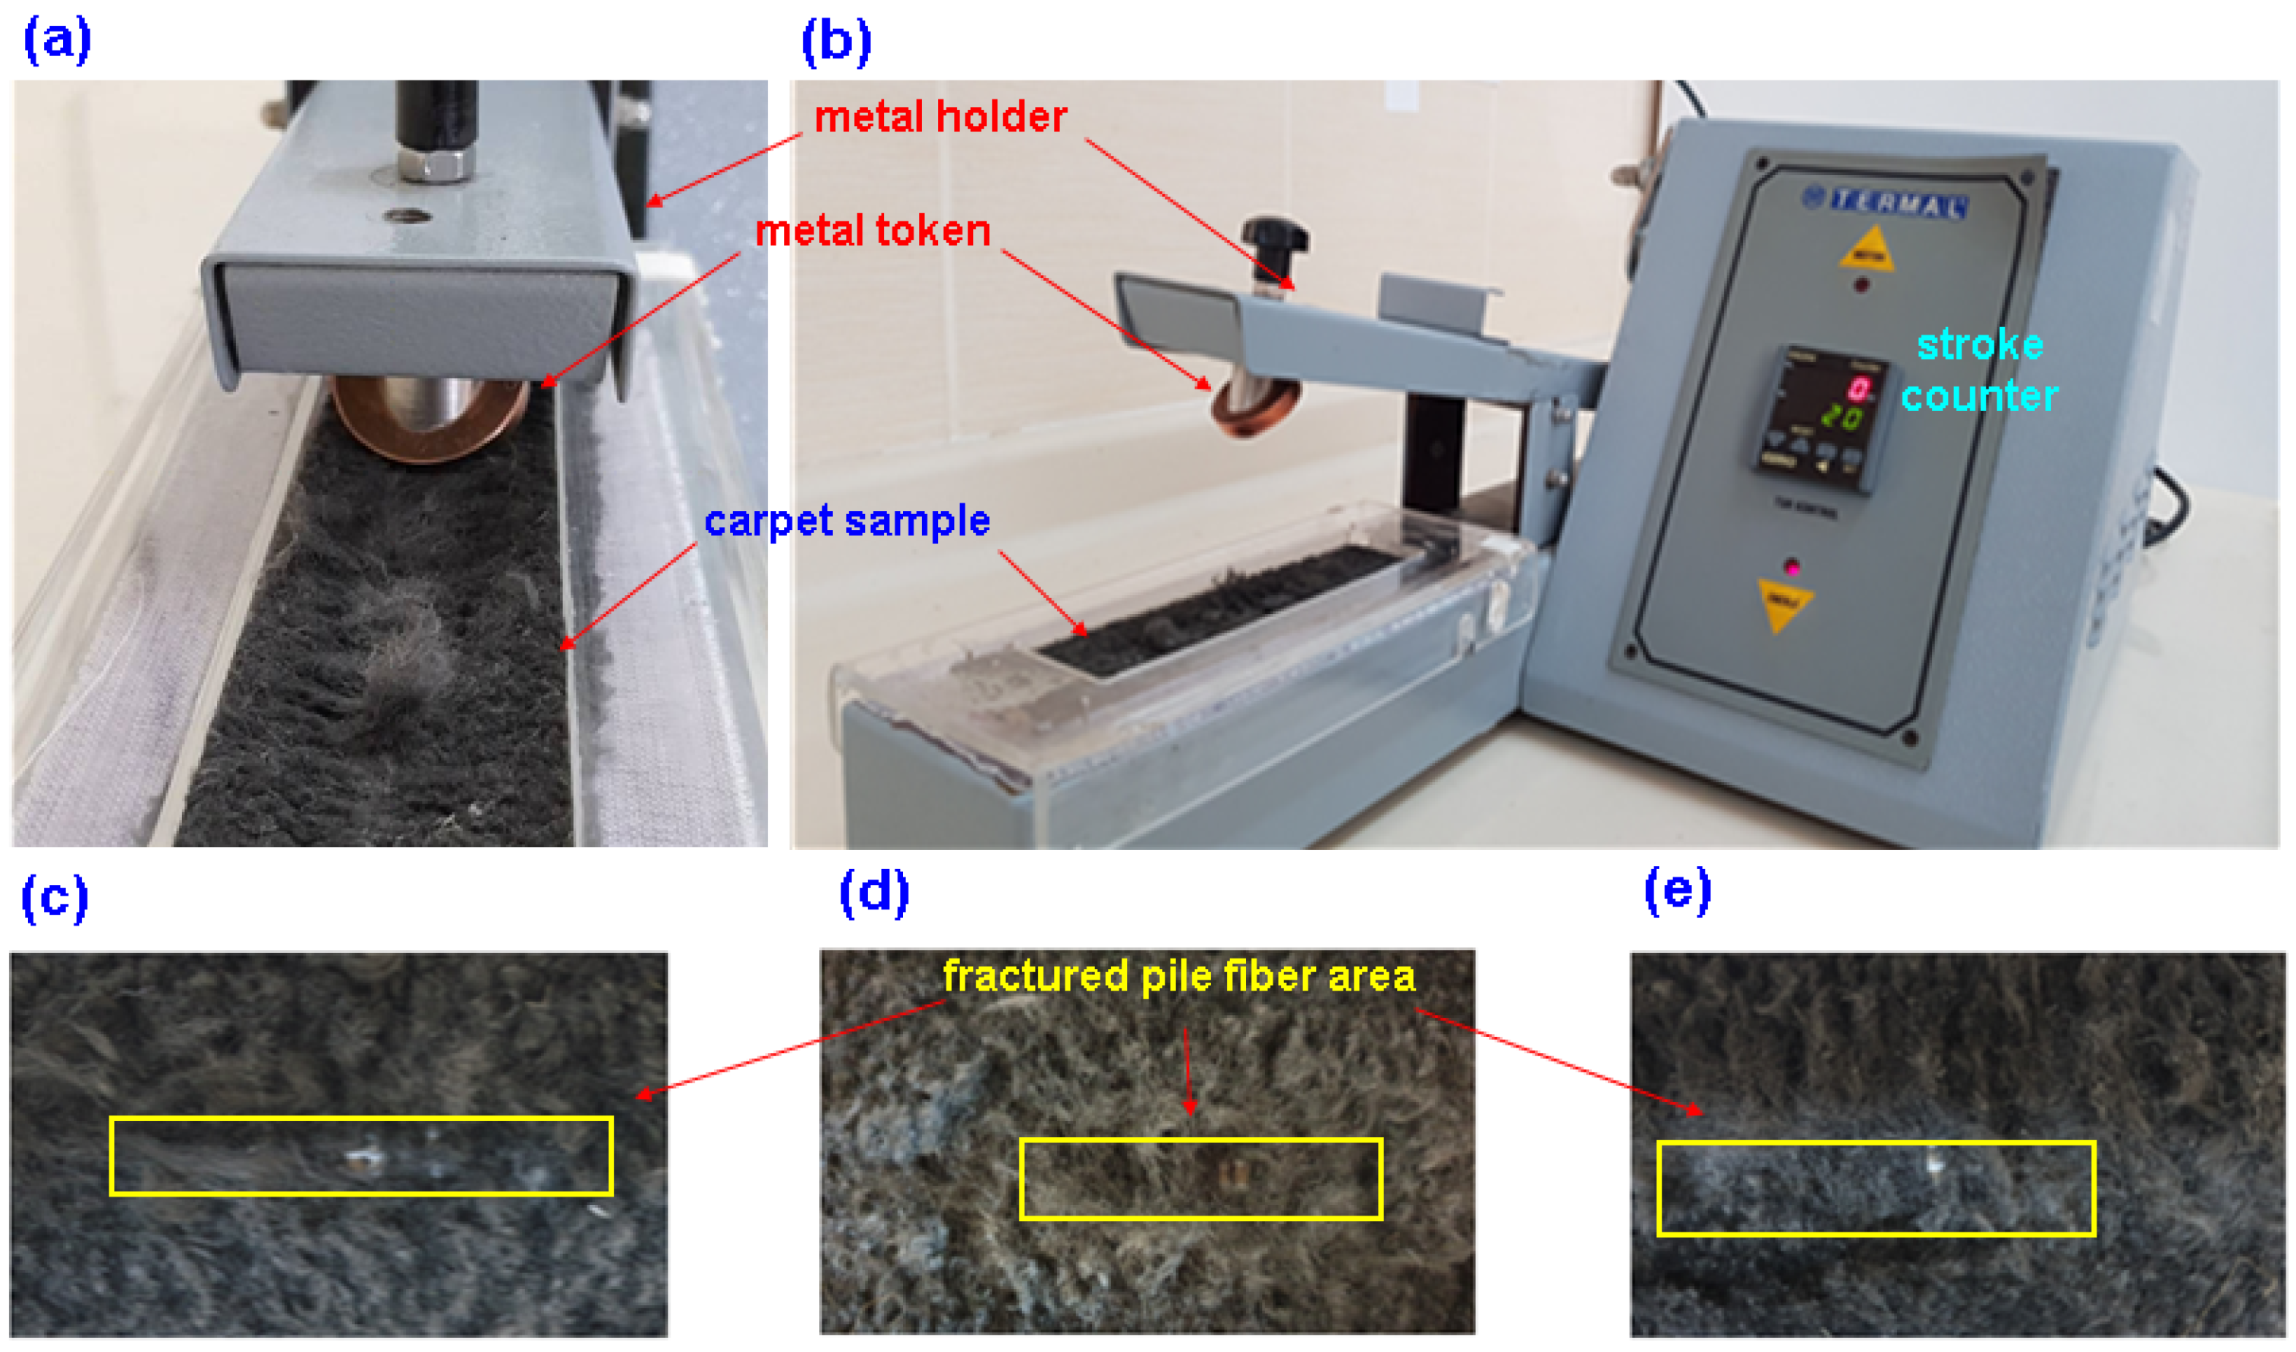
2.1.4. Rubbing (Token) Test

To assess the rubbing behavior of the carpet sample according to the BS 2543 test standards, a crockmeter (Termal, Istanbul, Turkey) equipped with a metal token holder was employed [87]. The dry carpet’s resistance to linear rubbing was evaluated using a metal token holder positioned at a 45° angle to the carpet pile surface. The areas of the carpet pile that exhibited deformations were identified through a visual assessment based on images captured using a digital camera. The dry carpet’s resistance to linear rubbing was evaluated using a metal token holder positioned at a 45° angle to the carpet pile surface. The metal token utilized in the study had a diameter of approximately 29 mm, a thickness of 6 mm, and was made of copper [71]. The token rubbing test was employed to simulate carpet hand cleaning. In this method, a rectangular specimen was positioned on the rubbing area of the crockmeter, and a metal token holder, inclined at a 45° angle to the carpet pile surface, was used to rub the specimen under low pressure (9 N). Figure 6a–e show the token rubbing test instrument during the rubbing test on a carpet sample. The token rubbing test was conducted until a visually consistent level of deformation was observed across all samples. The results of the test were expressed in terms of the stroke number. In the context of this study, a stroke was defined as a single back-and-forth movement of the metal token holder along the surface of the carpet pile.
The neat carpet sample and polyester pile mass loss of weight measurements were performed based on TS 251 [88] using an Ohaus AdventurerTM Pro AV812 (Ohaus Corp., Parsippany, NJ, USA) digital balance. The error in the measurement of weight was ±0.1 mg. The neat pile thickness, pile thickness after static loading and Martindale tests, and the neat carpet thickness were measured based on TS 7125 [89] and TS 3374 [90] using an Elastocon EV07 digital device, respectively. All mechanical tests were conducted in a standard laboratory atmosphere having a temperature of 23 °C ± 2 °C and relative humidity of 50 ± 10% [91]. A high-resolution digital camera (CANON PowerShot SX30 IS, Tokyo, Japan) was used to image the damaged surface of carpet samples after static loading and Martindale abrasion and token rubbing tests.

2.2. Statistical Model

Statistical modelling of some of the static loading (thickness loss and resilience) and abrasion (thickness loss) data on carpet samples was developed using “Design Expert” software. The best models on carpet were obtained, and the corresponding regression equations and regression curves were fitted. The analysis of variance (ANOVA) tables for static loading (thickness loss and resilience) and abrasion property, specifically the thickness loss, were measured, and the significance of the models was determined using p-values smaller than 0.05. The ANOVA tables revealed significant interactions between the pile height (A) and density (B) in both the static loading and abrasion tests. These interactions were taken into account when developing the regression equations. The generated data were subjected to a normality test, which indicated that the data exhibited a distribution that was approximately aligned with the normality line and conformed to a normal distribution.

3. Results and Discussion

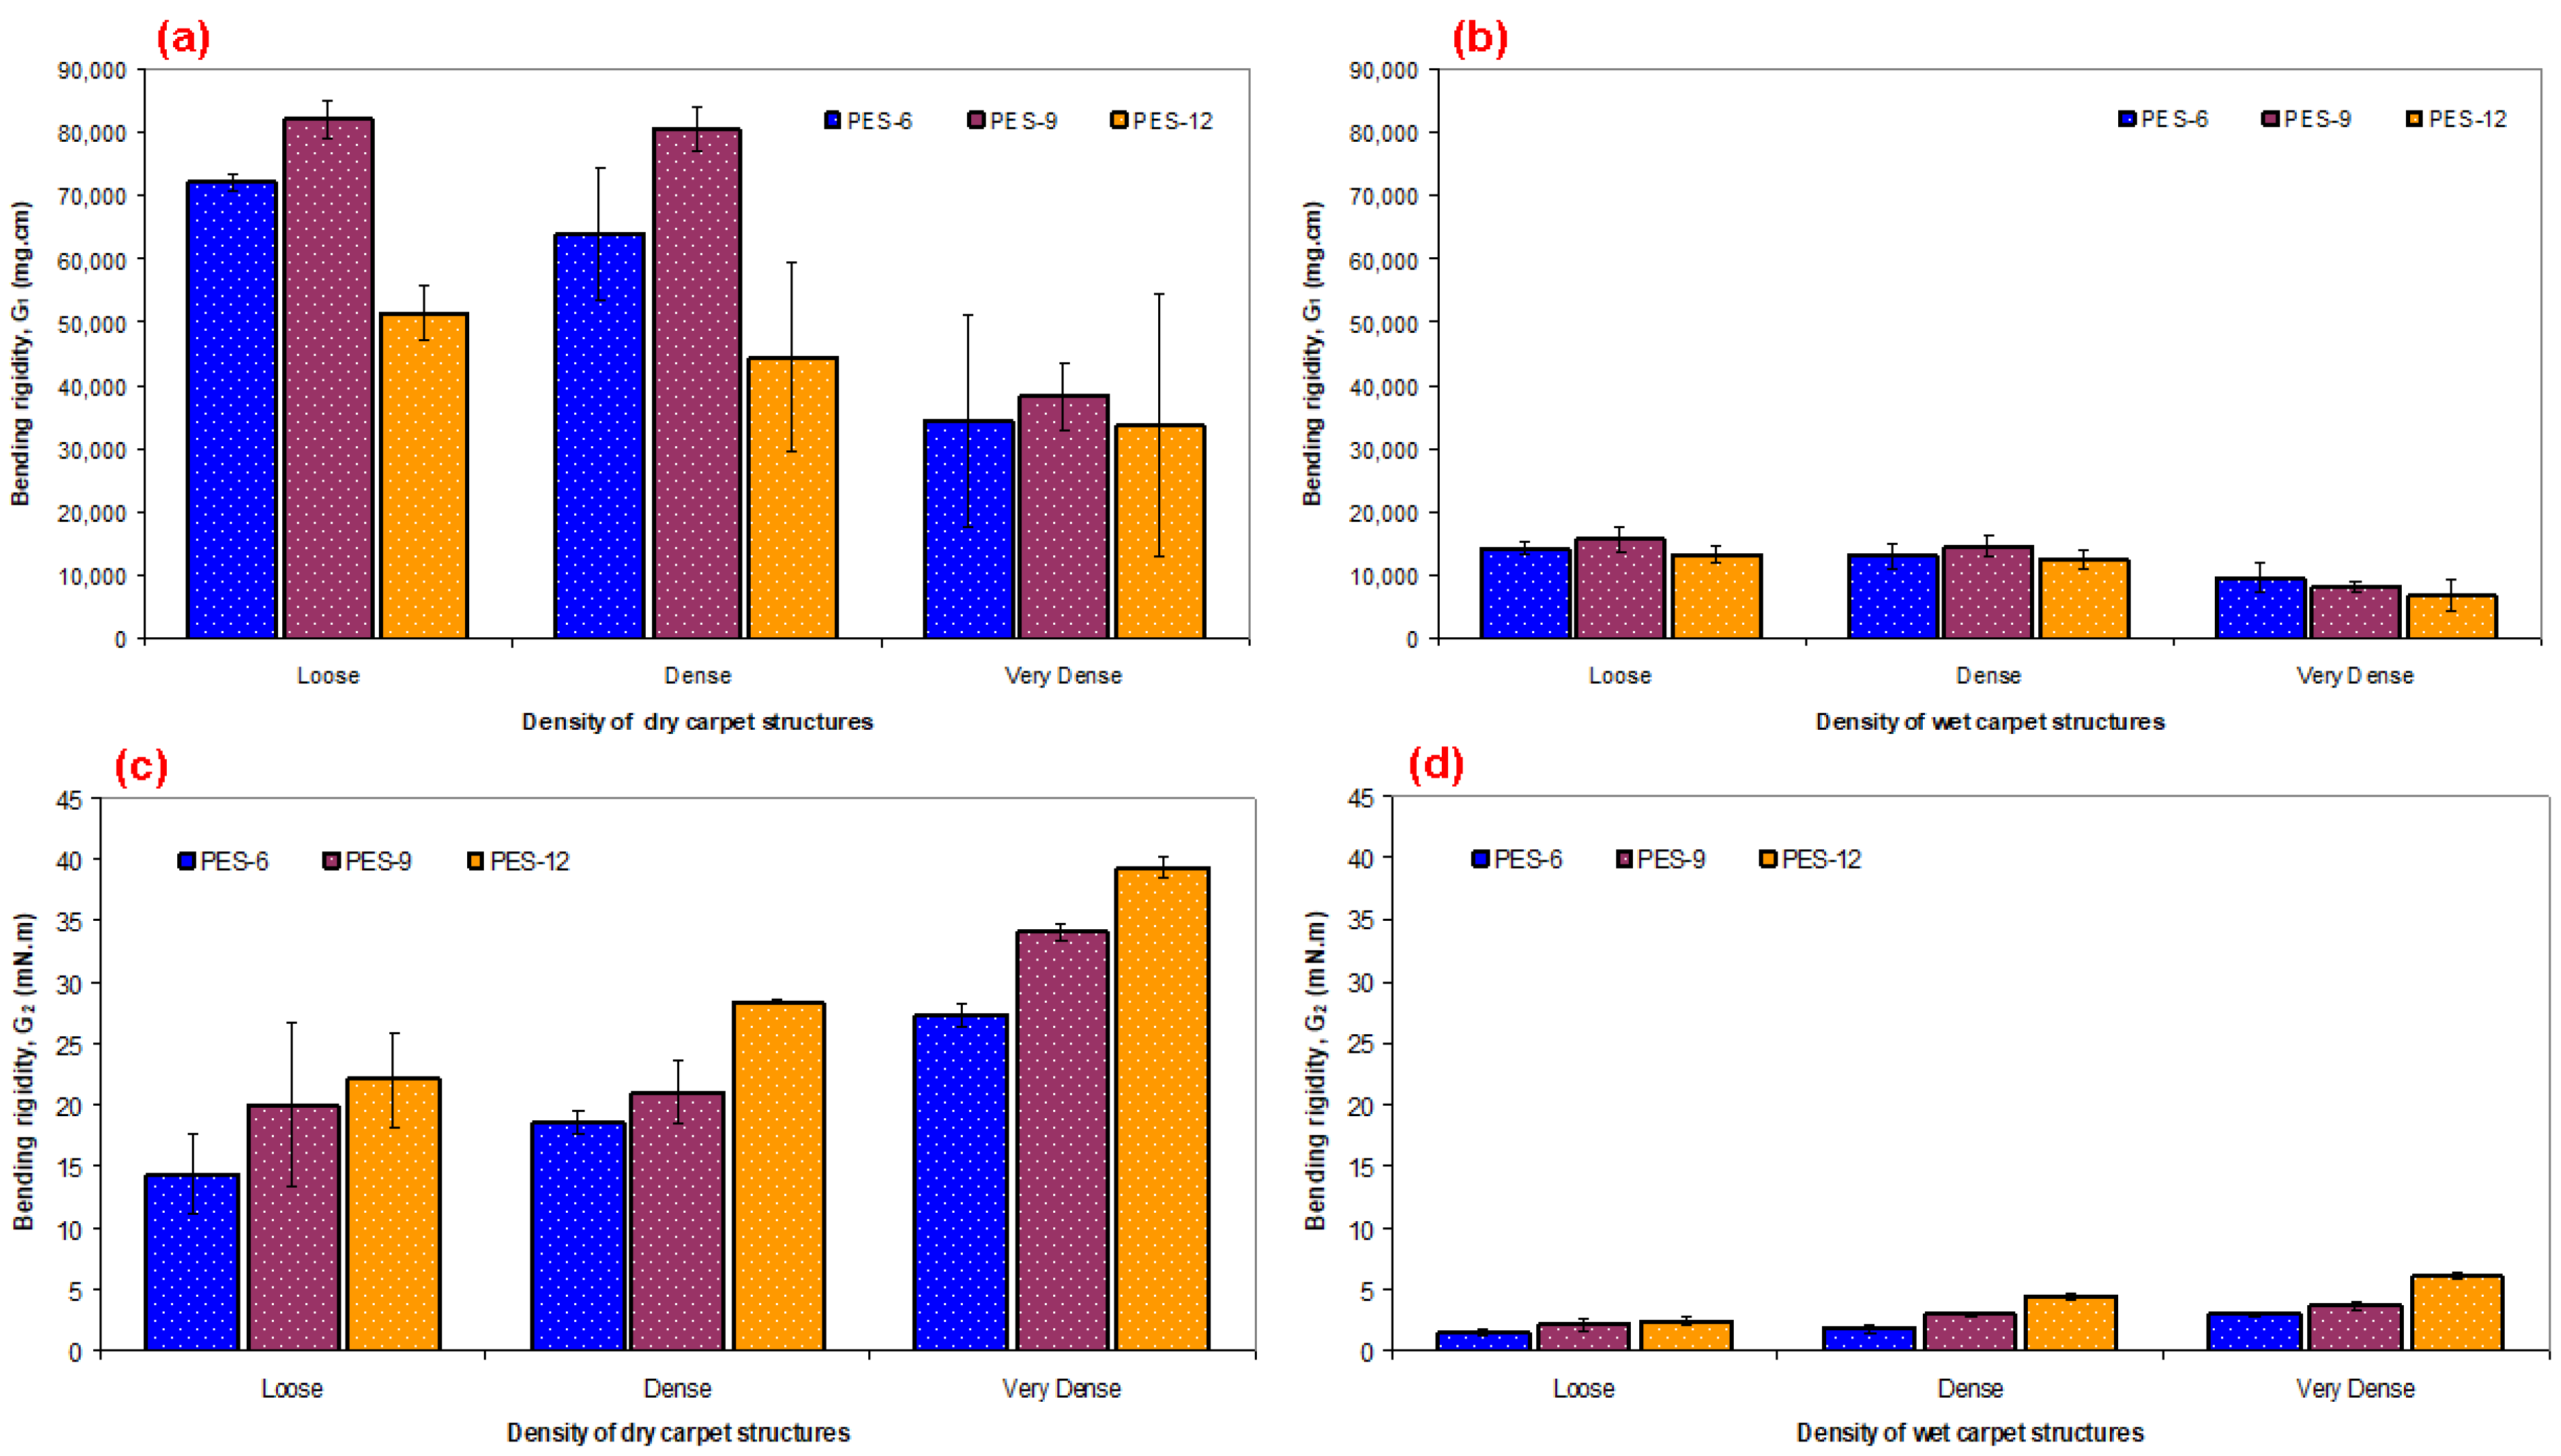
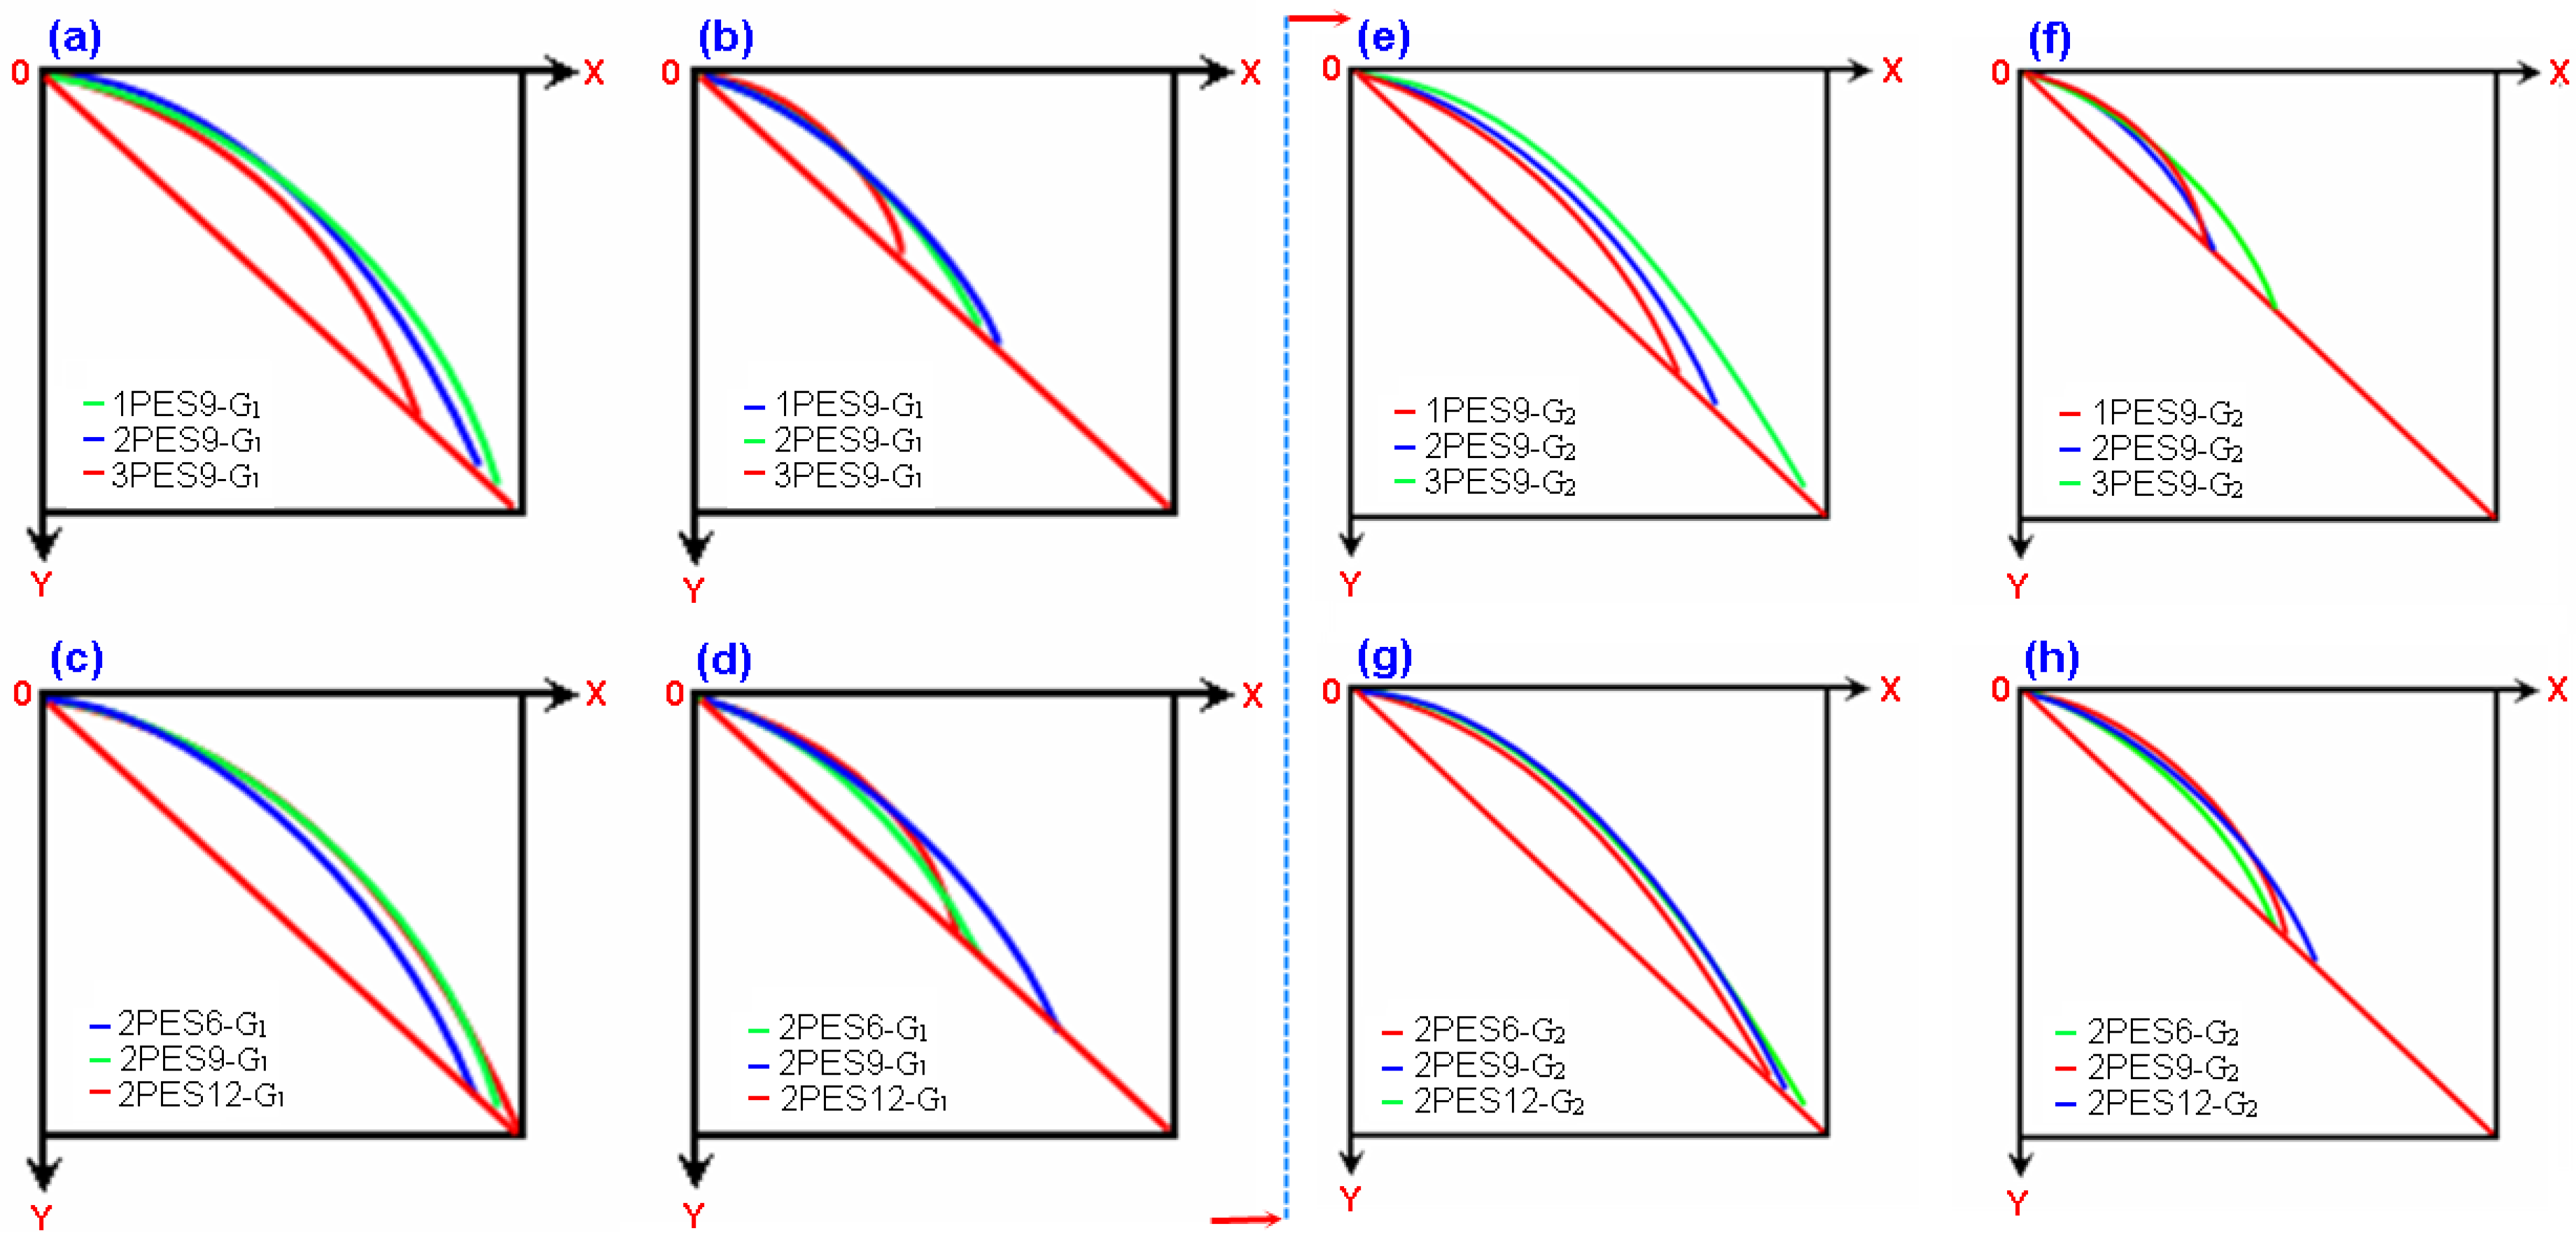
3.1. Carpet Structure Bending Results

Bending rigidity results on various carpet structures are presented in Table 3 and Figure 7a–d for both apparel fabric and technical fabric bending test methods. As shown in Table 3 and Figure 7a–b, the dry bending rigidity based on the apparel fabric test method of 2PES6-G1 and 3PES6-G1 was decreased by 12.67% and 108.63% compared to 1PES6-G1, respectively. Similar changes were obtained from remaining dry polyester carpet structures including 1PES9, 2PES9, 3PES9, 1PES12, 2PES12, and 3PES12 (Figure 7a). On the other hand, the polyester pile height probably indirectly affected the bending rigidity of carpet in that carpet areal density was incrementally increased when the pile height increased. The wet bending rigidity of 2PES6-G1 and 3PES6-G1 was decreased by 9.74% and 47.89% compared to 1PES6-G1, respectively. Similar trends were obtained from remaining wet carpet structures including 1PES9, 2PES9, 3PES9, 1PES12, 2PES12, and 3PES12 (Figure 7b). This indicated that the bending rigidity of polyester carpet samples from dry and wet cases exhibited similar results. The results from bending for apparel fabric showed that when the carpet weight (areal density, g/m2) increased, the bending rigidity (mg.cm) decreased from loose to very dense carpet structures due to the increase in weft density. Moreover, the average dry bending rigidity of polyester carpet samples was 4.61 times higher than the average wet bending rigidity of samples due to water uptake increasing the carpet weight.
As shown in Table 3 and Figure 7c,d, the dry bending rigidity, based on the technical fabric test method, increased by 21.95% and 47.26% for 2PES6-G2 and 3PES6-G2, respectively, compared to 1PES6-G2. Similar changes were observed in the remaining dry polyester carpet structures, including 1PES9, 2PES9, 3PES9, as well as 1PES12, 2PES12, and 3PES12 (Figure 7c). On the other hand, it is likely that the pile height indirectly influenced the bending rigidity of the carpet, as the carpet’s areal density increased incrementally with higher pile heights. The wet bending rigidities of 2PES6-G2 and 3PES6-G2 were increased by 18.78% and 50.34% compared to 1PES6-G1, respectively. Similar trends were nearly achieved from remaining wet carpet structures including 1PES9, 2PES9, 3PES9, and 1PES12, 2PES12, and 3PES12 (Figure 7d). This indicates that the bending rigidity of polyester carpet samples showed similar results in both dry and wet conditions. The bending results for technical fabric showed that as the carpet weight (areal density, g/m2) increased, the bending rigidity (mN.m) also increased, moving from loose to very dense carpet structures. This increase could be attributed to the larger sample size used for bending tests in technical fabric, with a sample width 12 times higher compared to the sample size used for bending tests in apparel fabric, where the sample size affects the bending stiffness. Furthermore, the average dry bending rigidity of polyester carpet samples was 8.11 times higher than the average wet bending rigidity of carpet samples, attributed to the increase in the weight of wet carpets. For future studies, the bending test for technical fabric can be simplified to determine the flexural properties of heavy three-dimensional dry or impregnated polymeric preforms, especially in complex shape molding for manufacturing specific parts.

Carpet Structure Curvature Results

Bending curvature results on various dry and wet carpets depending on apparel fabric and technical fabric bending test principles are illustrated in Figure 8a–h. Regression equations of bending curvature results on various dry and wet carpet structures are presented in Table 4. As shown in Table 3 and Figure 8a–h, the overhang lengths based on the apparel fabric test method of dry 2PES9-G1 and 3PES9-G1 carpet samples were decreased by 0.35% and 35.41% compared to 1PES9-G1, respectively. A similar tendency was found in the remaining dry carpet structures including 1PES6, 2PES6, 3PES6, and 1PES12, 2PES12, and 3PES12 (Table 3, Figure 8c). However, the pile height probably insignificantly affected the bending curvature of carpet in that carpet areal density was incrementally increased when the pile height increased (Figure 8c). The overhang lengths of wet 2PES9-G1 and 3PES9-G1 carpet samples were decreased by 2.2% and 29.92% compared to 1PES9-G1, respectively (Figure 8b). Nearly the same trends were obtained from rest of the wet polyester carpet structures including 1PES6, 2PES6, 3PES6, 1PES12, 2PES12, and 3PES12 (Table 3, Figure 8d). This indicated that the bending curvature of carpets from dry and wet cases illustrated similar results. The results from bending curvature for the apparel fabric test showed that when the carpet weight (areal density, g/m2) increased, the bending curvature (cm) decreased from loose to very dense carpet structures due to the increase in weft density. In addition, downward concave small bending curvature was obtained from very dense carpet structures. Further, the average dry bending curvature of carpet samples was 39.33% higher than the average wet bending curvature of carpet samples due to the increase in wet polyester carpet weight. Thus, large bending curvatures from all dry carpets were obtained compared to the wet carpets (Figure 8a–d).
As shown in Table 3 and Figure 8a–h, the overhang lengths based on the technical fabric test method of dry 2PES9-G2 and 3PES9-G2 carpets were increased by 1.99% and 12.05% compared to 1PES9-G2, respectively. Similar results were found from remaining dry carpet structures including 1PES6, 2PES6, 3PES6, 1PES12, 2PES12, 3PES12 (Table 3, Figure 8e). However, it is likely that the pile height had a minimal effect on the bending curvature of the carpet, as the carpet’s areal density incrementally increased with higher pile heights (see Figure 8g). Compared to 1PES9-G2, the overhang lengths of wet 2PES9-G2 and 3PES9-G2 carpets exhibited increases of 10.58% and 12.26%, respectively (refer to Figure 8f). Similar trends were observed in the remaining wet carpet structures, including 1PES6, 2PES6, 3PES6, as well as 1PES12, 2PES12, and 3PES12 (see Table 3 and Figure 7h). This suggests that the bending curvature of carpets in both dry and wet conditions exhibited similar results. The results of the bending curvature test for technical fabric showed that as the carpet weight (areal density, g/m2) increased, the bending curvature (cm) also increased, transitioning from loose to very dense carpet structures. This increase can be attributed to the higher weft density and the larger sample size used in the bending test for technical fabric, where the sample width was 12 times greater compared to the bending test for apparel fabric, where the sample size affects the bending curvature. In addition, loose carpet structures exhibited a downward concave small bending curvature, while very dense carpet structures exhibited a downward concave large bending curvature. Moreover, the average dry bending curvature of carpets was more than twice as high as the average wet bending curvature of carpets, attributed to the increase in wet carpet weight. Thus, it was found that all dry carpets exhibited larger bending curvatures compared to the wet carpets (see Figure 8e–h). It was concluded that bending via the technical fabric test can simplify for the determination of heavy three-dimensional dry or impregnate polymeric preforms’ flexural properties, particularly for complex shape molding part manufacturing.
Regression equations of the bending curvature of the dry and wet form of carpets based on the apparel fabric and technical fabric bending tests were obtained using MATLAB R2016a [83]. This was achieved using MATLAB’s numerical integration and standard plotting tools. Regression equations obeyed the polynomial function where n varied between 1.7630–0.7361 for apparel fabric and 0.9925–0.7570 for technical fabric. The coefficients of regression on the bending apparel and technical fabric test data were between 0.9999 and 0.9524, which was considered well fitted for the measured values (Table 4).

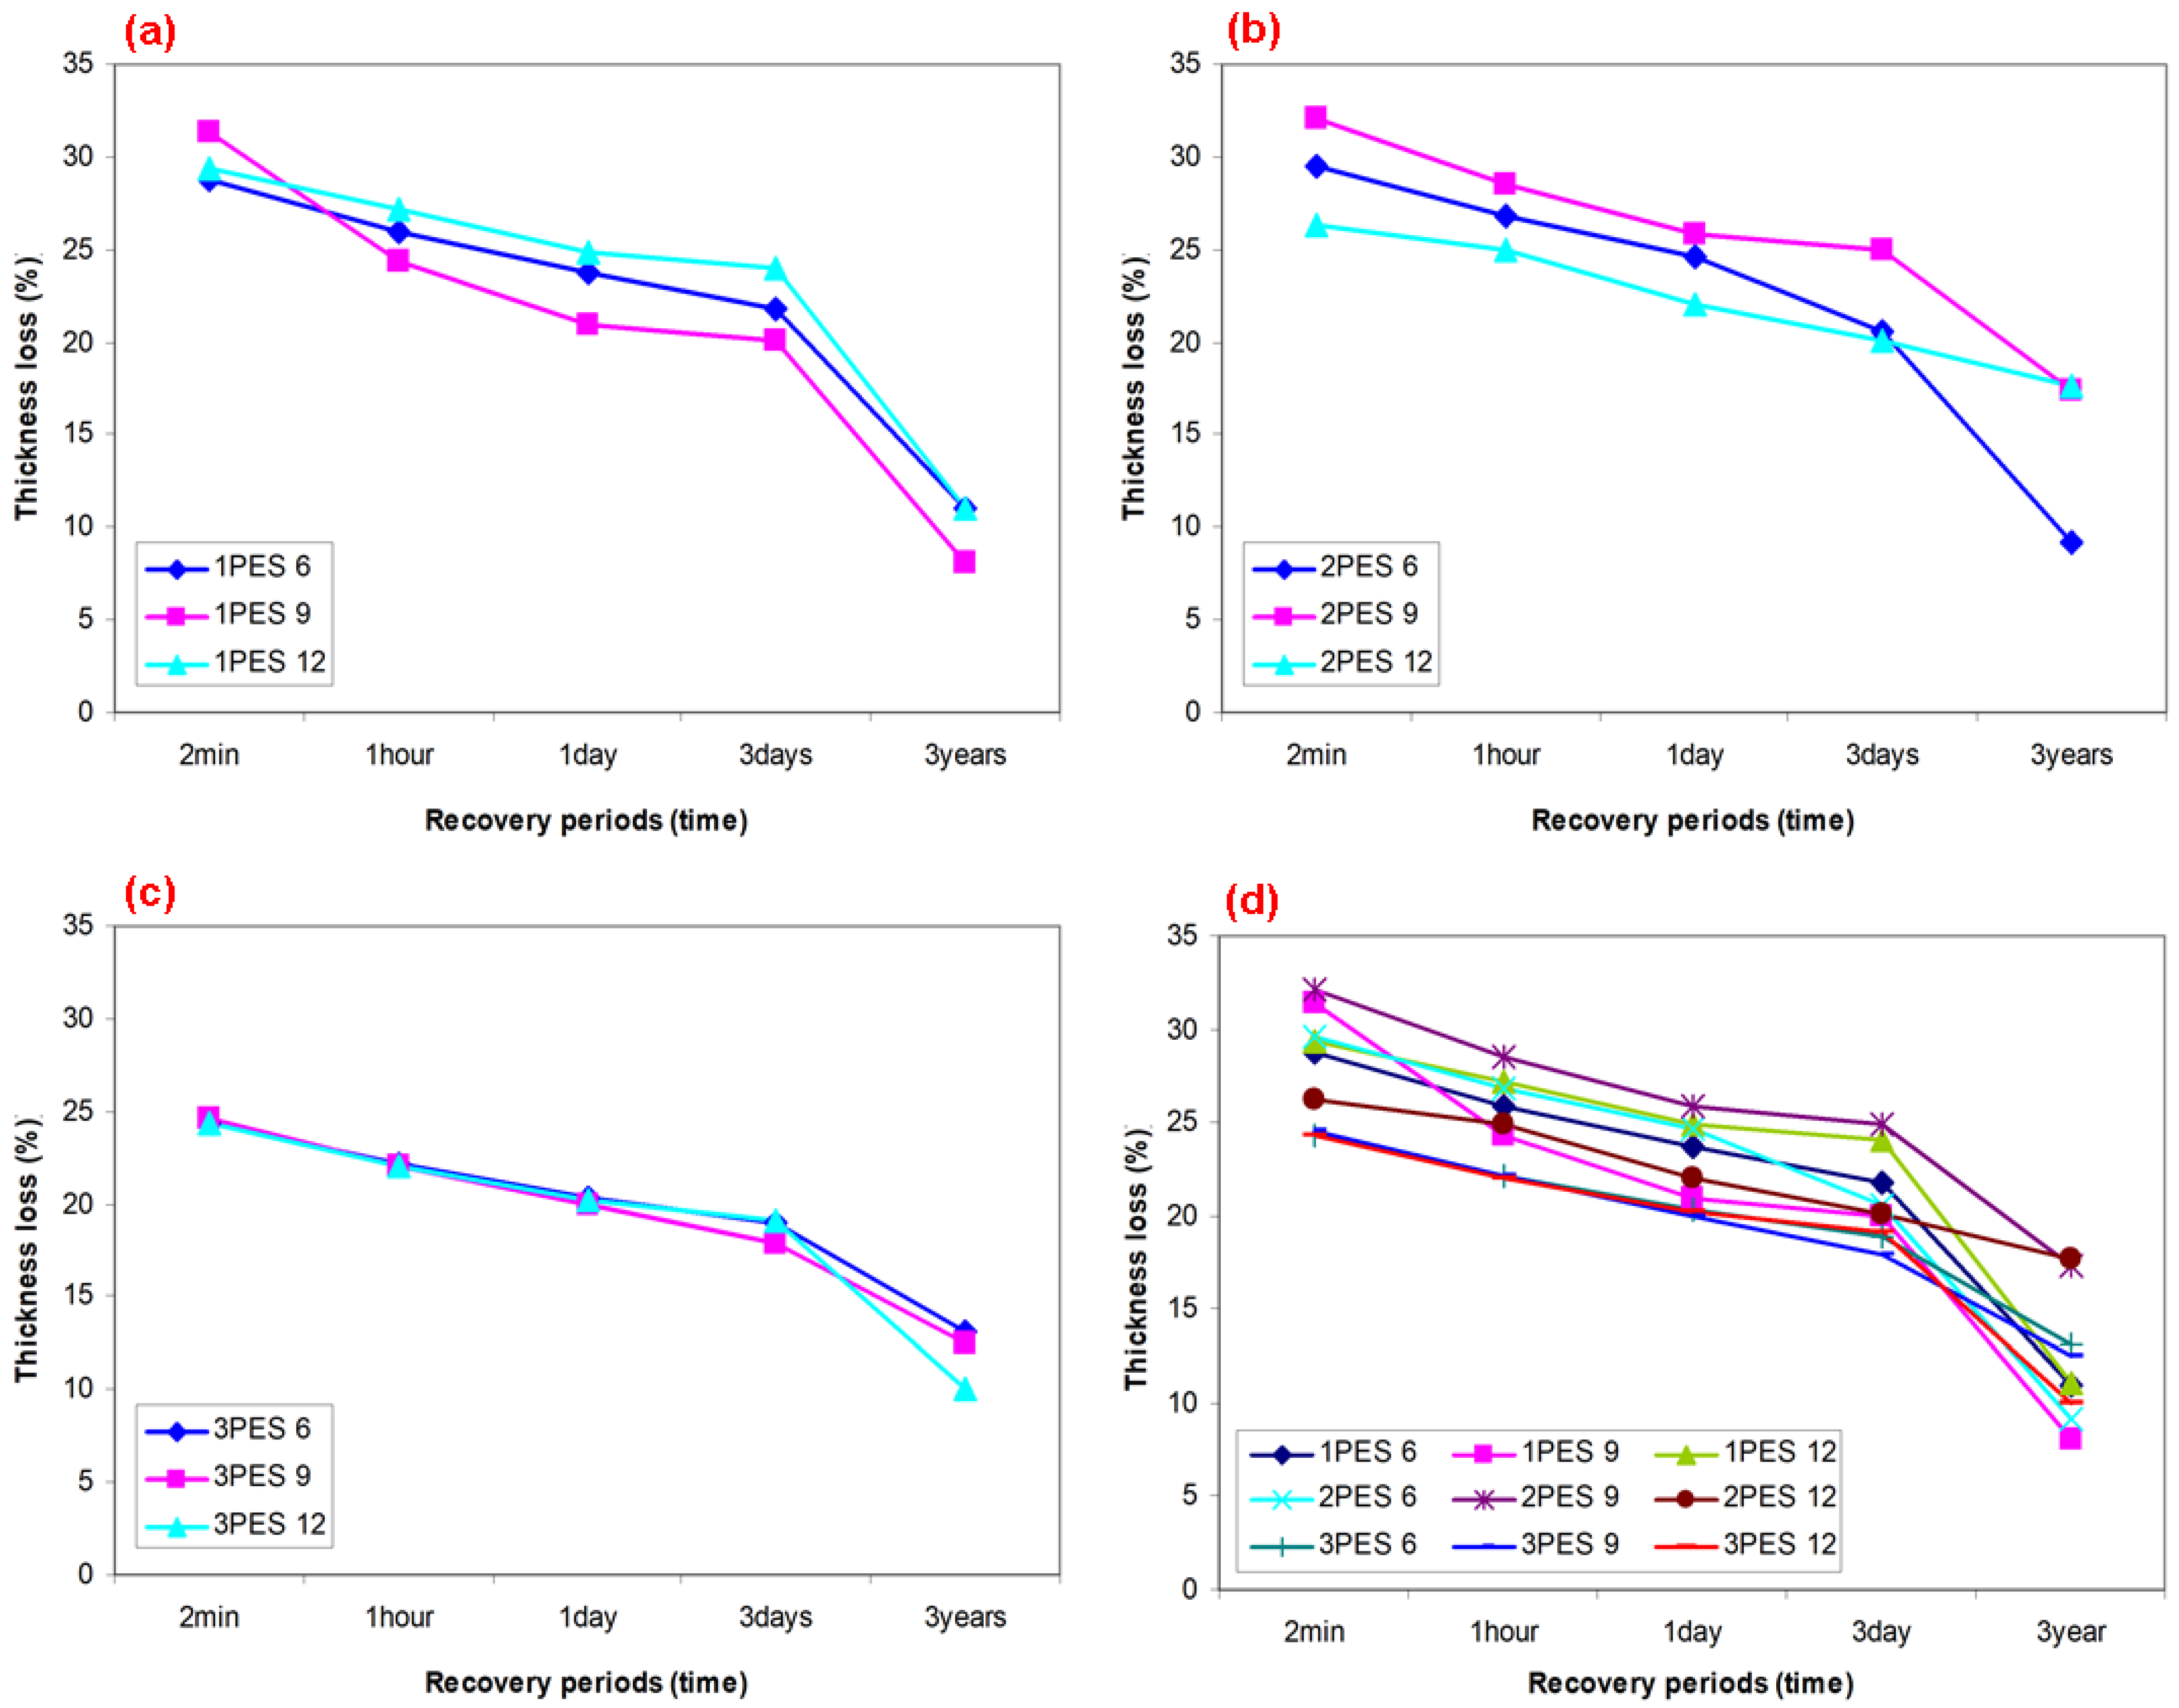
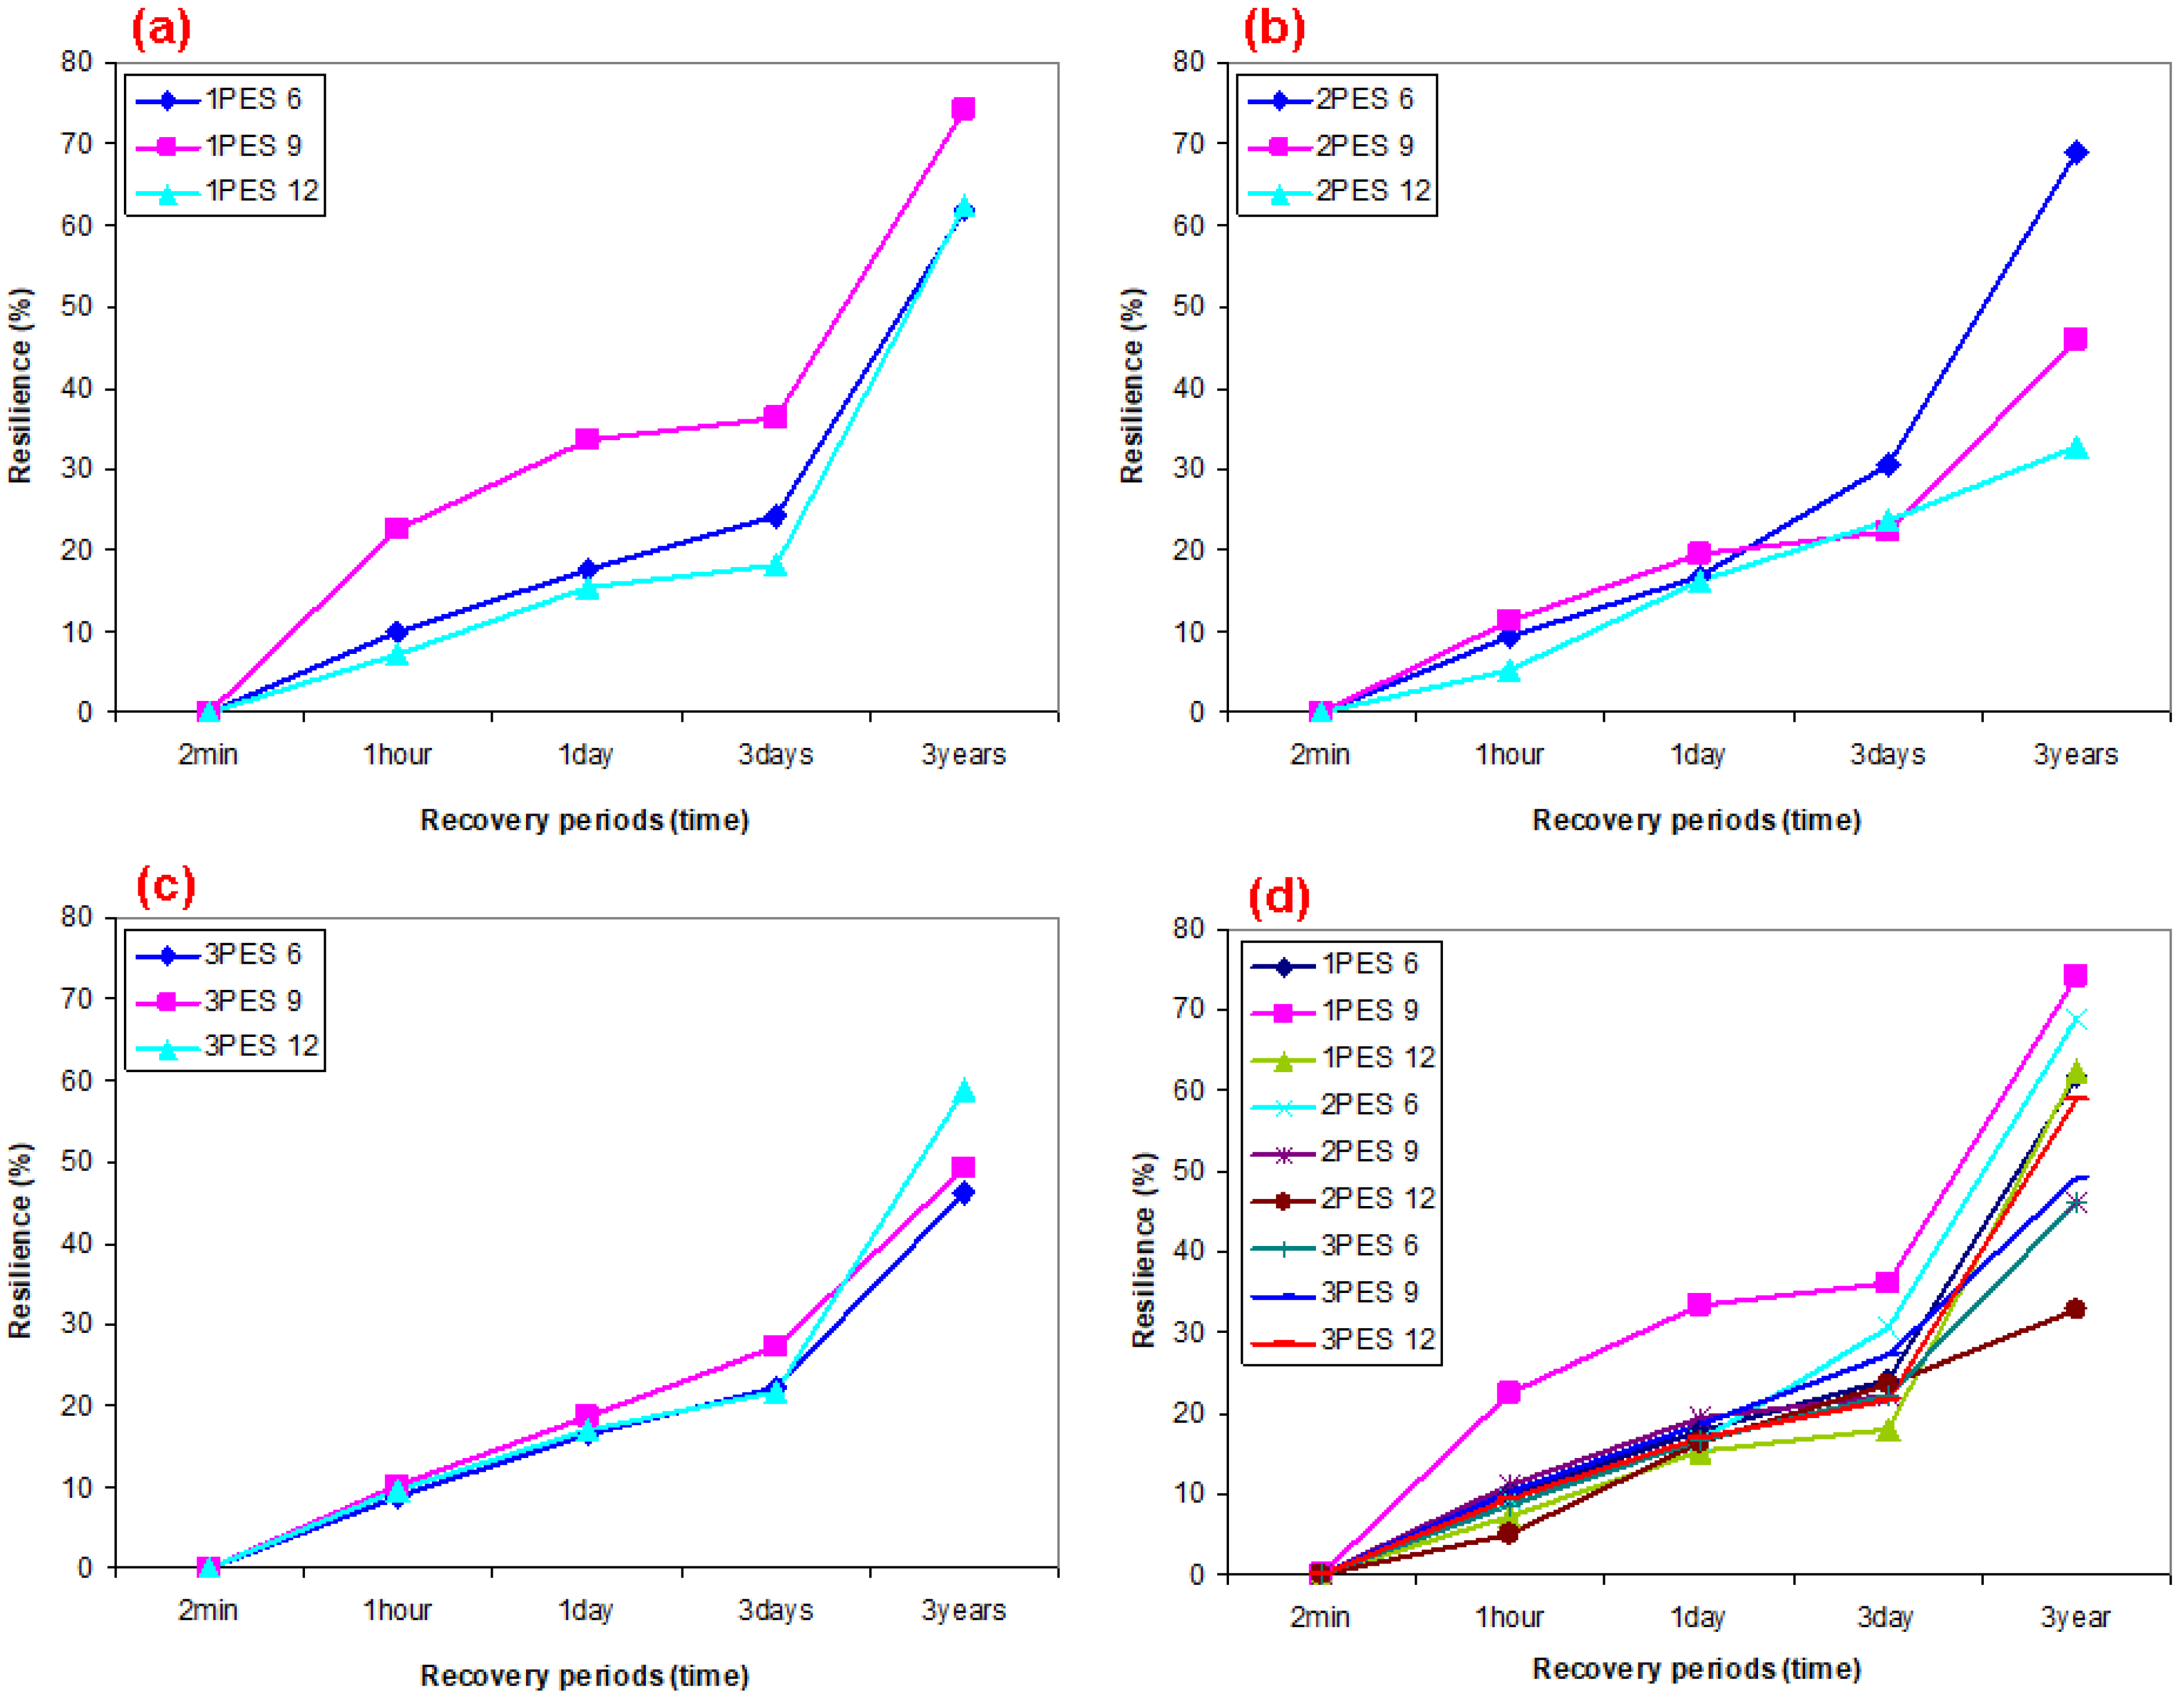
3.2. Carpet Structure Static Loading Results

Static loading (compression) results on the thickness (mm), thickness loss (%), and resilience (%) of various polyester pile carpet structures are presented in Table 5 and are illustrated in Figure 9a–d. In addition, Figure 10a–d illustrates various recovery period and resilience relations after static loading on dry carpet samples.
As shown in Table 5 and Figure 9a–d, the carpet thickness loss (%) of various recovery periods of all carpets almost linearly decreased. The average dry carpet thickness loss (%) under a vertical distributed load (compression) for various recovery periods including after 2 min, 1 h, 1 day, and 3 years of 2PES6 and 3PES6 were decreased by 0.45% and 12.53% compared to 1PES6, respectively. Similar results were roughly obtained from rest of the carpet structures including 1PES9, 2PES9, 3PES9, 1PES12, 2PES12, 3PES12, where when the pile density increases, the variation of thickness loss decreases for all polyester pile heights (Figure 9a–c). This is perhaps related to the increase in knots density, which affected polyester fiber-to-fiber friction (cohesion friction) and indirectly weft density. On the other hand, the thickness loss for each recovery period from loose to very dense carpets proportionally depended on the pile density. In general, it decreases as the pile density increases due to the compression load carrying capacity per knot. This capacity is higher in carpets with dense knots compared to those with sparse knots per unit area. In addition, the effect of pile heights on the carpet thickness loss for each recovery period was hardly significant from loose to very dense polyester carpets because of complex buckled pile yarn deformation mechanism under the constrained substrate, where critical structural parameters were considered as pile yarn specifications including linear density, knot density, polyester fiber-to-fiber friction, and twisted plied or untwisted textured forms [92].
As shown in Table 5 and Figure 10a–d, the carpet resilience (ability to recover from pile deformation or gain from total thickness loss, %) of various recovery periods of all carpets sharply increased. The average resilience (%) under static load (compression) for various recovery periods including after 2 min, 1 h, 1 day, and 3 years of 2PES6 and 3PES6 slightly decreased compared to 1PES6. Similar results were obtained from the remaining carpet structures, wherein an increase in pile density resulted in a decrease in resilience variation across all pile heights (refer to Figure 10a–c). This may be attributed to the increased density of knots and the structural weft density. On the other hand, the resilience for each recovery period from loose to very dense carpets depended on the pile density. Generally, it decreases as the pile density increases due to the strong resistance generated by carpets with dense knots per unit area. Furthermore, the impact of pile heights on the resilience of polyester carpet became marginally significant for each recovery period. As the pile height increased from loose to very dense carpets, the resilience of the carpet tended to decrease. This could be attributed to the time-dependent deformation mechanism of the polyester pile yarn under the constrained substrate, as well as the presence of complex residual stress and stress relaxation. These critical structural parameters include pile yarn specifications such as linear density, knots density, fiber-to-fiber friction, and the choice between twisted plied or untwisted textured forms. We plan to conduct further research on these aspects through generating load–displacement and stress–strain curves to elucidate the critical parameters of the carpet.

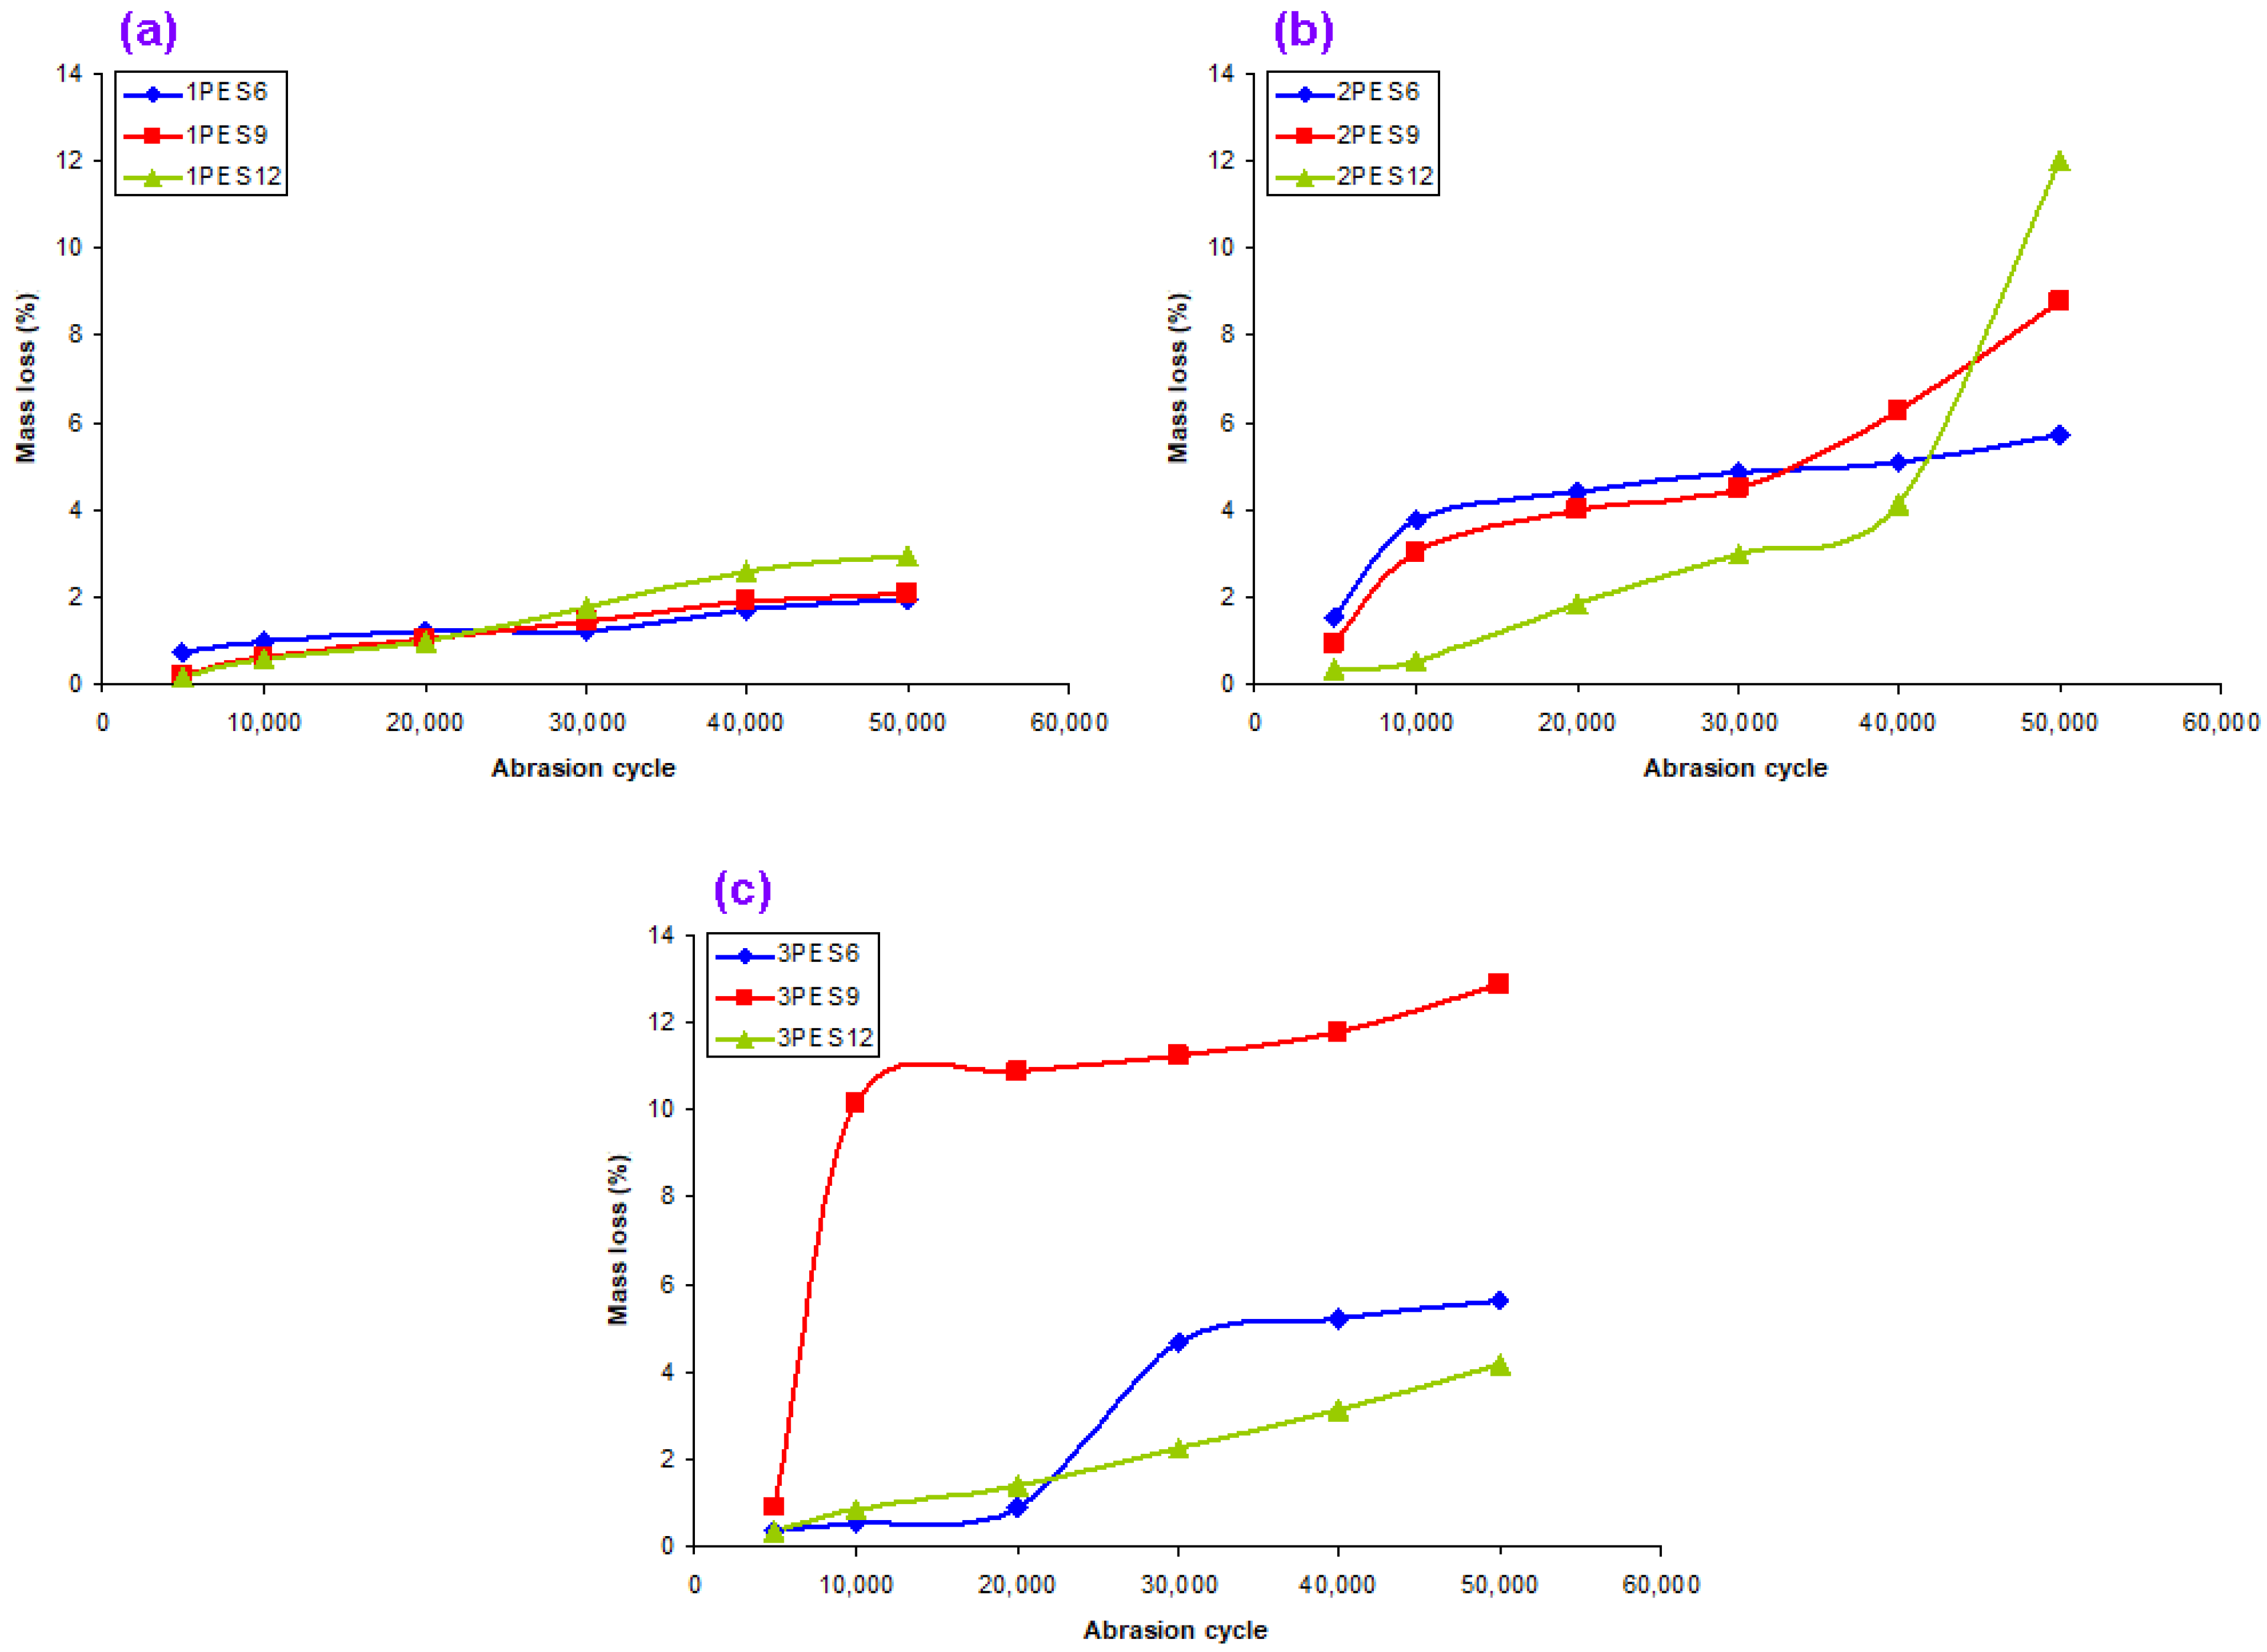
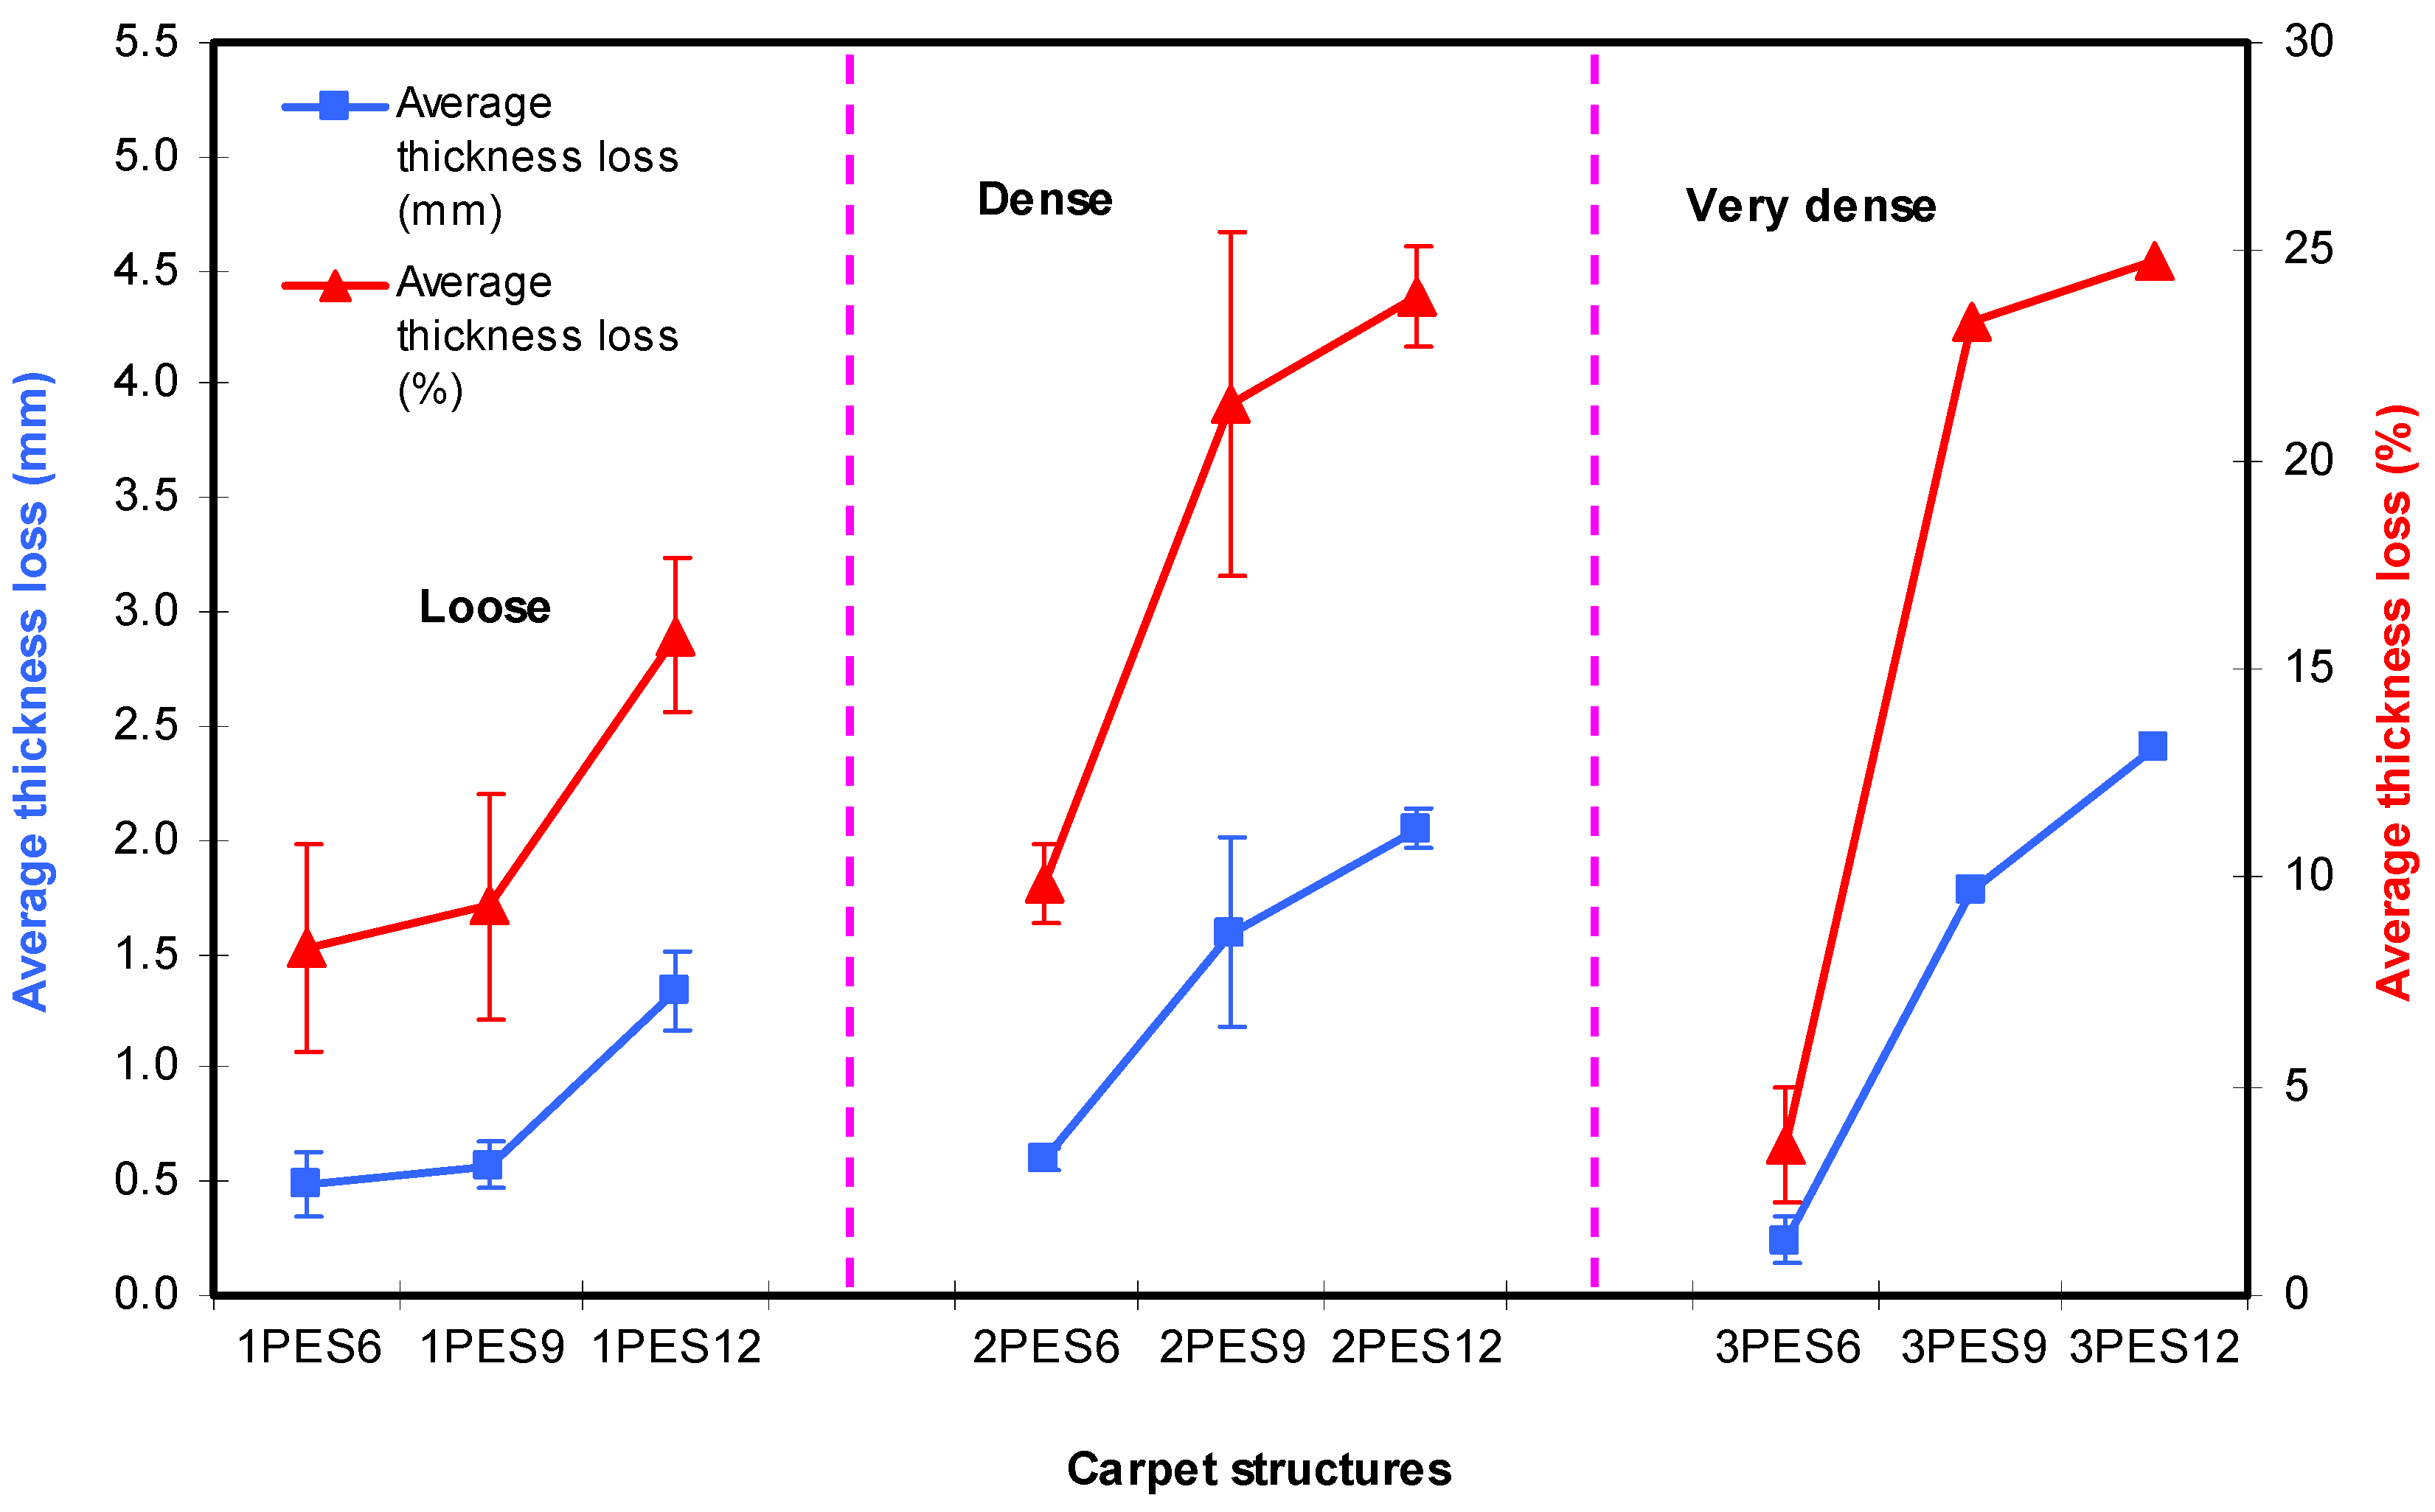
3.3. Martindale Abrasion Results

Martindale abrasion results on carpet structure for different abrasion cycles, pile mass loss and thickness loss is presented in Table 6. Figure 11a–c shows various abrasion cycles and pile mass loss (%) relations after a Martindale abrasion test on the dry carpet samples. Furthermore, Figure 12 exhibits abrasion cycle (50,000) and carpet thickness loss (mm, %) relations after testing on carpets.
As shown in Table 6 and Figure 11a–c, when the pile density increased, the carpet mass losses (%) of all carpets increased. For instance, the average carpet mass losses (%) of 1PES9, 2PES9, and 3PES9 carpet samples were 1.23%, 4.59%, and 9.63% higher, respectively. This is because of the number of knots per area. At the same pile density, when the pile height increased, the carpet mass losses (%) of all carpets were nearly increased. For instance, the average carpet mass losses (%) of 1PES6, 2PES9, and 3PES12 carpets were 1.31%, 1.23%, and 1.52% raised, respectively. On the other hand, when the abrasion cycles were increased from 5000 cycles to 50,000 cycles, the average carpet mass losses (%) increased from 0.63% to 6.25%. Moreover, it was identified that the effect of substrate architecture on the carpet abrasion properties was insignificant.
As shown in Table 6 and Figure 12, when the pile density increased, the carpet thickness losses (%) of all carpets were mainly increased after 50,000 abrasion cycles due to more out-of-plane fibers being in contact at the abraded area. For example, the average carpet thickness losses (%) of 1PES9, 2PES9, and 3PES9 carpet samples increased by 9.33%, 21.32%, and 23.30% compared to the initial carpet thickness values, respectively. At the same pile density, when the pile height increased, the carpet mass losses (%) of all carpet samples were nearly increased. Similarly, the average carpet thickness losses (%) of 1PES6, 1PES9, and 1PES12 carpet samples were 8.30%, 9.33%, and 15.81% greater, respectively.

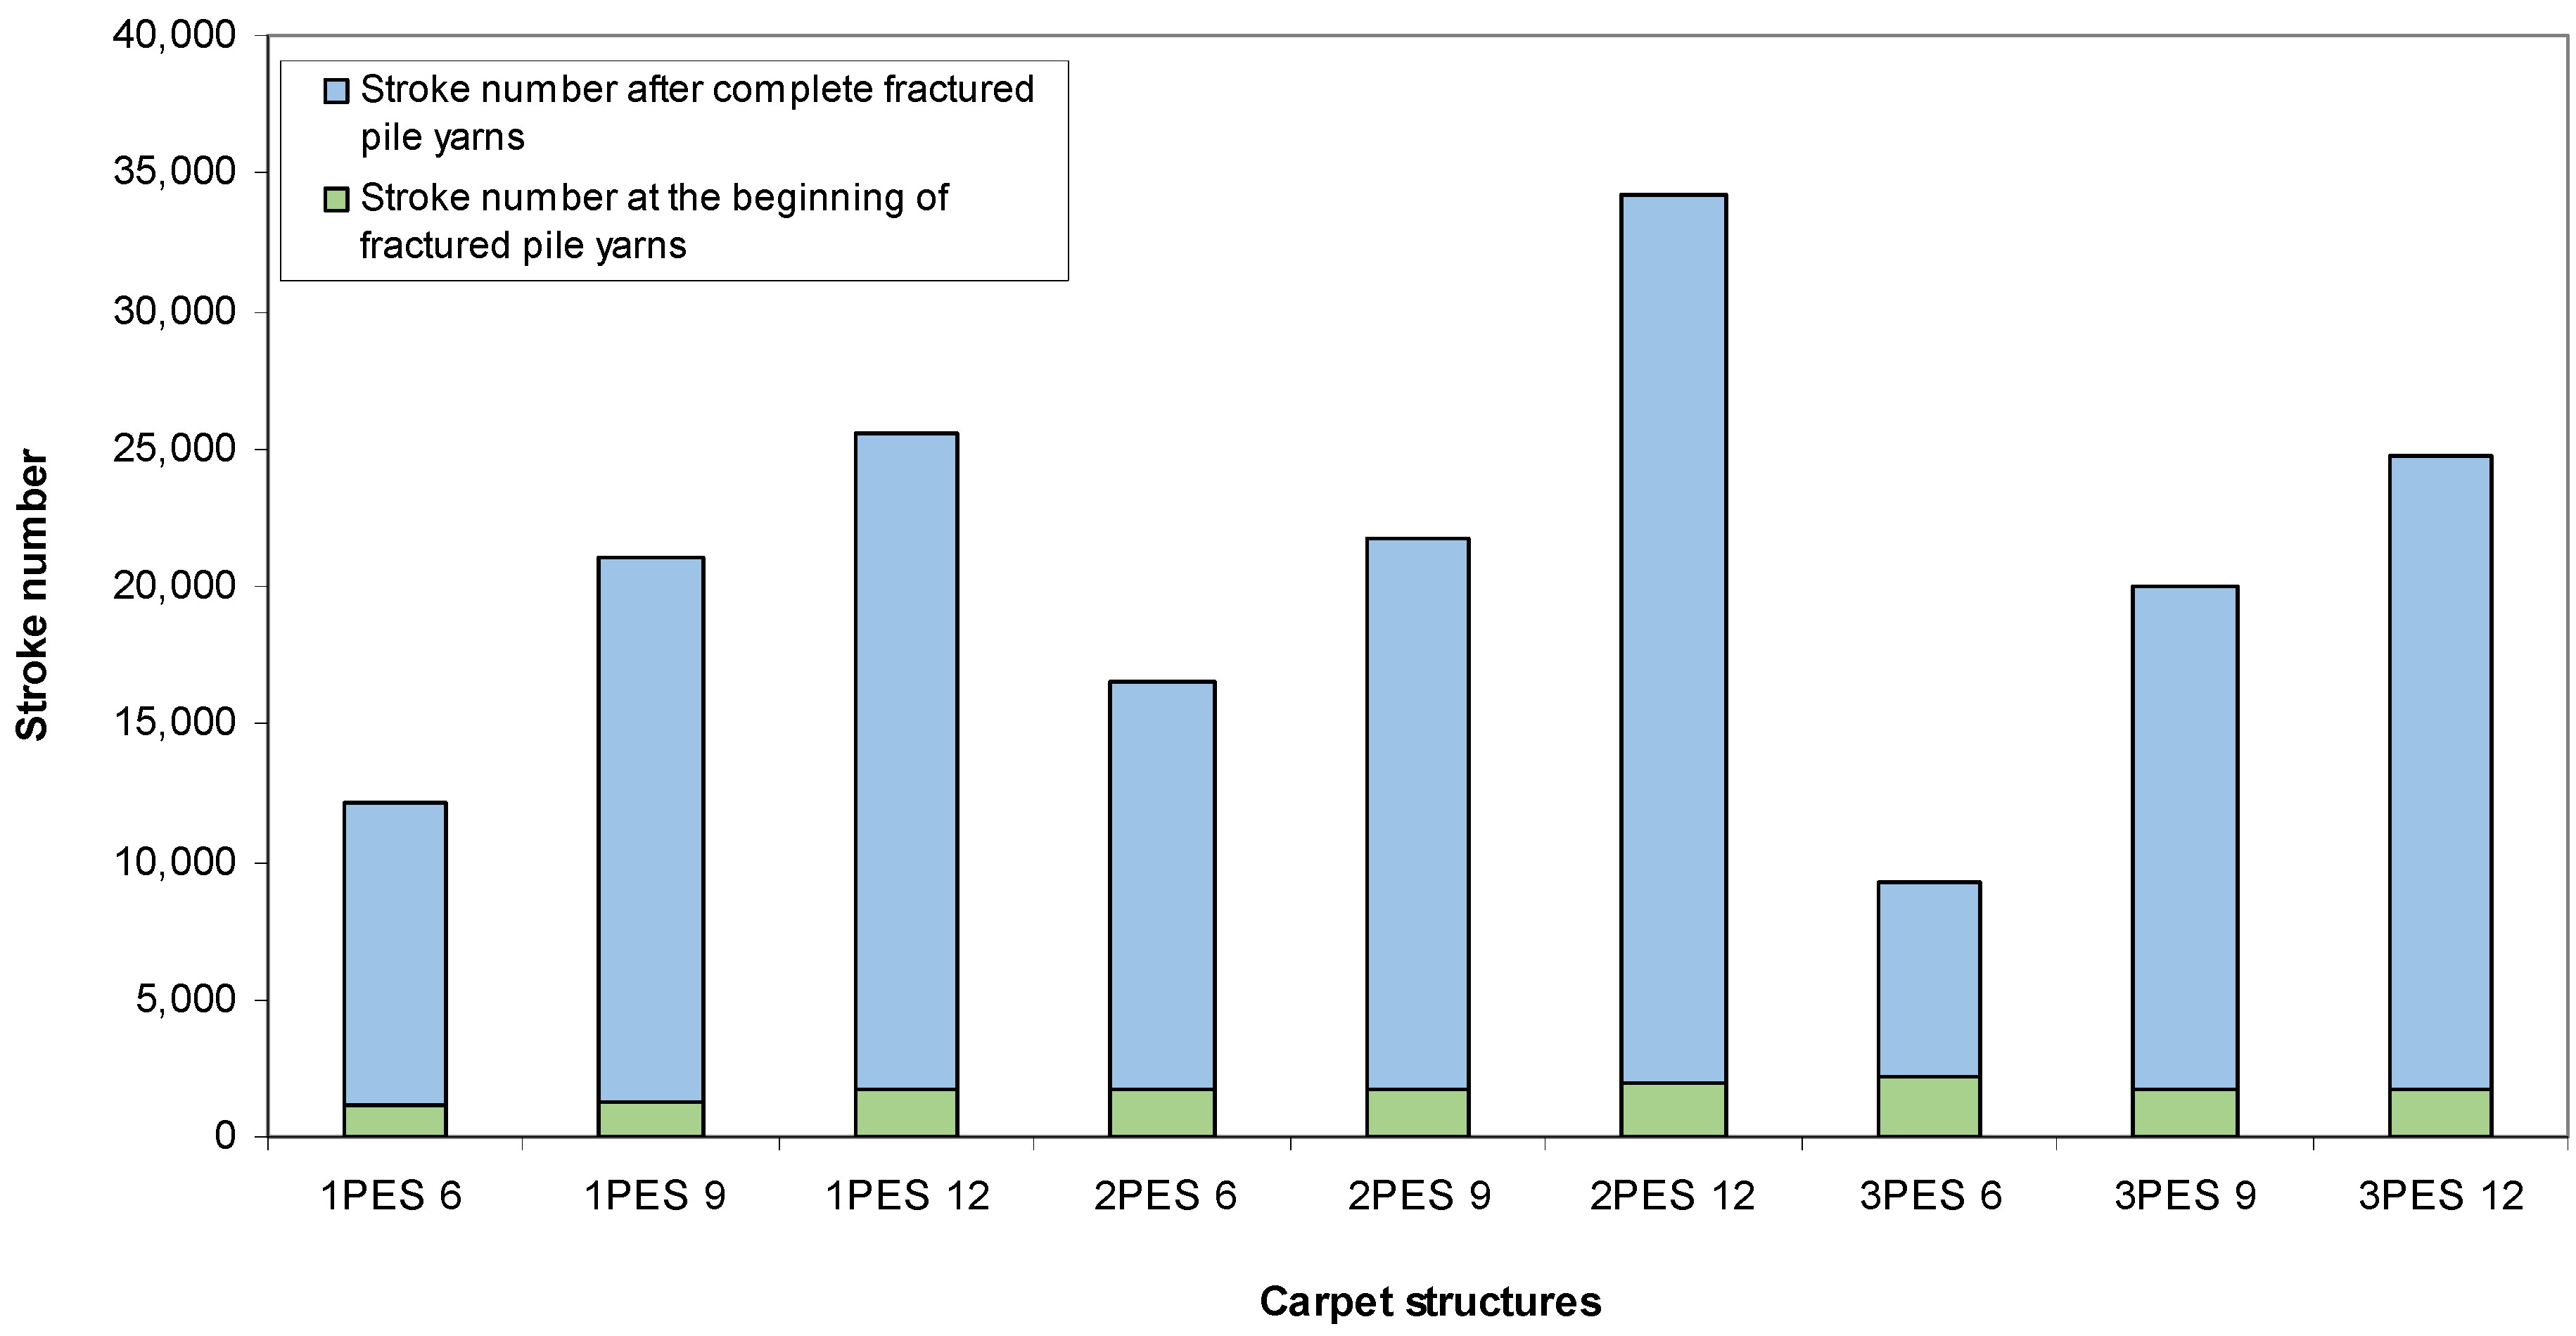
3.4. Token Rubbing Results

Token rubbing test results on carpet samples are presented in Table 7. Figure 13 exhibits token rubbing test results for various dry carpets. As shown in Table 7 and Figure 13, the number of strokes after the complete fracture of pile yarns increased as the pile heights for each pile density were increased. Comparable relationships were observed in both loose and dense carpet structures, with the exception of very dense carpet structures. Furthermore, it was discovered that the number of strokes after the complete fracture of pile yarns and the number of strokes at the onset of fractured pile yarns were proportional for almost all carpets.

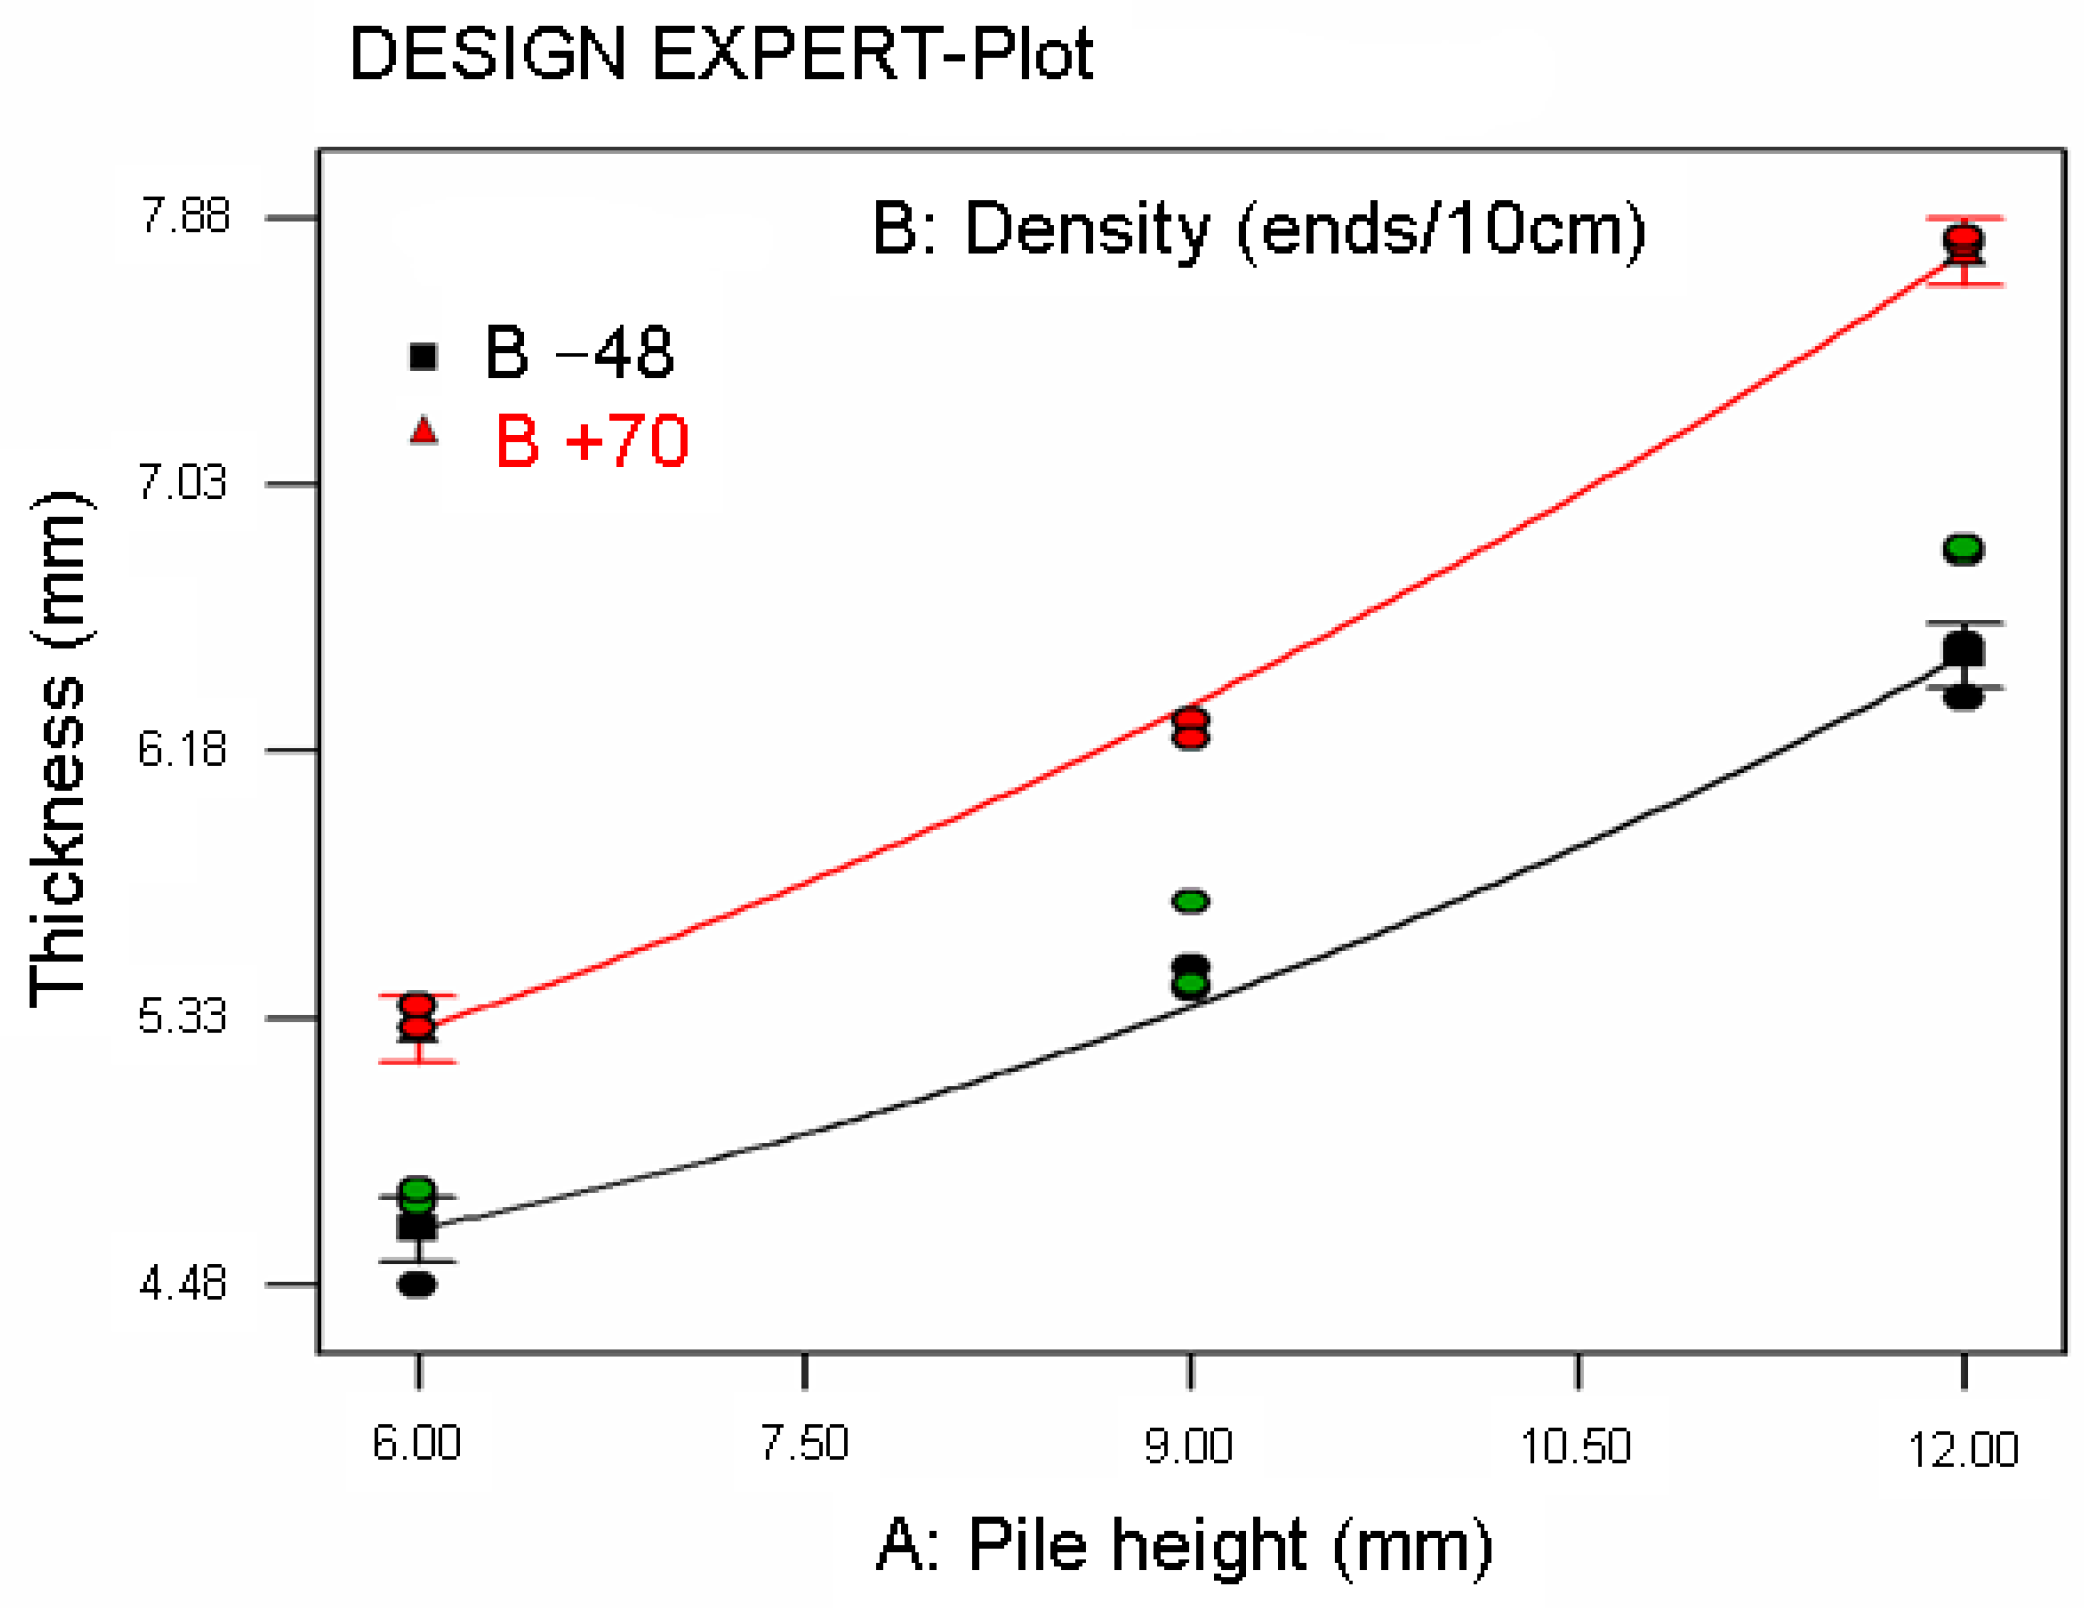
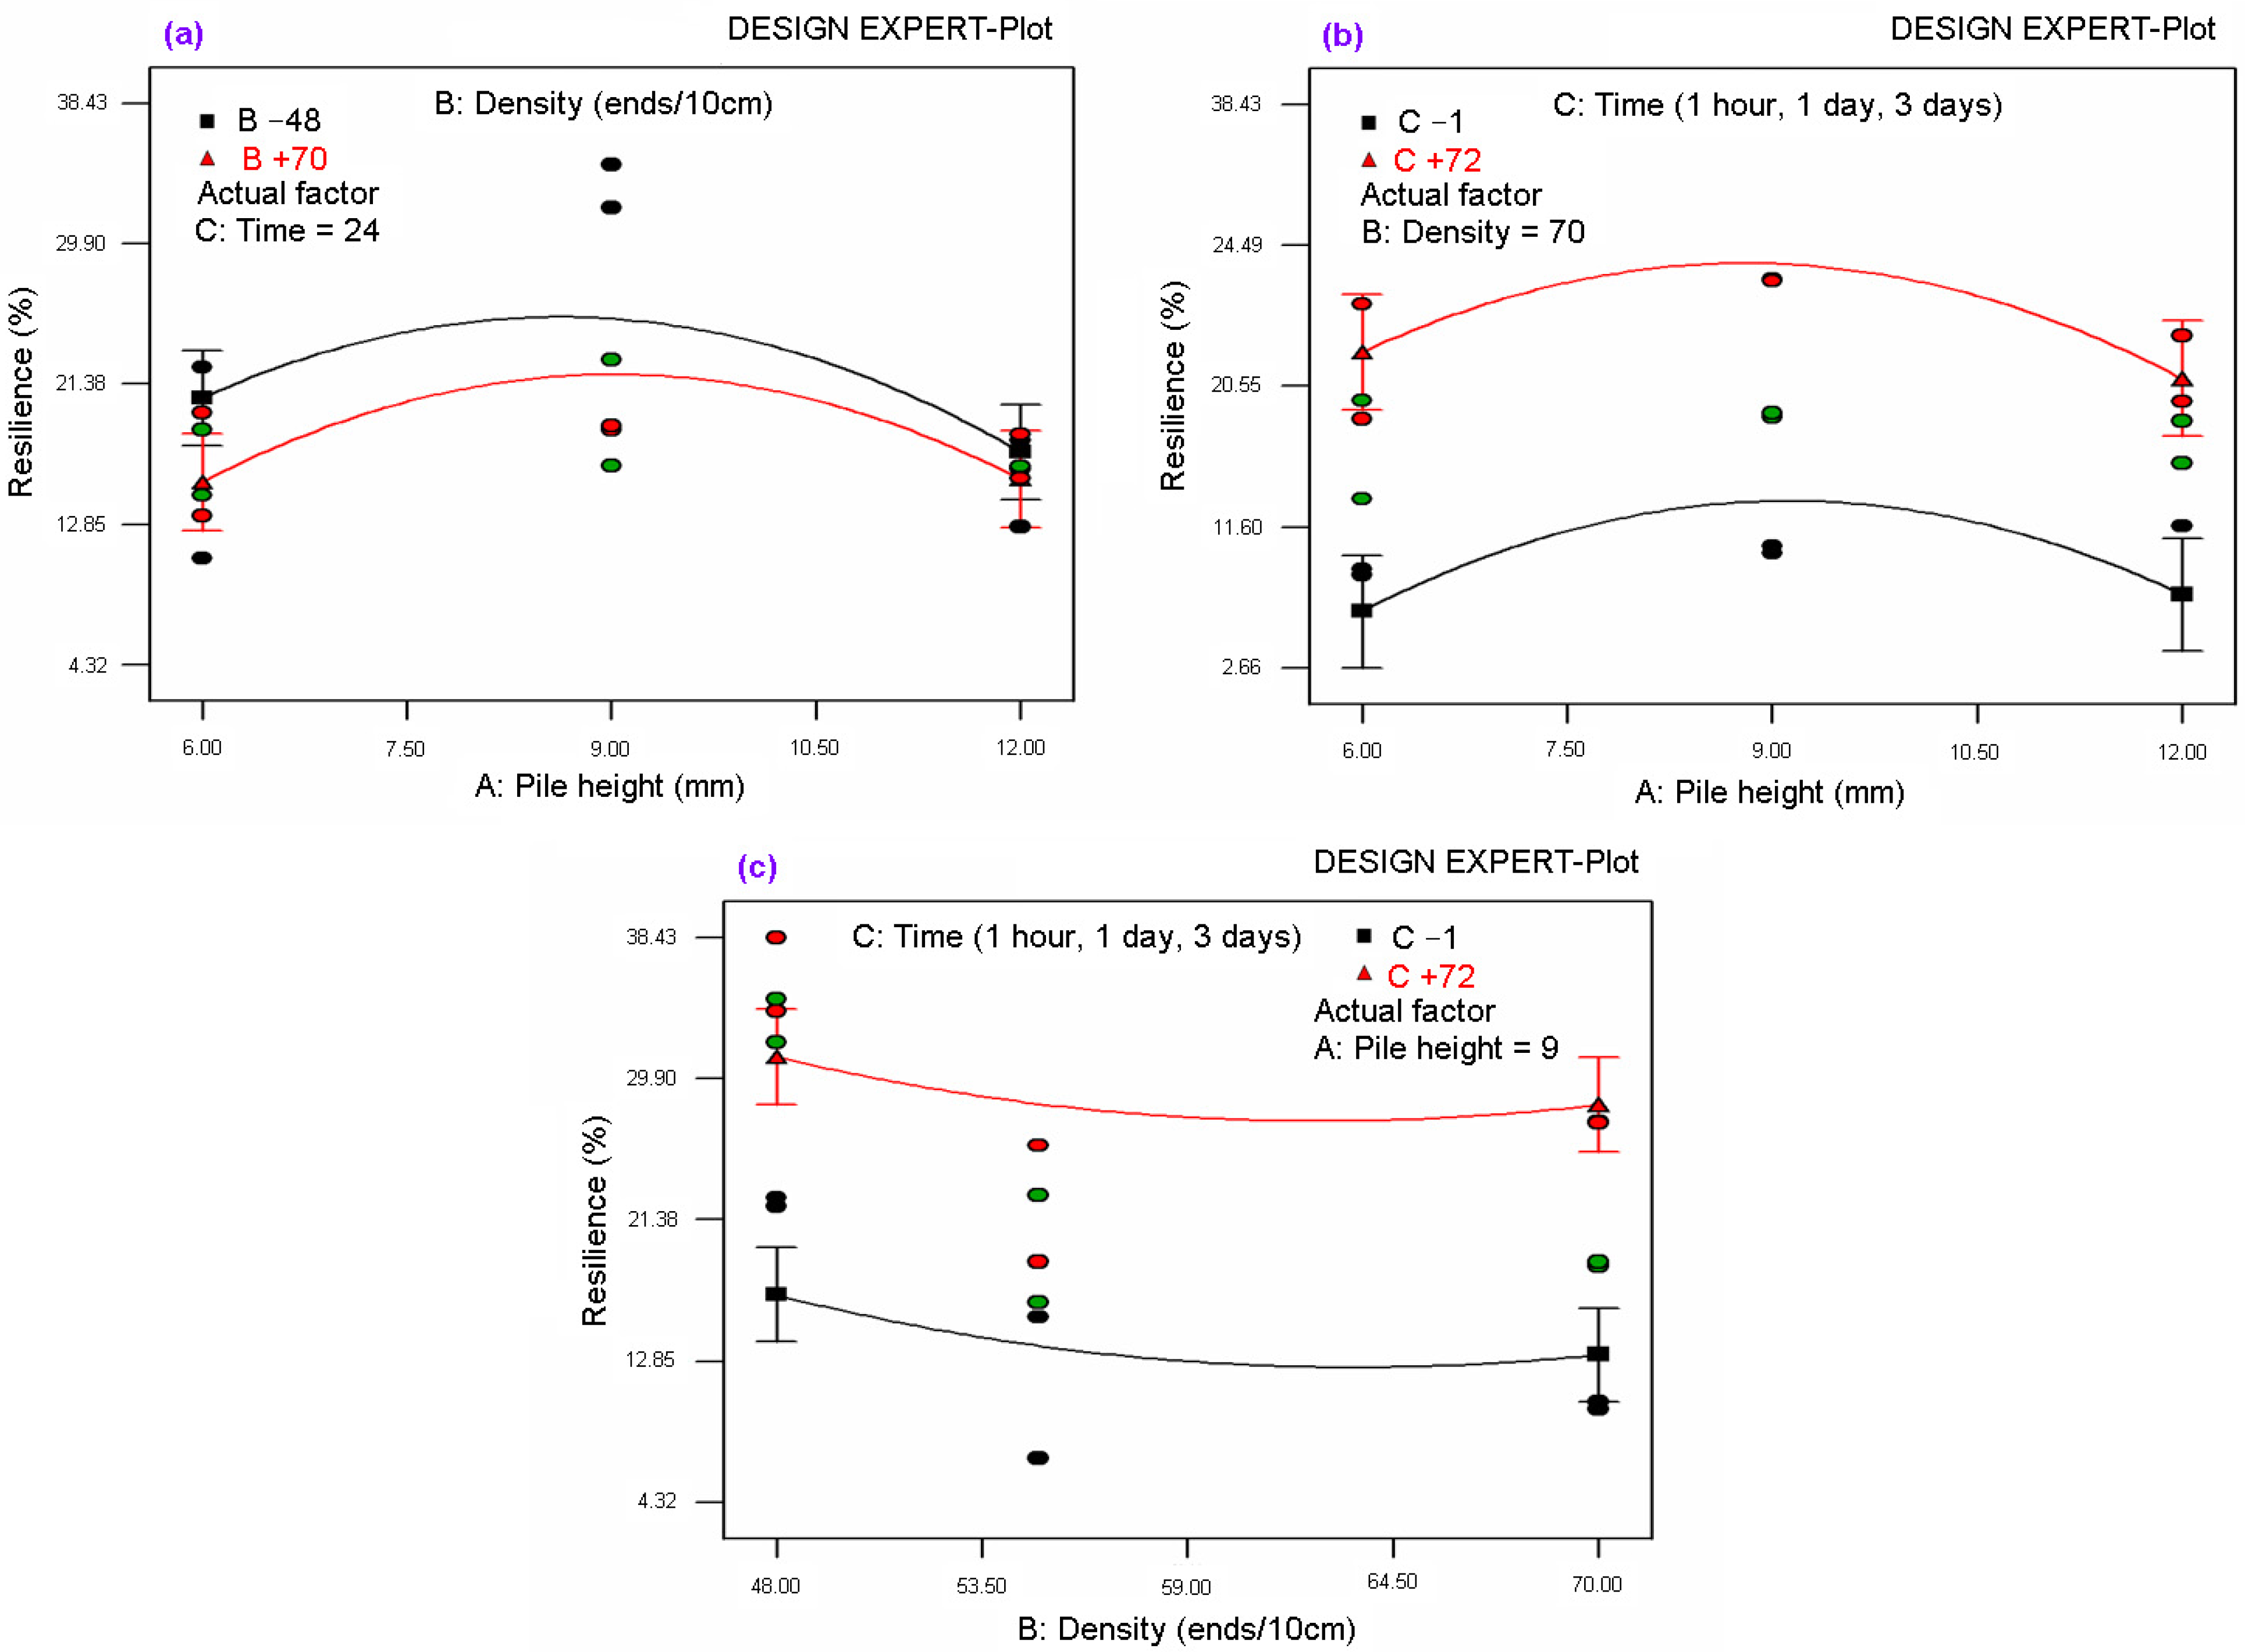
3.5. Statistical Modelling Results

A statistical model was applied to carpet thickness and resilience after some time period of static loading test data and abrasion thickness loss data generated from a Martindale test. The best models for carpet thickness and resilience and abrasion thickness loss were found using DESIGN EXPERT software [93]. Table 8 presents ANOVA for the models explaining carpet thickness, resilience, and abrasion thickness loss. Figure 14 illustrates the relationship between carpet thickness and pile height after a 3-day time period of static loading for various carpet pile densities. Figure 15a–c show the relationship between resilience and pile height after some time period of static loading for various carpet densities. Additionally, Figure 16 illustrates the relationship between carpet thickness loss and pile height after the abrasion test for various carpet densities.
As shown in Table 8 and Figure 14, the regression Equation (14) for carpet thickness (CT) was obtained from the ANOVA table where A is the pile height (mm), B is the density of the carpet (weft ends/10cm), and CT is the thickness of the carpet (mm) after 3 days of static loading. The coefficient of regression (R-squared) was 0.9919 and the mean absolute percent error was 1.28%. The general form of CT Equation (14) obeys the second-order polynomial function where pile height (A) is the main parameter before carpet density (B) of carpet thickness after static loading. The interaction graph of pile height and thickness after a 3-day time period of static loading was also fitted with the regression equations and exhibited in Figure 14.
CT = + 7 . 46638 0 . 34201 × A 0 . 10486 × B + 0 . 022778 × A 2 + 8 . 82395 E 004 × B 2 + 4 . 93843 E 003 × A × B
As shown in Table 8 and Figure 15a–c, the regression Equation (15) for carpet resilience (CR) was obtained from the ANOVA table where A is the pile height (mm), B is the density of the carpet (weft ends/10cm), C is the recovery period (2 min, 1 h, 1 day, and 3 days), and CR is the resilience of the carpet (mm) after static loading. The coefficient of regression (R-squared) was 0.7144 and the mean absolute percent error was 6.19%. The general form of CR Equation (15) obeys the second-order polynomial function where the recovery period (C) is the main parameter before pile height (A) of carpet resilience after static loading. The interaction graph of pile height, density, and resilience after various time periods of static loading was also fitted with the regression equations and illustrated in Figure 15a–c.
CR = + 42 . 22527 + 11 . 27528 × A 2 . 55068 × B + 0 . 49040 × C 0 . 71824 × A 2 + 0 . 018216 × B 2   3 . 46165 E - 003 × C 2 + 0 . 026250 × A × B 6 . 42826 E 003 × A × C + 4 . 65152 E 004 × B × C
As shown in Table 8 and Figure 16, the regression Equation (16) of carpet abrasion thickness loss (CTL) was obtained from the ANOVA table where A is the pile height (mm), B is the density of the carpet (weft ends/10cm), and CTL is the abrasion thickness loss of the carpet (mm) after Martindale abrasion testing. The coefficient of regression (R-squared) was 0.9199 and the mean absolute percent error was 21.71%. The general form of CTL Equation (16) obeys the second-order polynomial function where pile height (A) is the main parameter before carpet density (B) of carpet thickness after abrasion. The interaction graph of pile height and thickness loss on various densities after abrasion was also fitted with the regression equations and exhibited in Figure 16.
CTL = 10 . 57183 0 . 30387 × A + 0 . 38848   × B 3 . 76335 E 003 ×   B 2 + 9 . 56135 E 003 × A × B

4. Conclusions

It was found that the bending rigidity (mN.m) based on the technical fabric test increased from loose to very dense carpet structures, probably due to the large size of the carpet samples in that the size of the sample affects the bending stiffness. Further, the average dry bending rigidity of polyester carpet was over eight times higher than the average wet bending rigidity of the carpet. The bending curvature (cm) increased from loose to very dense carpet structures due to the increase in weft density and the size of the samples. In addition, downward concave small bending curvature was obtained from loose carpet, whereas downward concave large bending curvature was obtained from very dense carpet. In addition, the average dry bending curvature of polyester carpet was higher than the average wet bending curvature of the carpet due to the increase in wet carpet weight. It was concluded that bending through the technical fabric test can simplify the determination of heavy three-dimensional dry or impregnate polymeric preforms’ flexural properties.
The thickness loss (%) and resilience (%) for each recovery period from loose to very dense polyester carpets proportionally depended on the pile density. It generally decreased when the pile density increased due to compression of the load carrying capacity per knot, in which it was higher in carpets having dense knots compared to ones that had sparse knots per area. When the pile density increased, the carpet mass losses (%) of all carpets under abrasion load increased. At the same pile density, when the pile height increased, the carpet mass losses (%) of all carpet samples slightly increased. Additionally, after the number of strokes required to achieve completely fractured pile yarns in the rubbing test increased when the pile heights for each pile density increased.
For future studies, we will carry out more research on particular complex shape molding part manufacturing via generated load–displacement and stress–strain curves.

Author Contributions

Conceptualization, G.E. and K.B.; methodology, G.E. and K.B.; software, G.E.; validation, G.E. and K.B.; formal analysis, G.E. and K.B.; investigation, G.E. and S.Y.; resources, G.E. and S.Y.; data curation, G.E. and S.Y; writing original draft preparation, G.E.; writing—review and editing, K.B. and G.E.; visualization, G.E. and S.Y.; supervision, G.E. and K.B.; project administration, G.E.; funding acquisition, G.E. All authors have read and agreed to the published version of the manuscript.

Funding

This research received no specific grant from any funding agency in the public, commercial, or not-for-profit sectors.

Institutional Review Board Statement

Not applicable.

Data Availability Statement

Data are provided in the article.

Acknowledgments

This work was mainly supported by the Gumussuyu Halı Inc. subsidiary of Erciyes Anadolu Holding. The authors would like to thank them for their invaluable support. They also thank Huseyin Ozdemir for his help in the computing of some bending data.

Conflicts of Interest

The authors declare no potential conflicts with this article’s research, authorship, and publication.

References

  1. Chaudhuri, S.K.; Bandyopadyay, S. Structure and properties of carpet fibres and yarns. In Advances in Carpet Manufacture; Woodhead Publishing: Sawston, UK, 2017; pp. 19–43. [Google Scholar] [CrossRef]
  2. Gupta, S.K.; Goswami, K.K.; Majumdar, A. Durability of handmade wool carpets: A review. J. Nat. Fibers 2015, 12, 399–418. [Google Scholar] [CrossRef]
  3. Militki, J. Tensile failure of polyester fibers. In Handbook of Properties of Textile and Technical Fibres, 2nd ed.; The Textile Institute Book Series; Bunsell, A.R., Ed.; Woodhead Publishing: Sawston, UK, 2018; pp. 421–514. [Google Scholar] [CrossRef]
  4. Jaffe, M.; Easts, A.J.; Feng, X. Polyester fibers. In Thermal Analysis of Textiles and Fibers; Jaffe, M., Menczel, J.D., Eds.; Woodhead Publishing: Sawston, UK, 2020; pp. 133–149. [Google Scholar] [CrossRef]
  5. Rwei, S.P.; Lin, Y.T.; Su, Y.Y. Study of self-crimp polyester fibers. Polym. Eng. Sci. 2005, 45, 838–845. [Google Scholar] [CrossRef]
  6. Hsieh, Y.-L. Surface Characteristics of Fibers and Textiles; Pastore, C.M., Kiekens, P., Eds.; CRC Press: Boca Raton, FL, USA; Taylor & Francis Group: Abingdon, UK, 2018; pp. 34–55. [Google Scholar] [CrossRef]
  7. Tufail, M.R.; Jamshaid, H.; Mishra, R.; Hussain, U.; Tichy, M.; Muller, M. Characterization of hybrid composites with polyester waste fibers, olive root fibers and coir pith micro-particles using mixture design analysis for structural applications. Polymers 2021, 13, 2291. [Google Scholar] [CrossRef] [PubMed]
  8. East, A.J. The structure of polyester fibers. In Handbook of Textile Fiber Structure; Fundamentals and Manufactured Polymer Fibers; Eichhorn, S.J., Hearle, J.W.S., Jaffe, M., Kikutani, T., Eds.; Woodhead Publishing: Sawston, UK; CRC Press LLC: Cambridge, UK, 2009; Volume 1, pp. 81–225. [Google Scholar]
  9. Mandell, J.F.; Steckel, M.G.; Chung, S.S.; Kenney, M.C. Fatigue and environmental resistance of polyester and nylon fibers. Polym. Eng. Sci. 1987, 27, 1121–1127. [Google Scholar] [CrossRef]
  10. Karaca, E.; Ozcelik, F. Influence of the cross-sectional shape on the structure and properties of polyester fibers. J. Appl. Polym. Sci. 2007, 103, 2615–2621. [Google Scholar] [CrossRef]
  11. Mendelson, C. Home Comforts: The Art and Science of Keeping House; Simon and Schuster: New York, NY, USA, 2005; p. 896. [Google Scholar]
  12. Kale, P.D.; Lokhande, H.T. Grafting on polyester fibers. J. Appl. Polym. Sci. 1975, 19, 461–480. [Google Scholar] [CrossRef]
  13. Presley, A.B. Evaluation of carpet appearance loss: Structural factors. Text. Res. J. 1997, 67, 174–180. [Google Scholar] [CrossRef]
  14. Wang, J.; Wood, E.J. A new method for measuring carpet texture change. Text. Res. J. 1994, 64, 215–224. [Google Scholar] [CrossRef]
  15. Wilding, M.A.; Lomas, B.; Woodhouse, A.K. Changes due to wear in tufted pile carpets. Text. Res. J. 1990, 60, 627–640. [Google Scholar] [CrossRef]
  16. Xu, B. Quantifying surface roughness of carpets by fractal dimension. Cloth. Text. Res. J. 1997, 15, 155–161. [Google Scholar] [CrossRef]
  17. Postle, R.; Carnaby, G.A.; de-Jong, S. The Mechanics of Wool Structures; John Wiley: New York, NY, USA, 1988. [Google Scholar]
  18. Beil, N.B.; Roberts, W.W. Modeling and computer simulation of the compressional behavior of fiber assemblies: Part 1: Comparison to van wyk’s theory. Text. Res. J. 2002, 72, 341–351. [Google Scholar] [CrossRef]
  19. Vangheluwe, L.; Kiekens, P. Resilience properties of polypropylene carpets. Text. Res. J. 1997, 67, 671–676. [Google Scholar] [CrossRef]
  20. Laughlin, K.C.; Cusick, G.E. Carpet performance evaluation, Part II: Stress-strain behavior. Text. Res. J. 1968, 38, 72–80. [Google Scholar] [CrossRef]
  21. Wood, E.J. Description and measurement of carpet appearance. Text. Res. J. 1993, 63, 580–594. [Google Scholar] [CrossRef]
  22. Savilla, B.P. Physical Testing of Textiles; The Textile Institute: Manchester, UK; Woodhead Publishing: Sawston, UK, 1999. [Google Scholar]
  23. Goswami, K.K. Advances in Carpet Manufacture; Elseviere Ltd.: Cambridge, MA, USA, 2018; p. 323. [Google Scholar]
  24. Wu, J.; Pan, N.; Williams, K.R. Mechanical, biomechanical and psychophysical study of carpet performance. Text. Res. J. 2007, 77, 172–178. [Google Scholar] [CrossRef]
  25. McNeil, S.J.; Tapp, L.S. The design and initial evaluation of visual cues in carpets to assist walking. J. Text. Inst. 2016, 107, 376–385. [Google Scholar] [CrossRef]
  26. Kucuk, M.; Korkmaz, Y. Sound absorption properties of acrylic carpets. J. Text. Inst. 2017, 108, 1398–1405. [Google Scholar] [CrossRef]
  27. Kucuk, M.; Korkmaz, Y. Acoustic and thermal properties of polypropylene carpets: Effect of pile length and loop density. Fibers Polym. 2019, 20, 1519–1525. [Google Scholar] [CrossRef]
  28. Grosberg, P. The mechanical properties of woven fabrics part II: The bending of woven fabrics. Text. Res. J. 1966, 36, 205–214. [Google Scholar] [CrossRef]
  29. Abbott, N.J. Part II: A study of the peirce cantilever test for stiffness of textile fabrics. Text. Res. J. 1951, 21, 441–444. [Google Scholar] [CrossRef]
  30. Skelton, J. The bending behavior of fabrics at high curvatures. Text. Res. J. 1971, 41, 174–181. [Google Scholar] [CrossRef]
  31. Gibson, V.L.; Postle, R. An analysis of the bending and shear properties of woven, double-knitted and warp-knitted outerwear fabrics. Text. Res. J. 1978, 48, 14–27. [Google Scholar] [CrossRef]
  32. Matsuo, T. Bending of woven fabrics. J. Text. Mach. Soc. Jpn. 1969, 15, 19–33. [Google Scholar] [CrossRef] [Green Version]
  33. Cooper, D.N.E. The stiffness of woven textiles. J. Text. Inst. 1960, 51, P547. [Google Scholar] [CrossRef]
  34. Ghosh, T.K.; Batra, S.K.; Barker, R.L. The bending behaviour of plain-woven fabrics part I: A critical review. J. Text. Inst. 1990, 81, 245–254. [Google Scholar] [CrossRef]
  35. Hu, J. Structure and Mechanics of Woven Fabrics; Woodhead Publishing Ltd.: Cambridge, UK, 2004. [Google Scholar]
  36. Park, J.-W.; Oh, A.-G. Bending rigidity of yarns. Text. Res. J. 2006, 76, 478–485. [Google Scholar] [CrossRef]
  37. Bilisik, K. Bending behavior of multilayered and multidirectional stitched aramid woven fabric structures. Text. Res. J. 2011, 81, 1748–1761. [Google Scholar] [CrossRef]
  38. Dolatabadi, M.K.; Montazer, M.; Latifi, M. The effect of polyester fibres on quality of hand-knotted carpets. J. Text. Inst. 2005, 96, 1–9. [Google Scholar] [CrossRef]
  39. Yu, W.; Du, Z. Determination of the bending characteristic parameters of the bending evaluation system of fabric and yarn. Text. Res. J. 2006, 76, 702–711. [Google Scholar] [CrossRef]
  40. Timoshenko, S.P.; Gere, J.M. Theory of Elastic Stability; McGraw-Hill: New York, NY, USA, 1961. [Google Scholar]
  41. Plaut, R.H. Formulas to determine fabric bending rigidity from simple tests. Text. Res. J. 2015, 85, 884–894. [Google Scholar] [CrossRef]
  42. Kimura, K.; Kawabata, S.; Kawai, H. Compressive deformation theory of carpets. J. Text. Mach. Soc. Jpn. 1970, 23, T67–T76. [Google Scholar] [CrossRef]
  43. Kimura, K.; Kawabata, S. Improvement of the compressive deformation theory of carpets and its application to the carpet woven from compressible yarn. J. Text. Mach. Soc. Jpn. 1971, 24, T207–T214. [Google Scholar]
  44. Celik, N.; Koc, E. An experimental study on thickness loss of wilton type carpets produced with different pile materials after prolonged heavy static loading. part 2: Energy absorption and hysteresis effect. Fibres Text. East. Eur. 2007, 15, 87–92. [Google Scholar]
  45. Celik, N.; Koc, E. Study on the thickness loss of wilton-type carpets under dynamic loading. Fibres Text. East. Eur. 2010, 18, 54–59. [Google Scholar]
  46. Koc, E.; Celik, N.; Tekin, M. An experimental study on thickness loss of wilton-type carpets produced with different pile materials after prolonged heavy static loading. part-I: Characteristic parameters and carpet behaviour. Fibres Text. East. Eur. 2005, 13, 56–62. [Google Scholar]
  47. Dubinskaite, K.; Langenhove, L.V.; Milasius, R. Influence of pile height and density on the end-use properties of carpets. Fibres Text. East. Eur. 2008, 16, 68. [Google Scholar]
  48. Javidpanah, M.; Najar, S.S.; Dayiary, M. Study on thickness loss of cut-pile carpet produced with heat process-modified polyester pile yarn. Part I: Static loading. J. Text. Inst. 2014, 105, 1265–1271. [Google Scholar] [CrossRef]
  49. Javidpanah, M.; Najar, S.S.; Dayiary, M. Study on thickness loss of cut-pile carpet produced with heat process modified polyester pile yarn. Part II: Dynamic loading. J. Text. Inst. 2015, 106, 236–241. [Google Scholar] [CrossRef]
  50. Sarıoğlu, E.; Kaynak, H.K.; Çelik, H.İ.; Vuruşkan, D. Effects of structural parameters on compressibility and soiling properties of machine woven carpets. J. Text. Inst. 2019, 110, 1263–1270. [Google Scholar] [CrossRef]
  51. Tabatabaei, S.M.; Ghane, M. Effect of traffic exposure on toughness characteristics of hand-knotted carpets. Fibres Text. East. Eur. 2015, 23, 64–68. [Google Scholar] [CrossRef] [Green Version]
  52. Jafari, S.; Ghane, M.; Moezzi, M. The effect of UV degradation on the recovery behavior of cut-pile carpets after static loading. J. Text. Inst. 2017, 108, 256–259. [Google Scholar] [CrossRef]
  53. Liu, H.; Tandon, S.K.; Wood, E.J. Probability fracture mechanics of wear in wool carpet, Part I: Wear model of cut pile carpet. Text. Res. J. 2002, 72, 954–958. [Google Scholar] [CrossRef]
  54. Liu, H.; Tandon, S.K.; Wood, E.J. Part II: Wear model of loop pile carpet. Text. Res. J. 2002, 72, 958–962. [Google Scholar] [CrossRef]
  55. Hearle, J.W.S.; Liu, H.; Tandon, S.K.; Wood, E.J. Computational model of wool carpet wear. J. Text. Inst. 2005, 96, 137–142. [Google Scholar] [CrossRef]
  56. Carnaby, G.A. The mechanics of carpet wear. Text. Res. J. 1981, 51, 514–519. [Google Scholar] [CrossRef]
  57. Carnaby, G.A.; Wood, E.J. The physics of carpets. J. Text. Inst. 1989, 80, 71–90. [Google Scholar] [CrossRef]
  58. Hearle, J.W.S.; Lomas, B.; Goodman, P.J.; Camaby, G.A. Microscopic Examination of Worn Carpets, Part I: Comparison of the Modes of Fibre Failure in Floor Trials; WRONZ Communication C79; Wool Research Organisation of New Zealand: Christchurch, New Zealand, 1983. [Google Scholar]
  59. Hearle, J.W.S.; Mukhopadyay, S.K.; Sengonul, A. A Study of Fatigue Types and Distribution in a Controlled Damaged Wool Carpet, Part I: Straight-Walk Worn Carpet; WRONZ Report R212; Wool Research Organisation of New Zealand: Christchurch, New Zealand, 1997. [Google Scholar]
  60. Dayiary, M. Study on compressional energy contribution into total energy of pile deformation in cut-pile carpet. J. Text. Inst. 2015, 106, 1315–1321. [Google Scholar] [CrossRef]
  61. Dayiary, M.; Najar, S.S.; Shamsi, M. An experimental verification of cut-pile carpet compression behaviour. J. Text. Inst. 2010, 101, 488–494. [Google Scholar] [CrossRef]
  62. Hersh, S.P.; El-Shiekh, A. Energy consideration in the recovery of carpets. J. Text. Inst. 1972, 63, 660–663. [Google Scholar]
  63. Dayiary, M.; Najar, S.S.; Shamsi, M. A new theoretical approach to cut-pile carpet compression based on elastic-stored bending energy. J. Text. Inst. 2009, 100, 688–694. [Google Scholar] [CrossRef]
  64. Jafari, S.; Ghane, M. An analytical approach for the recovery behavior of cut pile carpet after static loading by mechanical models. Fibers Polym. 2016, 17, 651–655. [Google Scholar] [CrossRef]
  65. Khavari, S.; Ghane, M. An analytical approach for the compression and recovery behavior of cut pile carpets under constant rate of compression by mechanical models. Fibers Polym. 2017, 18, 190–195. [Google Scholar] [CrossRef]
  66. Mehta, P.V. An Introduction to Quality Control for the Apparel Industry; ASQC Quality Press: Milwaukee, WI, USA, 1992. [Google Scholar]
  67. Collier, B.J.; Epps, H.H. Textile Testing and Analysis; Prentice Hall Publishing: Englewood Cliffs, NJ, USA, 1999; Volume 7, p. 374. [Google Scholar]
  68. Manich, A.M.; Castellar, M.D.D.; Sauri, R.M.; Miguel, R.A.; Barella, A. Abrasion kinetics of wool and blended fabric. Text. Res. J. 2001, 71, 469–474. [Google Scholar] [CrossRef]
  69. Ozdil, N.; Kayseri, G.O.; Menguc, G.S. Analysis of abrasion characteristics in textiles. In Abrasion Resistance of Materials; Adamiak, M., Ed.; IntechOpen: London, UK, 2012; pp. 119–146. [Google Scholar] [CrossRef] [Green Version]
  70. Onder, E.; Berkalp, O.B. Effects of different structural parameters on carpet physical properties. Text. Res. J. 2001, 71, 549–555. [Google Scholar] [CrossRef]
  71. Bilisik, K.; Yolacan, G. Abrasion propertiesof upholstery flocked fabrics. Text. Res. J. 2009, 79, 1625–1632. [Google Scholar] [CrossRef]
  72. Gupta, N.P.; Shakyawar, D.B.; Sinha, R.D. Influence of fibre diameter and medullation on woollen spun yarns and their products. Indian J. Fibre Text. Res. 1998, 23, 32–37. [Google Scholar]
  73. Bilisik, K.; Turhan, Y.; Demiryurek, O. Tearing properties of upholstery flocked fabrics. Text. Res. J. 2011, 81, 290–300. [Google Scholar] [CrossRef]
  74. Bilisik, K.; Turhan, Y.; Demiryurek, O. Analysis and tensile characterization of flocked fabric after rubbing. J. Text. Inst. 2011, 102, 808–822. [Google Scholar] [CrossRef]
  75. Zhou, C.E.; Zhang, Q.; Kan, C.W. Some properties of a thickener for preparing inkjet printing ink for nylon carpet. Color. Technol. 2017, 133, 116–121. [Google Scholar] [CrossRef]
  76. Vandewiele, N.V. Carpet Weaving: Face-to-Face Carpet Weaving. Available online: http://www.vandewiele.be/carpetlooms.htm (accessed on 1 January 2022).
  77. ISO 4604; Textiles Glass–Woven Fabrics–Determination of Conventional Flexural Stiffness–Fixed Angle Flexometer Method. International Organization for Standardization: Geneva, Switzerland, 1978.
  78. Peirce, F.T. The handle of cloth as a measurable quantity. J. Text. Inst. 1937, 21, 377–416. [Google Scholar] [CrossRef]
  79. Peirce, F.T. The geometry of cloth structure. J. Text. Inst. 1937, 28, 45–96. [Google Scholar] [CrossRef]
  80. BS 3356; Method for Determination of Bending Length and Flexural Rigidity of Fabrics. British Standards Institution: London, UK, 1990.
  81. TS 1409; Method for Determination of Flexural Rigidity of Woven Fabrics. Turkish Standards Institution: Ankara, Turkey, 1974.
  82. Bilisik, K.; Yolacan, G. Experimental determination of bending behavior of multilayered and multidirectionally-stitched E-glass fabric structures for composites. Text. Res. J. 2012, 82, 1038–1049. [Google Scholar] [CrossRef]
  83. Matlab, R. MATLAB R2016a; The MathWorks Inc.: Natick, MA, USA, 2016. [Google Scholar]
  84. BS 4939; Method for Determination of Thickness Loss of Textile Floor Coverings after Prolonged Heavy Static Loading. British Standards Institution: London, UK, 2007.
  85. ISO 3416; Textile Floor Coverings; Determination of Thickness Loss after Prolonged Heavy Static Loading. International Organization for Standardization: Geneva, Switzerland, 1986.
  86. ISO 12947-3; Determination of the Abrasion Resistance of Fabrics by the Martindale Method Part 3: Determination of Mass Loss. International Organization for Standardization: Geneva, Switzerland, 1998.
  87. BS 2543; Upholstery Fabrics for End Use Applications. British Standards Institution: London, UK, 2004.
  88. TS 251 (ISO 3801:1977); Determination of Mass per Unit Length and Mass per Unit Area of Woven Fabrics. International Organization for Standardization: Geneva, Switzerland, 1991.
  89. TS 7125 (ISO 1766); Textile Floor Coverings-Determination of Thickness of Pile above the Substrate. International Organization for Standardization: Geneva, Switzerland, 2003.
  90. TS 3374 (ISO 1765); Machine Made Textile Floor Coverings-Determination of Thickness. International Organization for Standardization: Geneva, Switzerland, 1991.
  91. ISO 139; Textiles-Standard Atmospheres for Conditioning and Testing. International Organization for Standardization: Geneva, Switzerland, 2005.
  92. Hearle, J.W.S.; Grosberg, P.; Backer, S. Structural Mechanics of Fibres, Yarn and Fabrics; Wiley Interscience, Inc.: New York, NY, USA, 1969. [Google Scholar]
  93. State-Ease, Inc. Design Expert 6.0.1; State-Ease, Inc.: Minneapolis, MN, USA, 1985. [Google Scholar]
Figure 1. Schematic views of carpet structures. (a) The 2/2 V weave design: (1) weft, (2) warp (interlace or chain), (3) warp (stuffer), (4–8) pile yarns [76]. (b) The 1 + 2/3 V weave design: (1) weft, (2) warp (interlace or chain), (3) warp (stuffer), (4–8) pile yarns [76].
Polymers 15 03006 g001
Figure 2. (a) Bending rigidity instrument during testing of carpet structure in warp direction, (b) schematic view of bending rigidity instrument, and (c) bending curvature obtained from digital camera during testing.
Polymers 15 03006 g002
Figure 3. (a) Static loading instrument during testing of carpet structure, (b) schematic view of static loading instrument with carpet sample, (c) image of deformed loose carpet long pile (IPES12), (d) image of deformed dense carpet long pile (2PES12), and (e) image of deformed very dense carpet long pile (3PES12) structure samples (digital photos).
Polymers 15 03006 g003
Figure 4. Recovery period and thickness relations after static loading on carpet samples.
Polymers 15 03006 g004
Figure 5. (a) Martindale abrasion instrument during testing of carpet structure, (b) image of abraded loose carpet long pile (IPES12), (c) image of abraded dense carpet long pile (2PES12), and (d) image of abraded very dense carpet long pile (3PES12) structure samples (digital photos).
Polymers 15 03006 g005
Figure 6. Crockmeter with metal token holder during rubbing test on carpet sample. (a) Front view, (b) complete view of instrument, (c) image of fractured loose carpet long pile (IPES12), (d) image of fractured dense carpet long pile (2PES12), and (e) image of fractured very dense carpet long pile (3PES12) structure samples (digital photos).
Polymers 15 03006 g006
Figure 7. Flexural results on dry and wet forms of carpet samples. (a,c) Dry carpet samples for apparel and technical fabric methods, respectively, and (b,d) wet carpet samples for apparel and technical fabric methods, respectively.
Polymers 15 03006 g007
Figure 8. Bending curvature results on carpet depending on apparel fabric and technical fabric bending test principles. (a,e) Various densities of dry carpets (medium pile height), (b,f) various densities of wet carpets (medium pile height), (c,g) dense dry carpets (various pile height), and (d,h) dense wet carpet samples (various pile height).
Polymers 15 03006 g008
Figure 9. Various recovery period and thickness and thickness loss relations after static loading on the dry carpets. (a) Loose dry carpet (various pile height), (b) dense dry carpet (various pile height), (c) very dense dry carpet (various pile height), and (d) various densities and pile heights of dry carpet samples.
Polymers 15 03006 g009
Figure 10. Various recovery period and resilience relations after static loading on the dry carpets. (a) loose dry carpet (various pile height), (b) dense dry carpet (various pile height), (c) very dense dry carpet (various pile height), (d) various densities and pile heights of dry carpet samples.
Polymers 15 03006 g010
Figure 11. Various abrasion cycles and pile mass loss (%) relations after a Martindale abrasion test on dry carpets. (a) Mass loss (%) of loose carpets (various pile height), (b) mass loss (%) of dense carpets (various pile height), and (c) mass loss (%) of very dense carpets (various pile height).
Polymers 15 03006 g011
Figure 12. Abrasion cycle (50,000) and carpet thickness loss (mm, %) relations after a Martindale abrasion test on dry carpet samples.
Polymers 15 03006 g012
Figure 13. Token rubbing test results for various dry carpets.
Polymers 15 03006 g013
Figure 14. Relationship between carpet thickness and pile height after 3-day time period of static loading for various carpet densities.
Polymers 15 03006 g014
Figure 15. (a) Relationship between resilience and pile height after 1-day time period of static loading for various carpet densities; (b) relationship between resilience and pile height after 1 h, 1-day, and 3-day time period of static loading for very dense carpet; and (c) relationship between resilience and carpet density after 1 h, 1-day, and 3-day time period of static loading for medium pile height.
Polymers 15 03006 g015
Figure 16. Relationship between carpet thickness loss and pile height after abrasion test for various carpet densities.
Polymers 15 03006 g016
Table 1. Fiber, yarn, and substrate properties of polyester carpet structure.
SampleSample CodesYarn Linear Density (Tex)Yarn Composition (%)Density
(Ends/10 cm)
Substrate Weight
(Warp + Weft)
(g/m2)
WarpWeftWarpWeftWarpWeft
StufferChain StufferChain
Polymers 15 03006 i0011PES6
1PES9
1PES12
21111855680% Pes/20% Co80% Pes/20% CoJute4848843
Polymers 15 03006 i0022PES6
2PES9
2PES12
21111855680% Pes/20% Co80% Pes/20% CoJute4855925
Polymers 15 03006 i0033PES6
3PES9
3PES12
21111855680% Pes/20% Co80% Pes/20% CoJute4870896
Table 2. Pile yarn and carpet structure properties.
Sample CodesPileCarpet
Fiber TypeYarn Linear Density
(Tex)
Substrate Thickness
(mm)
Pile Height
(mm)
Pile Density
(Knots/m2)
Pile Weight
(g/m2)
Carpet Thickness
(mm)
Carpet
Weight
(g/m2)
1PES6Polyester1652.576 (3.34)230,4009545.911797 (1890)
1PES9Polyester1652.629 (4.21)230,40012236.822066 (2142)
1PES12Polyester1652.5912 (5.88)230,40014538.472297 (2219)
2PES6Polyester1652.636 (3.36)264,00010495.991974 (2098)
2PES9Polyester1652.599 (4.83)264,00013577.422282 (2121)
2PES12Polyester1652.6512 (5.88)264,00016218.532546 (2650)
3PES6Polyester1653.056 (3.54)336,00012536.582149 (2343)
3PES9Polyester1653.169 (4.46)336,00016457.612541 (2477)
3PES12Polyester1653.1912 (6.46)336,00019819.652877 (2875)
Table 3. Flexural results of dry and wet form of polyester carpets.
Bending for Apparel Fabric
SampleDryWet
Length of Overhang
l (cm)
Bending Rigidity
G1 (mg.cm)
Length of Overhang
l (cm)
Bending Rigidity
G1 (mg.cm)
1PES6-G1 14.50 ± 0.0872,028.90 ± 1216.738.48 ± 0.1914,397.10 ± 946.09
1PES9-G114.53 ± 0.1782,075.36 ± 2881.668.38 ± 0.3415,786.35 ± 1873.15
1PES12-G112.28 ± 0.3651,400.23 ± 4449.877.83 ± 0.2513,320.29 ± 1263.42
2PES6-G113.43 ± 0.7863,929.32 ± 10,601.427.93 ± 0.3813,119.76 ± 1869.14
2PES9-G114.48 ± 0.2180,446.04 ± 3440.738.20 ± 0.3414,672.87 ± 1732.53
2PES12-G110.90 ± 1.4244,462.45 ± 14,881.997.23 ± 0.3112,544.26 ± 1568.66
3PES6-G110.33 ± 1.8534,524.16 ± 16,745.186.90 ± 0.509735.21 ± 2186.97
3PES9-G110.73 ± 0.5138,387.64 ± 5379.776.45 ± 0.198324.76 ± 730.94
3PES12-G19.38 ± 2.3933,774.07 ± 20,862.795.68 ± 0.666767.60 ± 2376.14
Bending for technical fabric
SampleDryWet
Length of Overhang
l (cm)
Bending Rigidity
G2 (mN.m)
Length of Overhang
l (cm)
Bending Rigidity
G2 (mN.m)
1PES6-G2 18.40 ± 16.2614.44 ± 3.258.60 ± 4.251.47 ± 0.22
1PES9-G219.70 ± 28.9920.08 ± 6.679.30 ± 9.192.11 ± 0.49
1PES12-G220.10 ± 16.9722.10 ± 3.789.60 ± 6.362.41 ± 0.22
2PES6-G219.30 ± 3.5418.50 ± 0.928.90 ± 2.831.81 ± 0.30
2PES9-G220.10 ± 9.9021.12 ± 2.5610.40 ± 3.542.93 ± 0.20
2PES12-G220.60 ± 0.7128.41 ± 0.2011.10 ± 2.834.44 ± 0.26
3PES6-G221.20 ± 4.9527.38 ± 0.8810.10 ± 4.242.96 ± 0.18
3PES9-G222.40 ± 4.2434.14 ± 0.6410.60 ± 4.953.62 ± 0.26
3PES12-G222.35 ± 4.9539.36 ± 0.7612.00 ± 6.366.09 ± 0.25
Table 4. Regression equations of bending curvature of dry and wet forms of polyester carpets.
Bending for Apparel Fabric
Sample CodesDryWet
Equation of
Regression Curve
Coefficient of Regression (R2)Equation of
Regression Curve
Coefficient of Regression
(R2)
1PES6-G1 y = 4.404x0.7361 − 1.238x + 0.04107R2 = 0.9995y = 4.553x0.8316 − 2.146x + 0.01205R2 = 0.9993
1PES9-G1y = 53.88x0.9864 − 51.03x − 0.1173R2 = 0.9993y = 36.58x0.9857 − 34.47x − 0.03946R2 = 0.9989
1PES12-G1y = 36.5x0.9799 − 33.72x − 0.08238R2 = 0.9992y = 15.87x0.9718 − 14.02x − 0.01899R2 = 0.9998
2PES6-G1y = − 21.89x1.029 + 24.56x + 0.2938R2 = 0.9980y = 45.24x0.9906 − 43.24x − 0.1656R2 = 0.9964
2PES9-G1y = 39.7x0.9813 − 36.83x − 0.3762R2 = 0.9954y = 23.71x0.9741 − 21.48x − 0.003374R2 = 0.9999
2PES12-G1y = −26.88x1.025 + 29.57x − 0.05452R2 = 0.9989y = 101.5x0.9941 − 99.26x − 0.1659R2 = 0.9902
3PES6-G1y = 5.598x0.7809 − 2.351x − 0.03235R2 = 0.9985y = 5.323x0.8408 − 2.866x − 0.008245R2 = 0.9998
3PES9-G1y = 28.67x0.9749 − 26.02x − 0.000902R2 = 0.9995y = 17.04x0.9506 − 14.53x − 0.01272R2 = 0.9998
3PES12-G1y = −7.888x1.072 + 10.3x − 0.01667R2 = 0.9994y = −0.3296x1.763 + 2.383x − 0.008711R2 = 0.9998
Bending for technical fabric
Sample CodesDryWet
Equation of
Regression Curve
Coefficient of Regression (R2)Equation of
Regression Curve
Coefficient of Regression
(R2)
1PES6-G2 y = 45.62x0.9883 − 43.11x − 0.2136R2 = 0.9988y = 39.03x0.9894 − 37.06x − 0.2257R2 = 0.9914
1PES9-G2y = 13.55x0.9445 − 10.68x − 0.02309R2 = 0.9997y = 41.66x0.9857 − 39.51x − 0.09046R2 = 0.9968
1PES12-G2y = 4.758x0.8202 − 1.804x − 0.03475R2 = 0.9996y = 59.4x0.9919 − 57.18x − 0.2335R2 = 0.9947
2PES6-G2y = 39.37x0.987 − 37.02x − 0.1696R2 = 0.9979y = 58.79x0.9907 − 56.82x − 0.1212R2 = 0.9870
2PES9-G2y = 27.29x0.9814 − 25.01x − 0.1595R2 = 0.9970y = 35.46x0.9804 − 32.87x − 0.1126R2 = 0.9984
2PES12-G2y = 5.569x0.8483 − 2.619x − 0.0268R2 = 0.9997y = 76.96x0.9925 − 74.73x − 0.3564R2 = 0.9524
3PES6-G2y = 28.98x0.9798 − 26.31x − 0.2785R2 = 0.9978y = 25.58x0.9801 − 23.53x − 0.09408R2 = 0.9969
3PES9-G2y = 4.663x0.757 − 1.286x − 0.02506R2 = 0.9999y = 59.48x0.9911 − 57.49x − 0.2258R2 = 0.9555
3PES12-G2y = 4.675x0.8484 − 2.016x − 0.01012R2 = 0.9999y = 88.58x0.9898 − 85.61x − 0.2765R2 = 0.9649
Table 5. Recovery period and thickness, thickness loss, and resilience after static loading on various dry carpets.
Sample CodesInitial Thickness
(mm)
Carpet Thickness of Various Recovery Periods
(mm)
h1
(after 2 min.)
h2
(after 1 h)
h3
(after 1 Day)
h4
(3 Days)
h5
(3 Years)
1PES65.914.21 ± 0.444.38 ± 0.284.51 ± 0.234.62 ± 0.205.26 ± 0.79
1PES96.824.68 ± 0.035.16 ± 0.015.40 ± 0.025.46 ± 0.056.27 ± 0.66
1PES128.475.99 ± 0.056.17 ± 0.096.37 ± 0.136.44 ± 0.127.54 ± 0.47
2PES65.994.22 ± 0.084.39 ± 0.114.52 ± 0.024.76 ± 0.035.44 ± 0.54
2PES97.425.04 ± 0.085.31 ± 0.225.51 ± 0.185.57 ± 0.186.14 ± 0.13
2PES128.536.29 ± 0.036.41 ± 0.046.66 ± 0.026.82 ± 0.017.03 ± 0.64
3PES66.584.98 ± 0.045.12 ± 0.045.25 ± 0.045.34 ± 0.055.72 ± 0.20
3PES97.615.74 ± 0.065.93 ± 0.066.09 ± 0.046.25 ± 0.046.66 ± 0.23
3PES129.657.30 ± 0.077.53 ± 0.017.70 ± 0.017.81 ± 0.018.69 ± 0.26
Sample CodesInitial Thickness
(mm)
Carpet Thickness Loss of Various Recovery Periods
(%)
h1
(after 2 min.)
h2
(after 1 h)
h3
(after 1 day)
h4
(3 days)
h5
(3 years)
1PES65.9128.76 ± 7.4225.89 ± 4.7923.69 ± 3.8321.83 ± 3.3511.00 ± 13.40
1PES96.8231.38 ± 0.4124.34 ± 0.2120.89 ± 0.3120.01 ± 0.738.06 ± 9.75
1PES128.4729.34 ± 0.5827.21 ± 1.0924.85 ± 1.5924.03 ± 1.4211.04 ± 5.59
2PES65.9929.55 ± 1.4226.79 ± 1.7724.62 ± 0.3520.53 ± 0.479.18 ± 8.97
2PES97.4232.08 ± 1.1428.50 ± 2.9525.81 ± 2.3824.93 ± 2.4817.32 ± 1.81
2PES128.5326.26 ± 0.3324.91 ± 0.4121.98 ± 0.2520.05 ± 0.1717.64 ± 7.54
3PES66.5824.32 ± 0.6422.19 ± 0.6420.29 ± 0.5418.92 ± 0.7513.07 ± 3.01
3PES97.6124.57 ± 0.7422.08 ± 0.7419.97 ± 0.5617.87 ± 0.5612.48 ± 2.97
3PES129.6524.35 ± 0.7322.02 ± 0.0720.21 ± 0.1519.07 ± 0.1510.00 ± 2.71
Sample CodesInitial Thickness
(mm)
Carpet Resilience of Various Recovery Periods
(%)
h1
(after 2 min.)
h2
(after 1 h)
h3
(after 1 day)
h4
(3 days)
h5
(3 years)
1PES65.91-9.12 ± 6.8016.59 ± 8.2023.06 ± 8.2066.66 ± 37.99
1PES96.82-22.43 ± 0.3633.41 ± 1.8736.21 ± 3.1674.30 ± 30.72
1PES128.47-7.24 ± 1.8515.29 ± 3.7218.11 ± 3.2162.37 ± 18.32
2PES65.99-9.32 ± 1.6516.67 ± 2.8030.51 ± 1.7468.93 ± 28.91
2PES97.42-11.13 ± 6.0519.54 ± 4.5622.27 ± 4.9646.01 ± 7.57
2PES128.53-5.13 ± 0.3816.29 ± 0.1123.66 ± 1.6032.81 ± 29.58
3PES66.58-8.75 ± 0.2316.56 ± 4.4222.19 ± 5.1646.25 ± 10.95
3PES97.61-10.16 ± 0.3118.72 ± 0.1927.27 ± 0.0749.20 ± 13.64
3PES129.65-9.57 ± 3.0217.02 ± 1.9021.70 ± 2.9658.94 ± 12.37
Table 6. Abrasion cycle, carpet pile mass loss, and carpet thickness loss relations after a Martindale abrasion test on various carpets.
Sample CodesAbrasion CyclesCarpet Mass
(mg)
Carpet mass Loss
(mg)
Carpet mass Loss
(%)
Carpet Thickness
(mm)
Carpet Thickness Loss
(mm)
Carpet Thickness Loss
(%)
1PES6020300.00 ± 0.000.00 ± 0.005.91 ± 0.060.49 ± 0.148.30 ± 2.47
5000201515 ± 7.070.74 ± 0.37-
10,000201020 ± 0.000.99 ± 0.03-
20,000200525 ± 7.071.23 ± 0.31-
30,000200525 ± 7.071.23 ± 0.31-
40,000199535 ± 7.071.72 ± 0.30-
50,000199040 ± 0.001.97 ± 0.055.42 ± 0.20
1PES9023850.00 ± 0.000.00 ± 0.006.82 ± 0.110.57 ± 0.109.33 ± 2.70
500023805 ± 7.070.21 ± 0.30-
10,000237015 ± 7.070.63 ± 0.29-
20,000236025 ± 21.211.05 ± 0.89-
30,000235035 ± 21.211.47 ± 0.89-
40,000234045 ± 21.211.89 ± 0.88-
50,000233550 ± 14.412.10 ± 0.596.25 ± 0.01
1PES12025300.00 ± 0.000.00 ± 0.008.47 ± 0.071.34 ± 0.1715.81 ± 1.87
500025255 ± 7.070.20 ± 0.28-
10,000251515 ± 7.070.59 ± 0.28-
20,000250525 ± 7.070.99 ± 0.29-
30,000248545 ± 7.071.78 ± 0.27-
40,000246565 ± 7.072.57 ± 0.29-
50,000245575 ± 7.072.97 ± 0.307.13 ± 0.10
2PES6022600.00 ± 0.000.00 ± 0.005.99 ± 0.040.59 ± 0.119.86 ± 1.95
5000222535 ± 21.211.56 ± 0.97-
10,000217585 ± 7.073.76 ± 0.24-
20,0002160100 ± 0.004.43 ± 0.08-
30,0002150110 ± 0.004.87 ± 0.09-
40,0002145115 ± 7.075.09 ± 0.41-
50,0002130130 ± 0.005.75 ± 0.115.40 ± 0.15
2PES9021100.00 ± 0.000.00 ± 0.007.42 ± 0.121.58 ± 0.0421.32 ± 0.92
5000209020 ± 0.000.95 ± 0.07-
10,000204565 ± 35.363.03 ± 1.45-
20,000202585 ± 21.214.00 ± 0.71-
30,000201595 ± 21.214.48 ± 0.68-
40,0001975135 ± 77.786.28 ± 3.22-
50,0001920190 ± 141.428.78 ± 6.055.84 ± 0.16
2PES12026650.00 ± 0.000.00 ± 0.008.53 ± 0.282.05 ± 0.4223.91 ± 4.10
5000265510 ± 0.000.38 ± 0.00-
10,000265015 ± 7.070.56 ± 0.27-
20,000261550 ± 14.141.87 ± 0.51-
30,000258580 ± 28.283.00 ± 1.02-
40,0002555110 ± 0.004.13 ± 0.05-
50,0002345320 ± 84.8511.99 ± 3.026.49 ± 0.13
3PES6026750.00 ± 0.000.00 ± 0.006.58 ± 0.100.24 ± 0.083.64 ± 1.23
5000266510 ± 0.000.37 ± 0-
10,000266015 ± 7.070.56 ± 0.26-
20,000265025 ± 7.070.93 ± 0.26-
30,0002550125 ± 91.924.69 ± 3.47-
40,0002535140 ± 113.145.25 ± 4.27-
50,0002525150 ± 113.145.62 ± 4.276.34 ± 0.01
3PES9027150.00 ± 0.000.00 ± 0.007.61 ± 0.101.78 ± 0.3623.30 ± 4.44
5000269025 ± 7.070.92 ± 0.27-
10,0002440275 ± 35.3610.12 ± 1.22-
20,0002420295 ± 35.3610.86 ± 1.22-
30,0002410305 ± 35.3611.23 ± 1.21-
40,0002395320 ± 42.4311.78 ± 1.47-
50,0002365350 ± 70.7112.88 ± 2.505.84 ± 0.26
3PES12028600.00 ± 0.000.00 ± 0.009.65 ± 0.132.39 ± 0.1024.79 ± 1.37
5000285010 ± 0.000.35 ± 0.00-
10,000283525 ± 7.070.87 ± 0.25-
20,000282040 ± 14.141.40 ± 0.50-
30,000279565 ± 21.212.27 ± 0.73-
40,000277090 ± 56.573.14 ± 1.96-
50,0002740120 ± 98.994.19 ± 3.447.26 ± 0.23
Table 7. Stroke number and fractured pile yarn relations after token rubbing test on various carpet samples.
Sample CodesStroke Number at the Beginning of Fractured Pile YarnsStroke Number after Complete Fractured Pile Yarns
1PES6112511,000
1PES9125019,750
1PES12175023,750
2PES6175014,750
2PES9175020,000
2PES12200032,250
3PES622507000
3PES9175018,250
3PES12175023,000
Table 8. ANOVA tables for the model of carpet thickness and resilience after static loading and abrasion thickness loss.
Carpet Thickness
SourceSum of SquaresContribution (%)DFMean SquareF ValueProb > FSignificance
Model16.8999.1953.38293.23<0.0001significant
A13.6680.21113.661185.60<0.0001significant
B2.7716.2912.77240.82<0.0001significant
A20.170.9910.1714.590.0024significant
B20.030.1910.032.850.1169
AB0.221.3010.2219.260.0009significant
Residual0.140.81120.01
Lack of Fit0.040.2530.011.350.3188not significant
Pure Error0.100.5690.01
Cor Total17.03100.0017
Resilience
SourceSum of SquaresContribution (%)DFMean SquareF ValueProb > FSignificance
Model2646.5271.449294.0612.23<0.0001significant
A35.750.97135.751.490.2292
B93.522.52193.523.890.0549
C1910.6851.5811910.6879.46<0.0001significant
A2501.4313.541501.4320.85<0.0001significant
B242.051.14142.051.750.1929
C2168.314.541168.317.000.0113significant
AB18.800.51118.800.780.3813
AC11.710.32111.710.490.4889
BC0.860.0210.860.040.8508
Residual1058.0428.564424.05
Lack of Fit669.3618.071739.372.740.0095significant
Pure Error388.6710.492714.40
Cor Total3704.55100.0053
Abrasion thickness loss
SourceSum of SquaresContribution (%)DFMean SquareF ValueProb > FSignificance
Model9.0991.9942.2737.31<0.0001significant
A7.1672.4717.16117.57<0.0001significant
B1.3513.6211.3522.100.0004significant
B20.606.0510.609.820.0079
AB0.838.4110.8313.650.0027significant
Residual0.798.01130.06
Lack of Fit0.555.6040.145.210.0188significant
Pure Error0.242.4290.03
Cor Total9.88100.0017
Disclaimer/Publisher’s Note: The statements, opinions and data contained in all publications are solely those of the individual author(s) and contributor(s) and not of MDPI and/or the editor(s). MDPI and/or the editor(s) disclaim responsibility for any injury to people or property resulting from any ideas, methods, instructions or products referred to in the content.

