
Fracture of Epoxy Matrixes Modified with Thermo-Plastic Polymers and Winding Glass Fibers Reinforced Plastics on Their Base under Low-Velocity Impact Condition
 ,
,  ,
,  and
and 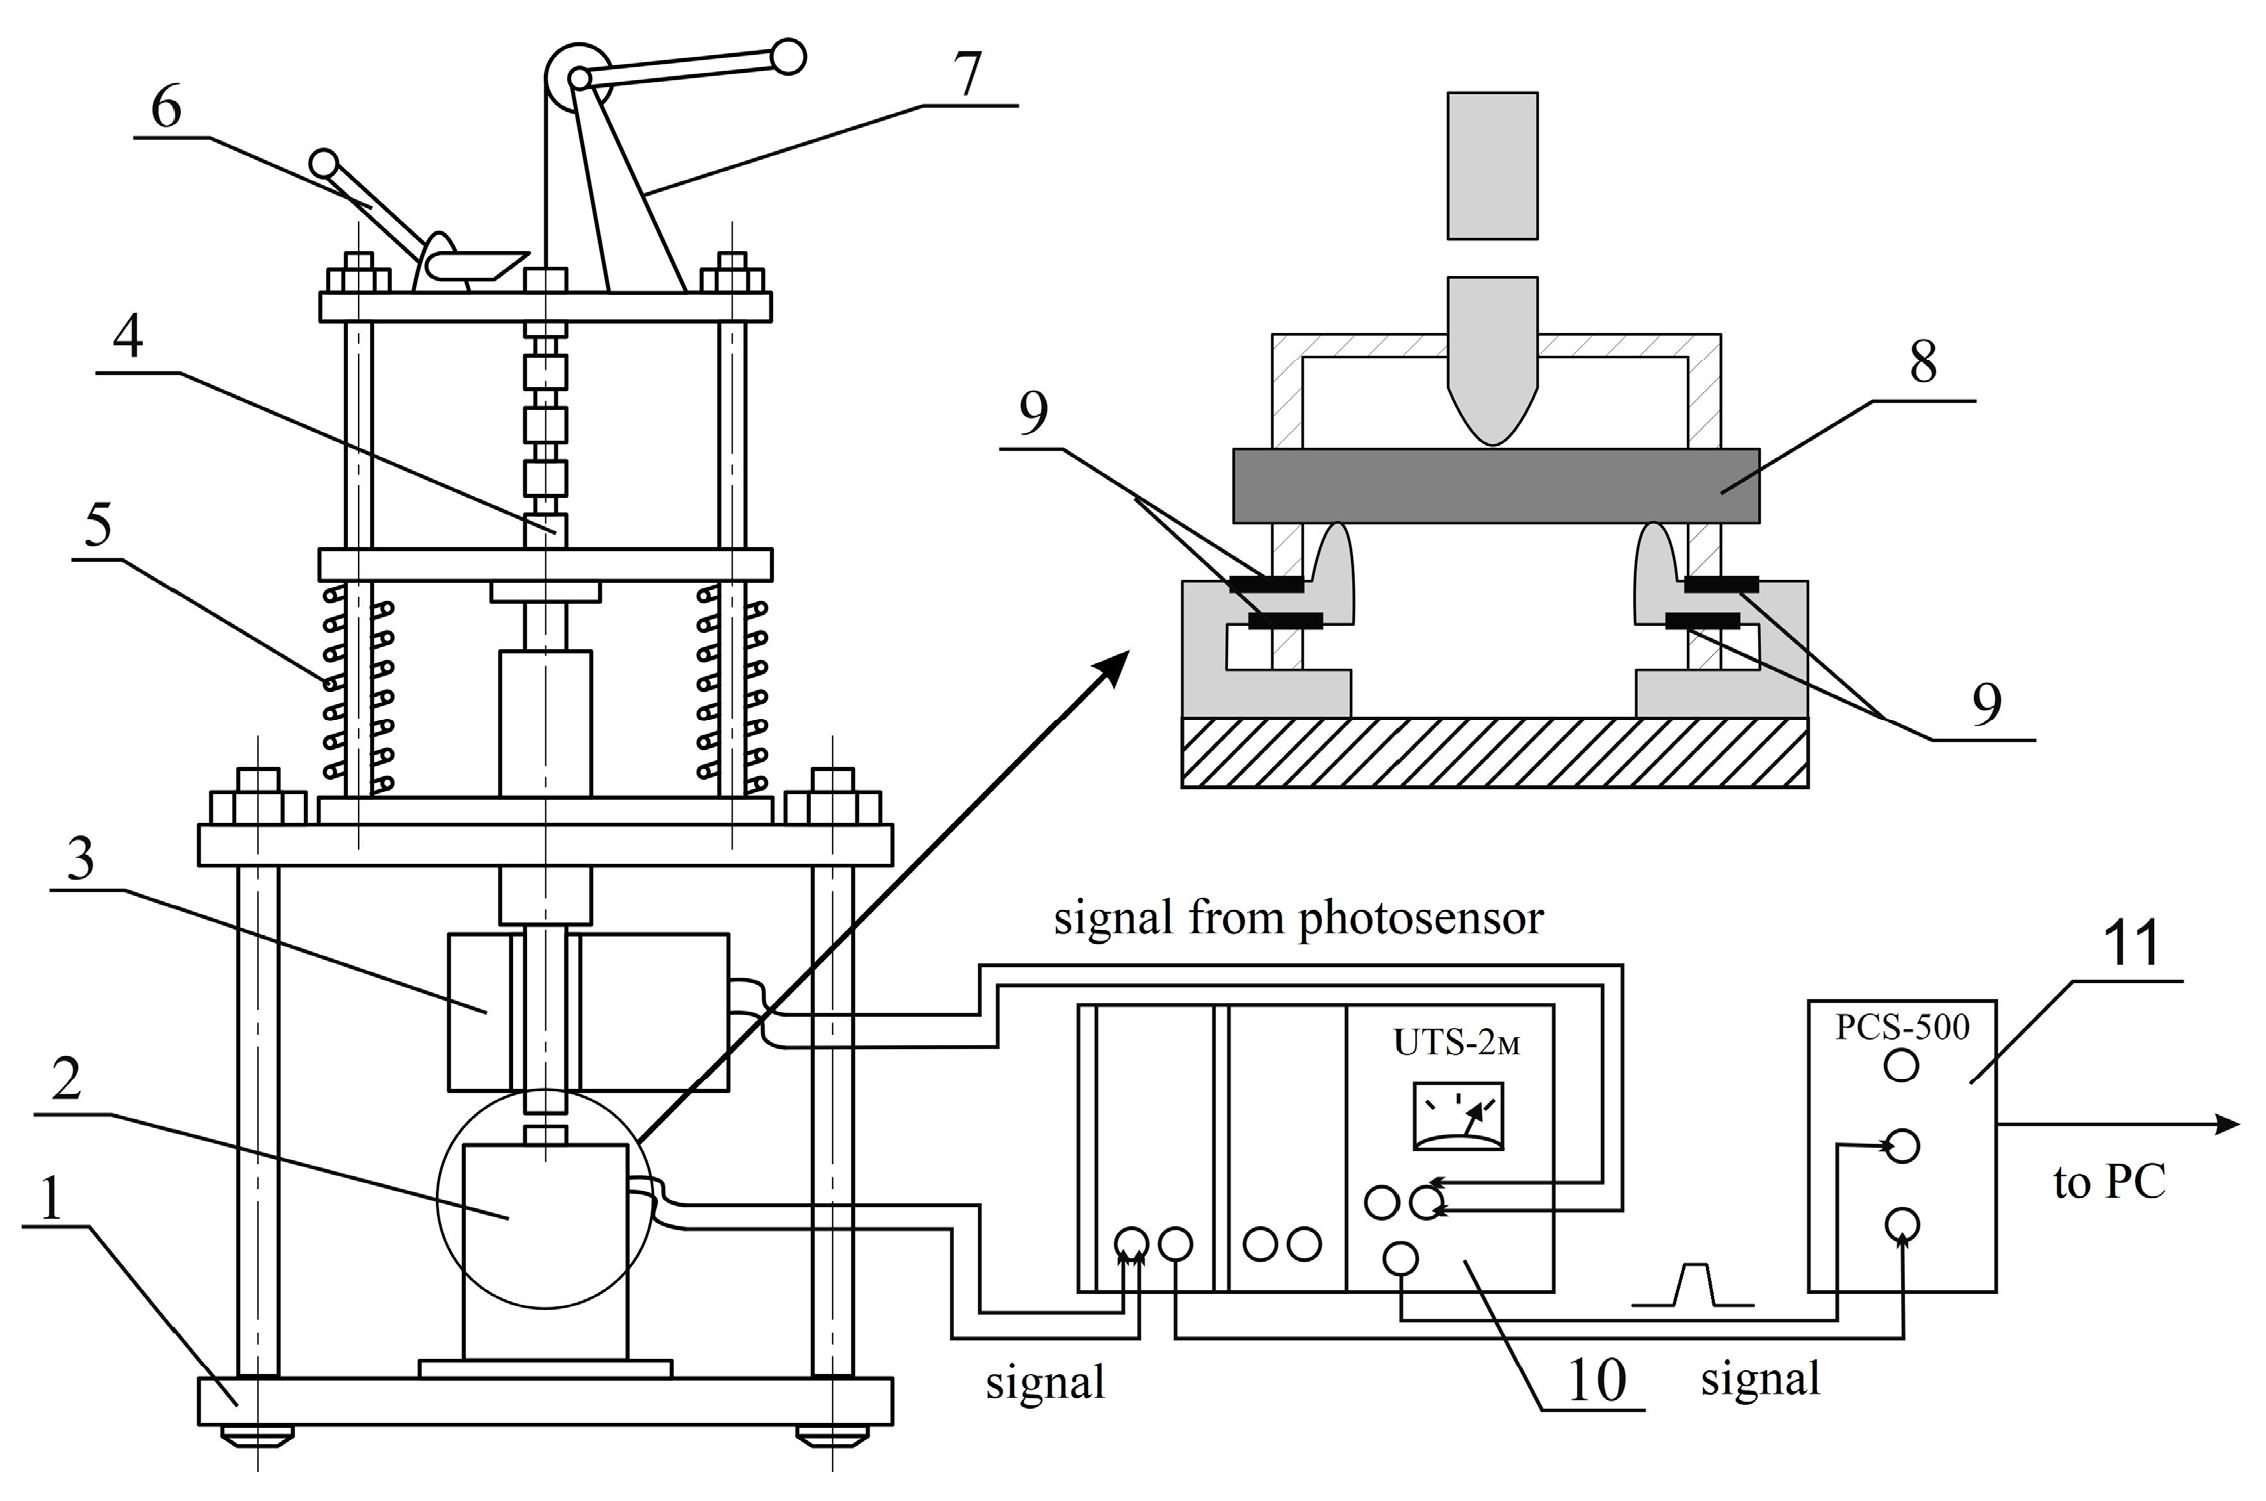
Abstract
:1. Introduction
2. Materials and Methods
2.1. Materials and Polymers Mixtures Preparation
2.2. Matrices Samples
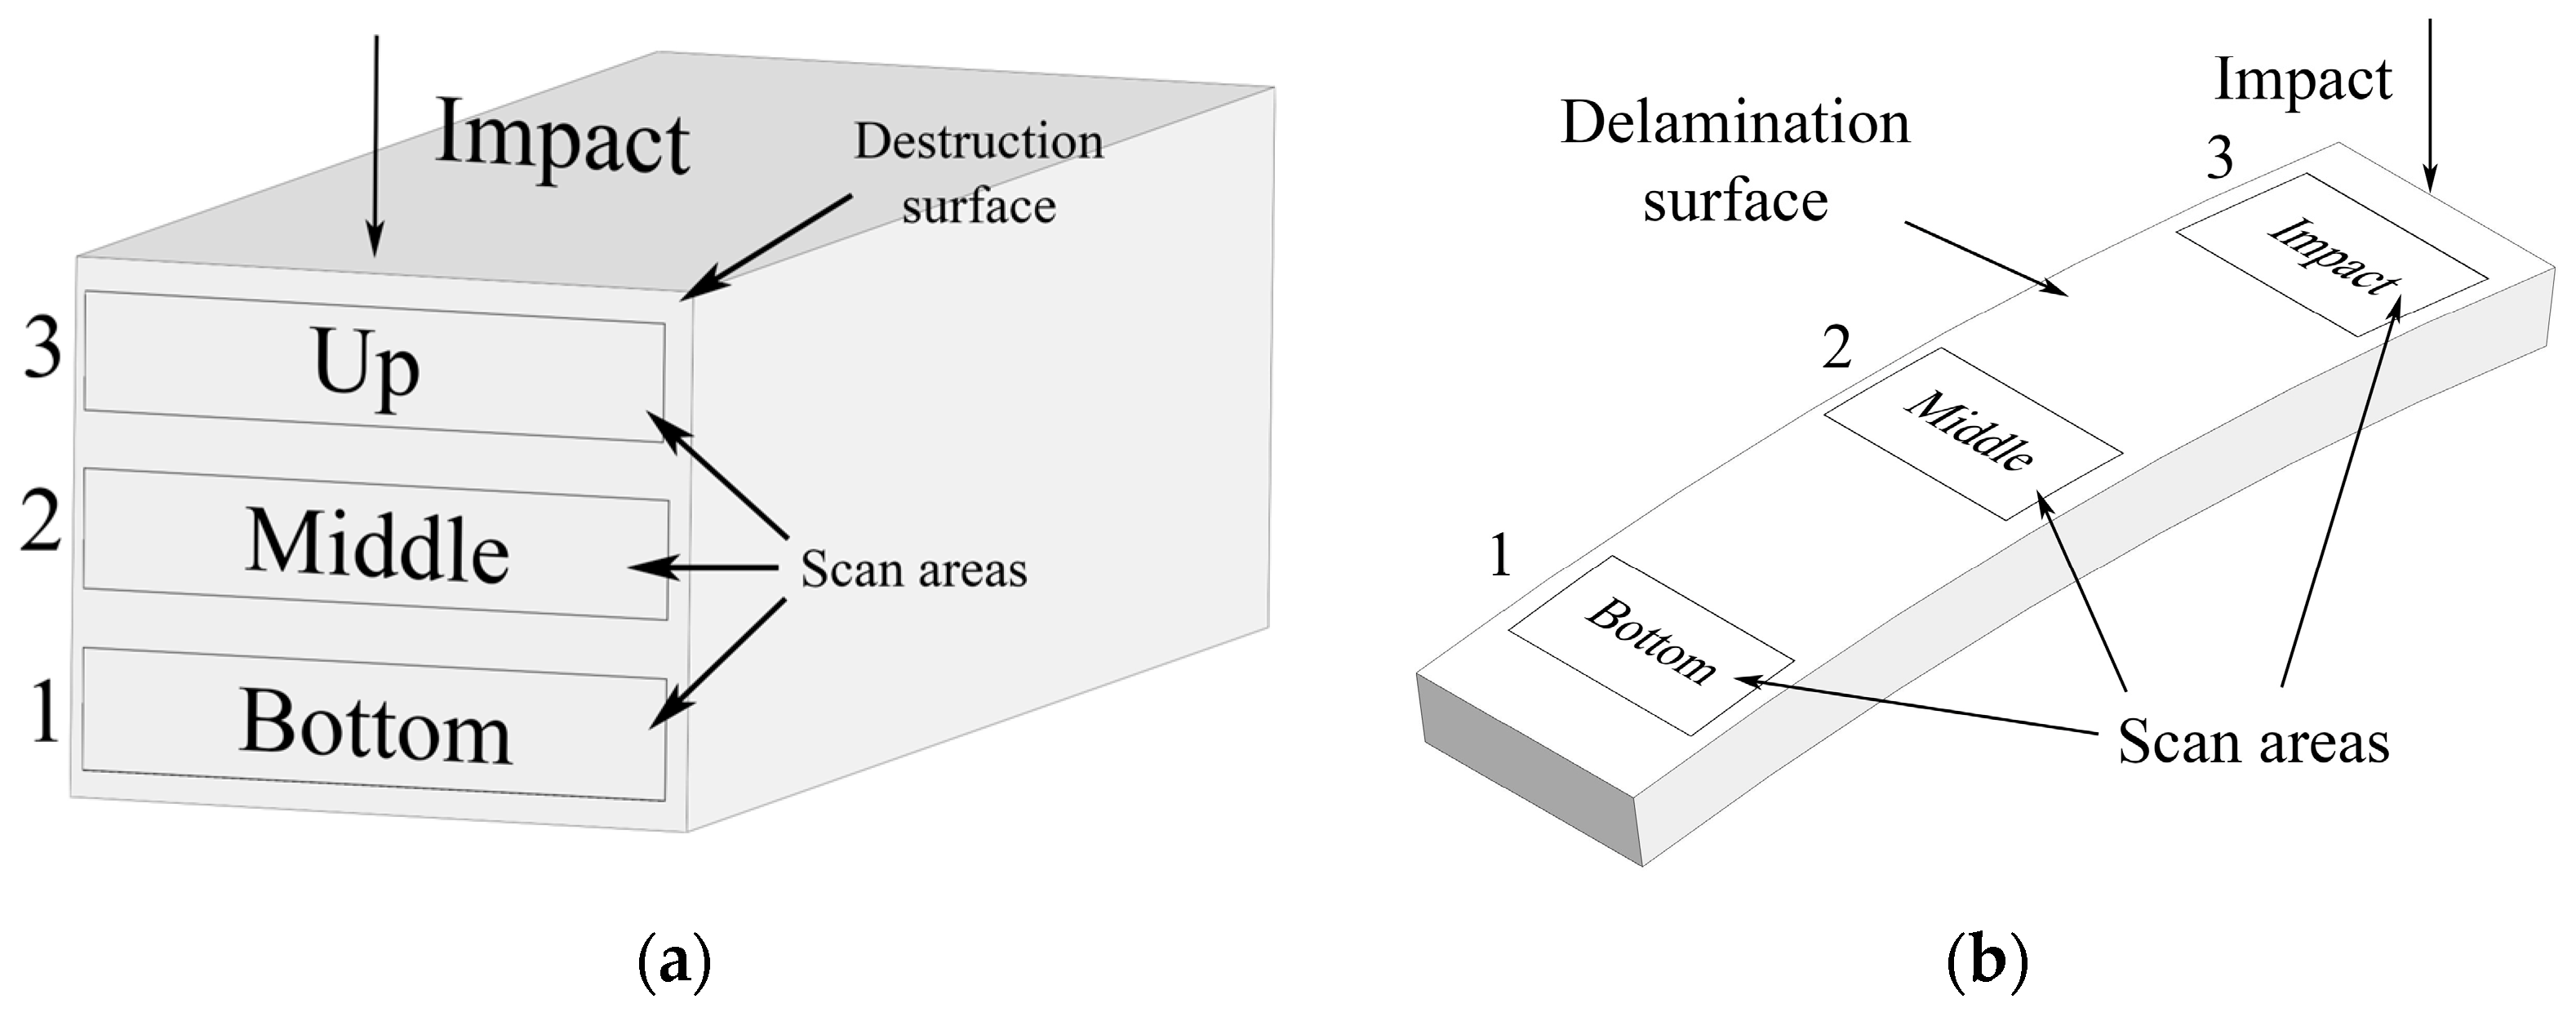
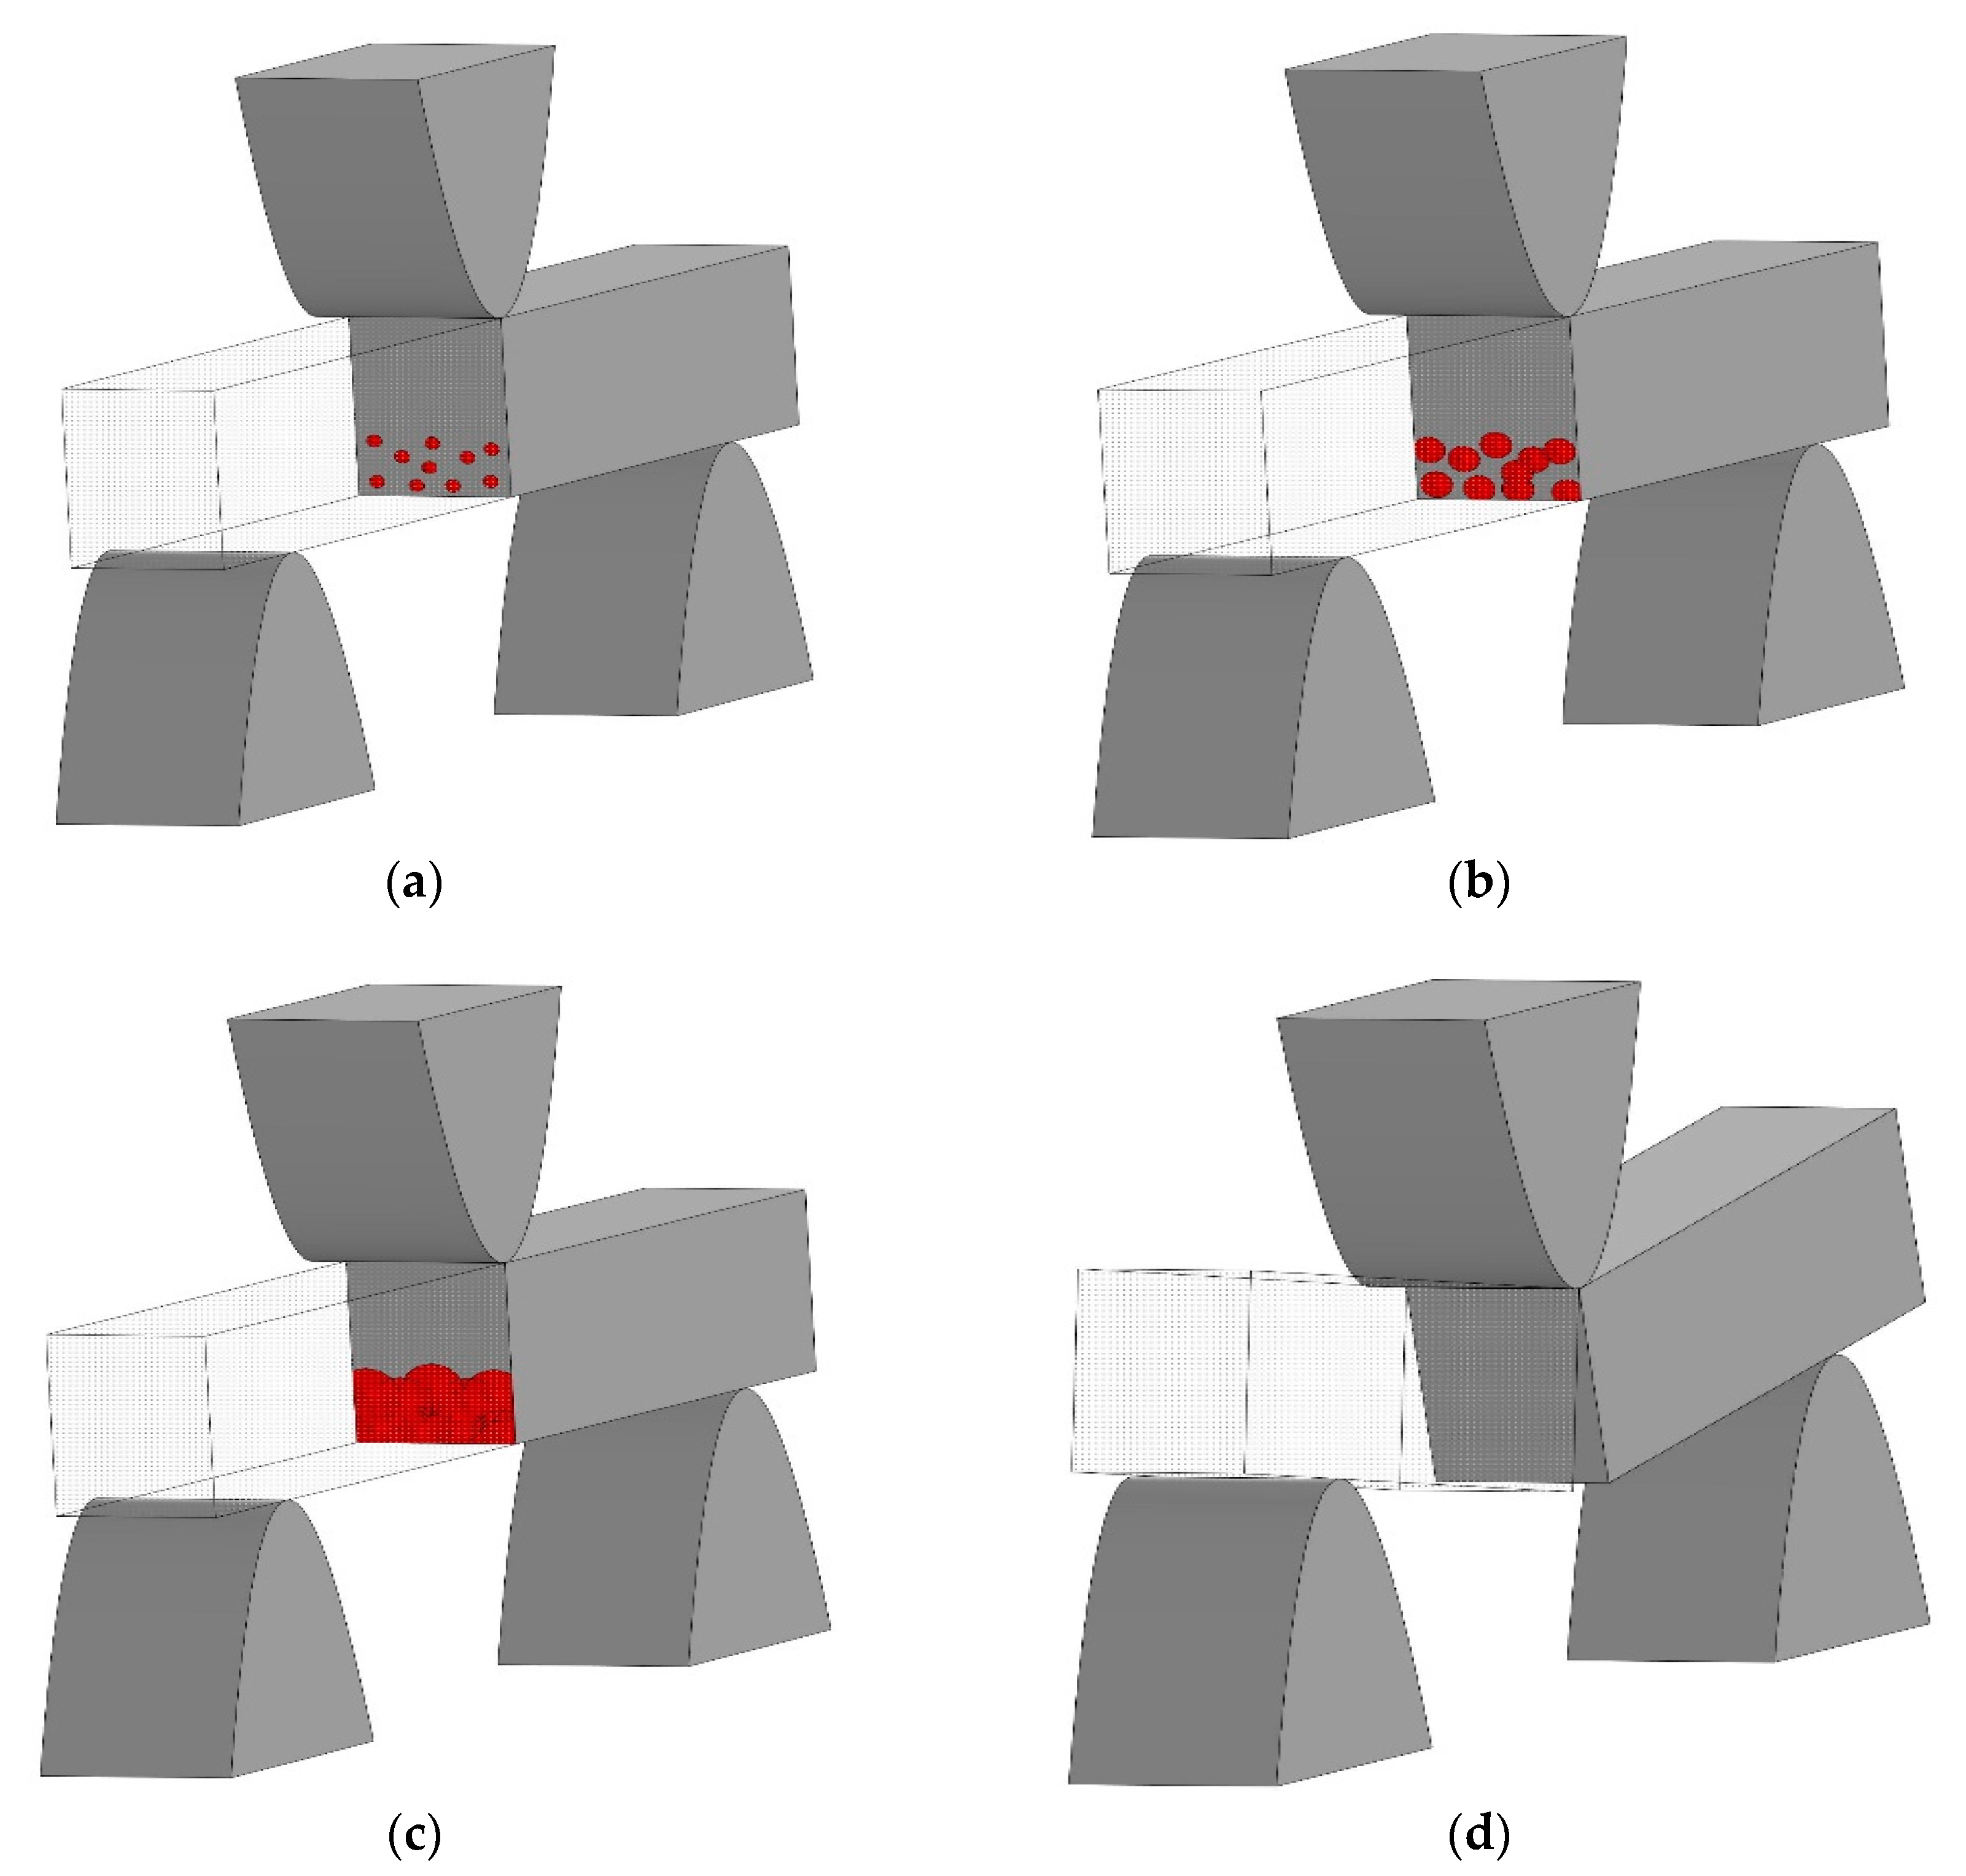
2.3. Samples GFRP
- Bending strength for non-reinforced polymers (σb) [59]:
- 2.
- Shear strength for reinforced plastics (τ) [58]:
- 3.
- The total energy of the material fracture:
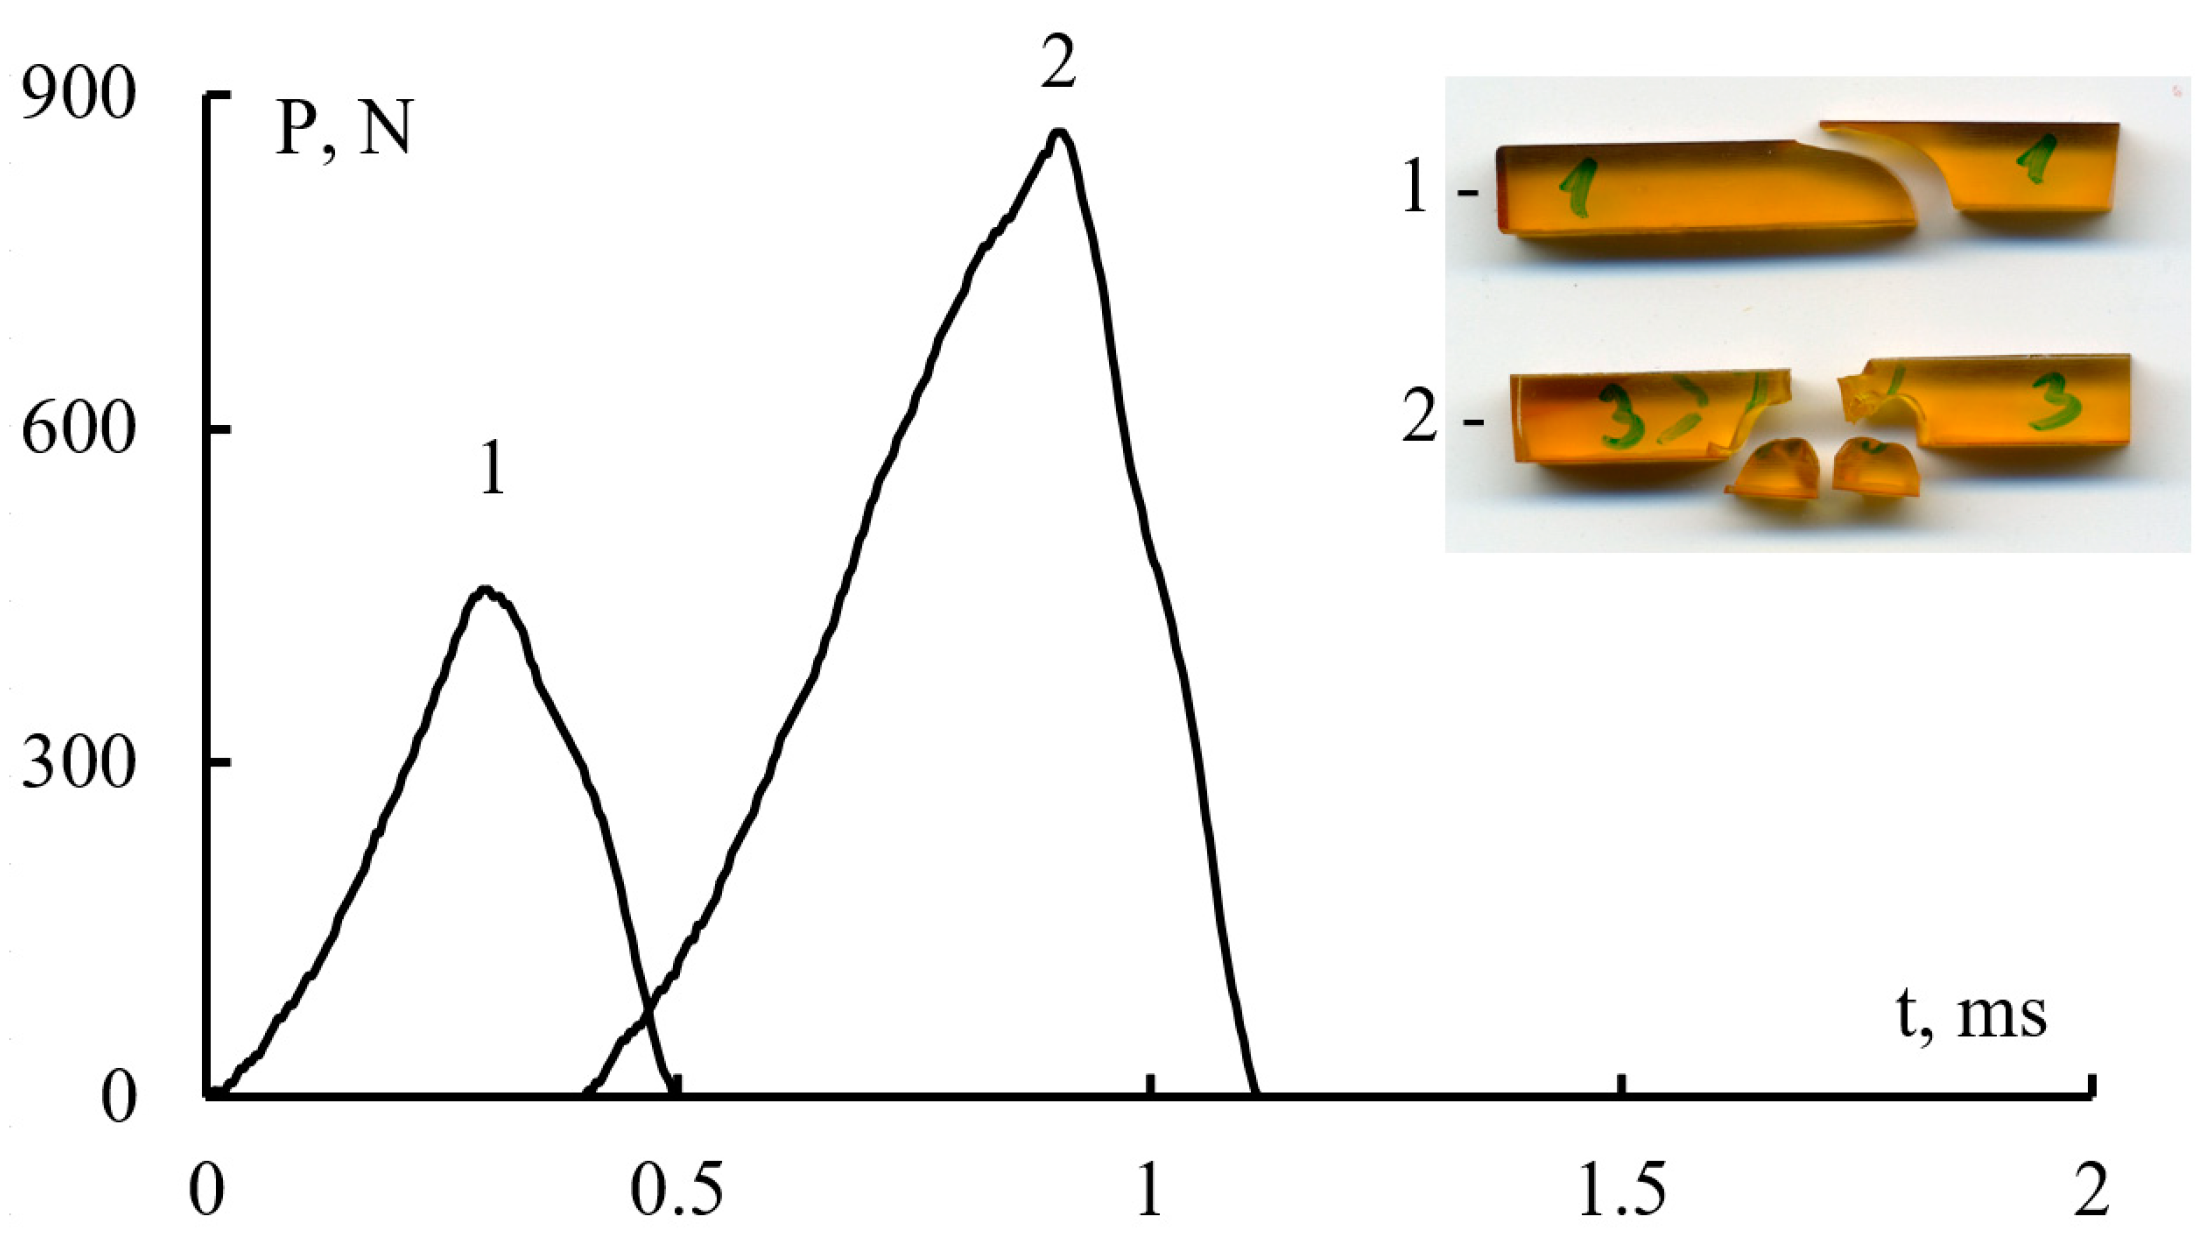
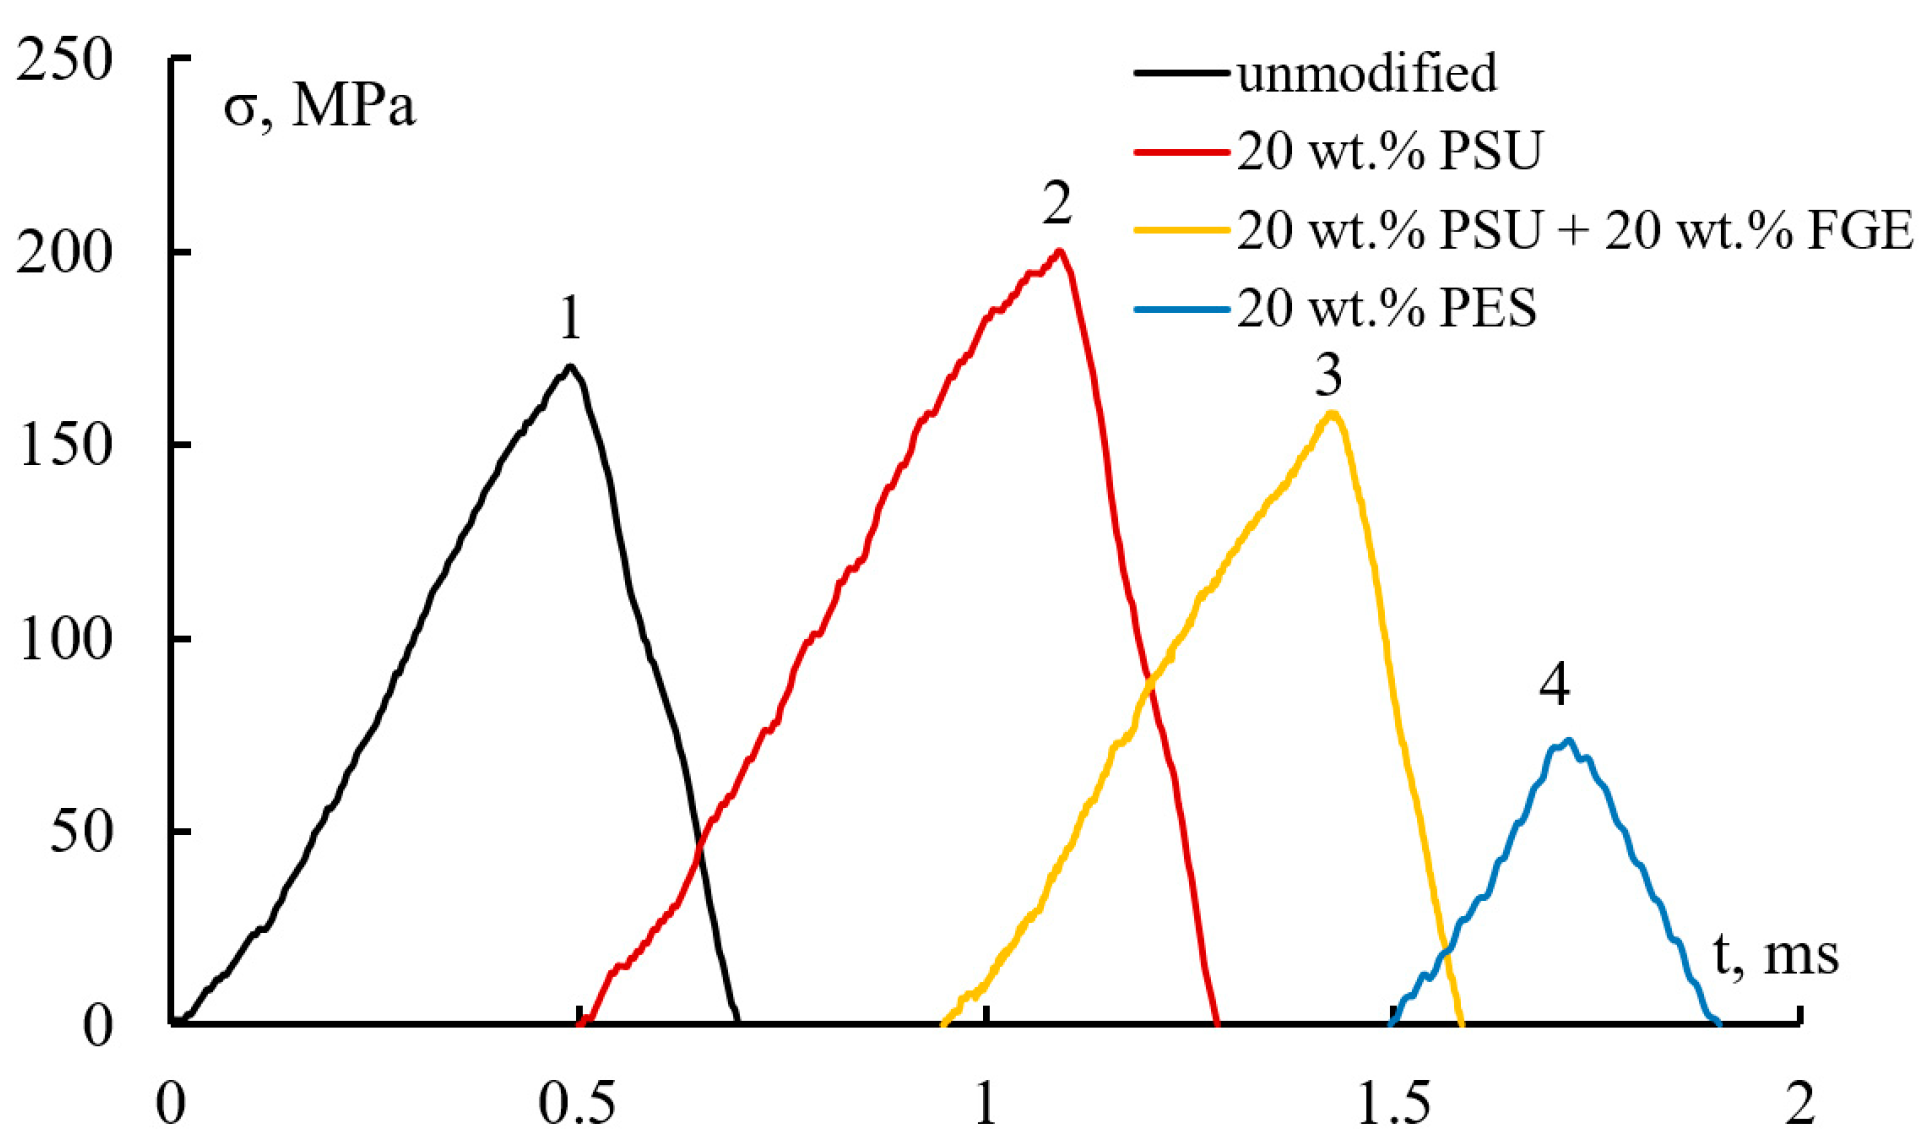
3. Results and Discussion
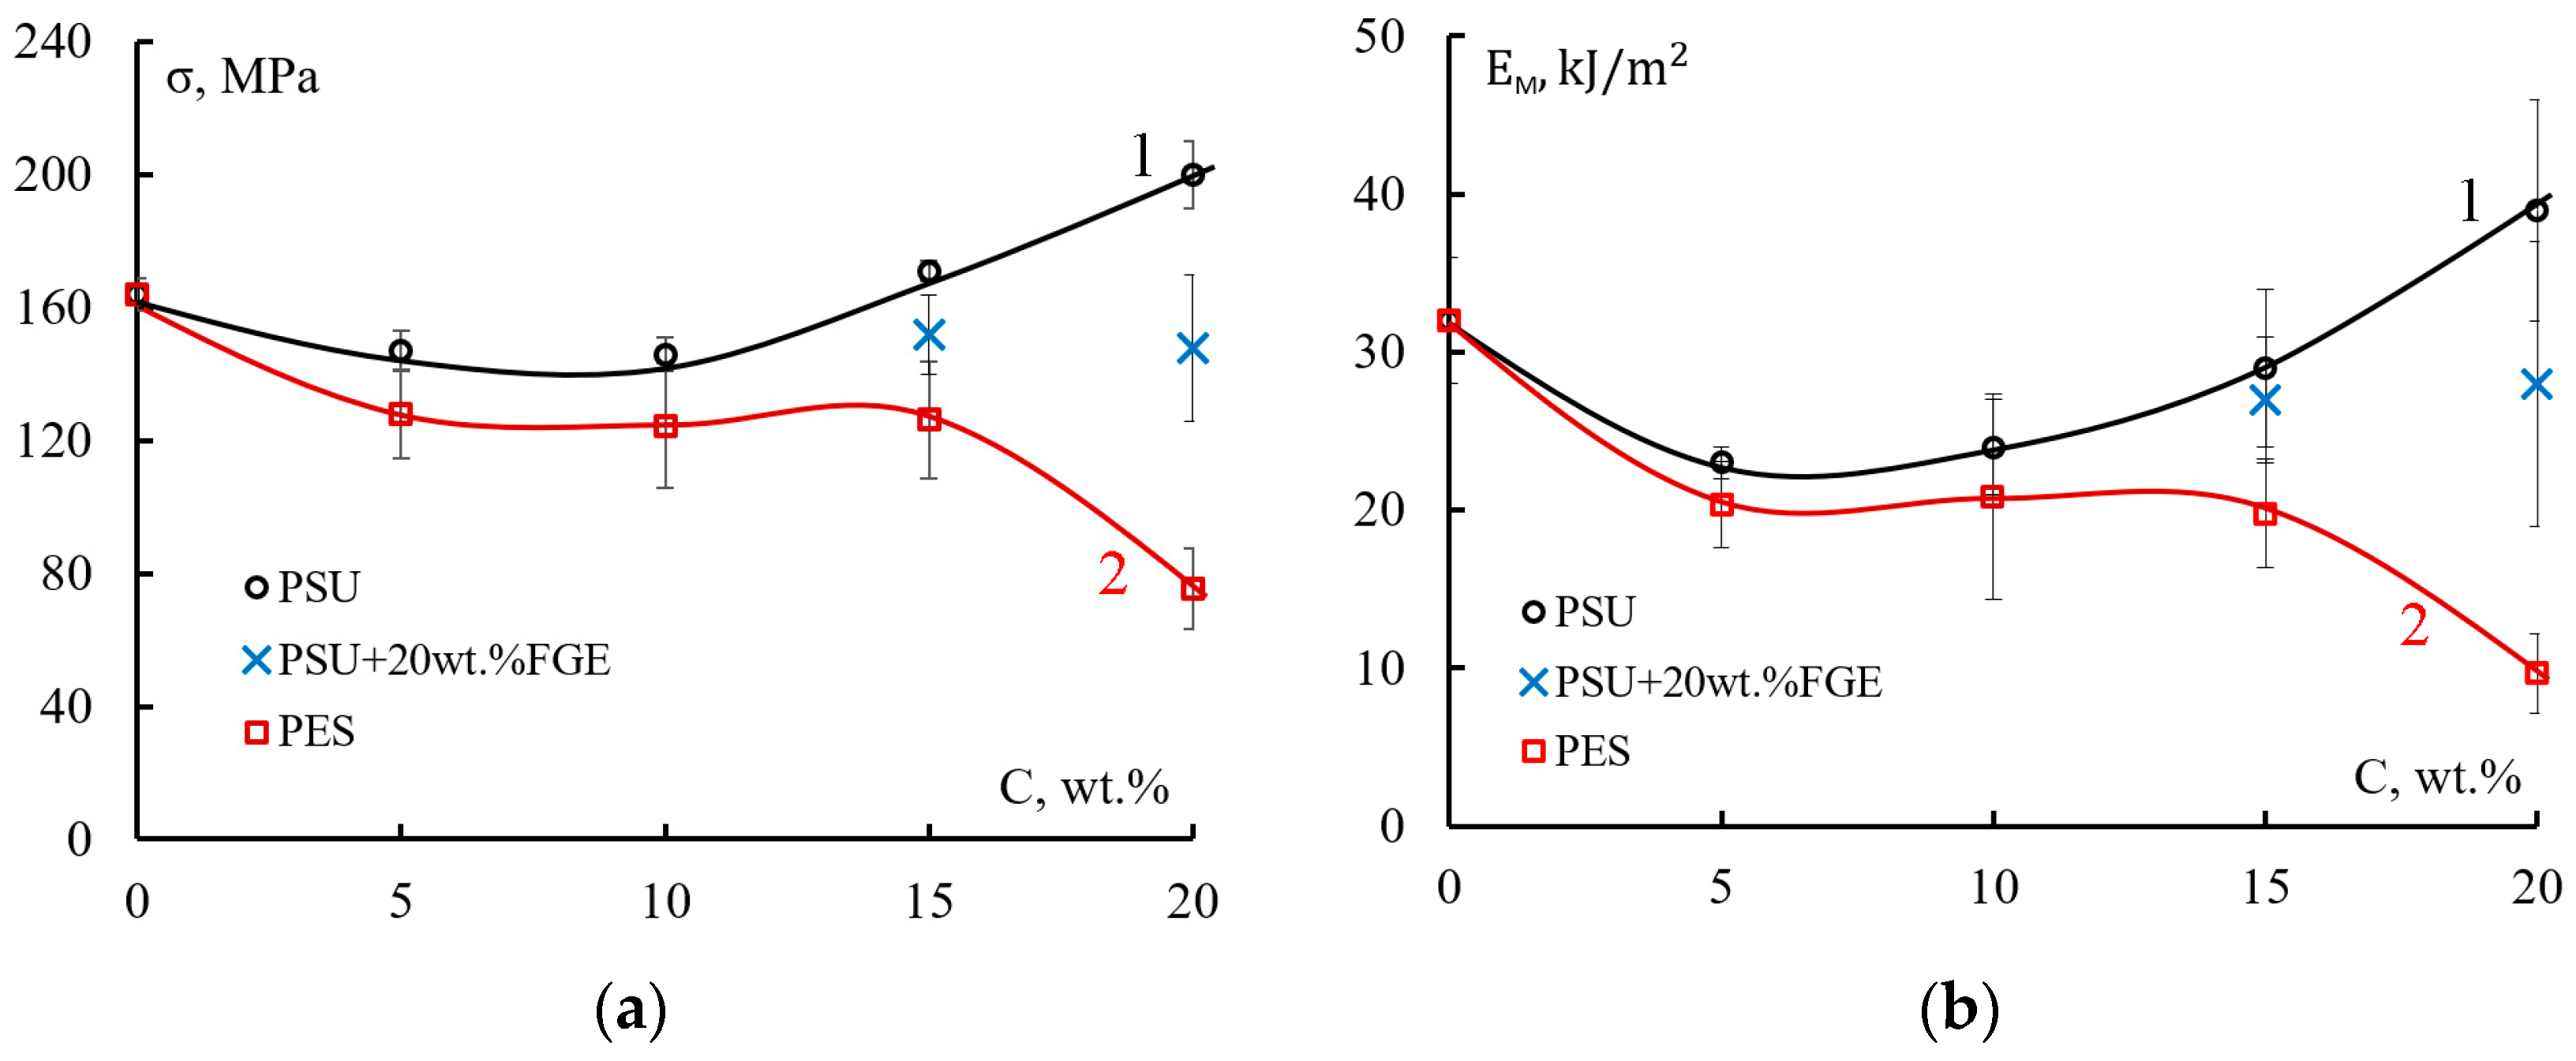
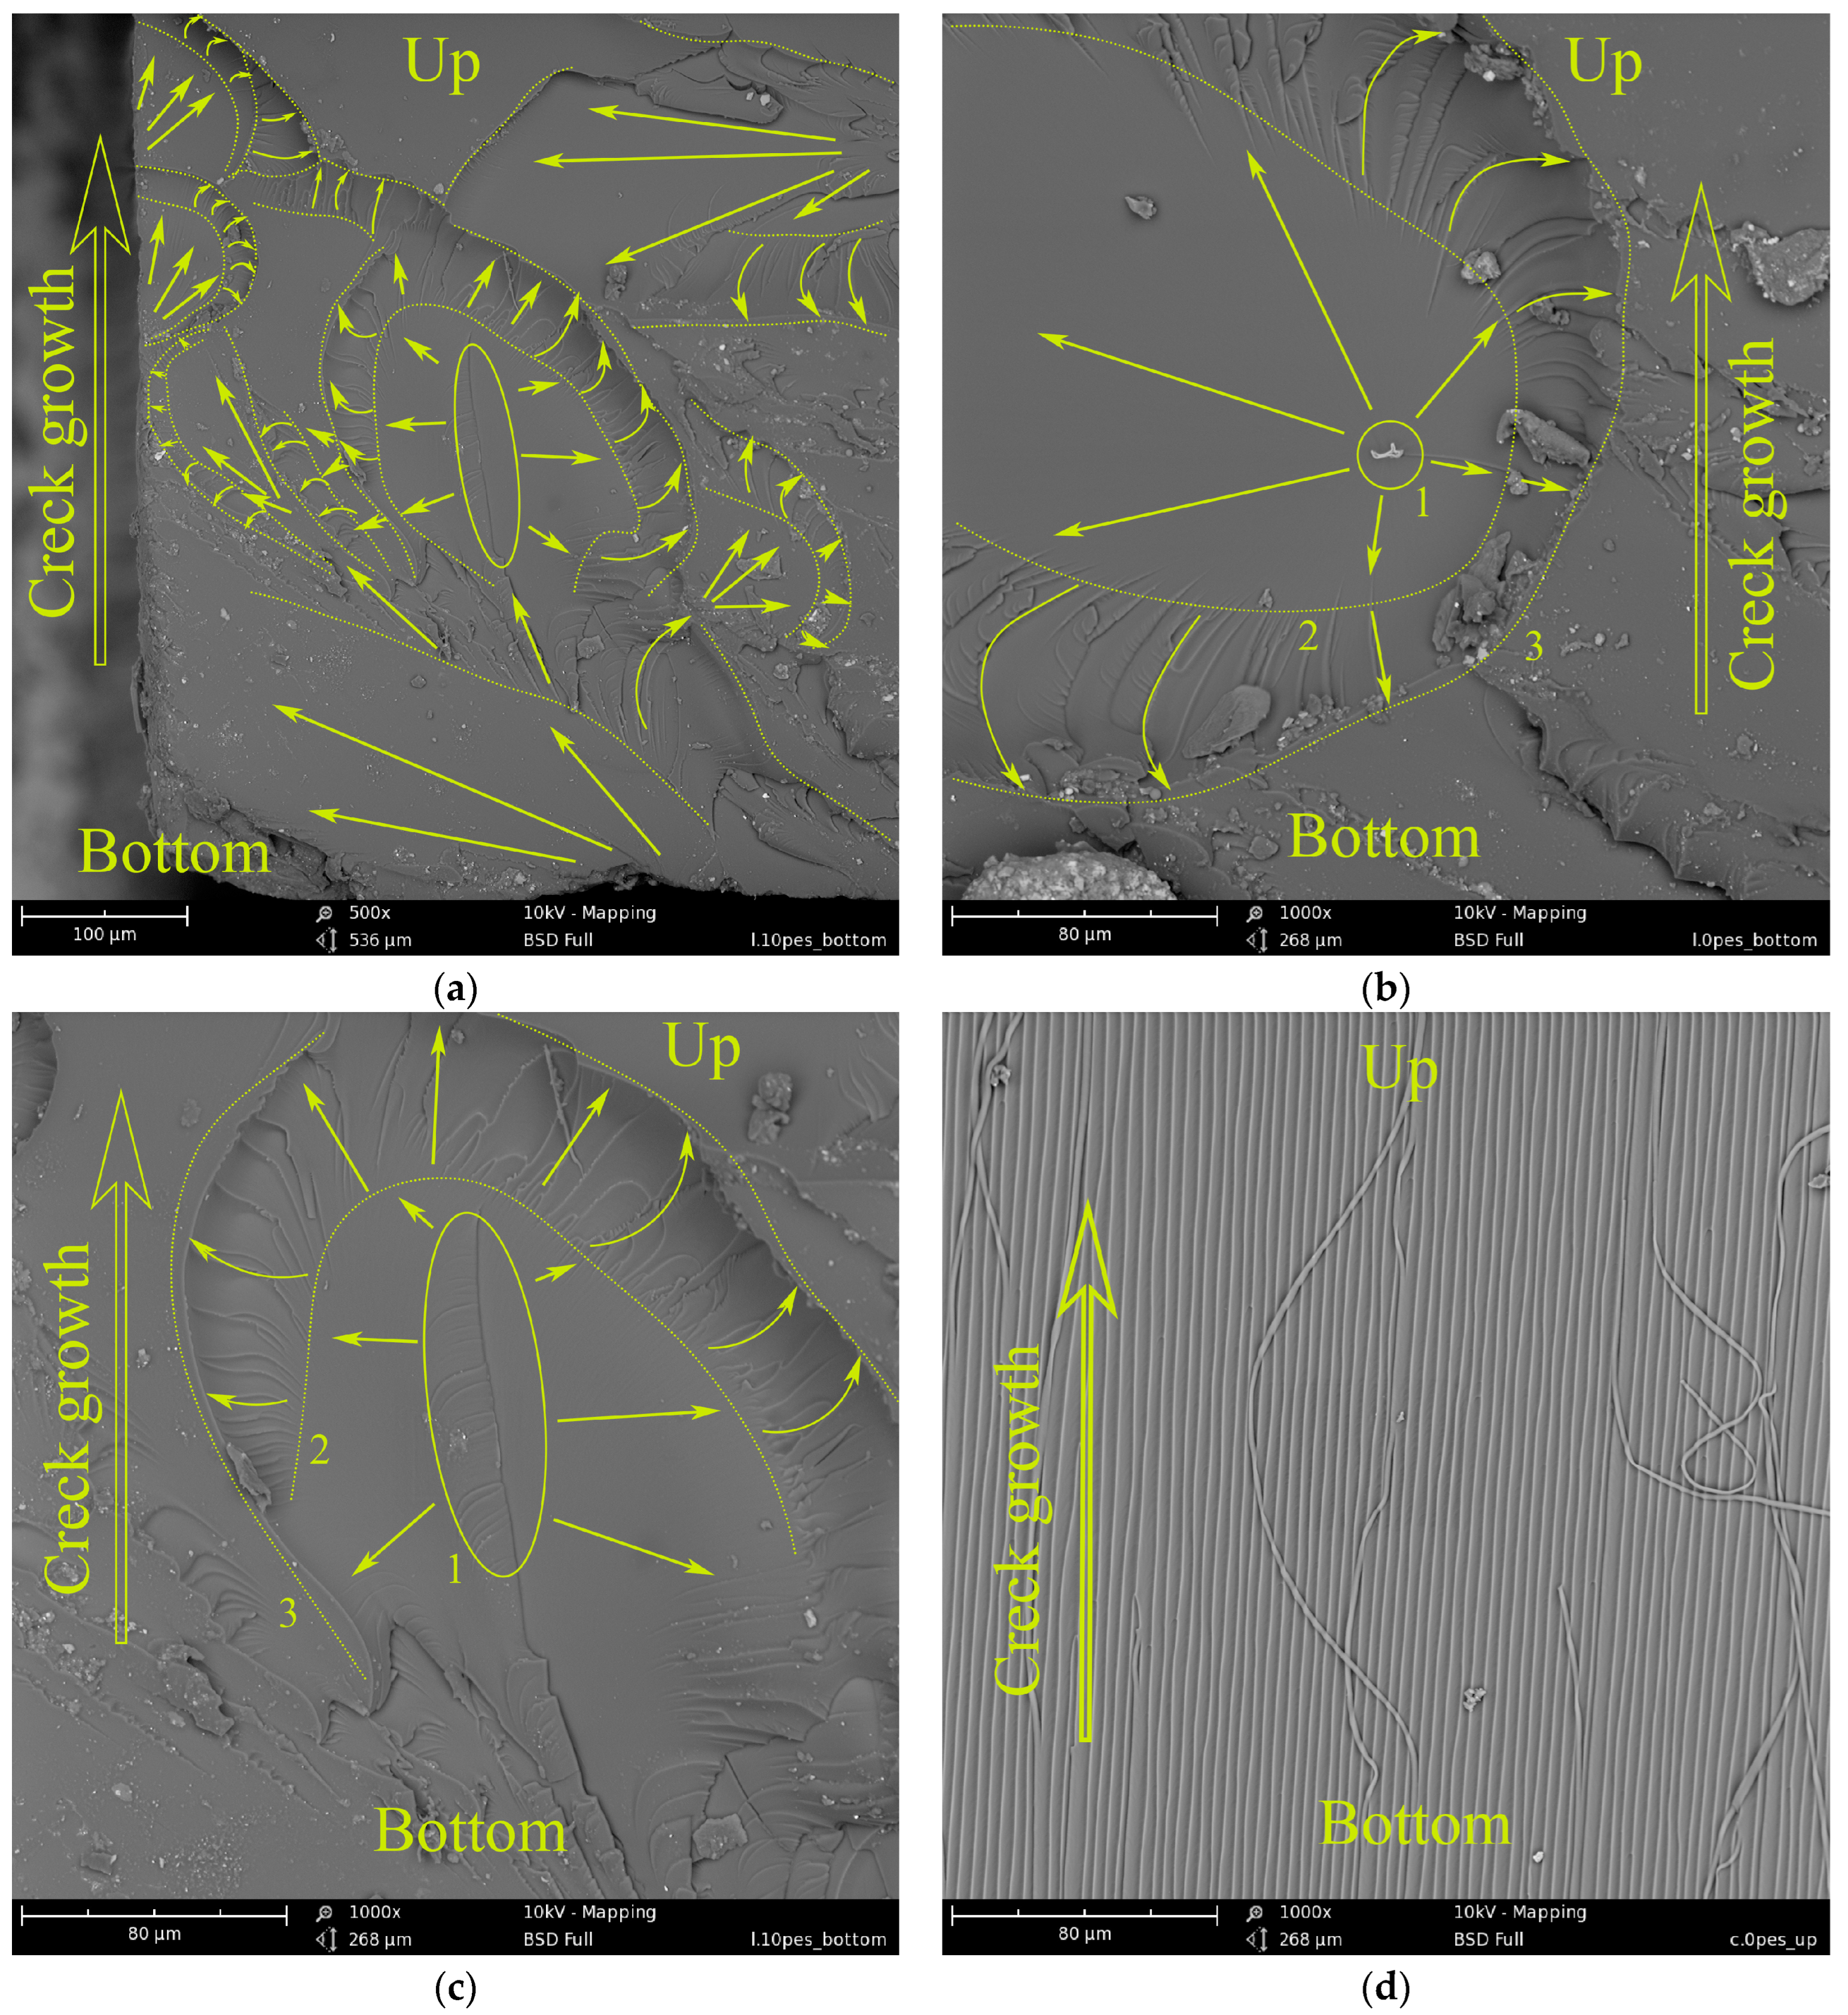
3.1. Matrix Impact Resistance
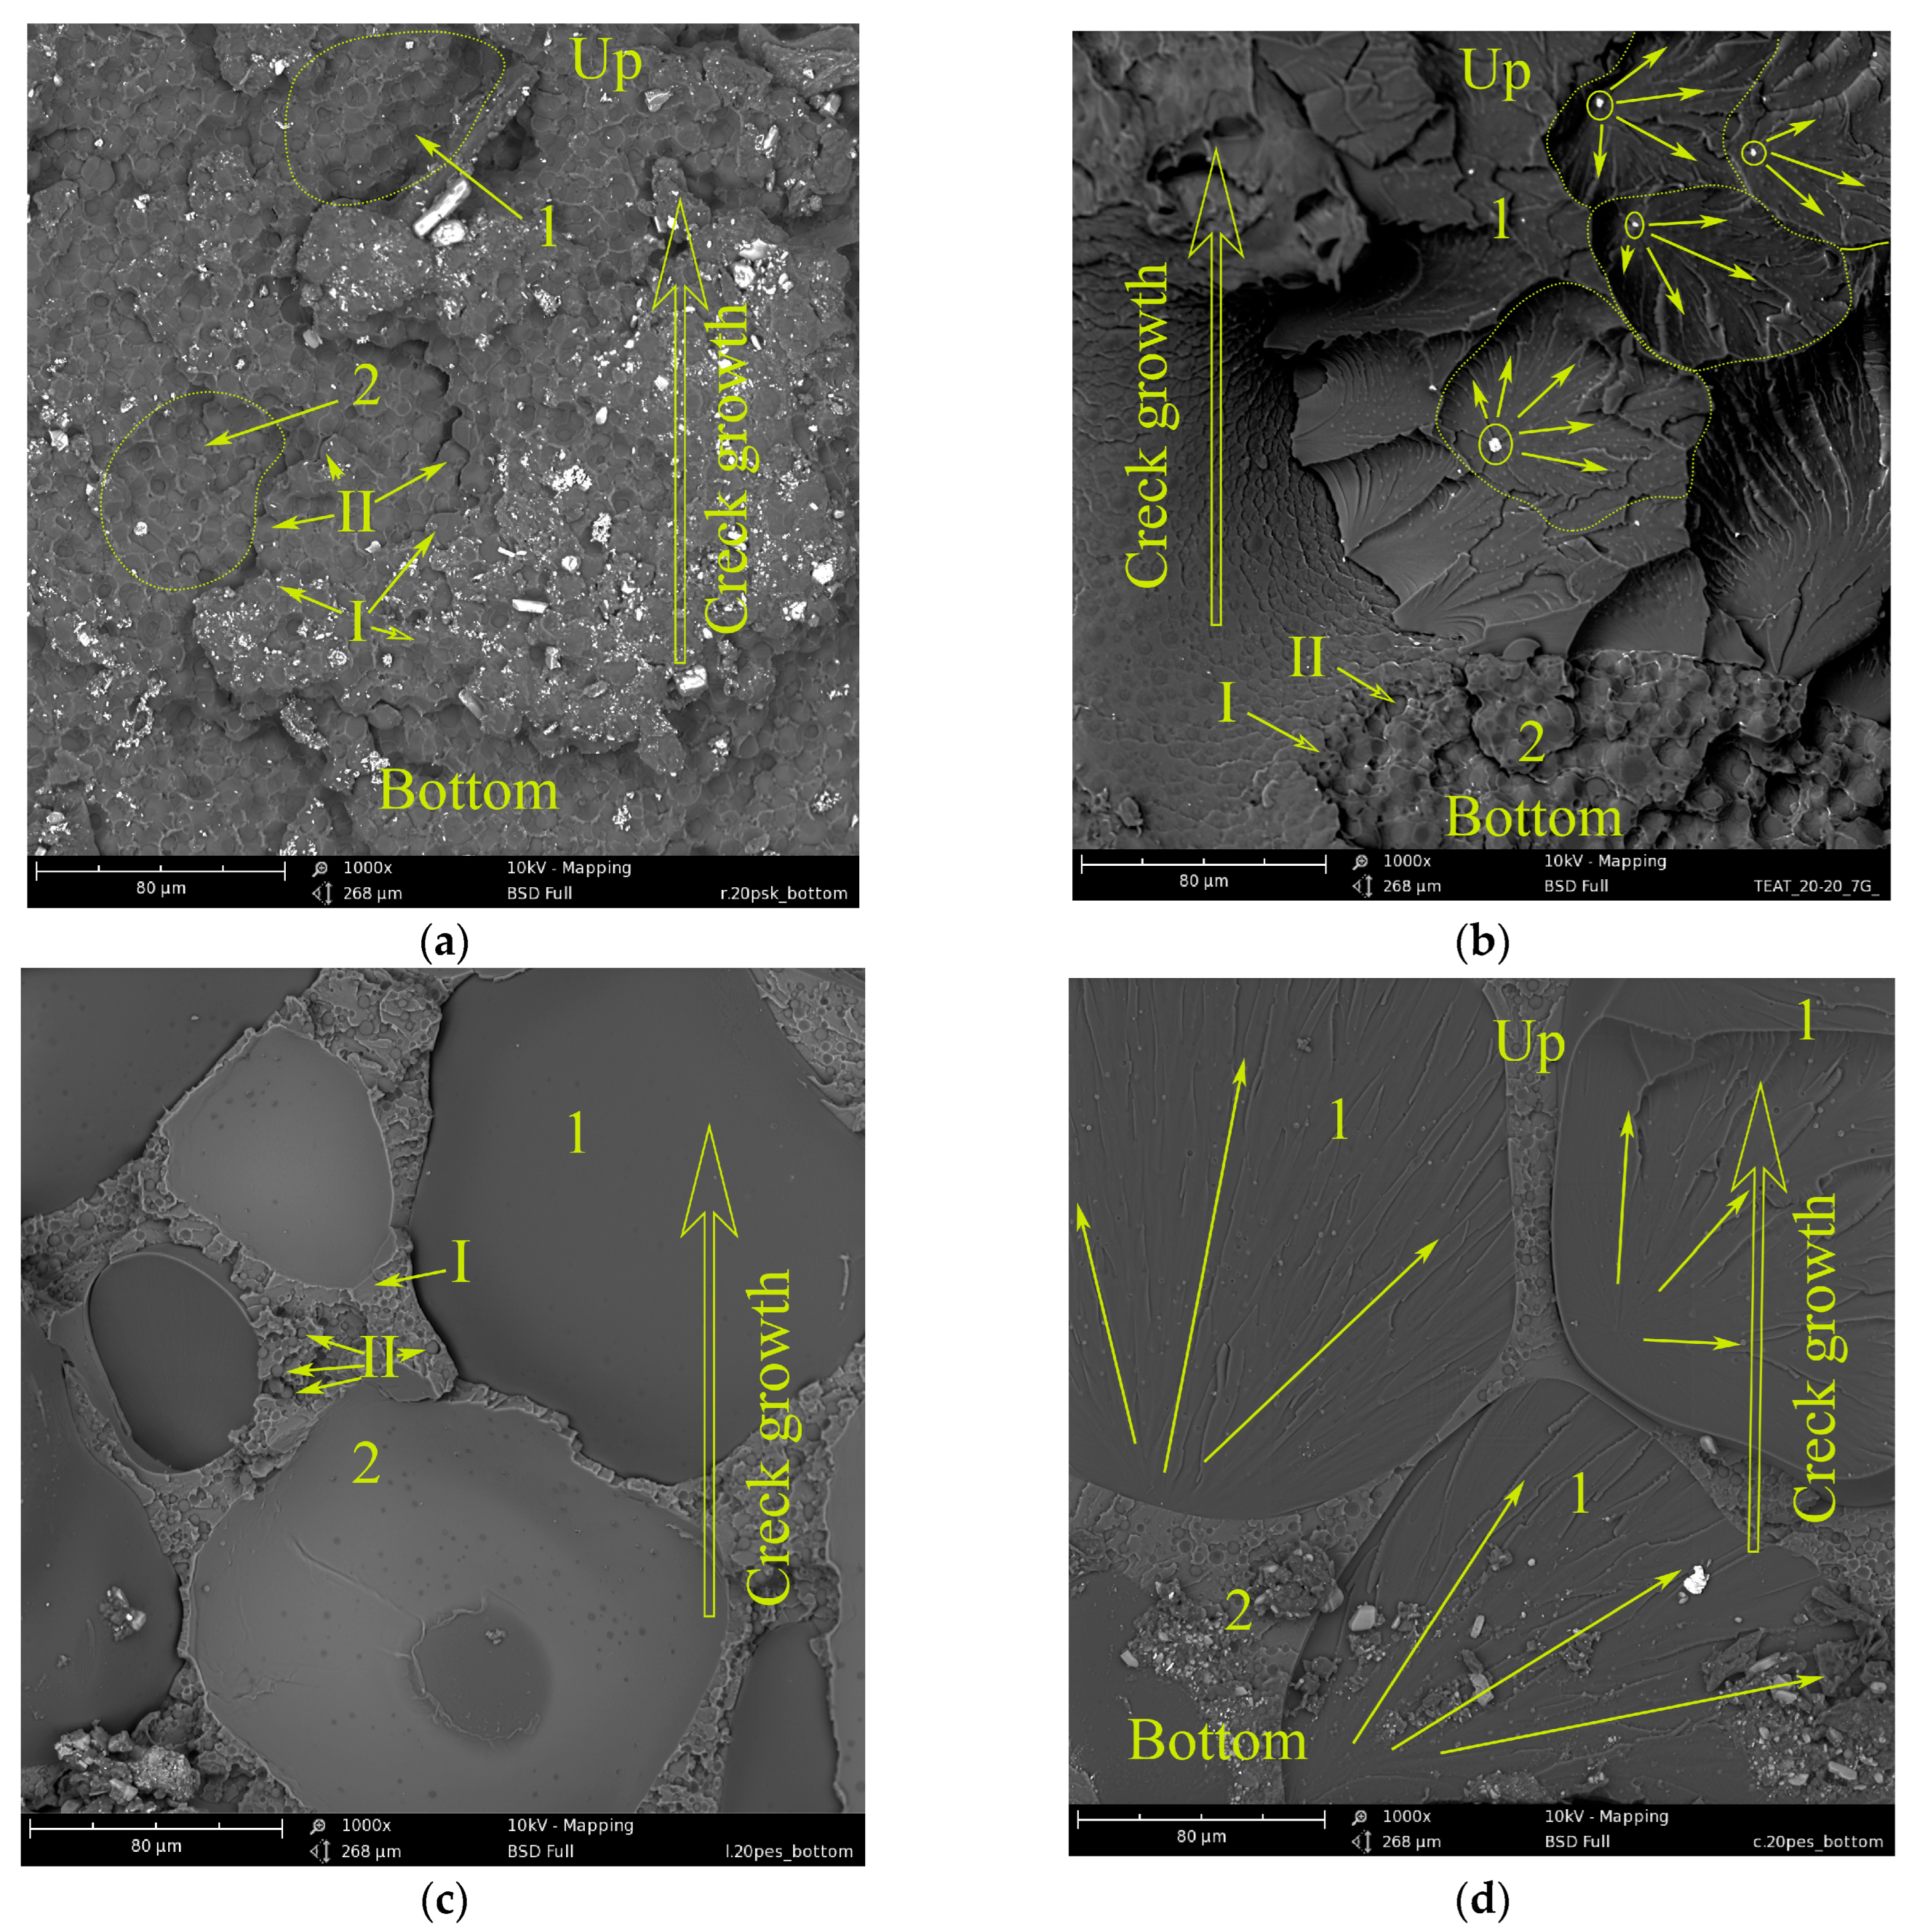
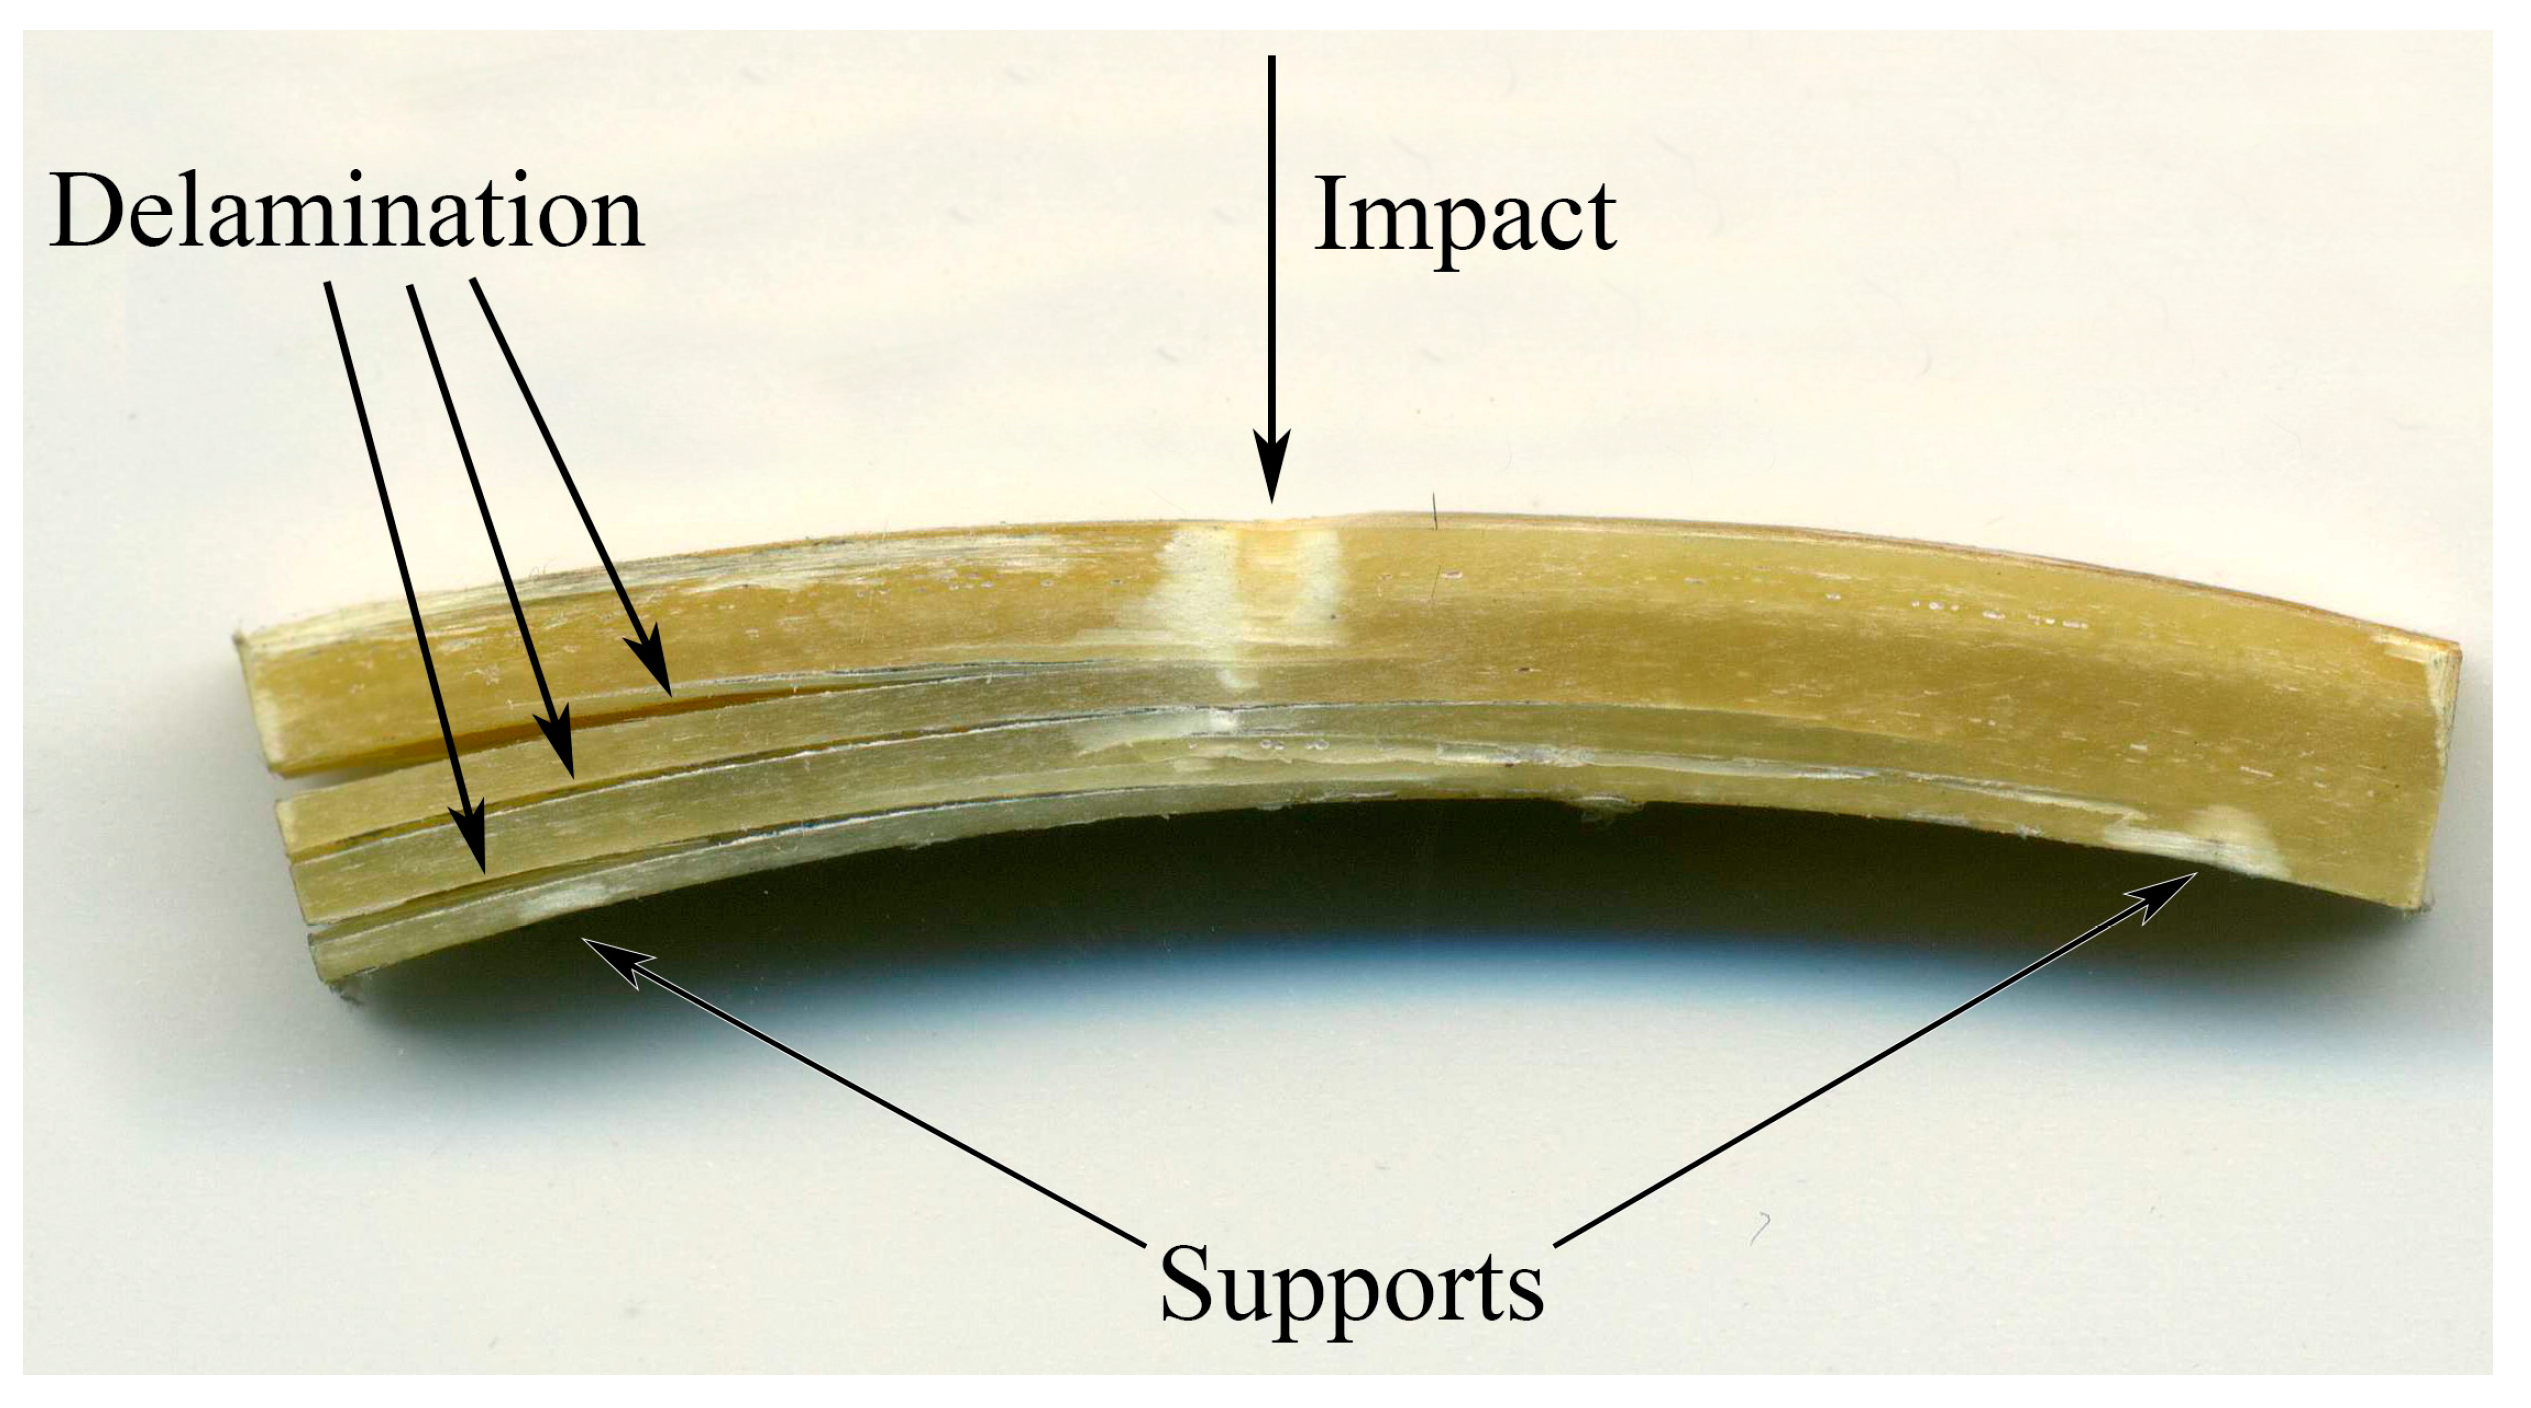
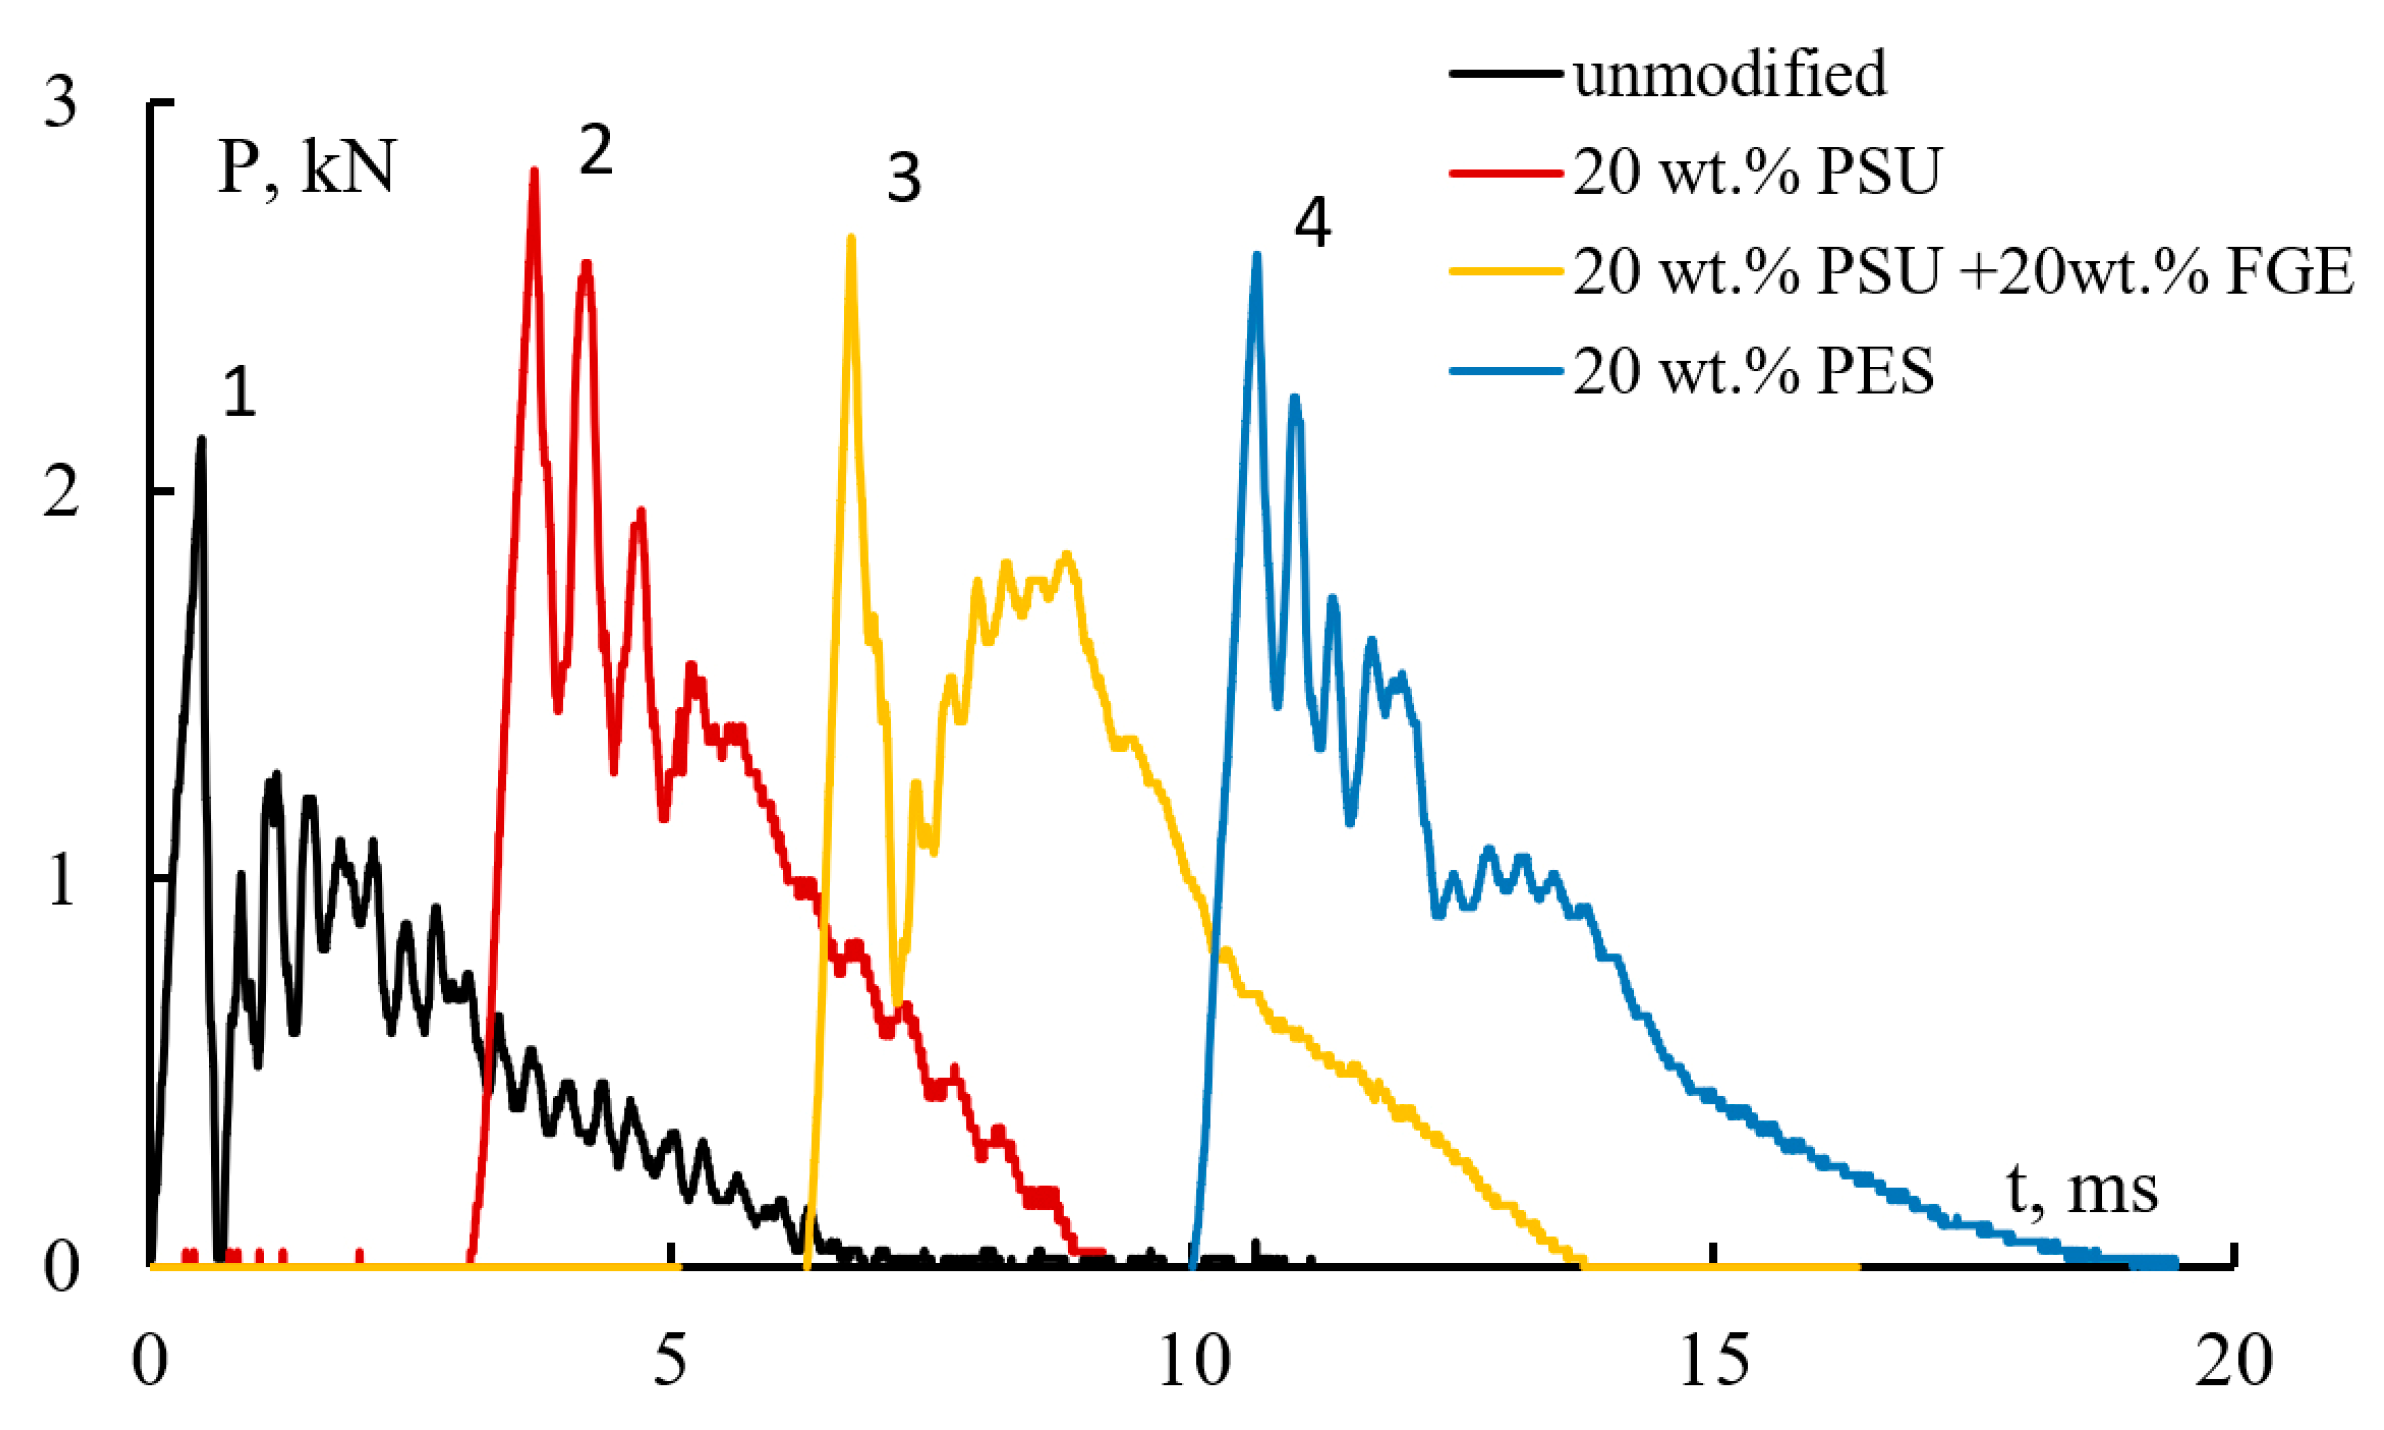
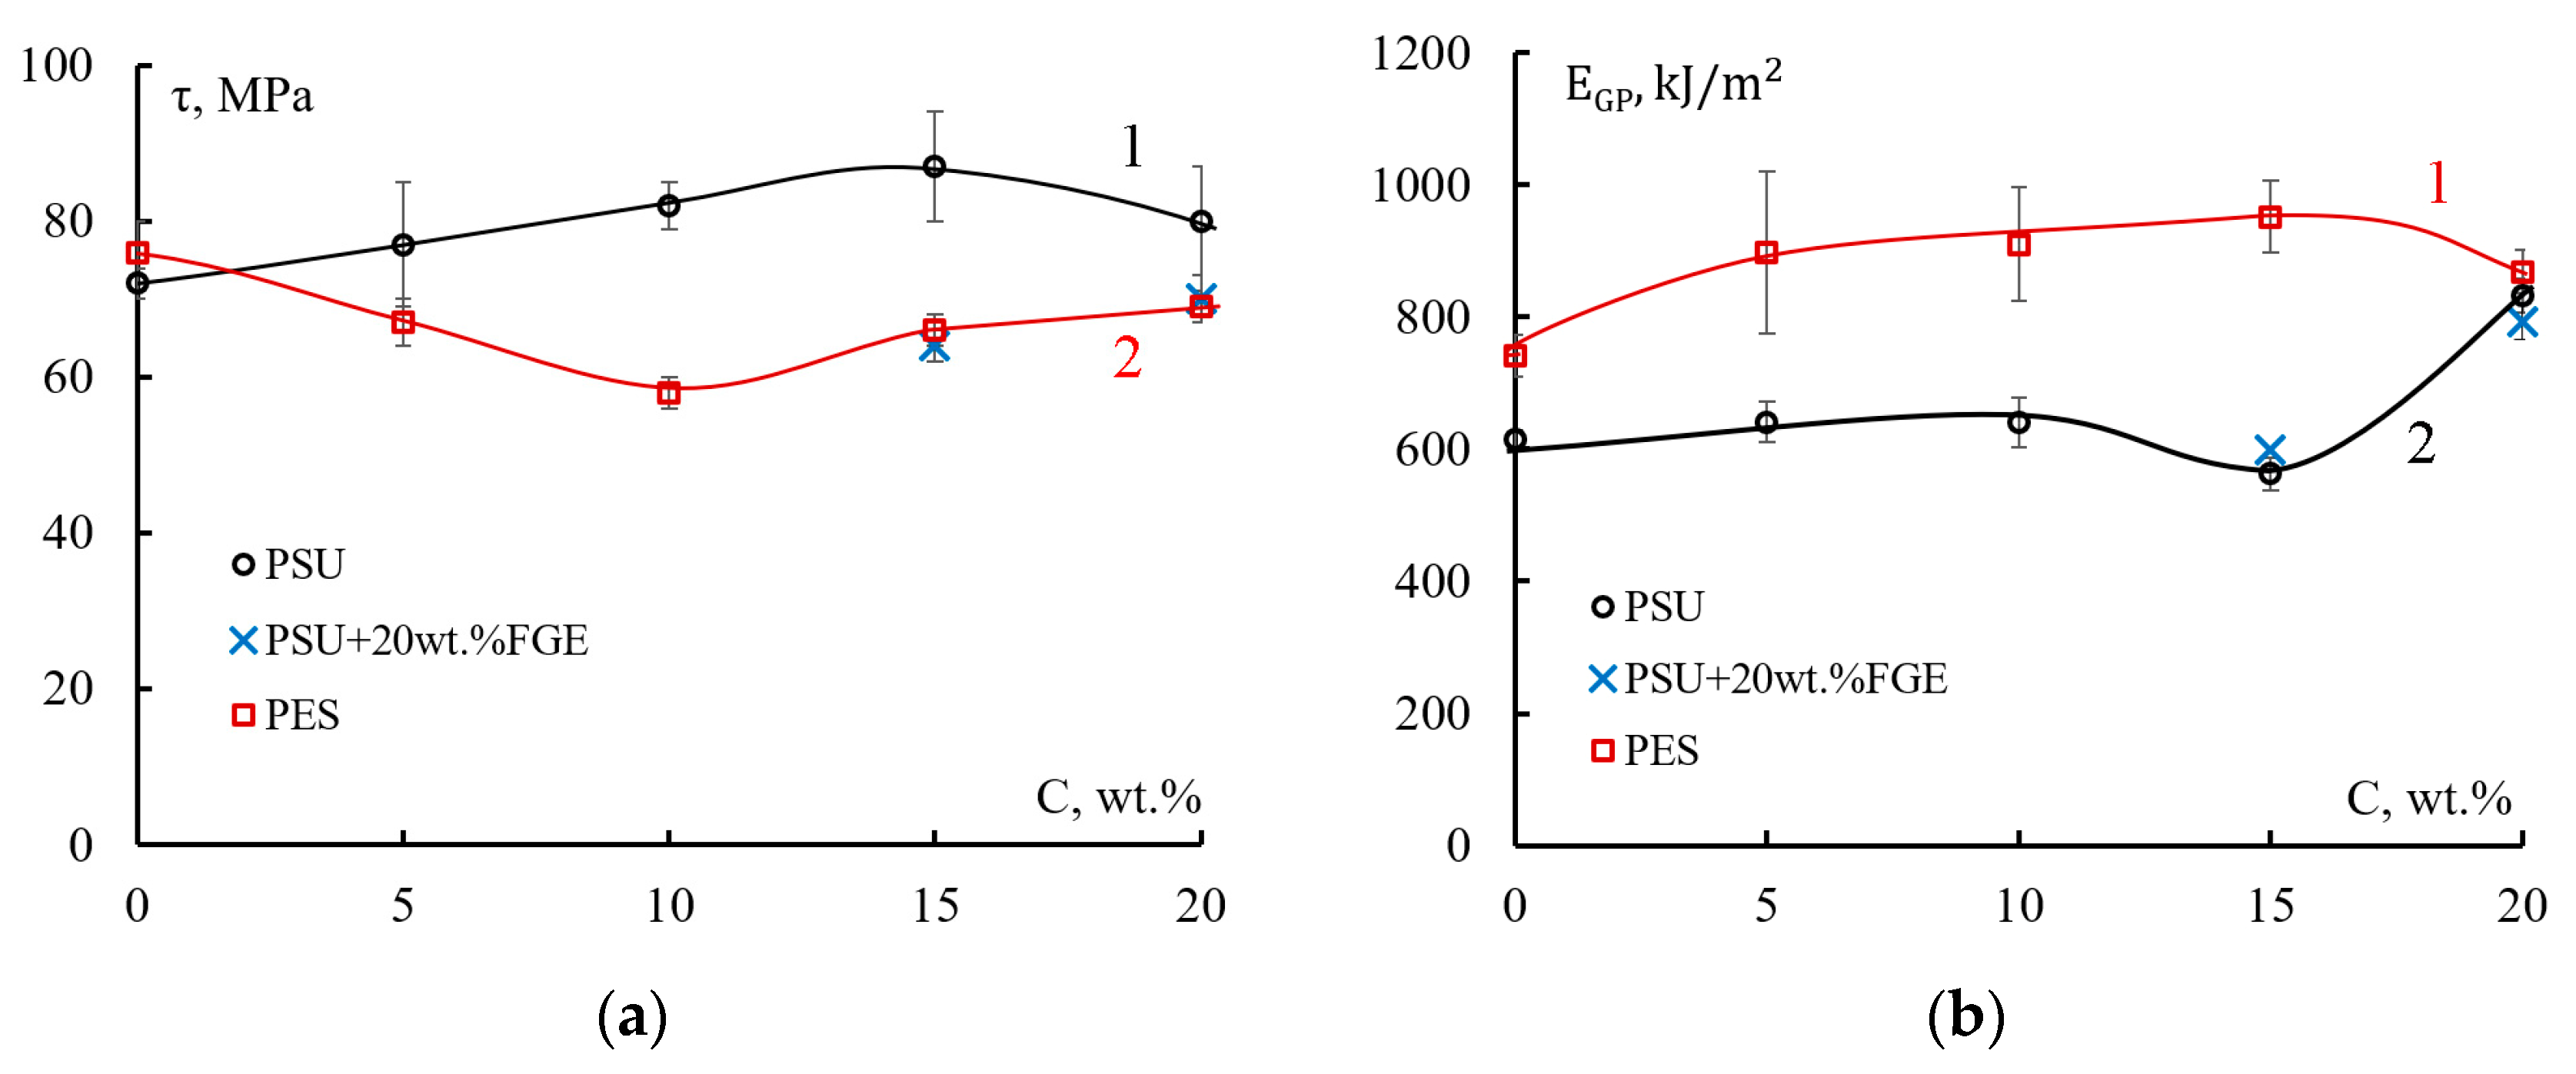
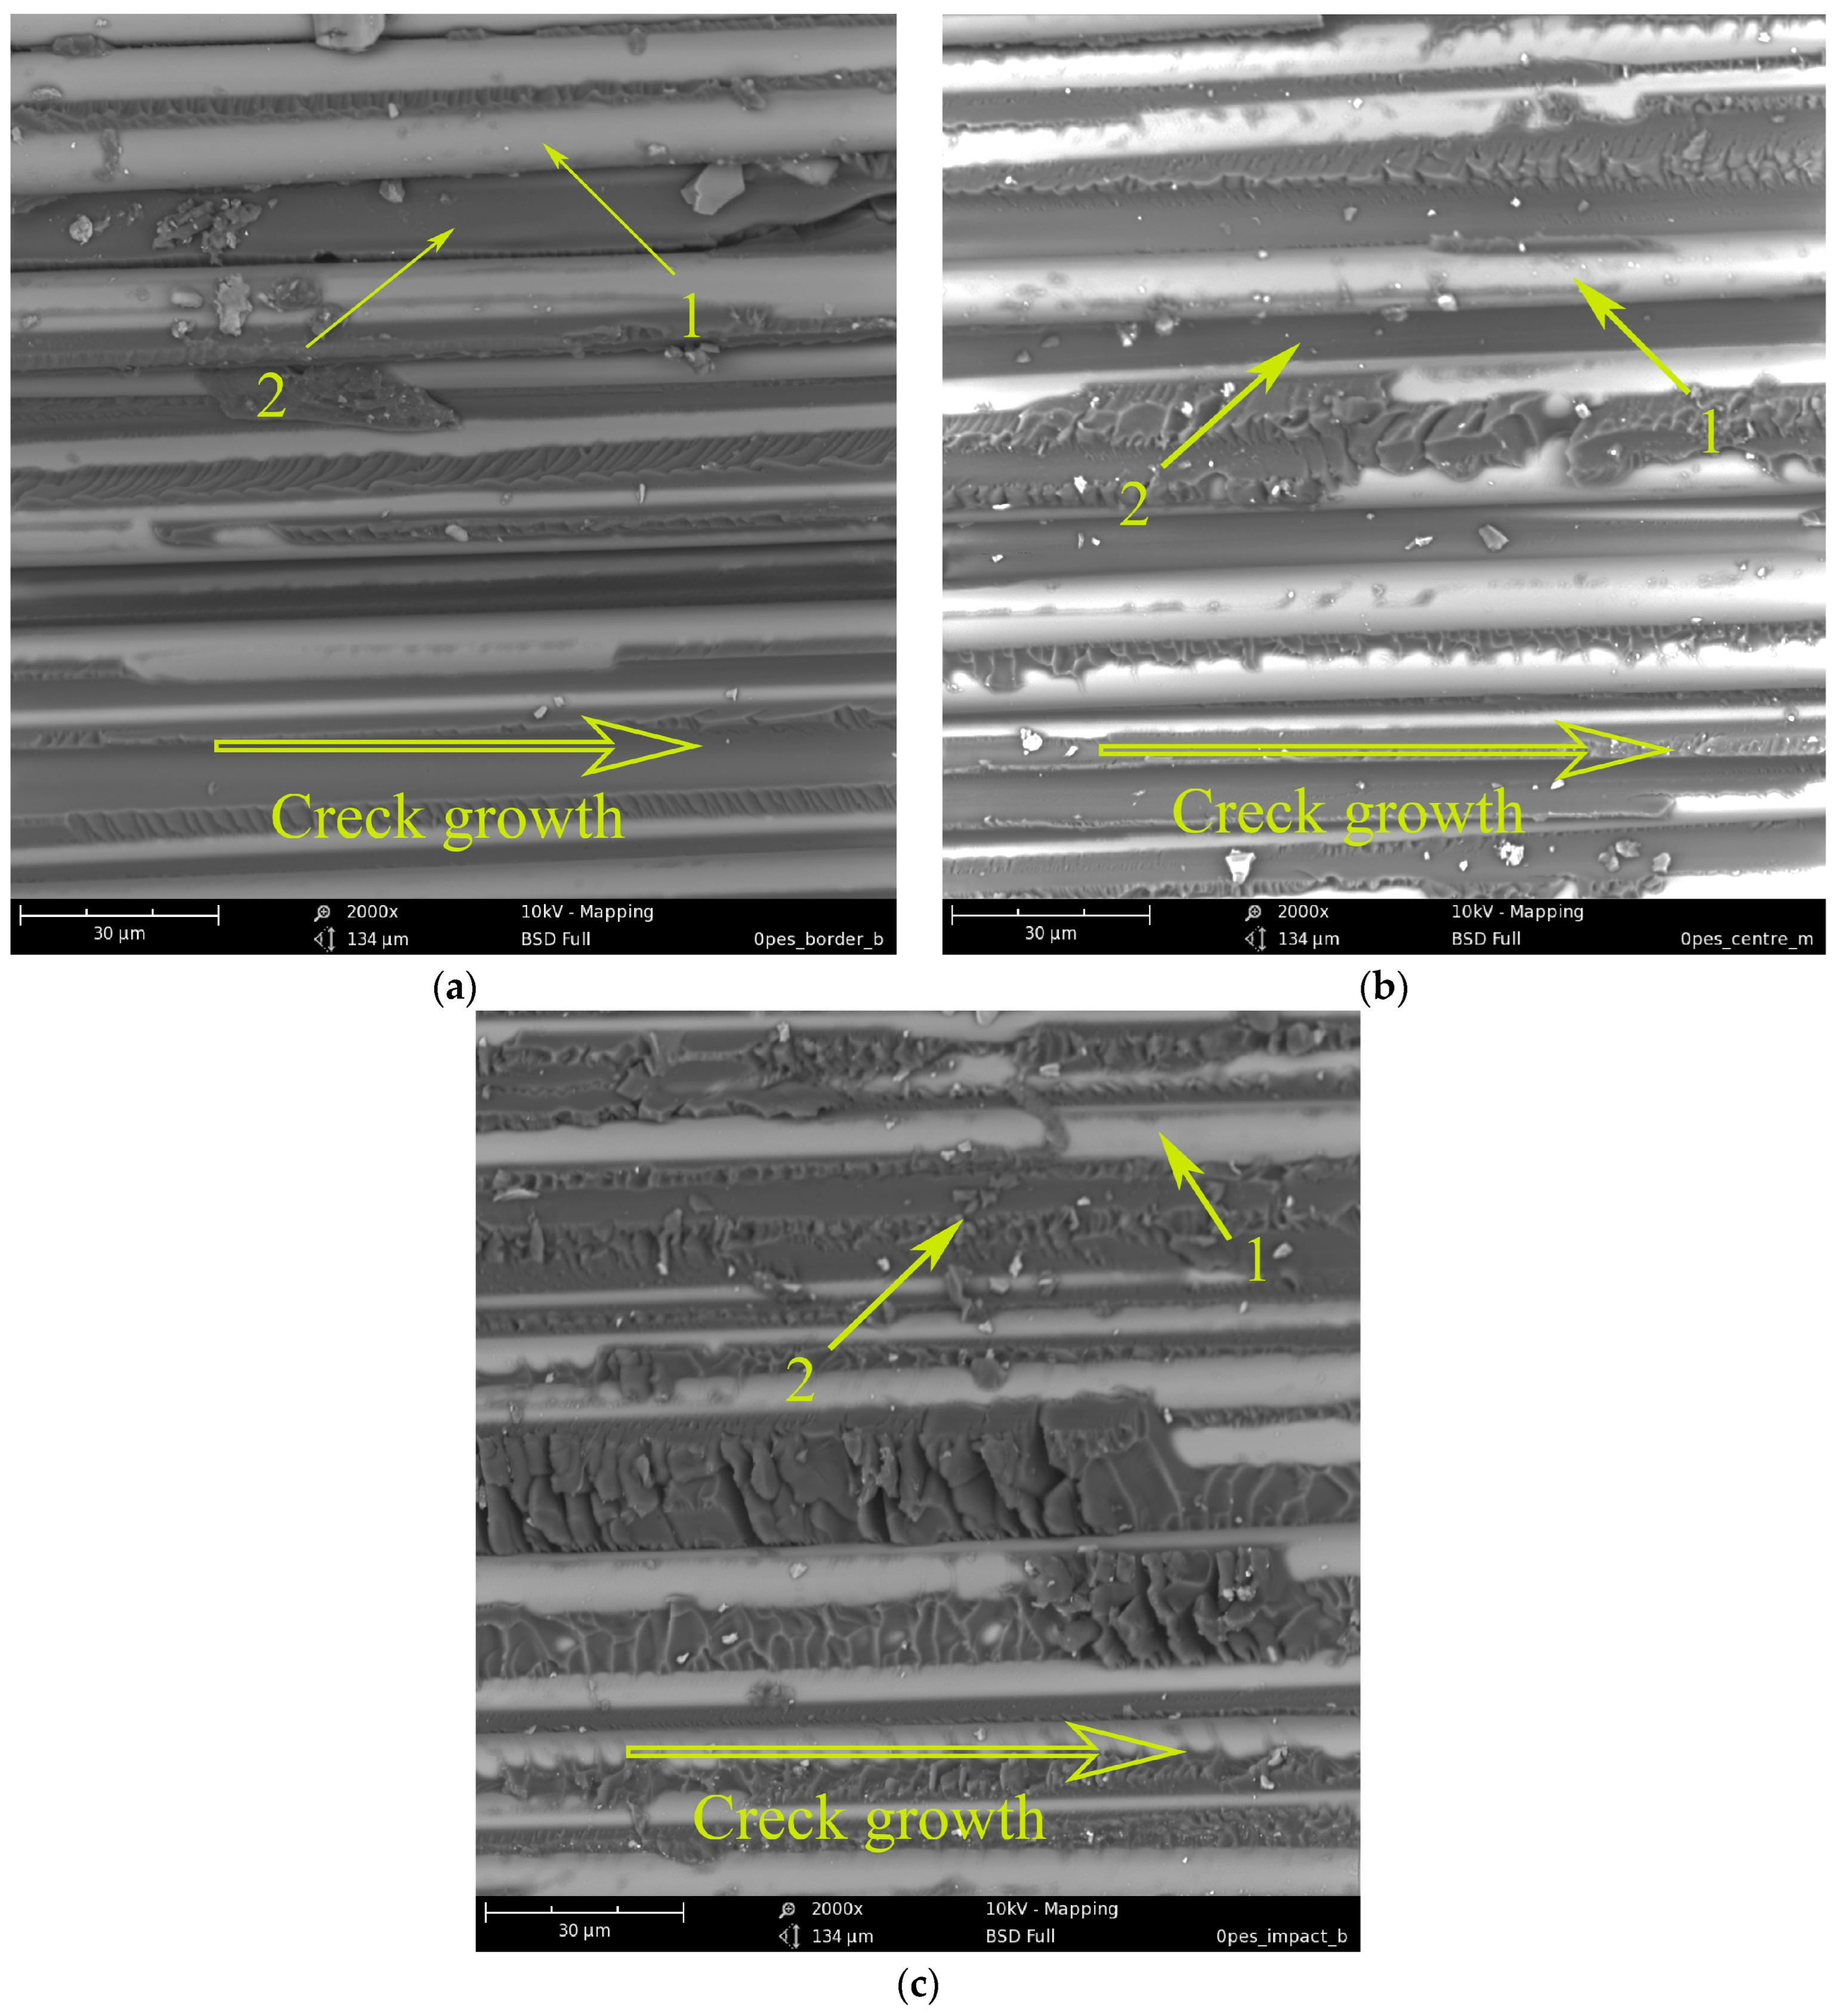
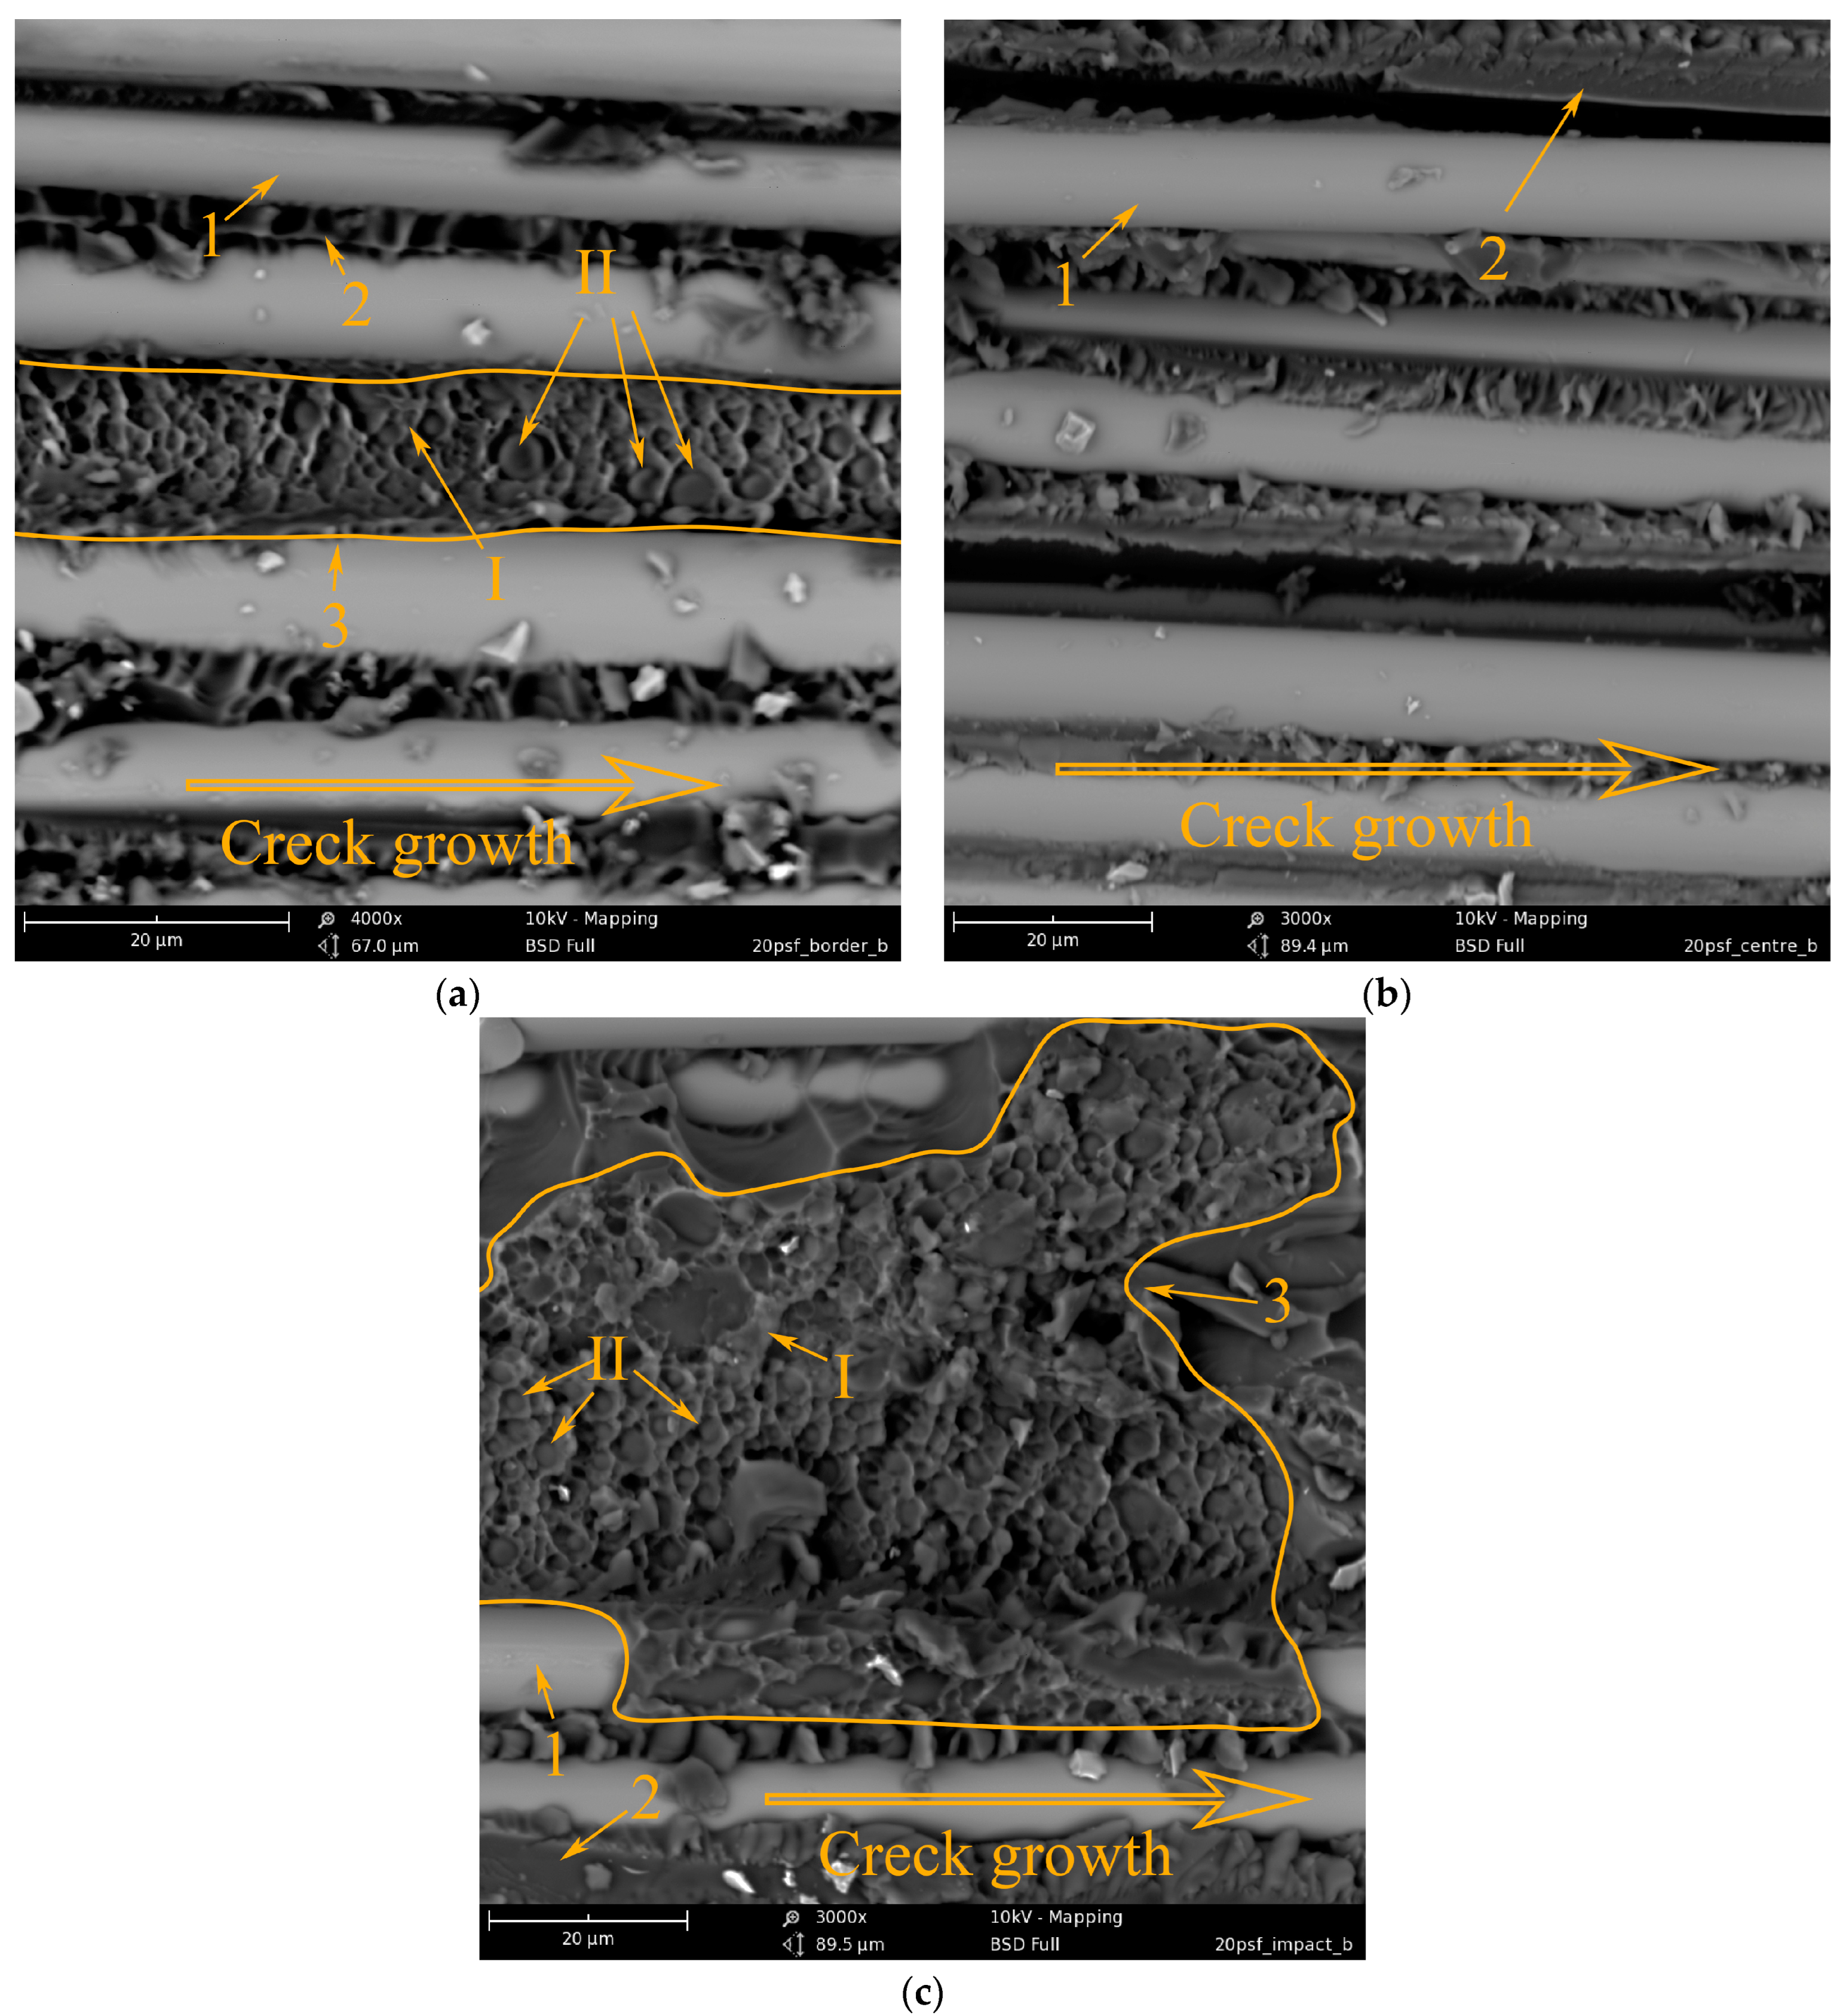
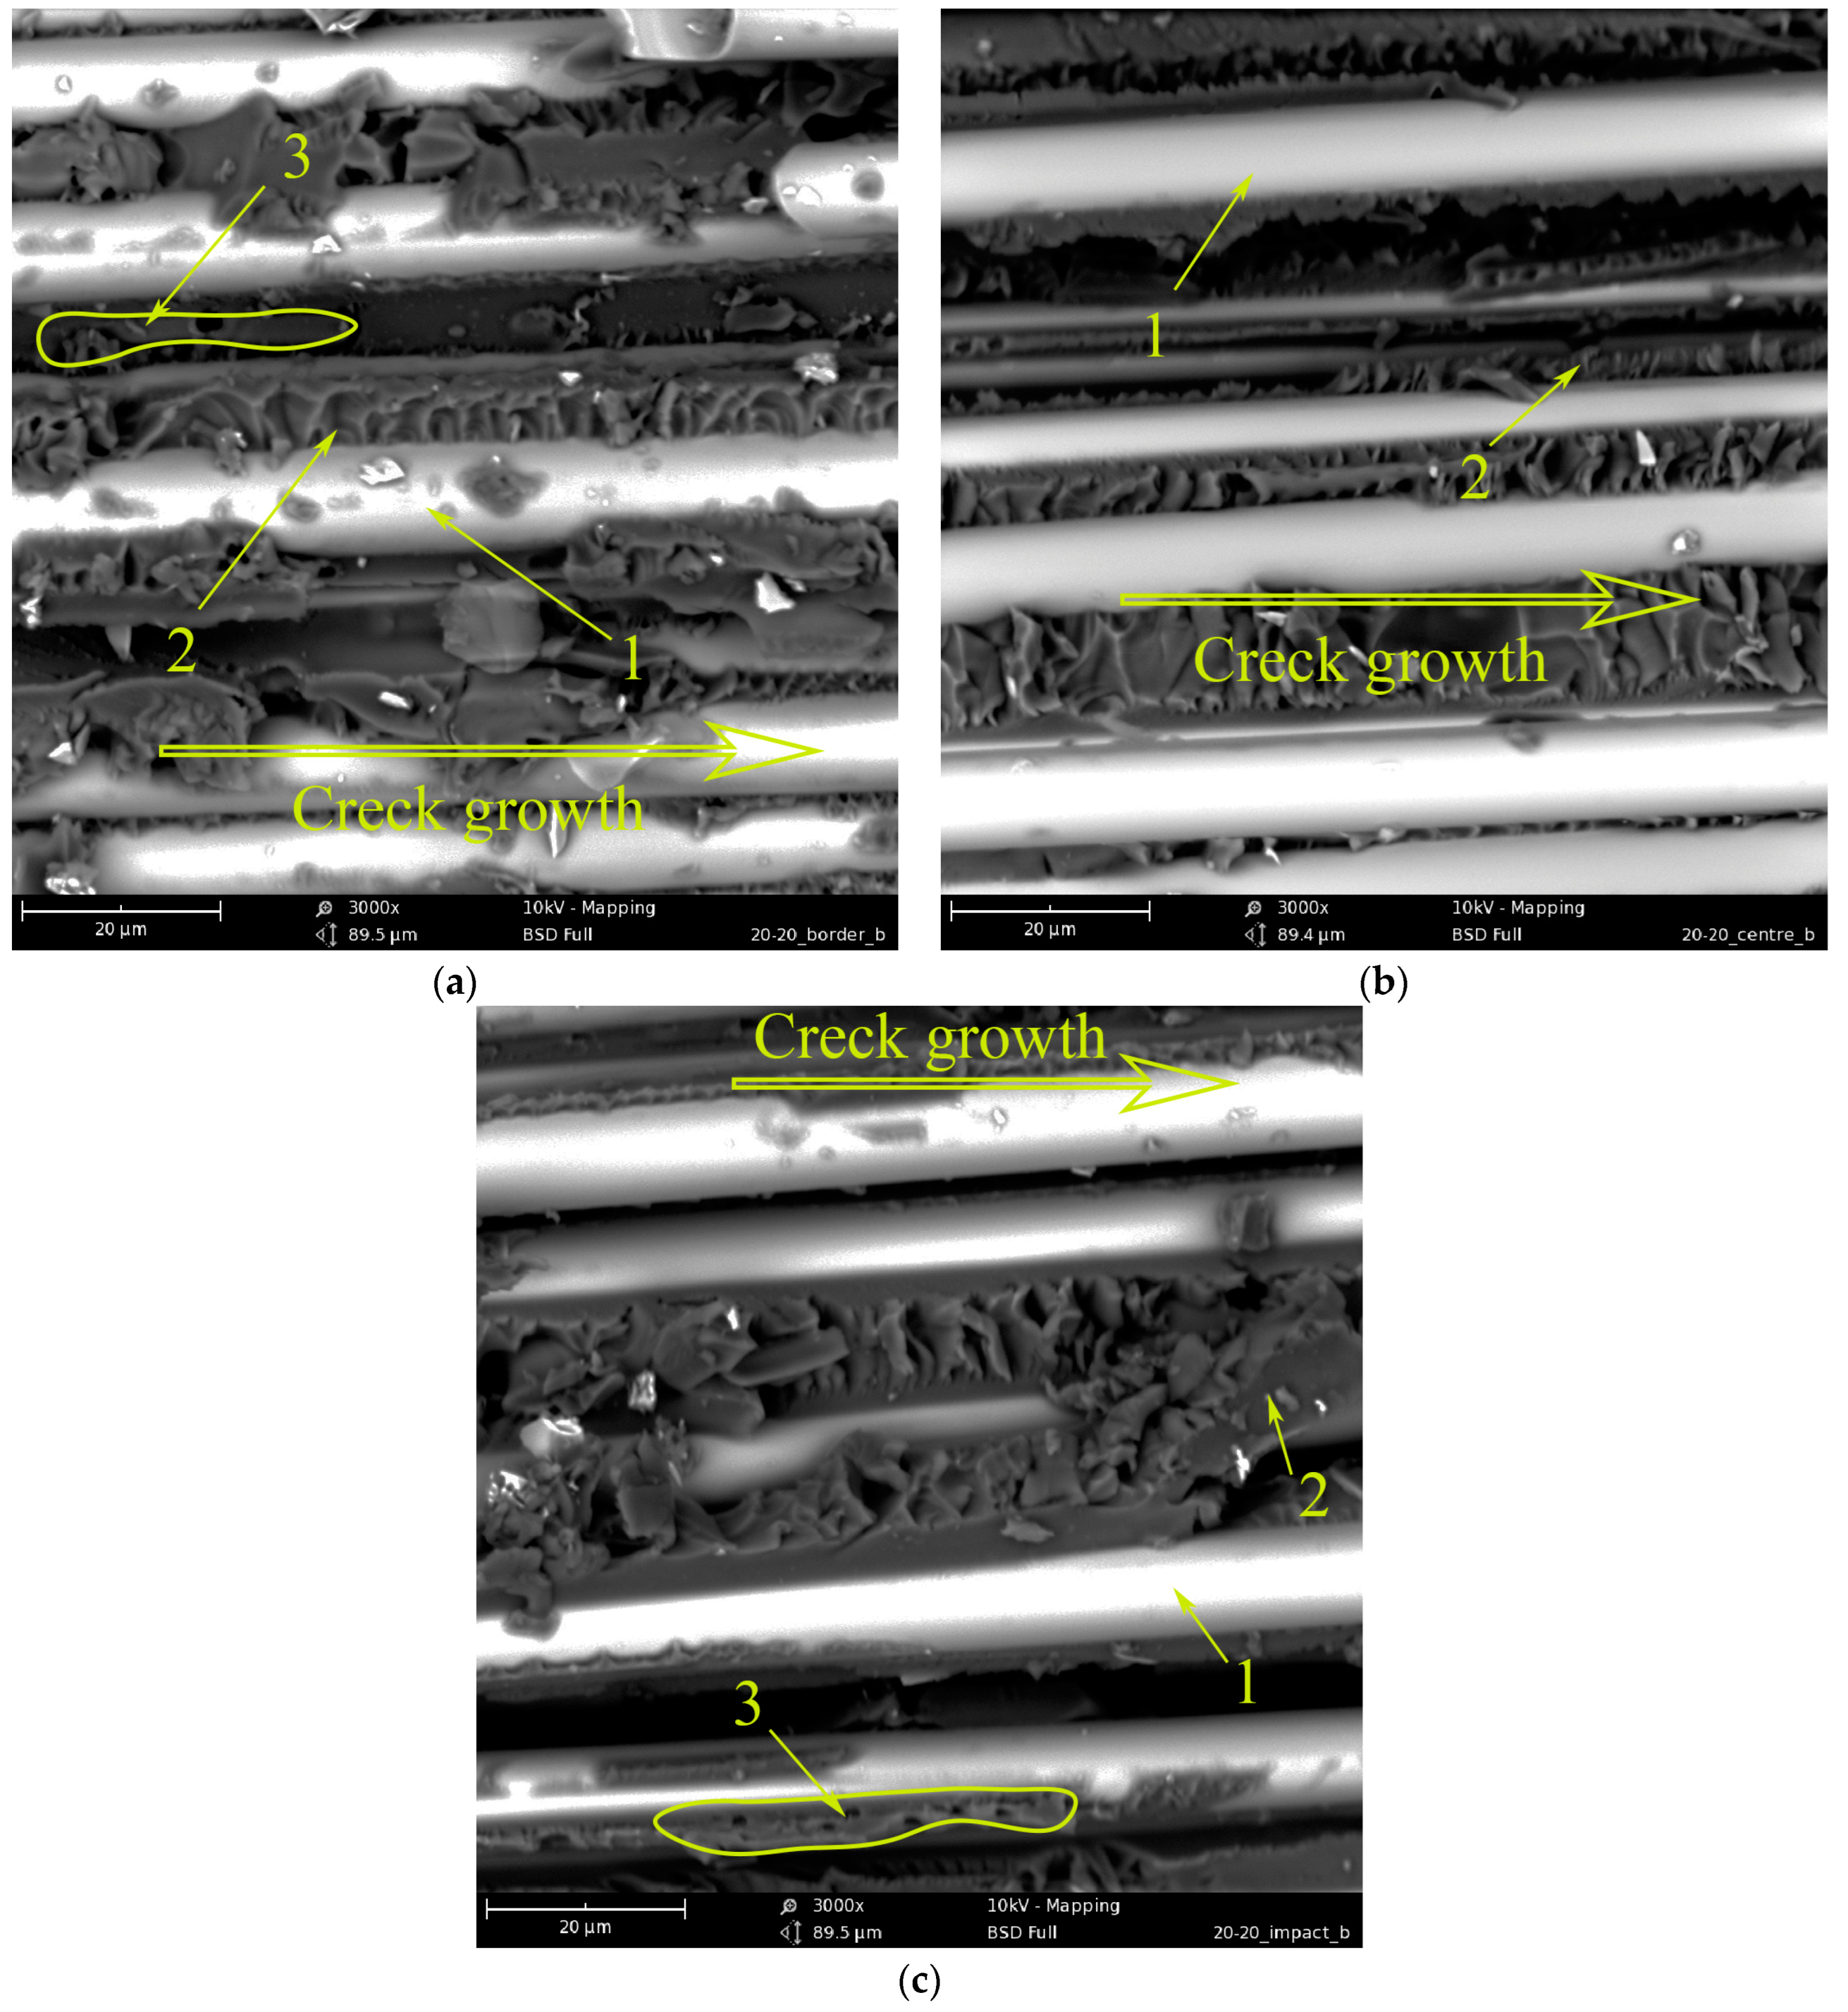
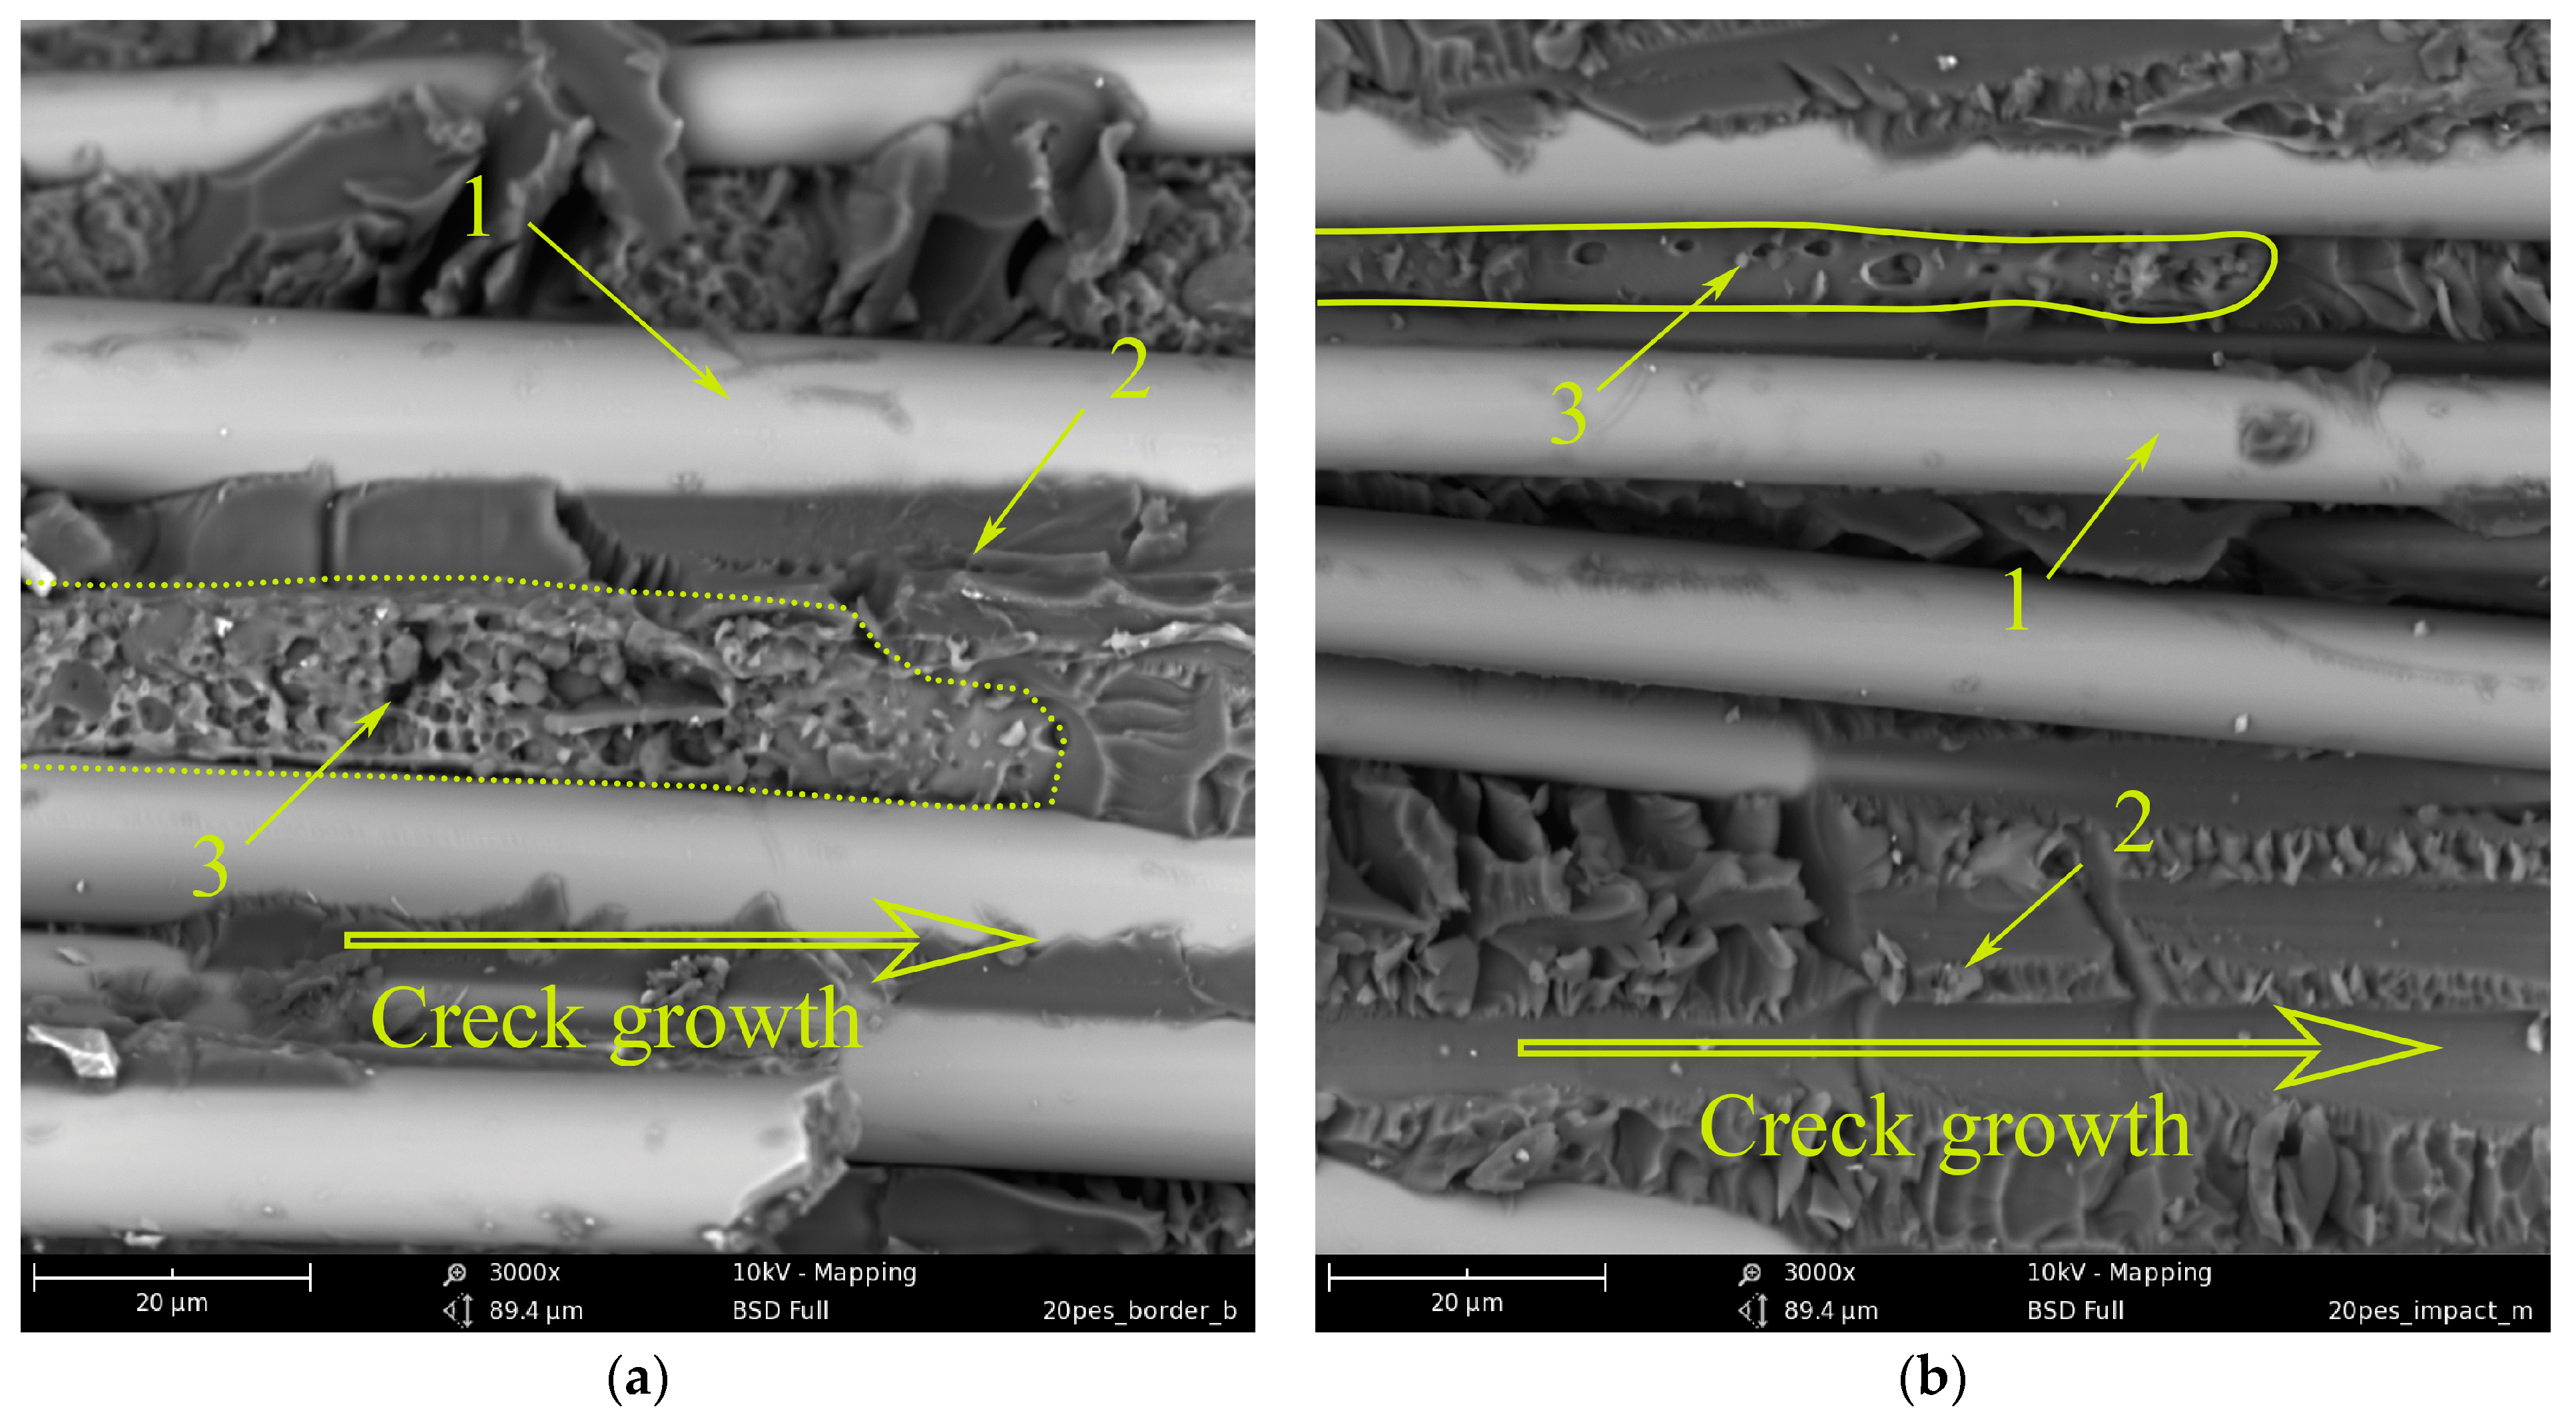
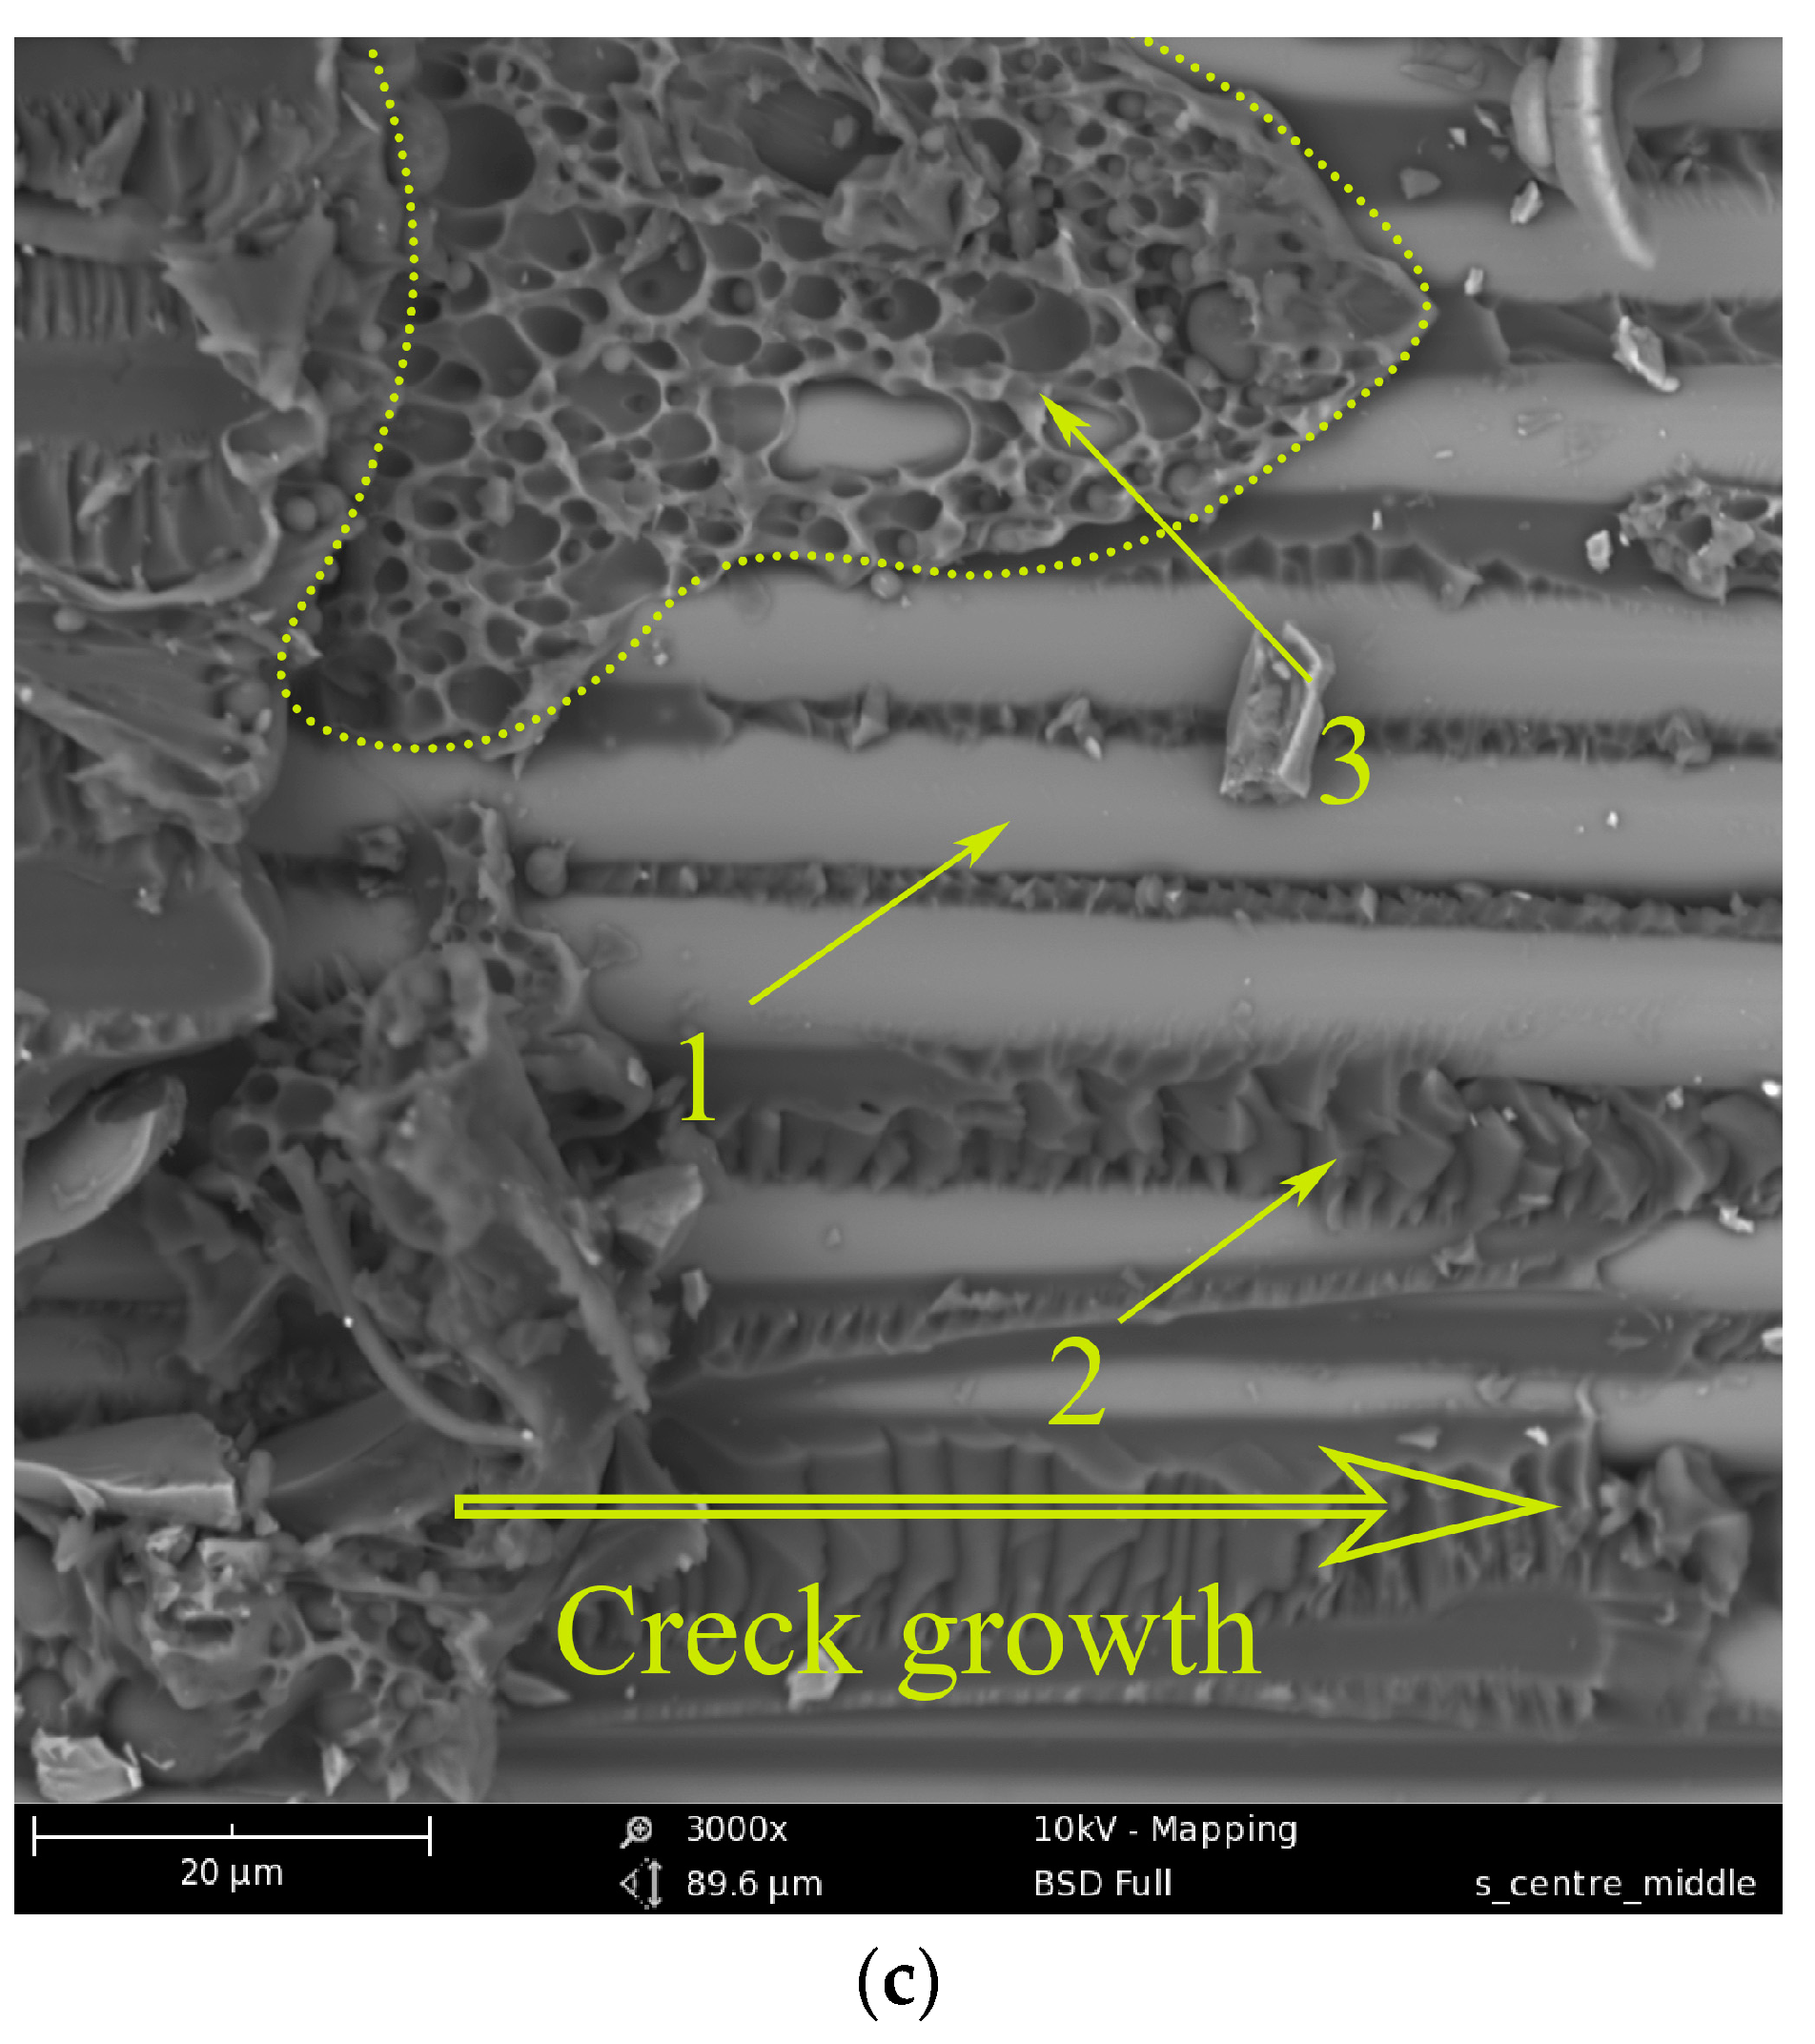
3.2. Impact Resistance of GFRP
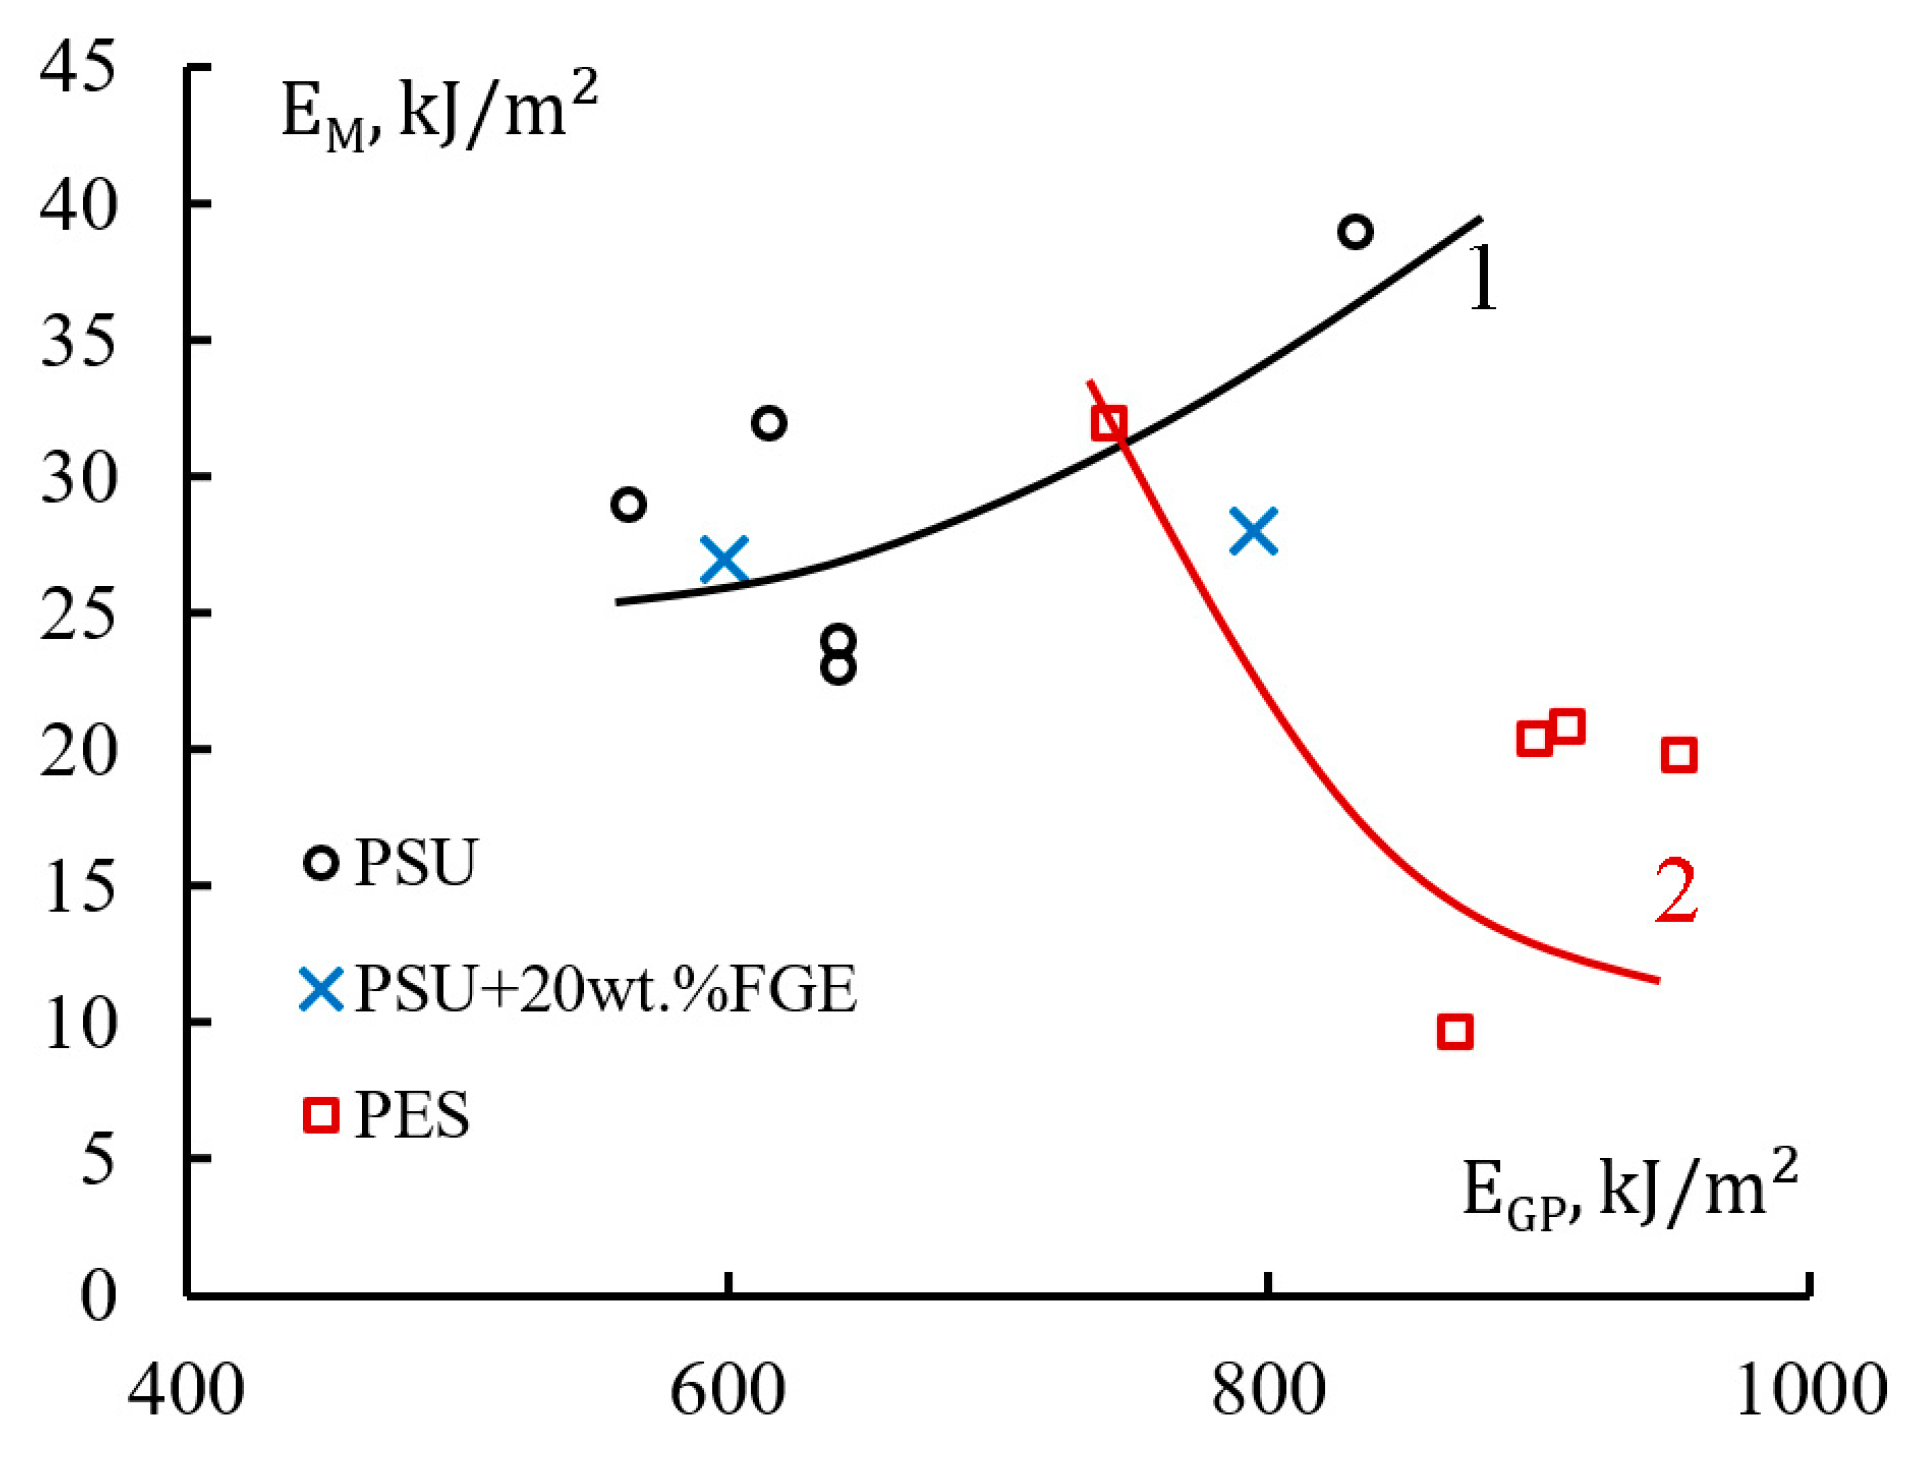
3.3. Energy Correlation
4. Conclusions
Author Contributions
Funding
Institutional Review Board Statement
Data Availability Statement
Conflicts of Interest
References
- Kausar, A.; Ahmad, I.; Eisa, M.H.; Maaza, M. Graphene Nanocomposites in Space Sector—Fundamentals and Advancements. C 2023, 9, 29. [Google Scholar] [CrossRef]
- Guo, R.; Li, C.; Xian, G. Water absorption and long-term thermal and mechanical properties of carbon/glass hybrid rod for bridge cable. Eng. Struct. 2023, 274, 115176. [Google Scholar] [CrossRef]
- Pan, Y.; Yan, D. Study on the durability of GFRP bars and carbon/glass hybrid fiber reinforced polymer (HFRP) bars aged in alkaline solution. Compos. Struct. 2021, 261, 113285. [Google Scholar] [CrossRef]
- Xian, G.; Guo, R.; Li, C.; Hong, B. Mechanical properties of carbon/glass fiber reinforced polymer plates with sandwich structure exposed to freezing-thawing environment: Effects of water immersion, bending loading and fiber hybrid mode. Mech. Adv. Mater. Struct. 2023, 30, 814–834. [Google Scholar] [CrossRef]
- Abdellaoui, H.; Raji, M.; Bouhfid, R.; Qaiss, A.E.K. 2—Investigation of the deformation behavior of epoxy-based composite materials. In Failure Analysis in Biocomposites, Fibre-Reinforced Composites and Hybrid Composites; Jawaid, M., Thariq, M., Saba, N., Eds.; Woodhead Publishing: Cambridge, UK, 2019; pp. 29–49. [Google Scholar]
- Gorbatkina, Y.A.; Ivanova-Mumzhieva, V.G. The Adhesion of Modified Epoxides to Fibers; Cambridge Scholars Publishing: Cambridge, UK, 2022. [Google Scholar]
- Zhou, P.; Tian, J.; Li, C.; Tang, Z. Comparative Study of Durability Behaviors of Thermoplastic Polypropylene and Thermo-setting Epoxy Exposed to Elevated Temperature, Water Immersion and Sustained Bending Loading. Polymers 2022, 14, 2953. [Google Scholar] [CrossRef]
- Lukashov, N.I.; Korokhin, R.A.; Gorbunova, I.Y.; Kireinov, A.V.; Vyatkina, M.A.; Tret’yakov, I.V. The Effect of UV Radiation on Physicochemical Properties of Winding Epoxy Glass Fiber Reinforced Plastics. Polym. Sci. Ser. D 2022, 15, 183–187. [Google Scholar] [CrossRef]
- Zhou, J.L.; Zhu, S.; Jia, W.P.; Cheng, C.; Hassan, E.A.; Yu, M.H. Curing Process and Heat-Resistance of Polyethersulfone Toughened Epoxy Resins. Mater. Sci. Forum 2017, 898, 2302–2308. [Google Scholar] [CrossRef]
- Sasidharan, S.; Anand, A. Epoxy-Based Hybrid Structural Composites with Nanofillers: A Review. Ind. Eng. Chem. Res. 2020, 59, 12617–12631. [Google Scholar] [CrossRef]
- Balguri, P.K.; Samuel, D.H.; Thumu, U. A review on mechanical properties of epoxy nanocomposites. Mater. Today Proc. 2021, 44, 346–355. [Google Scholar] [CrossRef]
- Medina, R.; Haupert, F.; Schlarb, A.K. Improvement of tensile properties and toughness of an epoxy resin by nanozirco-nium-dioxide reinforcement. J. Mater. Sci. 2008, 43, 3245–3252. [Google Scholar] [CrossRef]
- Ren, X.; Tu, Z.; Wang, J.; Jiang, T.; Yang, Y.; Shi, D.; Mai, Y.-W.; Shi, H.; Luan, S.; Hu, G.-H. Critical rubber layer thickness of core-shell particles with a rigid core and a soft shell for toughening of epoxy resins without loss of elastic modulus and strength. Compos. Sci. Technol. 2017, 153, 253–260. [Google Scholar] [CrossRef]
- Yu, W.; Fu, J.; Dong, X.; Chen, L.; Jia, H.; Shi, L. Highly Populated and Nearly Monodispersed Nanosilica Particles in an Organic Medium and Their Epoxy Nanocomposites. ACS Appl. Mater. Interfaces 2013, 5, 8897–8906. [Google Scholar] [CrossRef] [PubMed]
- Matykiewicz, D. Hybrid Epoxy Composites with Both Powder and Fiber Filler: A Review of Mechanical and Thermome-chanical Properties. Materials 2020, 13, 1802. [Google Scholar] [CrossRef] [PubMed] [Green Version]
- Van Velthem, P.; Gabriel, S.; Pardoen, T.; Bailly, C.; Ballout, W. Synergy between Phenoxy and CSR Tougheners on the Fracture Toughness of Highly Cross-Linked Epoxy-Based Composites. Polymers 2021, 13, 2477. [Google Scholar] [CrossRef]
- Mostovoy, A.; Shcherbakov, A.; Yakovlev, A.; Arzamastsev, S.; Lopukhova, M. Reinforced Epoxy Composites Modified with Functionalized Graphene Oxide. Polymers 2022, 14, 338. [Google Scholar] [CrossRef]
- Mohd Nurazzi, N.; Muhammad Asyraf, M.R.; Khalina, A.; Abdullah, N.; Sabaruddin, F.A.; Kamarudin, S.H.; Ahmad, S.; Mahat, A.M.; Lee, C.L.; Aisyah, H.A.; et al. Fabrication, Functionalization, and Application of Carbon Nanotube-Reinforced Polymer Composite: An Overview. Polymers 2021, 13, 1047. [Google Scholar] [CrossRef] [PubMed]
- Mostovoy, A.; Yakovlev, A.; Tseluikin, V.; Lopukhova, M. Epoxy Nanocomposites Reinforced with Functionalized Carbon Nanotubes. Polymers 2020, 12, 1816. [Google Scholar] [CrossRef]
- Chen, B.; Wang, F.; Li, J.-Y.; Zhang, J.-L.; Zhang, Y.; Zhao, H.-C. Synthesis of Eugenol Bio-based Reactive Epoxy Diluent and Study on the Curing Kinetics and Properties of the Epoxy Resin System. Chin. J. Polym. Sci. 2019, 37, 500–508. [Google Scholar] [CrossRef]
- Solodilov, V.I.; Gorbatkina, Y.A.; Kuperman, A.M. The Effect of an Active Diluent on the Properties of Epoxy Resin and Unidirectional Carbon-Fiber-Reinforced Plastics. Polym. Mech. 2003, 39, 493–502. [Google Scholar] [CrossRef]
- Chen, J.; Nie, X.; Liu, Z.; Mi, Z.; Zhou, Y. Synthesis and Application of Polyepoxide Cardanol Glycidyl Ether as Biobased Pol-yepoxide Reactive Diluent for Epoxy Resin. ACS Sustain. Chem. Eng. 2015, 3, 1164–1171. [Google Scholar] [CrossRef]
- Khalina, M.; Beheshty, M.H.; Salimi, A. The effect of reactive diluent on mechanical properties and microstructure of epoxy resins. Polym. Bull. 2019, 76, 3905–3927. [Google Scholar] [CrossRef]
- Bian, X.; Tuo, R.; Yang, W.; Zhang, Y.; Xie, Q.; Zha, J.; Lin, J.; He, S. Mechanical, Thermal, and Electrical Properties of BN–Epoxy Composites Modified with Carboxyl-Terminated Butadiene Nitrile Liquid Rubber. Polymers 2019, 11, 1548. [Google Scholar] [CrossRef] [Green Version]
- Tripathi, G.; Srivastava, D. Effect of carboxyl-terminated poly(butadiene-co-acrylonitrile) (CTBN) concentration on thermal and mechanical properties of binary blends of diglycidyl ether of bisphenol-A (DGEBA) epoxy resin. Mater. Sci. Eng. A 2007, 443, 262–269. [Google Scholar] [CrossRef]
- Chae, G.-S.; Park, H.-W.; Lee, J.-H.; Shin, S. Comparative Study on the Impact Wedge-Peel Performance of Epoxy-Based Structural Adhesives Modified with Different Toughening Agents. Polymers 2020, 12, 1549. [Google Scholar] [CrossRef]
- Wang, C.; Sun, Q.; Lei, K.; Chen, C.; Yao, L.; Peng, Z. Effect of Toughening with Different Liquid Rubber on Dielectric Relaxation Properties of Epoxy Resin. Polymers 2020, 12, 433. [Google Scholar] [CrossRef] [Green Version]
- Jin, Q.; Misasi, J.M.; Wiggins, J.S.; Morgan, S.E. Simultaneous reinforcement and toughness improvement in an aromatic epoxy network with an aliphatic hyperbranched epoxy modifier. Polymer 2015, 73, 174–182. [Google Scholar] [CrossRef]
- Liu, H.; Zhang, J.; Gao, X.; Huang, G. Simultaneous reinforcement and toughness improvement of an epoxy–phenolic network with a hyperbranched polysiloxane modifier. RSC Adv. 2018, 8, 17606–17615. [Google Scholar] [CrossRef] [PubMed]
- Boogh, L.; Pettersson, B.; Månson, J.-A.E. Dendritic hyperbranched polymers as tougheners for epoxy resins. Polymer 1999, 40, 2249–2261. [Google Scholar] [CrossRef]
- Miao, X.; Meng, Y.; Li, X. A novel all-purpose epoxy-terminated hyperbranched polyether sulphone toughener for an epoxy/amine system. Polymer 2015, 60, 88–95. [Google Scholar] [CrossRef]
- Fei, X.; Wei, W.; Tang, Y.; Zhu, Y.; Luo, J.; Chen, M.; Liu, X. Simultaneous enhancements in toughness, tensile strength, and thermal properties of epoxy-anhydride thermosets with a carboxyl-terminated hyperbranched polyester. Eur. Polym. J. 2017, 90, 431–441. [Google Scholar] [CrossRef]
- Lee, S.-Y.; Kang, M.-J.; Kim, S.-H.; Rhee, K.Y.; Lee, J.-H.; Park, S.-J. Roles of Small Polyetherimide Moieties on Thermal Stability and Fracture Toughness of Epoxy Blends. Polymers 2021, 13, 3310. [Google Scholar] [CrossRef] [PubMed]
- Guo, H.; Wang, B.; Fu, X.; Li, N.; Li, G.; Zheng, G.; Wang, Z.; Liu, C.; Chen, Y.; Weng, Z.; et al. A New Strategy to Improve the Toughness of Epoxy Thermosets—By Introducing Poly(ether nitrile ketone)s Containing Phthalazinone Structures. Materials 2023, 16, 2878. [Google Scholar] [CrossRef]
- Wu, J.; Li, C.; Hailatihan, B.; Mi, L.; Baheti, Y.; Yan, Y. Effect of the Addition of Thermoplastic Resin and Composite on Mechanical and Thermal Properties of Epoxy Resin. Polymers 2022, 14, 1087. [Google Scholar] [CrossRef] [PubMed]
- Giannotti, M.I.; Solsona, M.S.; Galante, M.J.; Oyanguren, P.A. Morphology control in polysulfone-modified epoxy resins by demixing behavior. J. Appl. Polym. Sci. 2003, 89, 405–412. [Google Scholar] [CrossRef]
- Shapagin, A.V.; Budylin, N.Y.; Chalykh, A.E.; Solodilov, V.I.; Korokhin, R.A.; Poteryaev, A.A. Phase Equilibrium, Morphology, and Physico-Mechanics in Epoxy–Thermoplastic Mixtures with Upper and Lower Critical Solution Temperatures. Polymers 2021, 13, 35. [Google Scholar] [CrossRef]
- Robertson, J.; Ward, T.; Hill, A. Thermal, mechanical, physical, and transport properties of blends of novel oligomer and thermoplastic polysulfone. Polymer 2000, 41, 6251–6262. [Google Scholar] [CrossRef]
- Sun, Z.; Xu, L.; Chen, Z.; Wang, Y.; Tusiime, R.; Cheng, C.; Zhou, S.; Liu, Y.; Yu, M.; Zhang, H. Enhancing the Mechanical and Thermal Properties of Epoxy Resin via Blending with Thermoplastic Polysulfone. Polymers 2019, 11, 461. [Google Scholar] [CrossRef] [Green Version]
- Chen, Z.; Tian, J.; Guo, J.; Xie, Z.; Chu, F. Study on the properties of the layered-structure in the epoxy/polysulfone blends. Thermosetting Resin 2018, 33, 15–18. [Google Scholar]
- Zheng, N.; Sun, W.; Liu, H.-Y.; Huang, Y.; Gao, J.; Mai, Y.-W. Effects of carboxylated carbon nanotubes on the phase separation behaviour and fracture-mechanical properties of an epoxy/polysulfone blend. Compos. Sci. Technol. 2018, 159, 180–188. [Google Scholar] [CrossRef]
- Rosetti, Y.; Alcouffe, P.; Pascault, J.-P.; Gérard, J.-F.; Lortie, F. Polyether Sulfone-Based Epoxy Toughening: From Micro- to Nano-Phase Separation via PES End-Chain Modification and Process Engineering. Materials 2018, 11, 1960. [Google Scholar] [CrossRef] [Green Version]
- Korokhin, R.A.; Solodilov, V.I.; Zvereva, U.G.; Solomatin, D.V.; Gorbatkina, Y.A.; Shapagin, A.V.; Lebedeva, O.V.; Bamborin, M.Y. Epoxy polymers modified with polyetherimide. Part II: Physicomechanical properties of modified epoxy oligomers and car-bon fiber reinforced plastics based on them. Polym. Bull. 2020, 77, 2039–2057. [Google Scholar] [CrossRef]
- Ma, H.; Aravand, M.A.; Falzon, B.G. Phase morphology and mechanical properties of polyetherimide modified epoxy resins: A comparative study. Polymer 2019, 179, 121640. [Google Scholar] [CrossRef]
- Cheng, C.; Chen, Z.; Huang, Z.; Zhang, C.; Tusiime, R.; Zhou, J.; Sun, Z.; Liu, Y.; Yu, M.; Zhang, H. Simultaneously improving mode I and mode II fracture toughness of the carbon fiber/epoxy composite laminates via interleaved with uniformly aligned PES fiber webs. Compos. Part A Appl. Sci. Manuf. 2020, 129, 105696. [Google Scholar] [CrossRef]
- Jin, H.; Yang, B.; Jin, F.-L.; Park, S.-J. Fracture toughness and surface morphology of polysulfone-modified epoxy resin. J. Ind. Eng. Chem. 2015, 25, 9–11. [Google Scholar] [CrossRef]
- Farooq, U.; Teuwen, J.; Dransfeld, C. Toughening of Epoxy Systems with Interpenetrating Polymer Network (IPN): A Review. Polymers 2020, 12, 1908. [Google Scholar] [CrossRef] [PubMed]
- Wang, Z.; Zhang, X.; Weng, L.; Liu, L. Low dielectric constant and high toughness epoxy resin based on hyperbranched polyester grafted by flexible chain modified. J. Mater. Sci. Mater. Electron. 2019, 30, 5936–5946. [Google Scholar] [CrossRef]
- Jiang, M.; Liu, Y.; Cheng, C.; Zhou, J.; Liu, B.; Yu, M.; Zhang, H. Enhanced mechanical and thermal properties of monocom-ponent high performance epoxy resin by blending with hydroxyl terminated polyethersulfone. Polym. Test. 2018, 69, 302–309. [Google Scholar] [CrossRef]
- Solodilov, V.I.; Korokhin, R.A.; Gorbatkina, Y.A.; Kuperman, A.M. Comparison of Fracture Energies of Epoxy-polysulfone Matrices and Unidirectional Composites Based on Them. Polym. Mech. 2015, 51, 177–190. [Google Scholar] [CrossRef]
- Tretyakov, I.V.; Vyatkina, M.A.; Cherevinskiy, A.P.; Solodilov, V.I.; Shapagin, A.V.; Korokhin, R.A.; Budylin, N.Y.; Kireinov, A.V.; Gorbatkina, Y.A. Effect of Polyethersulfone on the Properties of Epoxy Resin and Wound Unidirectional Glass Fiber Reinforced Plastics Based on It. Bull. Russ. Acad. Sci. Phys. 2021, 85, 876–880. [Google Scholar] [CrossRef]
- Solodilov, V.I.; Gorbatkina, Y.A.; Korokhin, R.A.; Kuperman, A.M. Properties of Filament-Wound Organoplastics Based on Epoxy Polysulfone Matrices and Armos and Rusar Aramid Fibers. Polym. Sci. Ser. D 2018, 11, 247–251. [Google Scholar] [CrossRef]
- Petrova, T.V.; Tretyakov, I.V.; Kireynov, A.V.; Shapagin, A.V.; Budylin, N.Y.; Alexeeva, O.V.; Beshtoev, B.Z.; Solodilov, V.I.; Yurkov, G.Y.; Berlin, A.A. Structure and Properties of Epoxy Polysulfone Systems Modified with an Active Diluent. Polymers 2022, 14, 5320. [Google Scholar] [CrossRef] [PubMed]
- Petrova, T.V.; Solodilov, V.I.; Kabantseva, V.E.; Karelina, N.V.; Polezhaev, A.V. Furfurylglycidyl ether: A new effective active diluent for epoxy resins from bio-renewable raw materials. IOP Conf. Ser. Mater. Sci. Eng. 2019, 683, 012070. [Google Scholar] [CrossRef]
- Petrova, T.V.; Kireynov, A.V.; Polezhaev, A.V.; Solodilov, V.I. Properties of an Epoxy Blends Modified with a Thermoplastic Heat-Resistant Polymer and an Active Diluent for Manufacture of Reinforced Plastics. Polym. Sci. Ser. D 2022, 15, 155–161. [Google Scholar] [CrossRef]
- Petrova, T.V.; Tretyakov, I.V.; Solodilov, V.I. Technological Parameters of Epoxypolysulphone Binders Modified with Furfuryl Glycidyl Ether. Russ. J. Phys. Chem. B 2023, 17, 177–181. [Google Scholar] [CrossRef]
- ASTM D2584-94; Standard Test Method for Ignition Loss of Cured Reinforced Resins. ASTM Standard: West Conshohocken, PA, USA, 1994.
- ASTM D2344/D2344M-13; Standard Test Method for Short-Beam Strength of Polymer Matrix Composite Materials and Their Laminates. ASTM Standard: West Conshohocken, PA, USA, 2013.
- ISO 178:2010; Plastics—Determination of Flexural Properties. ISO: Geneva, Switzerland, 2010; p. 19.
- Antonov, A.V.; Zelenskii, E.S.; Kuperman, A.M.; Lebedeva, O.V.; Rybin, A.A. Behavior of reinforced plastics based on poly-sulfone matrix under impact loading. Mech. Compos. Mater. 1998, 34, 12–19. [Google Scholar] [CrossRef]


Disclaimer/Publisher’s Note: The statements, opinions and data contained in all publications are solely those of the individual author(s) and contributor(s) and not of MDPI and/or the editor(s). MDPI and/or the editor(s) disclaim responsibility for any injury to people or property resulting from any ideas, methods, instructions or products referred to in the content. |
© 2023 by the authors. Licensee MDPI, Basel, Switzerland. This article is an open access article distributed under the terms and conditions of the Creative Commons Attribution (CC BY) license (https://creativecommons.org/licenses/by/4.0/).
Share and Cite
Tretyakov, I.V.; Petrova, T.V.; Kireynov, A.V.; Korokhin, R.A.; Platonova, E.O.; Alexeeva, O.V.; Gorbatkina, Y.A.; Solodilov, V.I.; Yurkov, G.Y.; Berlin, A.A. Fracture of Epoxy Matrixes Modified with Thermo-Plastic Polymers and Winding Glass Fibers Reinforced Plastics on Their Base under Low-Velocity Impact Condition. Polymers 2023, 15, 2958. https://doi.org/10.3390/polym15132958
Tretyakov IV, Petrova TV, Kireynov AV, Korokhin RA, Platonova EO, Alexeeva OV, Gorbatkina YA, Solodilov VI, Yurkov GY, Berlin AA. Fracture of Epoxy Matrixes Modified with Thermo-Plastic Polymers and Winding Glass Fibers Reinforced Plastics on Their Base under Low-Velocity Impact Condition. Polymers. 2023; 15(13):2958. https://doi.org/10.3390/polym15132958
Chicago/Turabian StyleTretyakov, Ilya V., Tuyara V. Petrova, Aleksey V. Kireynov, Roman A. Korokhin, Elena O. Platonova, Olga V. Alexeeva, Yulia A. Gorbatkina, Vitaliy I. Solodilov, Gleb Yu. Yurkov, and Alexander Al. Berlin. 2023. "Fracture of Epoxy Matrixes Modified with Thermo-Plastic Polymers and Winding Glass Fibers Reinforced Plastics on Their Base under Low-Velocity Impact Condition" Polymers 15, no. 13: 2958. https://doi.org/10.3390/polym15132958