
Effect of Agricultural Biomass Residues on the Properties of Recycled Polypropylene/Polyethylene Composites


Abstract
:1. Introduction
2. Materials and Methods
2.1. Materials
2.2. Methods
2.2.1. Composites and Test Sample Preparation
2.2.2. Analysis of Properties
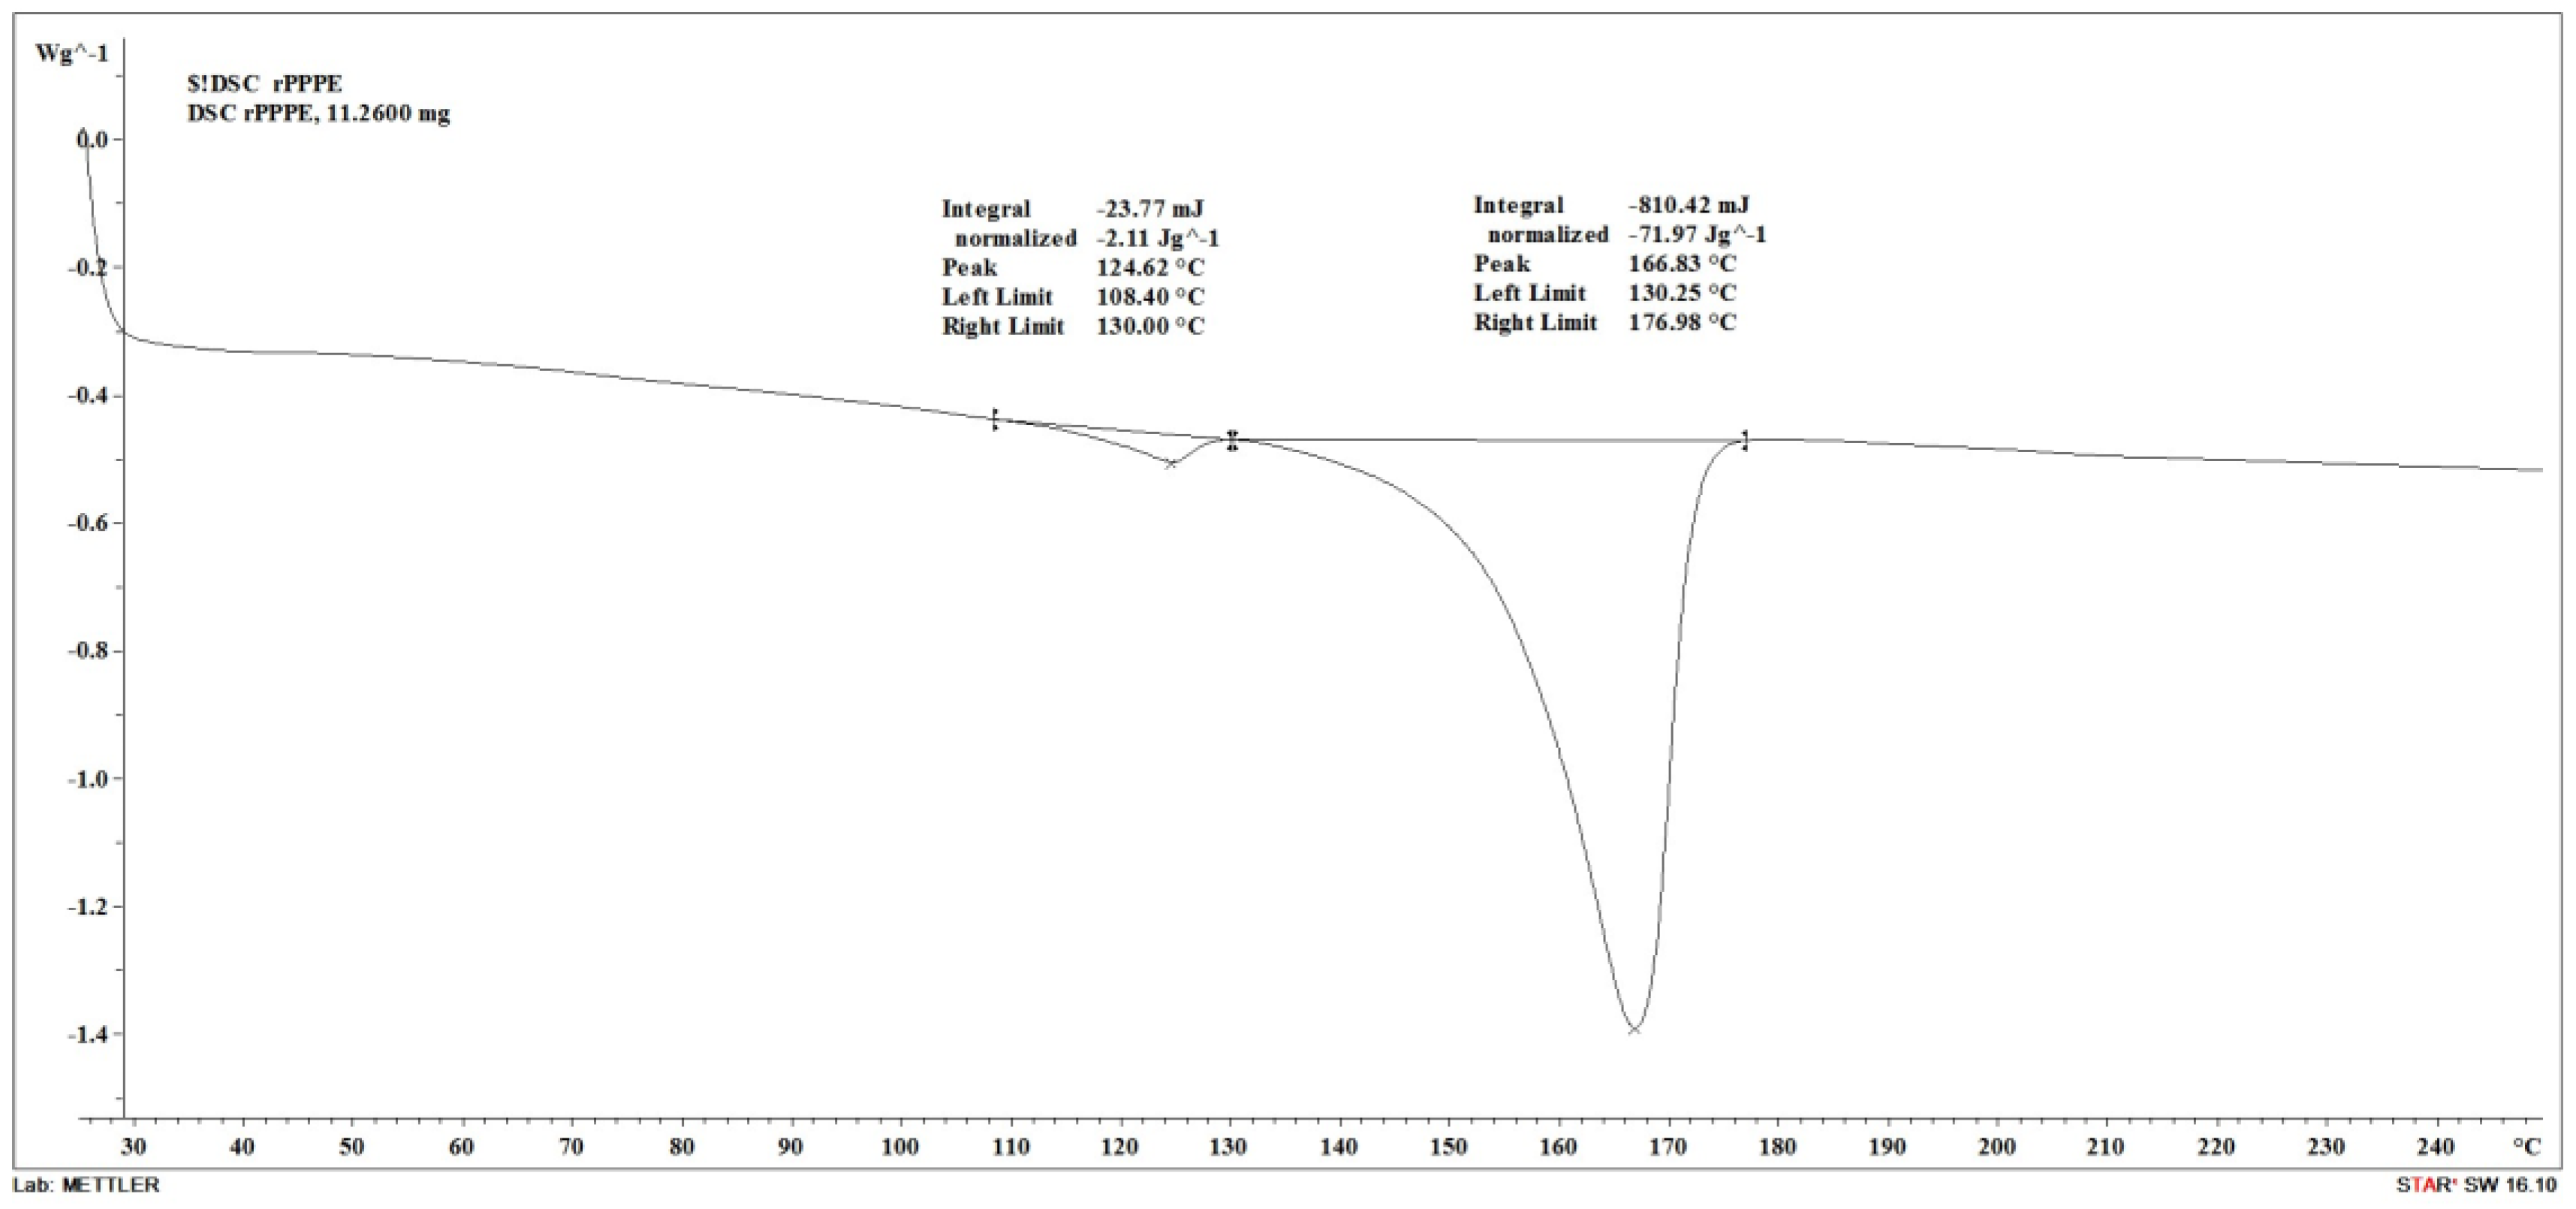
Differential Scanning Calorimetry (DSC)
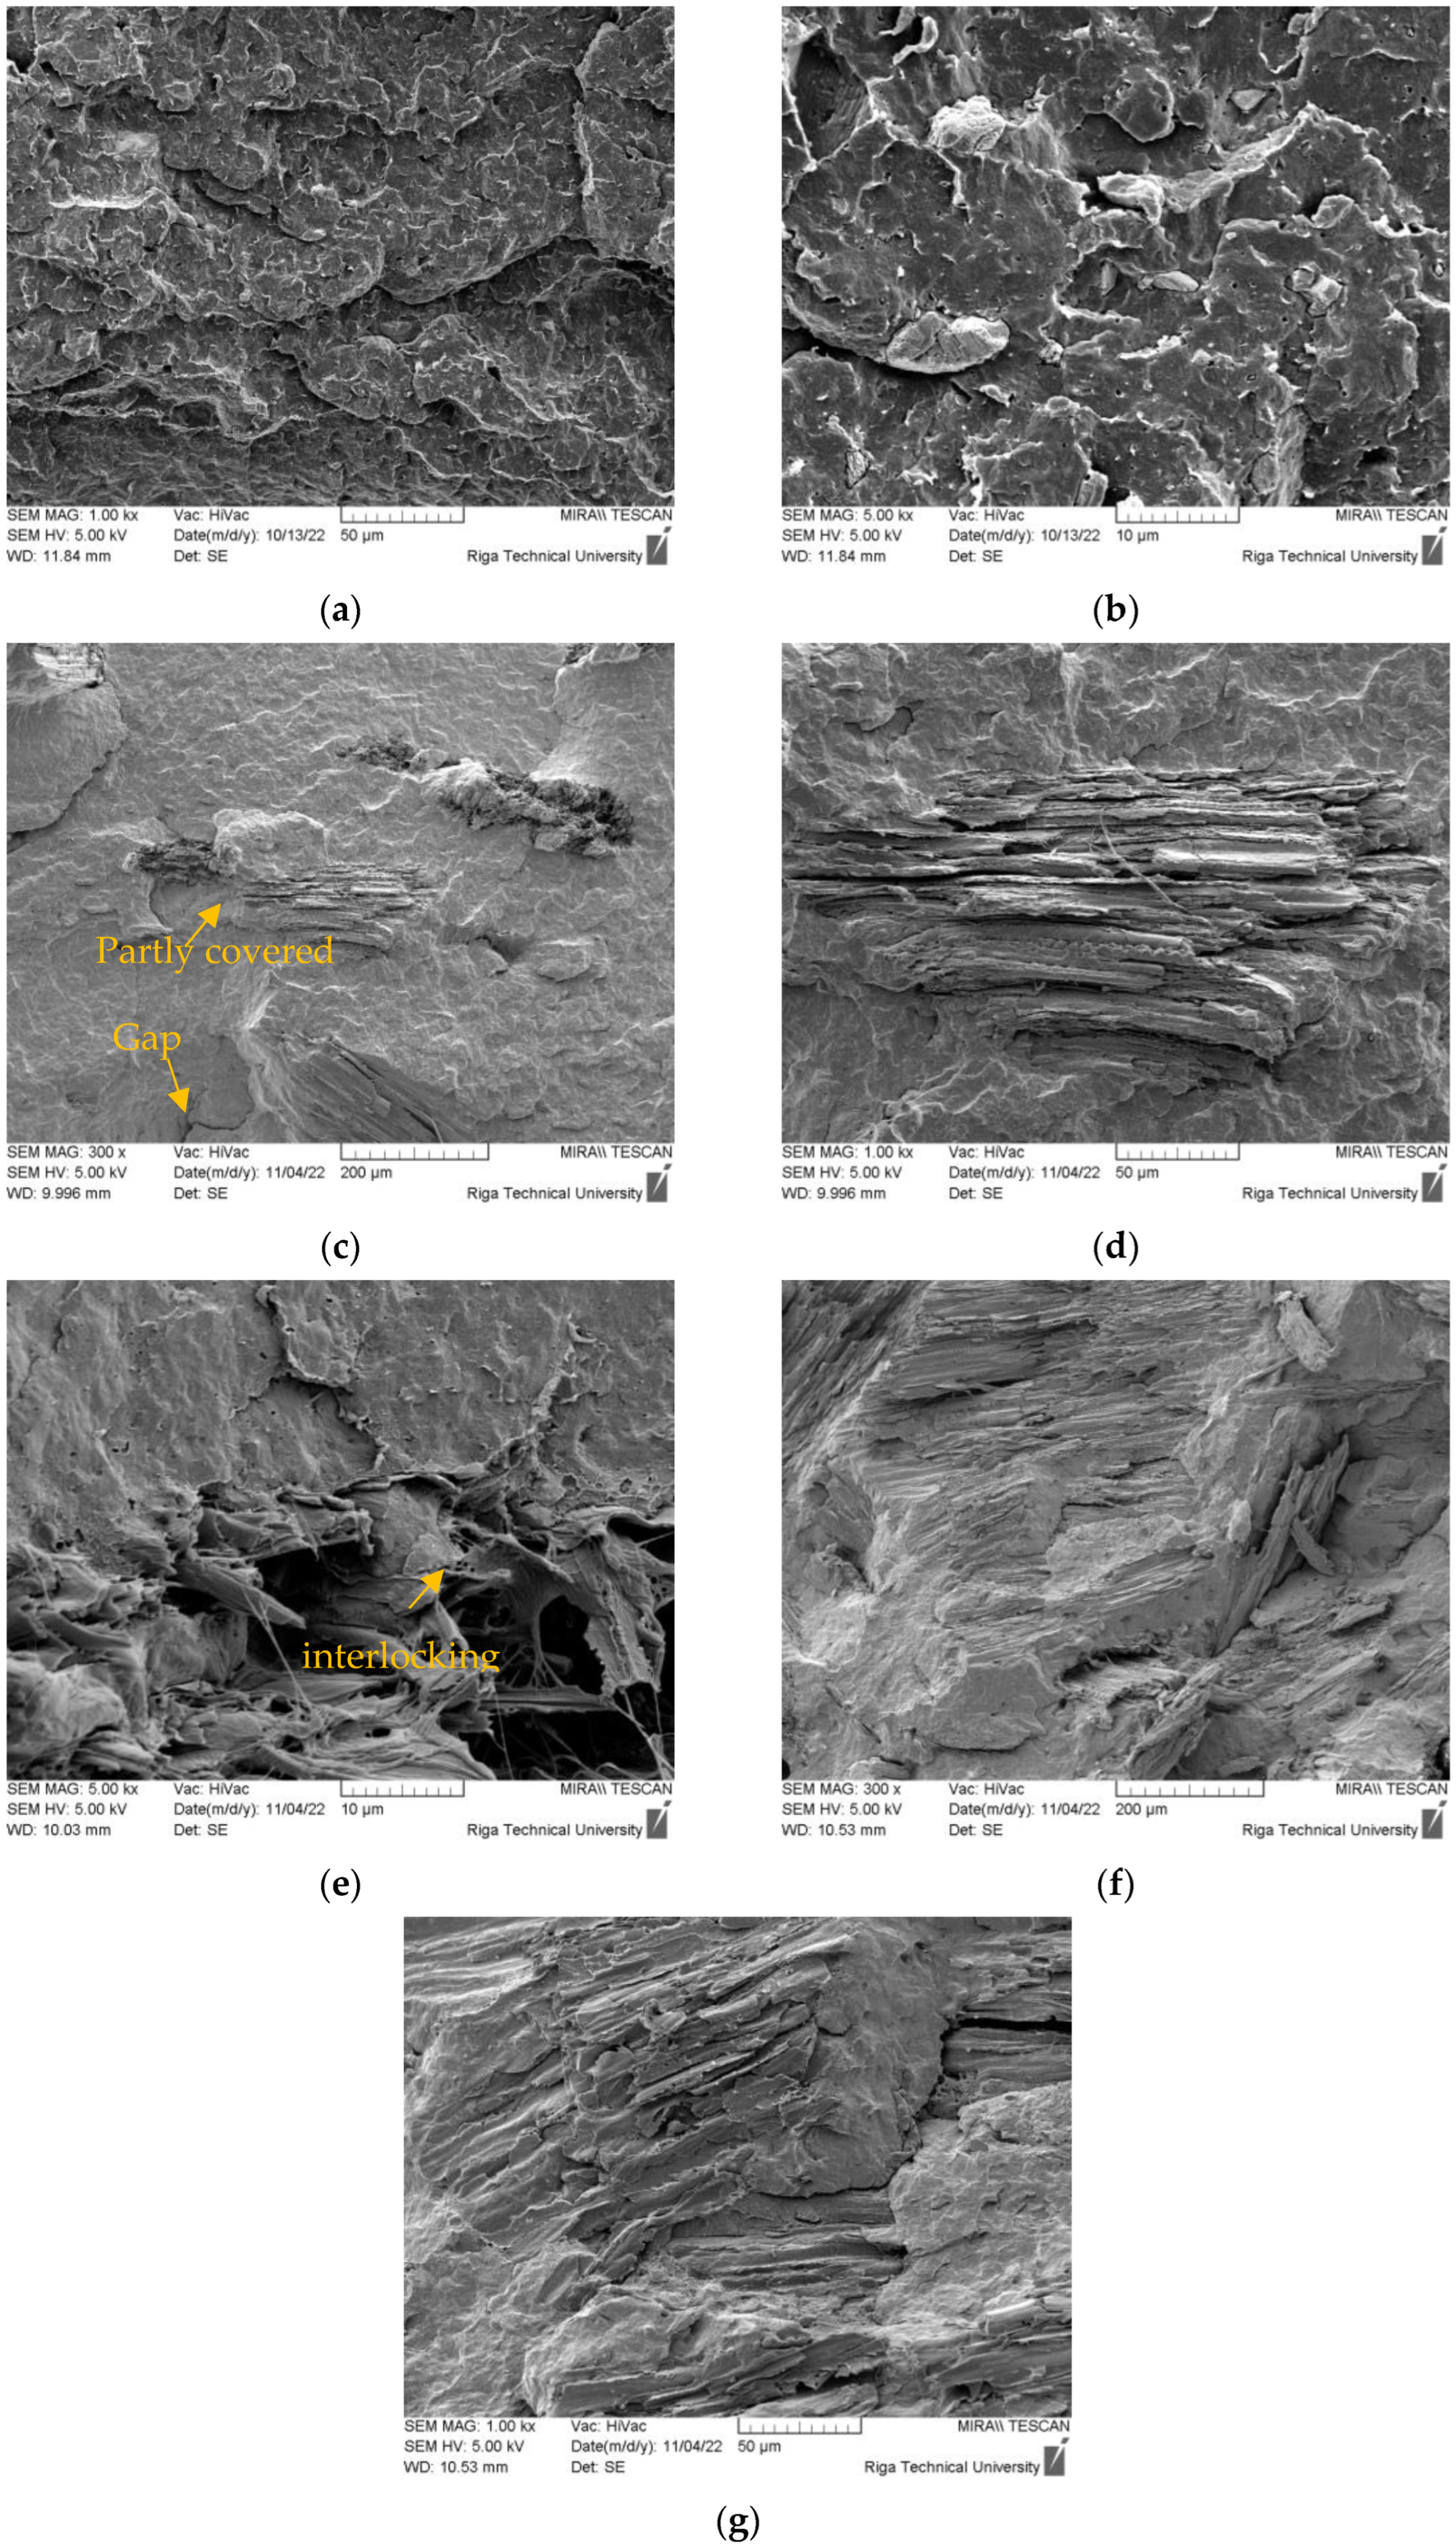
Scanning Electron Microscopy (SEM)
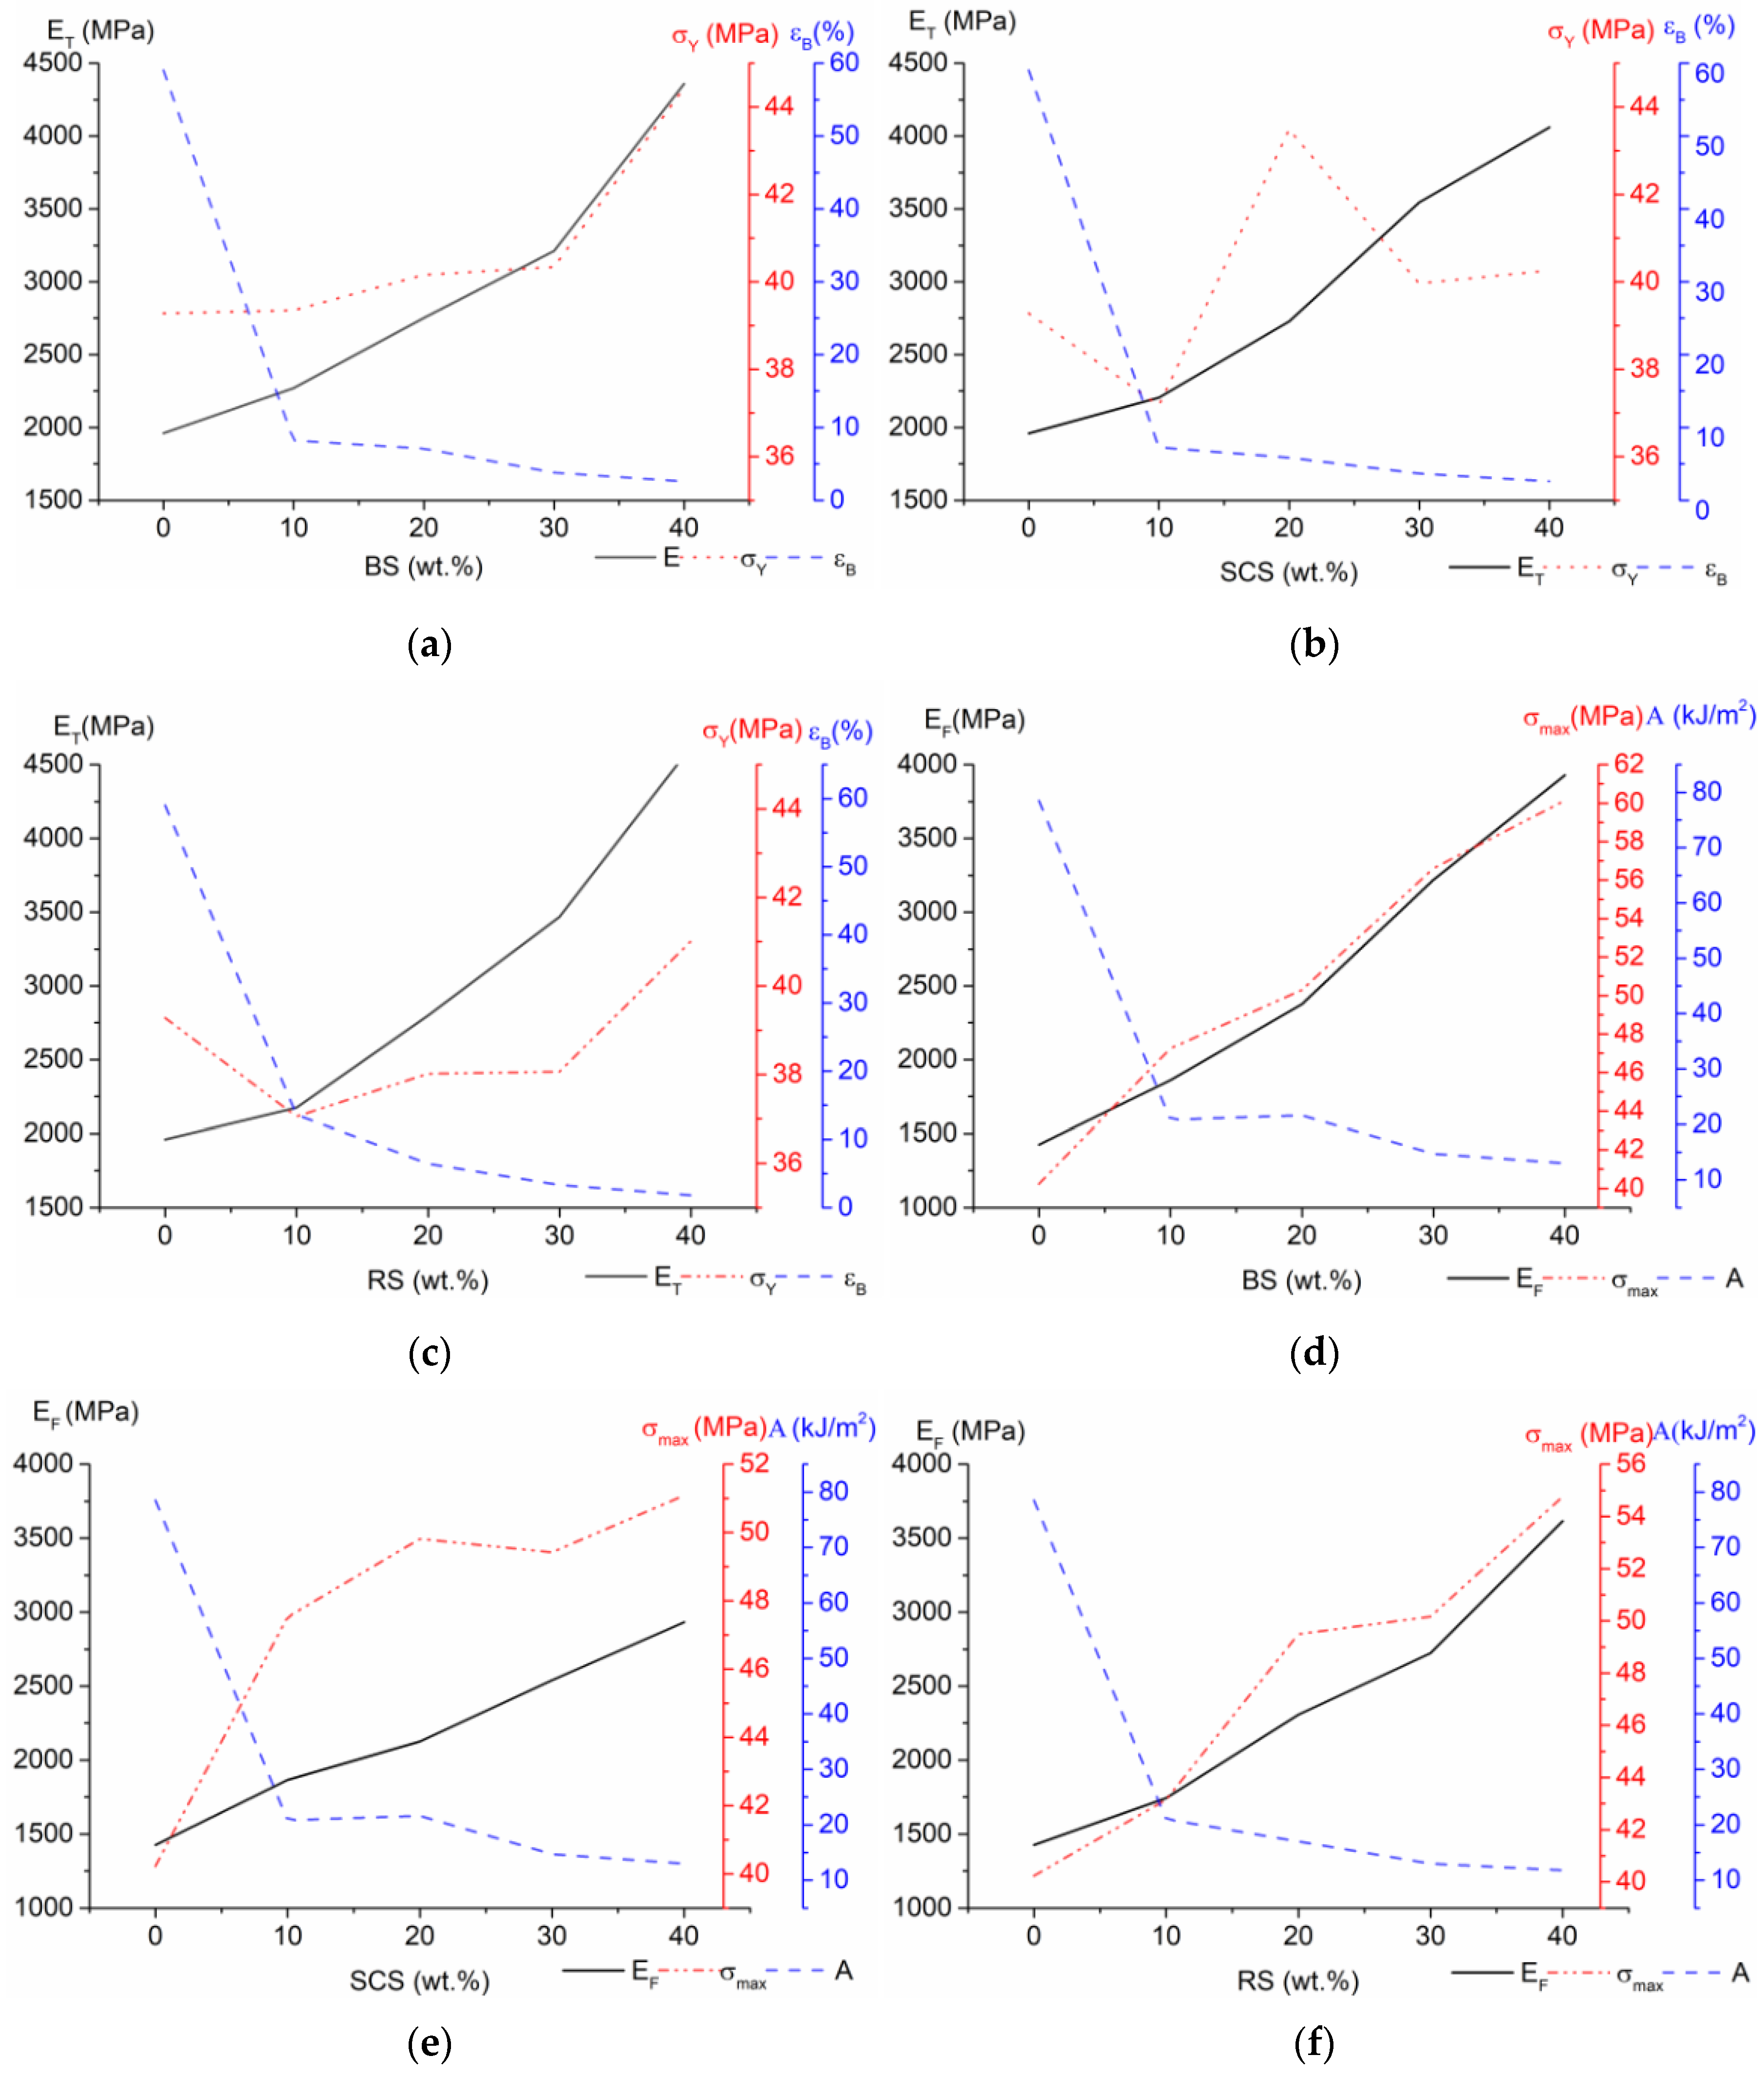
Tensile Properties
Flexural Properties
Impact Strength
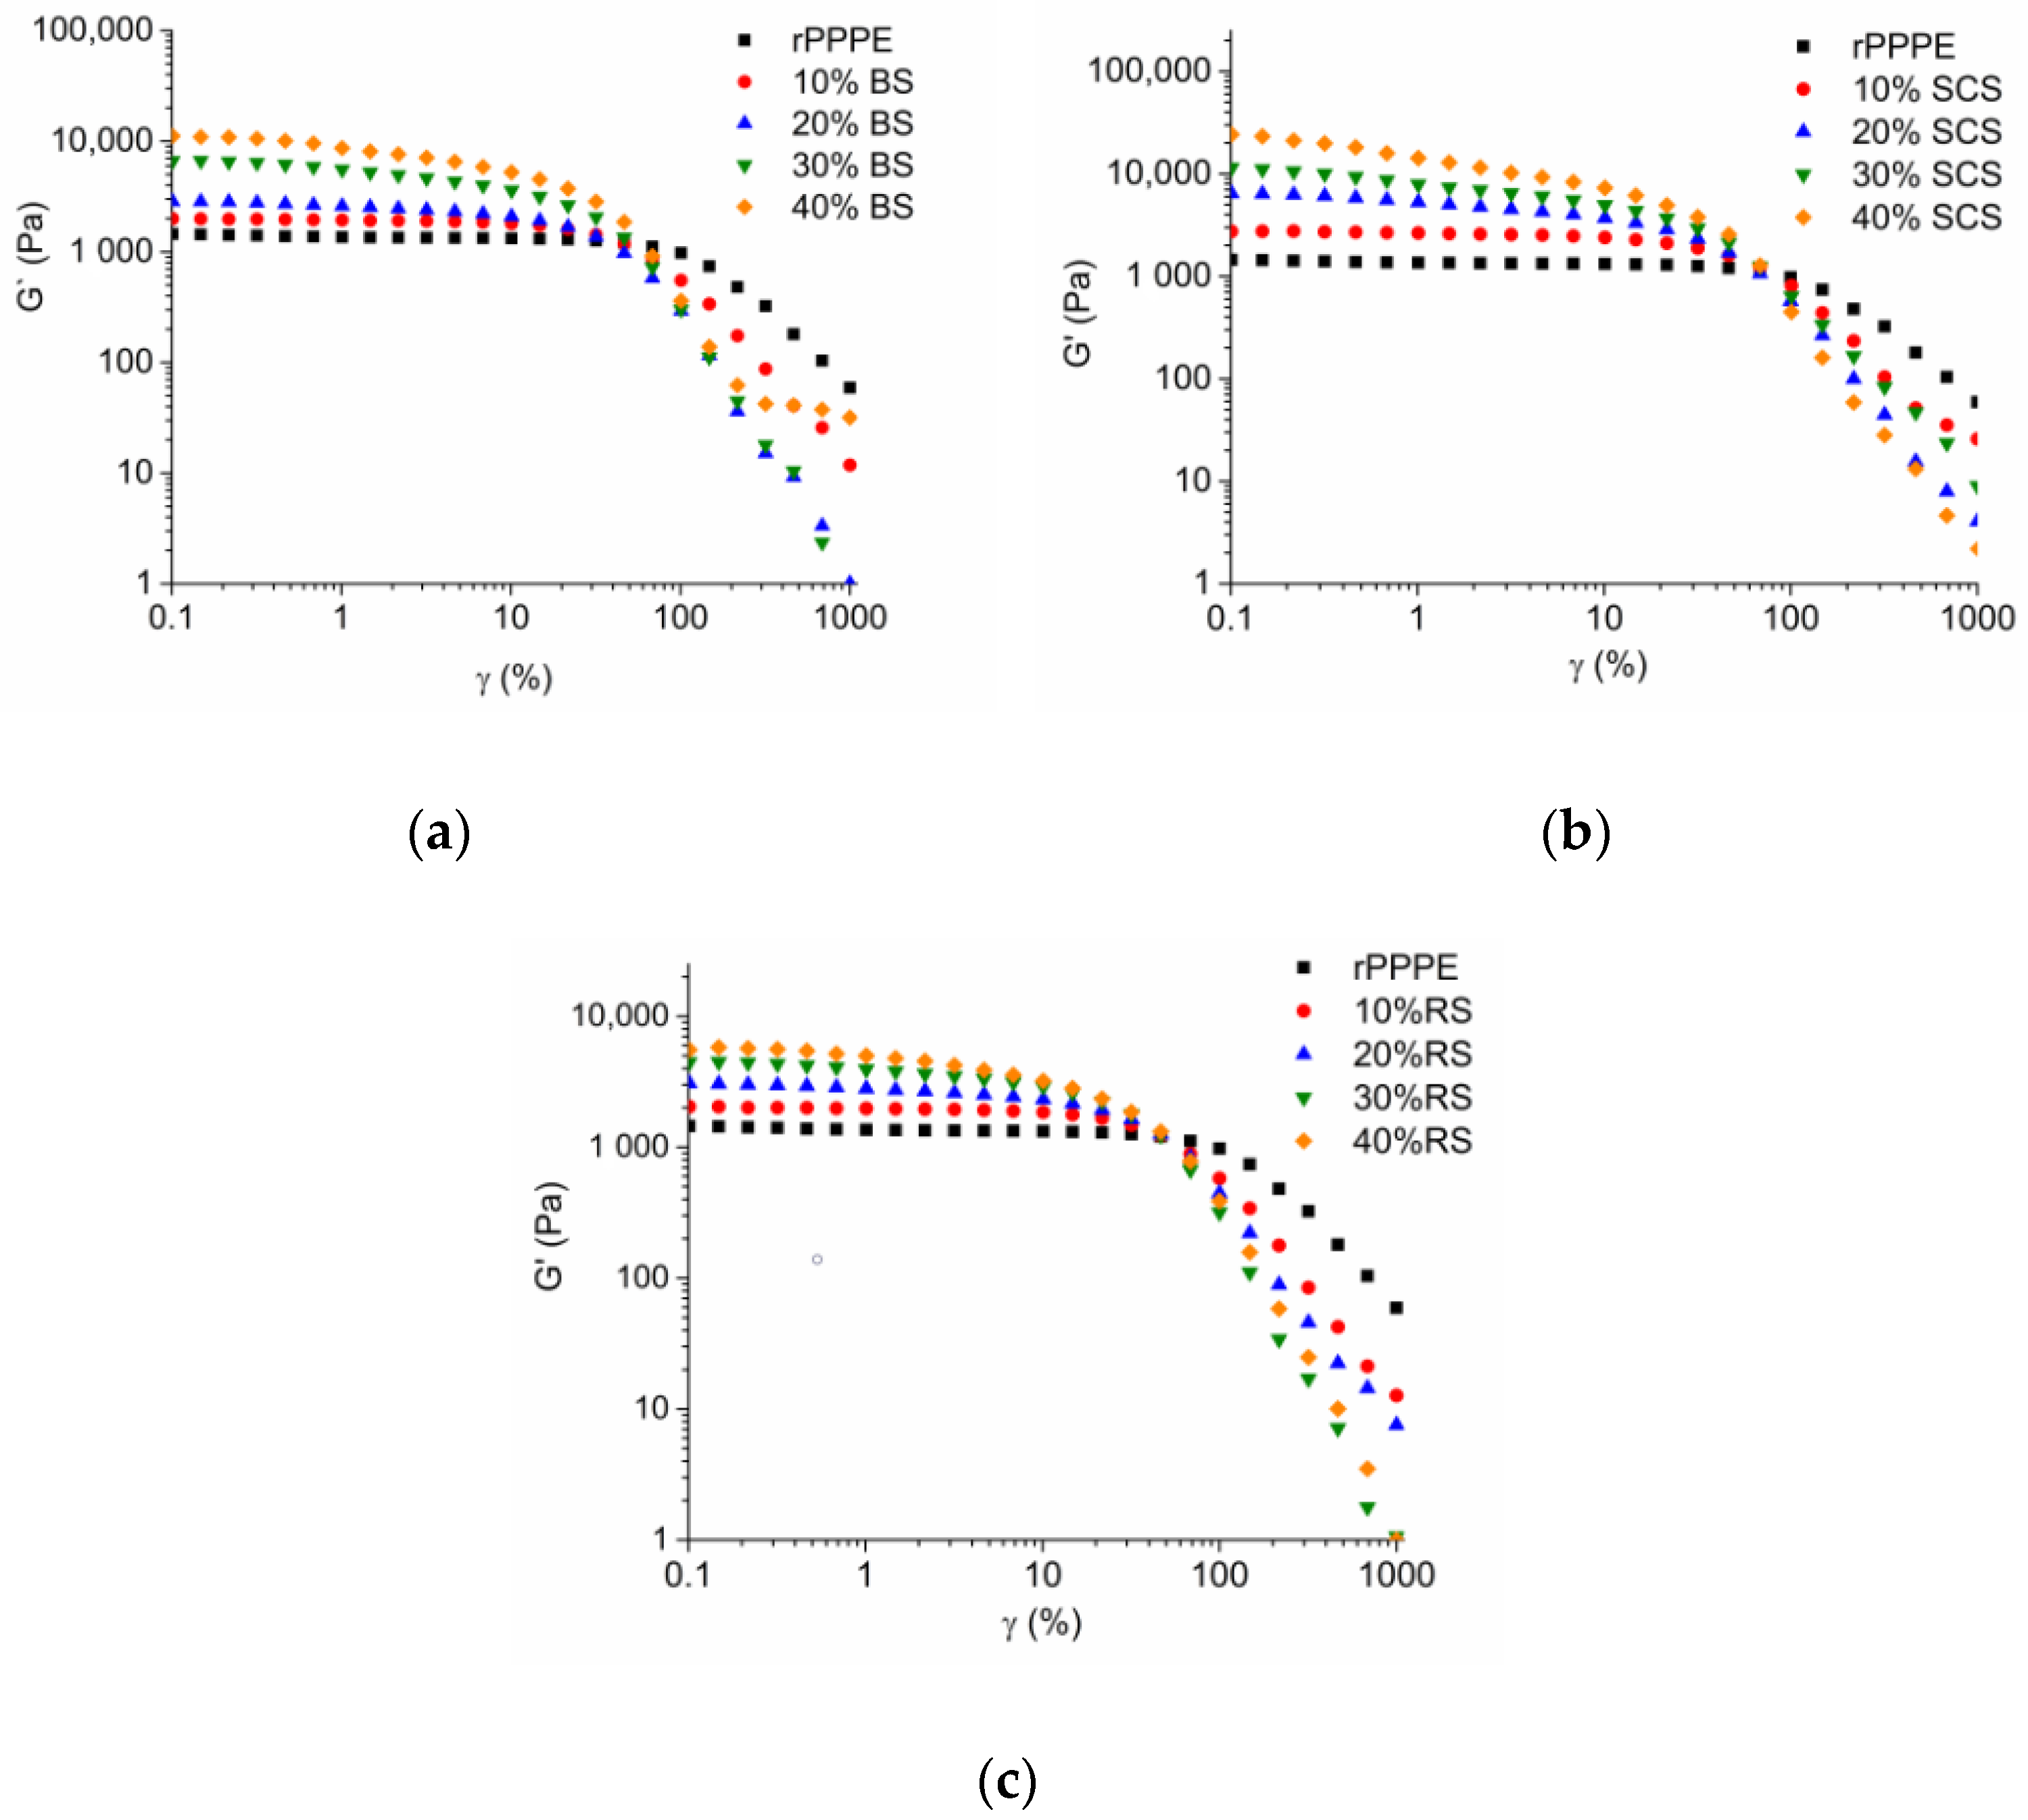
Rheological Properties
Moisture Absorption Test
Thermogravimetric Analysis (TGA)
3. Results and Discussion
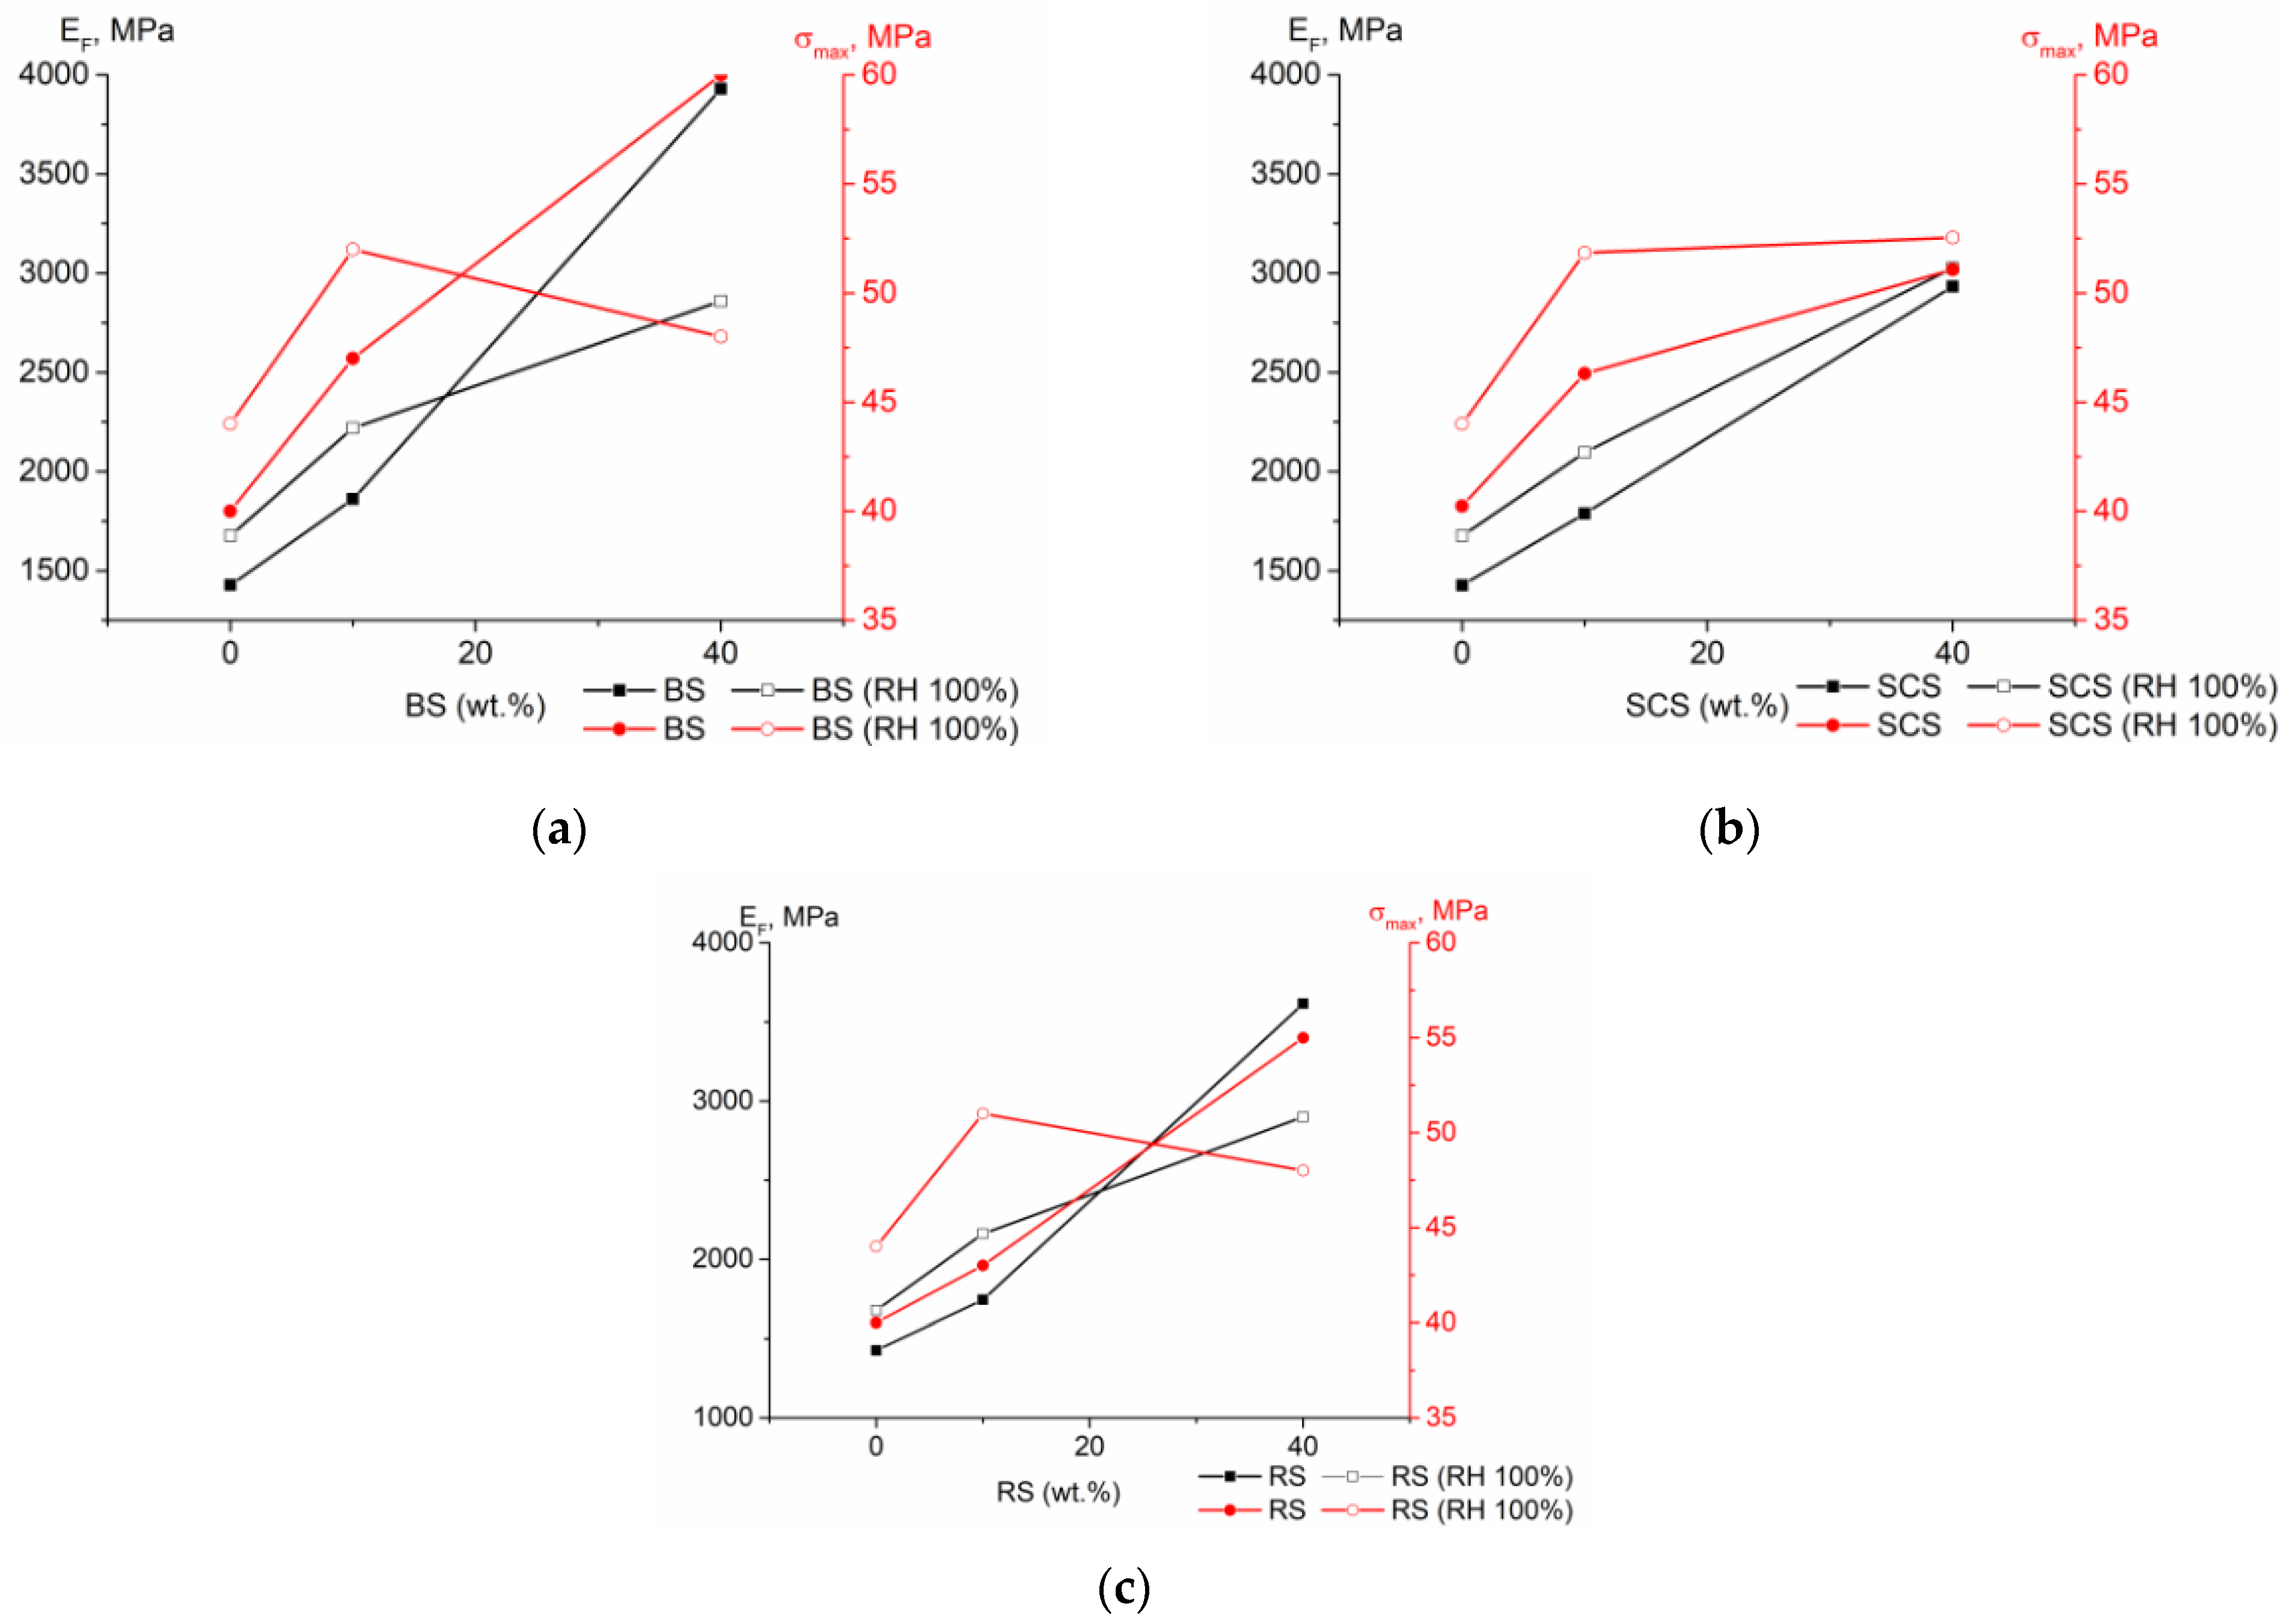
3.1. Mechanical Properties of the Composites
3.2. Scanning Electron Microscopy (SEM)
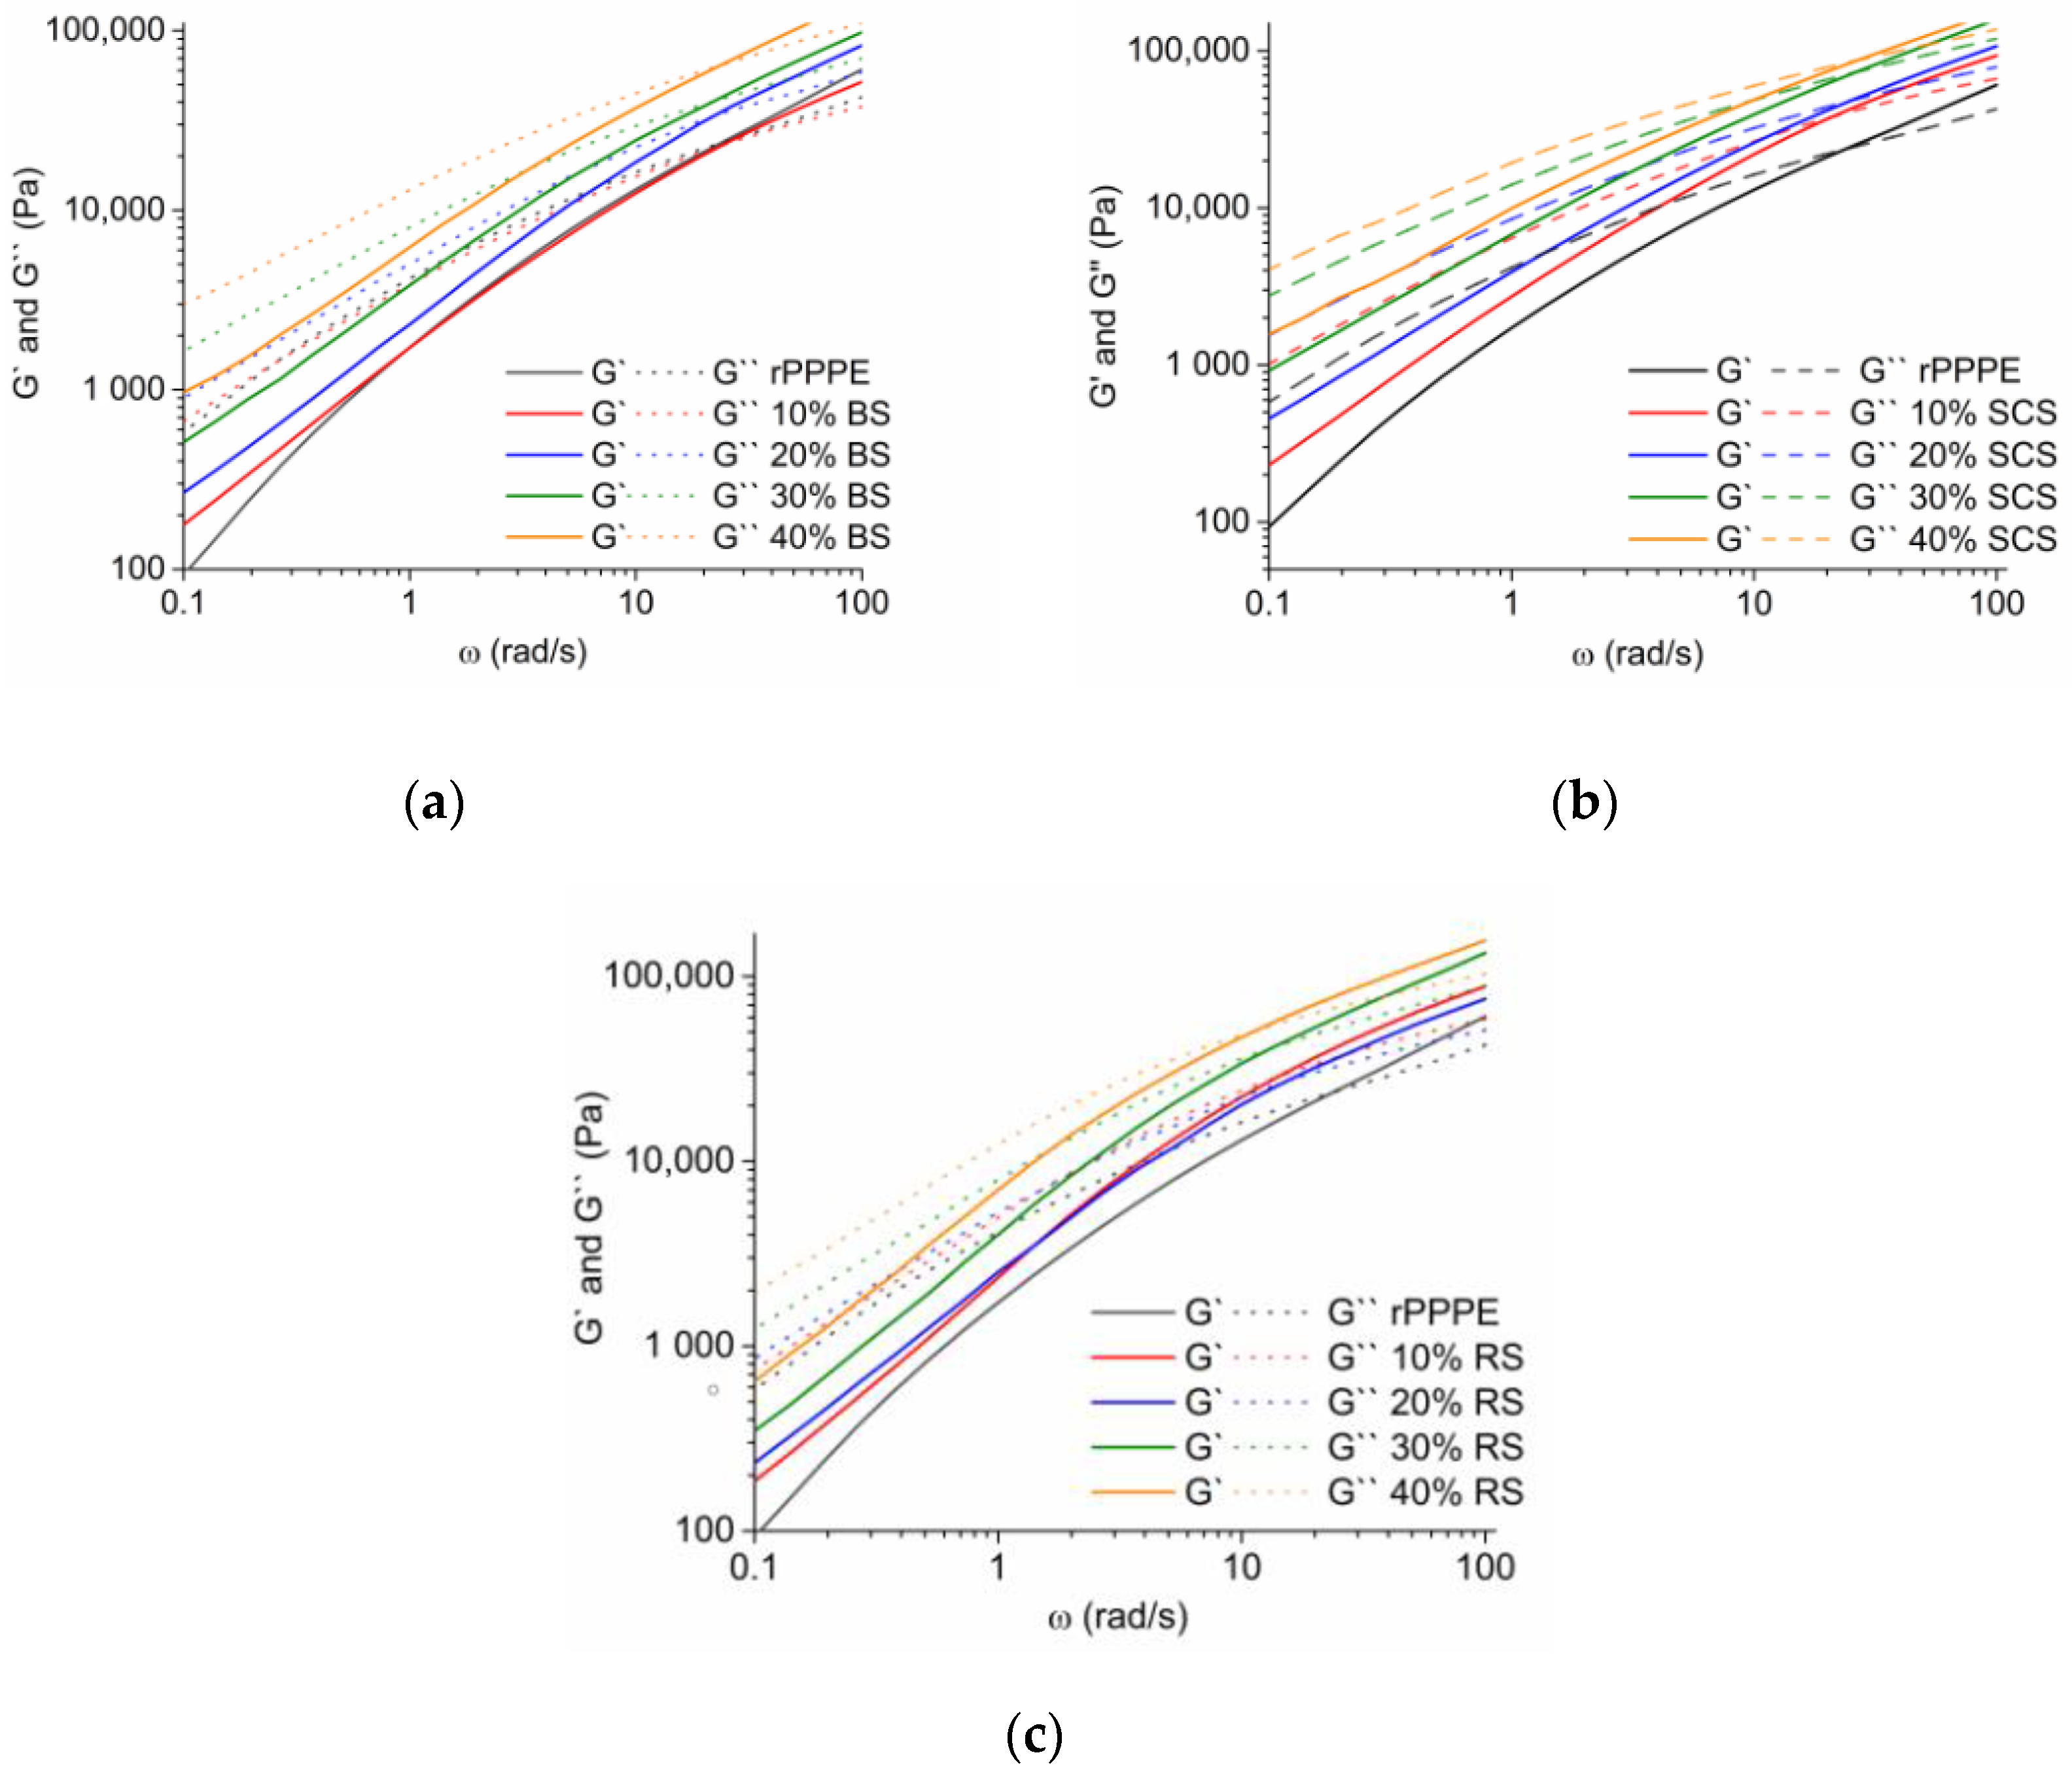
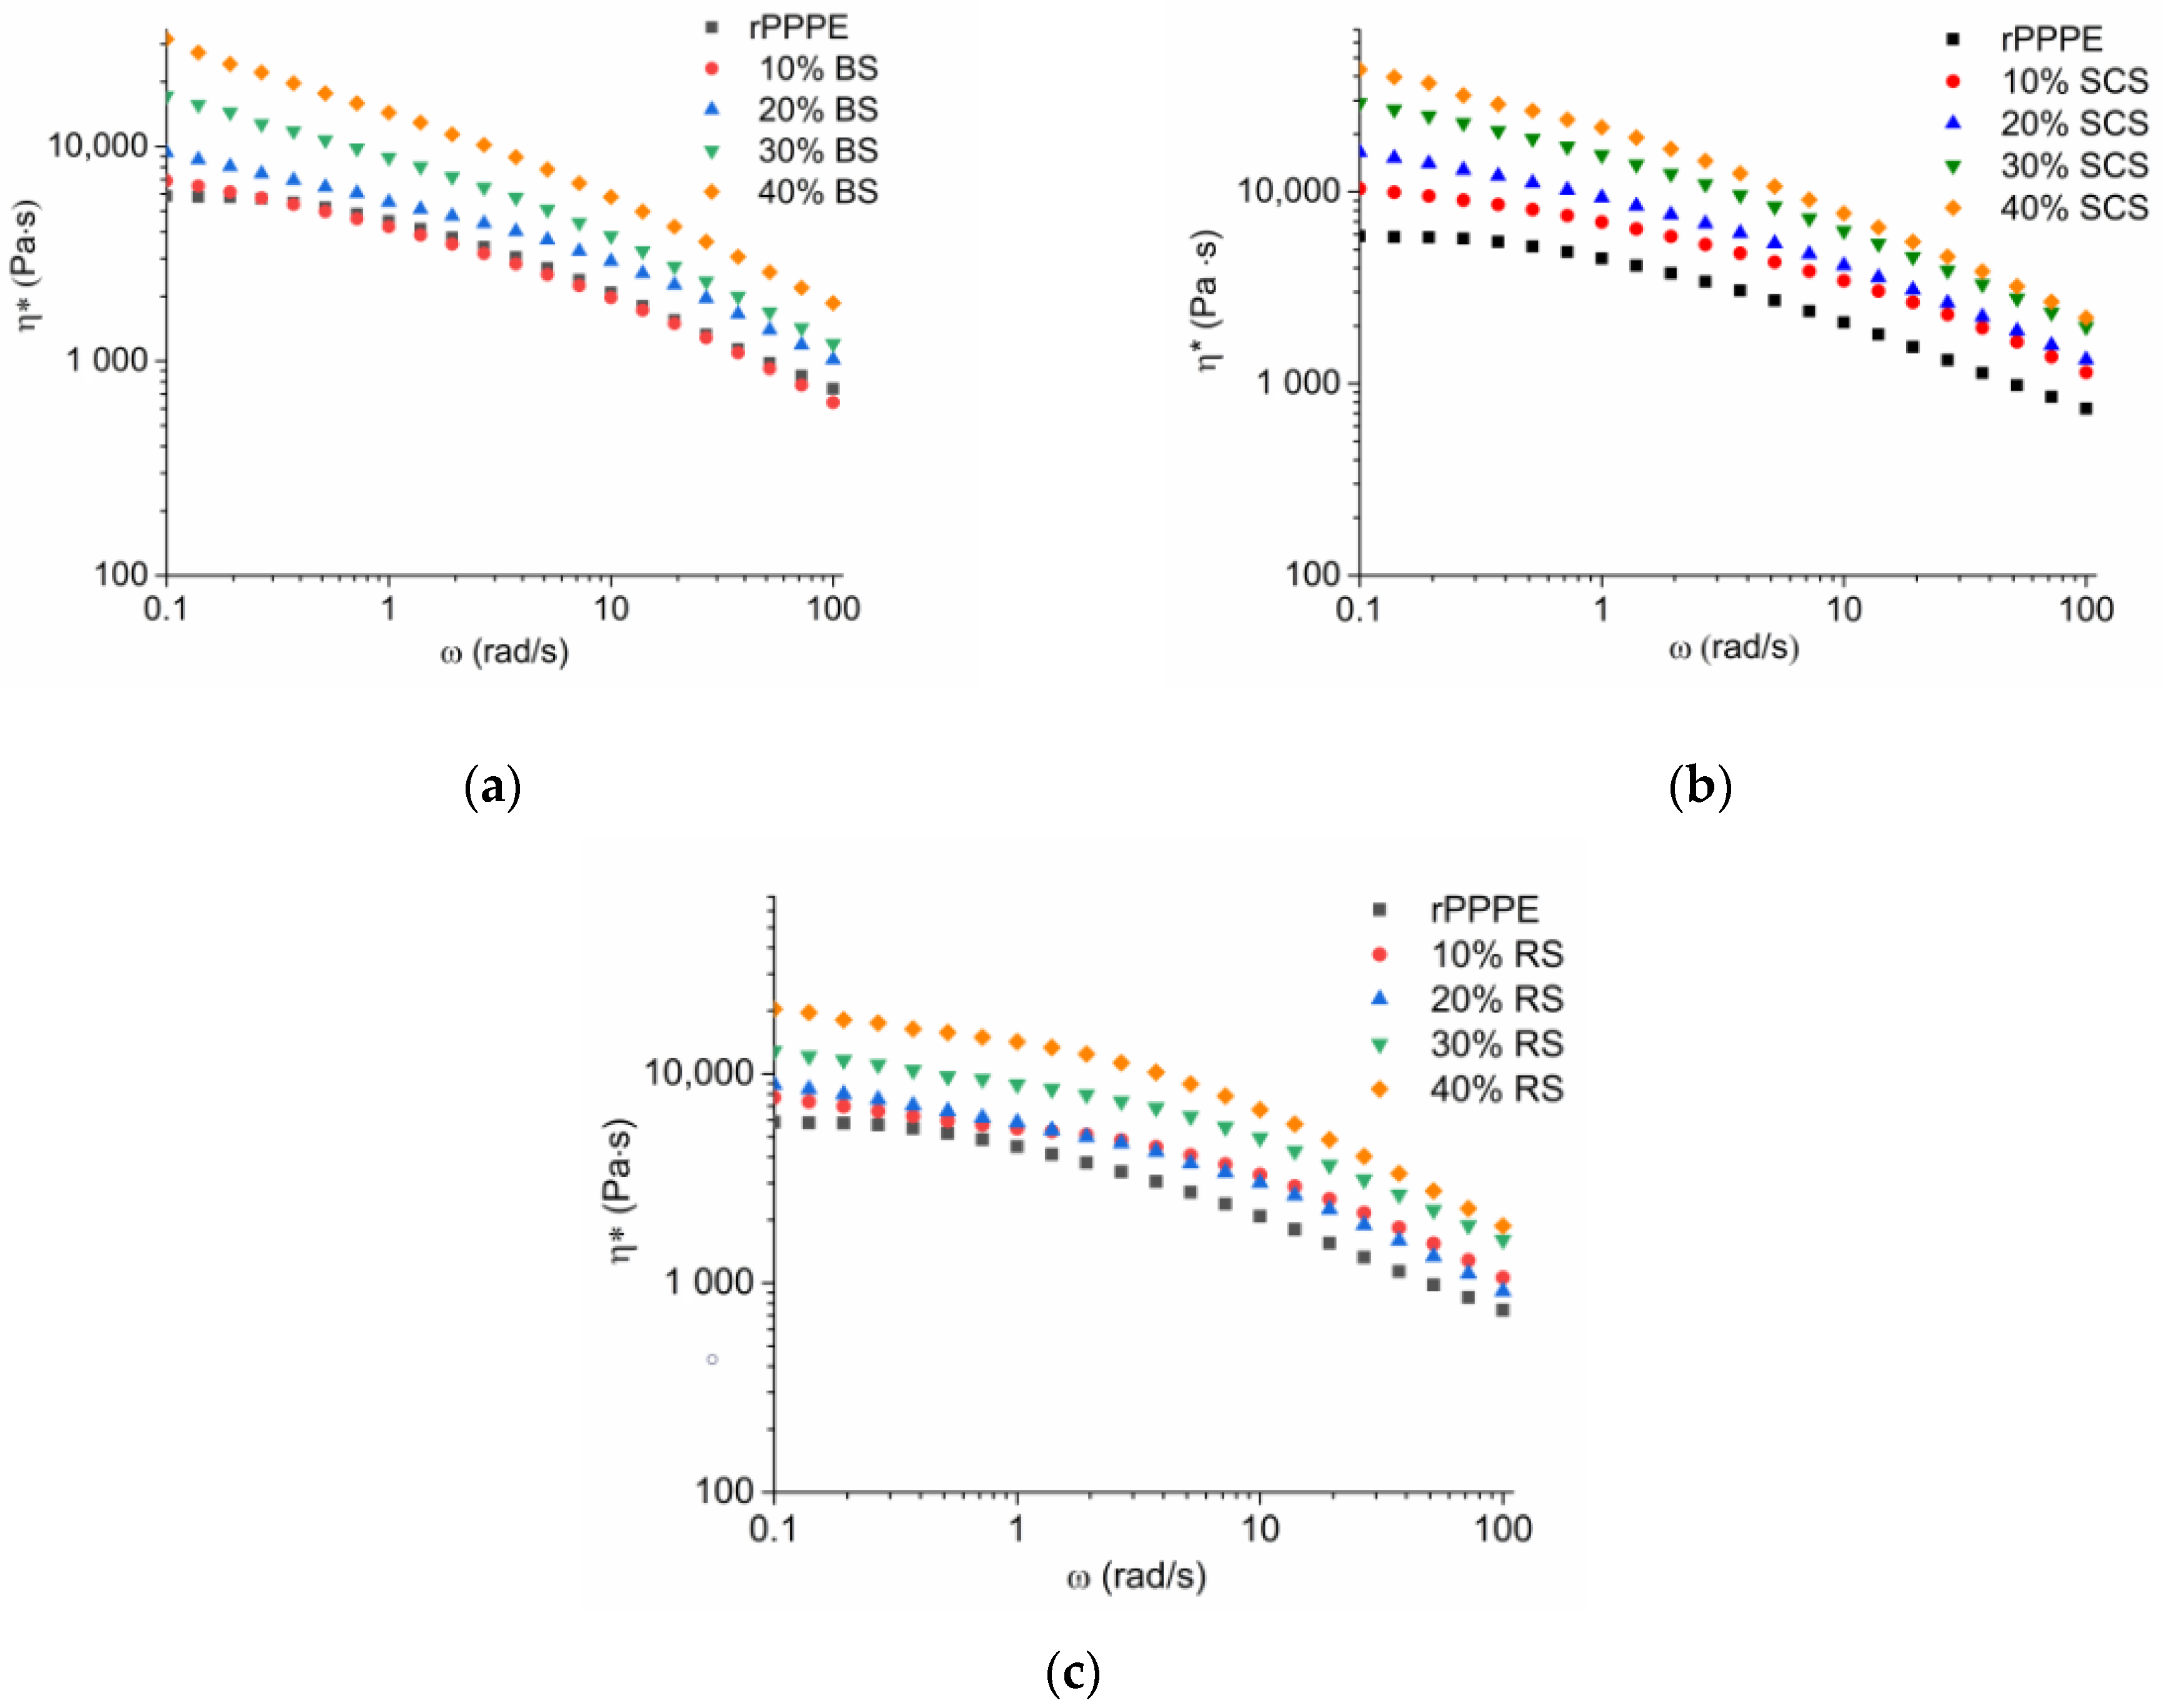
3.3. Rheological Properties
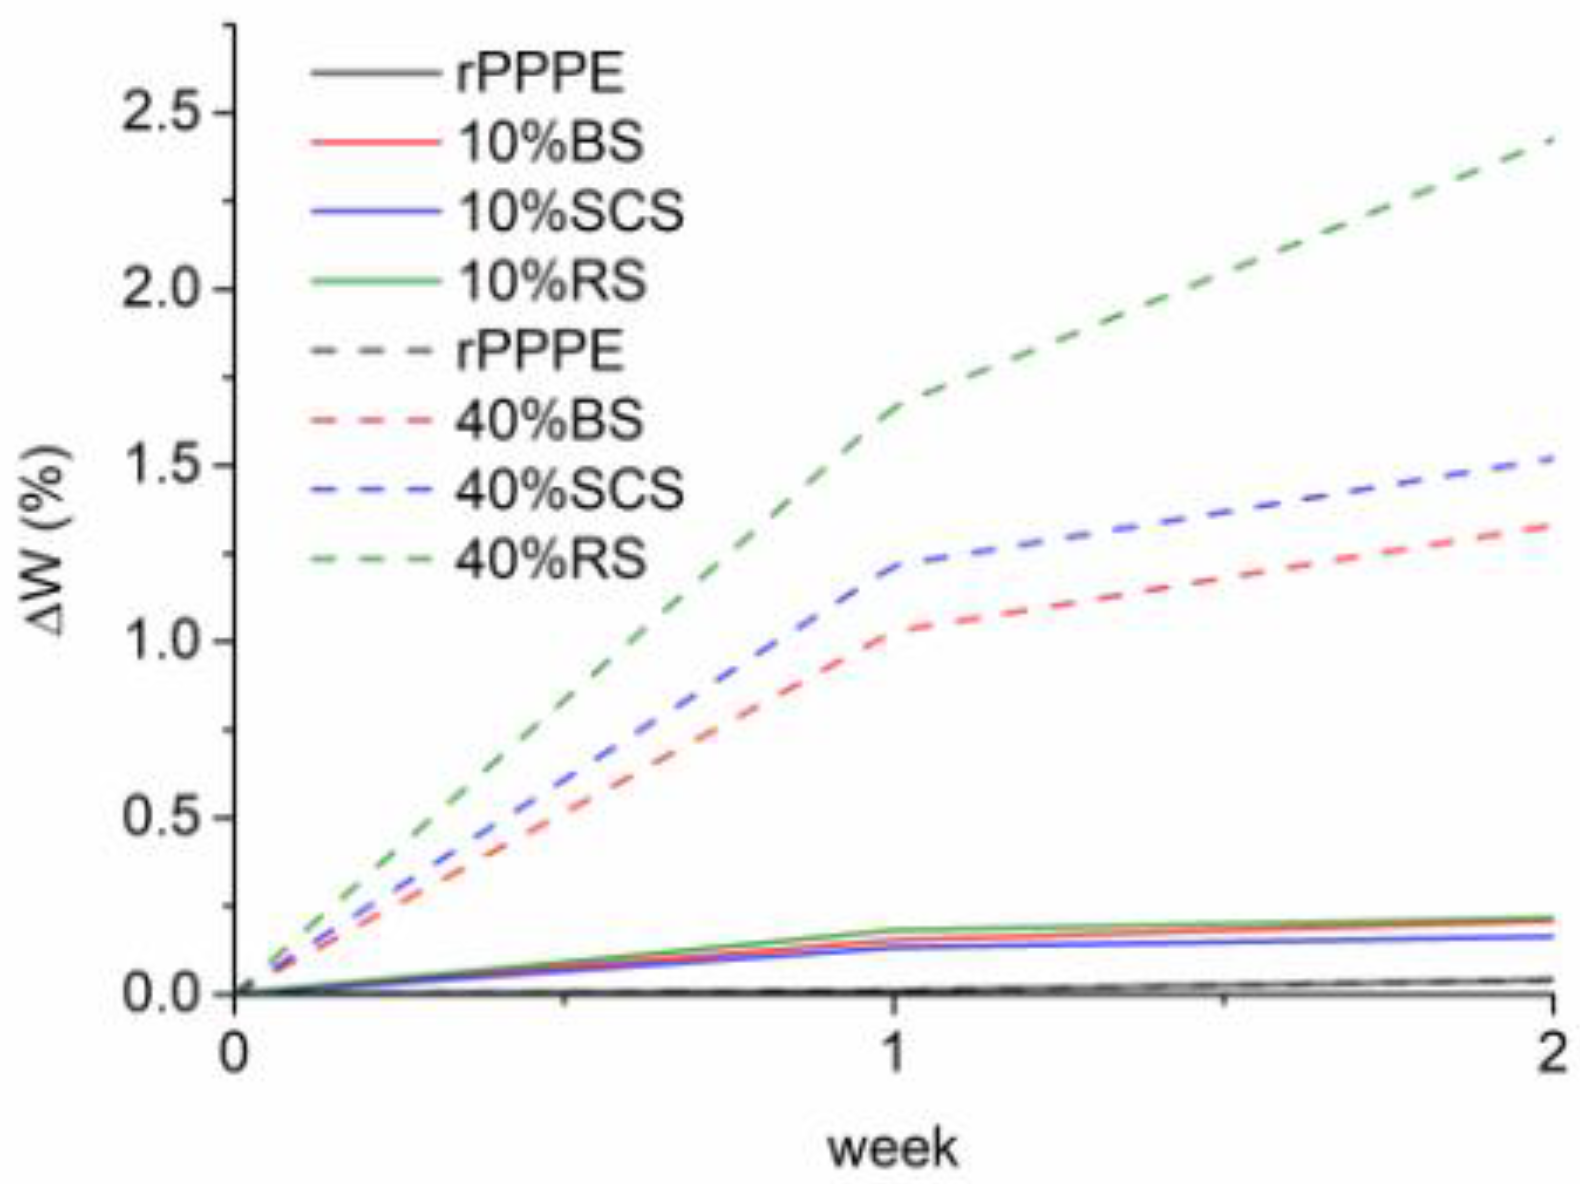
3.4. Moisture Absorption
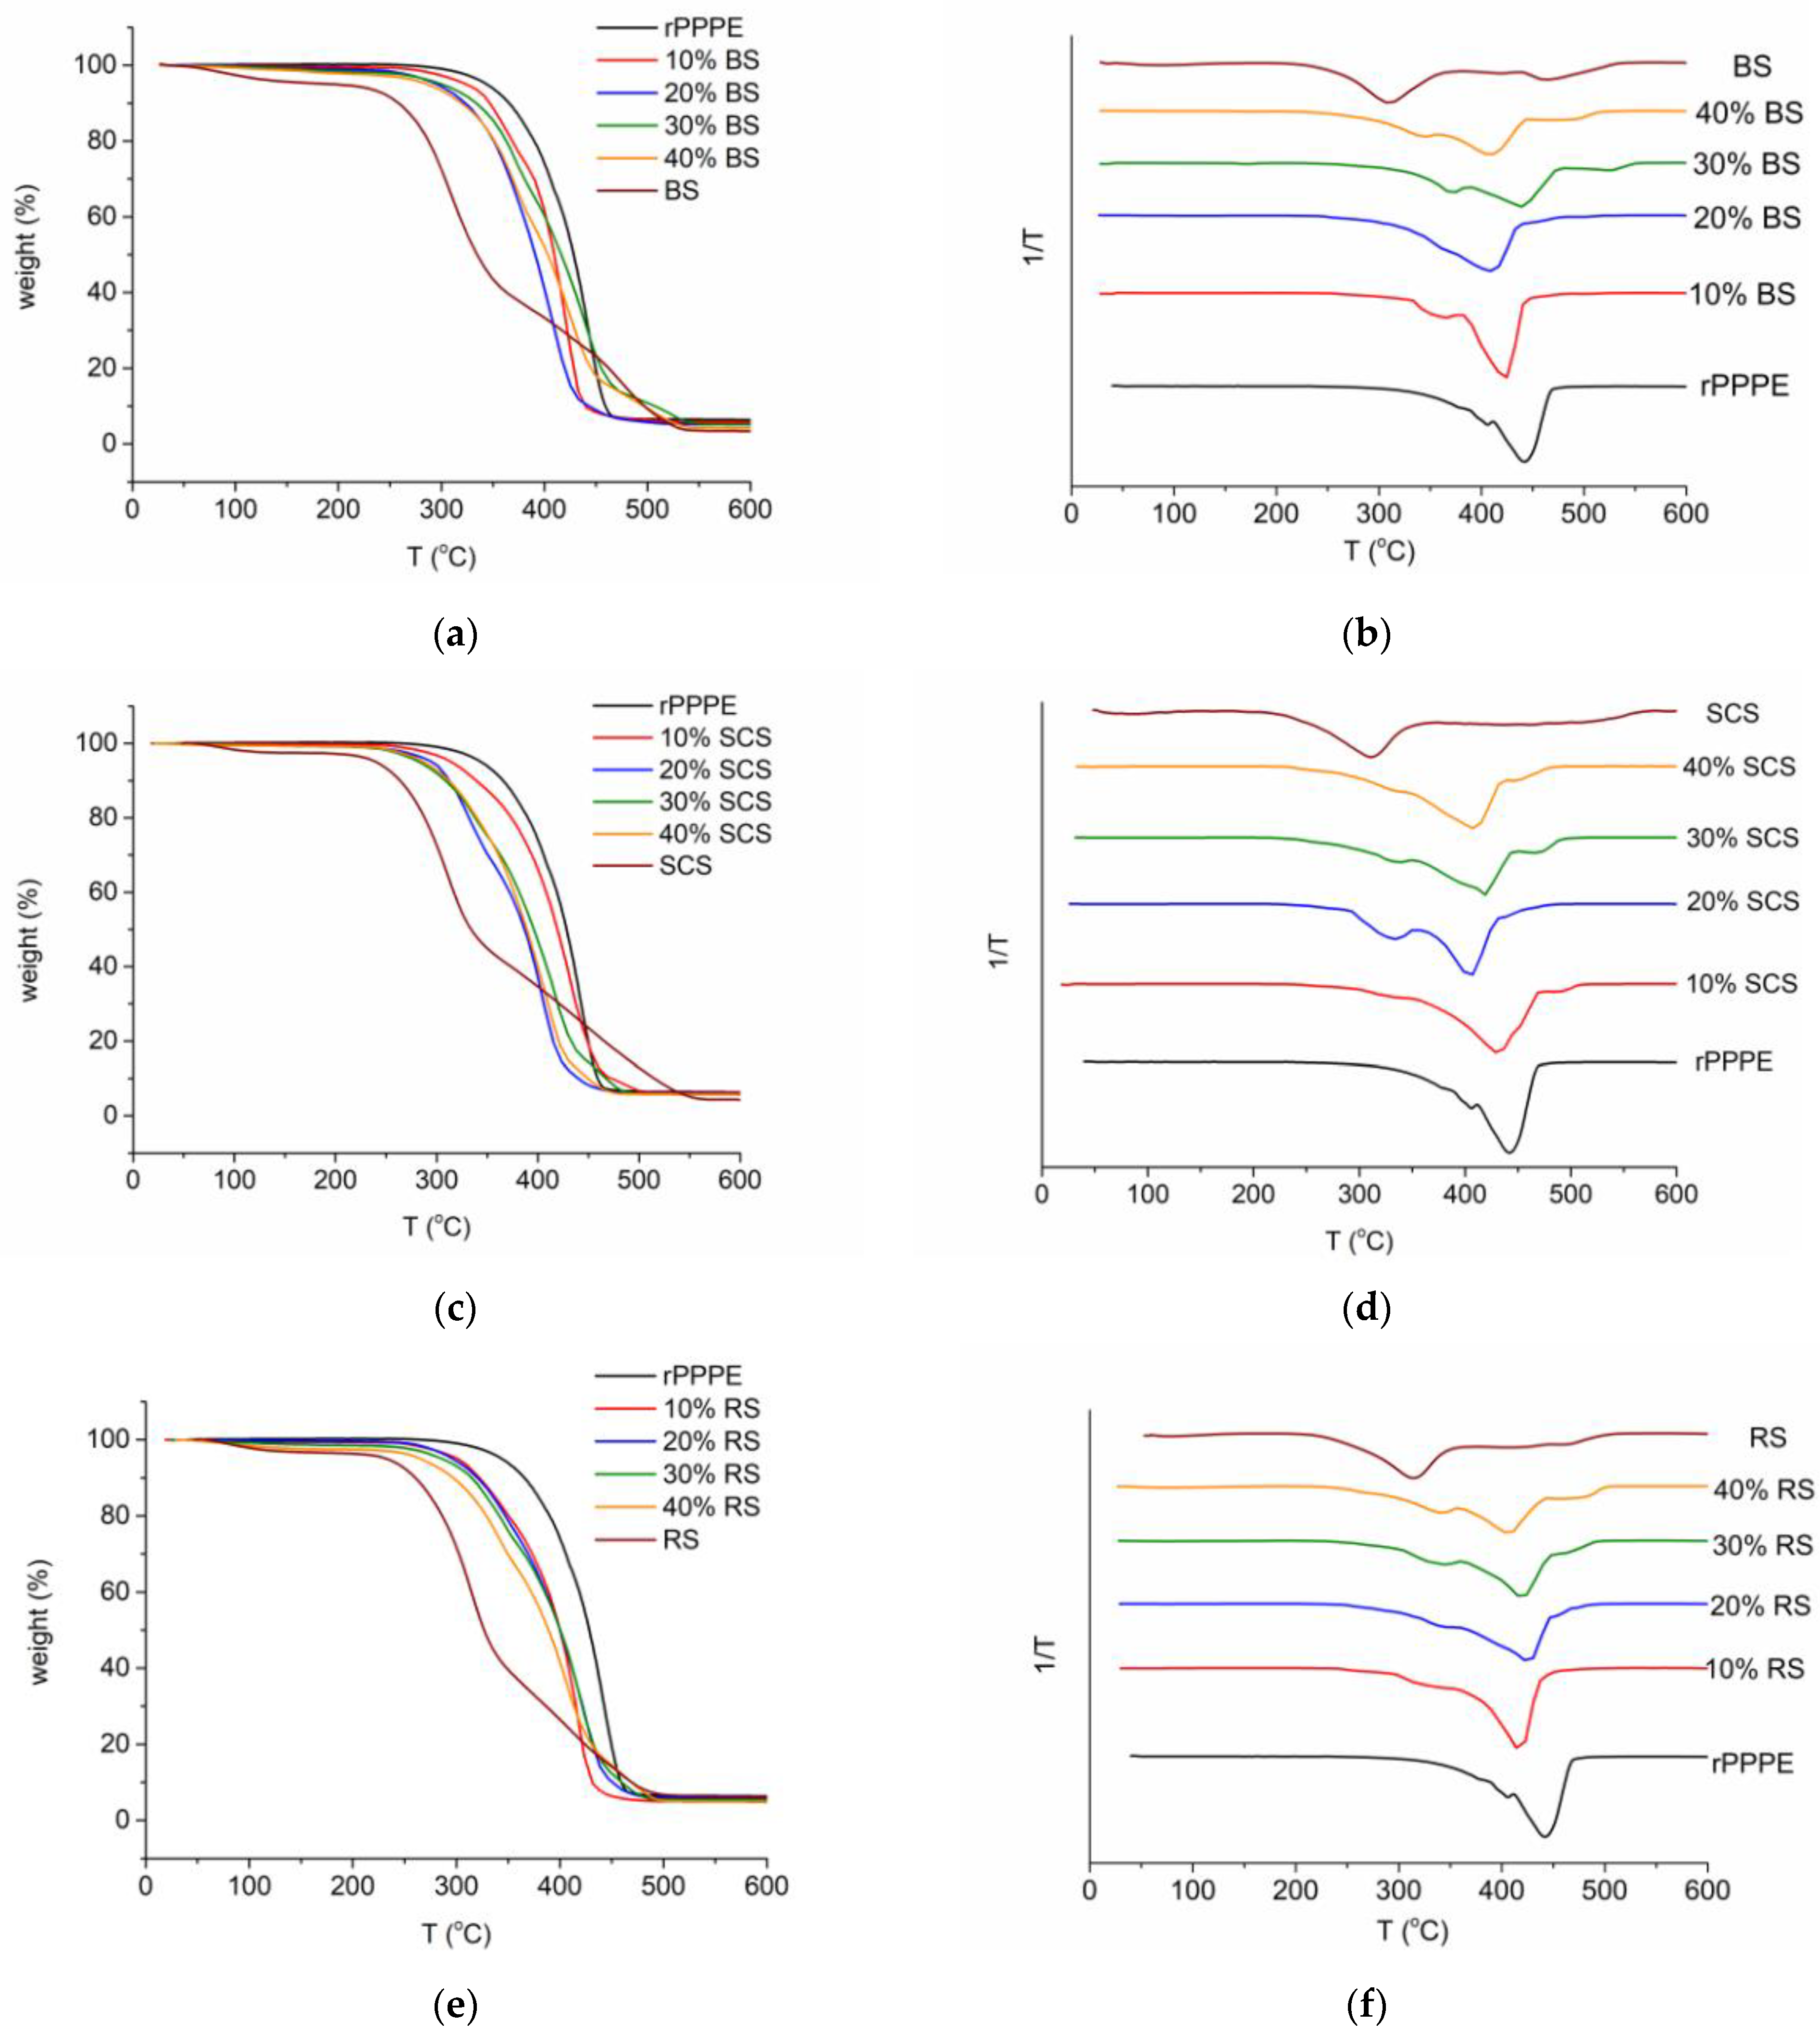
3.5. Thermal Properties
4. Conclusions
Supplementary Materials
Author Contributions
Funding
Institutional Review Board Statement
Data Availability Statement
Acknowledgments
Conflicts of Interest
References
- Zwawi, M. A Review on Natural Fiber Bio-Composites, Surface Modifications and Applications. Molecules 2021, 26, 404. [Google Scholar] [CrossRef] [PubMed]
- Deshmukh, G.S. Advancement in hemp fibre polymer composites: A comprehensive review. J. Polym. Eng. 2022, 42, 575–598. [Google Scholar] [CrossRef]
- Rigal, M.; Rigal, L.; Vilarem, G.; Vandenbossche Maréchal, V. Sweet Clovers, a Source of Fibers Adapted for Growth on Wet and Saline Soils. J. Nat. Fibers 2016, 13, 410–422. [Google Scholar] [CrossRef] [Green Version]
- Andrzejewski, J.; Barczewski, M.; Szostak, M. Injection Molding of Highly Filled Polypropylene-based Biocomposites. Buckwheat Husk and Wood Flour Filler: A Comparison of Agricultural and Wood Industry Waste Utilization. Polymers 2019, 11, 1881. [Google Scholar] [CrossRef] [Green Version]
- Andrzejewski, J.; Krawczak, A.; Wesoły, K.; Szostak, M. Rotational molding of biocomposites with addition of buckwheat husk filler. Structure-property correlation assessment for materials based on polyethylene (PE) and poly(lactic acid) PLA. Compos. B Eng. 2020, 202, 108410. [Google Scholar] [CrossRef]
- Paukszta, D. Mercerisation of Rapeseed Straw Investigated with the Use of Waxs Method. Fibres Text. East. Eur. 2013, 21, 19–23. [Google Scholar]
- Paukszta, D.; Zielińska-Maćkowiak, J. Crystallisation of polypropylene matrix in composites filled with wooden parts of rapeseed straw. J. Therm. Anal. Calorim. 2012, 109, 611–618. [Google Scholar] [CrossRef] [Green Version]
- Paukszta, D.; Jedryczka, M.; Binkiewicz, M. Mechanical properties of polypropylene composites filled with the straw of oilseed rape infested by the fungal pathogen Sclerotinia sclerotiorum. J. Compos. Mater. 2013, 47, 1461–1470. [Google Scholar] [CrossRef]
- Bichi, A.H.; Zhang, K.; Yang, J.; Chen, D. Analysis of the properties of alkaline-treated rape straw and stalk polyvinyl chloride composites. Text. Res. J. 2022, 92, 4008–4019. [Google Scholar] [CrossRef]
- Mirski, R.; Dziurka, D.; Banaszak, A. Effects of manufacture conditions on physical and mechanical properties of rape-polymer boards. Wood Res. 2019, 64, 659–666. [Google Scholar]
- Hysek, Š.; Sikora, A.; Schönfelder, O.; Bohm, M. Physical and Mechanical Properties of Boards Made from Modified Rapeseed Straw Particles. BioResourses 2018, 13, 6396–6408. [Google Scholar] [CrossRef]
- Plastics—The Facts 2021. Available online: https://plasticseurope.org/knowledge-hub/plastics-the-facts-2021/ (accessed on 22 May 2023).
- Statista. Available online: https://www.statista.com/statistics/1118063/global-polyethylene-polypropylene-demand/ (accessed on 11 April 2023).
- Aumnate, C.; Rudolph, N.; Sarmadi, M. Recycling of Polypropylene/Polyethylene Blends: Effect of Chain Structure on the Crystallization Behaviors. Polymers 2019, 11, 1456. [Google Scholar] [CrossRef] [Green Version]
- Srebrenkoska, V.; Dimzoski, B.; Gaceva Bogoeva, G.; Dimeski, D. Recycling ability of the polypropylene for production of the na-tural fiber composites. In Proceedings of the Seminar of Ecology, Sofia, Bulgaria, 23–24 April 2009. [Google Scholar]
- Abdullah, M.Z.; Che Aslan, N.H. Performance Evaluation of Composite from Recycled Polypropylene Reinforced with Mengkuang Leaf Fiber. Resources 2019, 8, 97. [Google Scholar] [CrossRef] [Green Version]
- Castro, B.; Faria, P.; Vieira, L.; Rubio, C.; Maziero, R.; Rodrigues, P.; Campos Rubio, J. Recycled Green PE Composites Rein-forced with Woven and Randomly Arranged Sisal Fibres Processed by Hot Compression Moulding. Acta Technol. Agric. 2020, 23, 81–86. [Google Scholar] [CrossRef]
- Younesi Kordkheili, H.; Pizzi, A. Ionic liquid-modified lignin as a bio-coupling agent for natural fiber-recycled polypropylene composites. Compos. B Eng. 2020, 181, 107587. [Google Scholar] [CrossRef]
- Fazli, A.; Stevanovic, T.; Rodrigue, D. Recycled HDPE/Natural Fiber Composites Modified with Waste Tire Rubber: A Comparison between Injection and Compression Molding. Polymers 2022, 14, 3197. [Google Scholar] [CrossRef]
- Žiganova, M.; Ābele, A.; Iesalniece, Z.; Meri, R.M. Mercerization of Agricultural Waste: Sweet Clover, Buckwheat, and Rapeseed Straws. Fibers 2022, 10, 83. [Google Scholar] [CrossRef]
- Ābele, A.; Bērziņš, R.; Bērziņa, R.; Merijs-Meri, R.; Žiganova, M.; Zicāns, J. Potential uses of N-methylmorpholine N-oxide for the treatment of agricultural waste biomass. Proc. Est. Acad. Sci. 2023, 72, 176–183. [Google Scholar] [CrossRef]
- Boey, J.Y.; Lee, C.K.; Tay, G.S. Factors Affecting mechanical properties of reinforced bioplastic: A review. Polymers 2022, 14, 3737. [Google Scholar] [CrossRef]
- Bogataj, V.Ž.; Fajs, P.; Peñalva, C.; Omahen, M.; Čop, M.; Henttonen, A. Utilization of recycled polypropylene, cellulose and newsprint fibres for production of green composites. Detritus 2019, 7, 36–43. [Google Scholar] [CrossRef]
- Spinacé, M.A.S.; Fermoseli, K.K.G.; De Paoli, M.-A. Recycled polypropylene reinforced with curaua fibers by extrusion. J. Appl. Polym. Sci. 2009, 112, 3686–3694. [Google Scholar] [CrossRef]
- Huda, M.S.; Drzal, L.T.; Mohanty, A.K.; Misra, M. Chopped glass and recycled newspaper as reinforcement fibers in injection molded poly(lactic acid) (PLA) composites: A comparative study. Compos. Sci. Technol. 2006, 66, 1813–1824. [Google Scholar] [CrossRef]
- Moreno, D.D.P.; Saron, C. Low-density polyethylene waste/recycled wood composites. Compos. Struct. 2017, 176, 1152–1157. [Google Scholar] [CrossRef]
- Vallejos, M.E.; Vilaseca, F.; Méndez, J.A.; Espinach, F.X.; Aguado, R.J.; Delgado-Aguilar, M.; Mutjé, P. Response of Polypropylene Composites Reinforced with Natural Fibers: Impact Strength and Water-Uptake Behaviors. Polymers 2023, 15, 900. [Google Scholar] [CrossRef]
- Sahai, R.; Pardeshi, R. Comparative study of effect of different coupling agent on mechanical properties and water absorption on wheat straw-reinforced polystyrene composites. J. Thermoplast. Compos. Mater. 2021, 34, 433–450. [Google Scholar] [CrossRef]
- Pušnik Črešnar, K.; Fras Zemljič, L.; Slemenik Perše, L.; Bek, M. Effect of Wood Fiber Loading on the Chemical and Thermo-Rheological Properties of Unrecycled and Recycled Wood-Polymer Composites. Appl. Sci. 2020, 10, 8863. [Google Scholar] [CrossRef]
- Ogah, A.; Afiukwa, J.; Nduji, A. Characterization and Comparison of Rheological Properties of Agro Fiber Filled High-Density Polyethylene Bio-Composites. Open J. Polym. Chem. 2014, 4, 12–19. [Google Scholar] [CrossRef] [Green Version]
- Mazzanti, V.; Mollica, F. A Review of Wood Polymer Composites Rheology and Its Implications for Processing. Polymers 2020, 12, 2304. [Google Scholar] [CrossRef]
- Părpăriţă, E.; Nicoleta Darie, R.; Popescu, C.M.; Uddin, A.; Vasile, C. Structure–morphology–mechanical properties relationship of some polypropylene/lignocellulosic composites. Mater. Des. 2014, 56, 763–772. [Google Scholar] [CrossRef]
- Sahu, P.; Gupta, M. Water absorption behavior of cellulosic fibres polymer composites: A review on its effects and remedies. J. Ind. Text. 2022, 51, 7480S–7512S. [Google Scholar] [CrossRef]
- Réquilé, S.; Duigou, A.; Bourmaud, A.; Baley, C. Moisture induced hygroscopic and mechanical properties of hemp reinforced biocomposite. In Proceedings of the 18th European Conference on Composite Materials, Athens, Greece, 24–28 June 2018. [Google Scholar]


| Samples | Matrix Content (wt.%) | Fibers Content (wt.%) | MAH (wt.%) | IRGA (wt.%) |
|---|---|---|---|---|
| rPPPE | 100 | - | - | - |
| 10% BS | 90 | 10 | 3 | 1 |
| 20% BS | 80 | 20 | ||
| 30% BS | 70 | 30 | ||
| 40% BS | 60 | 40 | ||
| 10% SCS | 90 | 10 | ||
| 20% SCS | 80 | 20 | ||
| 30% SCS | 70 | 30 | ||
| 40% SCS | 60 | 40 | ||
| 10% RS | 90 | 10 | ||
| 20% RS | 80 | 20 | ||
| 30% RS | 70 | 30 | ||
| 40% RS | 60 | 40 |
| Fiber wt.% | Gc(Pa)_BS | Gc(Pa)_SCS | Gc(Pa)_RS |
|---|---|---|---|
| 0 | 23,695 | 23,695 | 23,695 |
| 10 | 22,666 | 39,604 | 27,716 |
| 20 | 33,168 | 48,479 | 28,062 |
| 30 | 40,269 | 75,043 | 40,225 |
| 40 | 63,921 | 89,540 | 50,044 |
Disclaimer/Publisher’s Note: The statements, opinions and data contained in all publications are solely those of the individual author(s) and contributor(s) and not of MDPI and/or the editor(s). MDPI and/or the editor(s) disclaim responsibility for any injury to people or property resulting from any ideas, methods, instructions or products referred to in the content. |
© 2023 by the authors. Licensee MDPI, Basel, Switzerland. This article is an open access article distributed under the terms and conditions of the Creative Commons Attribution (CC BY) license (https://creativecommons.org/licenses/by/4.0/).
Share and Cite
Ābele, A.; Merijs-Meri, R.; Žiganova, M.; Iesalniece, Z.; Bochkov, I. Effect of Agricultural Biomass Residues on the Properties of Recycled Polypropylene/Polyethylene Composites. Polymers 2023, 15, 2672. https://doi.org/10.3390/polym15122672
Ābele A, Merijs-Meri R, Žiganova M, Iesalniece Z, Bochkov I. Effect of Agricultural Biomass Residues on the Properties of Recycled Polypropylene/Polyethylene Composites. Polymers. 2023; 15(12):2672. https://doi.org/10.3390/polym15122672
Chicago/Turabian StyleĀbele, Agnese, Remo Merijs-Meri, Madara Žiganova, Zanda Iesalniece, and Ivan Bochkov. 2023. "Effect of Agricultural Biomass Residues on the Properties of Recycled Polypropylene/Polyethylene Composites" Polymers 15, no. 12: 2672. https://doi.org/10.3390/polym15122672