
Thermal Conductivity and Phase-Change Properties of Boron Nitride–Lead Oxide Nanoparticle-Doped Polymer Nanocomposites
 , , and
Abstract
:1. Introduction
2. Materials and Methods
2.1. Materials
2.2. Polymers
2.2.1. Synthesis of the PEG DM Macrocrosslinkers and the PS-PEG Block Copolymers
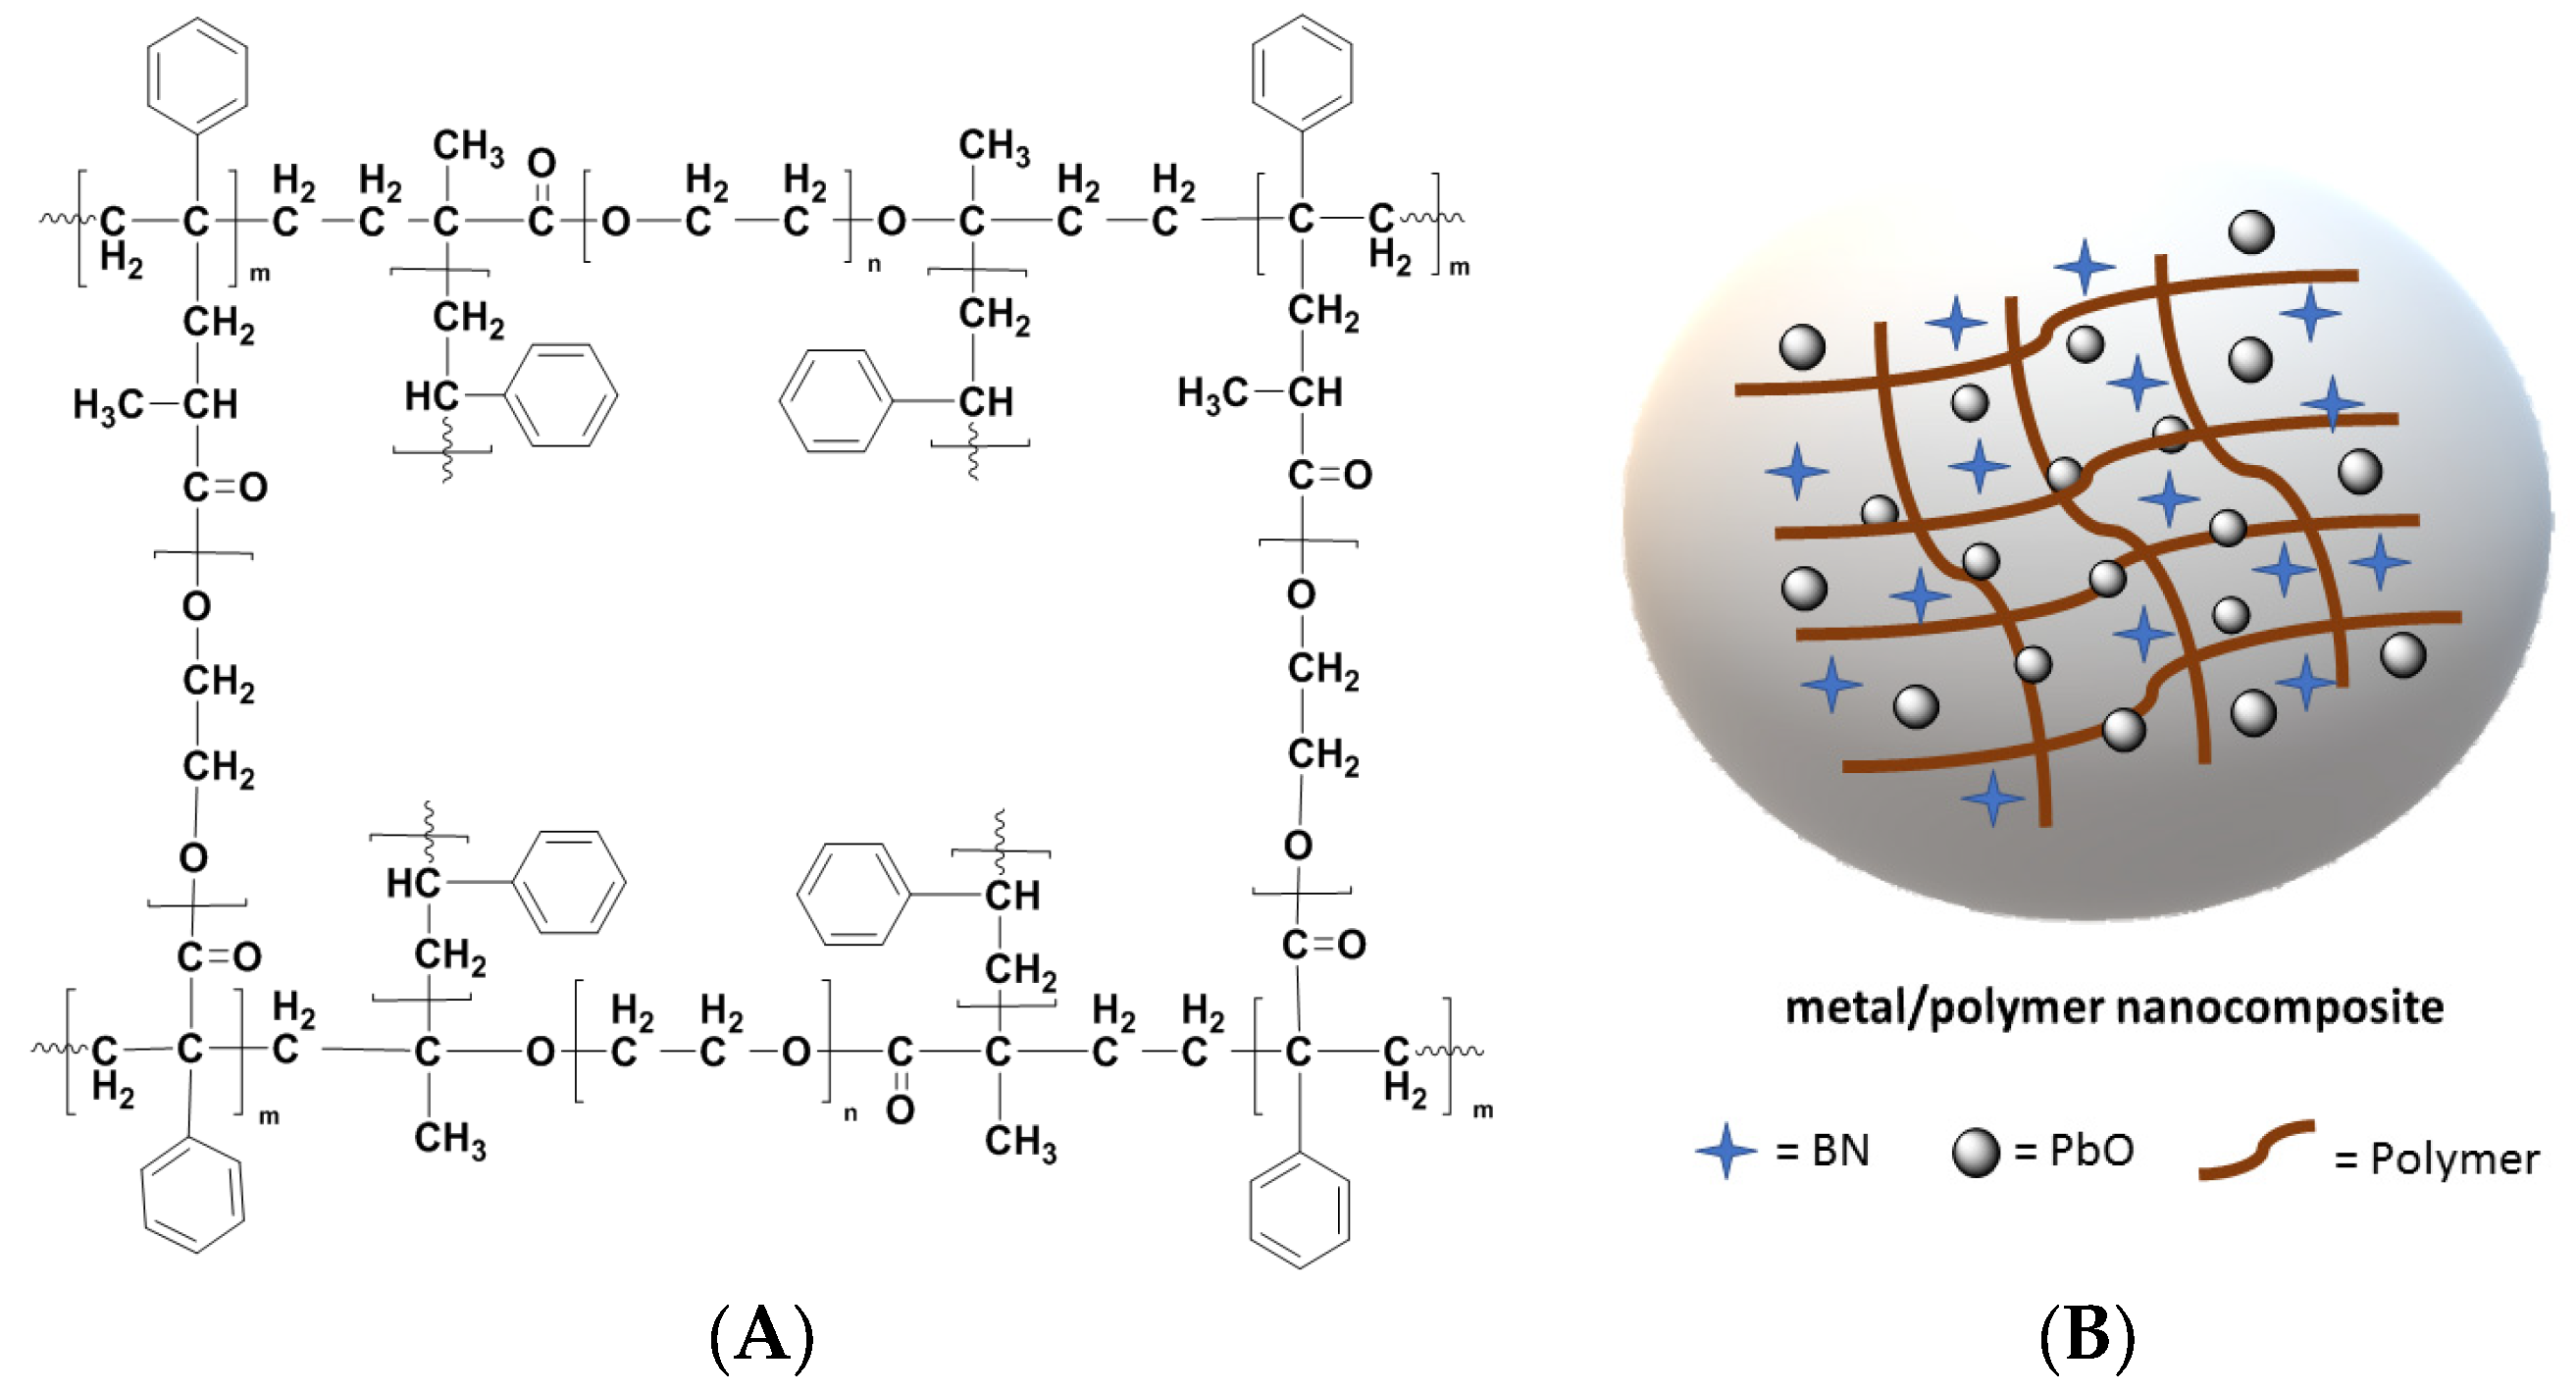
2.2.2. Preparation of the BN- and PbO-Doped PS-PEG PCM Nanocomposites
2.3. Characterizations
2.3.1. Thermal Properties
TGA Method
DSC Method
2.4. Thermal Conductivity Method
2.5. Morphology
2.5.1. SEM Analysis
2.5.2. TEM Analysis
2.5.3. XRD Method
3. Results and Discussion
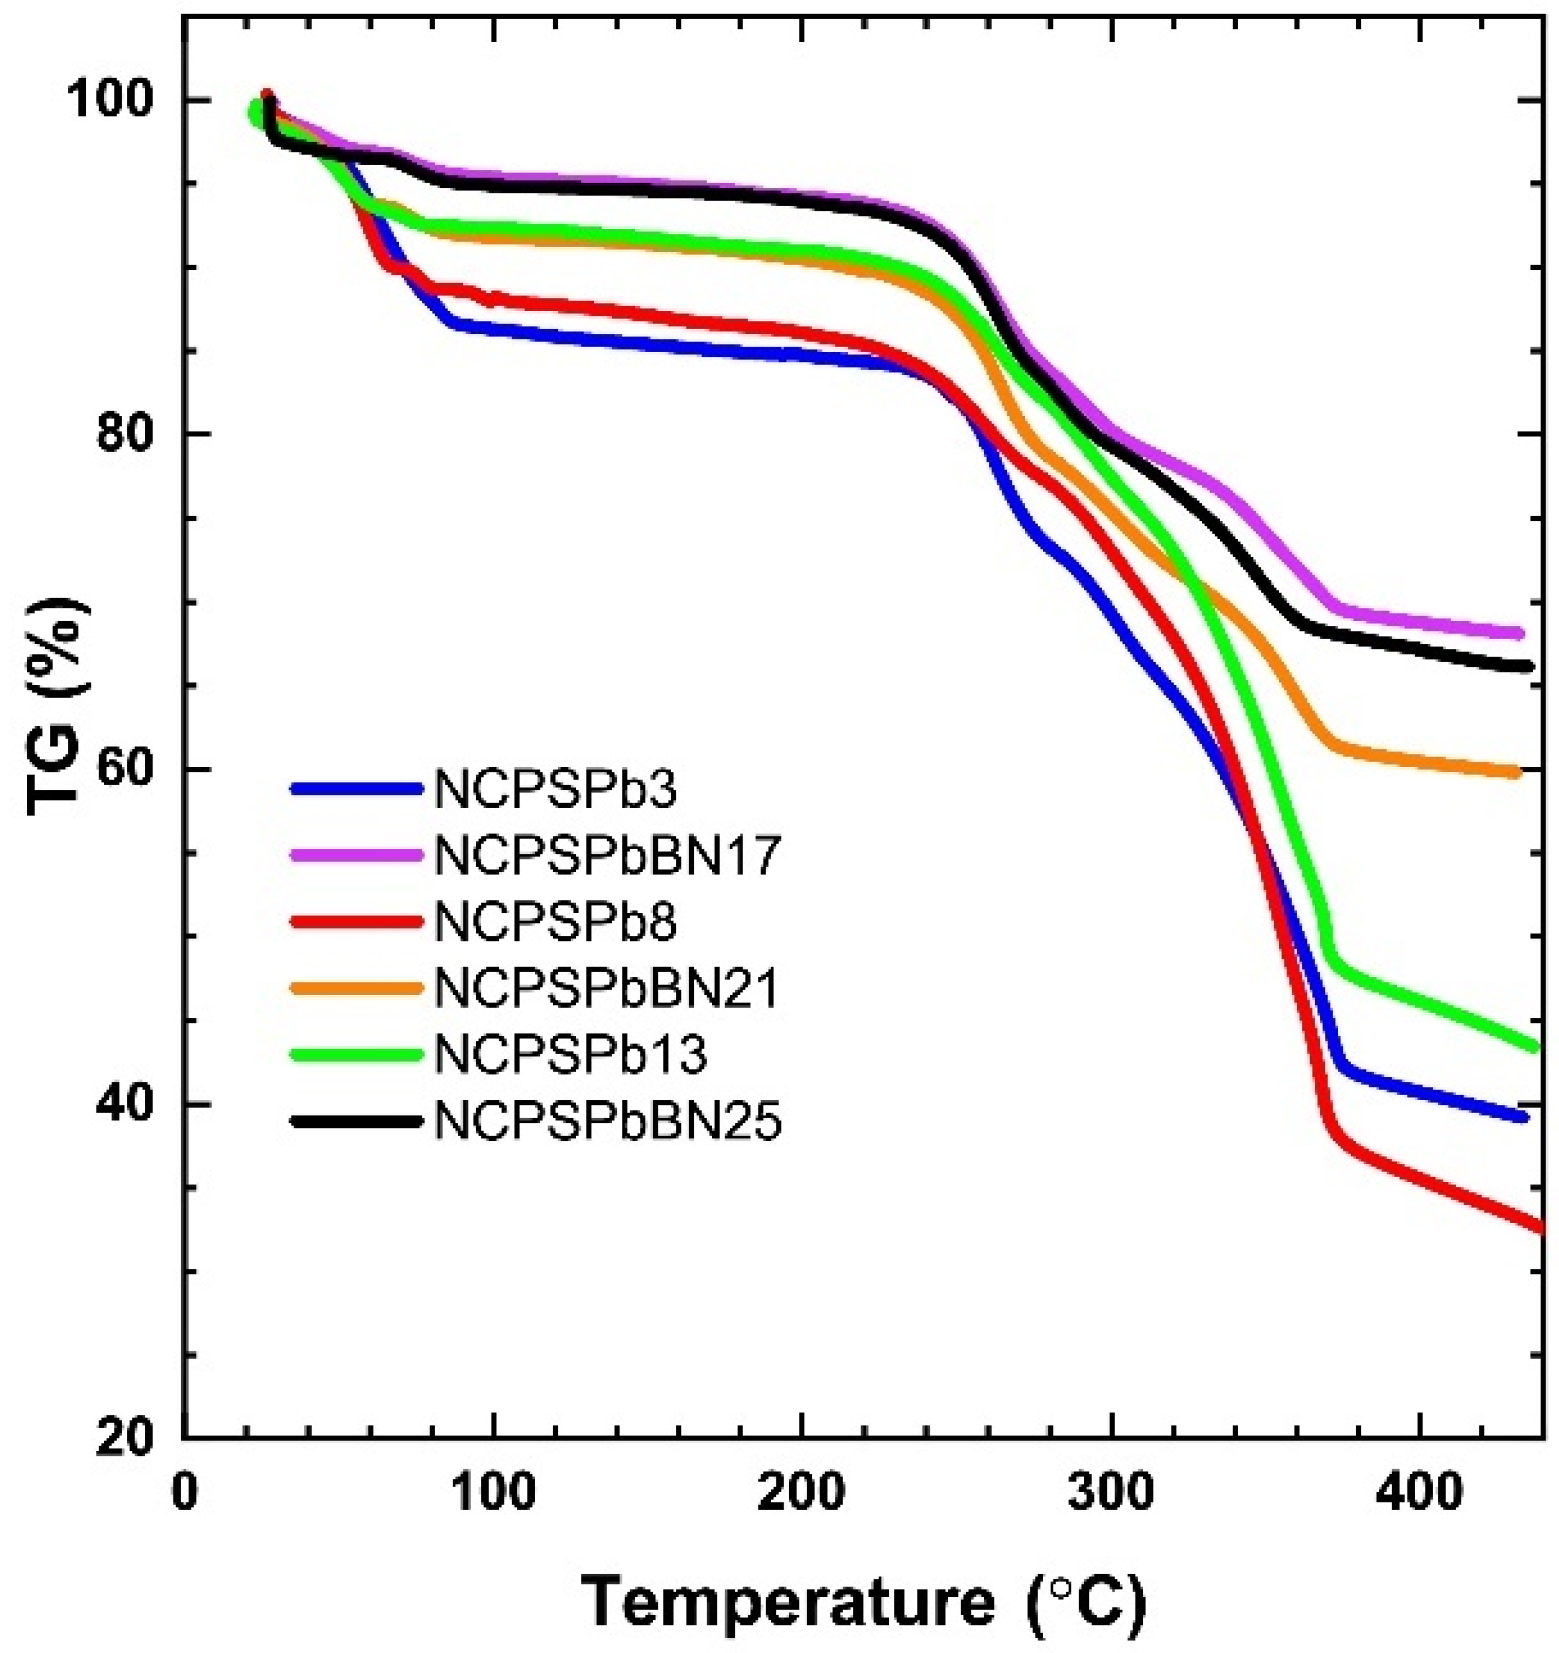
3.1. TGA Measurements of the PS-PEG-PbO and -BN Nanocomposite PCMs
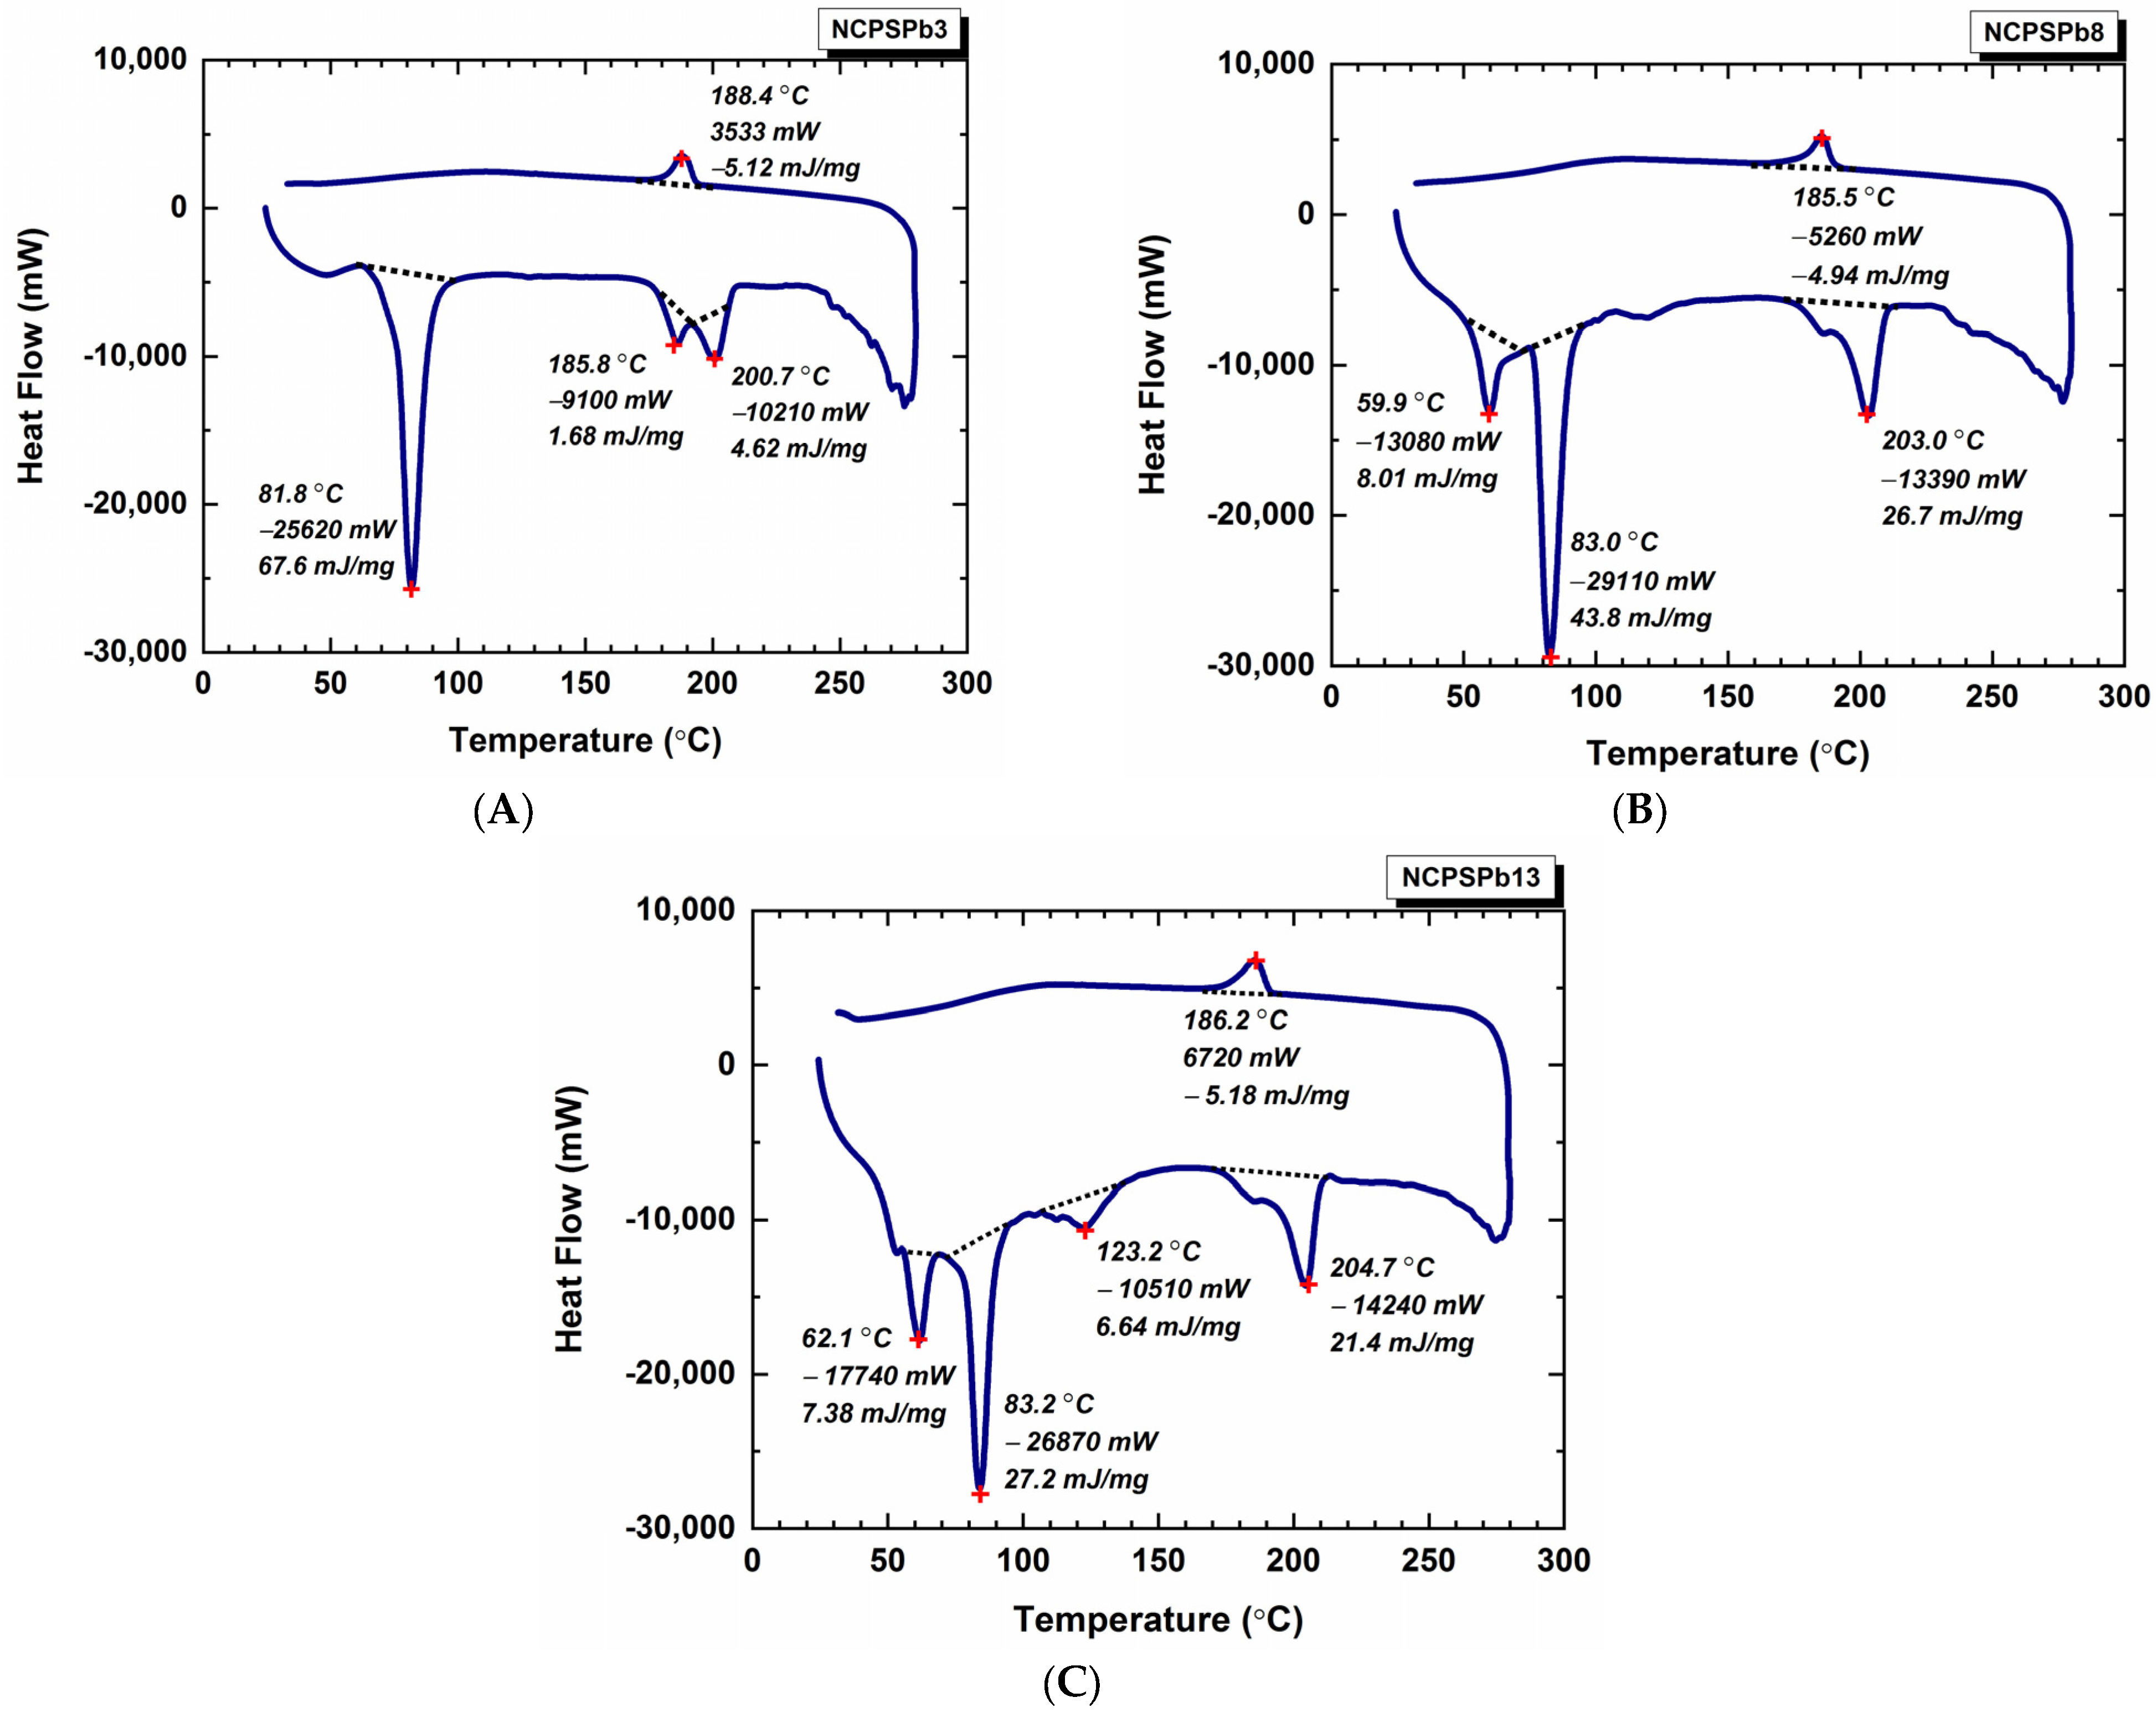
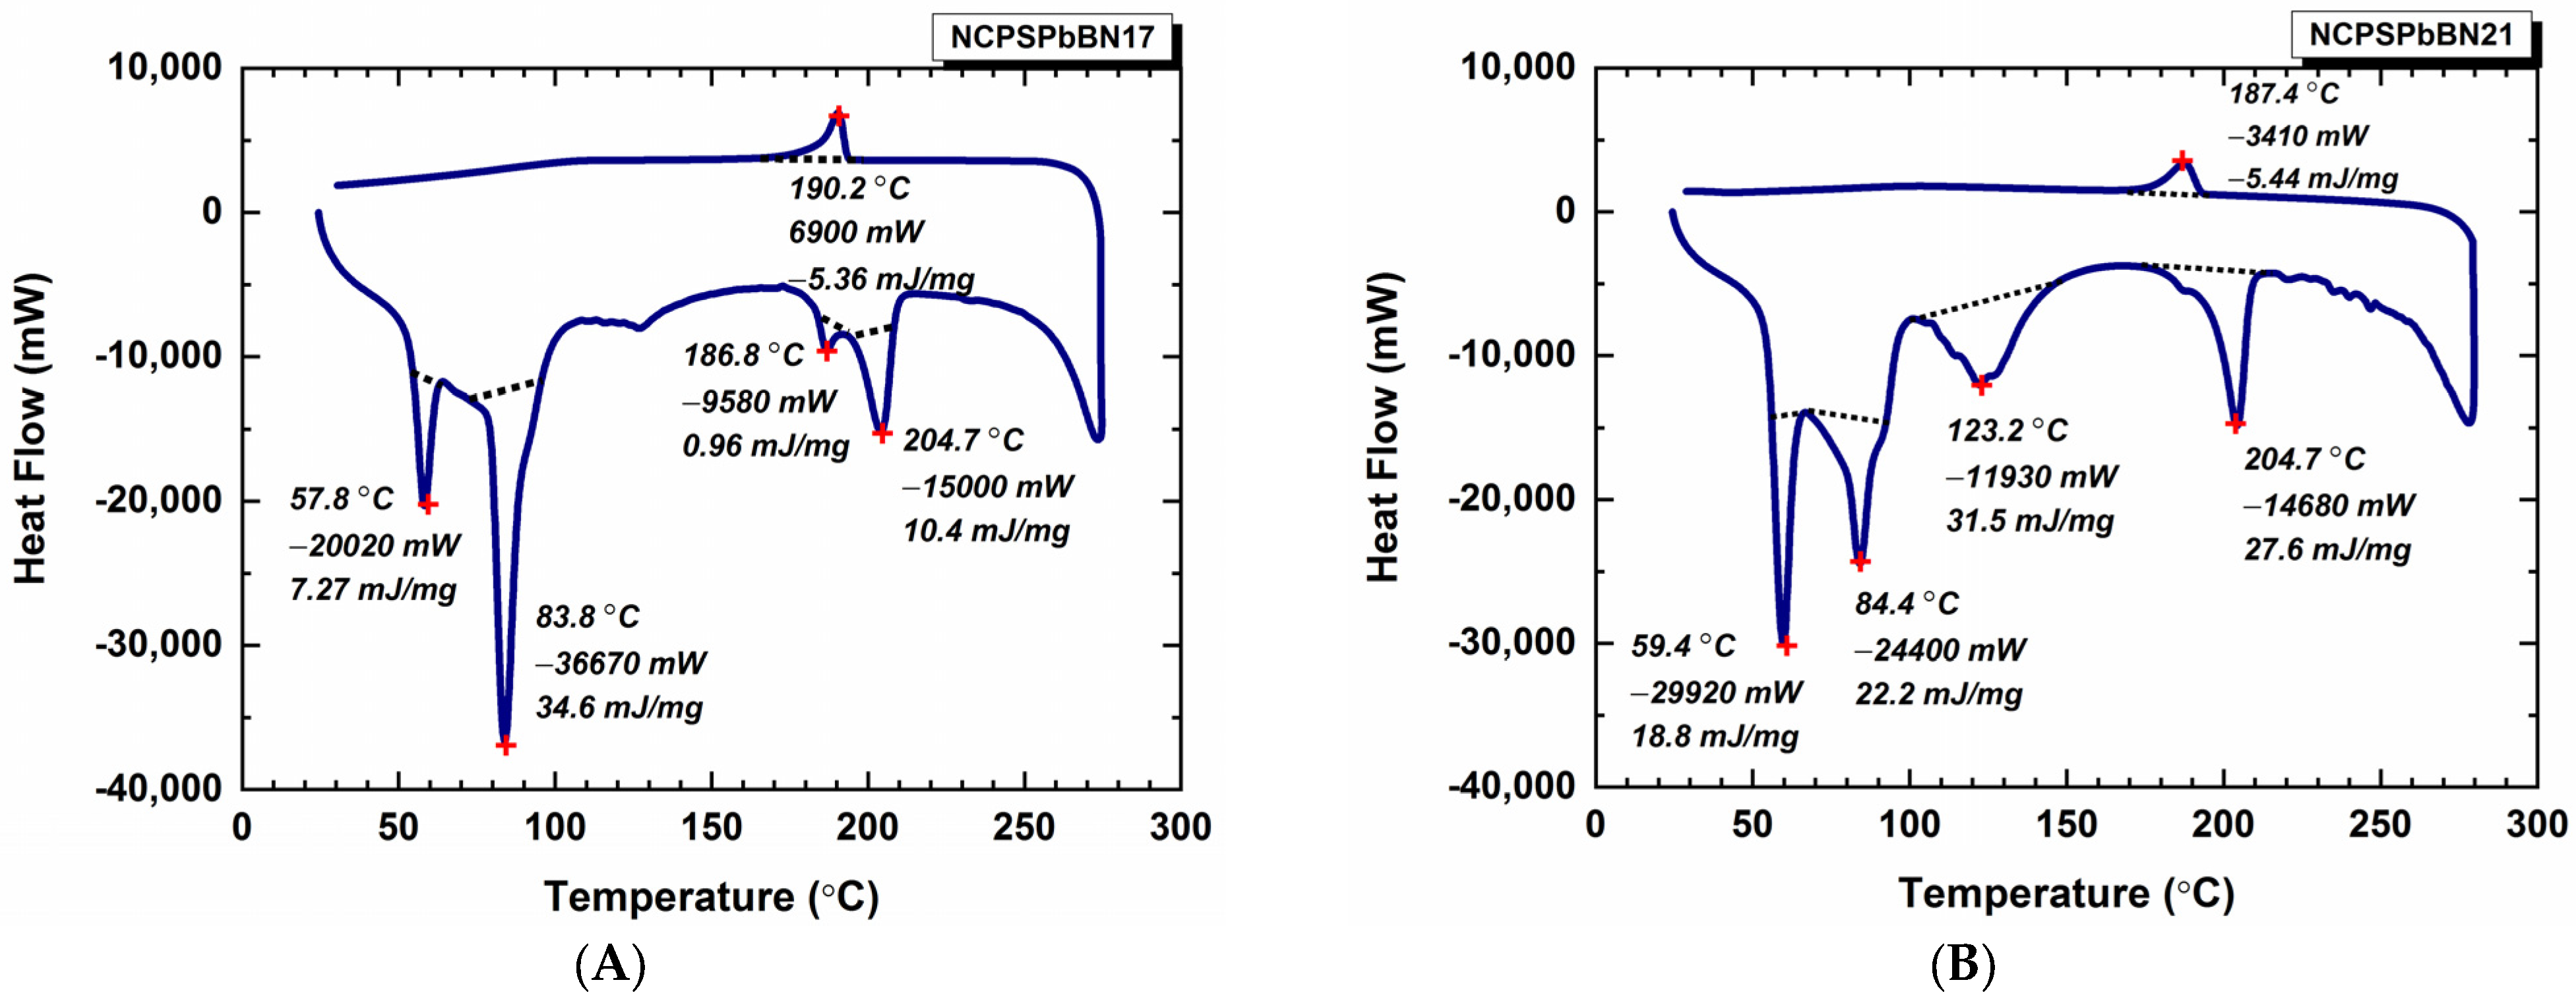
3.2. DSC Results of the PS-PEG/BN/PbO PCM Nanocomposites
3.3. Thermal Conductivity
3.4. Morphology Results
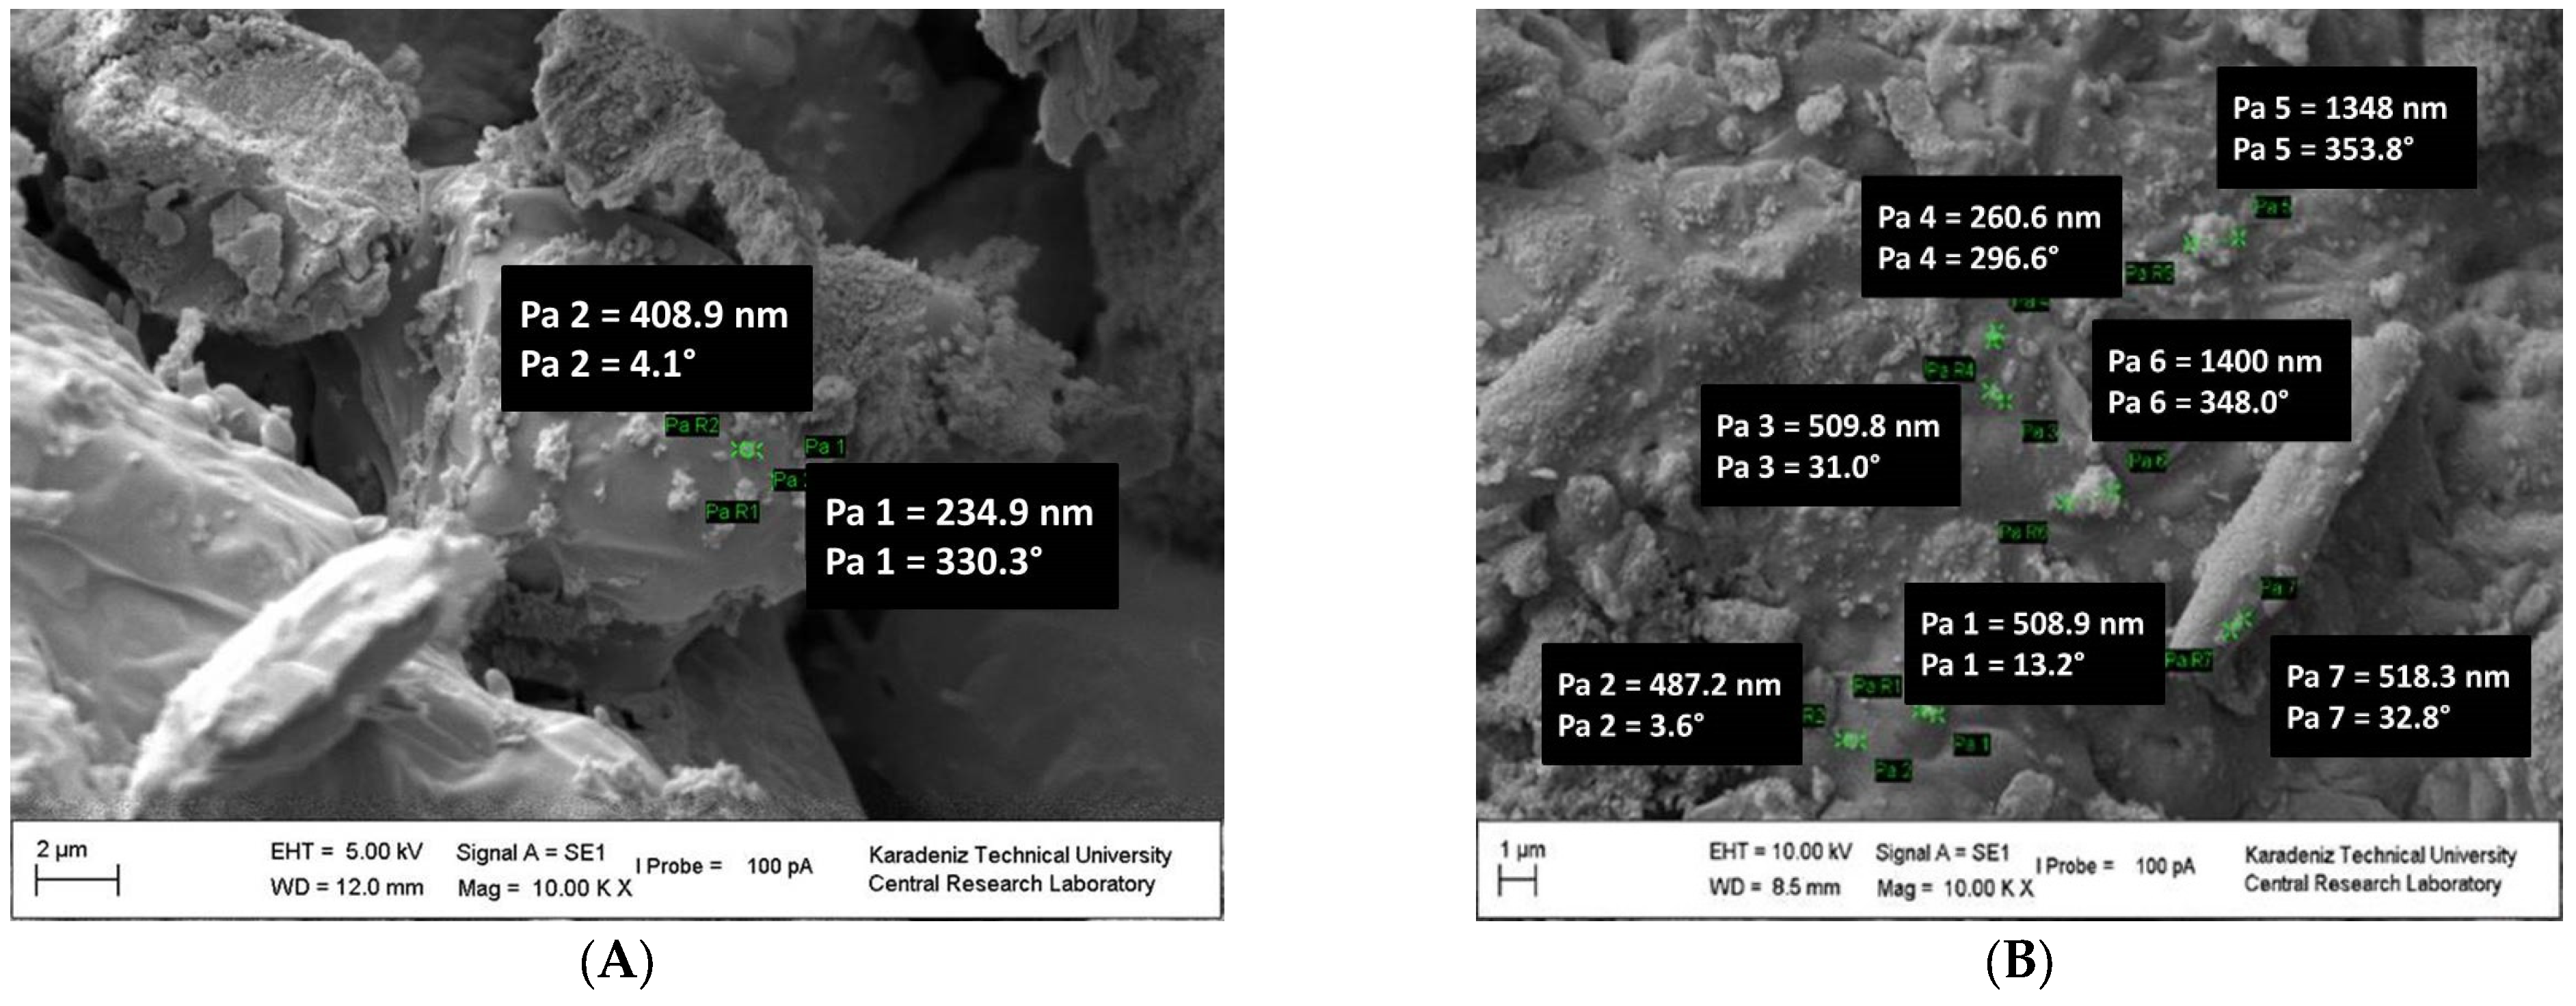
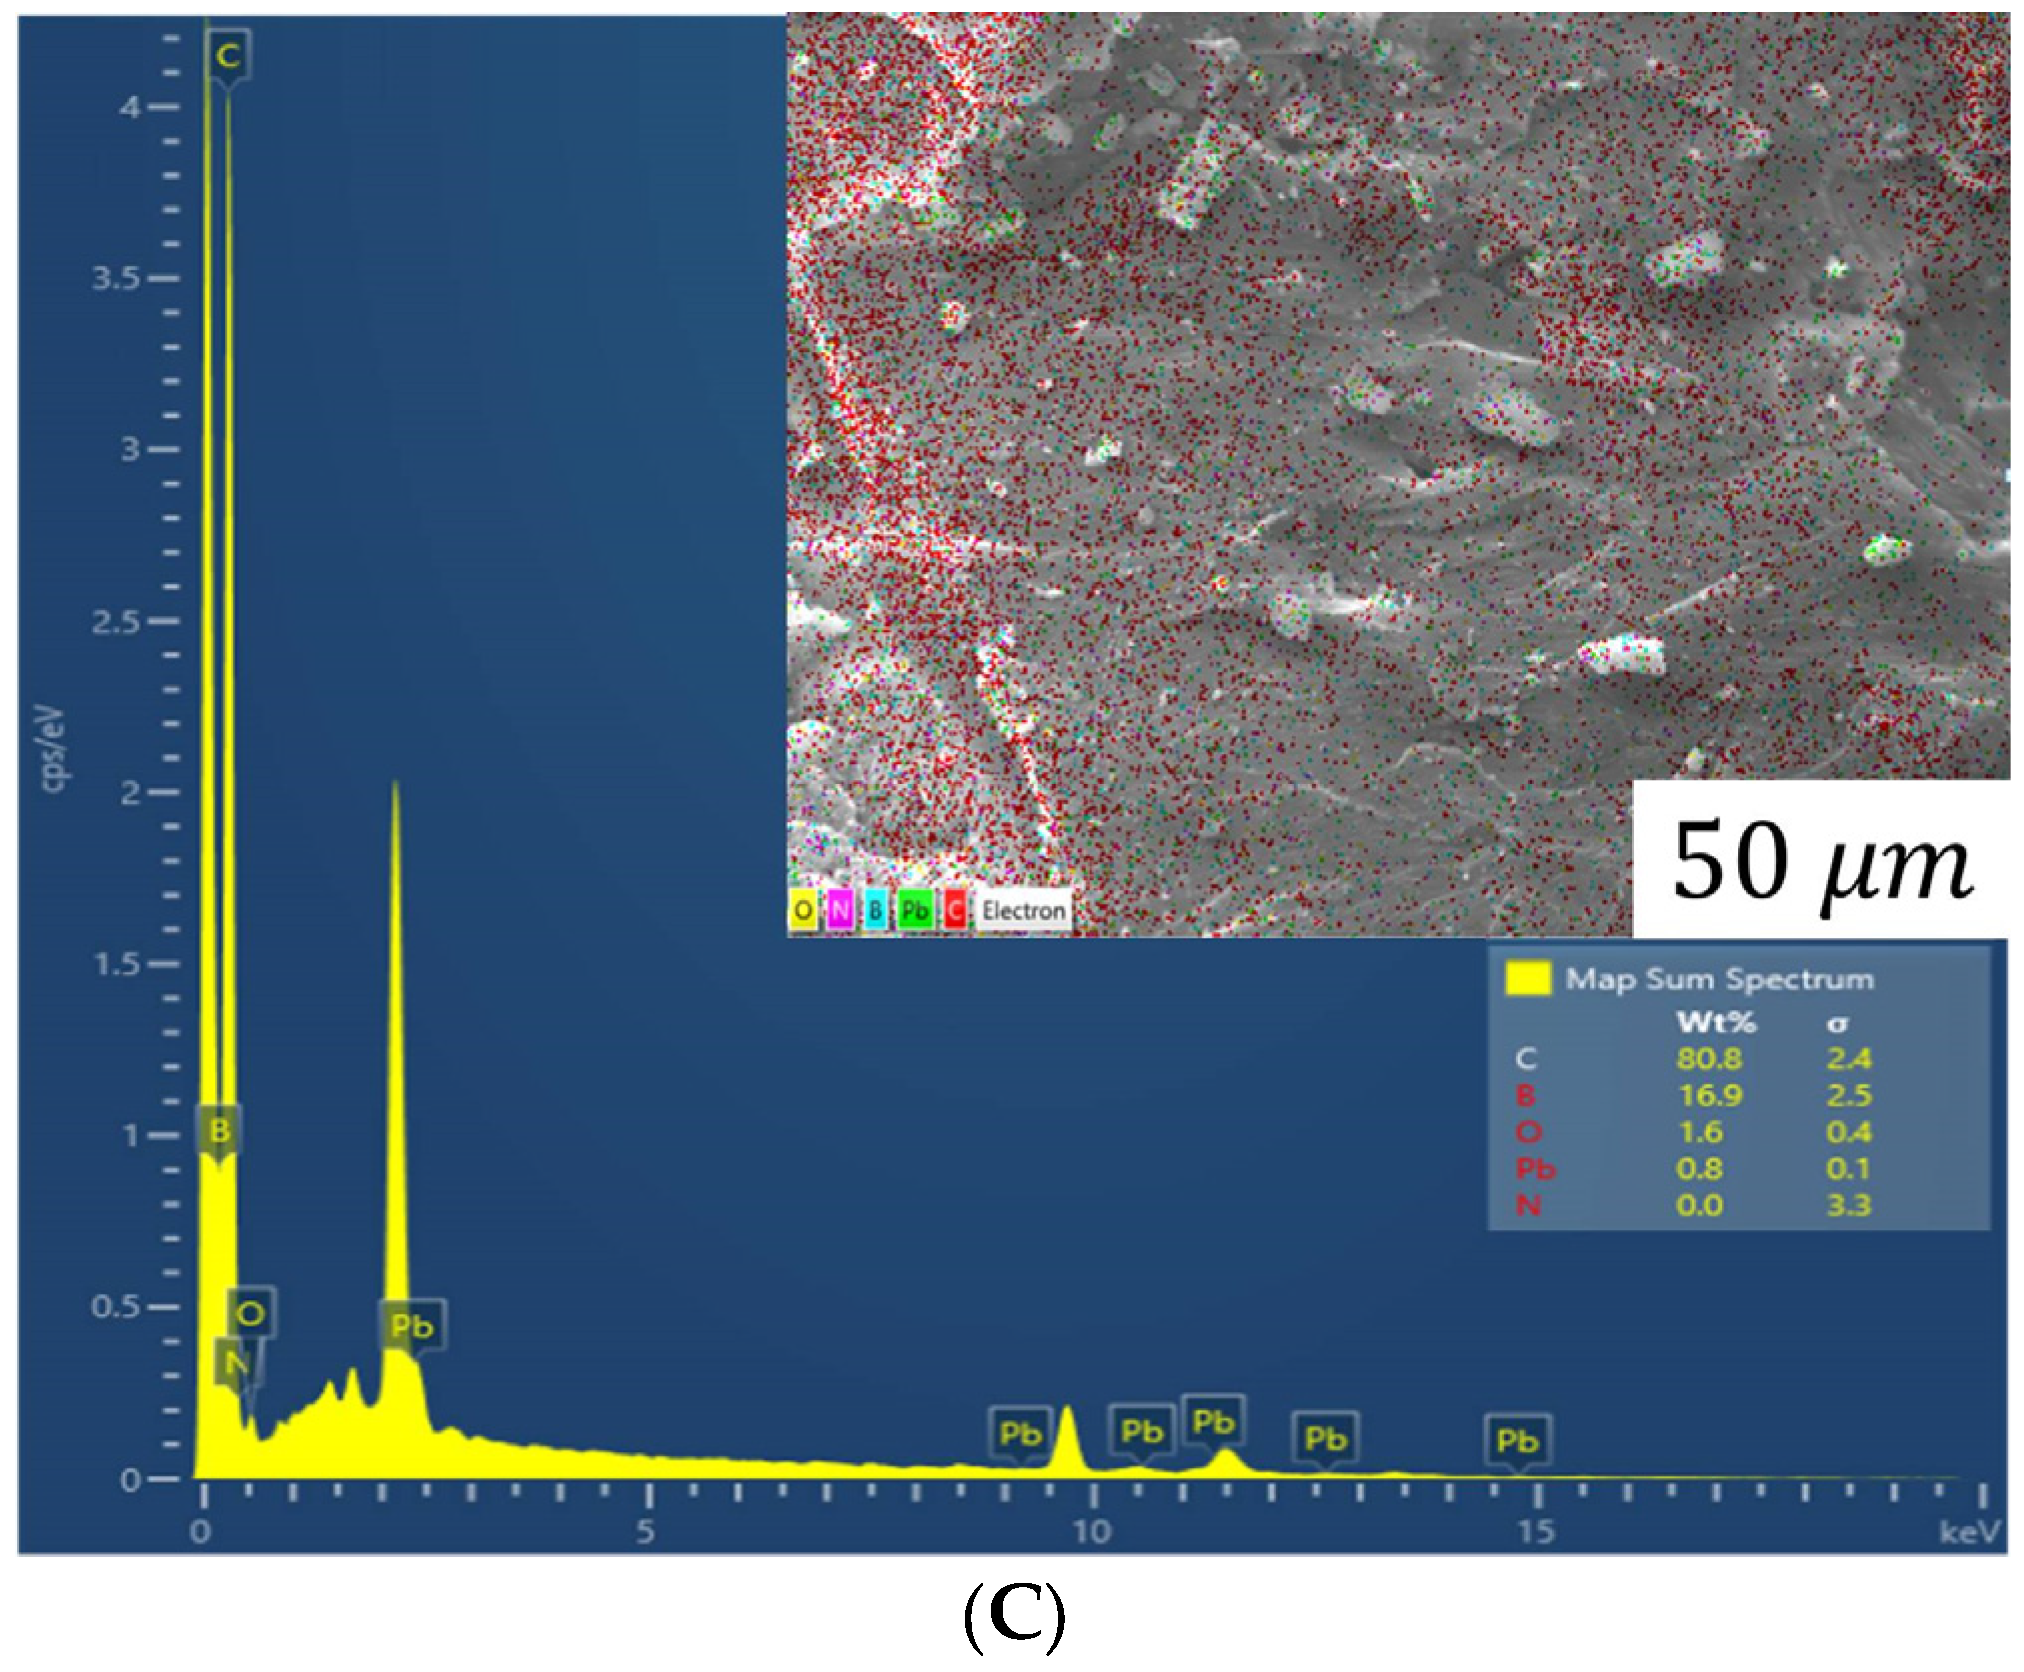
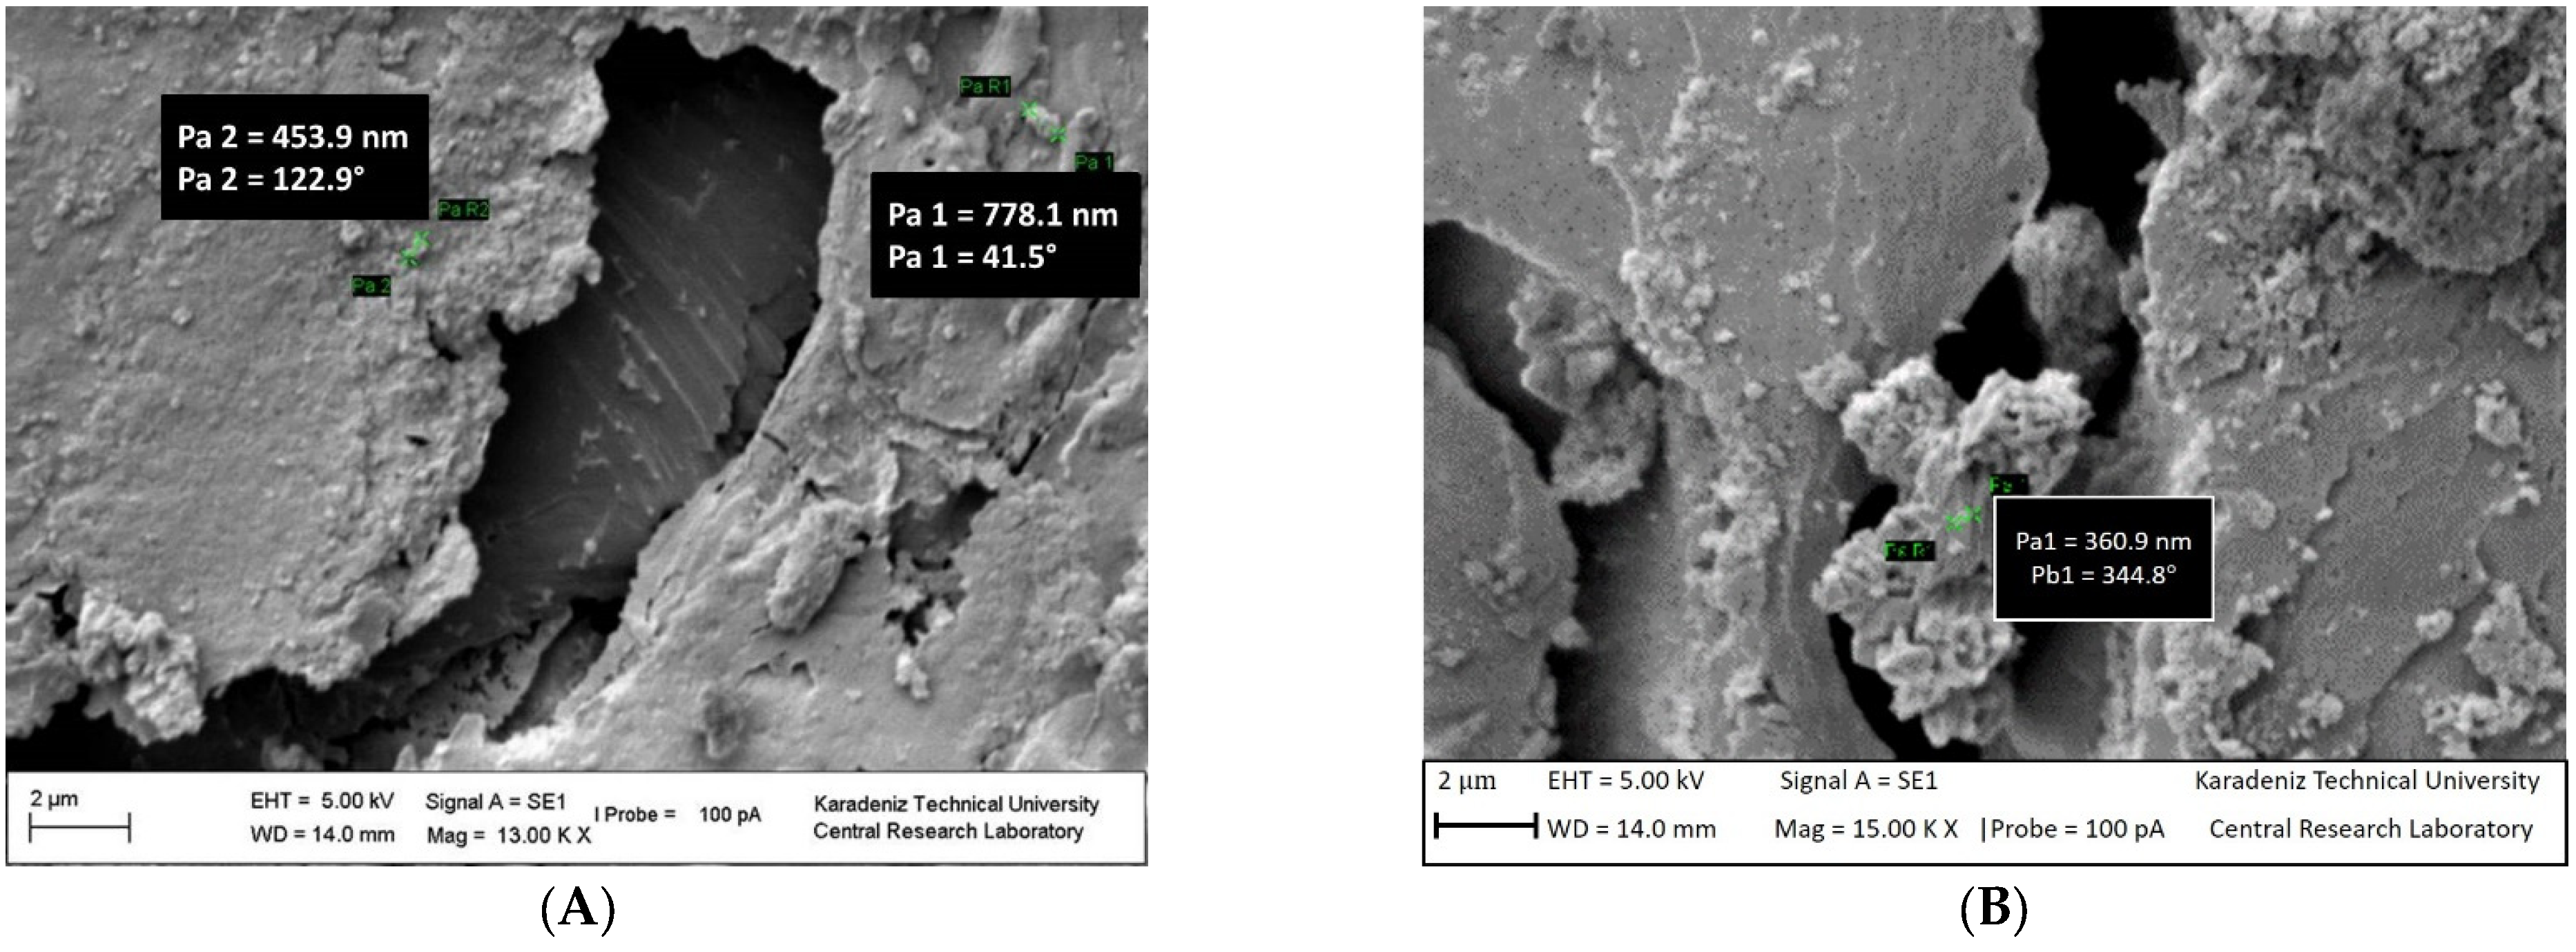
3.4.1. SEM Images of the PCM Nanocomposites
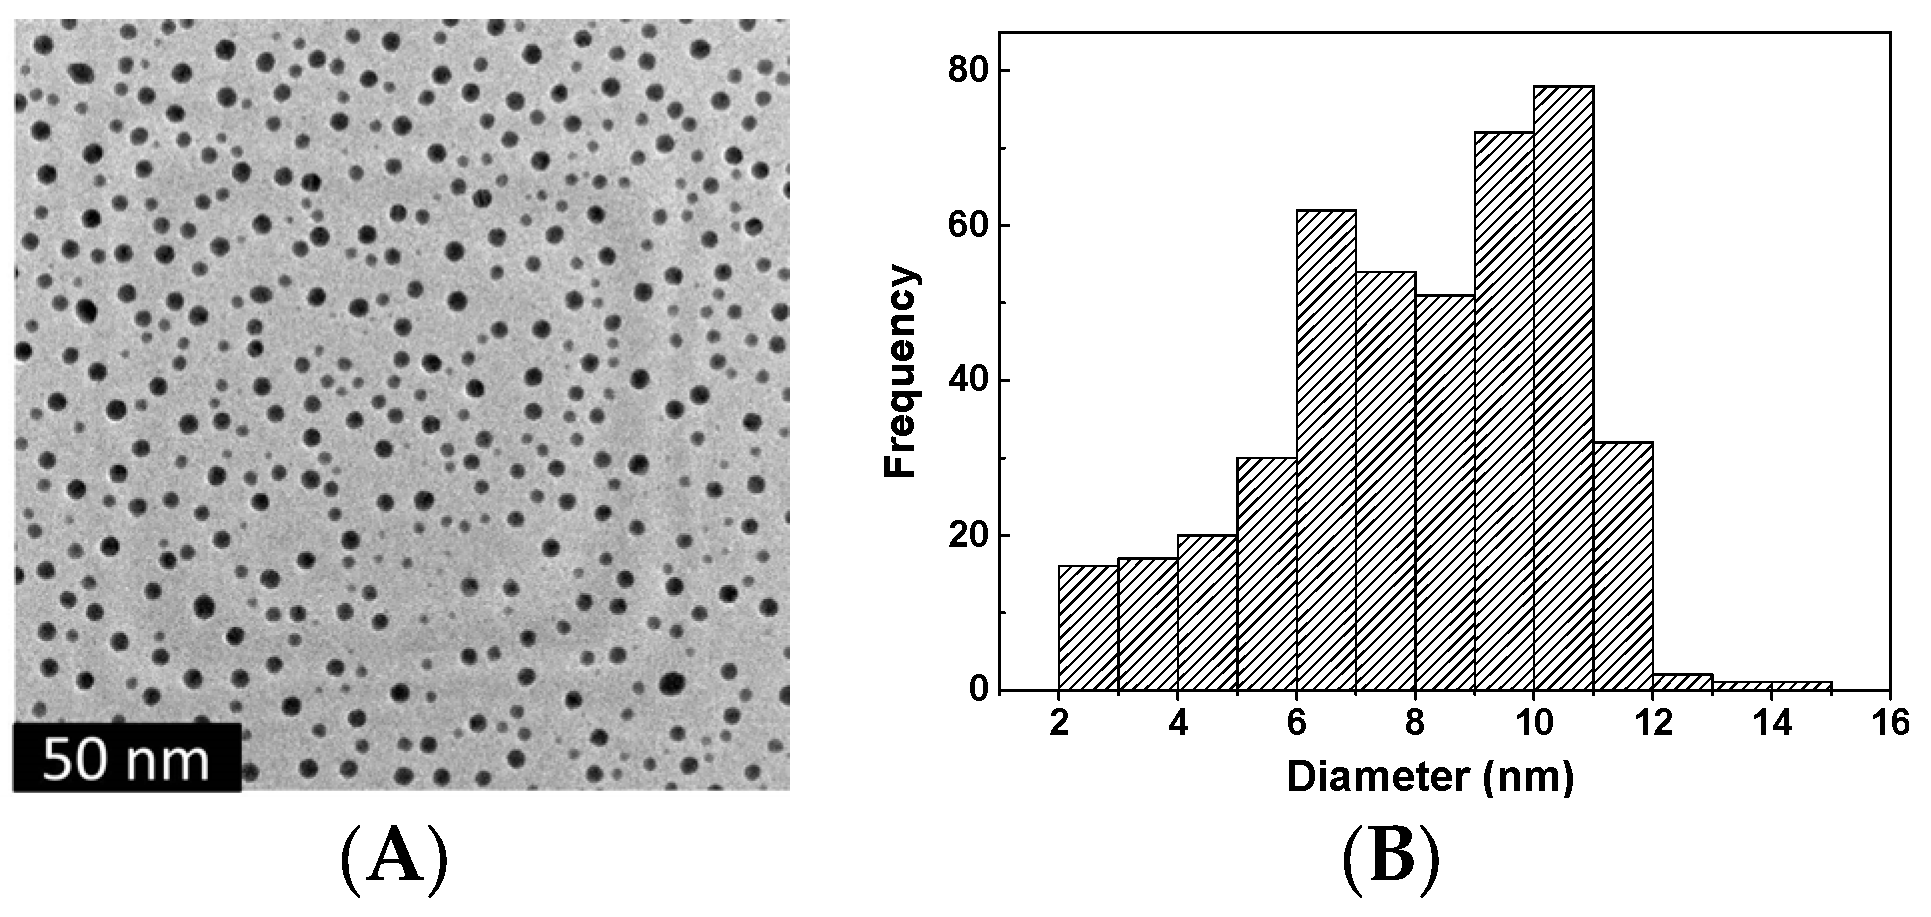
3.4.2. TEM Results
3.4.3. XRD Patterns of the BN Nanoparticle, PbO Nanoparticle, and the PS-PEG/BN/PbO PCM Nanocomposites
4. Conclusions
Supplementary Materials
Author Contributions
Funding
Institutional Review Board Statement
Informed Consent Statement
Data Availability Statement
Acknowledgments
Conflicts of Interest
References
- Duraković, B.; Mešetović, S. Thermal performances of glazed energy storage systems with various storage materials: An experimental study. Sustain. Cities Soc. 2019, 45, 422–430. [Google Scholar] [CrossRef]
- Duraković, B.; Torlak, M. Experimental and numerical study of a PCM window model as a thermal energy storage unit. Int. J. Low-Carbon Technol. 2017, 12, 272–280. [Google Scholar] [CrossRef]
- Durakovic, B.; Torlak, M. Simulation and experimental validation of phase change material and water used as heat storage medium in window applications. J. Mater. Environ. Sci. 2017, 8, 1837–1846. [Google Scholar]
- Farhat, N.; Inal, Z. Solar thermal energy storage solutions for building application: State of the art. Herit. Sustain. Dev. 2019, 1, 1–13. [Google Scholar] [CrossRef]
- Çakır, A.; Kurmuş, E.F. Energy storage technologies for building applications. Herit. Sustain. Dev. 2019, 1, 41–47. [Google Scholar] [CrossRef]
- Ermiş, K.; Findik, F. Thermal energy storage. Sustain. Eng. Innov. 2020, 2, 66–88. [Google Scholar] [CrossRef]
- Duraković, B. PCM-Based Building Envelope Systems Innovative Energy Solutions for Passive Design; Springer Nature Switzerland AG: Basel, Switzerland, 2020; pp. 63–87. [Google Scholar] [CrossRef]
- Teggar, M.; Arıcı, M.; Mezaache, E.H.; Mert, M.S.; Ajarostaghi, S.S.M.; Niyas, H.; Tuncbilek, E.; Ismail KA, R.; Younsi, Z.; Benhouia, A. A comprehensive review of micro/nano-enhanced phase change materials. J. Therm. Anal. Calorim. 2022, 147, 3989–4016. [Google Scholar] [CrossRef]
- Williams, J.D.; Peterson, G. A review of thermal property enhancements of low temperature nano-enhanced phase change materials. Nanomaterials 2021, 11, 2578. [Google Scholar] [CrossRef]
- Najim, F.T.; Mohammed, H.I.; Taqi Al-Najjar, H.M.; Thangavelu, L.; Mahmoud, M.Z.; Mahdi, J.M.; Tiji, M.E.; Yaïci, W.; Talebizadehsardari, P. Improved melting of latent heat storage using fin arrays with non-uniform dimensions and distinct patterns. Nanomaterials 2022, 12, 403. [Google Scholar] [CrossRef]
- Chen, K.; Mohammed, H.I.; Mahdi, J.M.; Rahbari, A.; Cairns, A.; Talebizadehsardari, P. Effects of non-uniform fin arrangement and size on the thermal response of a vertical latent heat triple-tube heat exchanger. J. Energy Storage 2022, 45, 103723–103747. [Google Scholar] [CrossRef]
- Hosseinzadeh, K.; Erfani Moghaddam, M.A.; Asadi, A.; Mogharrebi, A.R.; Jafari, B.; Hasani, M.R.; Ganji, D.D. Effect of two different fins (longitudinal-tree like) and hybrid nano-particles (MoS2-TiO2) on solidification process in triplex latent heat thermal energy storage system. Alex. Eng. J. 2021, 60, 1967–1979. [Google Scholar] [CrossRef]
- Talebizadehsardari, P.; Mohammed, H.I.; Mahdi, J.M.; Gillott, M.; Walker, G.S.; Grant, D.; Giddings, D. Effect of airflow channel arrangement on the discharge of a composite metal foam-phase change material heat exchanger. Int. J. Energy Res. 2021, 45, 2593–2609. [Google Scholar] [CrossRef]
- Ali, H.M.; Janjua, M.M.; Sajjad, U.; Yan, W.M. A critical review on heat transfer augmentation of phase change materials embedded with porous materials/foams. Int. J. Heat Mass Transf. 2019, 135, 649–673. [Google Scholar] [CrossRef]
- Moghaddam, M.E.; Abandani, M.H.S.; Hosseinzadeh, K.; Shafii, M.B.; Ganji, D. Metal foam and fin implementation into a triple concentric tube heat exchanger over melting evolution. Theor. Appl. Mech. Lett. 2022, 12, 100332–100341. [Google Scholar] [CrossRef]
- Bondareva, N.S.; Buonomo, B.; Manca, O.; Sheremet, M.A. Heat transfer performance of the finned nano-enhanced phase change material system under the inclination influence. Int. J. Heat Mass Transf. 2019, 135, 1063–1072. [Google Scholar] [CrossRef]
- Hosseinzadeh, K.; Montazer, E.; Shafii, M.B.; Ganji, A. Solidification enhancement in triplex thermal energy storage system via triplets fins configuration and hybrid nanoparticles. J. Energy Storage 2021, 34, 102177–102183. [Google Scholar] [CrossRef]
- Hosseinzadeh, K.; Moghaddam, M.E.; Asadi, A.; Mogharrebi, A.; Ganji, D. Effect of internal fins along with hybrid nano-particles on solid process in star shape triplex latent heat thermal energy storage system by numerical simulation. Renew. Energy 2020, 154, 497–507. [Google Scholar] [CrossRef]
- Ho, C.; Siao, C.-R.; Yang, T.-F.; Chen, B.-L.; Rashidi, S.; Yan, W.-M. An investigation on the thermal energy storage in an enclosure packed with micro-encapsulated phase change material. Case Stud. Therm. Eng. 2021, 25, 100987–100996. [Google Scholar] [CrossRef]
- Khedher, N.B.; Ghalambaz, M.; Alghawli, A.S.; Hajjar, A.; Sheremet, M.; Mehryan SA, M. Study of tree-shaped optimized fins in a heat sink filled by solid-solid nanocomposite phase change material. Int. Commun. Heat Mass Transf. 2022, 136, 106195. [Google Scholar] [CrossRef]
- Khedher, N.B.; Bantan, R.A.; Kolsi, L.; Omri, M. Performance investigation of a vertically configured LHTES via the combination of nano-enhanced PCM and fins: Experimental and numerical approaches. Int. Commun. Heat Mass Transf. 2022, 137, 106246. [Google Scholar] [CrossRef]
- Meng, L.; Ivanov, A.S.; Kim, S.; Zhao, X.; Kumar, N.; Young-Gonzales, A.; Saito, T.; Bras, W.; Gluesenkamp, K.; Bocharova, V. Alginate−Sodium Sulfate Decahydrate Phase Change Composite with Extended Stability. ACS Appl. Polym. Mater. 2022, 4, 6563–6571. [Google Scholar] [CrossRef]
- Peng, G.; Dou, G.; Hu, Y.; Sun, Y.; Chen, Z. Review Article Phase Change Material (PCM) Microcapsules for Thermal Energy Storage. Adv. Polym. Technol. 2020, 2020, 9490873. [Google Scholar] [CrossRef]
- Mohaddes, F.; Islam, S.; Shanks, R.; Fergusson, M.; Wang, L.; Padhye, R. Modification and evaluation of thermal properties of melamine-formaldehyde/n-eicosane microcapsules for thermo-regulation applications. Appl. Therm. Eng. 2014, 71, 11–15. [Google Scholar] [CrossRef]
- Yuzhan, L.; Navin, K.; Jason, H.; Damilola, O.A.; Kai, L.; Turnaoglu, T.; Monojoy, G.; Rios, O.; Tim JLaClair Samuel, G.; Kyle, R.G. Stable salt hydrate-based thermal energy storage materials. Compos. Part B 2022, 233, 109621. [Google Scholar] [CrossRef]
- Han, W.; Ge, C.; Zhang, R.; Ma, Z.; Wang, L.; Zhang, X. Boron nitride foam as a polymer alternative in packaging phase change materials: Synthesis, thermal properties and shape stability. Appl. Energy 2019, 238, 942–951. [Google Scholar] [CrossRef]
- Sundararajan, S.; Samui, A.B.; Kulkarni, P.S. Synthesis and characterization of poly(ethylene glycol) acrylate (PEGA) copolymers for application as polymeric phase change materials (PCMs). React. Funct. Polym. 2018, 130, 43–50. [Google Scholar] [CrossRef]
- Anuar Sharif, M.K.; Al-Abidi, A.A.; Mat, S.; Sopian, K.; Ruslan, M.H.; Sulaiman, M.Y.; Rosli, M.A.M. Review of the application of phase change material for heating and domestic hot water systems. Renew. Sustain. Energy Rev. 2015, 42, 557–568. [Google Scholar] [CrossRef]
- Deng, Y.; Li, J.; Qian, T.; Guan, W.; Li, Y.; Yin, X. Thermal conductivity enhancement of polyethylene glycol/expanded vermiculite shape-stabilized composite phase change materials with silver nanowire for thermal energy storage. Chem. Eng. J. 2016, 295, 427–435. [Google Scholar] [CrossRef]
- Wang, W.; Yang, X.; Fang, Y.; Ding, J.; Yan, J. Enhanced thermal conductivity and thermal performance of form-stable composite phase change materials by using β-Aluminum nitride. Appl. Energy 2009, 86, 1196–1200. [Google Scholar] [CrossRef]
- Song, S.; Qiu, F.; Zhu, W.; Guo, Y.; Zhang, Y.; Ju, Y.; Feng, R.; Liu, Y.; Chen, Z.; Zhou, J.; et al. Polyethylene glycol/halloysite@Ag nanocomposite PCM for thermal energy storage: Simultaneously high latent heat and enhanced thermal conductivity. Sol. Energy Mater. Sol. Cells 2019, 193, 237–245. [Google Scholar] [CrossRef]
- Chen, J.; Huang, X.; Sun, B.; Jiang, P. Highly Thermally Conductive Yet Electrically Insulating Polymer/Boron Nitride Nanosheets Nanocomposite Films for Improved Thermal Management Capability. ACS Nano 2019, 13, 337–345. [Google Scholar] [CrossRef] [PubMed]
- Jiang, Y.; Shi, X.; Feng, Y.; Li, S.; Zhou, X.; Xie, X. Enhanced thermal conductivity and ideal dielectric properties of epoxy composites containing polymer modified hexagonal boron nitride. Compos. Part A Appl. Sci. Manuf. 2018, 107, 657–664. [Google Scholar] [CrossRef]
- Wu, M.Q.; Wu, S.; Cai, Y.F.; Wang, R.Z.; Li, T.X. Form-stable phase change composites: Preparation, performance, and applications for thermal energy conversion storage and management. Energy Storage Mater. 2021, 42, 380–417. [Google Scholar] [CrossRef]
- Meng, Q.; Hu, J. A poly(ethylene glycol)-based smart phase change material. Sol. Energy Mater. Sol. Cells 2008, 92, 1260–1268. [Google Scholar] [CrossRef]
- Liu, B.; Zhang, X.; Ji, J. Review on solar collector systems integrated with phase-change material thermal storage technology and their residential applications. Int. J. Energy Res. 2021, 45, 8347–8369. [Google Scholar] [CrossRef]
- Dash, L.; Mahanwar, P.A. A Review on Organic Phase Change Materials and Their Applications. Int. J. Eng. Appl. Sci. Technol. 2021, 5, 268–284. [Google Scholar] [CrossRef]
- Chen, C.; Wang, L.; Huang, Y. Crosslinking of the electrospun polyethylene glycol/cellulose acetate composite fibers as shape-stabilized phase change materials. Mater. Lett. 2009, 63, 569–571. [Google Scholar] [CrossRef]
- Chen, C.; Wang, L.; Huang, Y. Ultrafine electrospun fibers based on stearyl stearate/polyethylene terephthalate composite as form stable phase change materials. Chem. Eng. J. 2009, 150, 269–274. [Google Scholar] [CrossRef]
- Chen, C.; Wang, L.; Huang, Y. A novel shape-stabilized PCM: Electrospun ultrafine fibers based on lauric acid/polyethylene terephthalate composite. Mater. Lett. 2008, 62, 3515–3517. [Google Scholar] [CrossRef]
- Al-Migdady, A.K.; Jawarneh, A.M.; Ababneh, A.K.; Dalgamoni, H.N. Numerical Investigation of the Cooling Performance of PCM-based Heat Sinks Integrated with Metal Foam Insertion. Jordan J. Mech. Ind. Eng. 2021, 15, 191–197. [Google Scholar]
- Nomura, T.; Okinaka, N.; Akiyama, T. Waste heat transportation system, using phase change material (PCM) from steelworks to chemical plant. Resour. Conserv. Recycl. 2010, 54, 1000–1006. [Google Scholar] [CrossRef]
- Gracia, D.A.; Rincón, L.; Castell, A.; Jiménez, M.; Boer, D.; Medrano, M.; Cabeza, L.F. Life cycle assessment of the inclusion of phase change materials (PCM) in experimental buildings. Energy Build. 2010, 42, 1517–1523. [Google Scholar] [CrossRef]
- Tyagi, V.V.; Buddhi, D. PCM thermal storage in buildings: A state of art. Renew. Sustain. Energy Rev. 2007, 11, 1146–1166. [Google Scholar] [CrossRef]
- Jin, J.; Lin, F.; Liu, R.; Xiao, T.; Zheng, J.; Qian, G.; Liu, H.; Wen, P. Preparation and thermal properties of mineral-supported polyethylene glycol as form-stable composite phase change materials (CPCMs) used in asphalt pavements. Sci. Rep. 2017, 7, 16998. [Google Scholar] [CrossRef] [PubMed]
- Tang, B.; Qiu, M.; Zhang, S. Thermal conductivity enhancement of PEG/SiO2 composite PCM by in situ Cu doping. Sol. Energy Mater. Sol. Cells 2012, 105, 242–248. [Google Scholar] [CrossRef]
- Meng, X.; Zhang, H.; Sun, L.; Xu, F.; Jiao, Q.; Zhao, Z.; Zhang, J.; Zhou, H.; Sawada, Y.; Liu, Y. Preparation and thermal properties of fatty acids/CNTs composite as shape-stabilized phase change materials. J. Therm. Anal. Calorim. 2013, 111, 377–384. [Google Scholar] [CrossRef]
- Feng, L.; Song, P.; Yan, S.; Wang, H.; Wang, J. The shape-stabilized phase change materials composed of polyethylene glycol and graphitic carbon nitride matrices. Thermochim. Acta 2015, 612, 19–24. [Google Scholar] [CrossRef]
- Sun, Q.; Yuan, Y.; Zhang, H.; Cao, X.; Sun, L. Thermal properties of polyethylene glycol/carbon microsphere composite as a novel phase change material. J. Therm. Anal. Calorim. 2017, 130, 1741–1749. [Google Scholar] [CrossRef]
- Pielichowska, K.; Pielichowski, K. Phase change materials for thermal energy storage. Prog. Mater. Sci. 2014, 65, 67–123. [Google Scholar] [CrossRef]
- Yuan, Y.; Zhang, H.; Zhang, N.; Sun, Q.; Cao, X. Effect of water content on the phase transition temperature, latent heat and water uptake of PEG polymers acting as endothermal-hydroscopic materials. J. Therm. Anal. Calorim. 2016, 126, 699–708. [Google Scholar] [CrossRef]
- Wensel, J.; Wright, B.; Thomas, D.; Douglas, W.; Mannhalter, B.; Cross, W.; Hong, H.; Kellar, J. Enhanced thermal conductivity by aggregation in heat transfer nanofluids containing metal oxide nanoparticles and carbon nanotubes. Appl. Phys. Lett. 2008, 92, 023110. [Google Scholar] [CrossRef]
- Alizadeh, N.; Broughton, R.M.; Auad, M.L. Graft Semi-Interpenetrating Polymer Network Phase Change Materials for Thermal Energy Storage. ACS Appl. Polym. Mater. 2021, 3, 1785–1794. [Google Scholar] [CrossRef]
- Sharma, R.K.; Ganesan, P.; Tyagi, V.V.; Mahlia, T.M.I. Accelerated thermal cycle and chemical stability testing of polyethylene glycol (PEG) 6000 for solar thermal energy storage. Sol. Energy Mater. Sol. Cells 2016, 147, 235–239. [Google Scholar] [CrossRef]
- Zhang, L.; Zhu, J.; Zhou, W.; Wang, J.; Wang, Y. Thermal and electrical conductivity enhancement of graphite nanoplatelets on form-stable polyethylene glycol/polymethyl methacrylate composite phase change materials. Energy 2012, 39, 294–302. [Google Scholar] [CrossRef]
- Mo, S.; Mo, B.; Wu, F.; Jia, L.; Chen, Y. Preparation and thermal performance of ternary carbonates/silica microcomposites as phase change materials. J. Sol-Gel Sci. Technol. 2021, 99, 220–229. [Google Scholar] [CrossRef]
- Zhang, C.; Shi, Z.; Li, A.; Zhang, Y.F. RGO-Coated Polyurethane Foam/Segmented Polyurethane Composites as Solid–Solid Phase Change Thermal Interface Material. Polymers 2020, 12, 3004. [Google Scholar] [CrossRef] [PubMed]
- Chen, B.; Han, M.; Zhang, B.; Ouyang, G.; Shafei, B.; Wang, X.; Hu, S. Efficient Solar-to-Thermal Energy Conversion and Storage with High-Thermal-Conductivity and Form-Stabilized Phase Change Composite Based on Wood-Derived Scaffolds. Energies 2019, 12, 1283. [Google Scholar] [CrossRef]
- Cui, Y.; Liu, C.; Hu, S.; Yu, X. The experimental exploration of carbon nanofiber and carbon nanotube additives on thermal behavior of phase change materials. Sol. Energy Mater. Sol. Cells 2011, 95, 1208–1212. [Google Scholar] [CrossRef]
- Wu, B.; Chen, R.; Fu, R.; Agathopoulos, S.; Su, X.; Liu, H. Low thermal expansion coefficient and high thermal conductivity epoxy/Al2O3/T-ZnOw composites with dual-scale interpenetrating network structure. Compos. Part A Appl. Sci. Manuf. 2020, 137, 105993. [Google Scholar] [CrossRef]
- Qi, G.Q.; Liang, C.L.; Bao, R.Y.; Liu, Z.Y.; Yang, W.; Xie, B.H.; Yang, M.B. Polyethylene glycol based shape-stabilized phase change material for thermal energy storage with ultra-low content of graphene oxide. Sol. Energy Mater. Sol. Cells 2014, 123, 171–177. [Google Scholar] [CrossRef]
- Shen, J.; Zhang, P.; Song, L.; Li, J.; Ji, B.; Li, J.; Chen, L. Polyethylene glycol supported by phosphorylated polyvinyl alcohol/graphene aerogel as a high thermal stability phase change material. Compos. Part B Eng. 2019, 179, 107545. [Google Scholar] [CrossRef]
- Barani, Z.; Mohammadzadeh, A.; Geremew, A.; Huang, C.Y.T.; Coleman, D.; Mangolini, L.; Kargar, F.; Baladin, A.A. Thermal Properties of the Binary-Filler Hybrid Composites with Graphene and Copper Nanoparticles. Adv. Funct. Mater. 2019, 30, 1904008. [Google Scholar] [CrossRef]
- Tu, J.; Li, H.; Cai, Z.; Zhang, J.; Hu, X.; Huang, J.; Xiong, C.; Jiang, M.; Huang, L. Phase change-induced tunable dielectric permittivity of poly(vinylidene fluoride)/polyethylene glycol/graphene oxide composites. Compos. Part B Eng. 2019, 173, 106920. [Google Scholar] [CrossRef]
- Hu, H. Recent advances of polymeric phase change composites for flexible electronics and thermal energy storage system. Compos. Part B Eng. 2020, 195, 108094. [Google Scholar] [CrossRef]
- Yang, J.; Tang, L.S.; Bao, R.Y.; Bai, L.; Liu, Z.Y.; Yang, W.; Xie, B.H.; Yang, M.B. Largely enhanced thermal conductivity of poly(ethylene glycol)/boron nitride composite phase change materials for solar-thermal-electric energy conversion and storage with very low content of graphene nanoplatelets. Chem. Eng. J. 2017, 315, 481–490. [Google Scholar] [CrossRef]
- Guerra, V.; Wan, C.; McNally, T. Thermal conductivity of 2D nano-structured boron nitride (BN) and its composites with polymers. Prog. Mater. Sci. 2019, 100, 170–186. [Google Scholar] [CrossRef]
- Jia, X.; Li, Q.; Ao, C.; Hu, R.; Xia, T.; Xue, Z.; Wang, Q.; Deng, X.; Zhang, W.; Lu, C. High thermal conductive shape-stabilized phase change materials of polyethylene glycol/boron nitride@chitosan composites for thermal energy storage. Compos. Part A Appl. Sci. Manuf. 2020, 129, 105710. [Google Scholar] [CrossRef]
- Lu, X.; Huang, H.; Zhang, X.; Lin, P.; Huang, J.; Sheng, X.; Zhang, L.; Qu, J. Novel light-driven and electro-driven polyethylene glycol/two-dimensional MXene form-stable phase change material with enhanced thermal conductivity and electrical conductivity for thermal energy storage. Compos. Part B Eng. 2019, 177, 107372. [Google Scholar] [CrossRef]
- Kenisarin, M.; Mahkamov, K. Solar energy storage using phase change materials. Renew. Sustain. Energy Rev. 2007, 11, 1913–1965. [Google Scholar] [CrossRef]
- Huang, C.; Qian, X.; Yang, R. Thermal conductivity of polymers and polymer nanocomposites. Mater. Sci. Eng. R Rep. 2018, 132, 1–22. [Google Scholar] [CrossRef]
- Zhou, W.; Qi, S.; An, Q.; Zhao, H.; Liu, N. Thermal conductivity of boron nitride reinforced polyethylene composites. Mater. Res. Bull. 2007, 42, 1863–1873. [Google Scholar] [CrossRef]
- Presley, M.A.; Christensen, P.R. Thermal conductivity measurements of particulate materials 1. A review. J. Geophys. Res. Planets 1997, 102, 6535–6550. [Google Scholar] [CrossRef]
- Cinan, Z.M.; Baskan, T.; Erol, B.; Mutlu, S.; Misirlioglu, Y.; Savaskan Yilmaz, S.; Yilmaz, A.H. Gamma irradiation, thermal conductivity, and phase change tests of the cement-hyperbranched poly amino-ester-block-poly cabrolactone-polyurathane plaster-lead oxide and arsenic oxide composite for development of radiation shielding material. Int. J. Energy Res. 2021, 45, 20729–20762. [Google Scholar] [CrossRef]
- Cinan, Z.M.; Erol, B.; Baskan, T.; Mutlu, S.; Savaskan Yilmaz, S.; Yilmaz, A.H. Gamma Irradiation and the Radiation Shielding Characteristics: For the Lead Oxide Doped the Crosslinked Polystyrene-b-Polyethyleneglycol Block Copolymers and the Polystyrene-b-Poly ethylene glycol-Boron Nitride Nanocomposites. Polymers 2021, 13, 3246. [Google Scholar] [CrossRef] [PubMed]
- Savaskan Yilmaz, S. Synthesis and Investigation of Ion Exchange Properties of New Ion Exchangers. Ph.D. Thesis, Karadeniz Technical University, Trabzon, Turkey, 1994. [Google Scholar]
- Savaşkan, S.; Besirli, N.; Hazer, B. Synthesis of some new cation-exchanger resins. J. Appl. Polym. Sci. 1996, 59, 1515–1524. [Google Scholar] [CrossRef]
- Zeighampour, F.; Khoddami, A.; Hadadzadeh, H.; Ghane, M. Thermal conductivity enhancement of shape-stabilized phase change nanocomposites via synergistic effects of electrospun carbon nanofiber and reduced graphite oxide nanoparticles. J. Energy Storage 2022, 51, 104521–104534. [Google Scholar] [CrossRef]
- Pielichowska, K.; Pielichowski, K. Biodegradable PEO/cellulose-based solidsolid phase change materials. Polym. Adv. Technol. 2011, 22, 1633–1641. [Google Scholar] [CrossRef]
- Gao, W.; Lin, W.; Liu, T.; Xia, C. An experimental study on the heat storage performances of polyalcohols NPG, TAM, PE, and AMPD and their mixtures as solid-solid phase-change materials for solar energy applications. Int. J. Green Energy 2007, 4, 301–311. [Google Scholar] [CrossRef]
- Wang, X.; Lu, E.; Lin, W.; Liu, T.; Shi, Z.; Tang, R.; Wang, C. Heat storage performance of the binary systems neopentyl glycol/pentaerythritol and neopentyl glycol/trihydroxy methylaminomethane as solid–solid phase change materials. Energy Convers. Manag. 2000, 41, 129–134. [Google Scholar] [CrossRef]
- Fallahi, A.; Guldentops, G.; Tao, M.; Granados-Focil, S.; Van Dessel, S. Review on solid-solid phase change materials for thermal energy storage: Molecular structure and thermal properties. Appl. Therm. Eng. 2017, 127, 1427–1441. [Google Scholar] [CrossRef]
- Tritt, T.M. Physics of Solids and Liquids, Thermal Conductivity Theory, Properties, and Applications; Kluwer Academic/Plenum Publishers: New York, NY, USA, 2004. [Google Scholar]
- Pan, W.; Phillpot, S.R.; Wan, C.; Chernatynskiy, A.; Qu, Z. Low thermal conductivity oxides. Camb. Univ. Press 2012, 37, 917–922. [Google Scholar] [CrossRef]
- Pierson, H.O. Handbook of Carbon, Graphite, Diamond and Fullerences: Properties, Processing and Applications; Noyes Publications: Park Ridge, NJ, USA, 1993. [Google Scholar]
- Wypych, G. Handbook of Fillers: Physical Properties of Fillers and Filled Materials; ChemTec Publishing: Toronto, ON, Canada, 2000; Chapter 2. [Google Scholar]
- Fischer, J.E. Carbon nanotubes: Structure and properties. In Carbon Nanomaterials; Taylor and Francis Group: New York, NY, USA, 2006; pp. 51–58. [Google Scholar]
- Lebedev, S.M. A comparative study on thermal conductivity and permittivity of composites based on linear low-density polyethylene and poly(lactic acid) filled with hexagonal boron nitride. Polym. Compos. 2021, 43, 111–117. [Google Scholar] [CrossRef]
- Osman, A.F.; El Balaa, H.; El Samad, O.; Awad, R.; Badawi, M.S. Assessment of X-ray shielding properties of polystyrene incorporated with different nano-sizes of PbO. Radiat. Environ. Biophys. 2023, 1–17. [Google Scholar] [CrossRef] [PubMed]
- Zeng, S.; Liang, Y.; Lu, H.; Wang, L.; Dinh, X.Y.; Yu, X.; Ho, H.P.; Hu, X.; Yong, K.T. Synthesis of symmetrical hexagonal-shape PbO nanosheets using gold nanoparticles. Mater. Lett. 2012, 67, 74–77. [Google Scholar] [CrossRef]
- Hussein, A.M.; Dannoun, E.M.A.; Aziz, S.B.; Brza, M.A.; Abdulwahid, R.T.; Hussen, S.A.; Rostam, S.; Mustafa, D.M.T.; Muhammad, D.S. Steps Toward the Band Gap Identification in Polystyrene Based Solid Polymer Nanocomposites Integrated with Tin Titanate Nanoparticles. Polymers 2020, 12, 2320. [Google Scholar] [CrossRef] [PubMed]
- Li, Y.; Ma, Q.; Huang, C.; Liu, G. Crystallization of Poly (ethylene glycol) in Poly (methyl methacrylate) Networks. Express Polym. Lett. 2013, 7, 416–430. [Google Scholar] [CrossRef]


| PCM ID | PS-PEG | PS-PEG (wt%) | BN (wt%) | PbO (wt%) | Volume (mm3) |
|---|---|---|---|---|---|
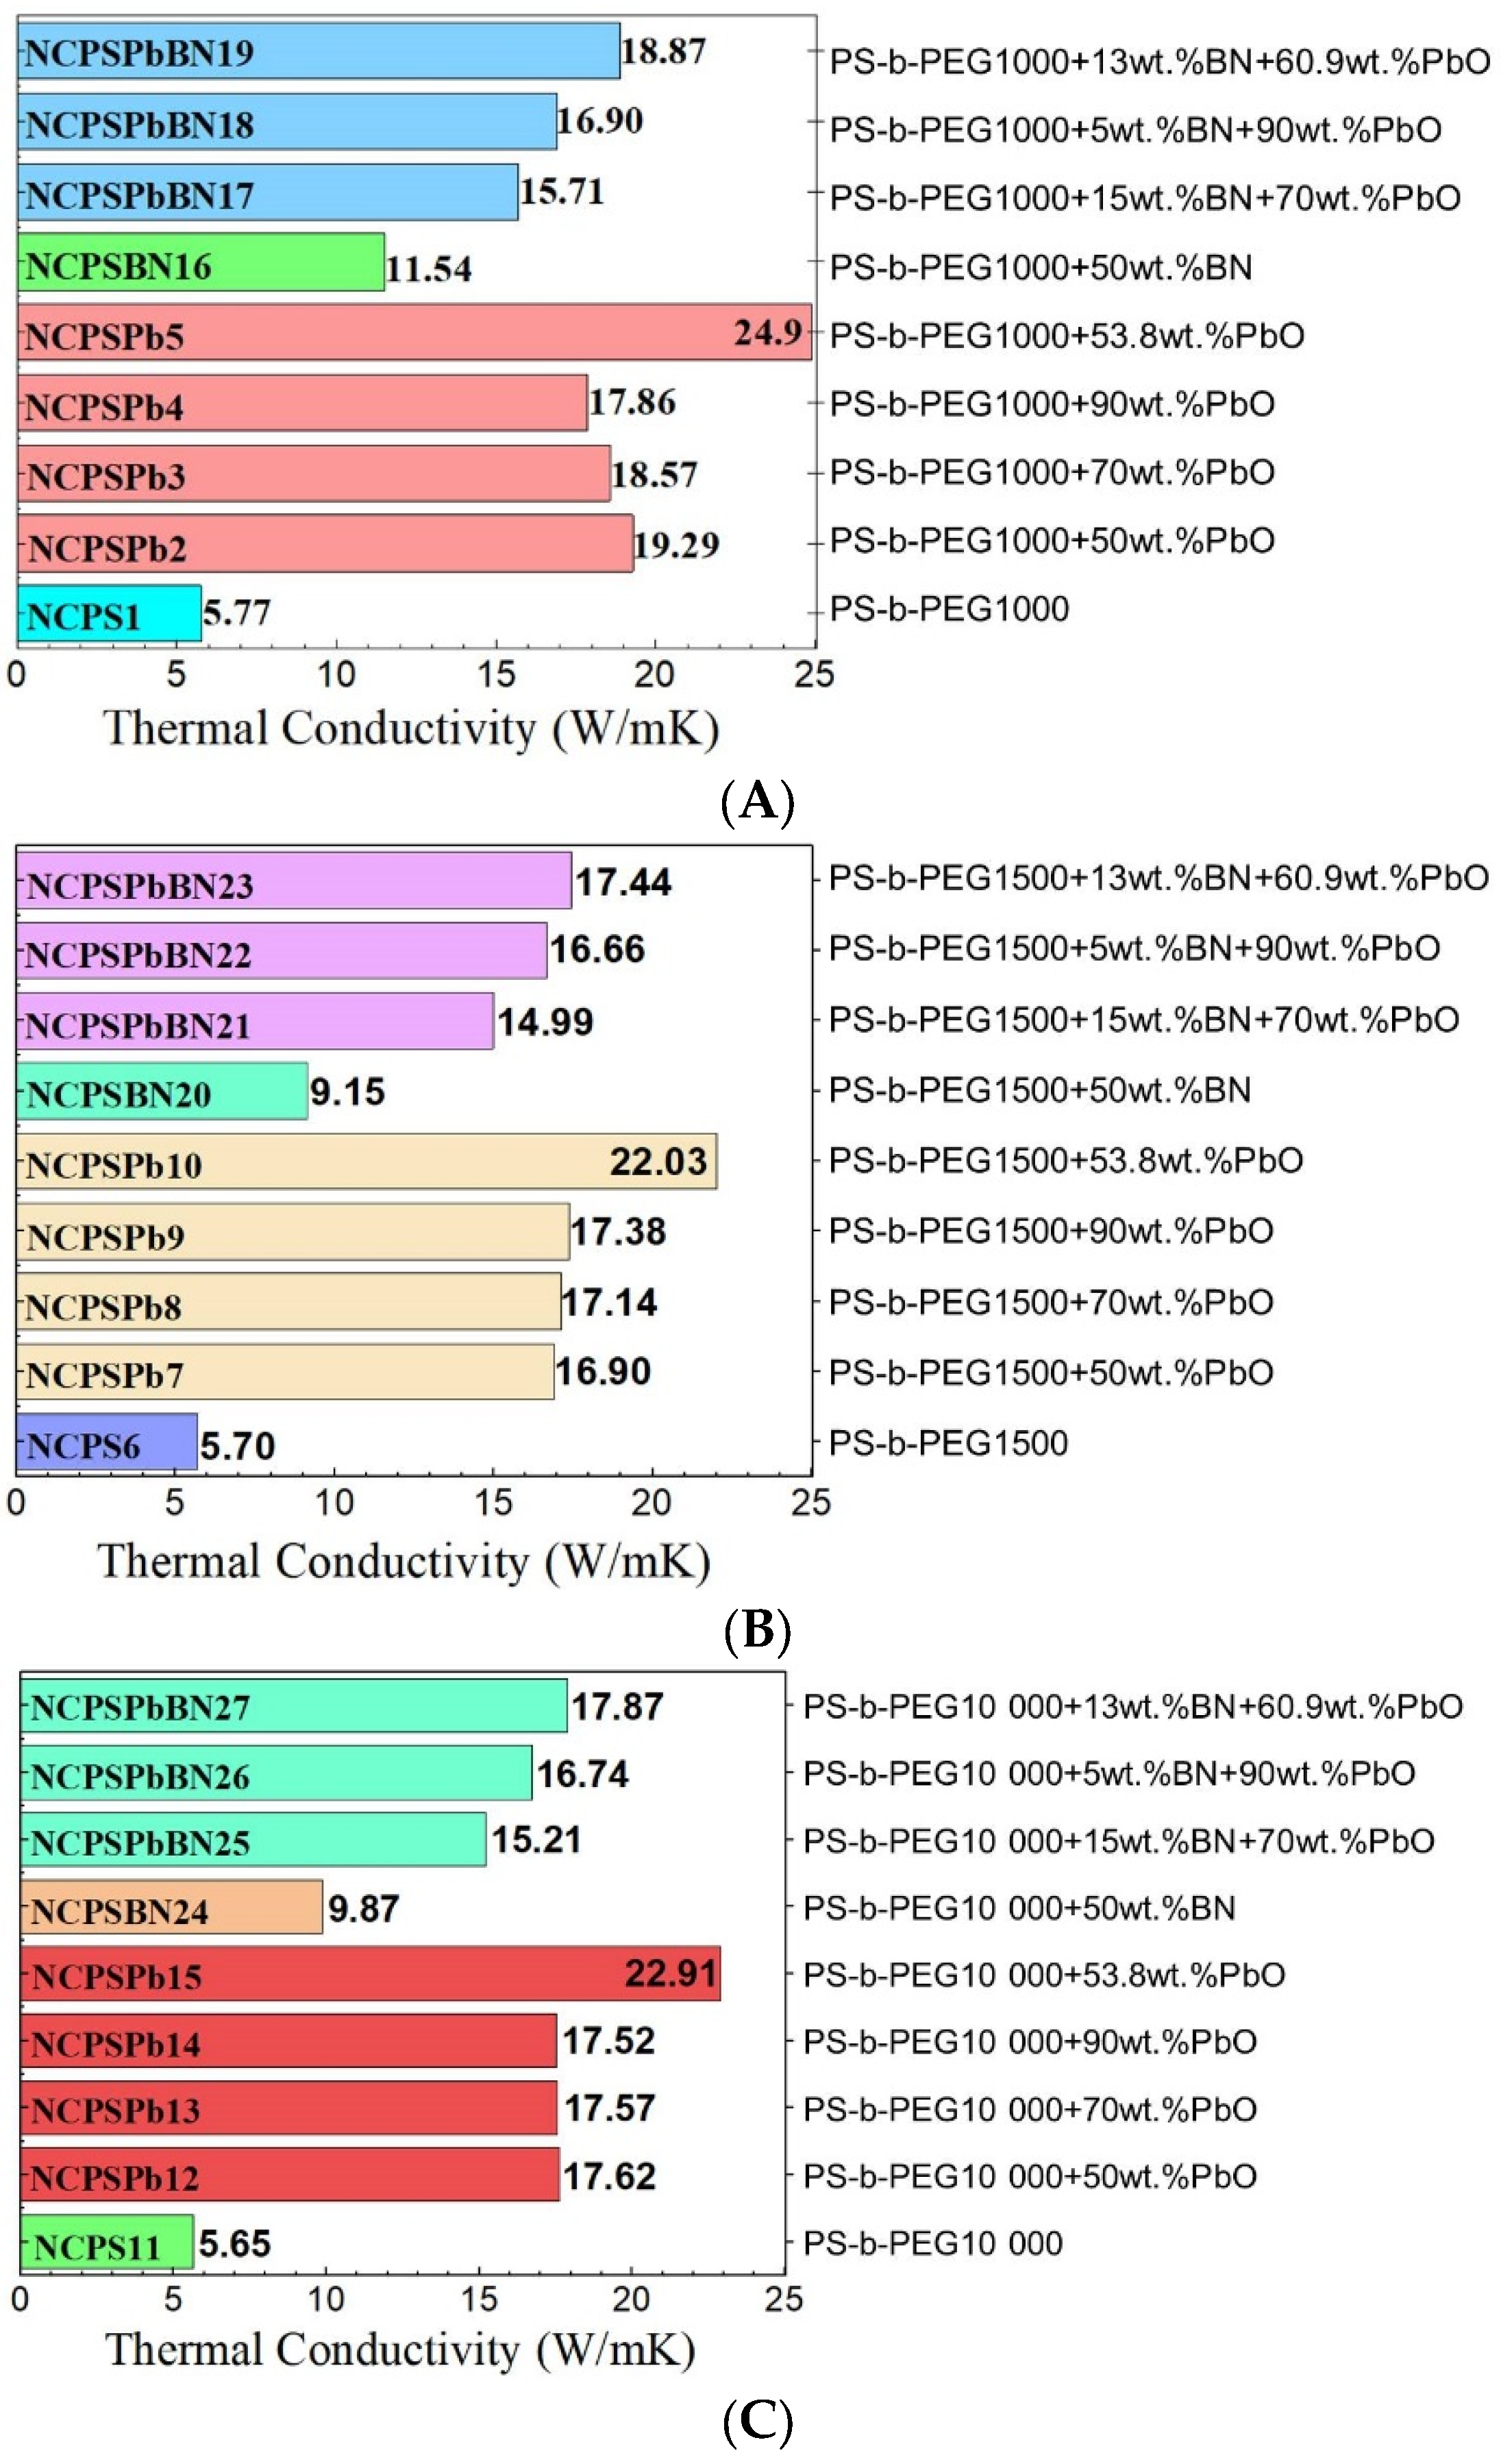
| NCPS1 | 1000 | 100 | 0 | 0 | 575.3 |
| NCPSPb2 | 1000 | 50 | 0 | 50 | 579.1 |
| NCPSPb3 | 1000 | 30 | 0 | 70 | 523.9 |
| NCPSPb4 | 1000 | 10 | 0 | 90 | 357.5 |
| NCPSPb5 | 1000 | 46.2 | 0 | 53.8 | 753.8 |
| NCPS6 | 1500 | 100 | 0 | 0 | 631.8 |
| NCPSPb7 | 1500 | 50 | 0 | 50 | 734.5 |
| NCPSPb8 | 1500 | 30 | 0 | 70 | 631.8 |
| NCPSPb9 | 1500 | 10 | 0 | 90 | 463.6 |
| NCPSPb10 | 1500 | 46.2 | 0 | 53.8 | 858.3 |
| NCPS11 | 10,000 | 100 | 0 | 0 | 782.3 |
| NCPSPb12 | 10,000 | 50 | 0 | 50 | 399.4 |
| NCPSPb13 | 10,000 | 30 | 0 | 70 | 519.8 |
| NCPSPb14 | 10,000 | 10 | 0 | 90 | 511.2 |
| NCPSPb15 | 10,000 | 46.2 | 0 | 53.8 | 657.6 |
| NCPSBN16 | 1000 | 50 | 50 | 0 | 696.5 |
| NCPSPbBN17 | 1000 | 15 | 15 | 70 | 599.6 |
| NCPSPbBN18 | 1000 | 5 | 5 | 90 | 551.1 |
| NCPSPbBN19 | 1000 | 26.1 | 13 | 60.9 | 513.5 |
| NCPSBN20 | 1500 | 50 | 50 | 0 | 591.3 |
| NCPSPbBN21 | 1500 | 15 | 15 | 70 | 515.9 |
| NCPSPbBN22 | 1500 | 5 | 5 | 90 | 638.3 |
| NCPSPbBN23 | 1500 | 26.1 | 13 | 60.9 | 607.6 |
| NCPSBN24 | 10,000 | 50 | 50 | 0 | 741.6 |
| NCPSPbBN25 | 10,000 | 15 | 15 | 70 | 413.5 |
| NCPSPbBN26 | 10,000 | 5 | 5 | 90 | 528.8 |
| NCPSPbBN27 | 10,000 | 26.1 | 13 | 60.9 | 842.4 |
| PCM ID | First Stage of Degradation | Second Stage of Degradation | Third Stage of Degradation | Fourth Stage of Degradation | ||||
|---|---|---|---|---|---|---|---|---|
| t (°C) | Remaining Mass, %wt | t (°C) | Remaining Mass, %wt | t (°C) | Remaining Mass, %wt | t (°C) | Remaining Mass, %wt | |
| NCPS1 | 46.7 | 76.7 | 254.2 | 62.5 | 343.5 | 49.4 | 381.2 | 36.4 |
| NCPSPb2 | 40.3 | 99.2 | 249.6 | 88.4 | 335.4 | 71.4 | 382.8 | 45.1 |
| NCPSPb3 | 49.0 | 99.9 | 244.4 | 83.1 | 289.0 | 71.8 | 375.3 | 42.3 |
| NCPSPb4 | 43.3 | 98.7 | 85.9 | 88.73 | 241.8 | 83.7 | 402.9 | 51.8 |
| NCPSPb5 | 80.8 | 71.5 | 257.9 | 66.3 | 383.7 | 21.2 | - | - |
| NCPS6 | 53.4 | 93.5 | 322.4 | 82.5 | 417.9 | 0.5 | - | - |
| NCPSPb7 | 50.7 | 92.7 | 257.6 | 64.8 | 280.7 | 58.4 | 386.9 | 22.7 |
| NCPSPb8 | 39.9 | 97.5 | 243.3 | 83.4 | 374.0 | 38.0 | 428.7 | 33.4 |
| NCPSPb9 | 47.2 | 98.1 | 165.9 | 85.9 | 349.0 | 61.0 | 370.1 | 53.9 |
| NCPSPb10 | 47.2 | 90.51 | 85.7 | 81.9 | 253.4 | 76.7 | 380.0 | 30.4 |
| NCPS11 | 31.2 | 96.1 | 66.5 | 76.0 | 293.8 | 69.3 | 401. 8 | 3.0 |
| NCPSPb12 | 25.3 | 94.3 | 75.2 | 49.7 | 259.9 | 40.4 | 403.3 | −54.0 |
| NCPSPb13 | 41.6 | 97.3 | 239.1 | 89.5 | 326.4 | 71.2 | 371.9 | 48.8 |
| NCPSPb14 | 44.0 | 97.6 | 231.9 | 87.2 | 287.7 | 77.2 | 372.0 | 56.2 |
| NCPSPb15 | 45.1 | 98.4 | 245.1 | 91.4 | 372.2 | 64.6 | 424.9 | 61.1 |
| NCPSBN16 | 46.5 | 98.8 | 254.8 | 96.4 | 366.9 | 63.4 | 424.8 | 60.0 |
| NCPSPbBN17 | 54.7 | 97.04 | 233.7 | 93.2 | 331.7 | 77.1 | 381.5 | 69.2 |
| NCPSPbBN18 | 37.1 | 97.5 | 228.3 | 91.6 | 370.0 | 65.2 | 420.1 | 62.7 |
| NCPSPbBN19 | 47.2 | 87.9 | 230.8 | 84.6 | 331.1 | 12.6 | 393.5 | 3.9 |
| NCPSBN20 | 37.0 | 99.0 | 281.9 | 95.3 | 376.6 | 63.4 | 418.7 | 61.2 |
| NCPSPbBN21 | 39.2 | 97.8 | 237.4 | 88.7 | 344.0 | 68.5 | 371.9 | 61.5 |
| NCPSPbBN22 | 53.8 | 99.0 | 152.9 | 97.0 | 357.9 | 72.0 | 421.0 | 69.4 |
| NCPSPbBN23 | 41.2 | 97.1 | 242.8 | 86.9 | 365.1 | 58.6 | 427.0 | 53.2 |
| NCPSBN24 | 51.8 | 99.2 | 272.8 | 96.6 | 385.3 | 75.9 | 417.3 | 74.8 |
| NCPSPbBN25 | 64.7 | 96.5 | 235.5 | 92.6 | 361.9 | 68.7 | 410.8 | 66.7 |
| NCPSPbBN26 | 65.8 | 99.0 | 236.7 | 95.1 | 377.2 | 68.8 | 412.4 | 68.0 |
| NCPSPbBN27 | 28.3 | 99.2 | 238.5 | 95.1 | 371.7 | 54.7 | 421.8 | 50.8 |
| PCM ID | Tm (°C) | ΔHm (J g−1) | Tc (°C) | ΔHc (J g−1) | Fc |
|---|---|---|---|---|---|
| NCPS1 | 73.2 185.2 | 3.7 7.31 | 7.9 76.8 | 1.24 1.31 | 0.032 0.034 |
| NCPSPb3 | 81.8 185.8 200.7 | 67.6 1.68 4.62 | 188.4 | 5.12 | 0.728 |
| NCPS6 | 80.6 133.1 159.5 185.4 | 4.16 0.69 0.31 0.40 | 78 | 2.27 | 0.063 |
| NCPSPb8 | 59.9 83.0 203.0 | 8.01 43.8 26.7 | 185.5 | 4.94 | 0.724 |
| NCPS11 | 58.8 137.2 190.1 | 12.6 13.3 4.96 | 31.5 | 7.98 | 0.305 |
| NCPSPb13 | 62.1 83.2 123.2 204.7 | 7.38 27.2 6.64 21.4 | 186.2 | 5.18 | 0.698 |
| NCPSBN16 | 73.8 137.3 186.1 | 2.75 0.58 4.69 | 4.7 89.4 | 1.67 1.14 | 0.089 0.087 |
| NCPSPbBN17 | 57.8 83.8 186.8 204.7 | 7.27 34.6 0.96 10.4 | 190.2 | 5.36 | 1.985 |
| NCPSBN20 | 80.3 185.3 | 1.81 1.15 | 11.5 93.2 | 1.04 0.67 | 0.094 0.092 |
| NCPSPbBN21 | 59.4 84.4 123.2 204.7 | 18.8 22.2 31.5 27.6 | 187.4 | 5.44 | 1.777 |
| NCPSBN24 | 55.5 184.8 | 6.73 8.49 | 112.1 | 0.62 | 0.053 |
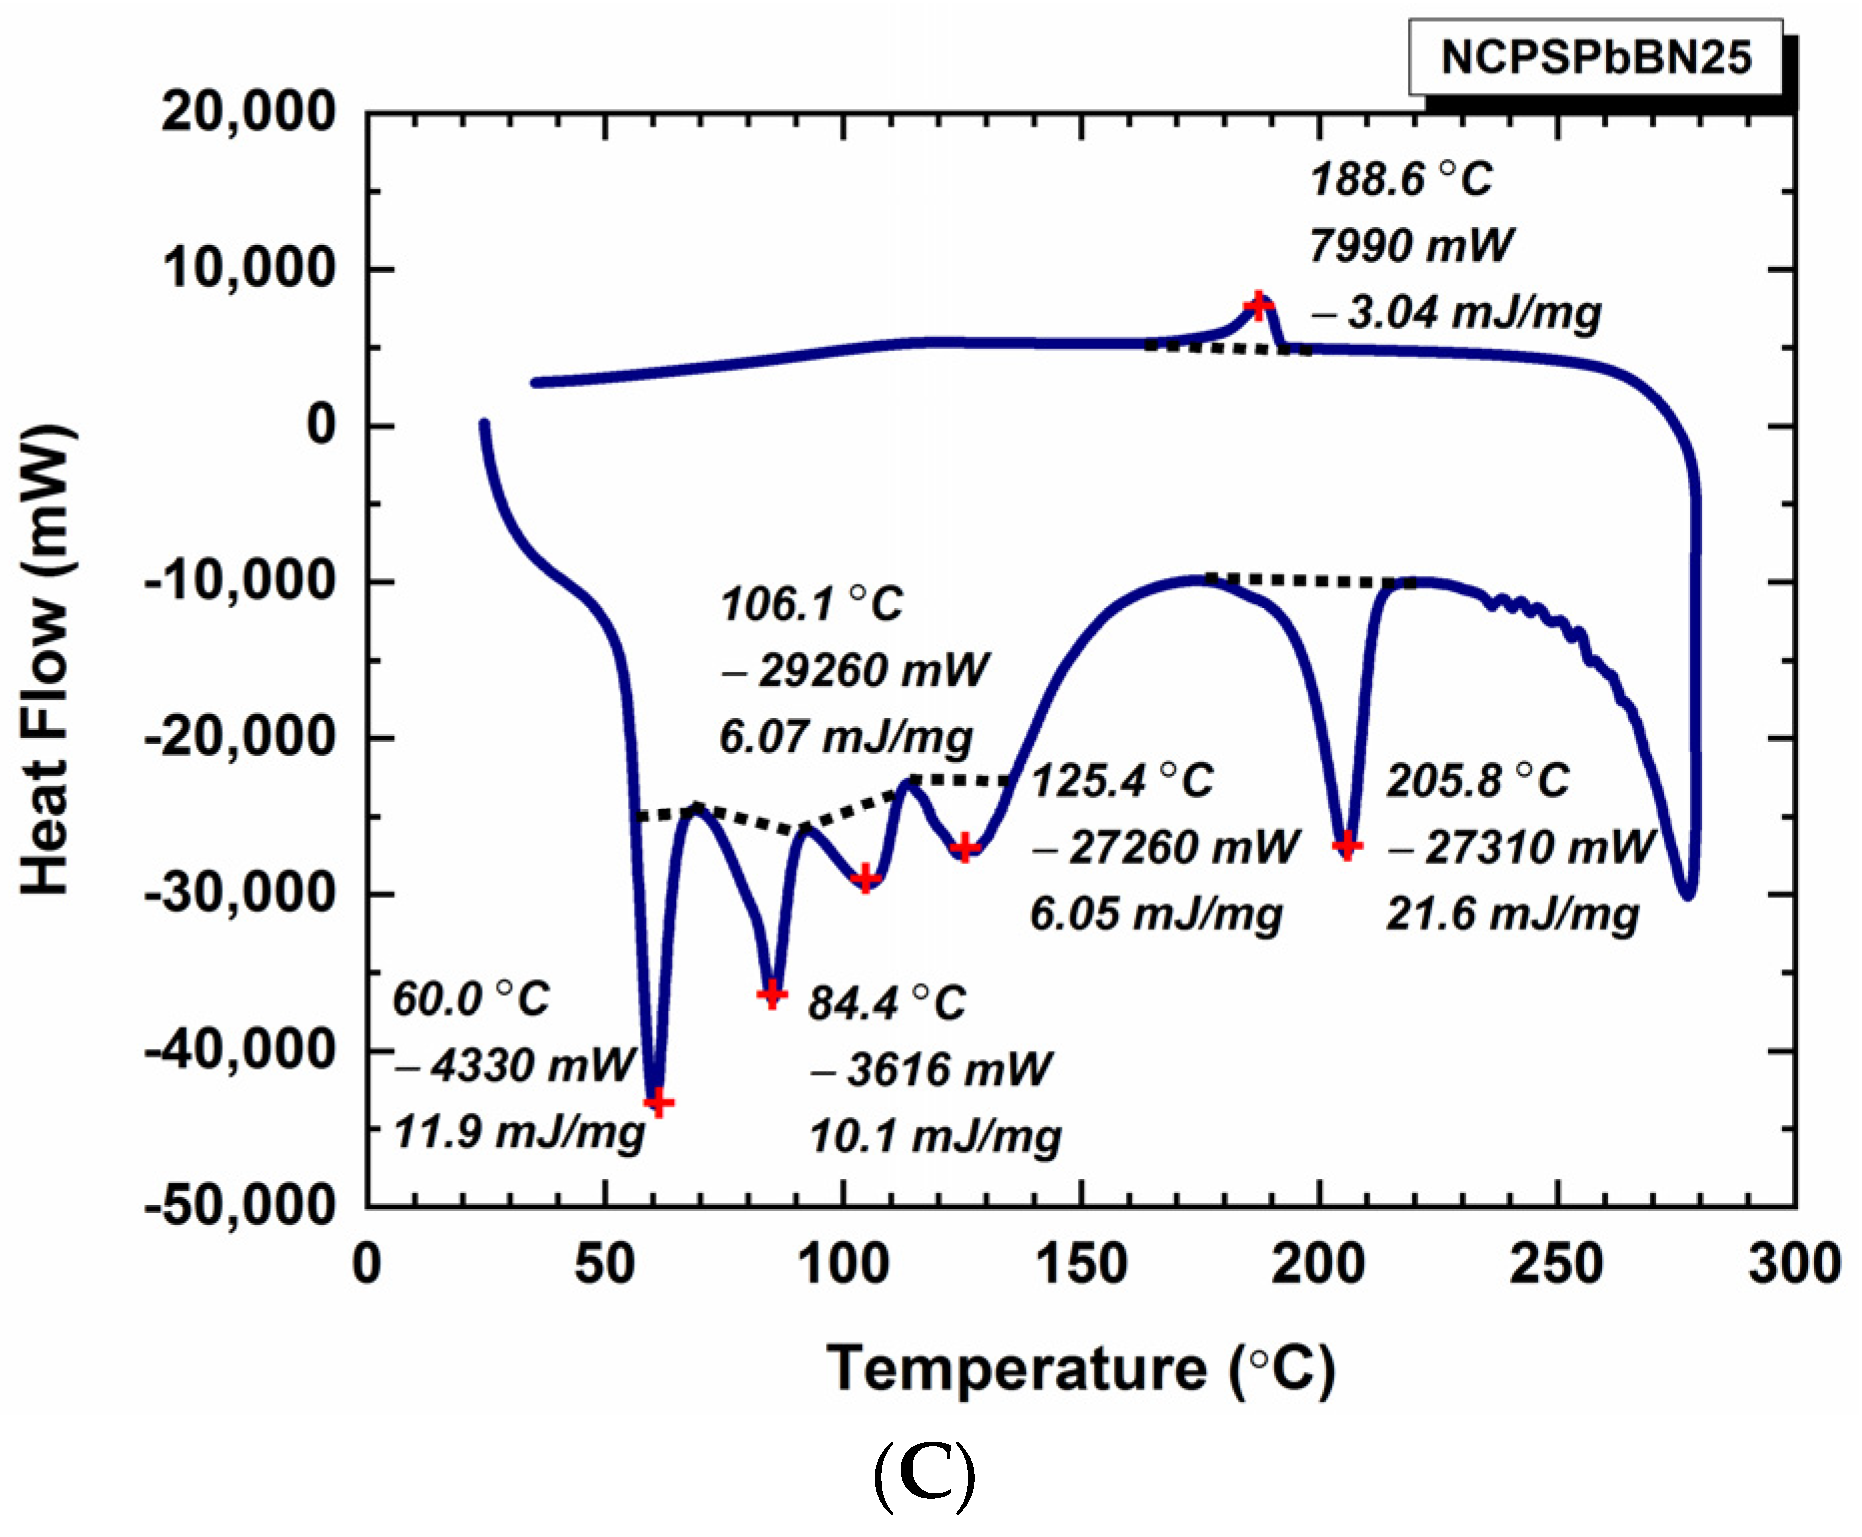
| NCPSPbBN25 | 60.0 84.1 106.1 125.4 205.8 | 11.9 10.01 6.07 6.05 21.6 | 188.6 | 3.04 | 0.860 |
| PEO-CMC [79] | 58.4–62.5 | 52.8–140.2 | 35.3–41.3 | 5.2–138 | - |
| PEO-CEL [79] | 62.5–63.4 | 40.6–134.7 | 32.5–39.5 | 40.2–127.3 | - |
| AMPD/TAM [80] | 114.7–122.6 | 5.1–181.5 | 19.3–187.1 | 20–203.8 | - |
| NPG/TAM/PE/AMPD [80] | 171.6 | 14.1 | 169.6 | 17.4 | - |
| NPG/PE [81] | 160.3–169.8 | 18.8–26.2 | - | - | - |
| PE-TAM [82] | 184.6 | 14.2 | 188.6 | 14.3 |
Disclaimer/Publisher’s Note: The statements, opinions and data contained in all publications are solely those of the individual author(s) and contributor(s) and not of MDPI and/or the editor(s). MDPI and/or the editor(s) disclaim responsibility for any injury to people or property resulting from any ideas, methods, instructions or products referred to in the content. |
© 2023 by the authors. Licensee MDPI, Basel, Switzerland. This article is an open access article distributed under the terms and conditions of the Creative Commons Attribution (CC BY) license (https://creativecommons.org/licenses/by/4.0/).
Share and Cite
Ortaç, B.; Mutlu, S.; Baskan, T.; Savaskan Yilmaz, S.; Yilmaz, A.H.; Erol, B. Thermal Conductivity and Phase-Change Properties of Boron Nitride–Lead Oxide Nanoparticle-Doped Polymer Nanocomposites. Polymers 2023, 15, 2326. https://doi.org/10.3390/polym15102326
Ortaç B, Mutlu S, Baskan T, Savaskan Yilmaz S, Yilmaz AH, Erol B. Thermal Conductivity and Phase-Change Properties of Boron Nitride–Lead Oxide Nanoparticle-Doped Polymer Nanocomposites. Polymers. 2023; 15(10):2326. https://doi.org/10.3390/polym15102326
Chicago/Turabian StyleOrtaç, Bülend, Saliha Mutlu, Taylan Baskan, Sevil Savaskan Yilmaz, Ahmet Hakan Yilmaz, and Burcu Erol. 2023. "Thermal Conductivity and Phase-Change Properties of Boron Nitride–Lead Oxide Nanoparticle-Doped Polymer Nanocomposites" Polymers 15, no. 10: 2326. https://doi.org/10.3390/polym15102326