
The Long-Term Mechanical Properties of BS Perpendicular to the Grain

Abstract
:
1. Introduction
2. Materials and Methods
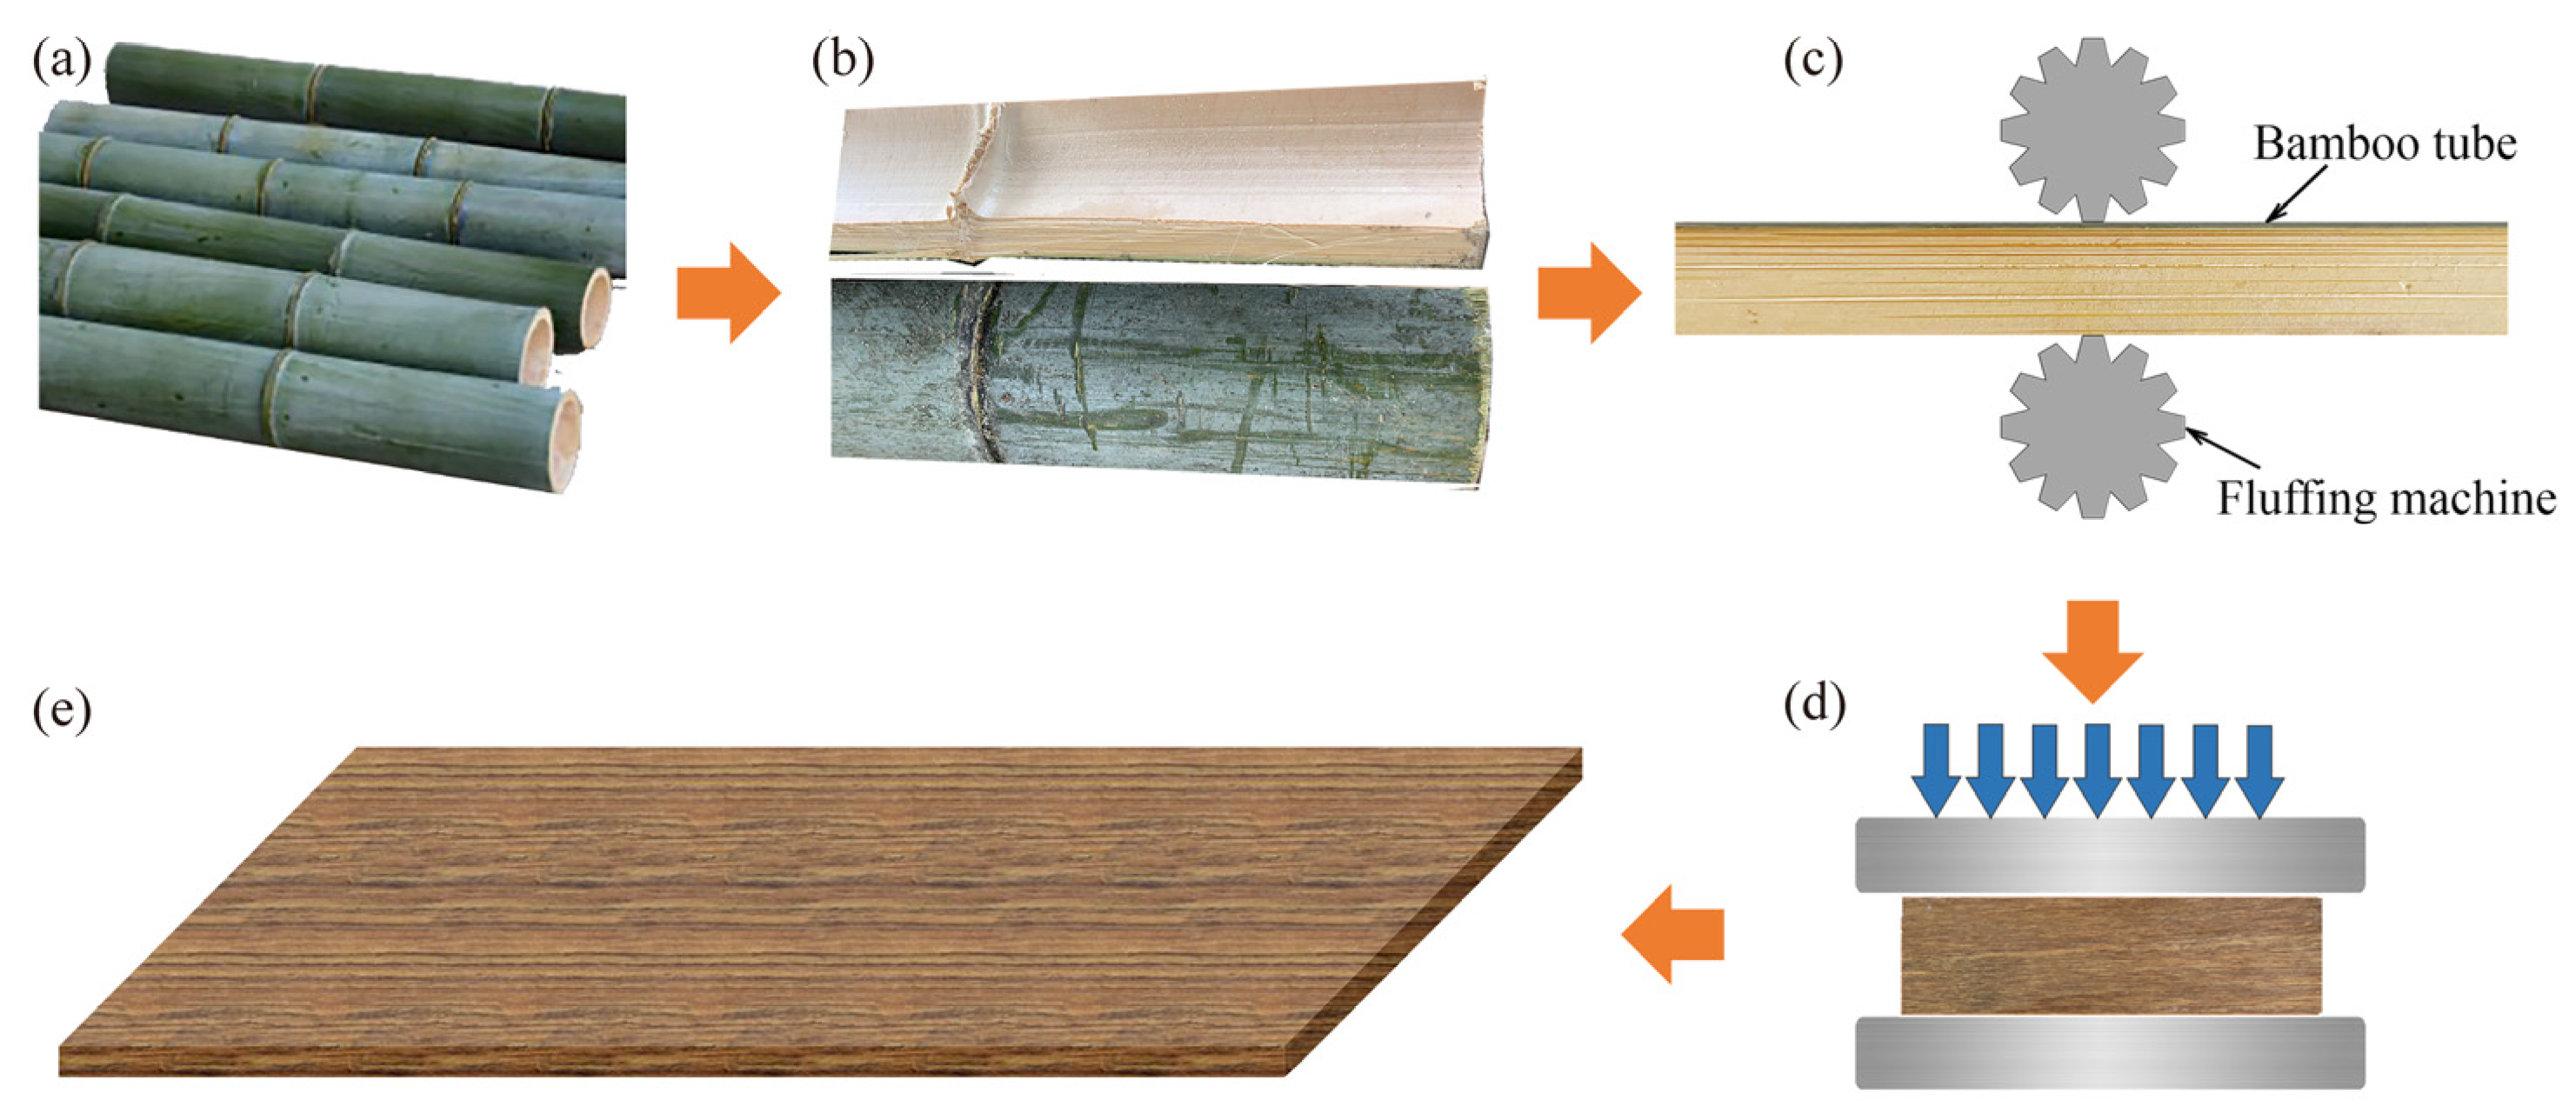
2.1. Materials
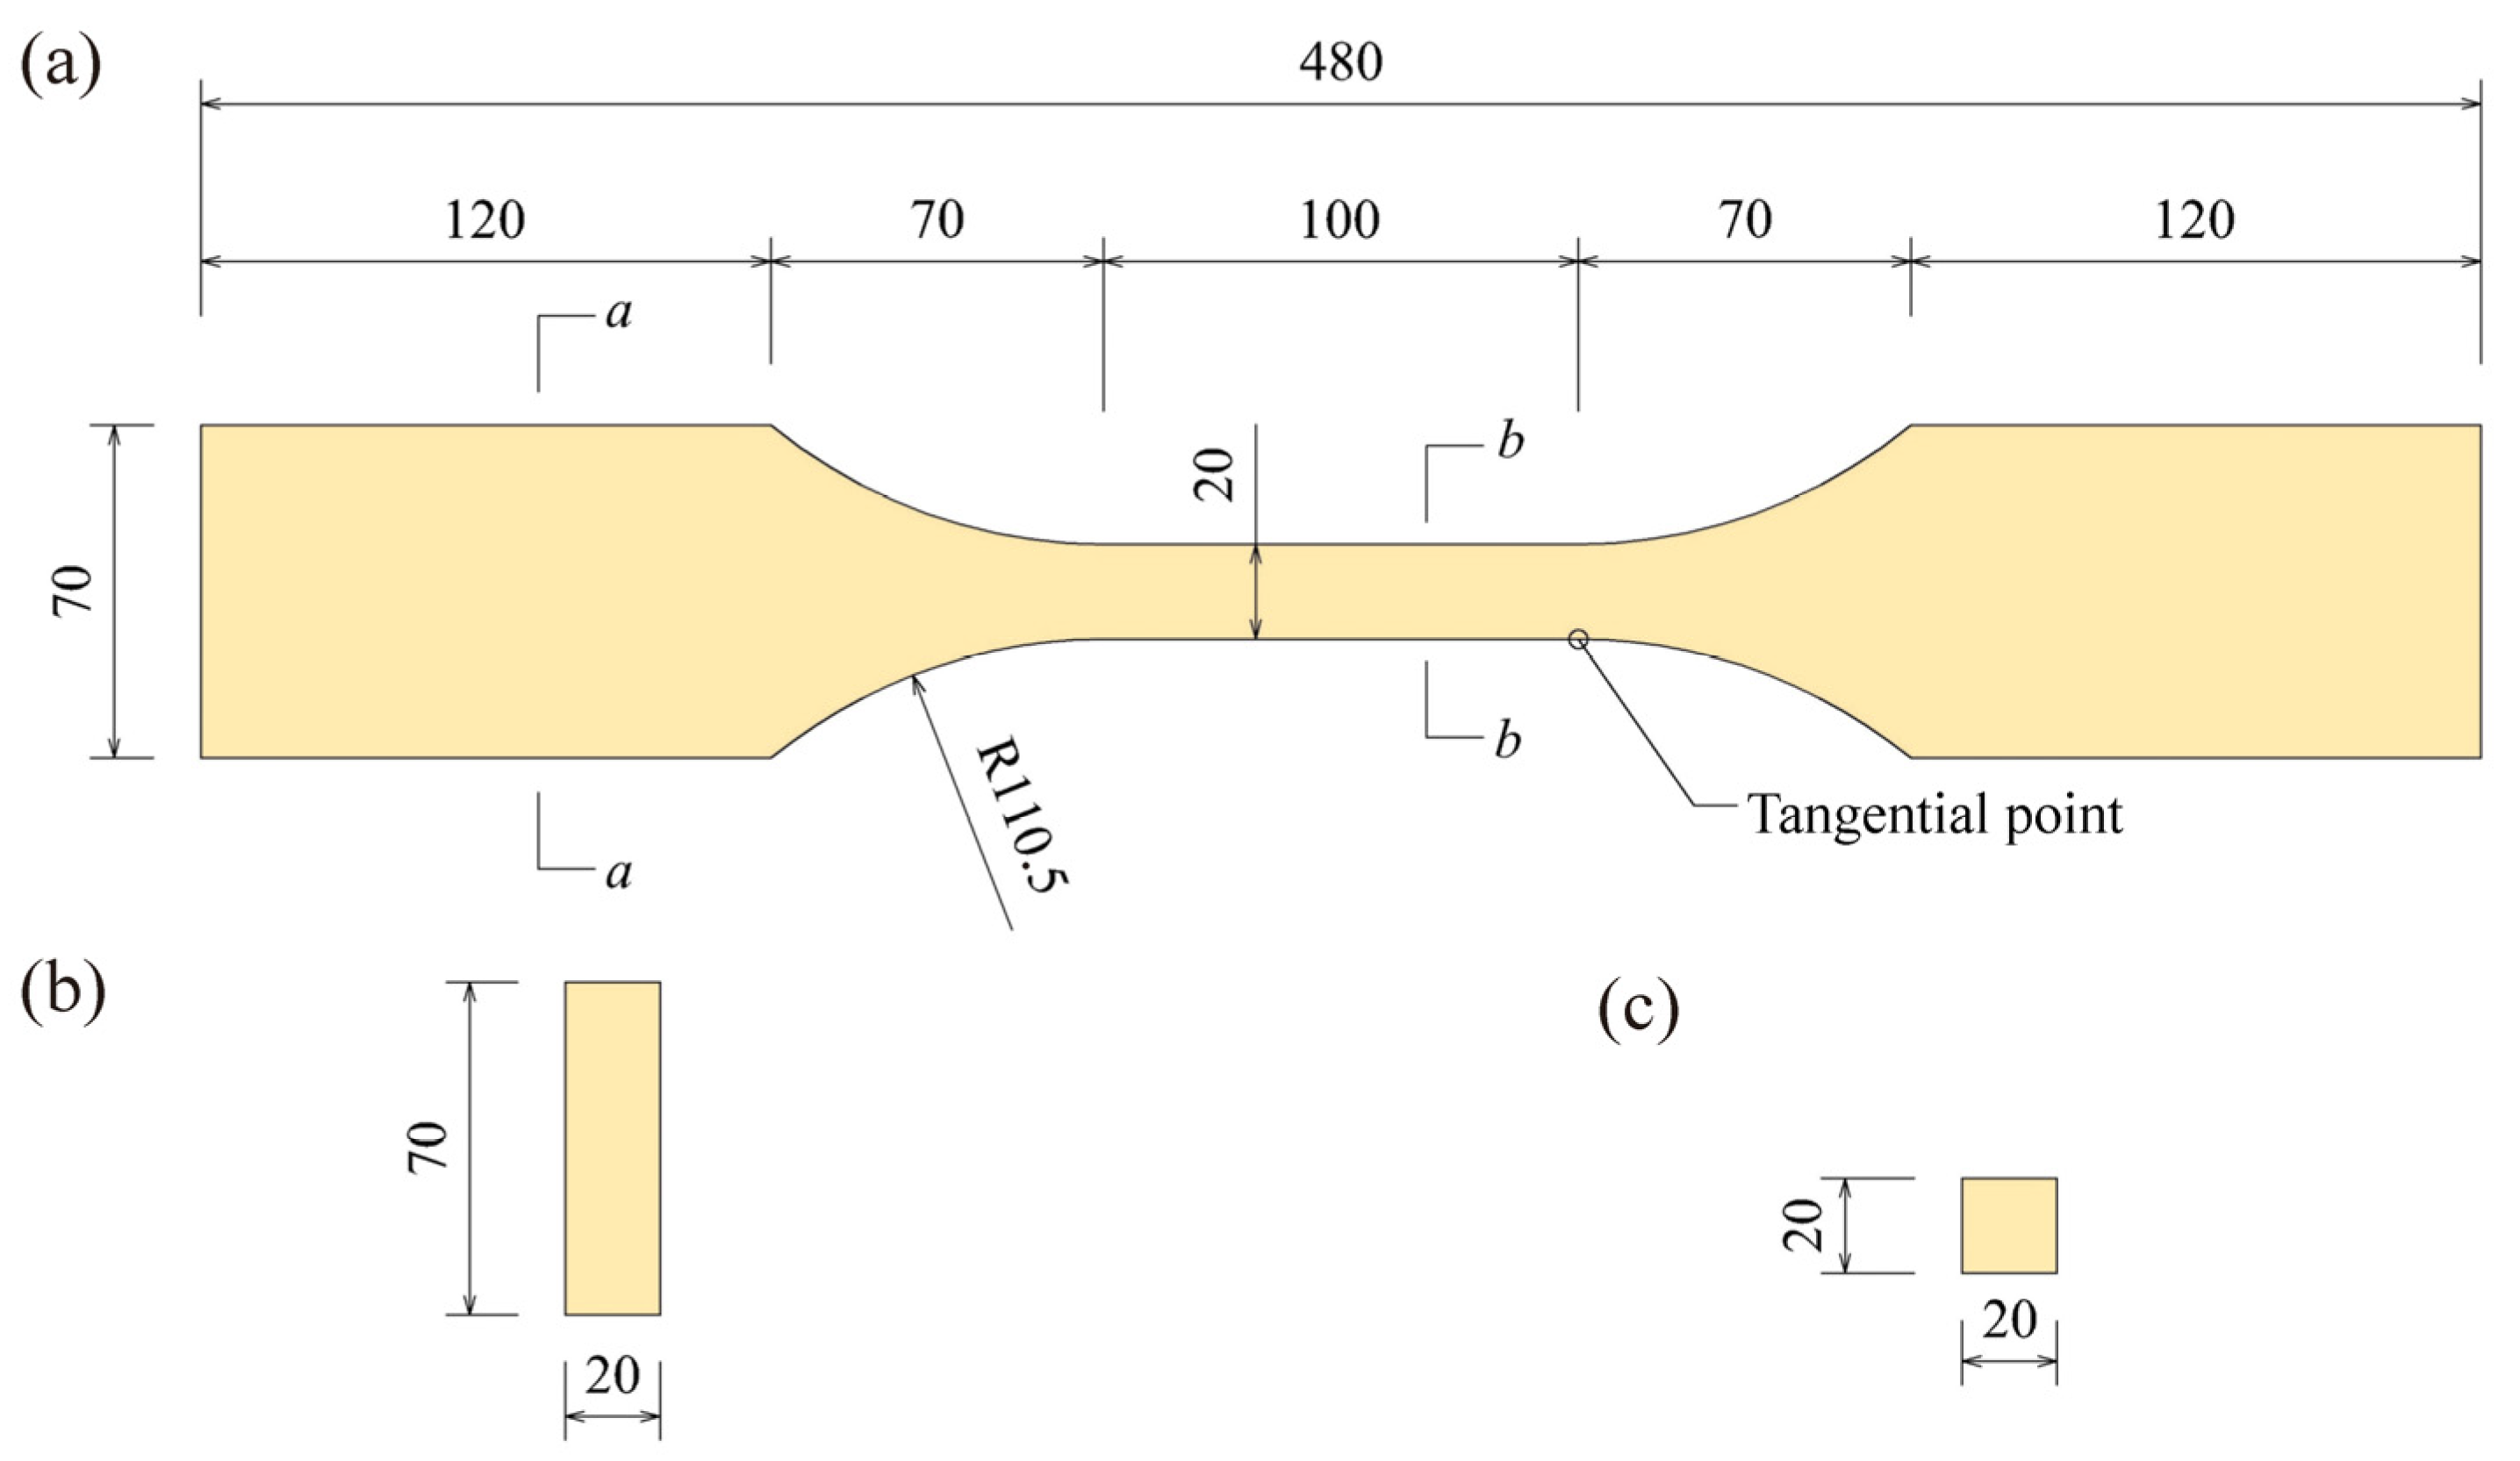
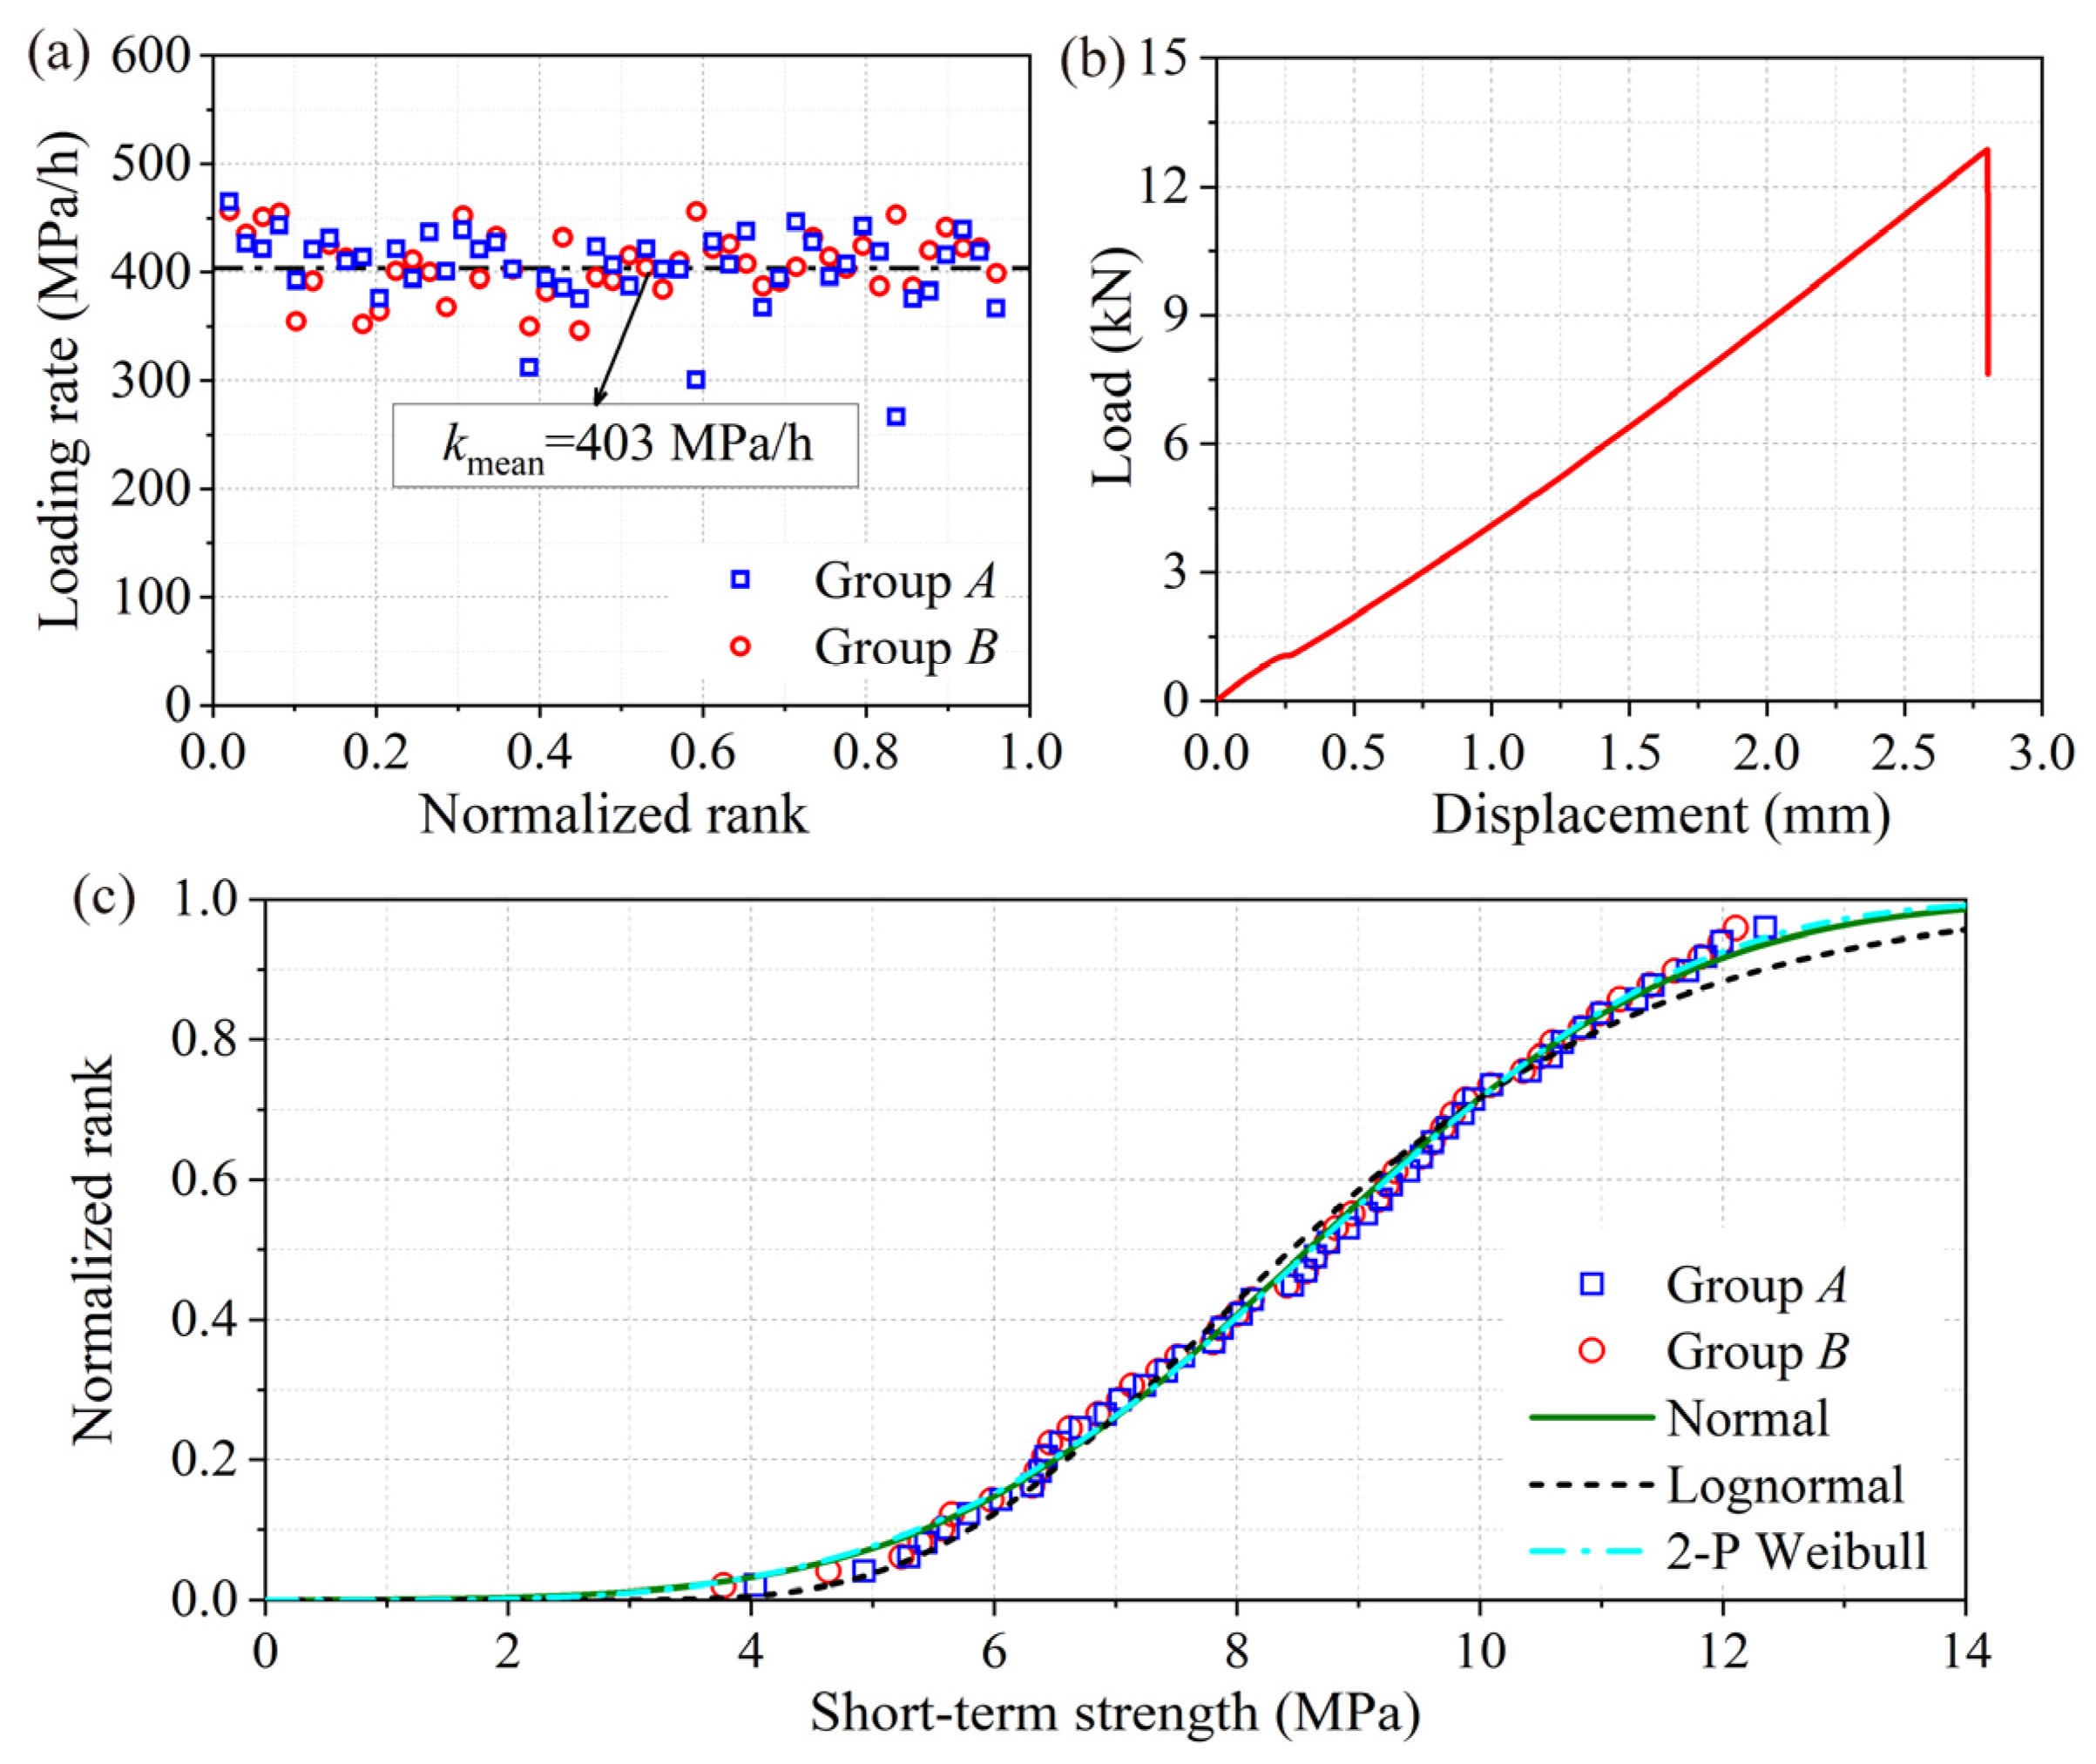
2.2. Short-Term Test
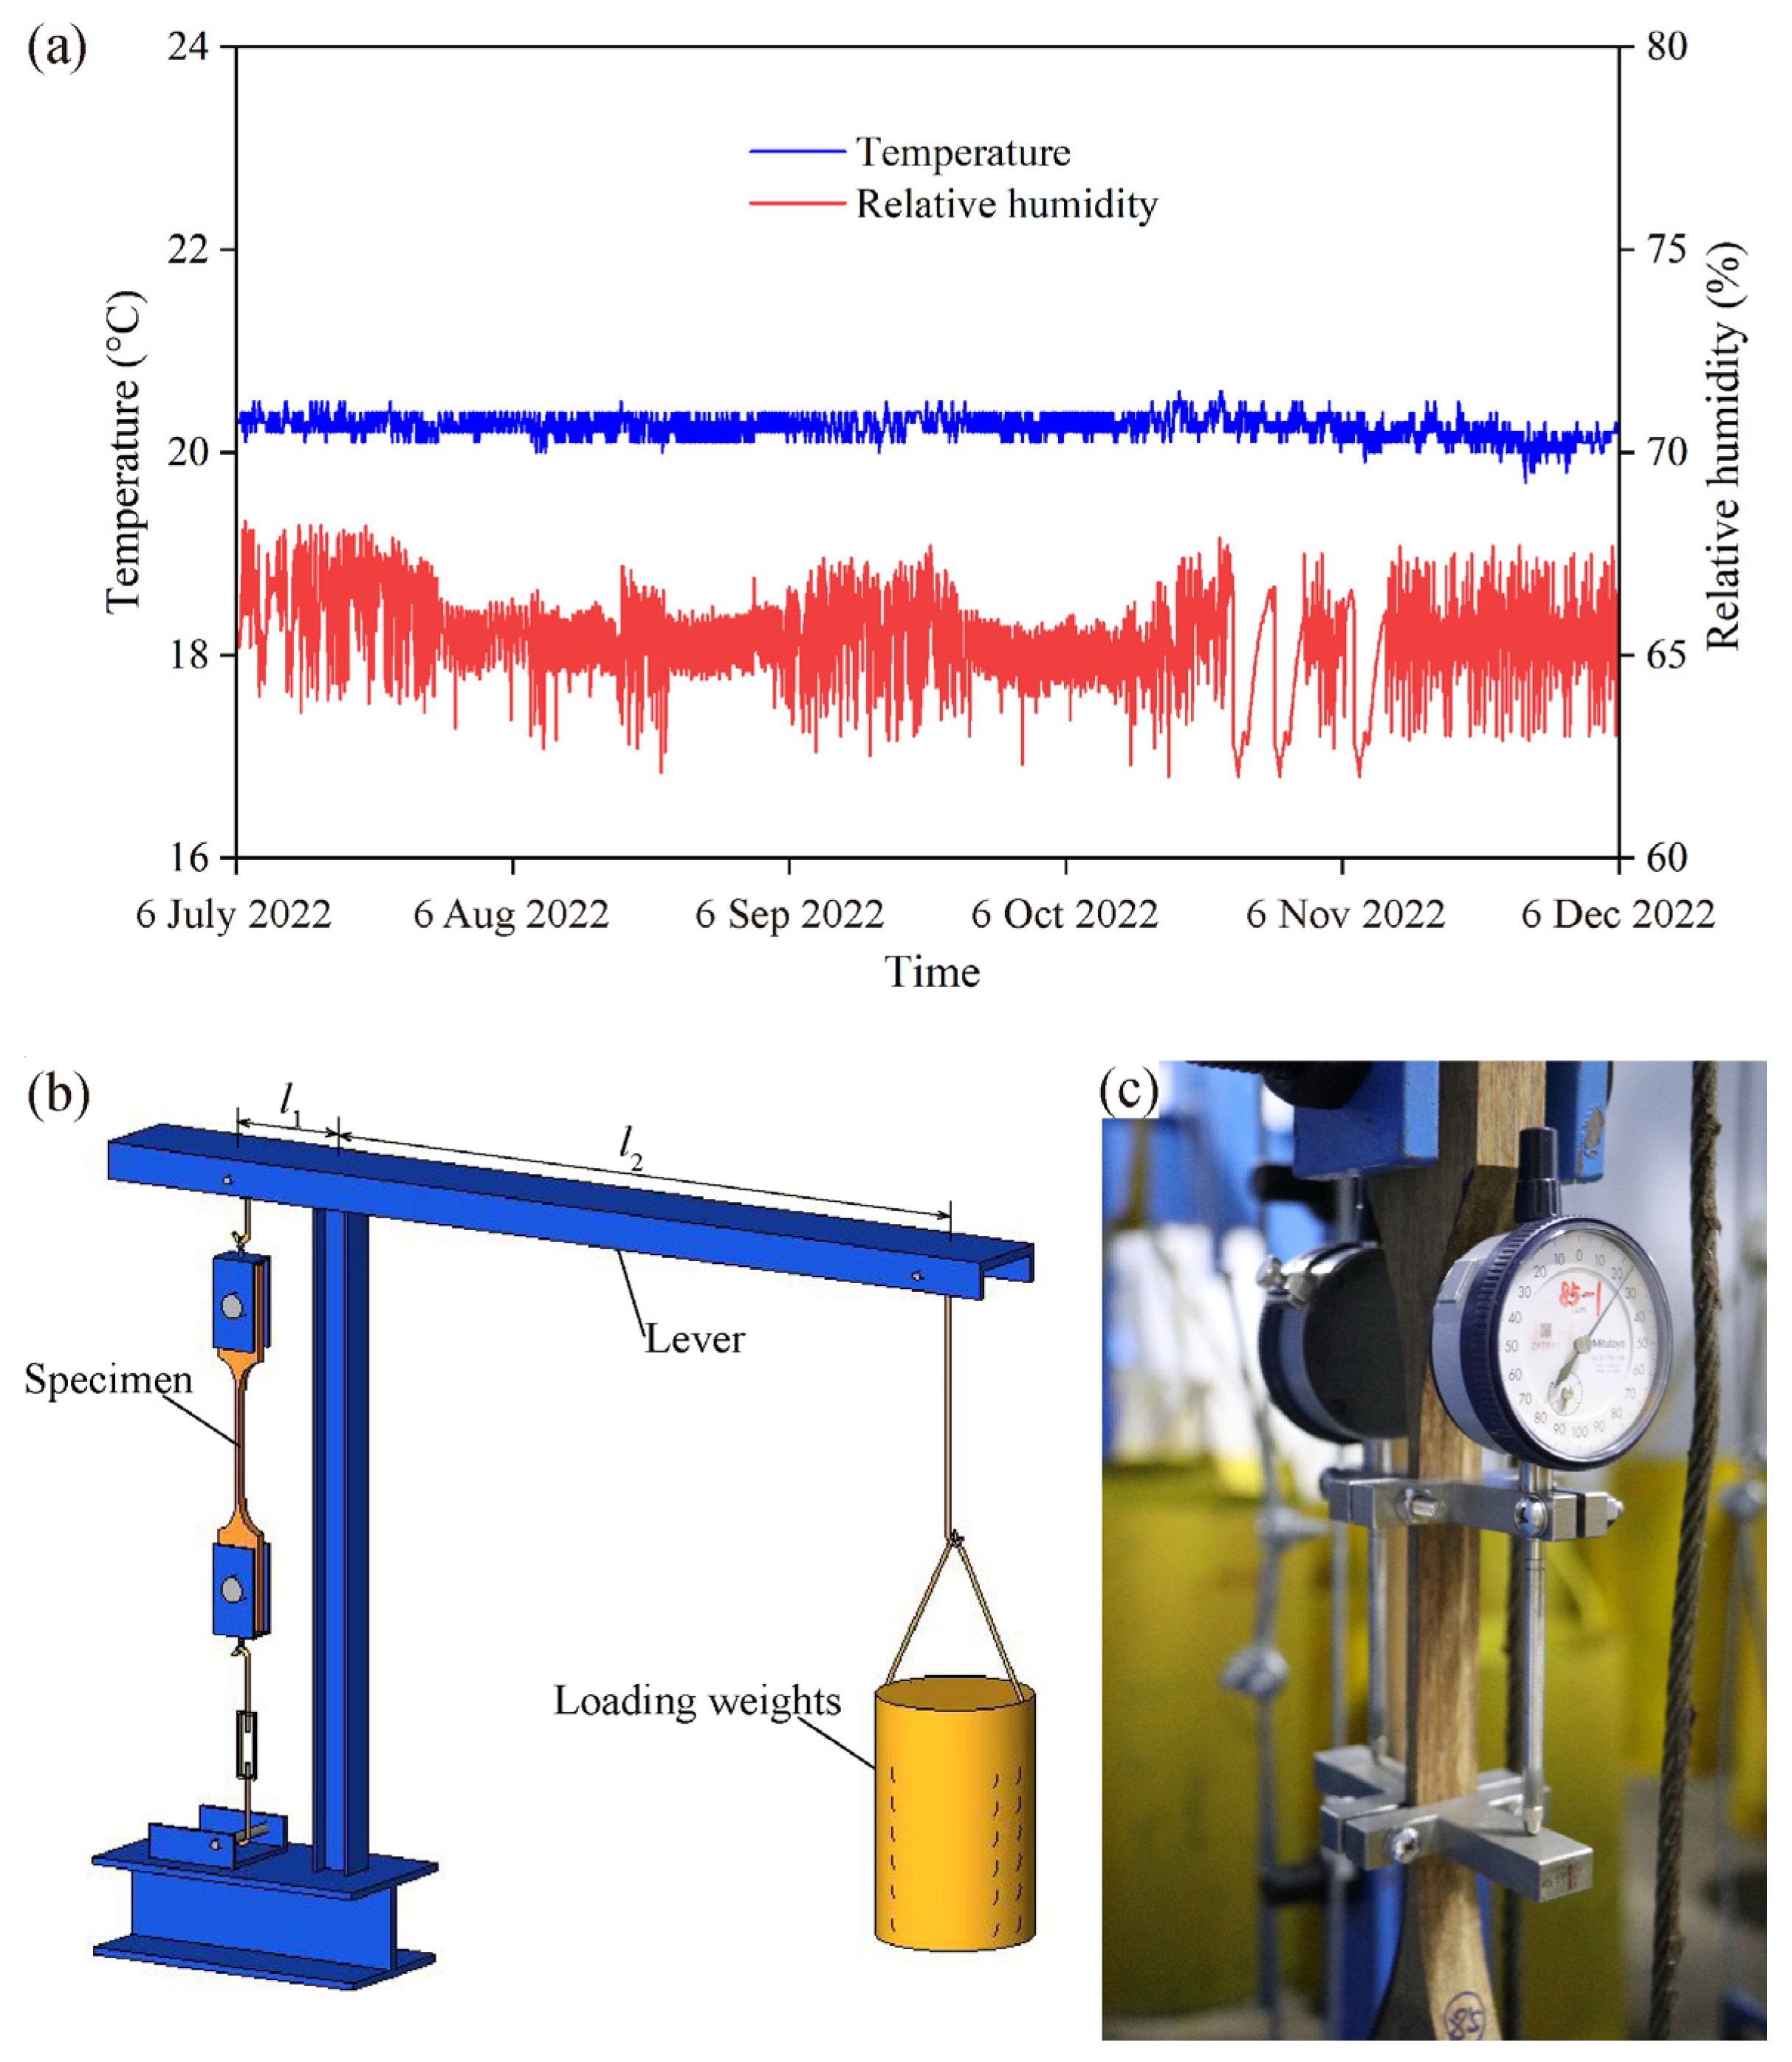
2.3. Long-Term Test
3. Results and Discussion
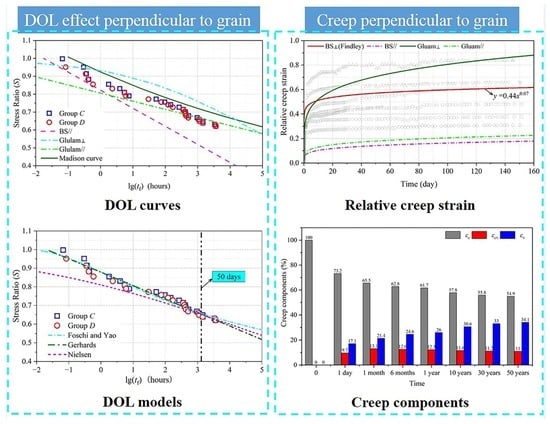
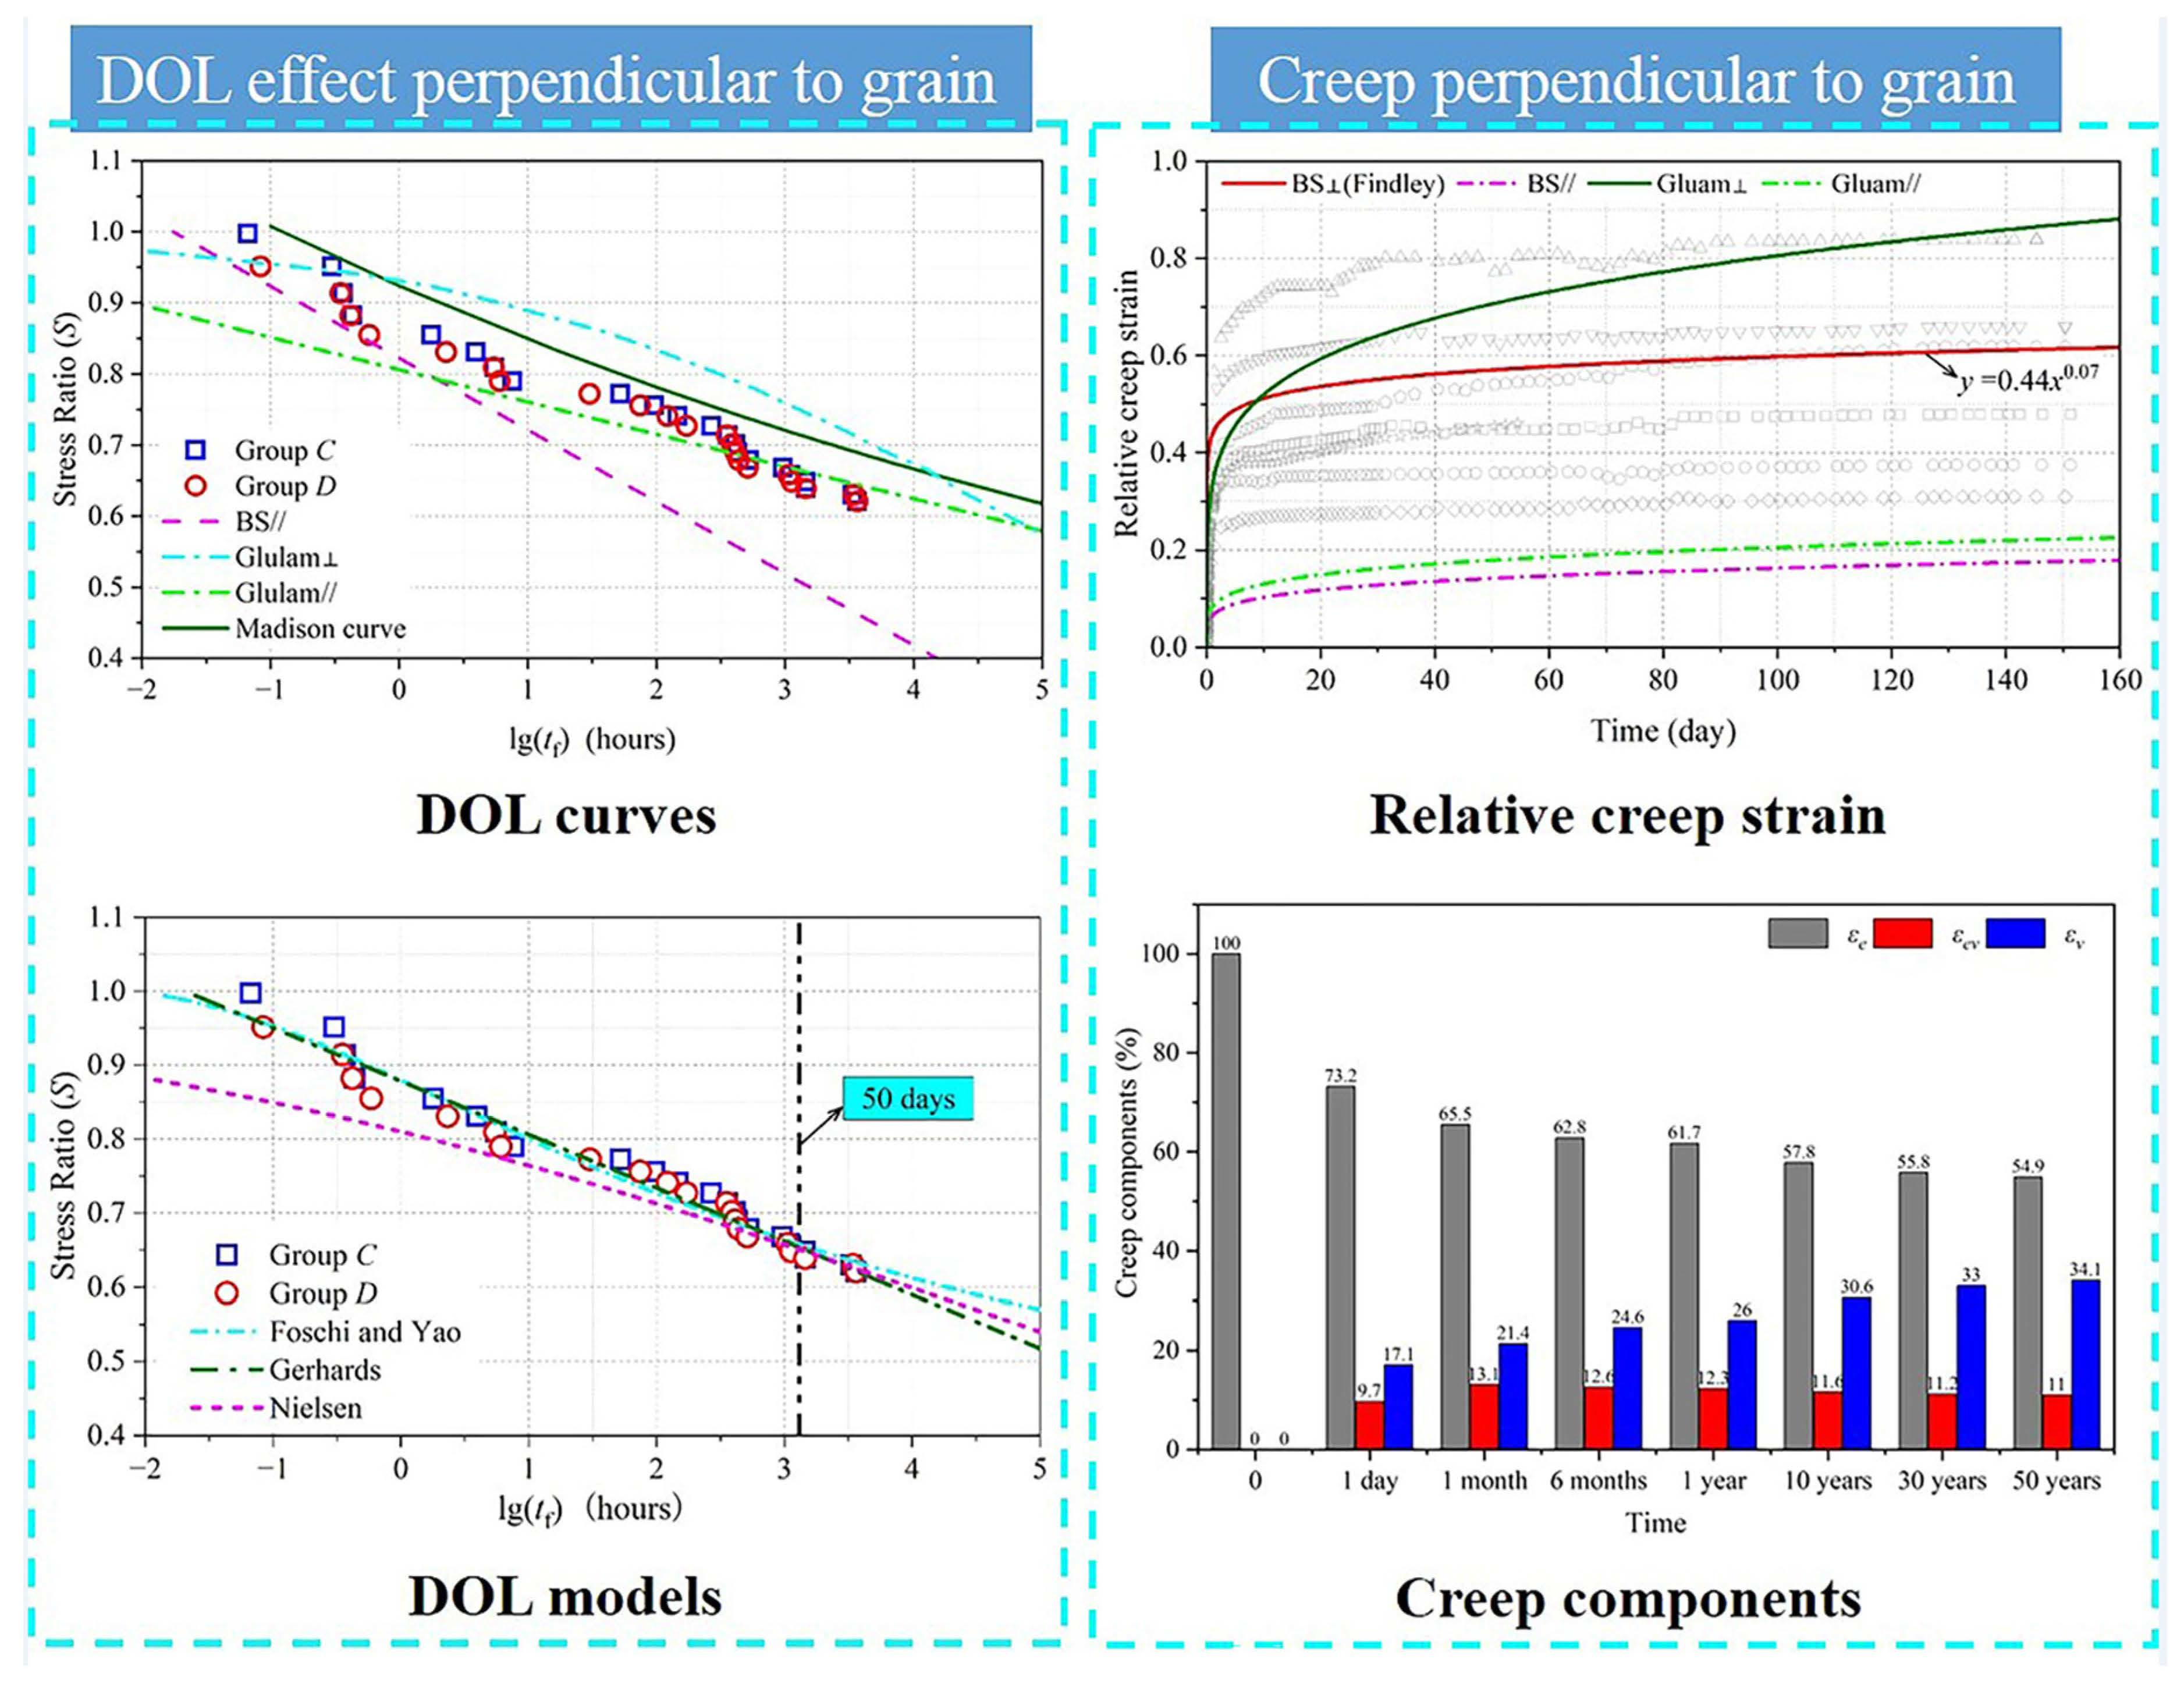
3.1. DOL Effect
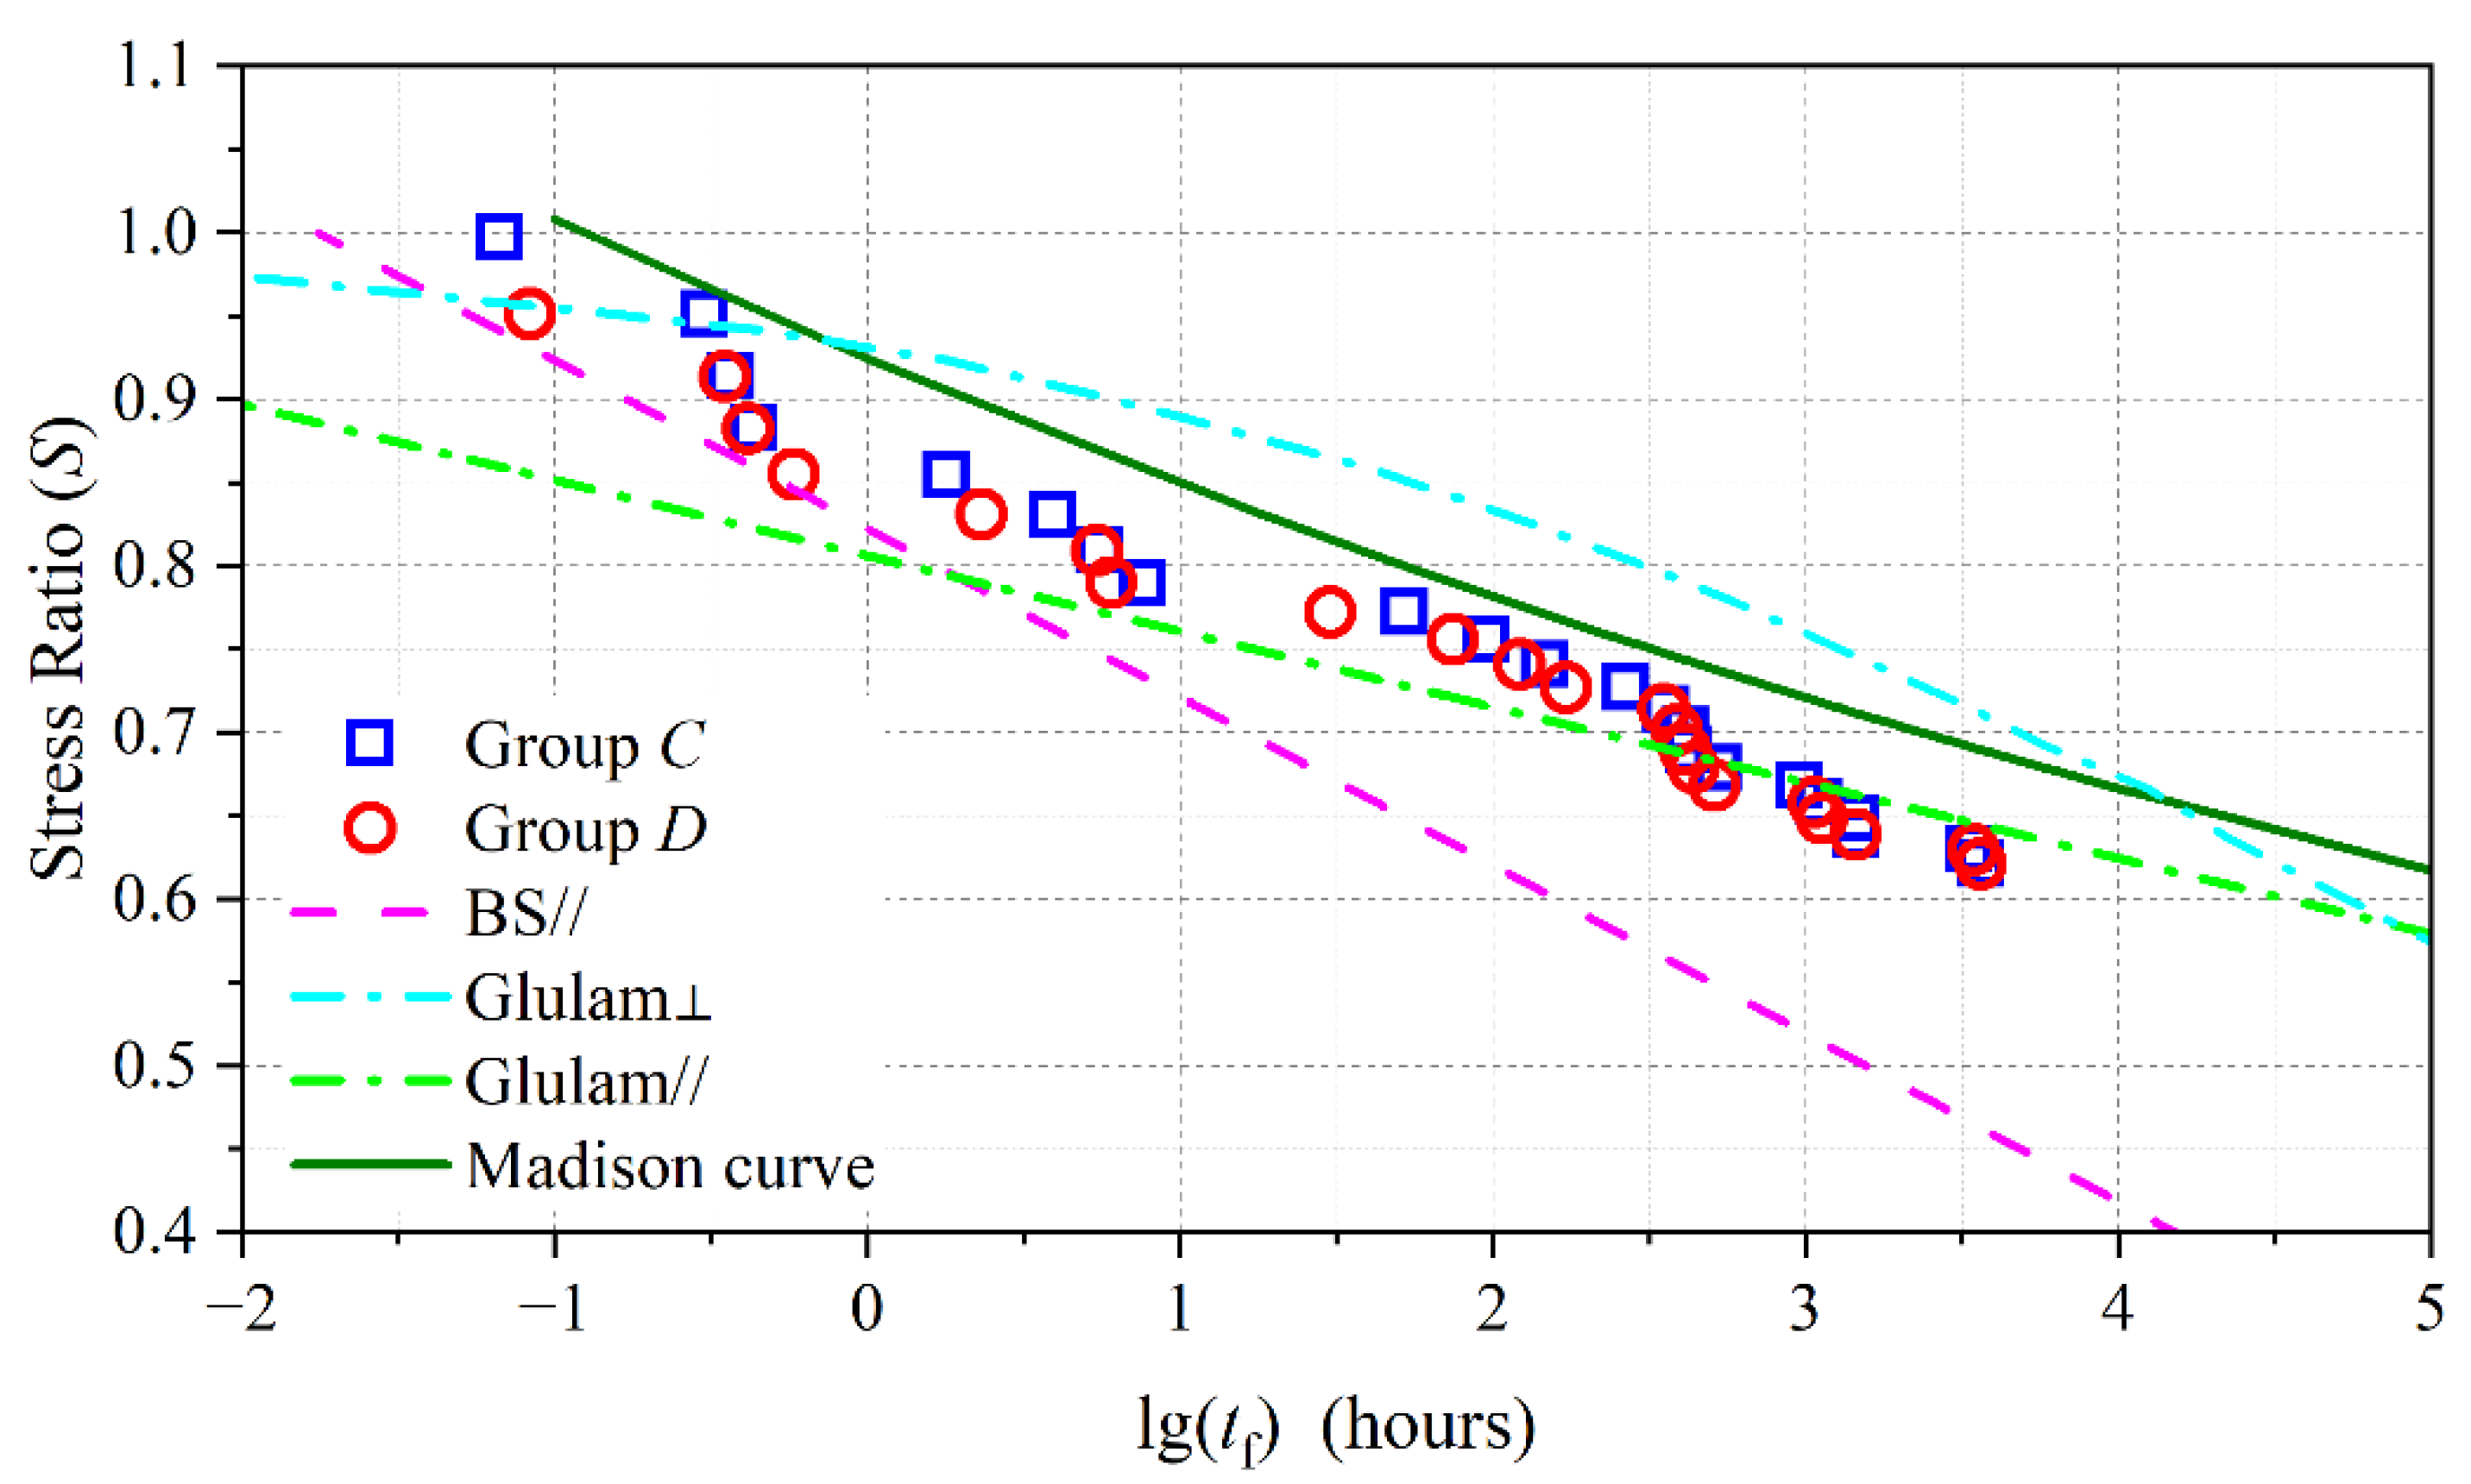
3.1.1. Test Results
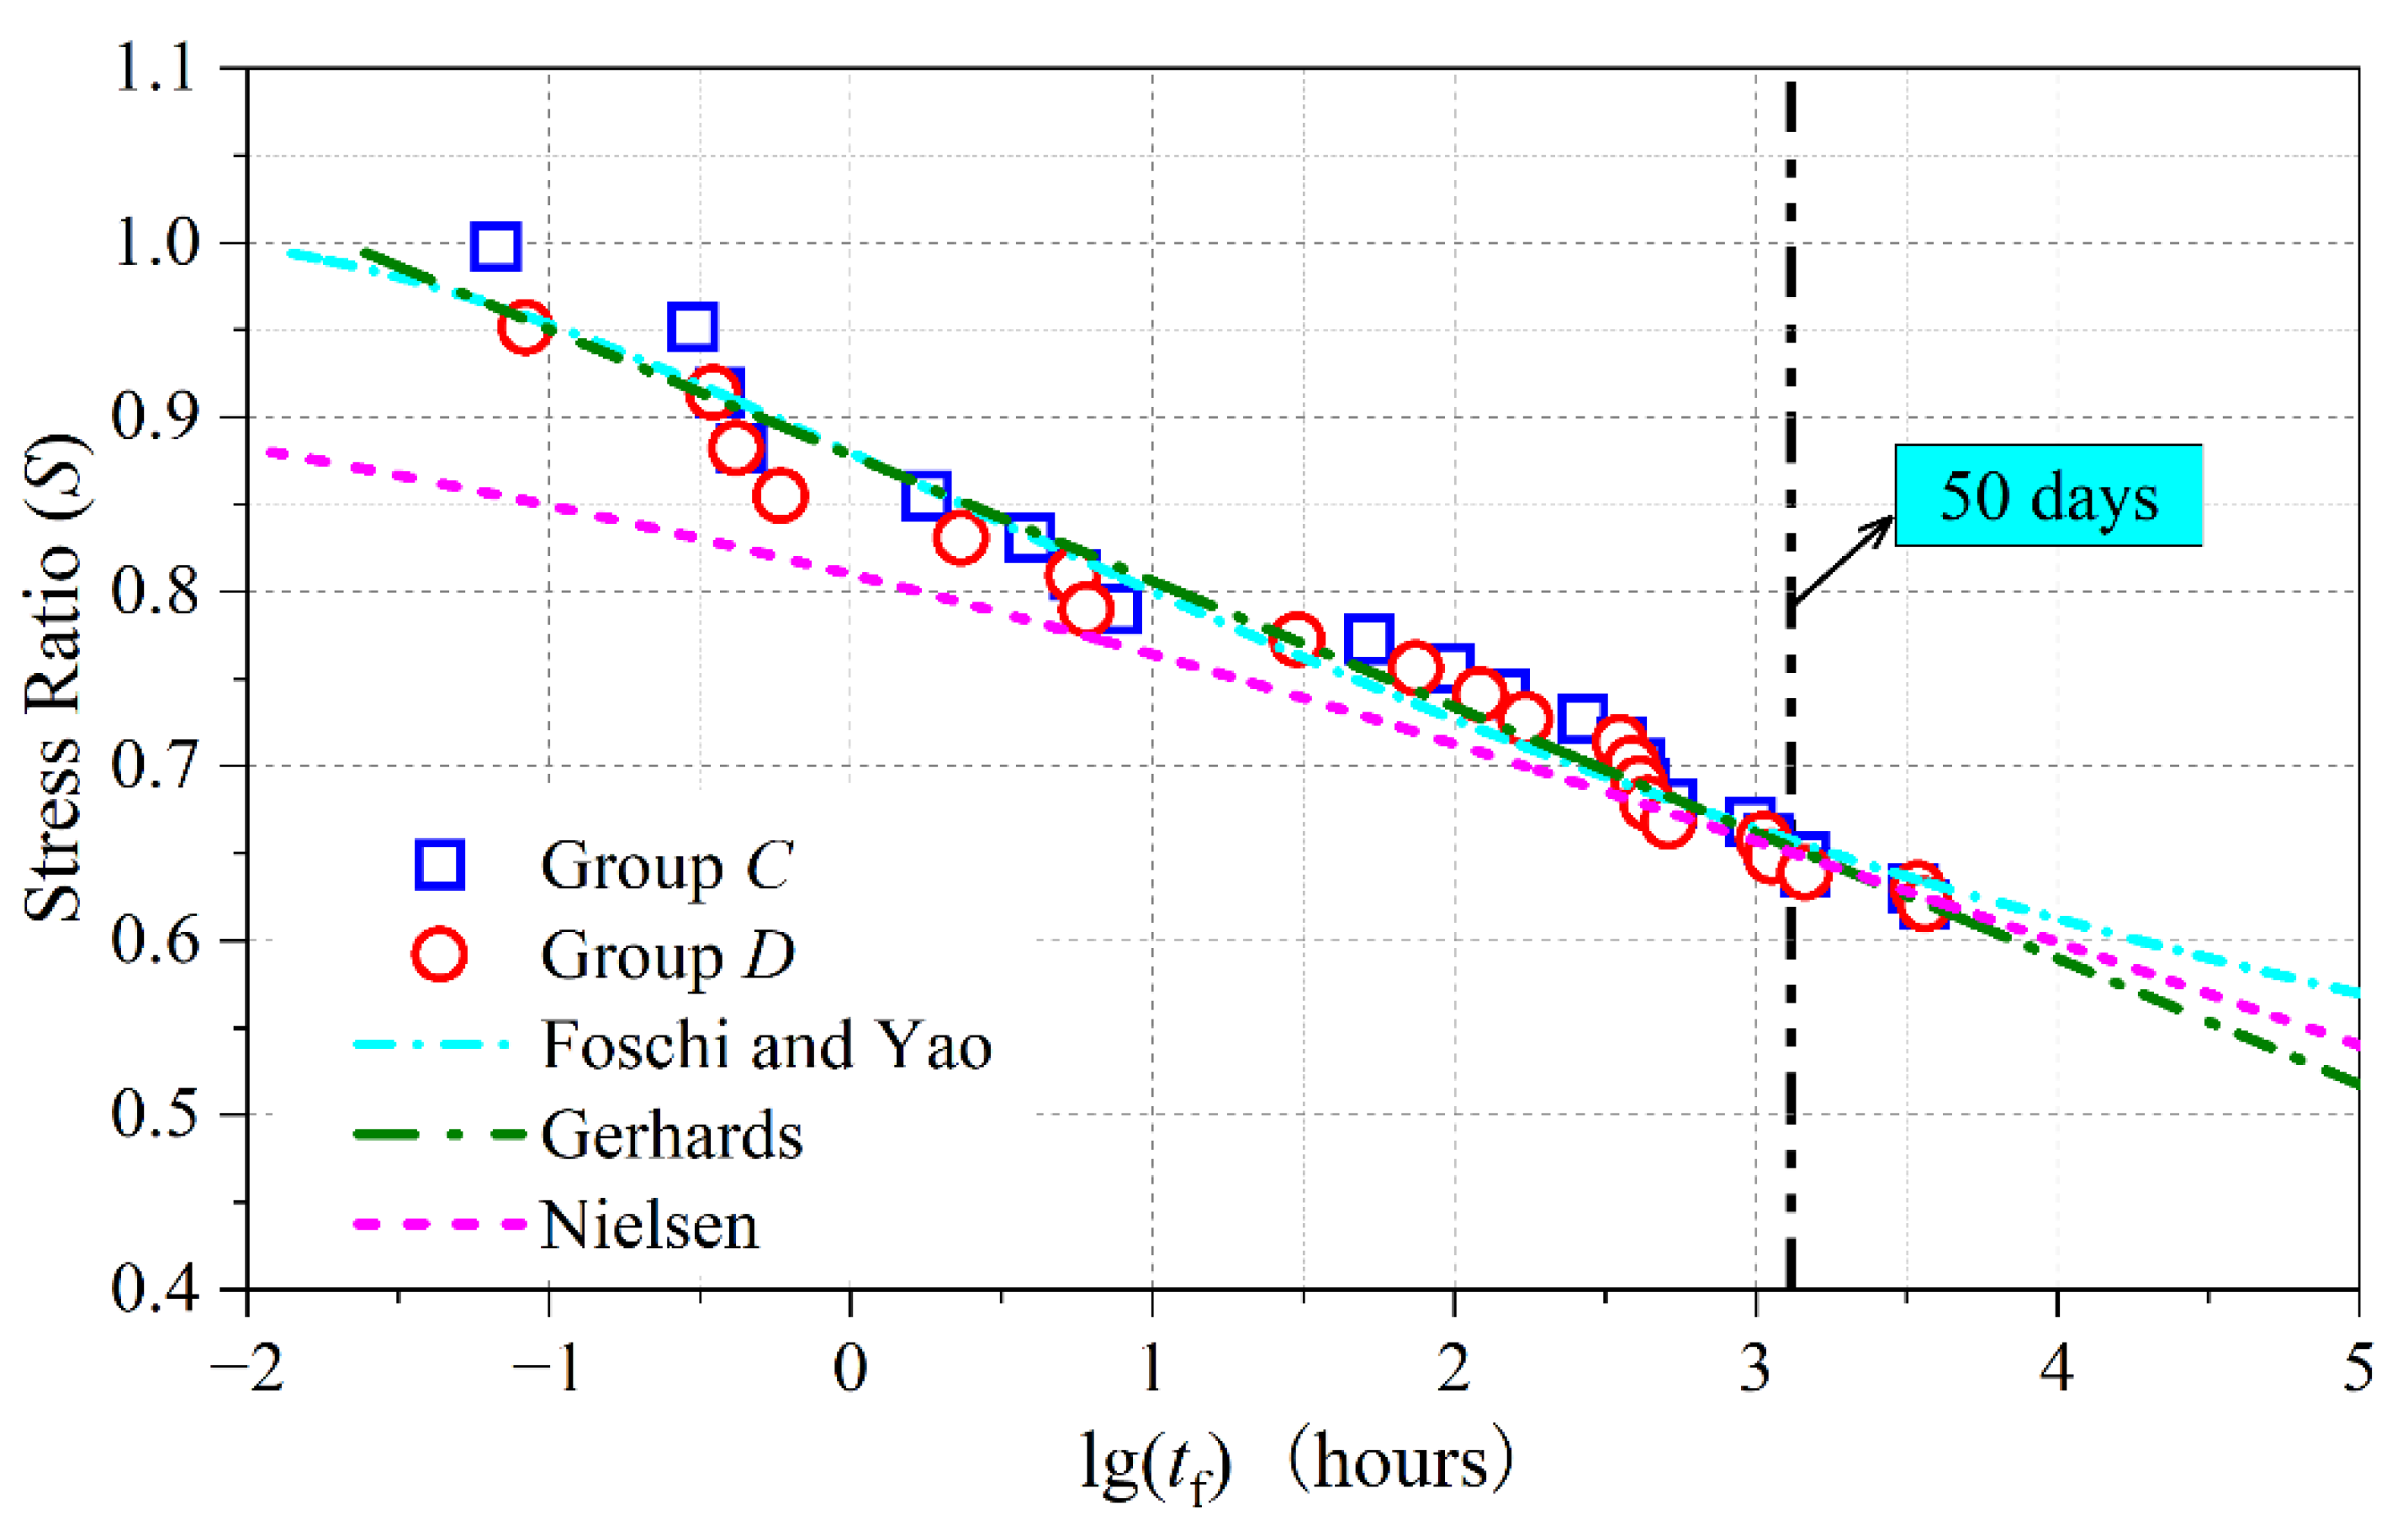
3.1.2. DOL Models
- The Foschi and Yao model can be expressed as:
- 2.
- The Gerhards model can be expressed as follows:
- 3.
- The Nielsen model can be expressed as:
3.2. Creep Behavior
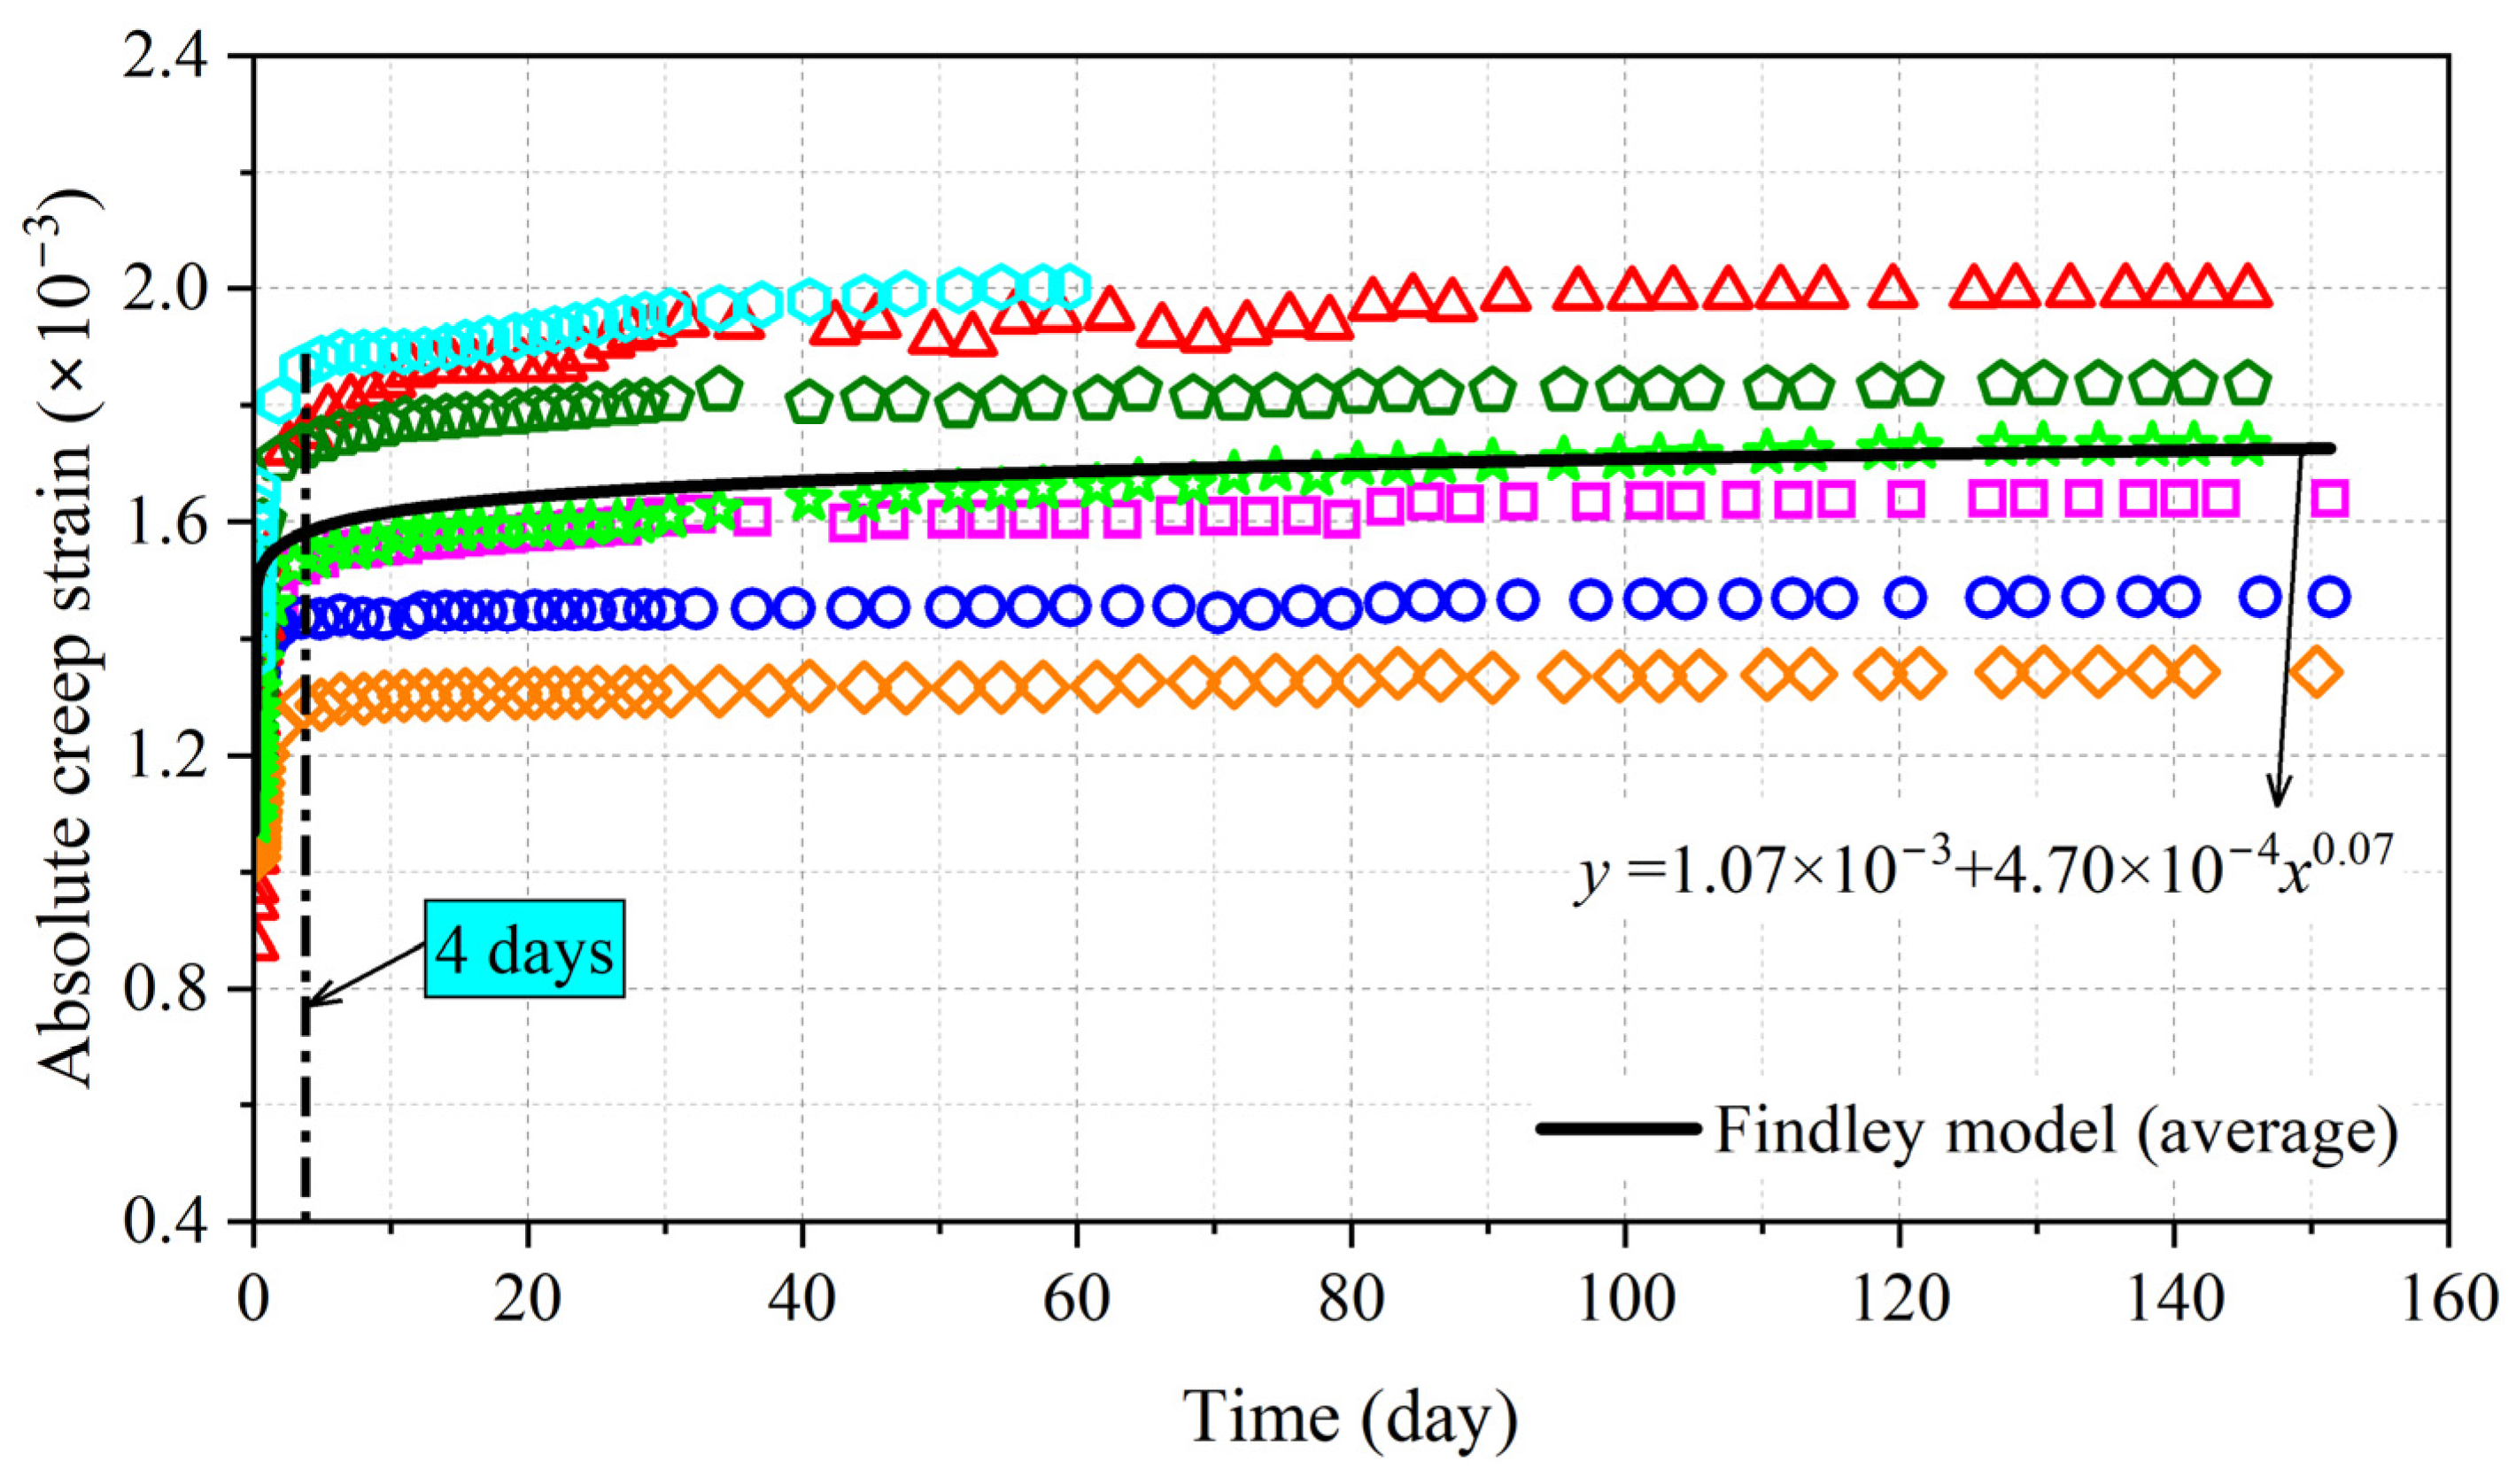
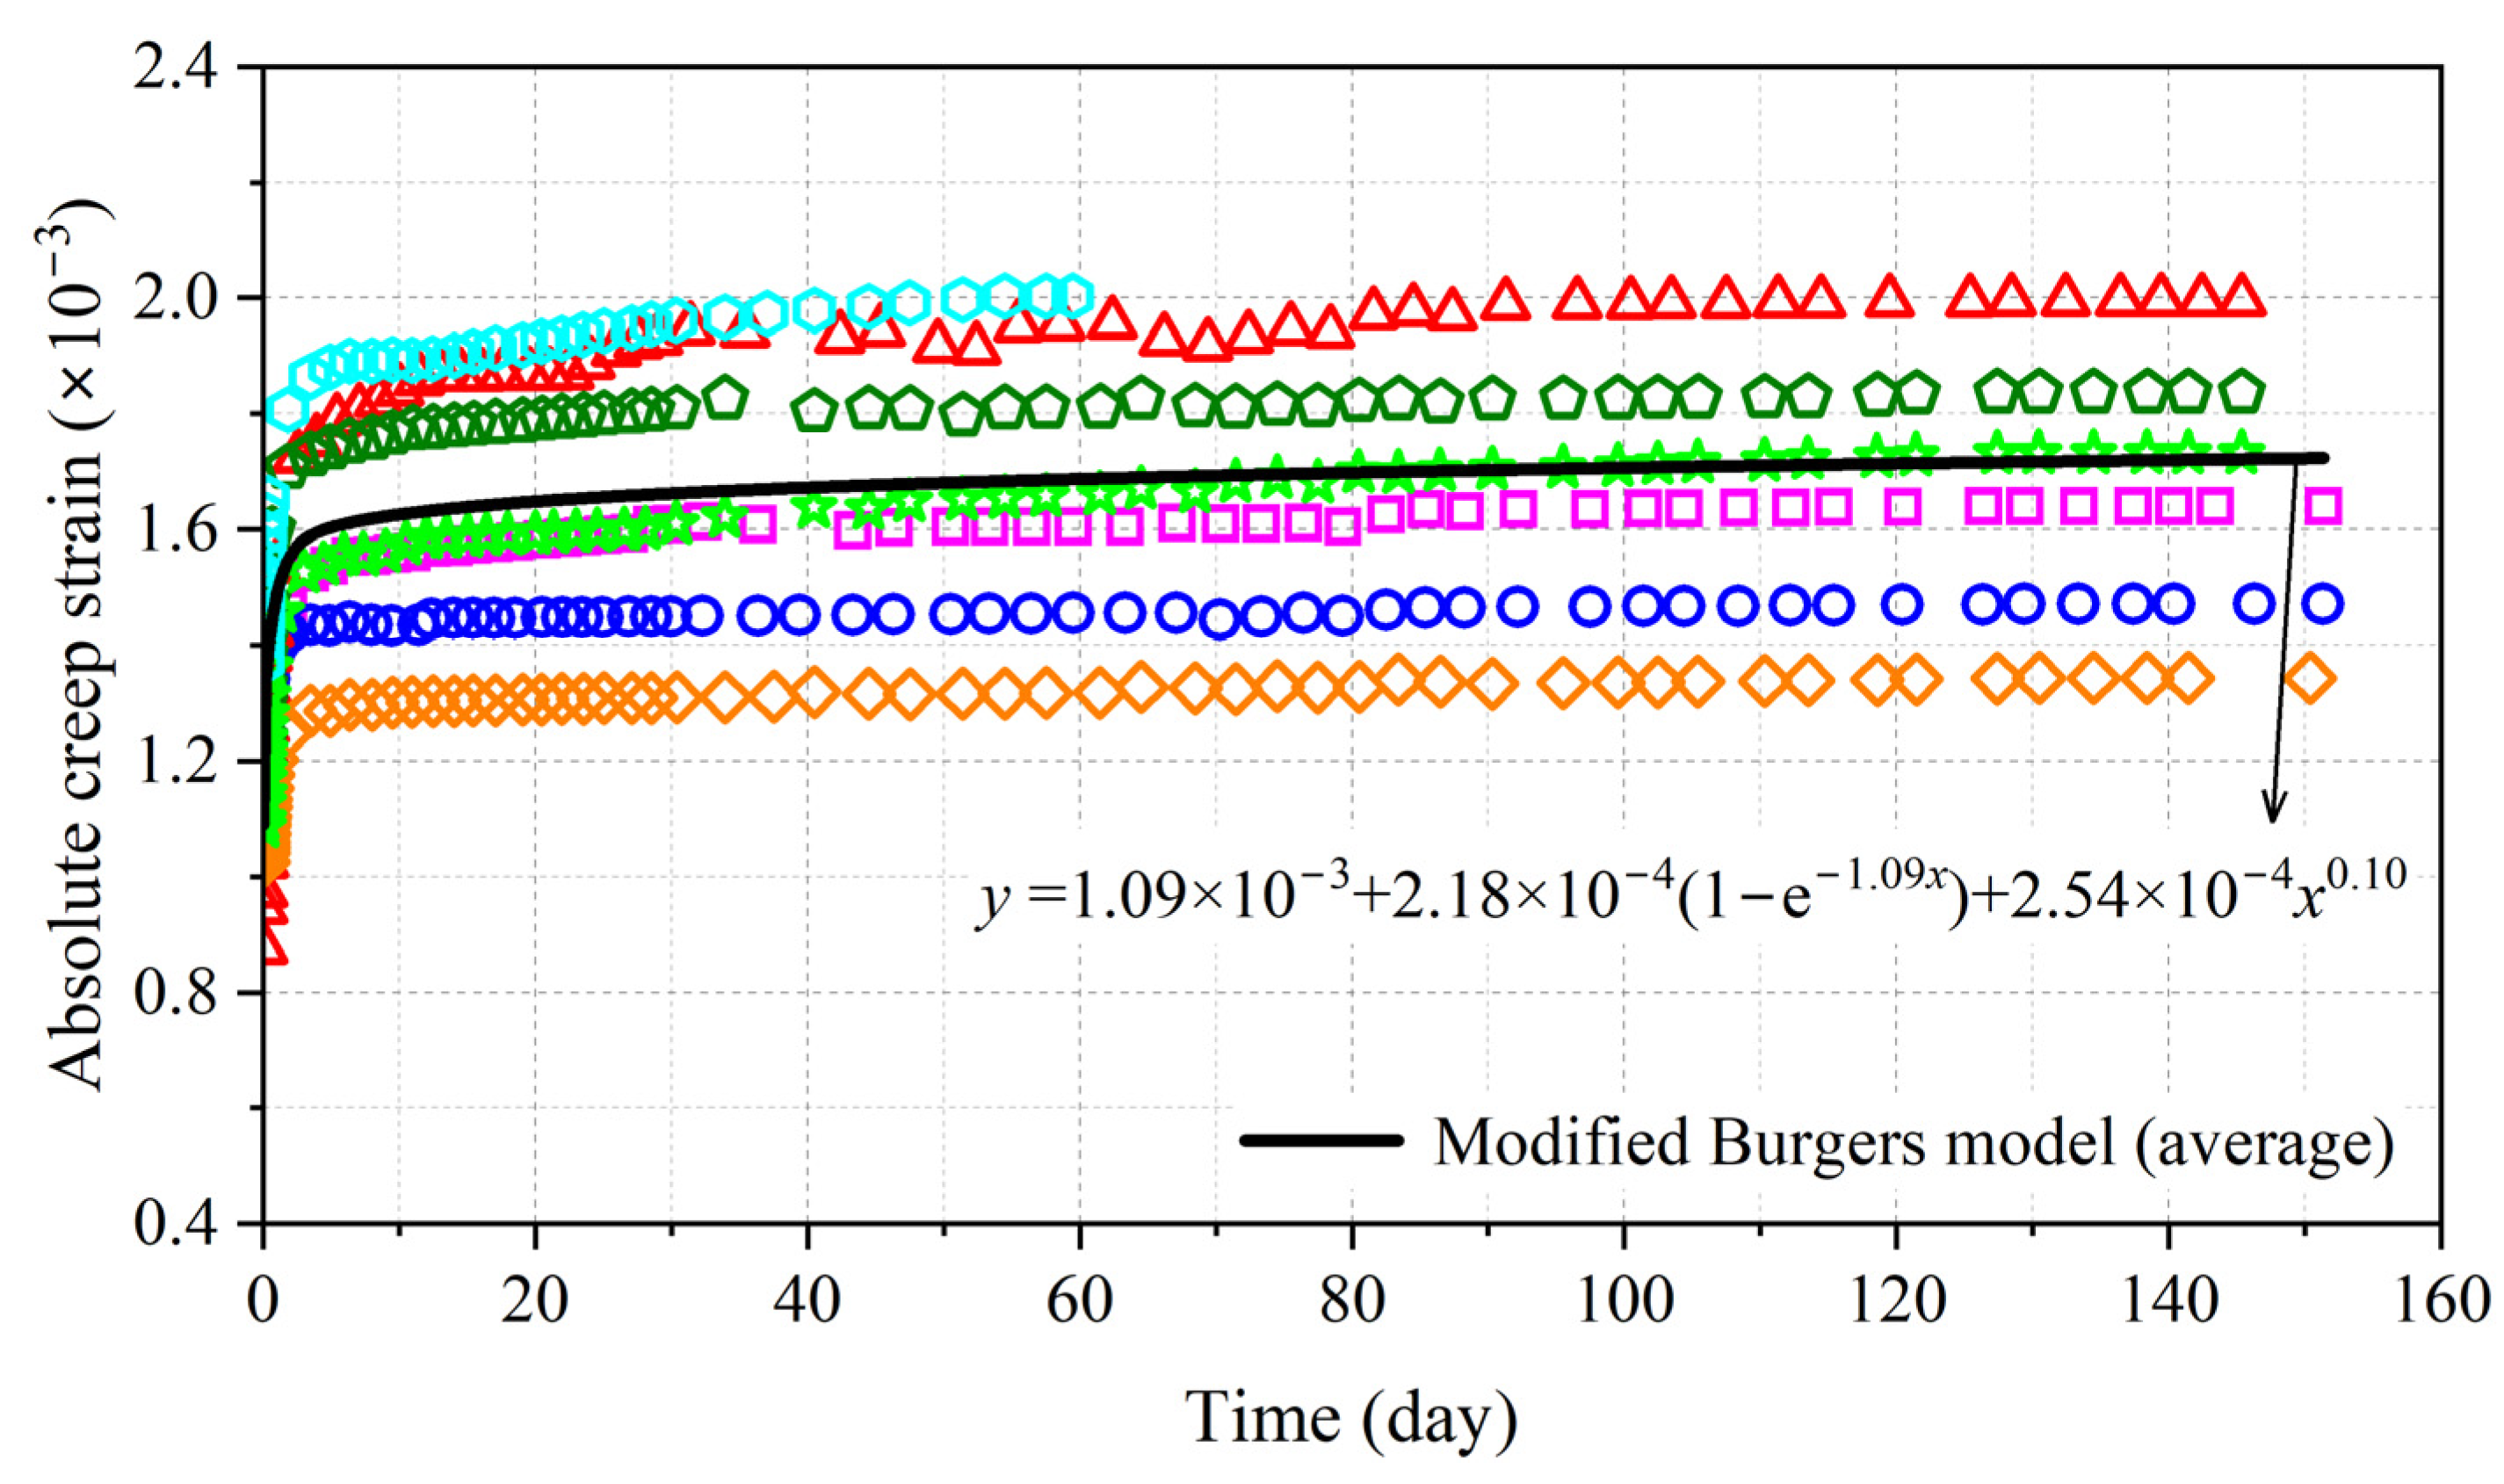
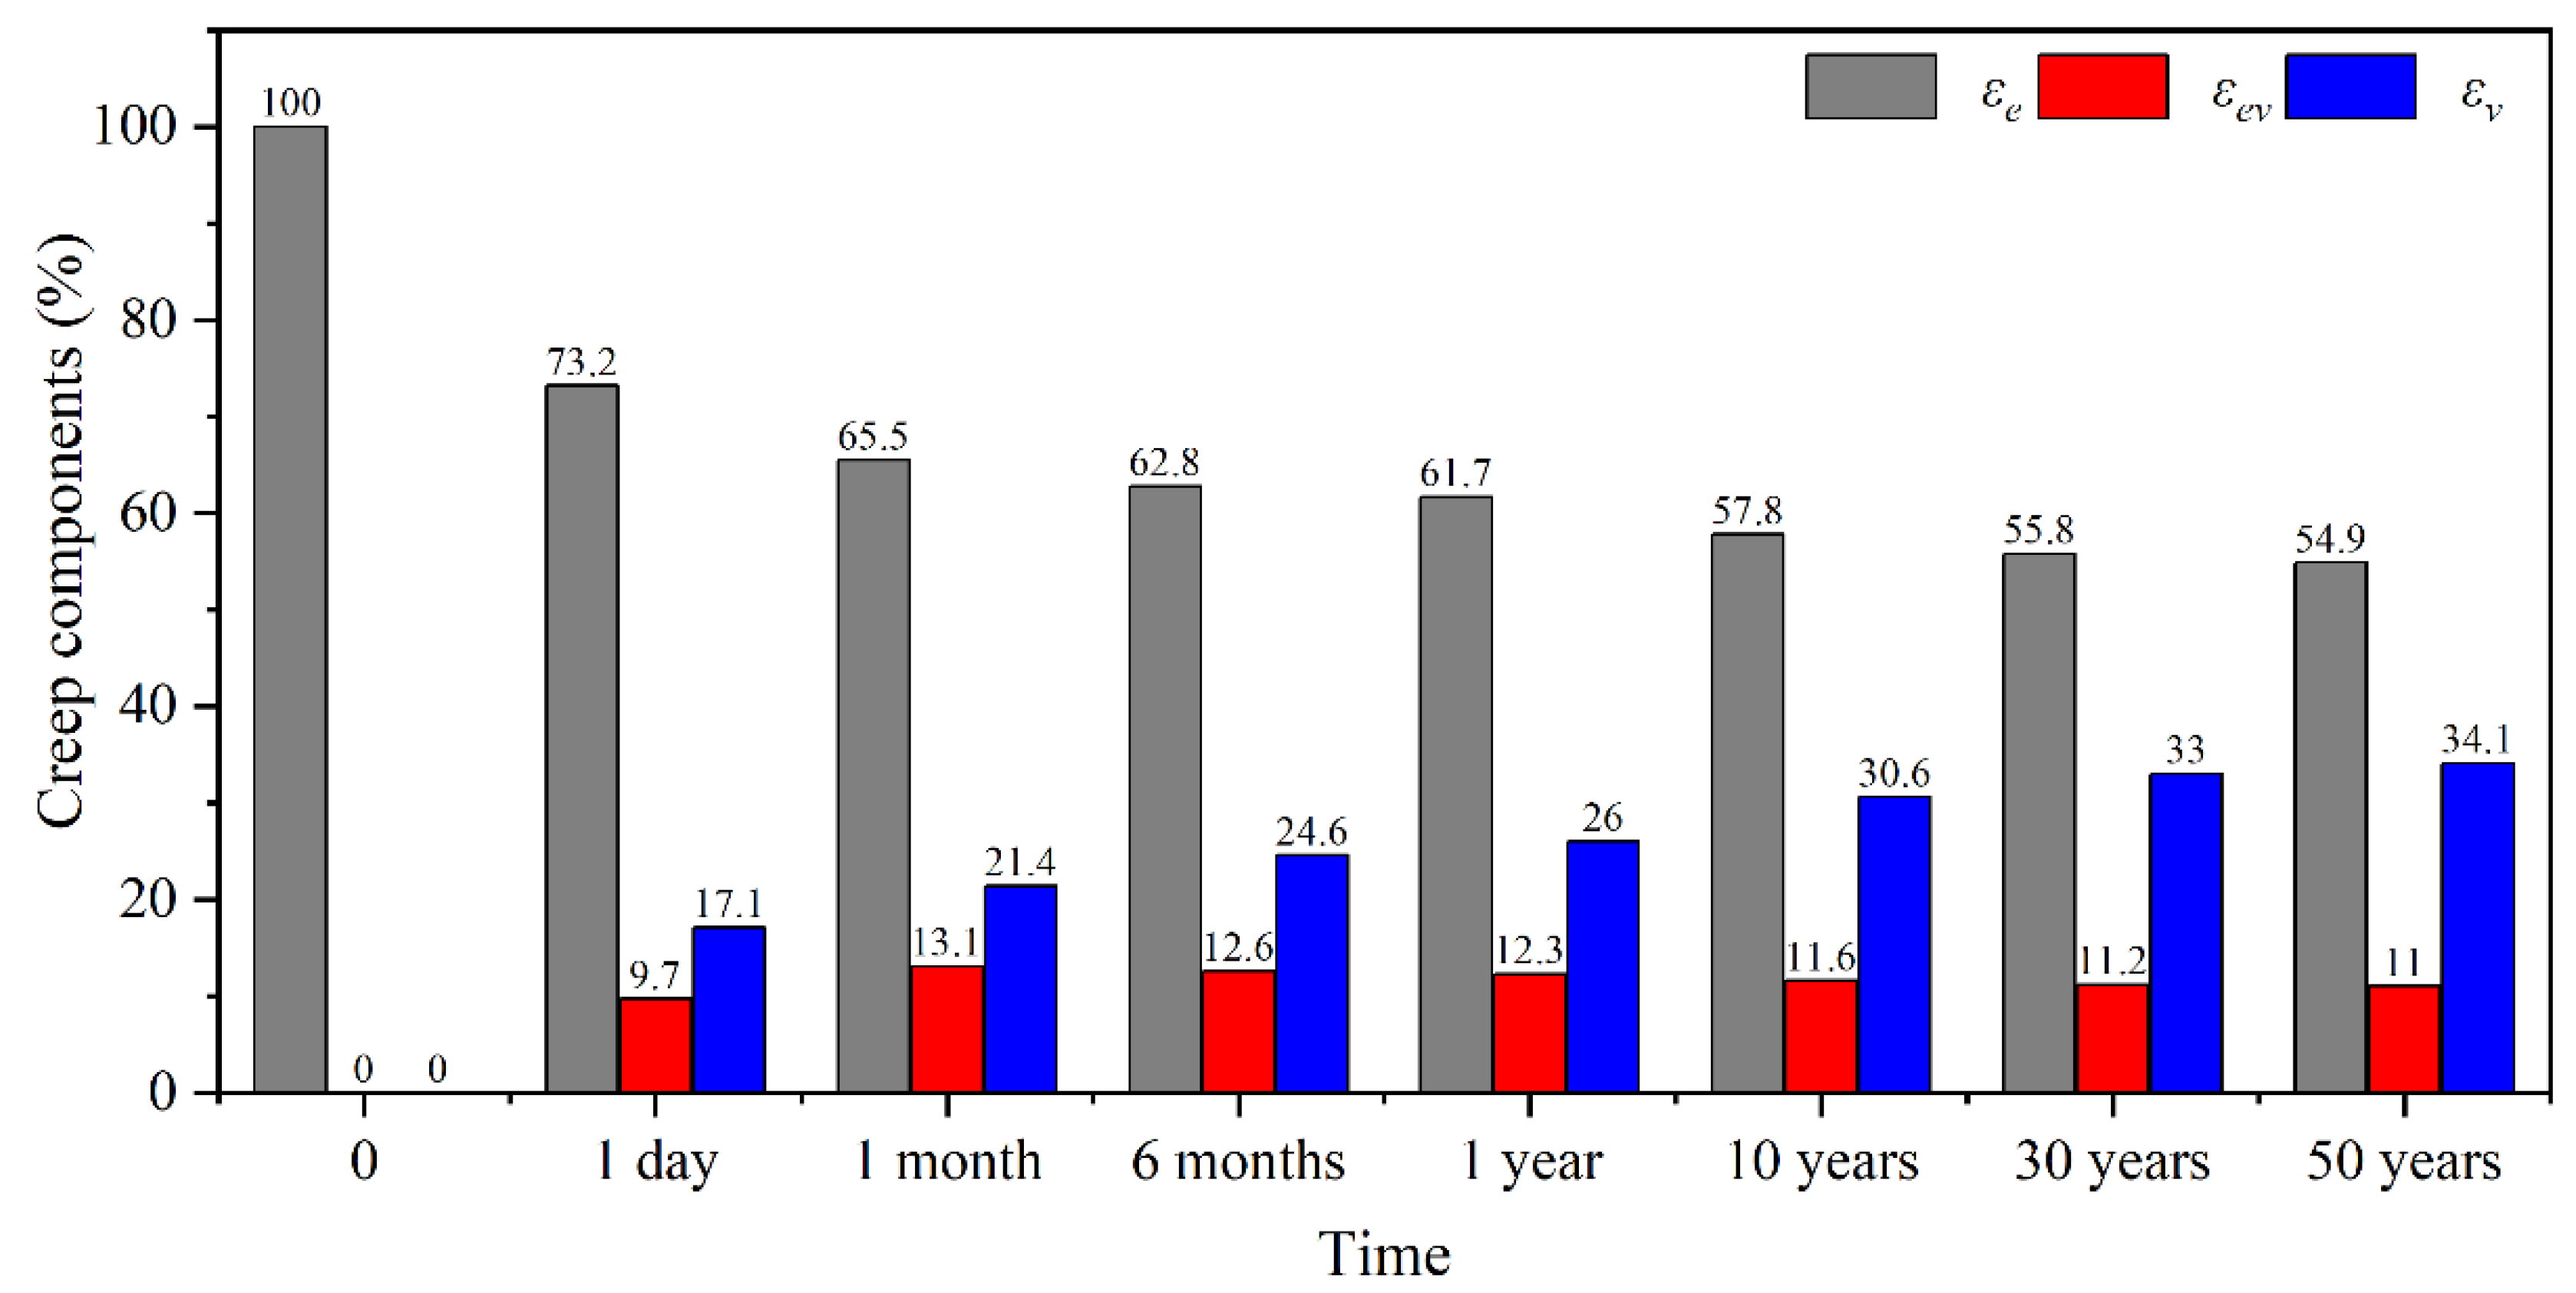
3.2.1. Creep Strain
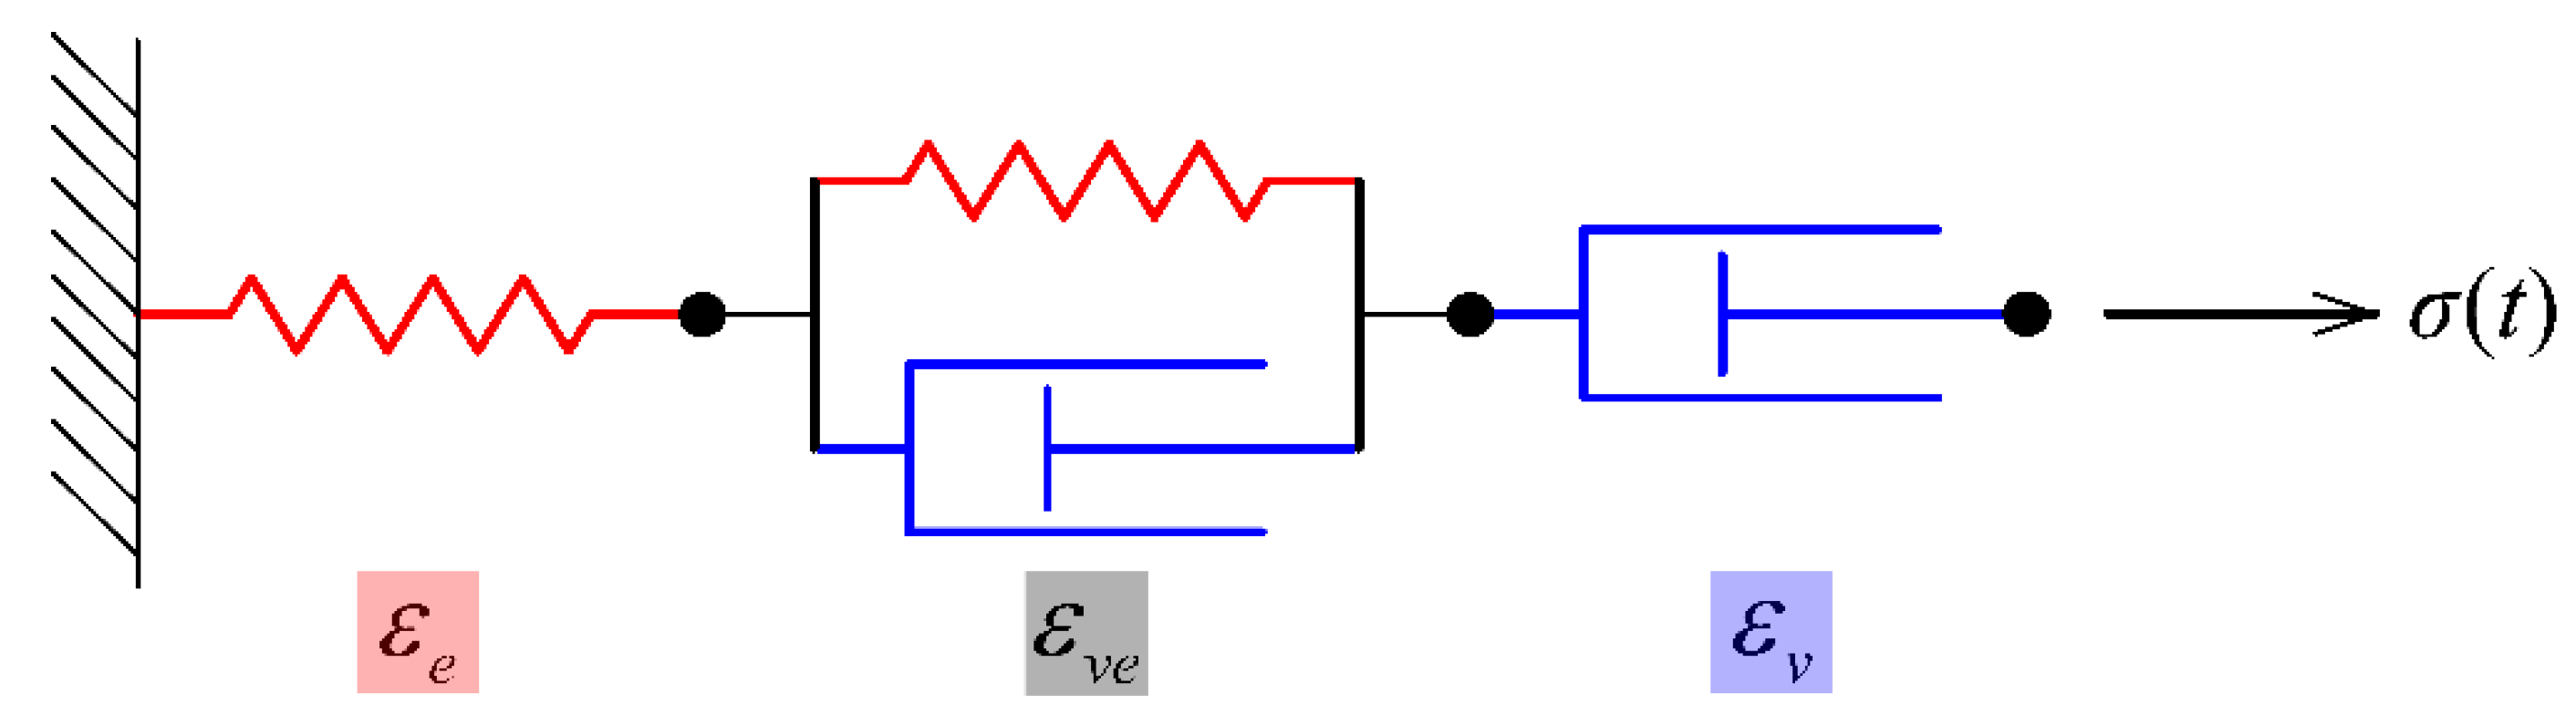
3.2.2. Viscoelastic Model
4. Conclusions
- (1)
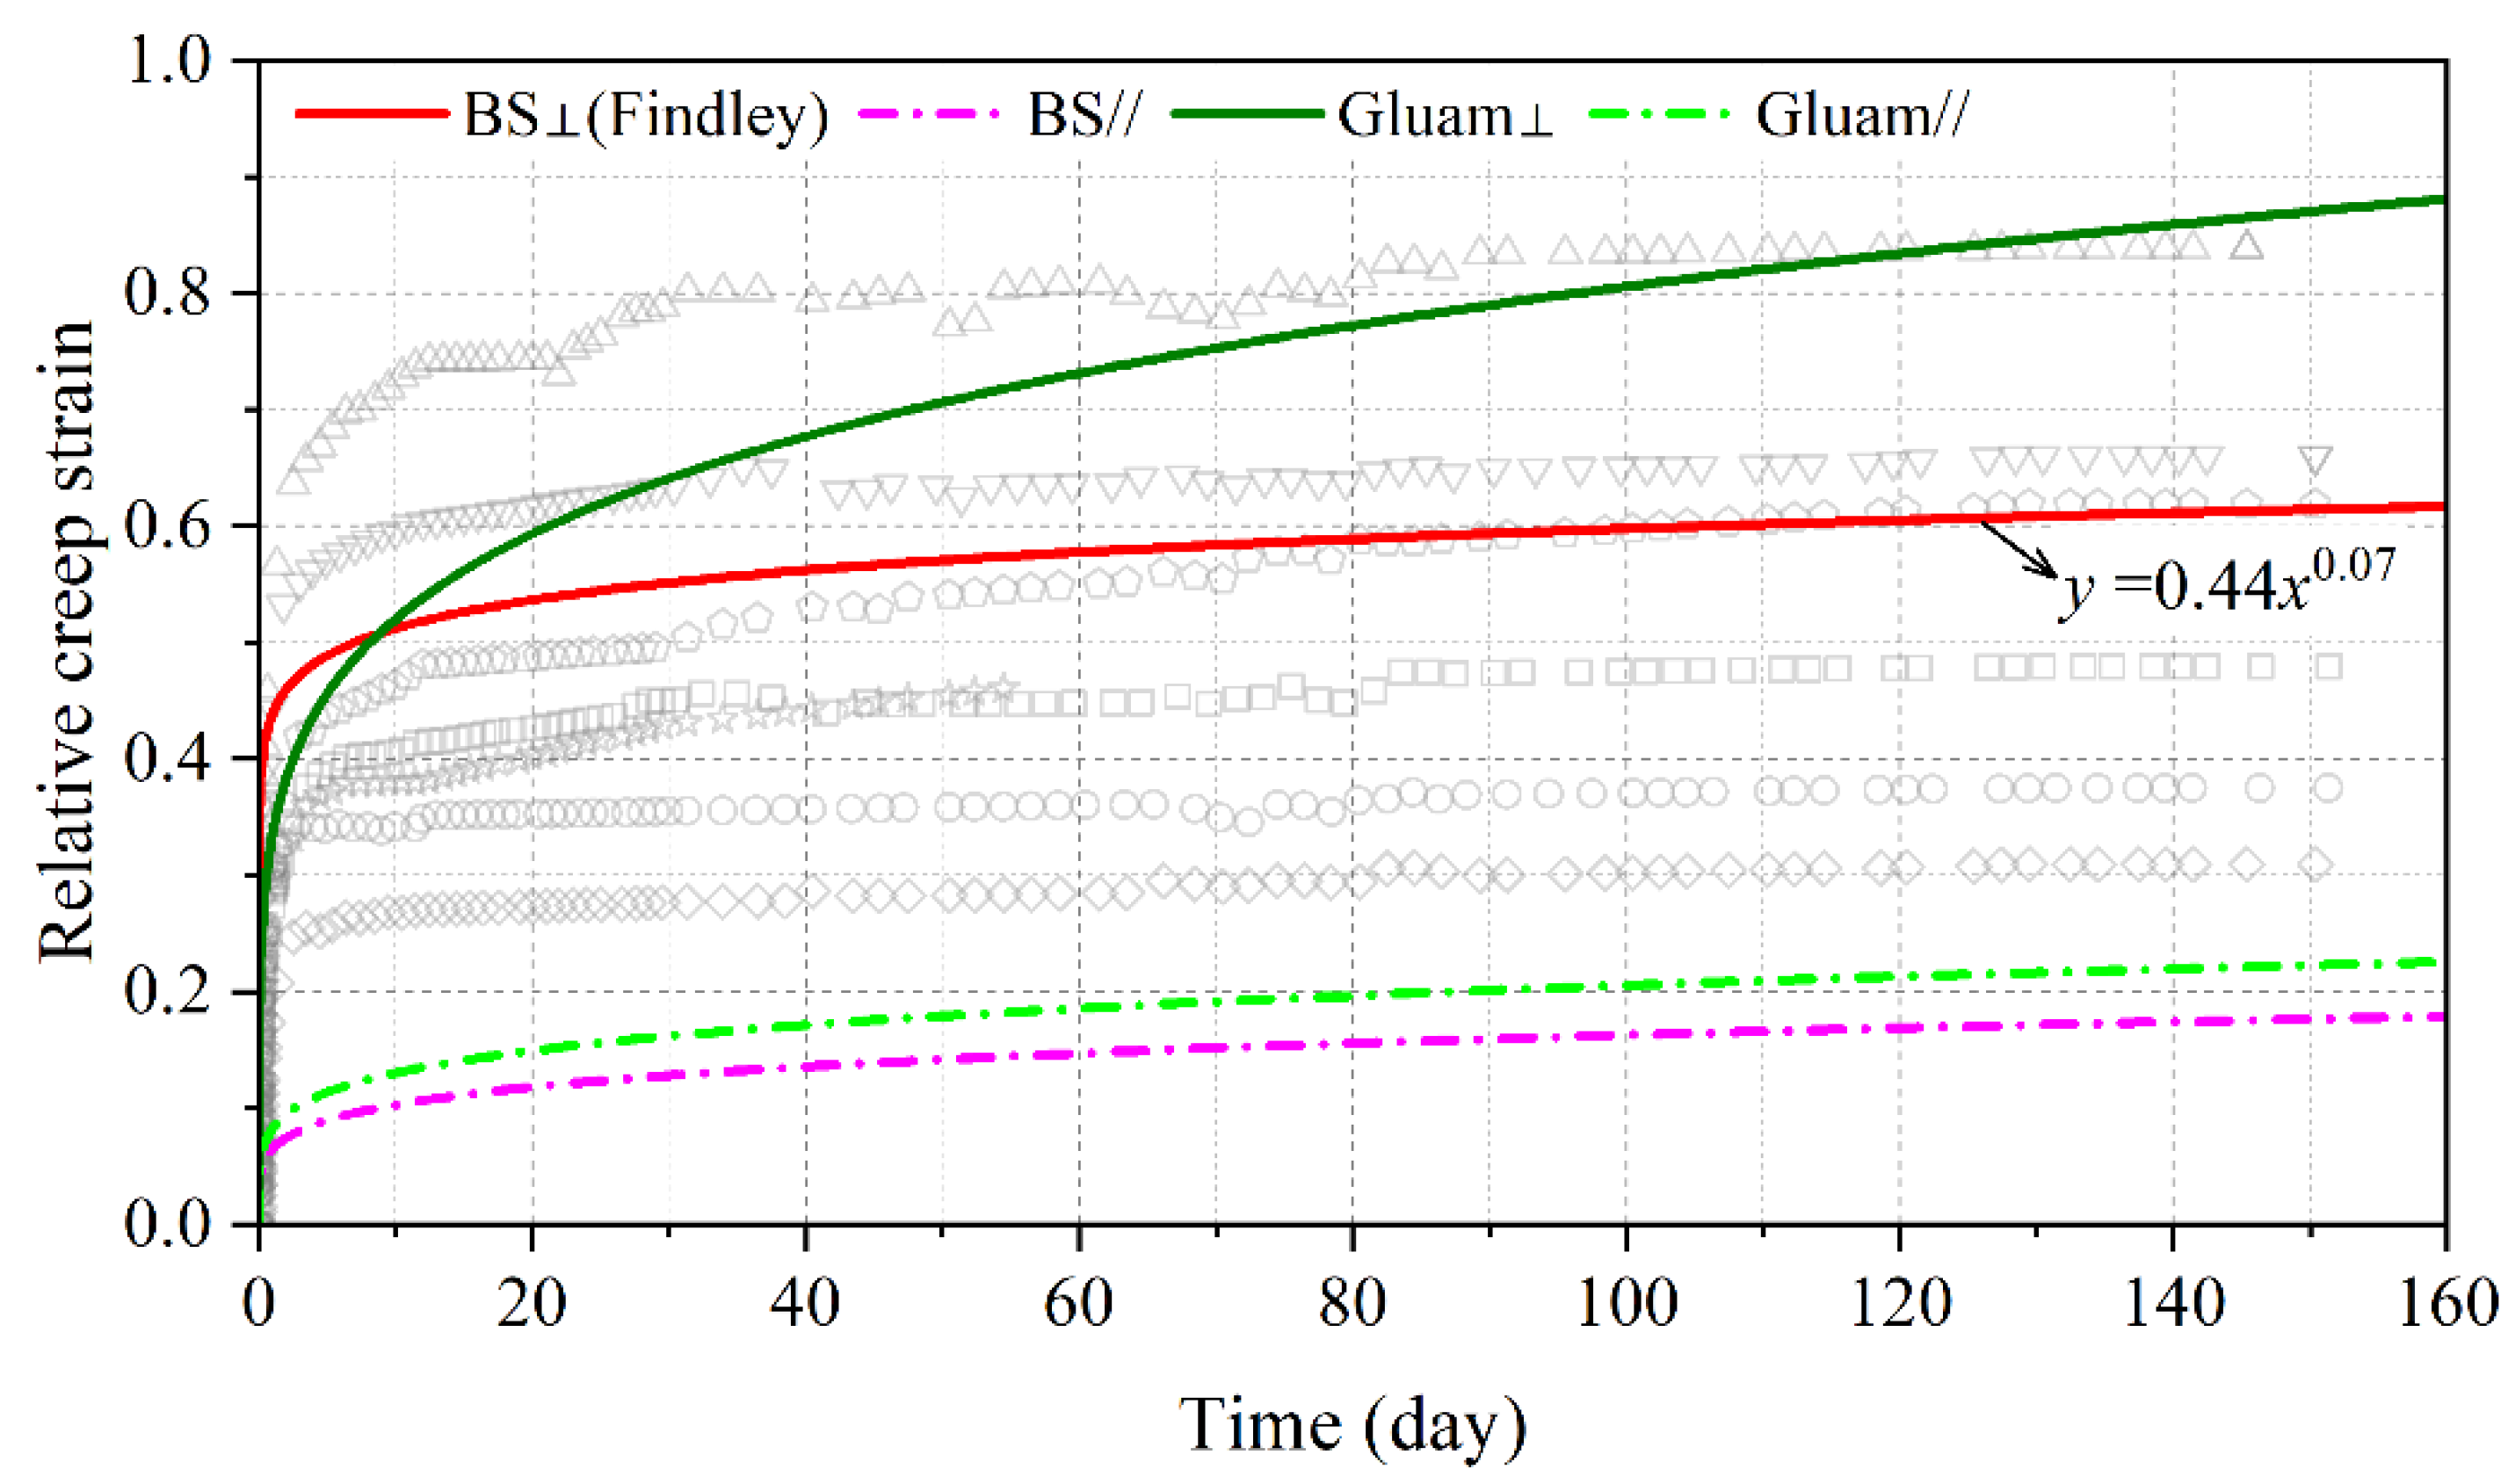
- The DOL effect of BS perpendicular the grain was less severe than in BS parallel to the grain and glulam parallel to the grain, but close to the Madison curve. The resistance to creep in BS perpendicular to the grain was weaker than in BS parallel to the grain. Consequentially, it should be considered which grain direction is appropriate to bear the long-term load in different construction circumstances.
- (2)
- The DOL factor in 50 years predicted by the Foschi and Yao model for BS perpendicular to the grain was 0.549, which is close to 0.550 for glulam parallel to the grain. Furthermore, the creep factor in 50 years for BS perpendicular to the grain was 0.87, about 40% that of glulam perpendicular to the grain. As a result, BS is considered a promising and appropriate substitute for wood composites in green buildings.
- (3)
- The Gerhards model presented a better fitting than the Foschi and Yao or Nielsen models. The modified Burgers model and the Findley model fitted the creep data well. Viscoelastic creep strain played a more significant role in BS perpendicular to the grain than parallel. Viscous strain contributed the most to the long-term creep strain in BS both perpendicular and parallel to the grain.
Author Contributions
Funding
Institutional Review Board Statement
Data Availability Statement
Acknowledgments
Conflicts of Interest
References
- Yu, Y.; Liu, R.; Huang, Y.; Meng, F.; Yu, W. Preparation, physical, mechanical, and interfacial morphological properties of engineered bamboo scrimber. Constr. Build. Mater. 2017, 157, 1032–1039. [Google Scholar] [CrossRef]
- Lapina, A.; Zakieva, N. Bamboo in modern construction and architecture. In IOP Conference Series: Materials Science and Engineering; IOP Publishing: Bristol, UK, 2021; p. 012019. [Google Scholar]
- Chen, G.; Luo, H.; Wu, S.; Guan, J.; Luo, J.; Zhao, T. Flexural deformation and fracture behaviors of bamboo with gradient hierarchical fibrous structure and water content. Compos. Sci. Technol. 2018, 157, 126–133. [Google Scholar] [CrossRef]
- Li, H.; Zhang, H.; Qiu, Z.; Su, J.; Wei, D.; Lorenzo, R.; Yuan, C.; Liu, H.; Zhou, C. Mechanical Properties and Stress Strain Relationship Models for Bamboo Scrimber. J. Renew. Mater. 2020, 8, 13–27. [Google Scholar] [CrossRef]
- Madsen, B. Duration of Load Tests for Wood in Tension Perpendicular to Grain, Structural Research Series; UBC: Vancouver, BC, Canada, 1972. [Google Scholar]
- Aicher, S.; Dill-Langer, G.; Ranta-Maunus, A. Duration of load effect in tension perpendicular to the grain of glulam in different climates. Holz als Roh- und Werkst. 1998, 56, 295–305. [Google Scholar] [CrossRef]
- Wu, Q. Investigation of Duration of Load of Wood; Harbin Institute of Technology: Harbin, China, 2021. [Google Scholar]
- Liu, W.; Hu, X.; Yuan, B.; Xu, F.; Huang, J. Tensile strength model of bamboo srimber by 3-p-b fracture test on the basis of non-LEFM. Compos. Sci. Technol. 2020, 198, 108295. [Google Scholar] [CrossRef]
- Wu, Q.; Niu, S.; Wang, H.; Jin, Y.; Zhu, E. An investigation of the DOL effect of wood in tension perpendicular to grain. Constr. Build. Mater. 2020, 256, 119496. [Google Scholar] [CrossRef]
- Wood, L. Relation of Strength of Wood to Duration of Load; Forest Products Laboratory, U.S. Department of Agriculture: Washington, DC, USA, 1960.
- Foschi, R.; Barrett, J. Load-duration effects in western hemlock lumber. ASCE J. Struct. Div. 1982, 108, 1494–1510. [Google Scholar] [CrossRef]
- Gerhards, C.; Link, C. A cumulative damage model to predict load duration characteristics of lumber. Wood Fiber Sci. 1987, 19, 147–164. [Google Scholar]
- Nielsen, L. Lifetime of wood as related to strength distribution. In Reliability-Based Design of Engineered Wood Structures; Bodig, J., Ed.; Springer: Dordrecht, The Netherlands, 1992; pp. 129–138. [Google Scholar]
- EN-1995-1-1; Design of Timber Structures—Part 1-1: General—Common Rules and Rules for Buildings. European Committee for Standardization: Brussels, Belgium, 2004.
- Wu, Q.; Huo, L.; Zhu, E.; Niu, S.; Wang, H. An Investigation of the Duration of Load of Structural Timber and the Clear Wood. Forests 2021, 12, 1148. [Google Scholar] [CrossRef]
- Luo, X.Y.; Wang, X.Y.; Ren, H.Q.; Zhang, S.B.; Zhong, Y. Long-term mechanical properties of bamboo scrimber. Constr. Build. Mater. 2022, 338, 127659. [Google Scholar] [CrossRef]
- Findley, W.N.; Lai, J.S.; Onaran, K.; Christensen, R.M. Creep and Relaxation of Nonlinear Viscoelastic Materials With an Introduction to Linear Viscoelasticity; Dover Publications: Mineola, NY, USA, 1976. [Google Scholar]
- Pierce, C.B.; Dinwoodie, J.M.; Paxton, B.H. Creep in chipboard. Part 5: An improved model for creep prediction. Wood Sci. Technol. 1985, 19, 83–91. [Google Scholar] [CrossRef]


| Probability Distribution Type | The Maximum Error of Signal Point | The Sum of Squared Error | Mean Value (MPa) | Std (MPa) |
|---|---|---|---|---|
| Test results | -- | -- | 8.50 | 2.13 |
| Normal | 0.0416 | 0.0404 | 8.58 | 2.47 |
| Lognormal | 0.0761 | 0.1236 | 8.77 | 2.45 |
| 2-P Weibull | 0.0366 | 0.0337 | 8.61 | 2.41 |
| DOL Model | Parameters | Mean | Std | R2 |
|---|---|---|---|---|
| Foschi and Yao | u2 | 366.41 | 1.61 × 10⁻³ | 0.961 |
| u3 | 435.71 | 1.70 | ||
| u4 | 3.72 | 1.99 × 10⁻³ | ||
| Gerhards | µ1 | 28.04 | 6.45 × 10⁻¹ | 0.972 |
| µ2 | 31.92 | 8.43 × 10⁻¹ | ||
| Nielsen | γ1 | 10.79 | 7.69 × 10⁻³ | 0.931 |
| γ2 | 0.154 | 6.71 × 10⁻⁵ |
| Service Years | BS⊥ | BS// | Glulam⊥ | Glulam// | Madison Curve | ||
|---|---|---|---|---|---|---|---|
| Foschi and Yao | Gerhards | Nielsen | |||||
| 5 | 0.584 | 0.538 | 0.525 | 0.397 | 0.629 | 0.595 | 0.635 |
| 10 | 0.572 | 0.515 | 0.501 | 0.385 | 0.613 | 0.582 | 0.620 |
| 30 | 0.554 | 0.480 | 0.464 | 0.367 | 0.592 | 0.560 | 0.599 |
| 50 | 0.549 | 0.463 | 0.447 | 0.360 | 0.583 | 0.550 | 0.589 |
Disclaimer/Publisher’s Note: The statements, opinions and data contained in all publications are solely those of the individual author(s) and contributor(s) and not of MDPI and/or the editor(s). MDPI and/or the editor(s) disclaim responsibility for any injury to people or property resulting from any ideas, methods, instructions or products referred to in the content. |
© 2022 by the authors. Licensee MDPI, Basel, Switzerland. This article is an open access article distributed under the terms and conditions of the Creative Commons Attribution (CC BY) license (https://creativecommons.org/licenses/by/4.0/).
Share and Cite
Luo, X.; Luo, X.; Ren, H.; Zhang, S.; Zhong, Y. The Long-Term Mechanical Properties of BS Perpendicular to the Grain. Polymers 2023, 15, 128. https://doi.org/10.3390/polym15010128
Luo X, Luo X, Ren H, Zhang S, Zhong Y. The Long-Term Mechanical Properties of BS Perpendicular to the Grain. Polymers. 2023; 15(1):128. https://doi.org/10.3390/polym15010128
Chicago/Turabian StyleLuo, Xiangya, Xiangqian Luo, Haiqing Ren, Shuangbao Zhang, and Yong Zhong. 2023. "The Long-Term Mechanical Properties of BS Perpendicular to the Grain" Polymers 15, no. 1: 128. https://doi.org/10.3390/polym15010128