
A New Kinetic Modeling Approach for Predicting the Lifetime of ATH-Filled Silane Cross-Linked Polyethylene in a Nuclear Environment


Abstract
:
1. Introduction
2. Materials and Methods
2.1. Materials
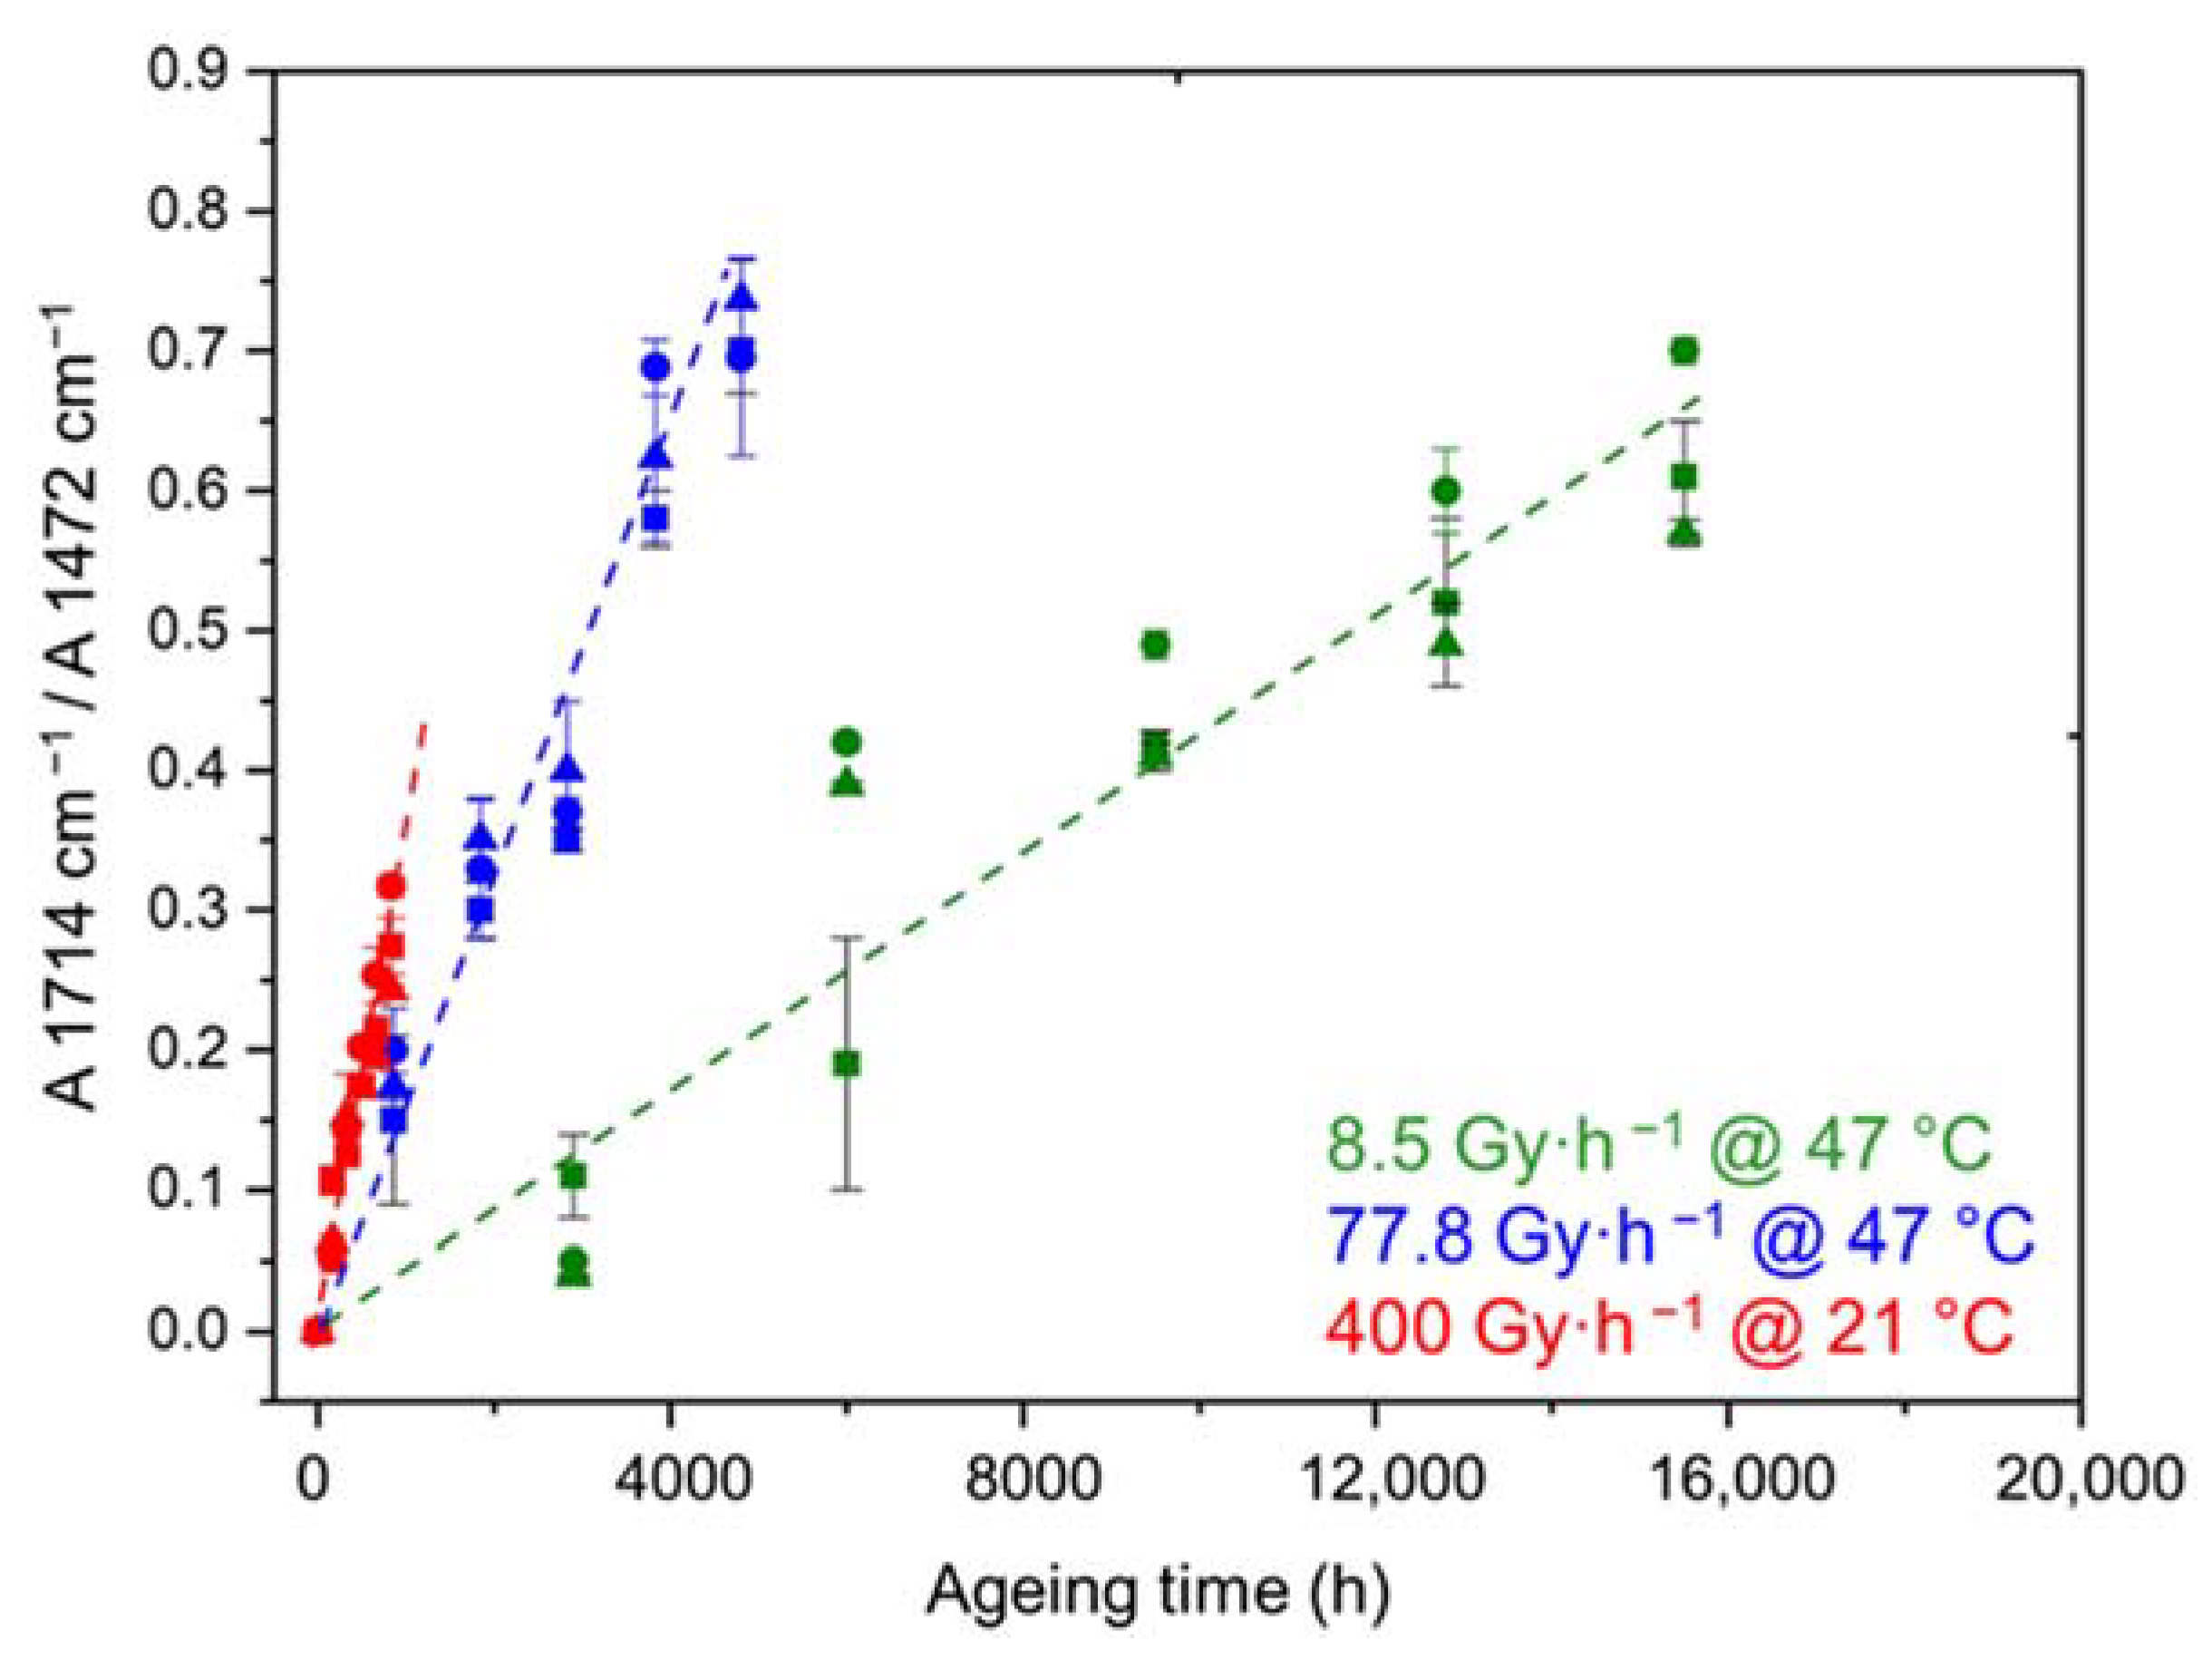
2.2. Radio-Thermal Ageing Conditions
2.3. Experimental Characterizations
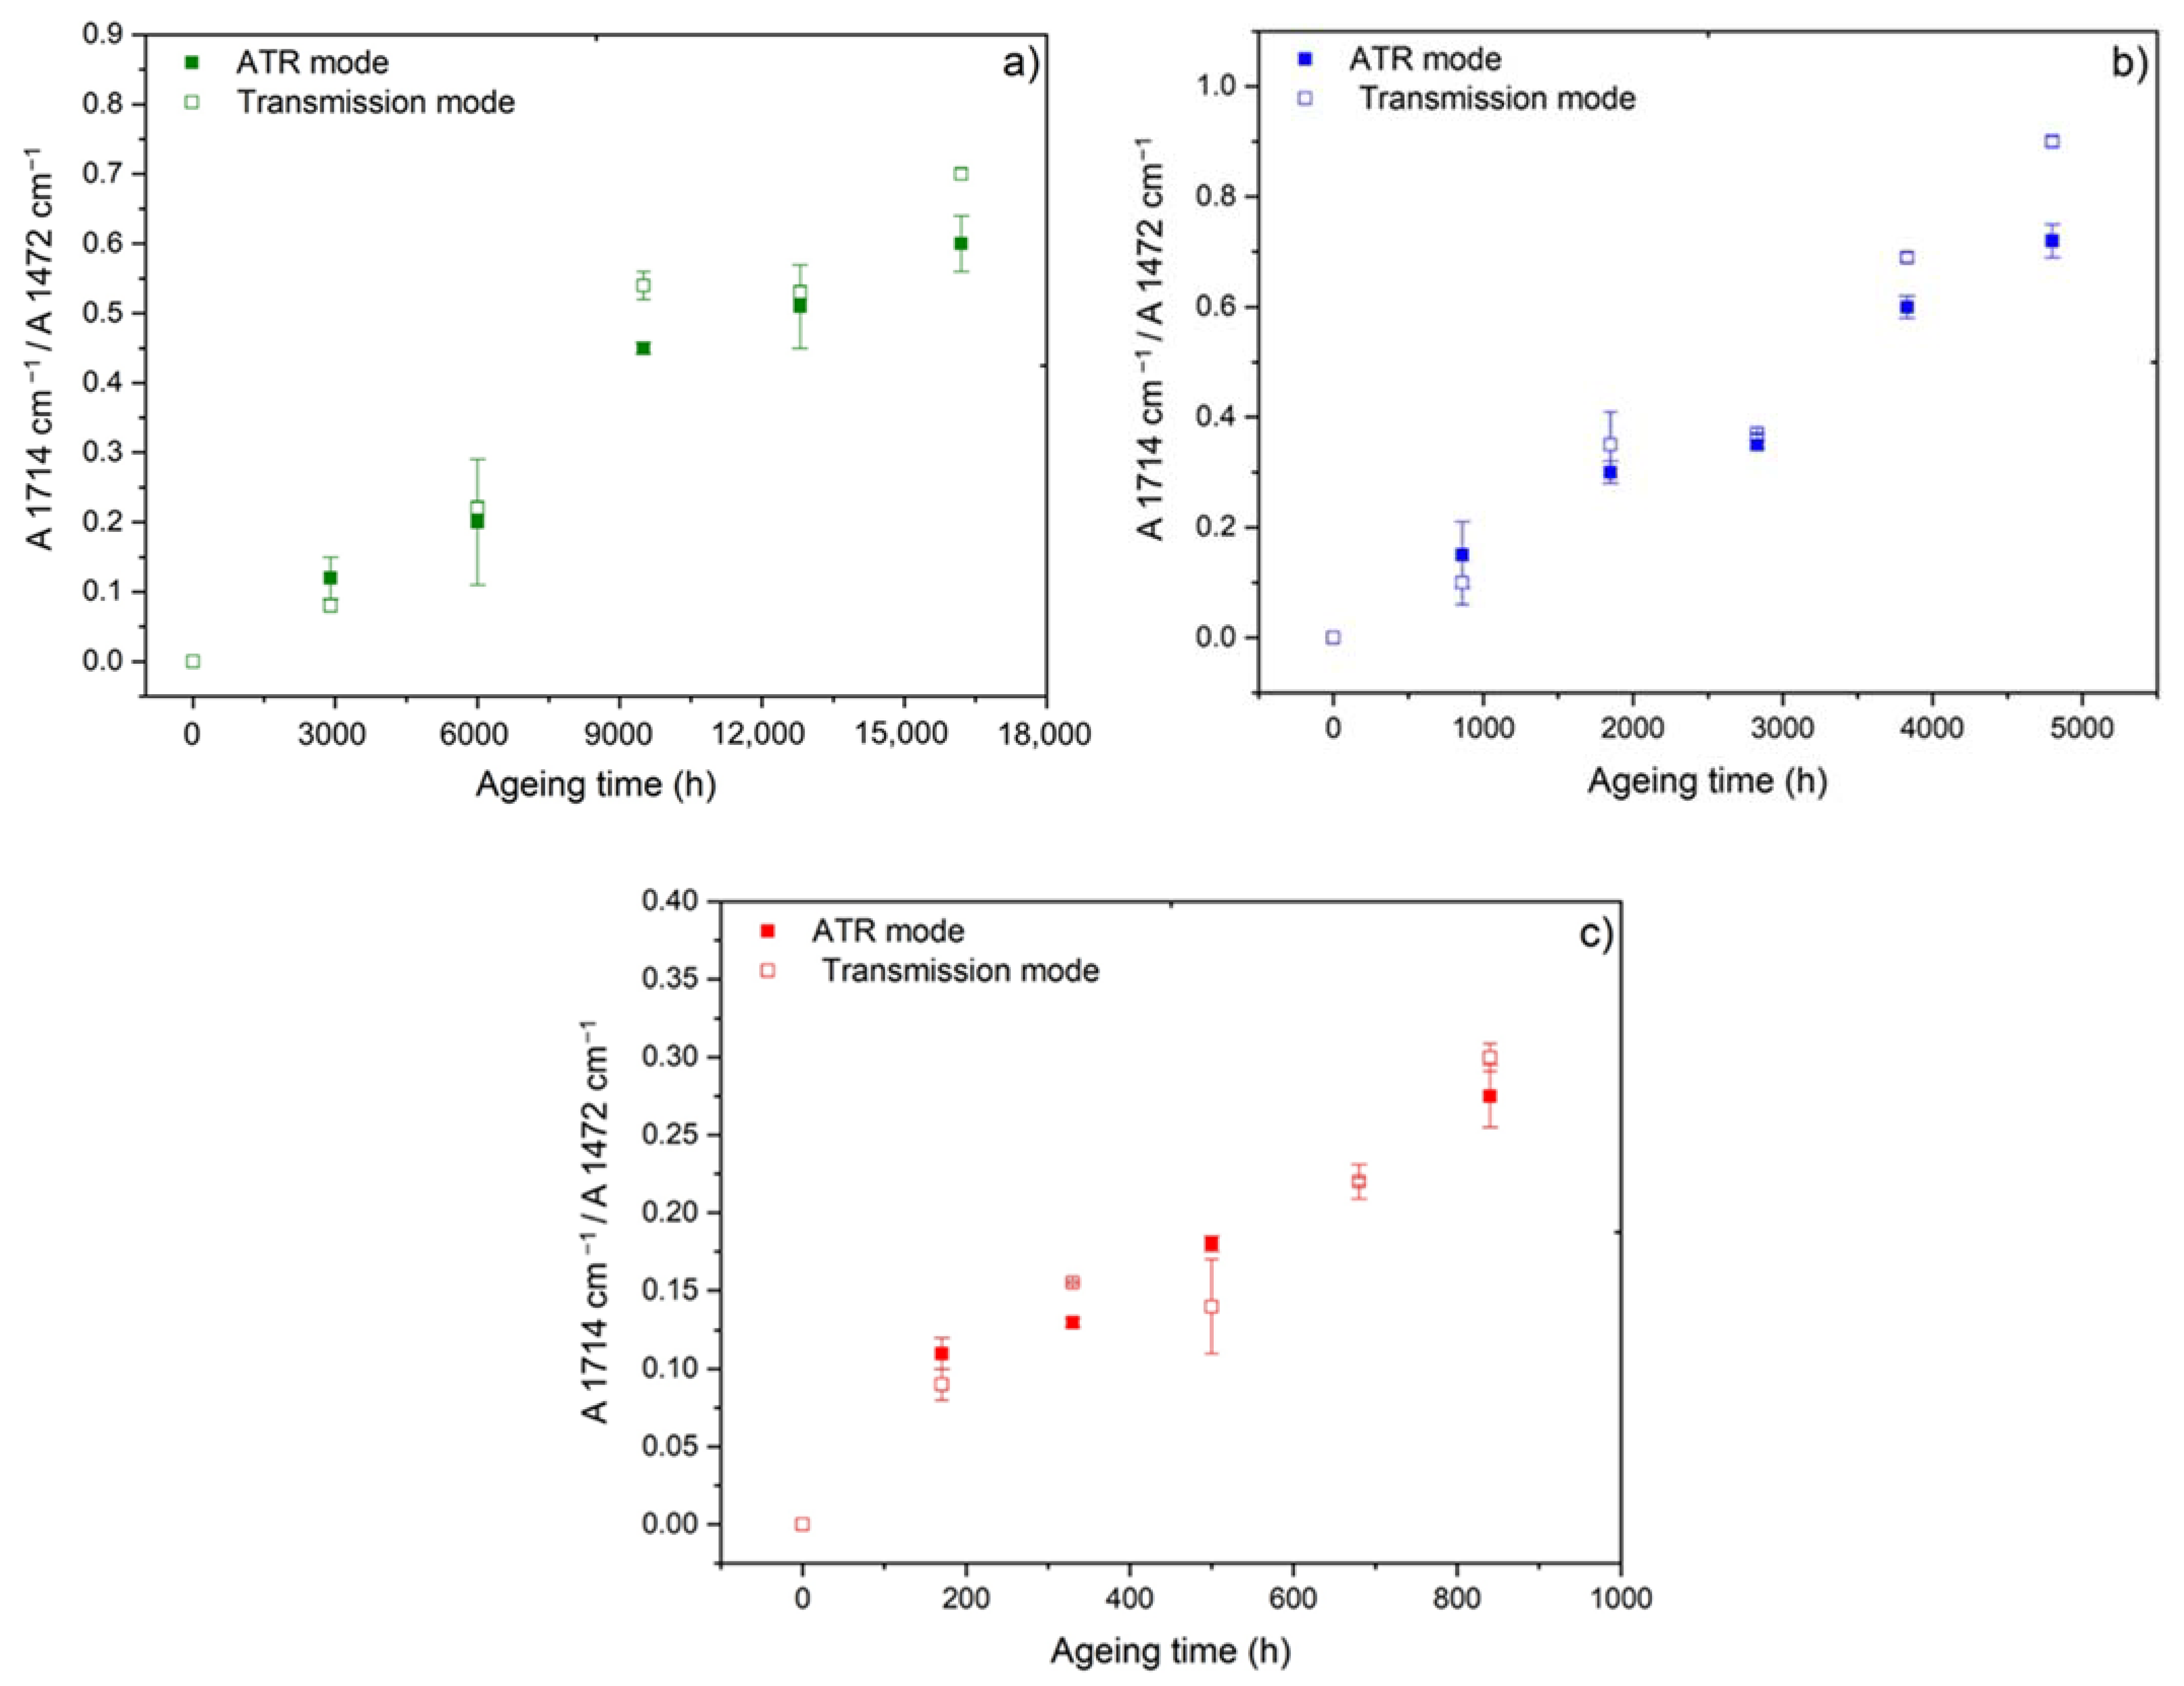
2.3.1. FTIR Spectroscopy
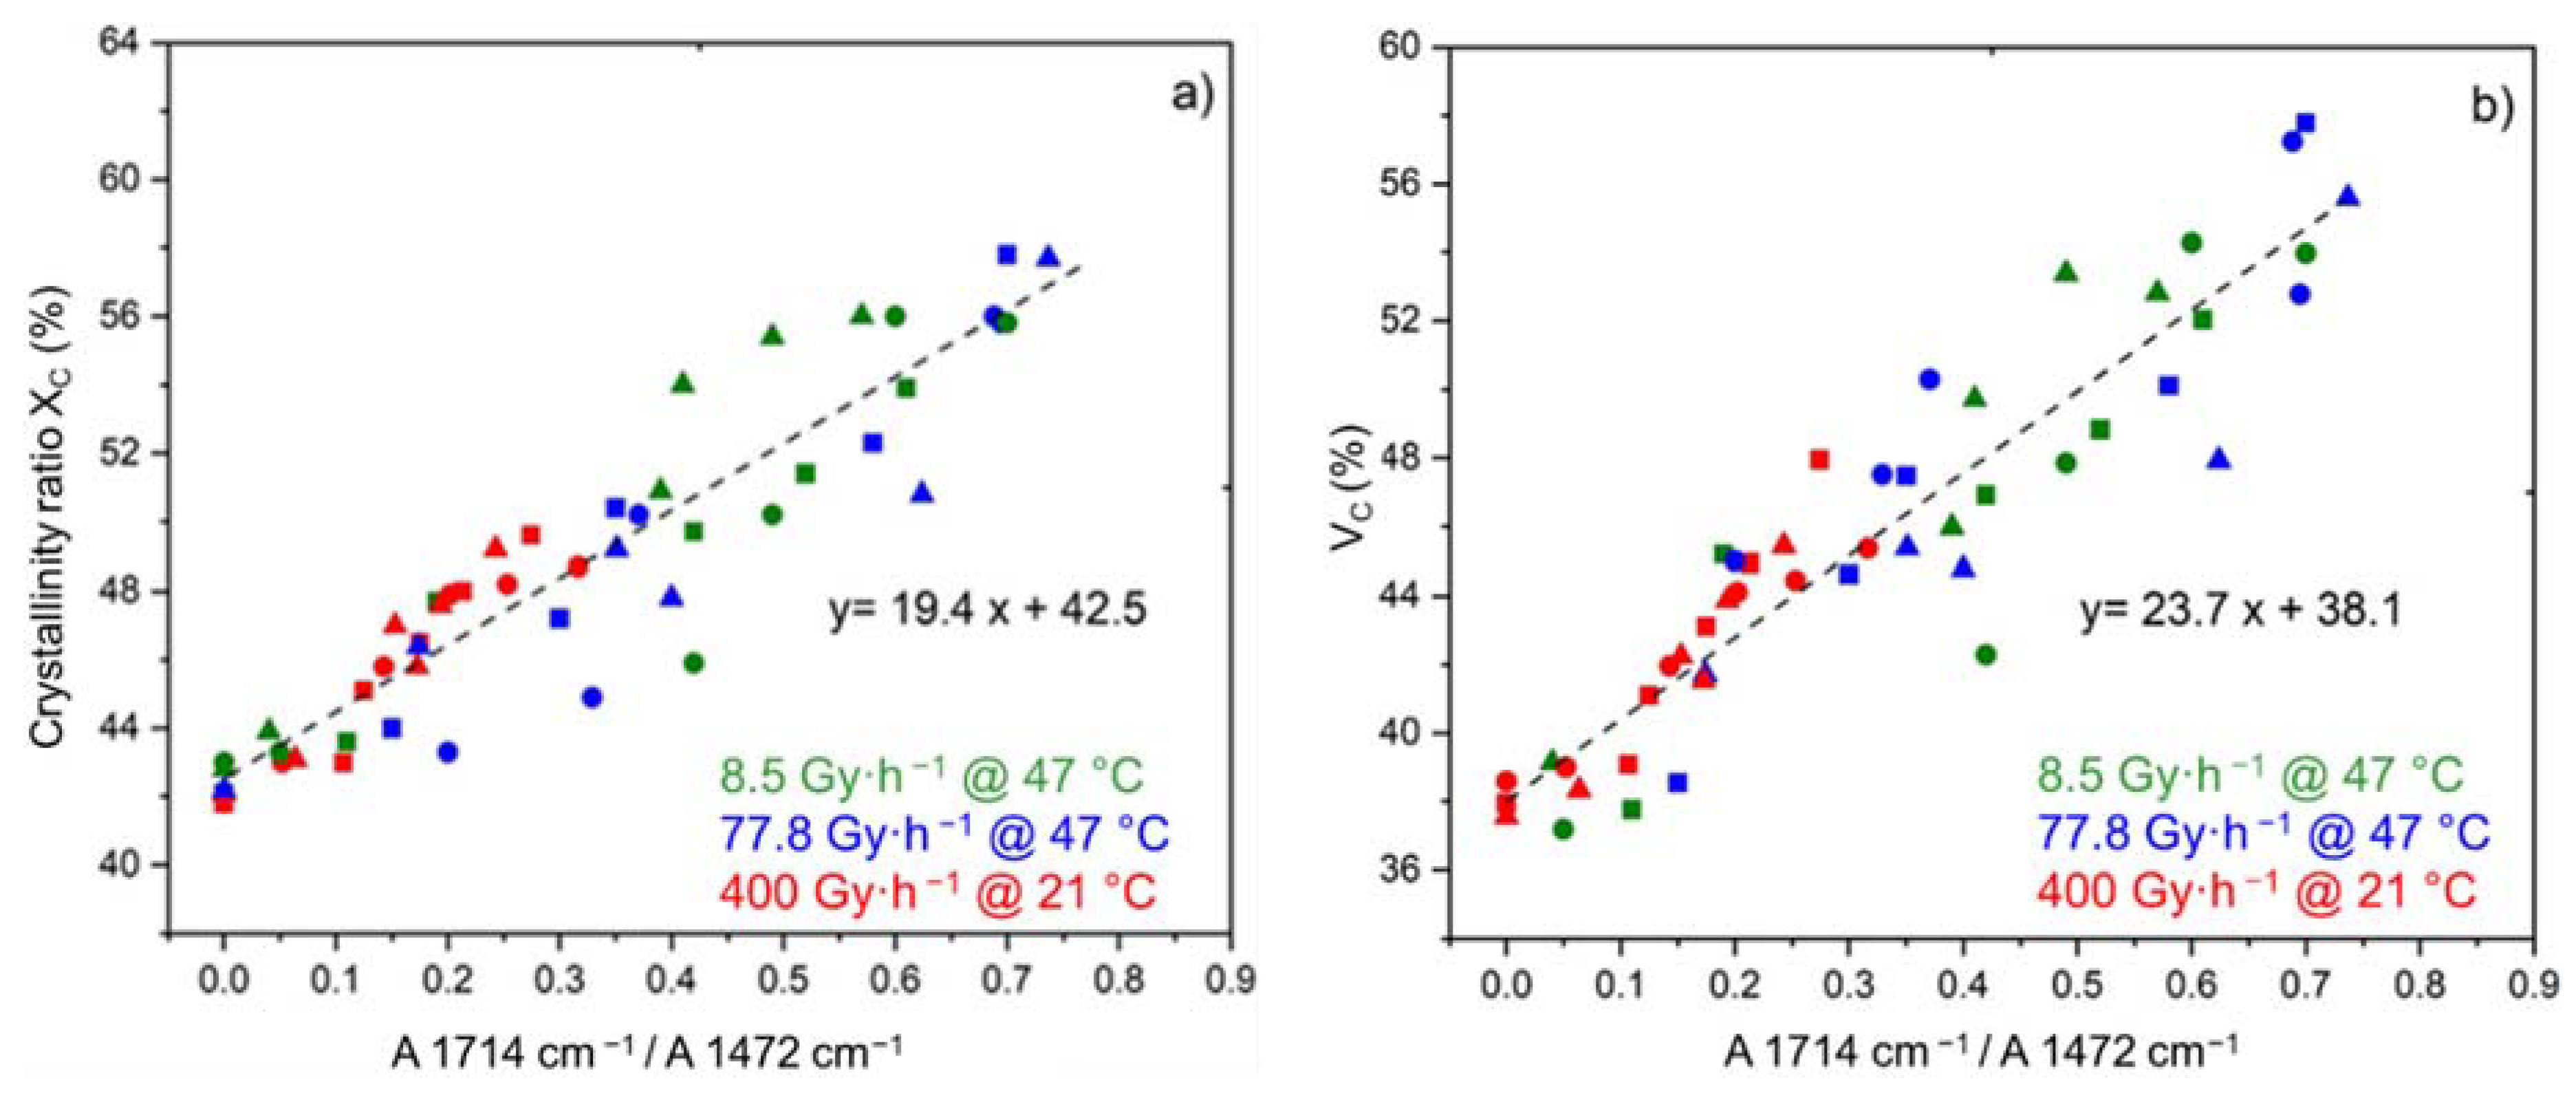
2.3.2. Differential Scanning Calorimetry
2.3.3. Density Measurements
2.3.4. Swelling Measurements
2.3.5. Micro-Indentation
2.3.6. Uniaxial Tensile Testing
3. Results and Discussion
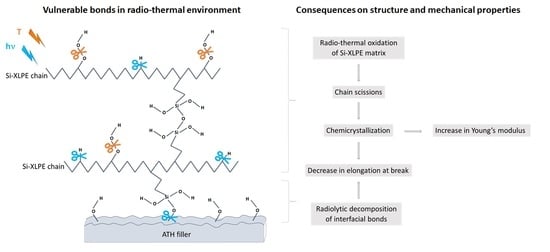
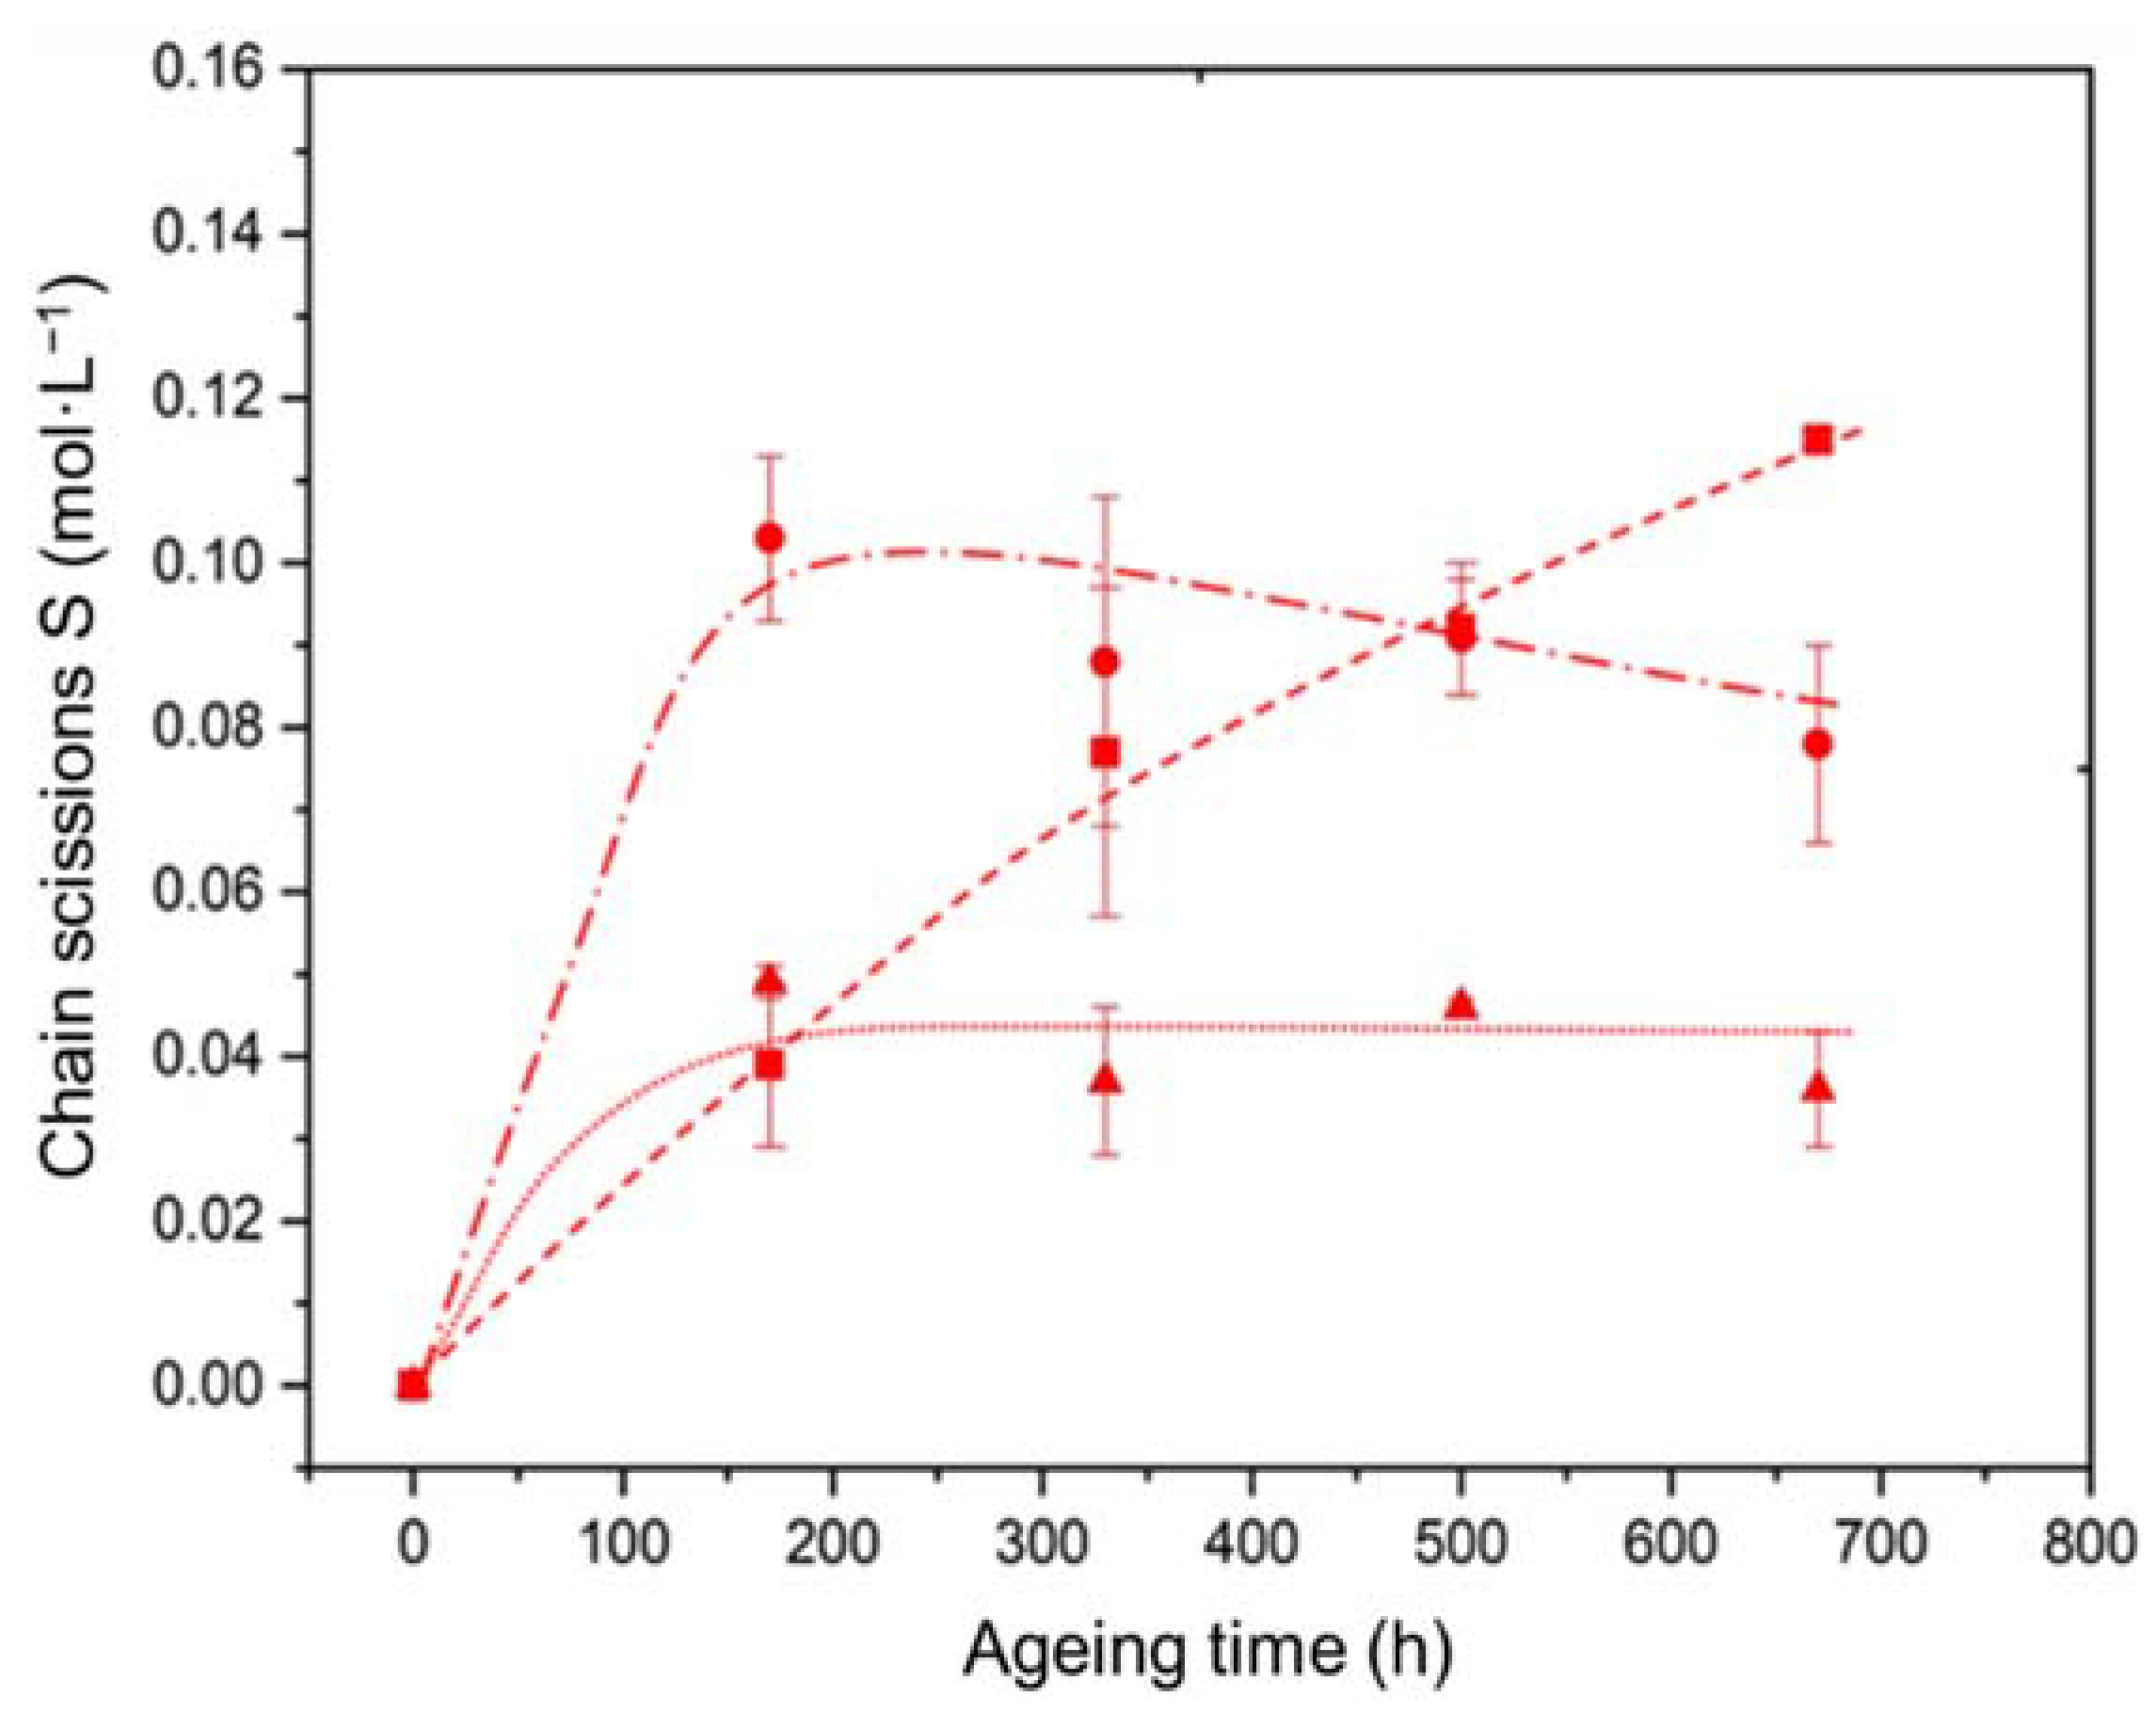
3.1. Characterization of the Degradation of the Si-XLPE Matrix
3.2. Characterization of the Degradation in the Interfacial Region
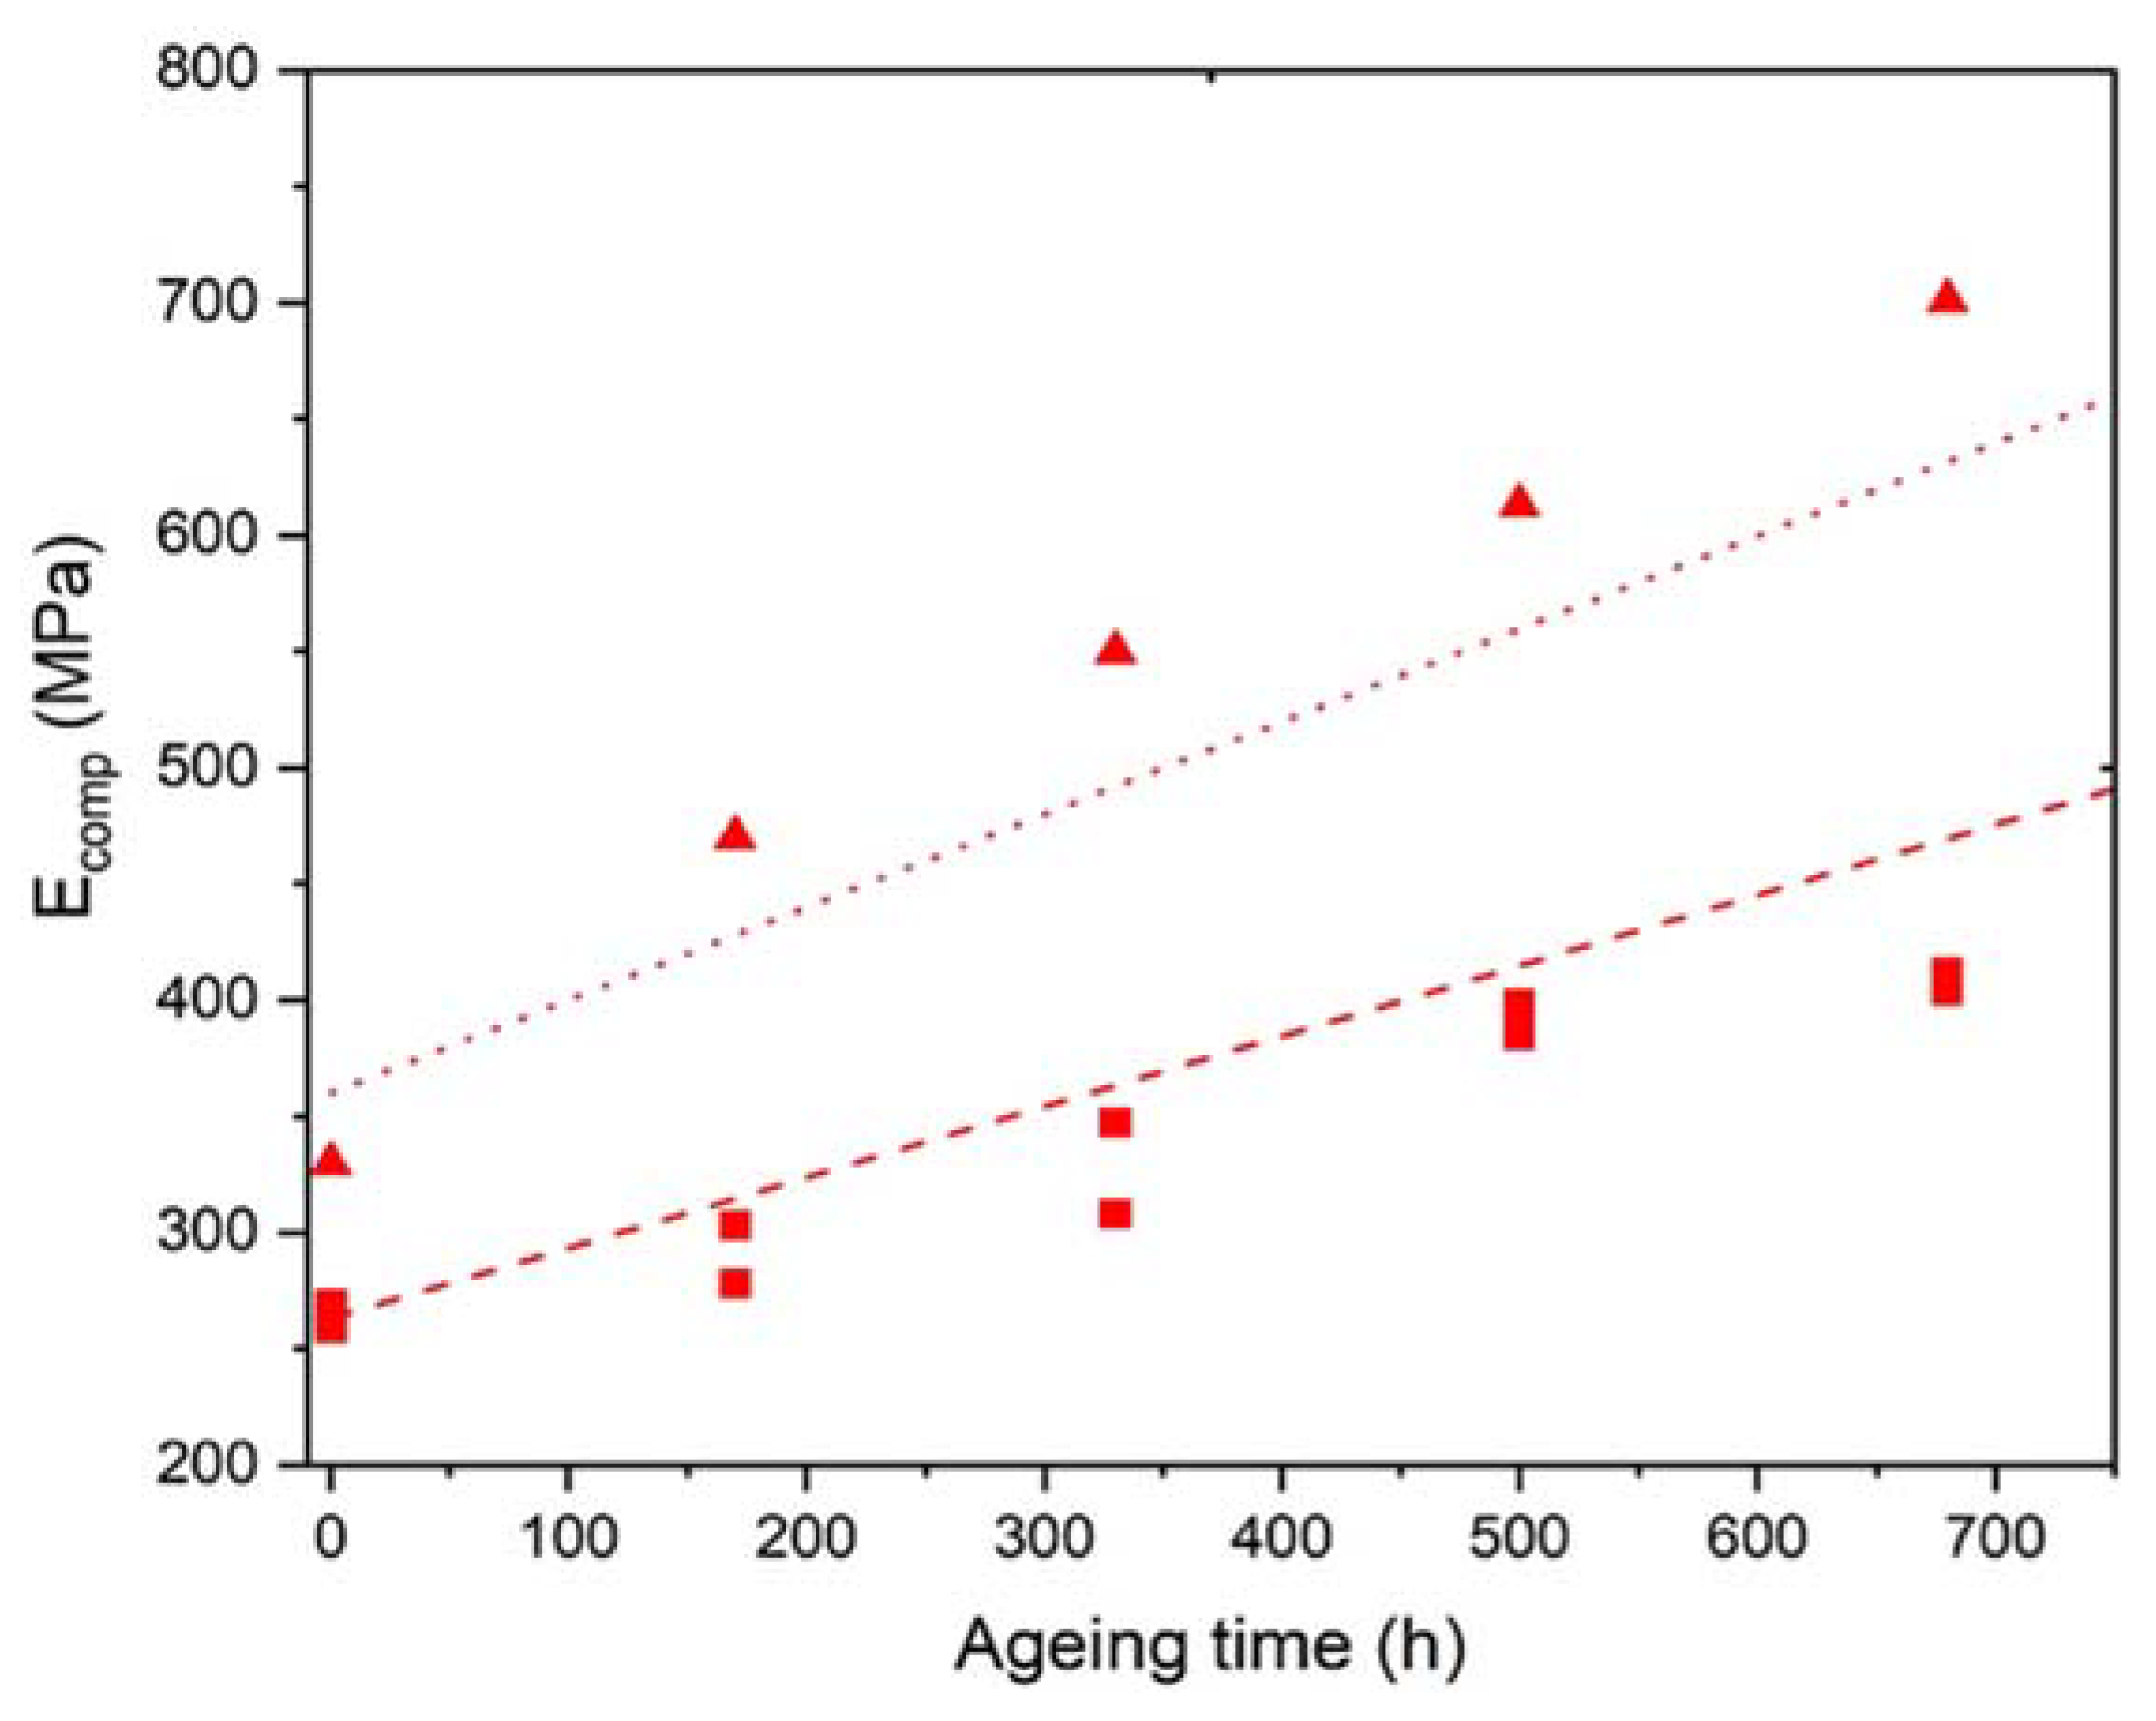
3.3. Consequences for Mechanical Properties
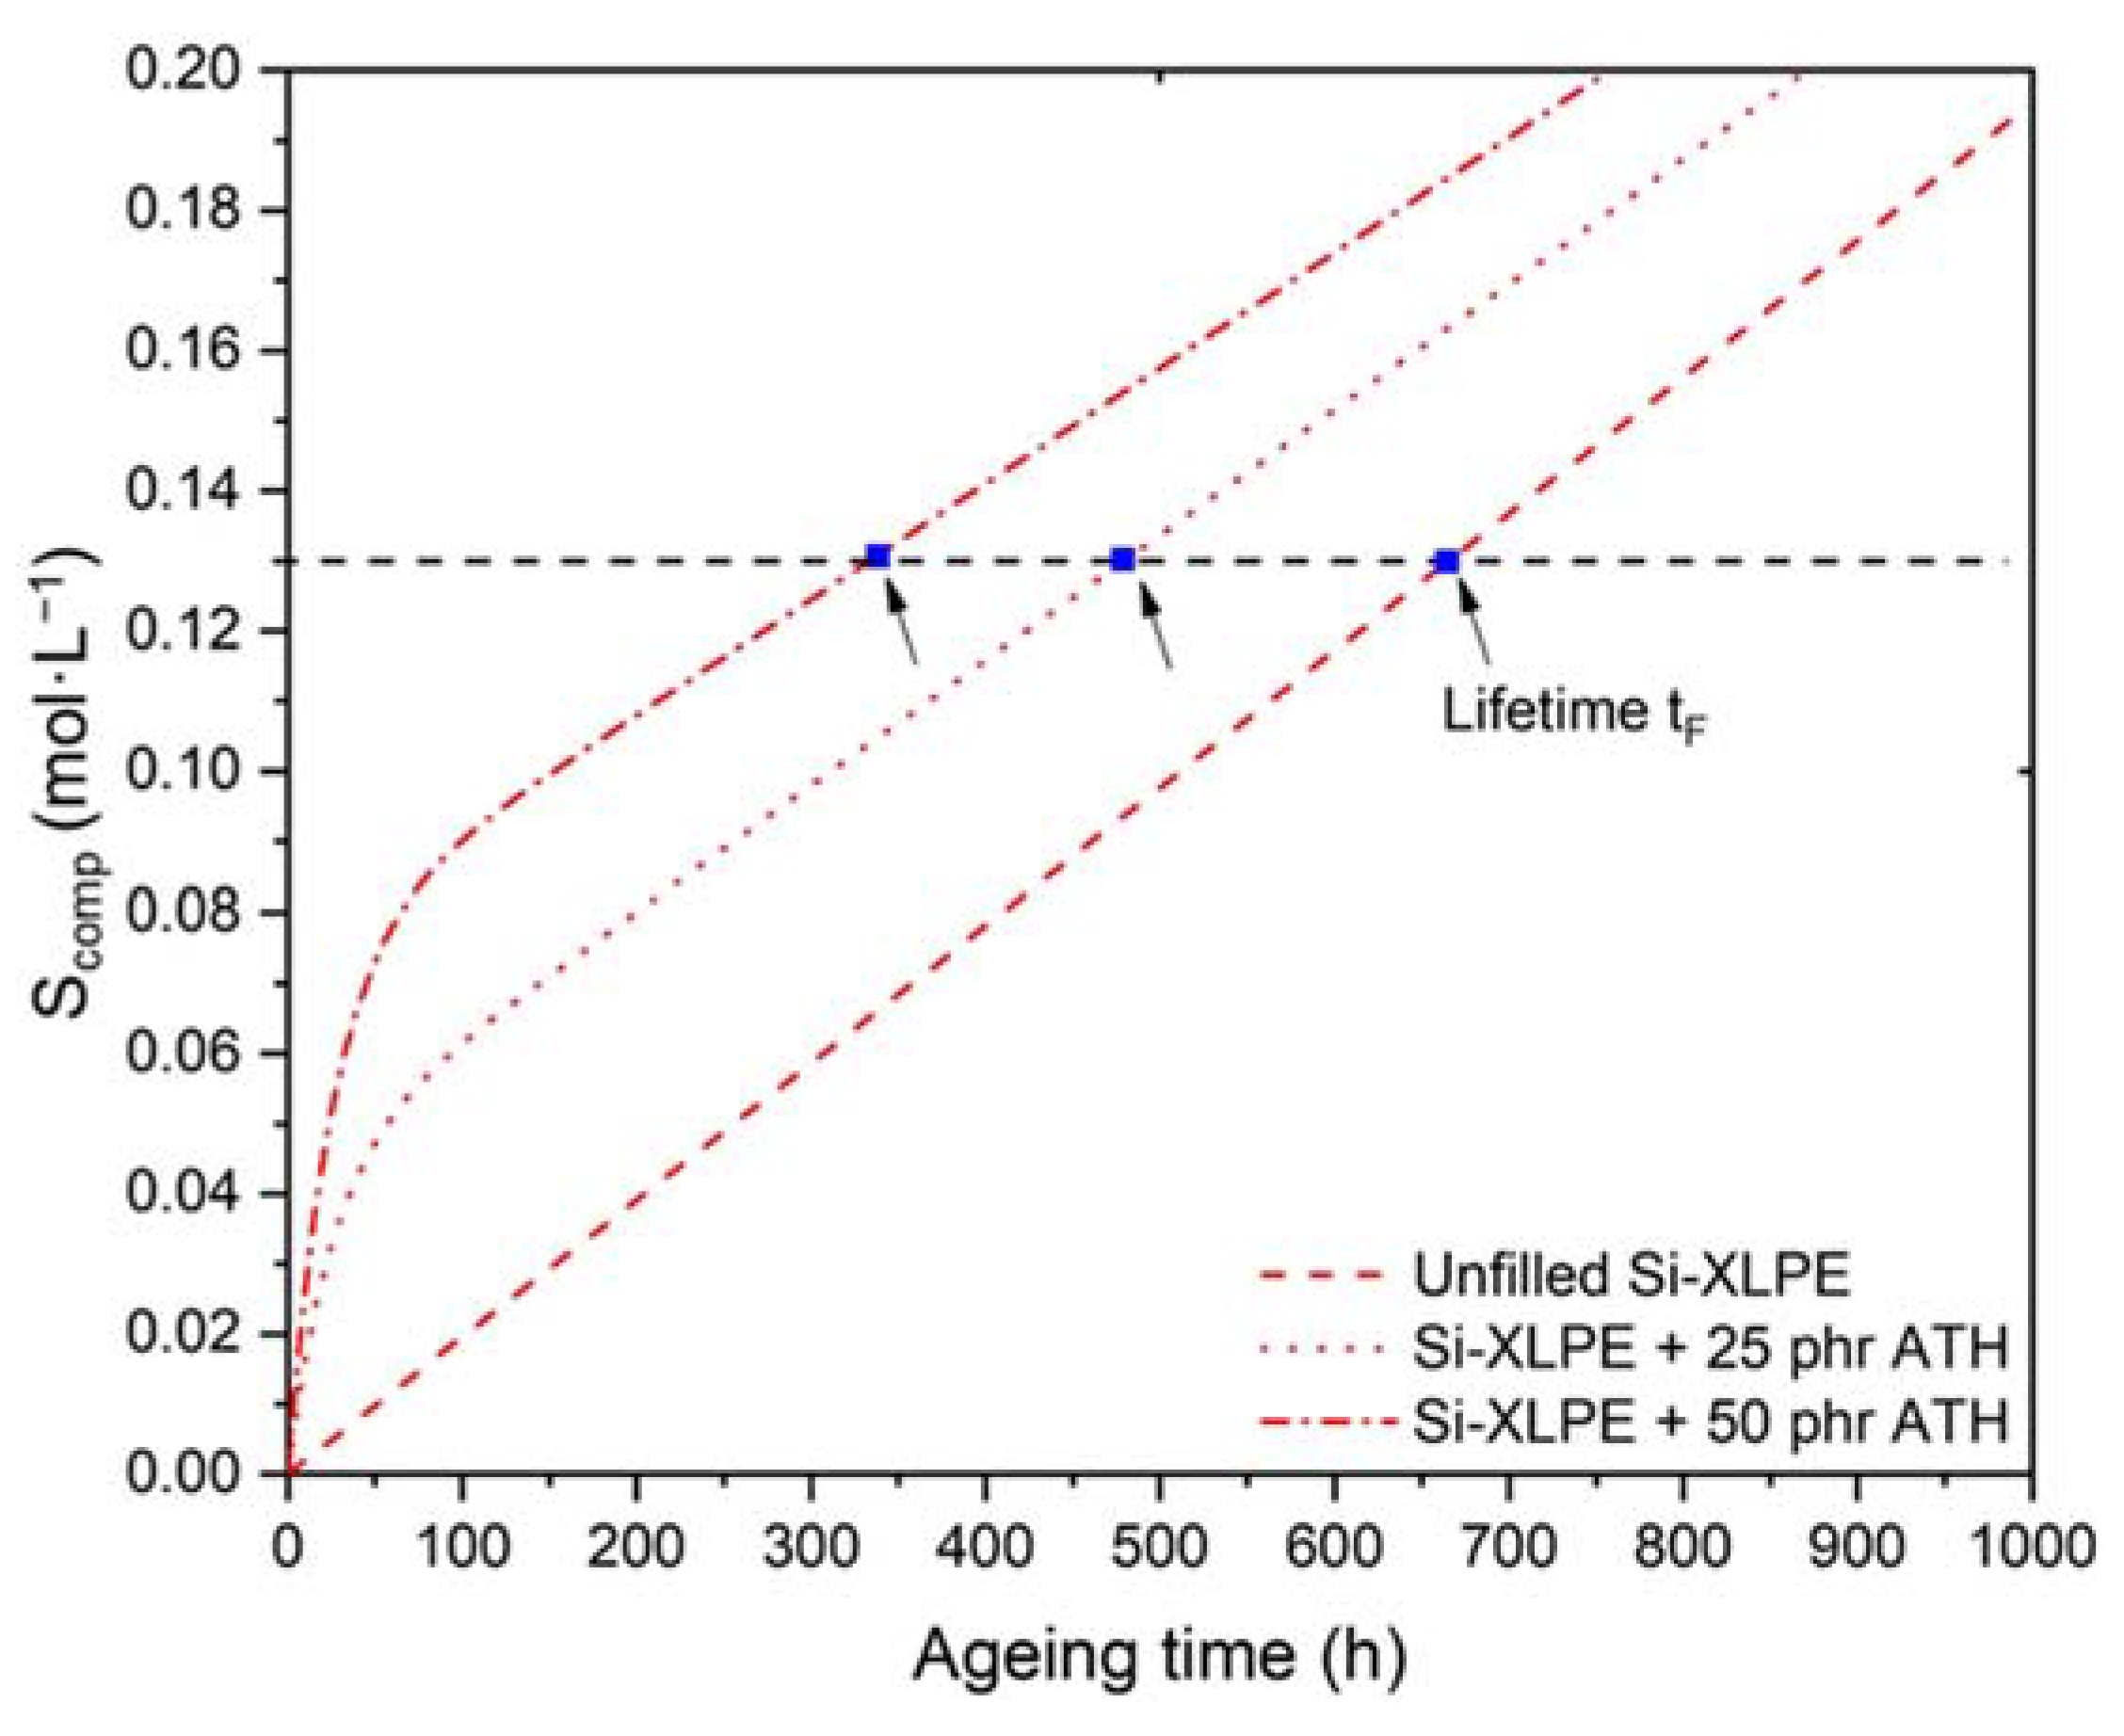
3.4. Extension of the Kinetic Model to Composite Materials
4. Conclusions
Author Contributions
Funding
Institutional Review Board Statement
Informed Consent Statement
Data Availability Statement
Conflicts of Interest
Appendix A. Quick Summary of the Kinetic Modeling of the Radio-Thermal Ageing of the Unfilled Si-XLPE Matrix
Appendix A.1. Mechanistic Scheme
- (1R)
- PH + hν → P• + ½H2 ()
- (1T)
- 2POOH → P• + PO2• ()
- (2)
- P• + O2 → PO2• ()
- (3)
- PO2• + PH → POOH + P• ()
- (4)
- P• + P• → Inactive products ()
- (5)
- P• + PO2• → Inactive products ()
- (6)
- PO2• + PO2• → Inactive products + O2 ()
Appendix A.2. Kinetic Model
Appendix A.3. Parameters

| T (°C) | 21 | 47 | 47 |
|---|---|---|---|
| I(Gy·h−1) | 400 | 77.8 | 8.5 |
| 8 | 8 | 8 | |
| (L·mol−1·s−1) | 5.0 × 10⁻⁹ | 2.5 × 10⁻⁷ | 2.4 × 10⁻⁷ |
| (L·mol−1·s−1) | 108 | 108 | 108 |
| (L·mol−1·s−1) | 1.6 × 10⁻³ | 1.9 × 10⁻² | 1.9 × 10⁻² |
| (L·mol−1·s−1) | 8.0 × 10¹¹ | 8.0 × 10¹¹ | 8.0 × 10¹¹ |
| (L·mol−1·s−1) | 1.2 × 10¹⁰ | 7.0 × 10¹⁰ | 9.0 × 10¹⁰ |
| (L·mol−1·s−1) | 5.0 × 10⁴ | 1.0 × 10⁶ | 2.0 × 10⁶ |
| (%) | 90 | 70 | 75 |
| (%) | 90 | 70 | 75 |
| (%) | 90 | 52 | 52 |
| (%) | 90 | 52 | 52 |
References
- Peacock, A.J. Handbook of Polyethylene. Structures, Properties and Applications; Marcel Decker Inc.: New York, NY, USA, 2000. [Google Scholar]
- Van Krevelen, D.W.; Te Nijenhuis, K. Electrical Properties. In Properties of Polymers: Their Correlation with Chemical Structure—Their Numerical Estimation and Prediction from Additive Group Contributions, 4th ed.; Elsevier: Amsterdam, The Netherlands, 2009; Chapter 11; pp. 319–354. [Google Scholar]
- Cotts, D.B.; Reyes, Z. Electrically Conductive Organic Polymers for Advanced Applications; William Andrew Publishing, Noyes Data Corporation: Park Ridge, NJ, USA, 1986. [Google Scholar]
- Plesa, I.; Notingher, P.V.; Stancu, C.; Wiesbrock, F.; Schlögl, S. Polyethylene nanocomposites for power cable insulations. Polymers 2019, 11, 24. [Google Scholar] [CrossRef] [Green Version]
- Rothon, R.N. Particulate-Filled Polymer Composites, 2nd ed.; Rapra Technology Limited: Shawbury, UK, 2003. [Google Scholar]
- Kramer, E.; Koppelmann, J. Studies of the autoxidation of polybutylene and crosslinked polyethylene by isothermal long-term DTA. Polym. Degrad. Stab. 1986, 14, 333–339. [Google Scholar] [CrossRef]
- Langlois, V.; Meyer, M.; Audouin, L.; Verdu, J. Physical aspects of the thermal oxidation of crosslinked polyethylene. Polym. Degrad. Stab. 1992, 36, 207–2016. [Google Scholar] [CrossRef]
- Celina, M.; George, G.A. Characterisation and degradation studies of peroxide and silane crosslinked polyethylene. Polym. Degrad. Stab. 1995, 48, 297–312. [Google Scholar] [CrossRef]
- Rapp, G.; Tireau, J.; Bussière, P.-O.; Chenal, J.-M.; Rousset, F.; Cazeau, L.; Gardette, J.-L.; Thérias, S. Influence of the physical state of a polymer blend on thermal ageing. Polym. Degrad. Stab. 2019, 163, 161–173. [Google Scholar] [CrossRef]
- Blivet, C.; Larché, J.-F.; Israeli, Y.; Bussière, P.-O.; Gardette, J.-L. Thermal oxidation of cross-linked PE and EPR used as insulation materials: Multi-scale correlation over a wide range of temperatures. Polym. Test. 2021, 93, 106913. [Google Scholar] [CrossRef]
- Hettal, S.; Roland, S.; Sipila, K.; Joki, H.; Colin, X. A new analytical model for predicting the radio-thermal oxidation and the lifetime of electrical cable insulation in nuclear power plants. Application to silane crosslinked polyethylene. Polym. Degrad. Stab. 2021, 185, 109492. [Google Scholar] [CrossRef]
- Langlois, V.; Audouin, L.; Verdu, J.; Courtois, P. Thermo-oxidative aging of crosslinked linear polyethylene: Stabilizer consumption and lifetime prediction. Polym. Degrad. Stab. 1993, 40, 399–409. [Google Scholar] [CrossRef]
- Liu, S.; Veysey, S.W.; Fifield, L.S.; Bowler, N. Quantitative analysis of changes in antioxidant in crosslinked polyethylene (XLPE) cable insulation material exposed to heat and gamma radiation. Polym. Degrad. Stab. 2018, 156, 252–258. [Google Scholar] [CrossRef] [Green Version]
- Salivon, T.; Colin, X.; Comte, R. Degradation of XLPE and PVC cable insulators. In Proceedings of the IEEE Conference on Electrical Insulation and Dielectric Phenomena, Ann Arbor, MI, USA, 18–21 October 2015; pp. 656–659. [Google Scholar]
- Xu, A.; Roland, S.; Colin, X. Physico-chemical characterization of the blooming of Irganox 1076® antioxidant onto the surface of a silane-crosslinked polyethylene. Polym. Degrad. Stab. 2020, 171, 109046. [Google Scholar] [CrossRef]
- Xu, A.; Roland, S.; Colin, X. Thermal ageing of a silane-crosslinked polyethylene stabilised with a thiodipropionate antioxidant. Polym. Degrad. Stab. 2020, 181, 109276. [Google Scholar] [CrossRef]
- Xu, A.; Roland, S.; Colin, X. Physico-chemical analysis of a silane-grafted polyethylene stabilised with an excess of Irganox 1076®: Proposal of a microstructural model. Polym. Degrad. Stab. 2021, 183, 109453. [Google Scholar] [CrossRef]
- Xu, A.; Roland, S.; Colin, X. Thermal ageing of a silane-crosslinked polyethylene stabilised with an excess of Irganox 1076®. Polym. Degrad. Stab. 2021, 189, 109597. [Google Scholar] [CrossRef]
- Khelidj, N.; Colin, X.; Audouin, L.; Verdu, J. A simplified approach for the lifetime prediction of PE in nuclear environments. Nucl. Instrum. Methods Phys. Res. 2005, 236, 88–94. [Google Scholar] [CrossRef]
- Colin, X.; Monchy-Leroy, C.; Audouin, L.; Verdu, J. Lifetime prediction of polyethylene in nuclear plants. Nucl. Instrum. Methods Phys. Res. 2007, 265, 251–255. [Google Scholar] [CrossRef]
- Planes, E.; Chazeau, L.; Vigier, G.; Fournier, J.; Stevenson-Royaud, I. Influence of fillers on mechanical properties of ATH filled EPDM during ageing by gamma irradiation. Polym. Degrad. Stab. 2010, 95, 1029–1038. [Google Scholar] [CrossRef] [Green Version]
- Sidi, A.; Colombani, J.; Larché, J.-F.; Rivaton, A. Multiscale analysis of the radiooxidative degradation of EVA/EPDM composites. ATH filler and dose rate effect. Radiat. Phys. Chem. 2018, 142, 14–22. [Google Scholar] [CrossRef]
- Colombani, J.; Sidi, A.; Larché, J.-F.; Tavio-Gueho, C.; Rivaton, A. Thermooxidative degradation of crosslinked EVA/EPDM copolymers: Impact of Aluminium TriHydrate (ATH) filler incorporation. Polym. Degrad. Stab. 2018, 153, 130–144. [Google Scholar] [CrossRef]
- Gabrielle, B.; Lorthioir, C.; Lauprêtre, F. Thermal aging of interfacial polymer chains in ethylene-propylene-diene terpolymer/aluminum hydroxide composites: Solid-state NMR study. J. Phys. Chem. B 2011, 115, 12392–12400. [Google Scholar] [CrossRef]
- Planes, E.; Chazeau, L.; Vigier, G.; Stuhldreier, T. Influence of silica fillers on the ageing by gamma radiation of EDPM nanocomposites. Compos. Sci. Technol. 2010, 70, 1530–1536. [Google Scholar] [CrossRef] [Green Version]
- Guzzo, M.; De Paoli, M.-A. The photo-oxidation of EPDM rubber: Part V—Mechanical properties degradation of vulcanized filled samples. Polym. Degrad. Stab. 1992, 38, 41–45. [Google Scholar] [CrossRef]
- Zak, P.; Placek, V. Deliverable D2.2: Specifications of Tests—Accelerated Ageing Protocol, Test Strategy; TeaM Cables Report; UJV Rez: Husinec, Czech Republic, 2018. [Google Scholar]
- Lacoste, J.; Carlsson, D.J. Gamma-, photo-, and thermally-initiated oxidation of linear low density polyethylene: A quantitative comparison of oxidation products. J. Polym. Sci. Part Polym. Chem. 1992, 30, 493–500. [Google Scholar] [CrossRef]
- Da Cruz, M.; Van Schoors, L.; Benzarti, K.; Colin, X. Thermo-oxidative degradation of additive free polyethylene: Part I—Analysis of chemical modifications at molecular and macromolecular scales. J. Appl. Polym. Sci. 2016, 133, 43287. [Google Scholar] [CrossRef]
- Bian, Y.; Colin, X.; Aressy, M. Thermal ageing of high tenacity polyvinyl alcohol yarns. Polym. Degrad. Stab. 2020, 179, 109277. [Google Scholar] [CrossRef]
- Zerbi, G.; Gallino, G.; Del Fanti, N.; Baini, L. Structural depth profiling in polyethylene films by multiple internal reflection infra-red spectroscopy. Polymer 1989, 30, 2324–2327. [Google Scholar] [CrossRef]
- Pagès, P. Characterization of Polymer Materials Using FT-IR and DSC Techniques; Universidade da Curuna: La Curuna, Spain, 2005. [Google Scholar]
- Hettal, S.; Suraci, S.V.; Roland, S.; Fabiani, D.; Colin, X. Towards a kinetic modeling of the changes in the electrical properties of cable insulation during radio-thermal oxidation in nuclear power plants: Application to silane-crosslinked polyethylene. Polymers 2021, 13, 4427. [Google Scholar] [CrossRef] [PubMed]
- Colin, X.; Monchy-Leroy, C.; Verdu, J. Effect of gamma irradiation on tensile properties of low molecular weight polyethylene samples. Radiat. Phys. Chem. 2011, 80, 895–901. [Google Scholar] [CrossRef] [Green Version]
- Van Krevelen, D.W.; Te Nijenhuis, K. Physical Constants of the Most Polar Solvents. In Properties of Polymers: Their Correlation with Chemical Structure, their Numerical Estimation and Prediction from Additive Group Contributions, 4th ed.; Elsevier: Amsterdam, The Netherlands, 2009; Tab IV; pp. 904–919. [Google Scholar]
- Walter, E.R.; Reding, P.F. Variations in unit cell dimensions in polyethylene. J. Appl. Polym. Sci. 1956, 21, 561–562. [Google Scholar] [CrossRef]
- Van Krevelen, D.W.; Te Nijenhuis, K. Volumetric Properties. In Properties of Polymers: Their Correlation with Chemical Structure, their Numerical Estimation and Prediction from Additive Group Contributions, 4th ed.; Elsevier: Amsterdam, The Netherlands, 2009; Chapter 4; pp. 71–108. [Google Scholar]
- Flory, P.J.; Rehner, J. Statistical mechanics of cross-linked polymer networks II: Swelling. J. Chem. Phys. 1943, 11, 521–526. [Google Scholar] [CrossRef]
- Kraus, G. Quantitative characterization of polybutadiene networks. J. Appl. Polym. Sci. 1963, 7, 1257–1263. [Google Scholar] [CrossRef]
- Hendra, P.J.; Peacock, A.J.; Willis, H.A. The morphology of linear polyethylenes crosslinked in their melts. The structure of melt crystallized polymers in general. Polymer 1987, 28, 705–709. [Google Scholar]
- Kraus, G. Swelling of filled-reinforced vulcanizates. J. Appl. Polym. Sci. 1963, 7, 861–871. [Google Scholar] [CrossRef]
- Kruzelak, J.; Hudec, I.; Dosoudil, R. Influence of thermo-oxidative and ozone ageing on the properties of elastomeric magnetic composites. Polym. Degrad. Stab. 2012, 97, 921–928. [Google Scholar] [CrossRef]
- Colin, X.; Ben Hassine, M.; Nait-Abdelaziz, M. Chemo-mechanical model for predicting the lifetime of EPDM rubbers. Rubber Chem. Technol. 2019, 92, 722–724. [Google Scholar] [CrossRef]
- Oliver, W.C.; Pharr, G.M. An improved technique for determining hardness and elastic modulus using load and displacement sensing indentation experiments. J. Mater. Res. 1992, 7, 1564–1583. [Google Scholar] [CrossRef]
- Courvoisier, E.; Bicaba, Y.; Colin, X. Multi-scale and multi-technical analysis of the thermal degradation of poly(ether imide). Polym. Degrad. Stab. 2018, 147, 177–186. [Google Scholar] [CrossRef]
- Courvoisier, E.; Bicaba, Y.; Colin, X. Multi-scale and multi-technique analysis of the thermal degradation of poly(ether ether ketone). Polym. Degrad. Stab. 2018, 151, 65–79. [Google Scholar] [CrossRef]
- Guth, E. Theory of filler reinforcement. J. Appl. Phys. 1945, 16, 20–25. [Google Scholar] [CrossRef]
- ISO 5271:2012; Plastics—Determination of Tensile Properties—Part 1: General Principles. AFNOR: La Plaine Saint-Denis, France, February 2012.
- ISO 5272:2012; Plastics—Determination of Tensile Properties—Part 2: Test Conditions for Moulding and Extrusion Plastics. AFNOR: La Plaine Saint-Denis, France, 2012.
- Choi, C.L.; Leung, W.P. Elastic moduli of ultra drawn polyethylene. J. Polym. Sci. Part B Polym. Phys. 1985, 23, 1759–1780. [Google Scholar] [CrossRef]
- Huang, J.; Minne, W.; Drozdzak, R.; Recher, G.; Le Gac, P.Y.; Richaud, E. Thermal oxidation of poly(dicyclopentadiene). Polym. Degrad. Stab. 2020, 174, 109102. [Google Scholar] [CrossRef]
- Seguchi, T.; Yamamoto, Y. Diffusion and Solubility of Oxygen in γ-Irradiated Polymer Insulation Materials; Japan Atomic Energy Research Institute Report; JAERI 1299: Takasaki, Japan, 1986. [Google Scholar]


| ρcomp | XATH (%) | VATH (%) | ρ | XC (%) | Fg (%) | |
|---|---|---|---|---|---|---|
| Unfilled Si-XLPE | - | 0 | 0 | 0.914 | 42.1 | 71.1 |
| Si-XLPE + 25 phr ATH | 1.032 | 20.9 | 8.5 | 0.903 | 42.8 | 69.6 |
| Si-XLPE + 50 phr ATH | 1.146 | 33.2 | 15.6 | 0.910 | 43.0 | 67.6 |
| Dose Rate (Gy·h−1) | Dose Rate (Gy·s−1) | Temperature (°C) | Withdrawal Times of Samples (h) | Withdrawal Doses of Samples (kGy) |
|---|---|---|---|---|
| 8.5 | 2.36 × 10⁻³ | 47 | 2900–6000–9500–12,800–15,500 | 25–51–81–109–132 |
| 77.8 | 2.16 × 10⁻² | 47 | 860–1850–2830–3830–4800 | 67–144–220–298–373 |
| 400 | 1.11 × 10⁻¹ | 21 | 167–334–501–668–835 | 68–134–200–267–334 |
| Degradation Products | Wavenumbers (cm−1) | References |
|---|---|---|
| Conjugated C=C | 1590 and 1630 | [30] |
| Isolated C=C | 1650 | [30] |
| Carboxylic acids | 1714 | [11] |
| Aldehydes | 1736 | [11] |
| γ-Lactones or anhydrides | 1778 | [11] |
| Unfilled Si-XLPE | 0.914 | 42.1 | 37.9 | 0.853 |
| Si-XLPE + 25 phr ATH | 0.903 | 42.8 | 37.6 | 0.821 |
| Si-XLPE + 50 phr ATH | 0.910 | 43.0 | 38.6 | 0.832 |
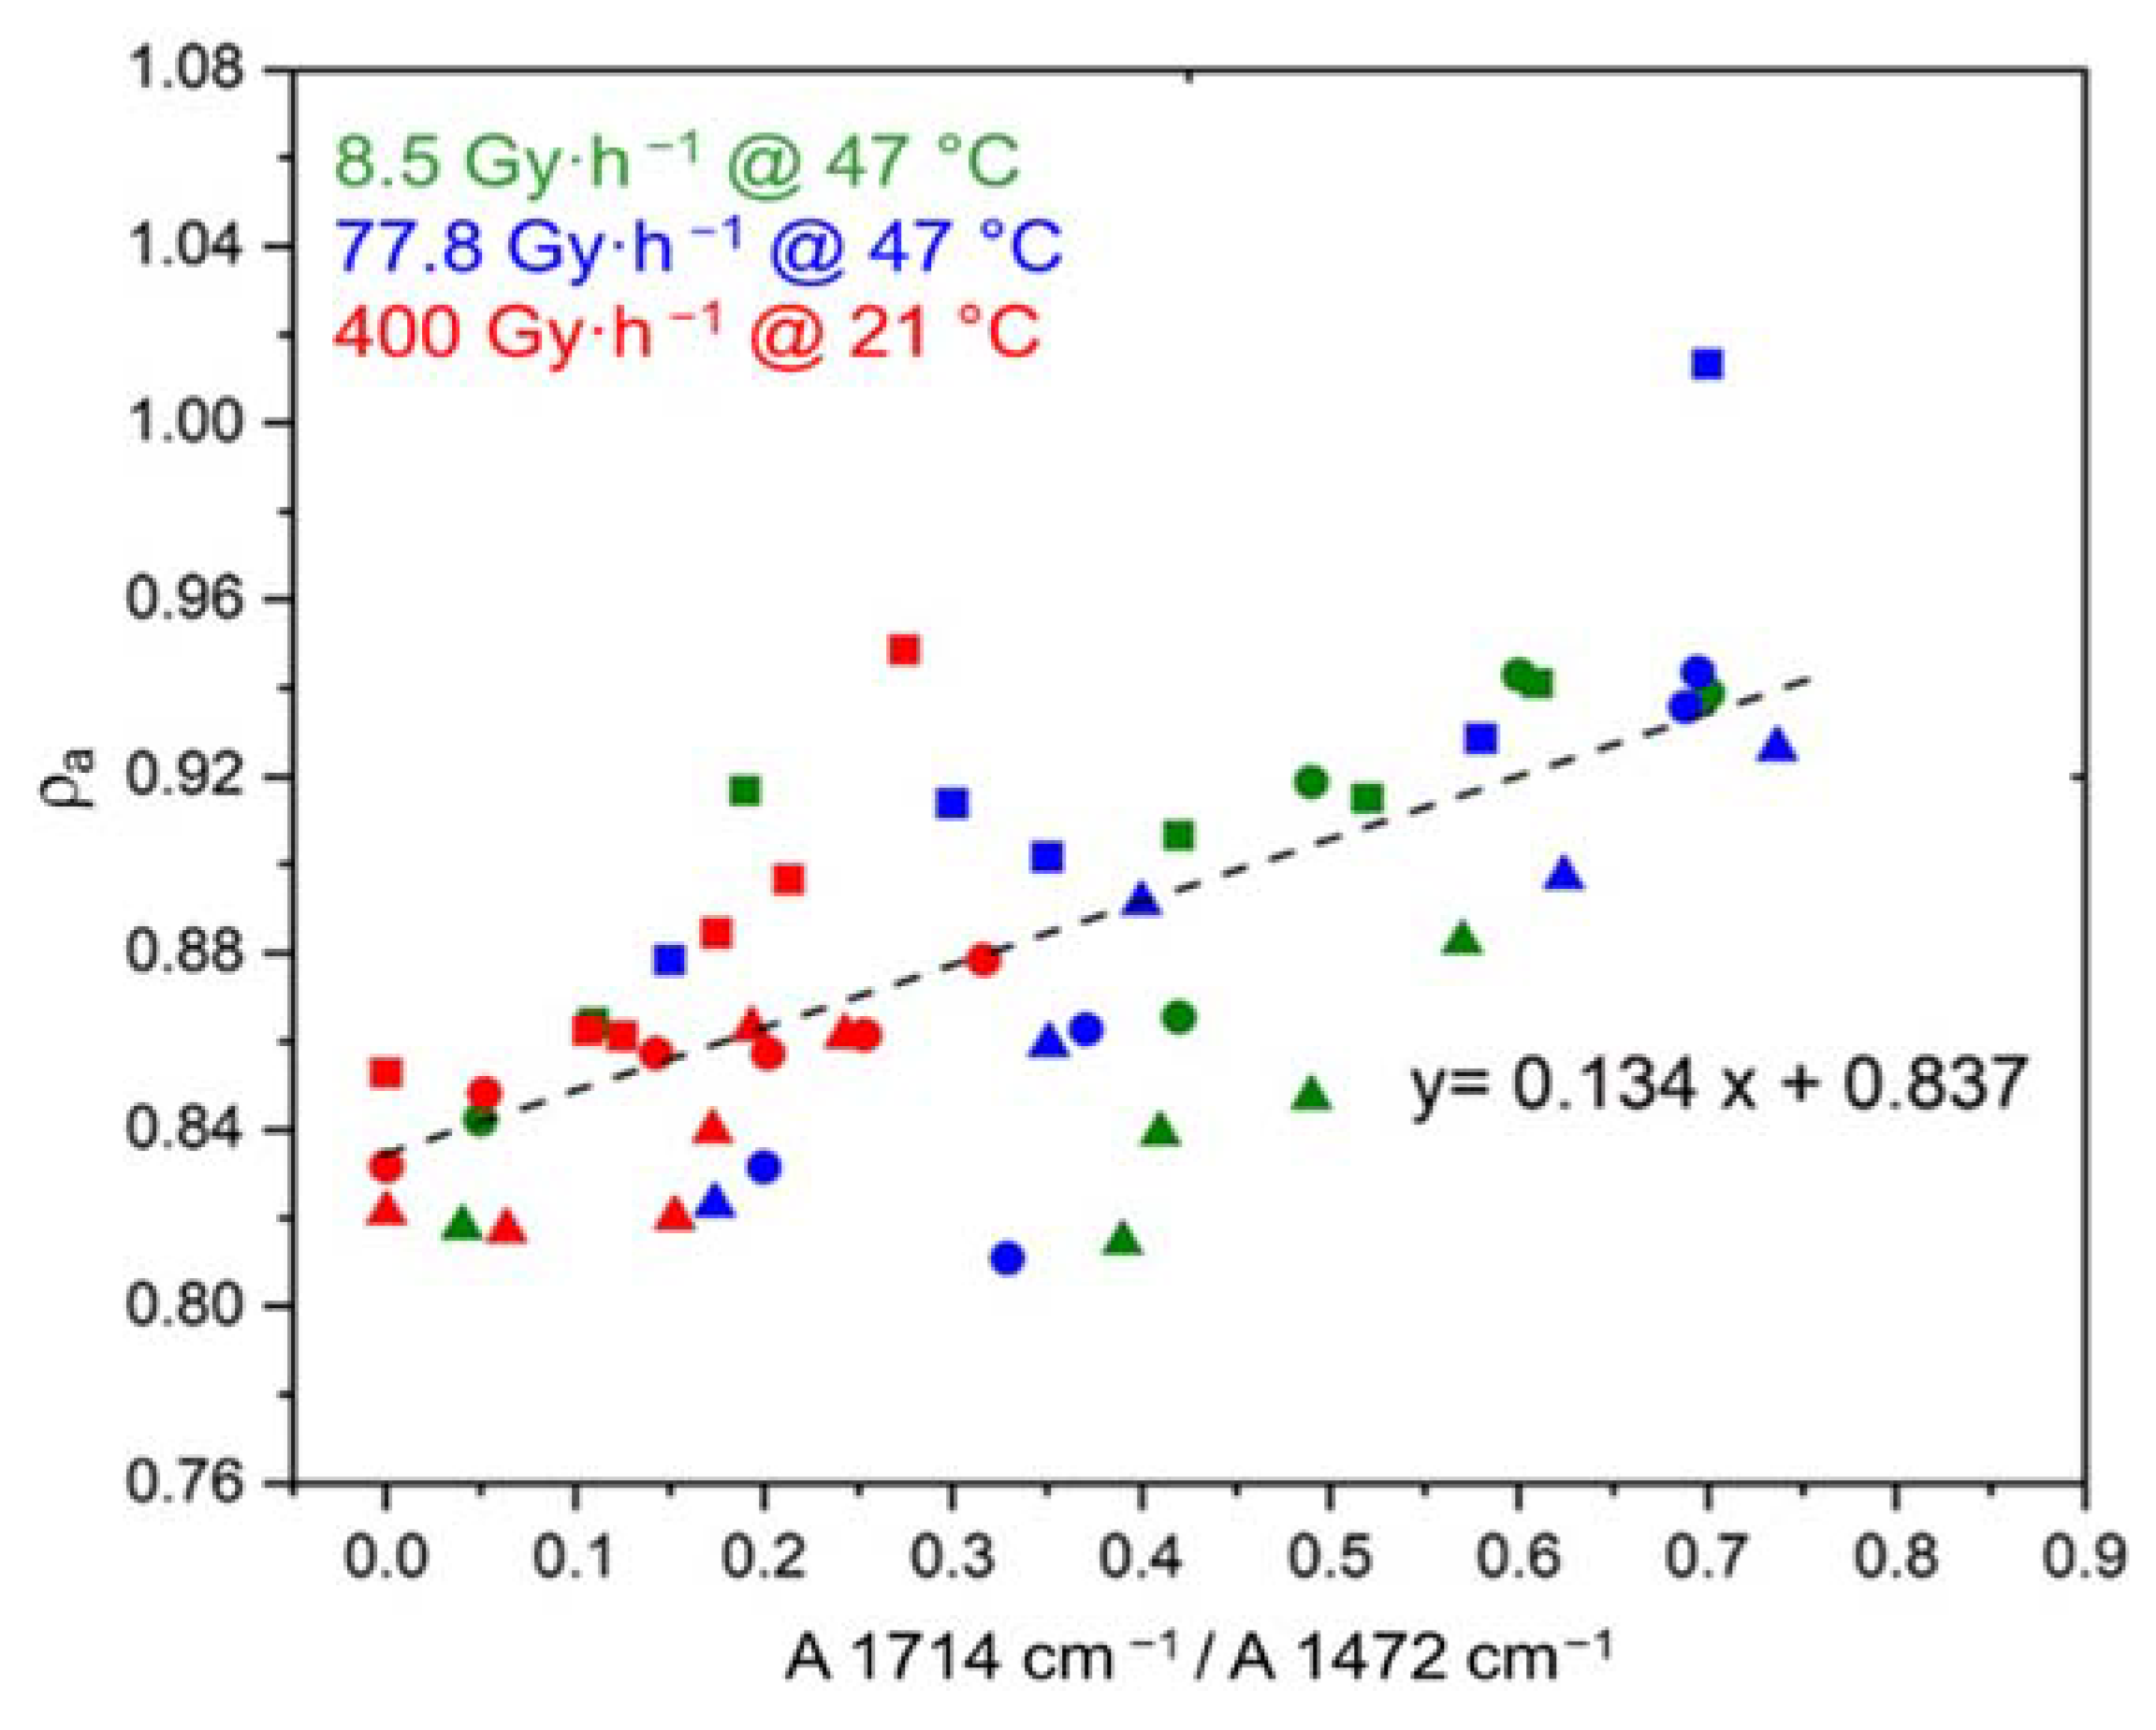
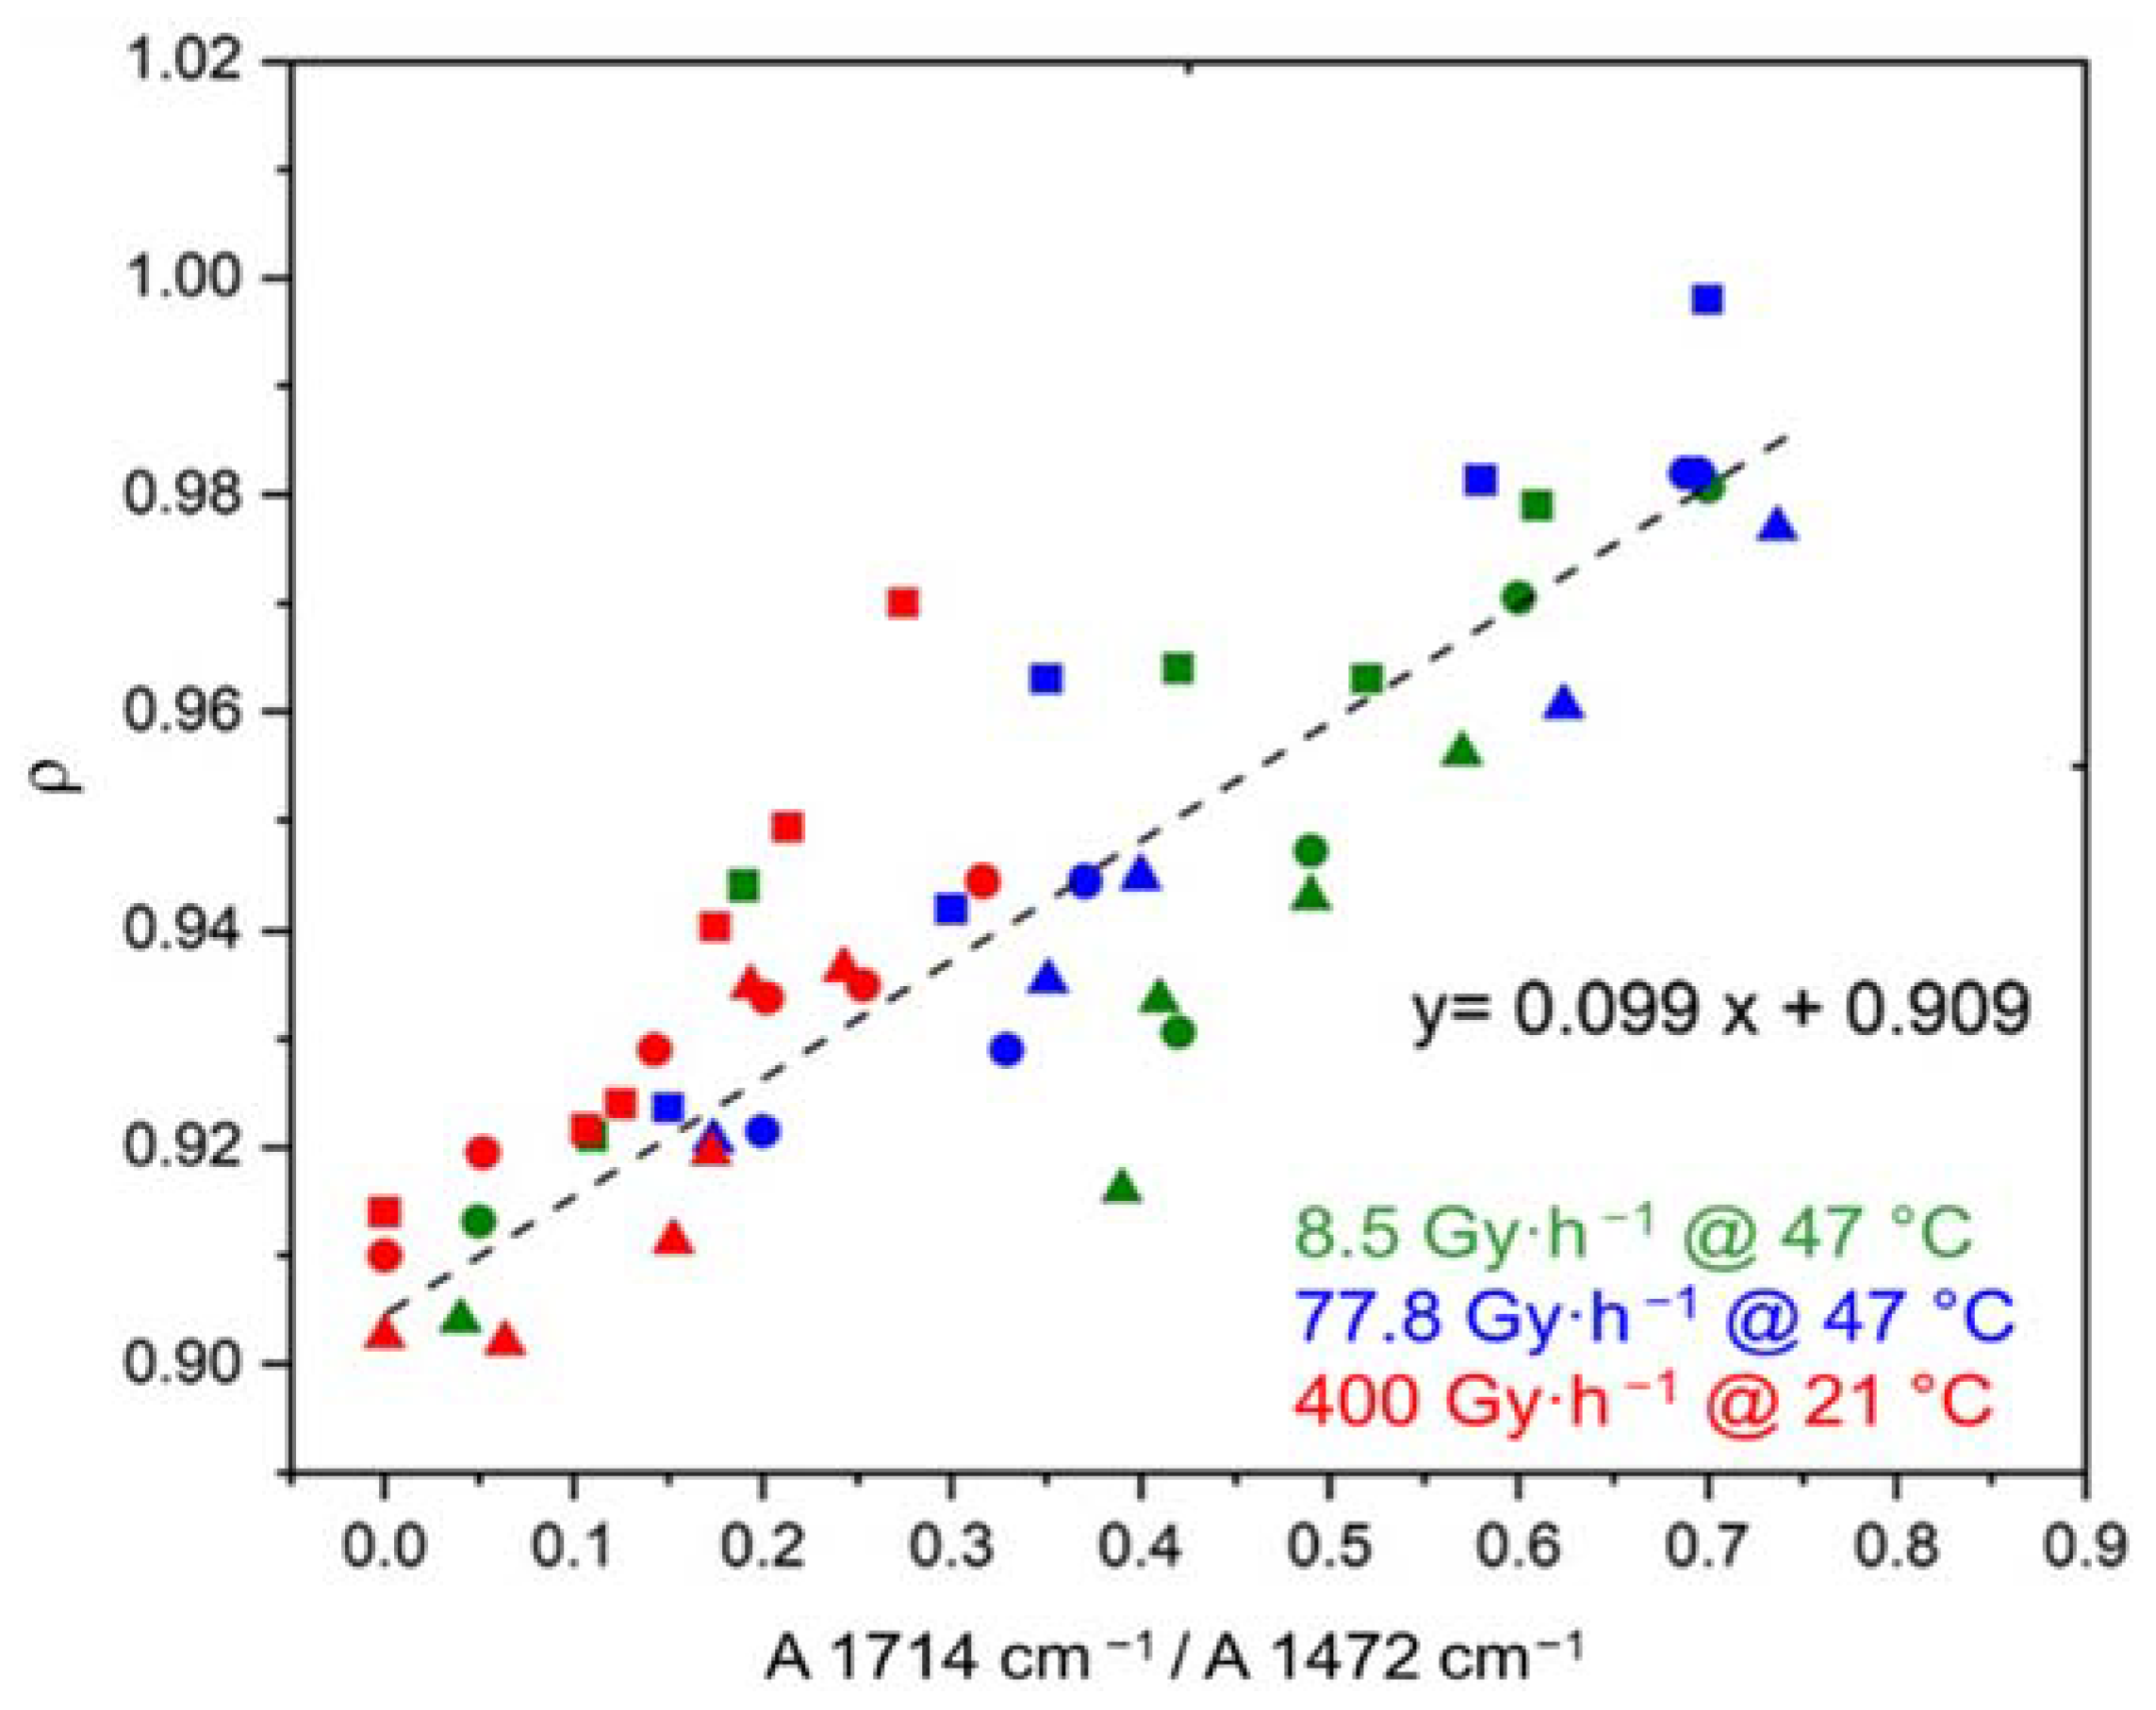
| Average value | 0.909 ± 0.006 | 42.5 ± 0.5 | 38.1 ± 0.5 | 0.837 ± 0.016 |
| 8.5 Gy·h−1 ≅ 47 °C | 77.8 Gy·h−1 ≅ 47 °C | 400 Gy·h−1 ≅ 21 °C | |
|---|---|---|---|
| Unfilled Si-XLPE | 6240 | 1200 | 720 |
| Si-XLPE + 25 phr ATH | 5300 | 1000 | 400 |
| Si-XLPE + 50 phr ATH | 5300 | 1100 | 370 |
| 8.5 Gy·h−1 ≅ 47 °C | 77.8 Gy·h−1 ≅ 47 °C | 400 Gy·h−1 ≅ 21 °C | |
|---|---|---|---|
| Unfilled Si-XLPE | 6500 | 1250 | 670 |
| Si-XLPE + 25 phr ATH | 5300 | 1250 | 480 |
| Si-XLPE + 50 phr ATH | 5300 | 1000 | 340 |
Publisher’s Note: MDPI stays neutral with regard to jurisdictional claims in published maps and institutional affiliations. |
© 2022 by the authors. Licensee MDPI, Basel, Switzerland. This article is an open access article distributed under the terms and conditions of the Creative Commons Attribution (CC BY) license (https://creativecommons.org/licenses/by/4.0/).
Share and Cite
Hettal, S.; Roland, S.; Sipila, K.; Joki, H.; Colin, X. A New Kinetic Modeling Approach for Predicting the Lifetime of ATH-Filled Silane Cross-Linked Polyethylene in a Nuclear Environment. Polymers 2022, 14, 1492. https://doi.org/10.3390/polym14071492
Hettal S, Roland S, Sipila K, Joki H, Colin X. A New Kinetic Modeling Approach for Predicting the Lifetime of ATH-Filled Silane Cross-Linked Polyethylene in a Nuclear Environment. Polymers. 2022; 14(7):1492. https://doi.org/10.3390/polym14071492
Chicago/Turabian StyleHettal, Sarah, Sébastien Roland, Konsta Sipila, Harri Joki, and Xavier Colin. 2022. "A New Kinetic Modeling Approach for Predicting the Lifetime of ATH-Filled Silane Cross-Linked Polyethylene in a Nuclear Environment" Polymers 14, no. 7: 1492. https://doi.org/10.3390/polym14071492