
Fabrication of Conductive, High Strength and Electromagnetic Interference (EMI) Shielded Green Composites Based on Waste Materials

 , , , ,
  and
and
Abstract
:1. Introduction
2. Materials and Methods
2.1. Methodology
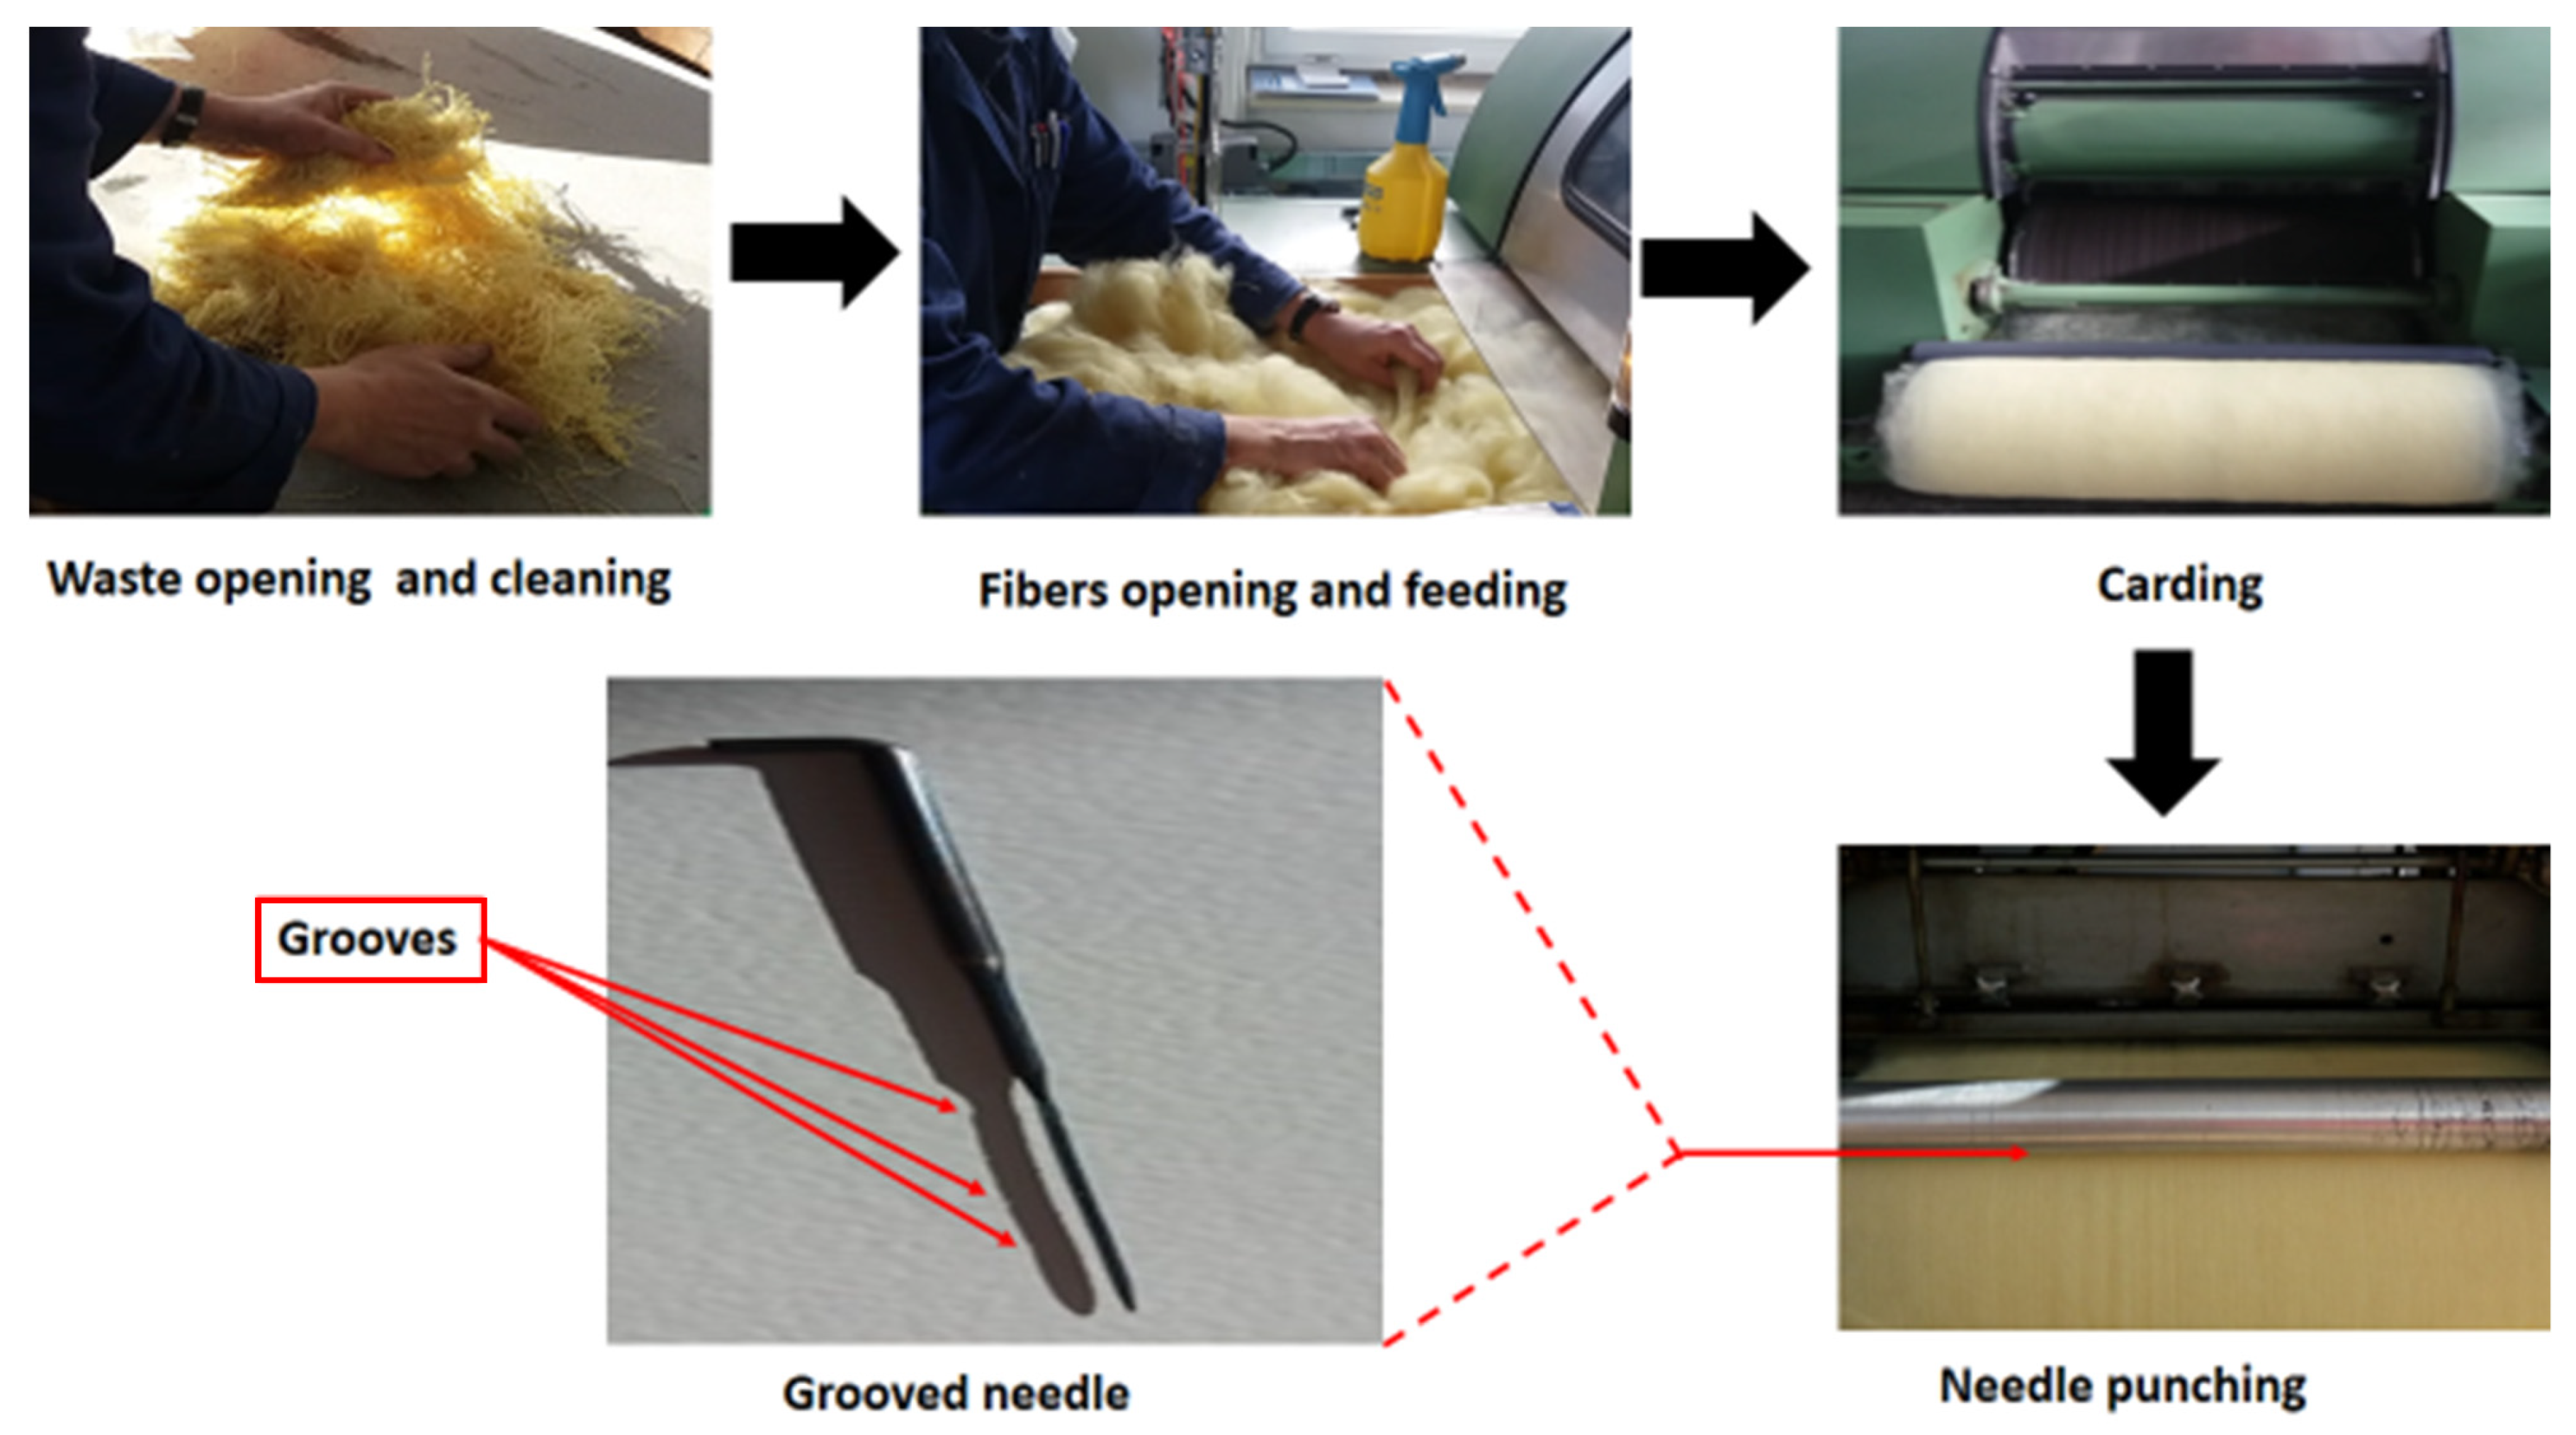
2.1.1. Preparation of Kevlar Web
2.1.2. Chemical Treatment of Kevlar Nonwoven Web
2.1.3. Preparation of Particles
2.1.4. Preparation of Conductive Paste
2.1.5. Fabrication of Composites from the Conductive Paste
3. Characterizations
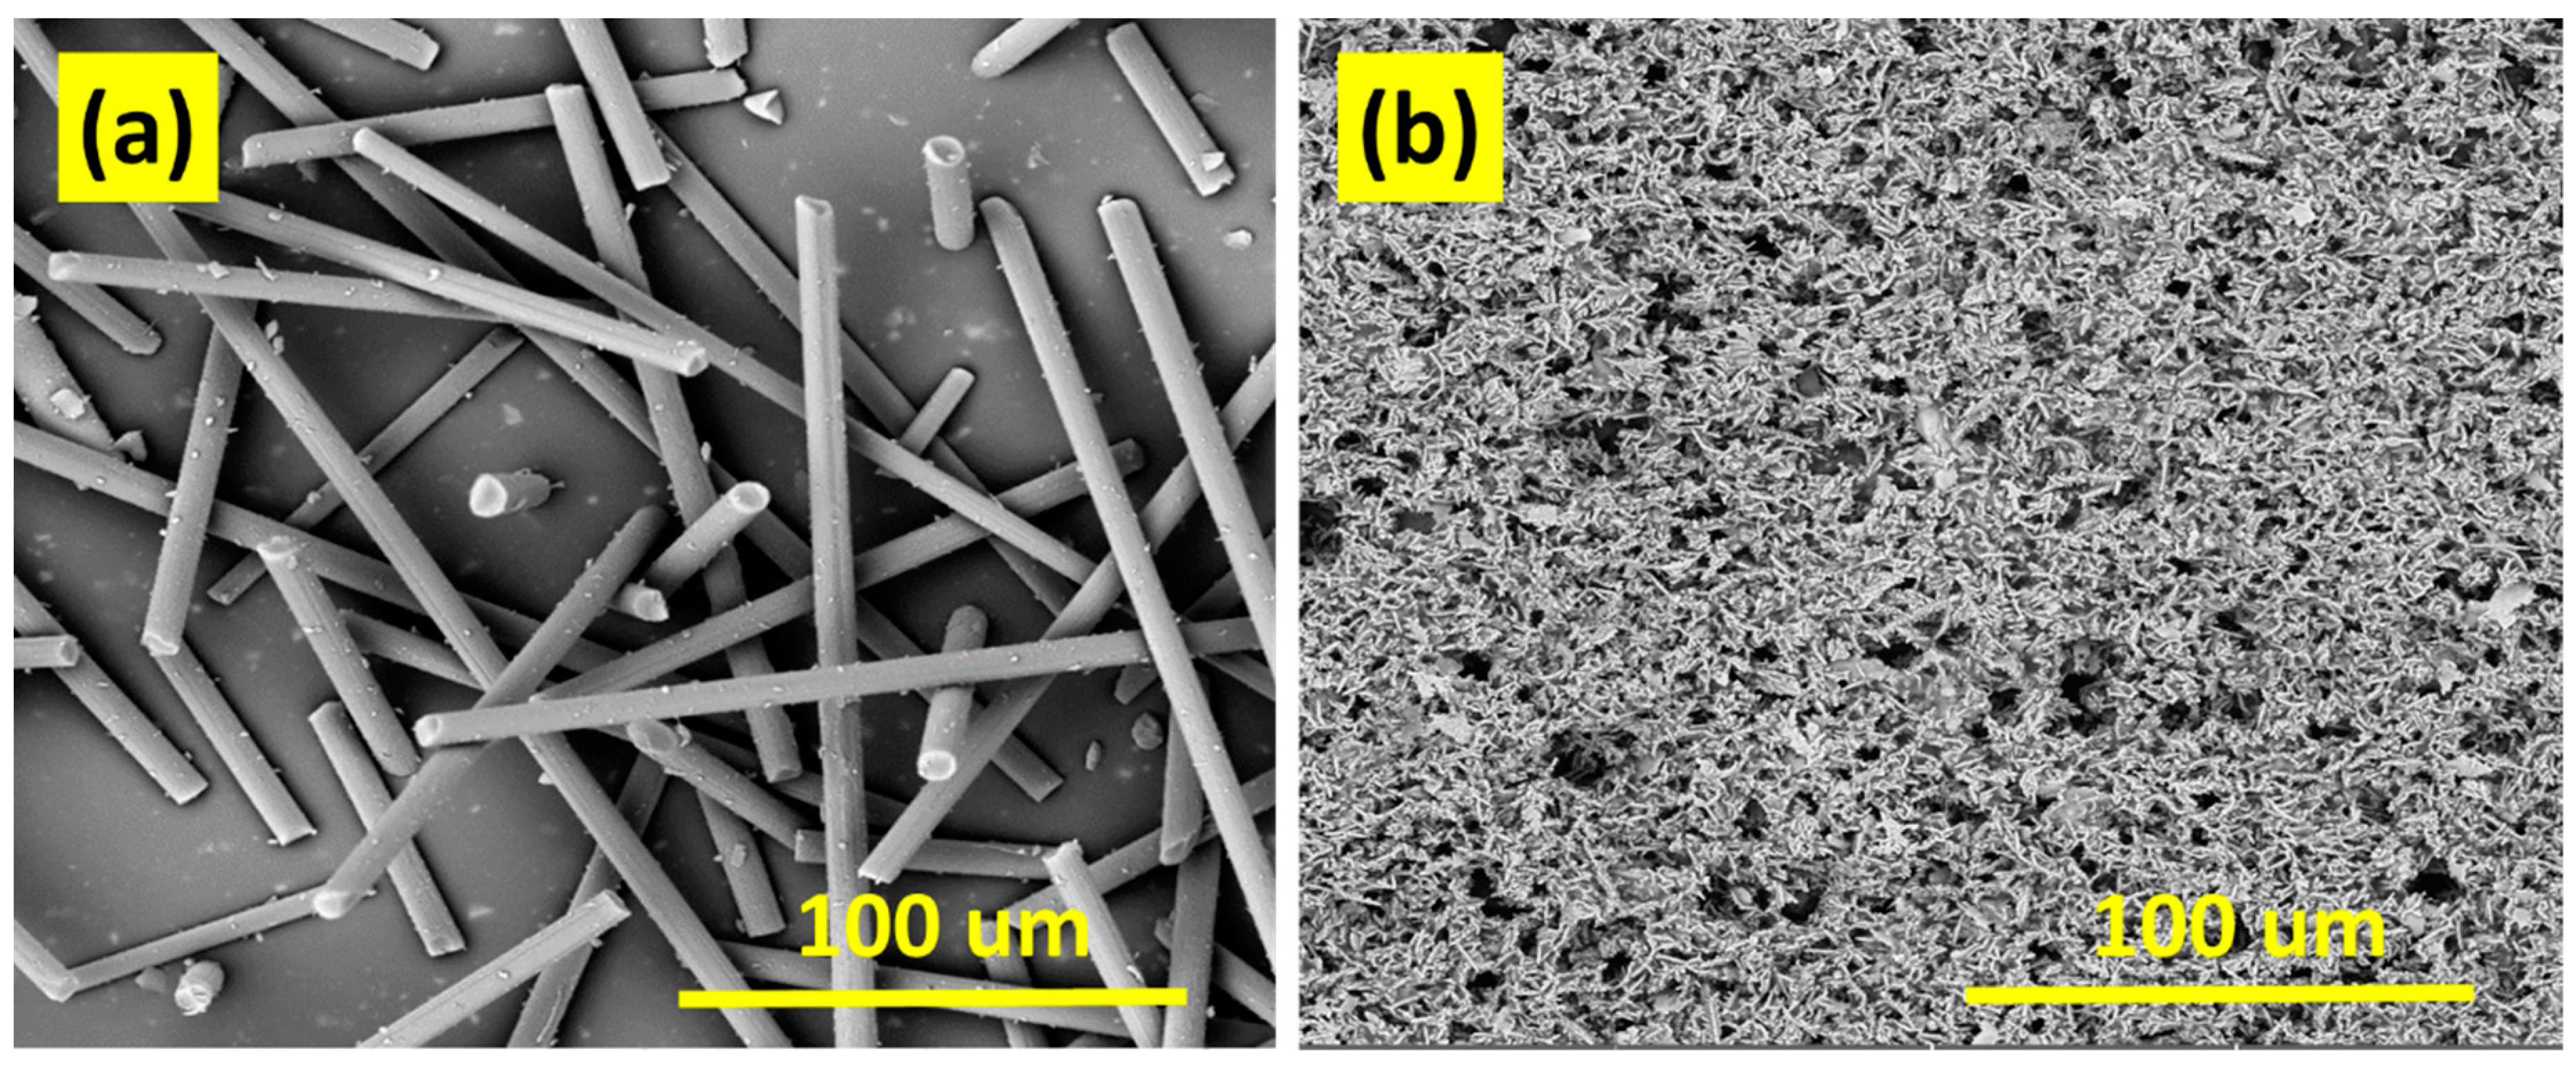
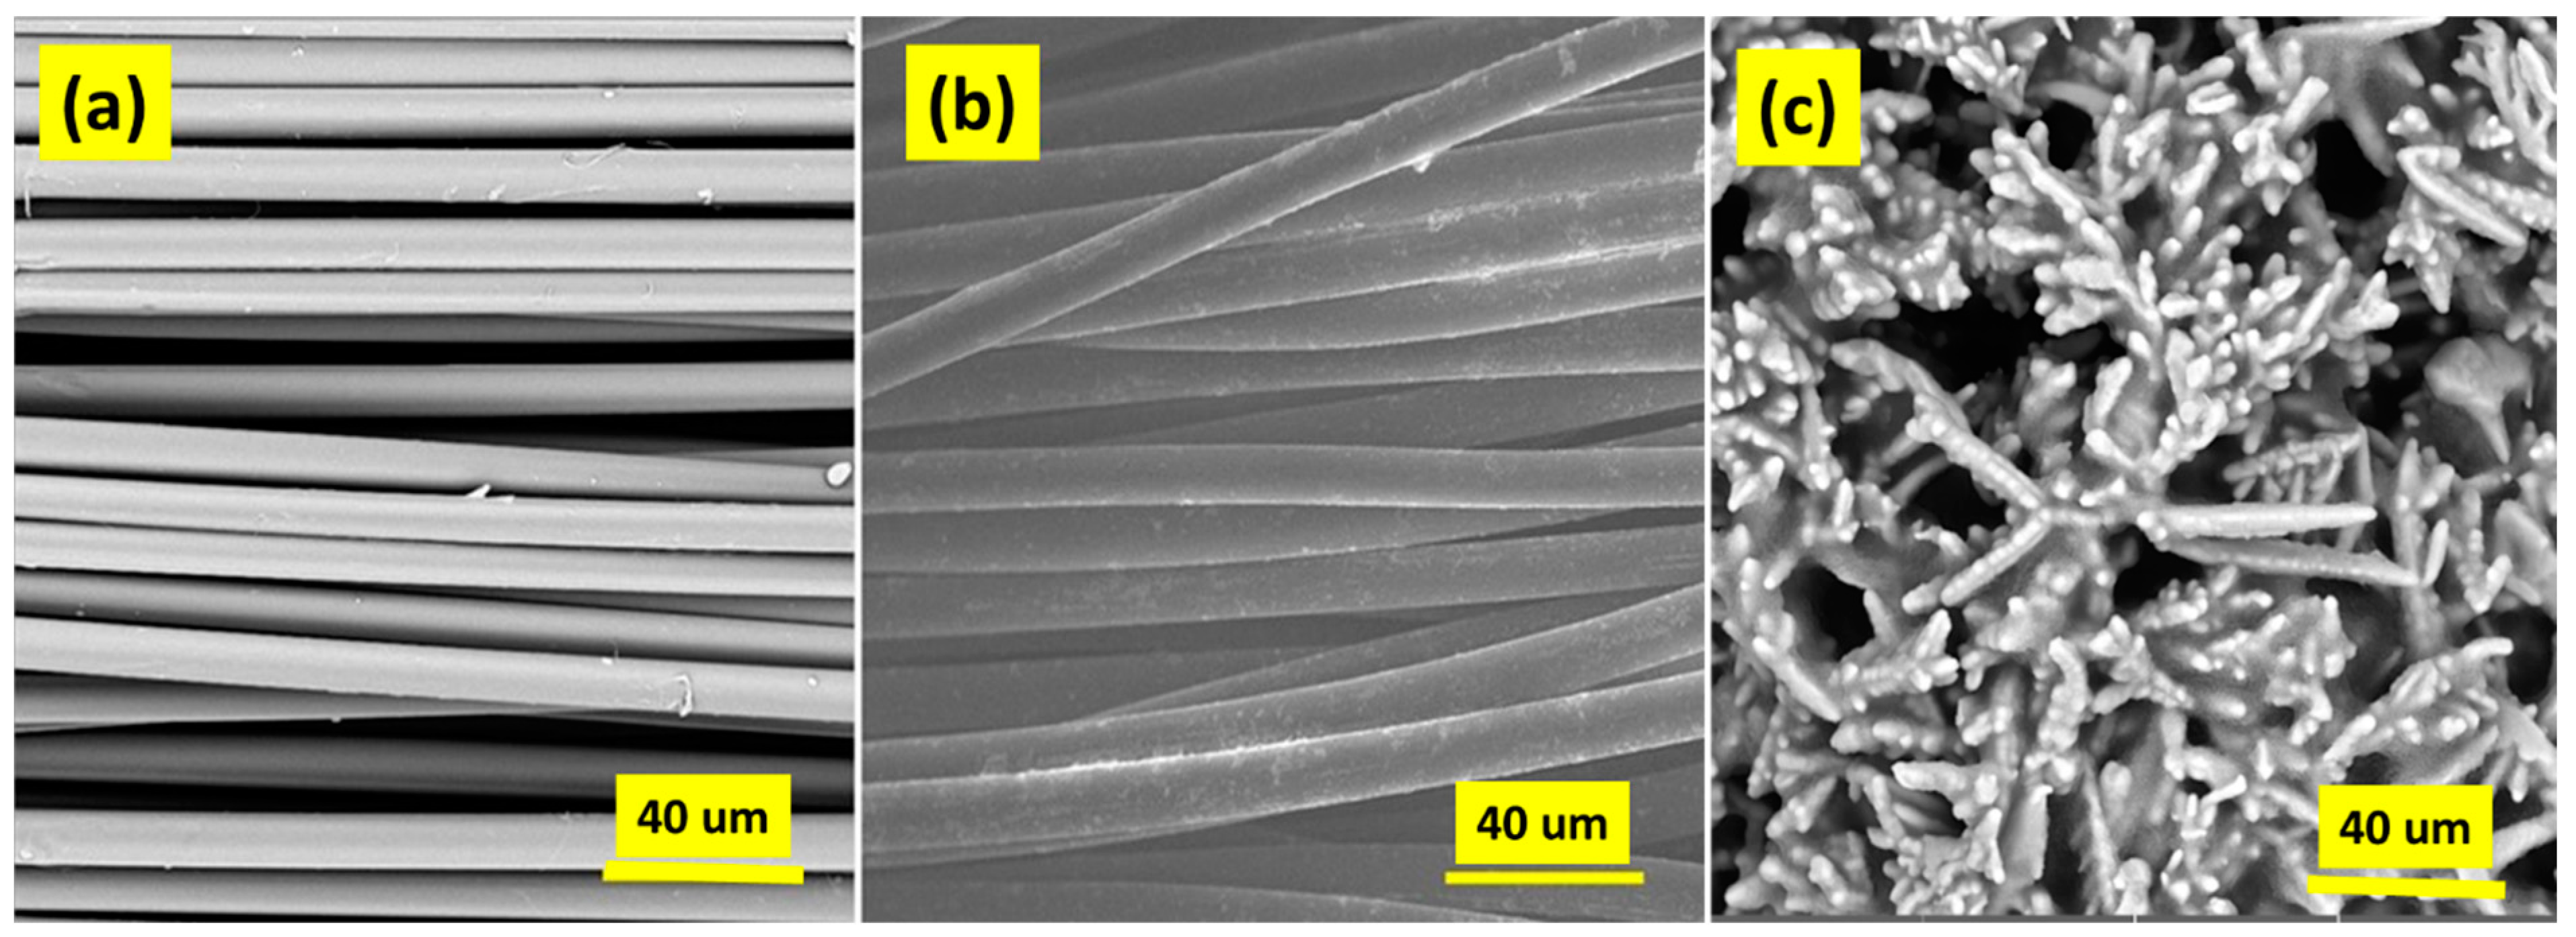
3.1. Surface Morphology Testing
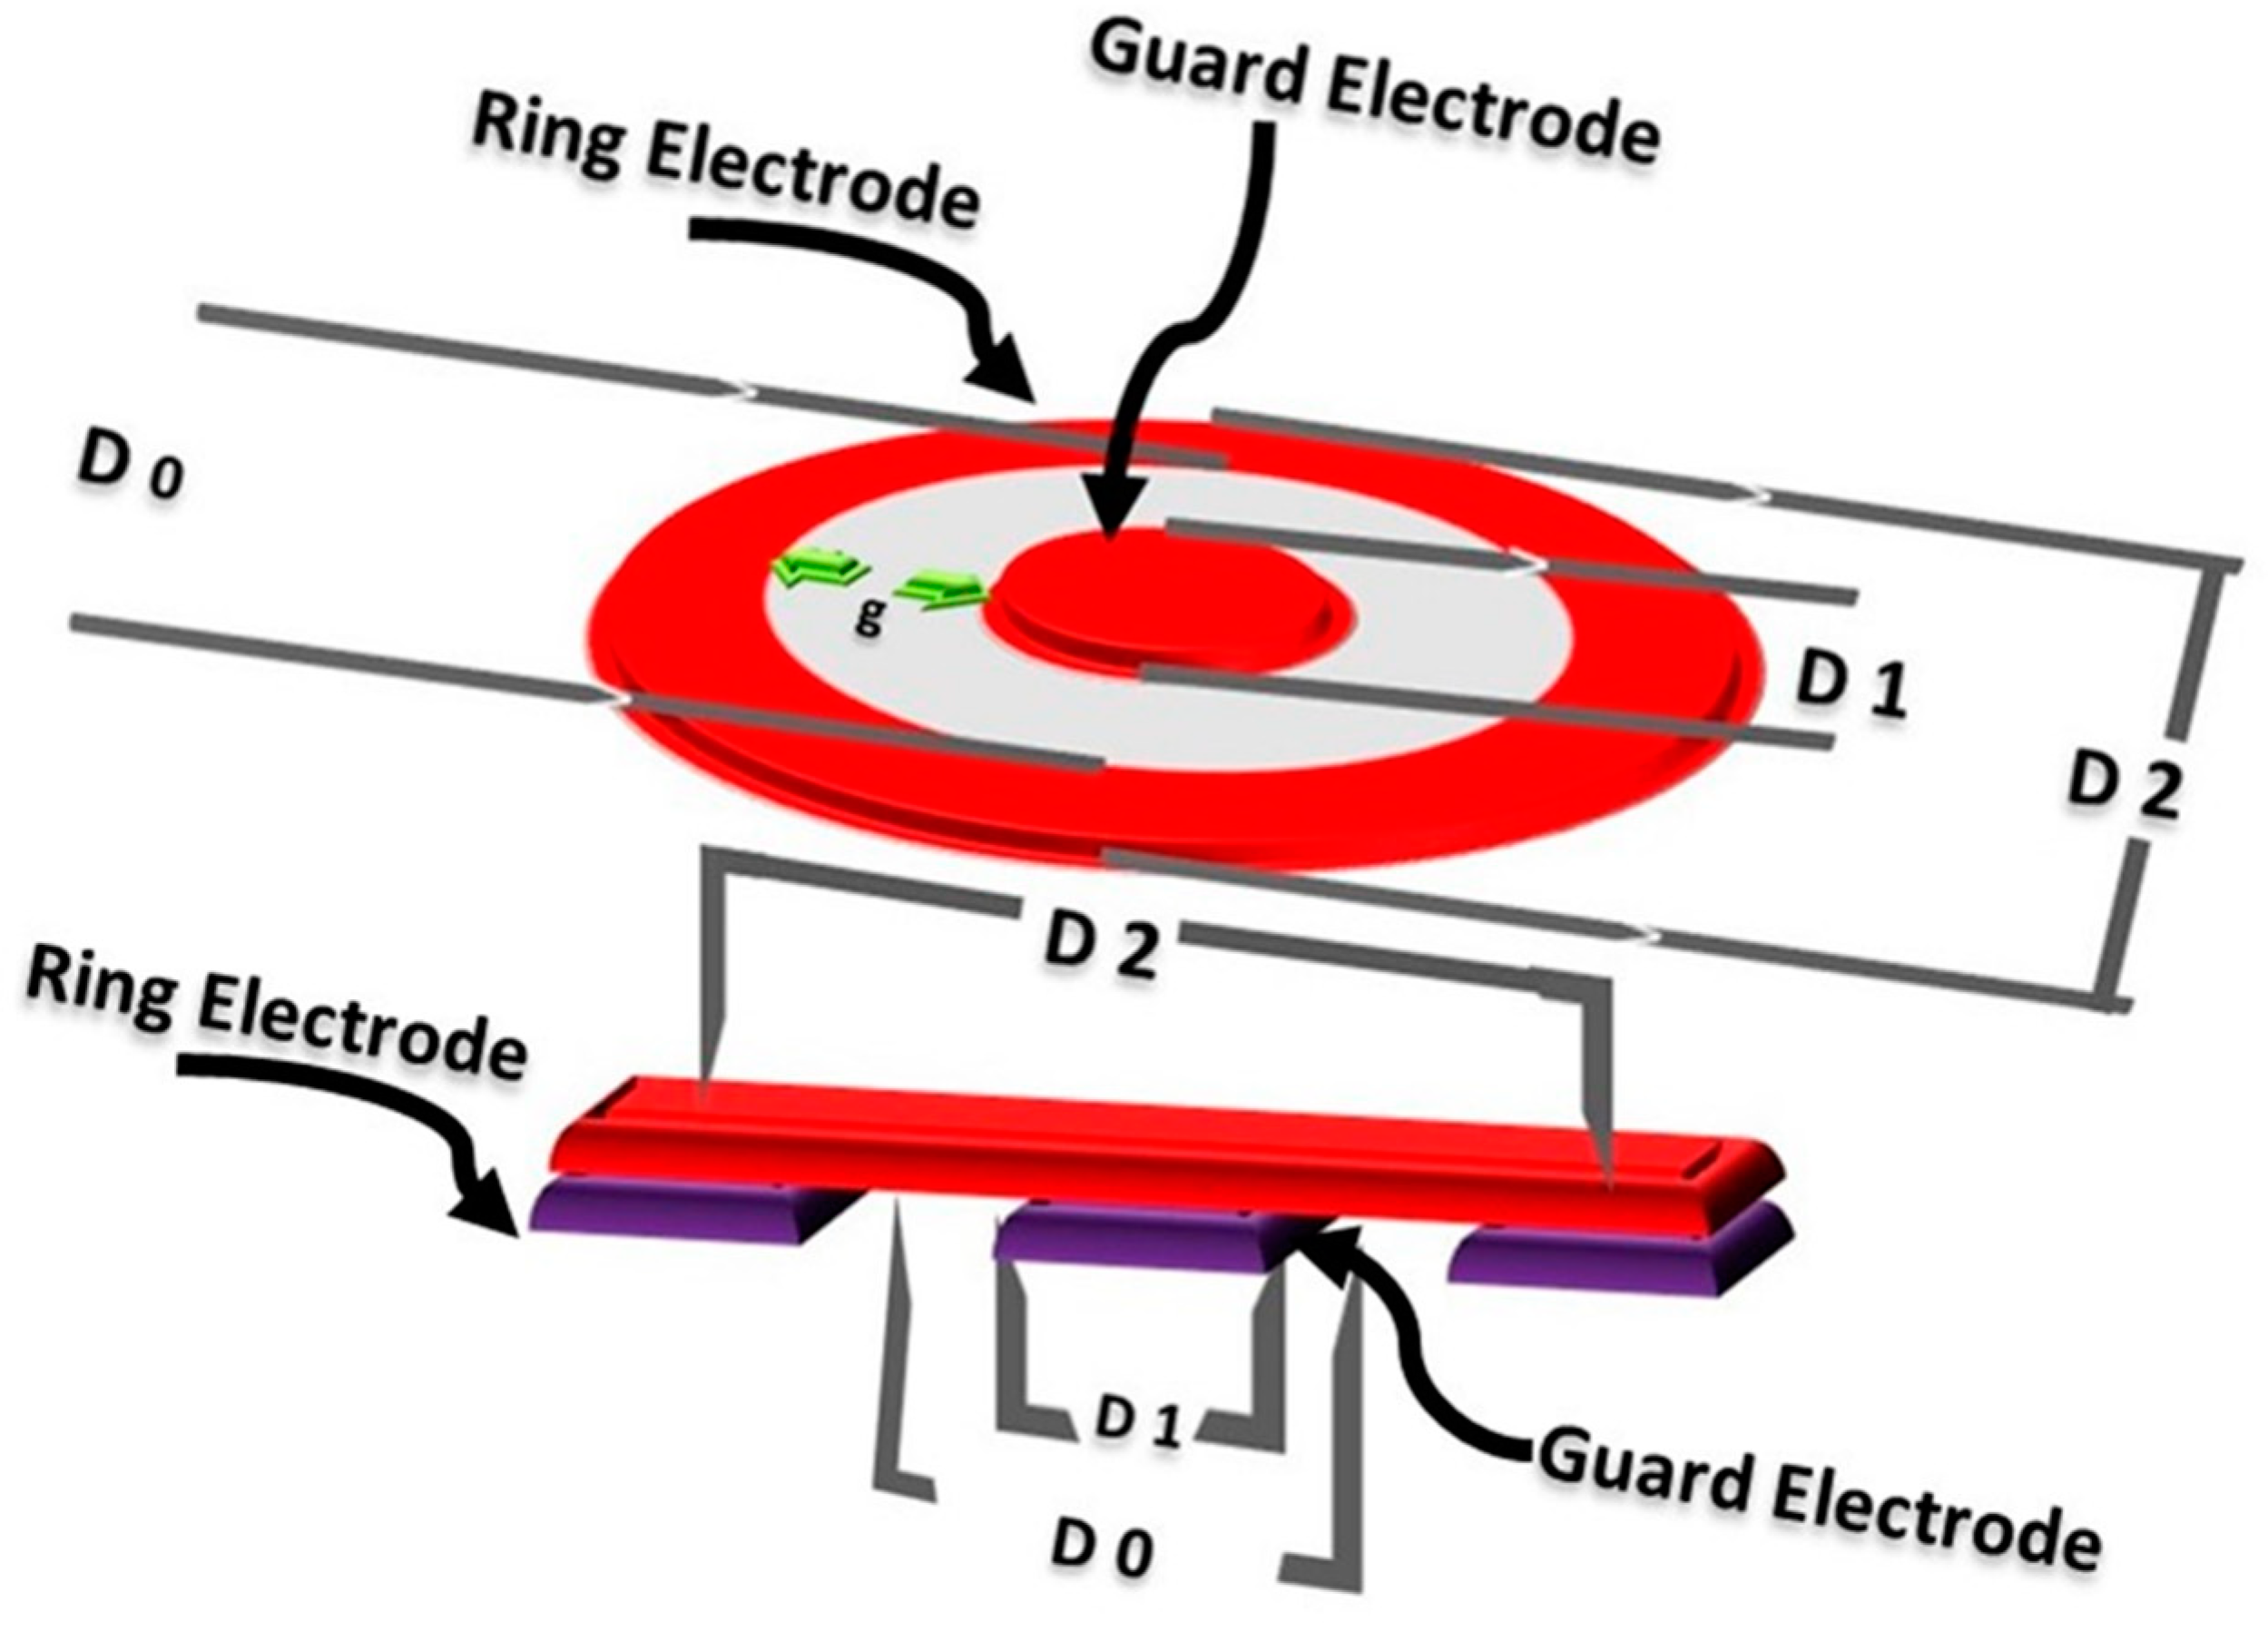
3.2. Electrical Resistivity
3.3. Electromagnetic Shielding Testing
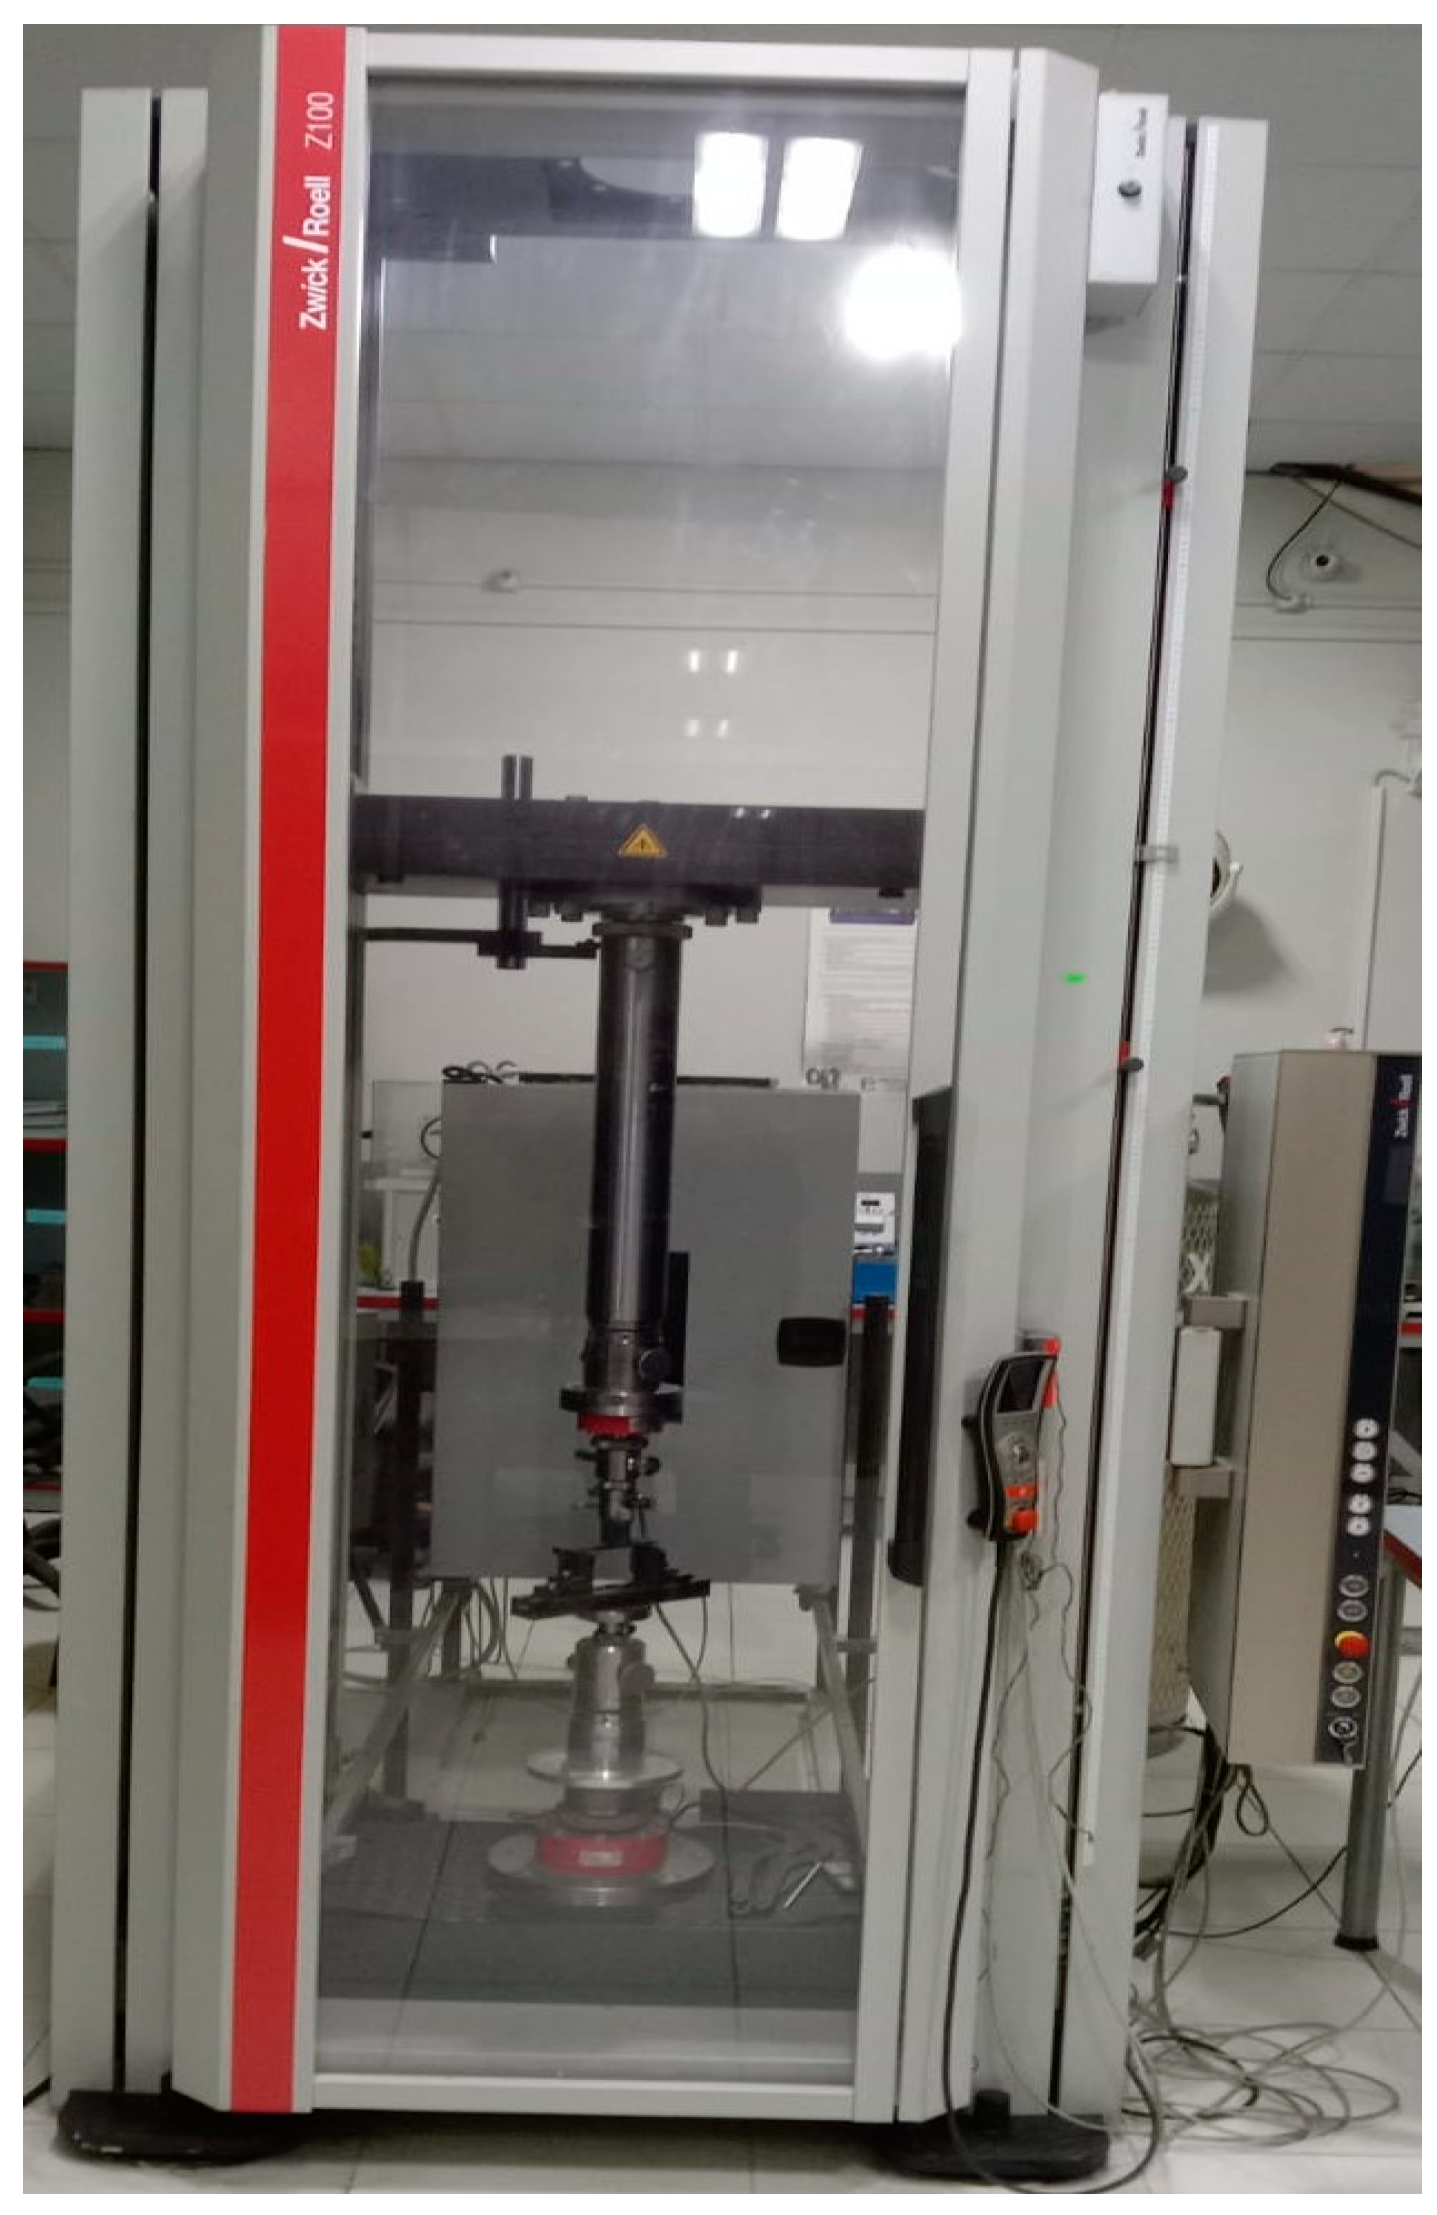
3.4. Characterization of Mechanical Properties
3.5. Heating Performance of Conductive Fabrics
3.6. Thermal Conductivity
4. Results and Discussion
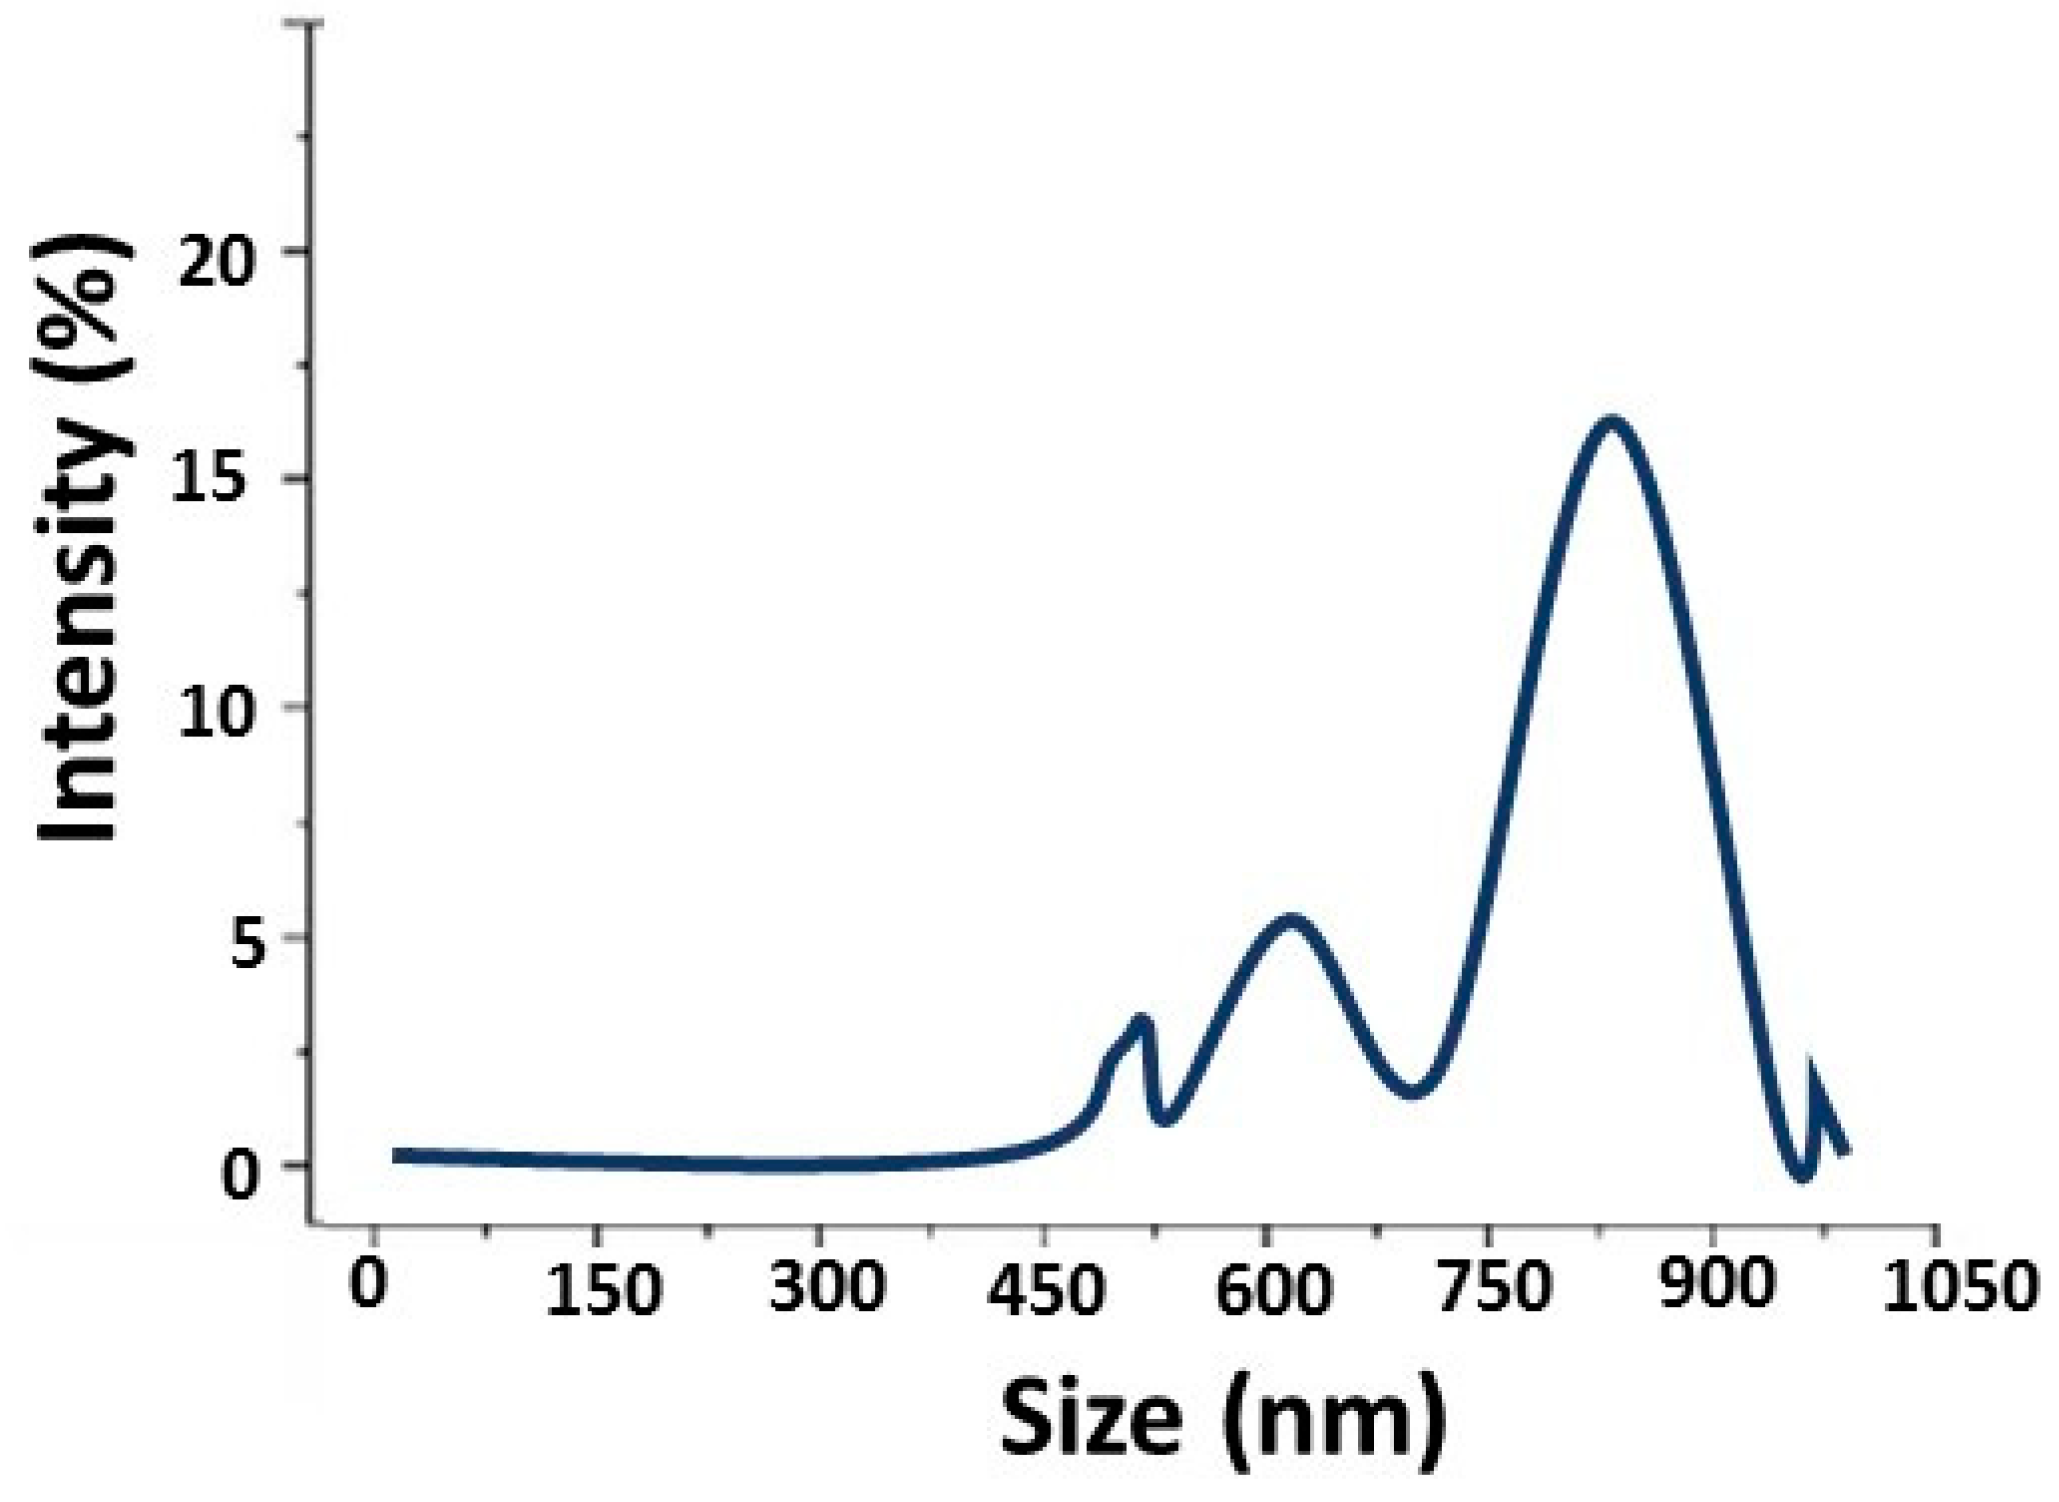
4.1. Particle Size Analysis
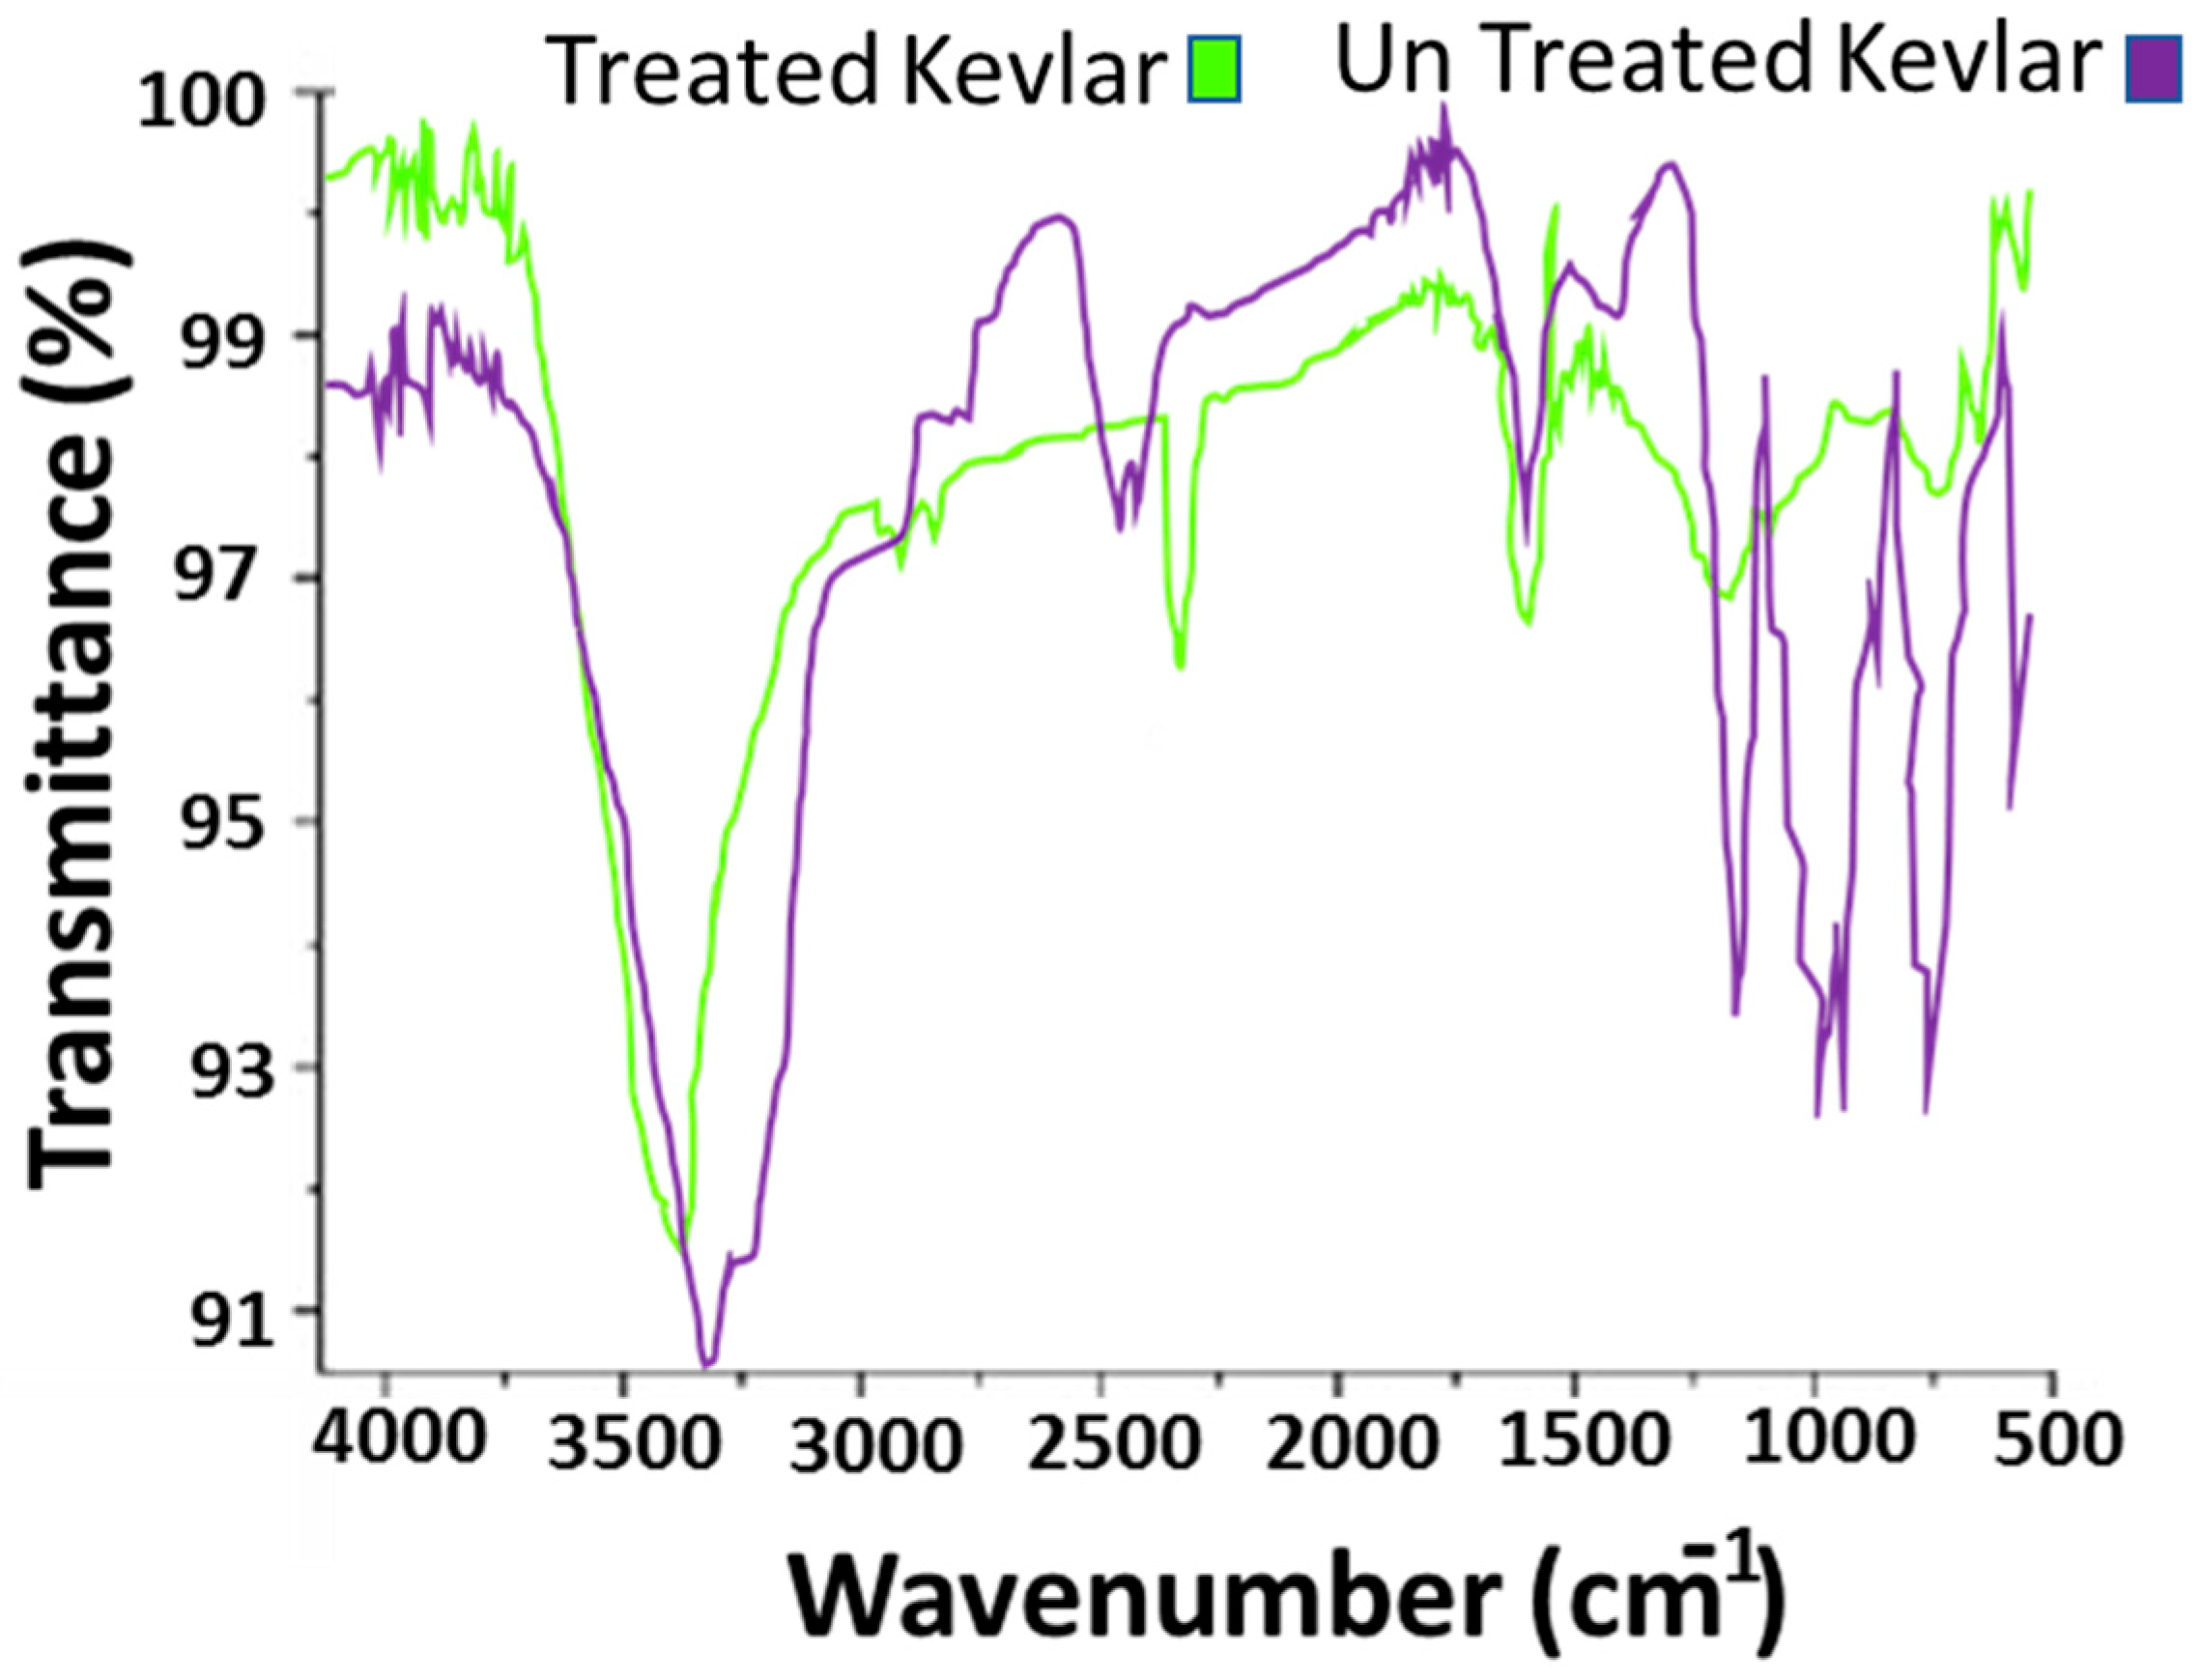
4.2. FTIR Analysis
4.3. Electrical Conductivity
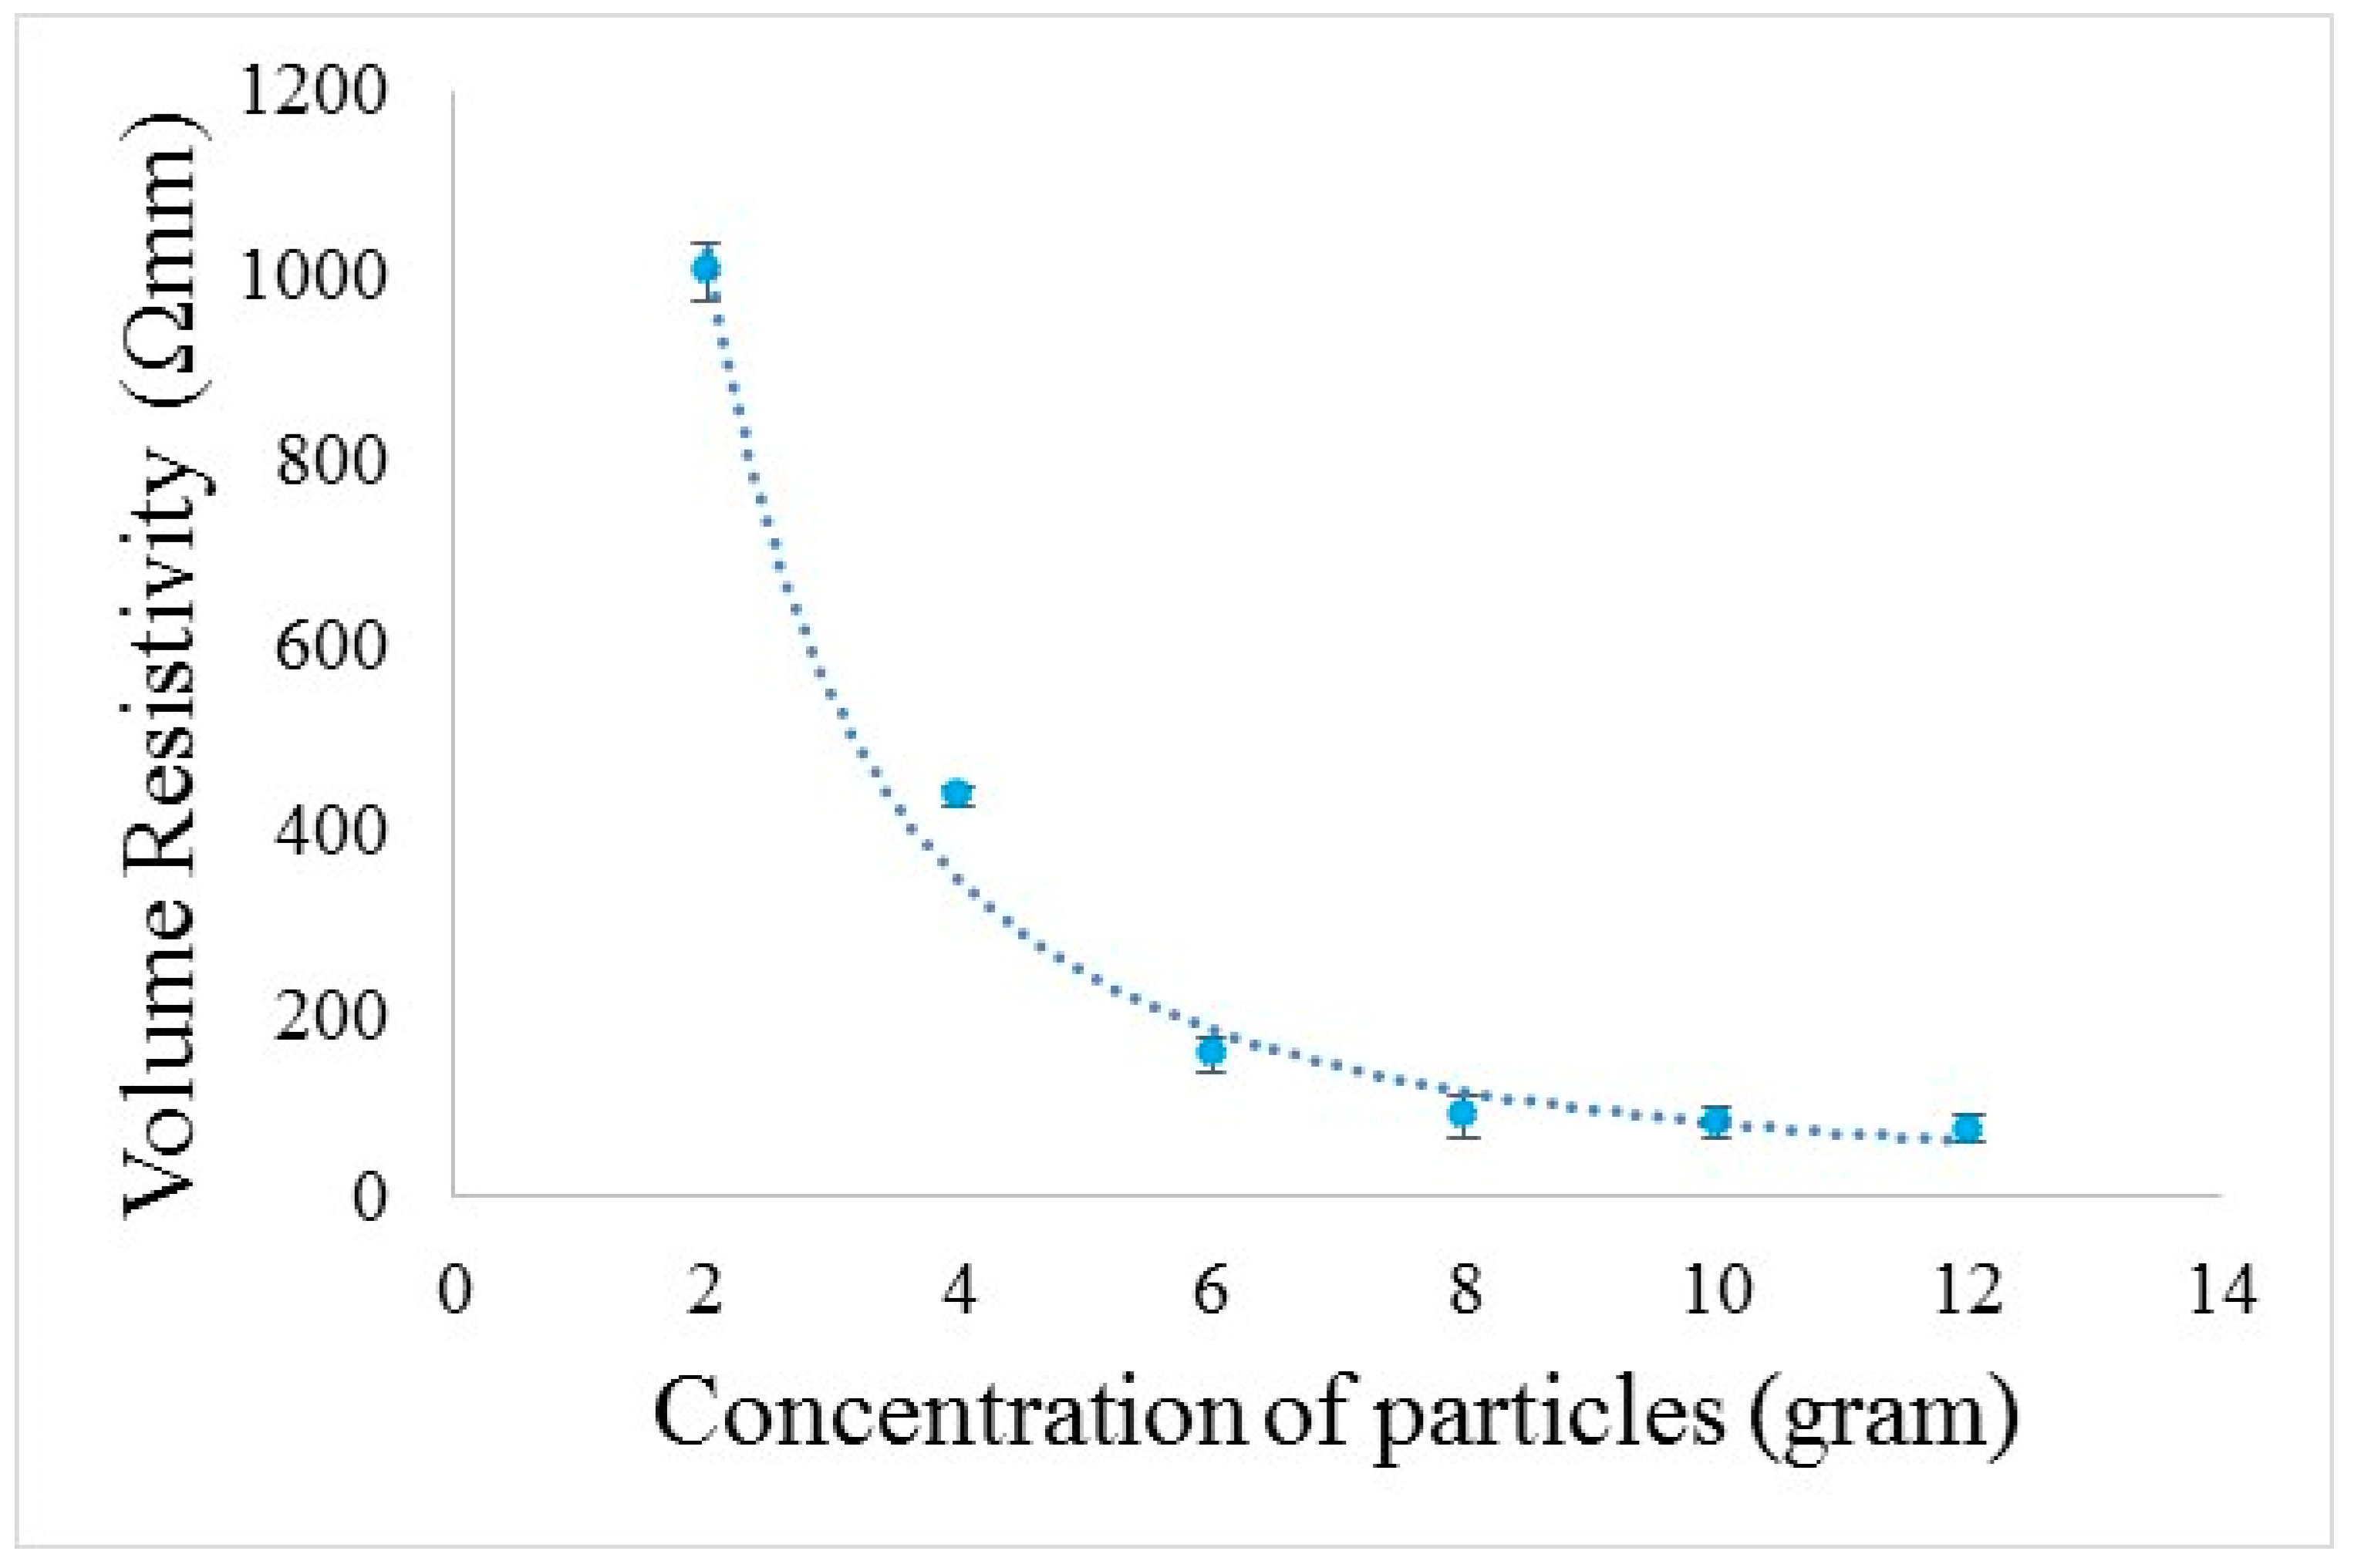
4.3.1. Electrical Resistivity of Methanol Solution
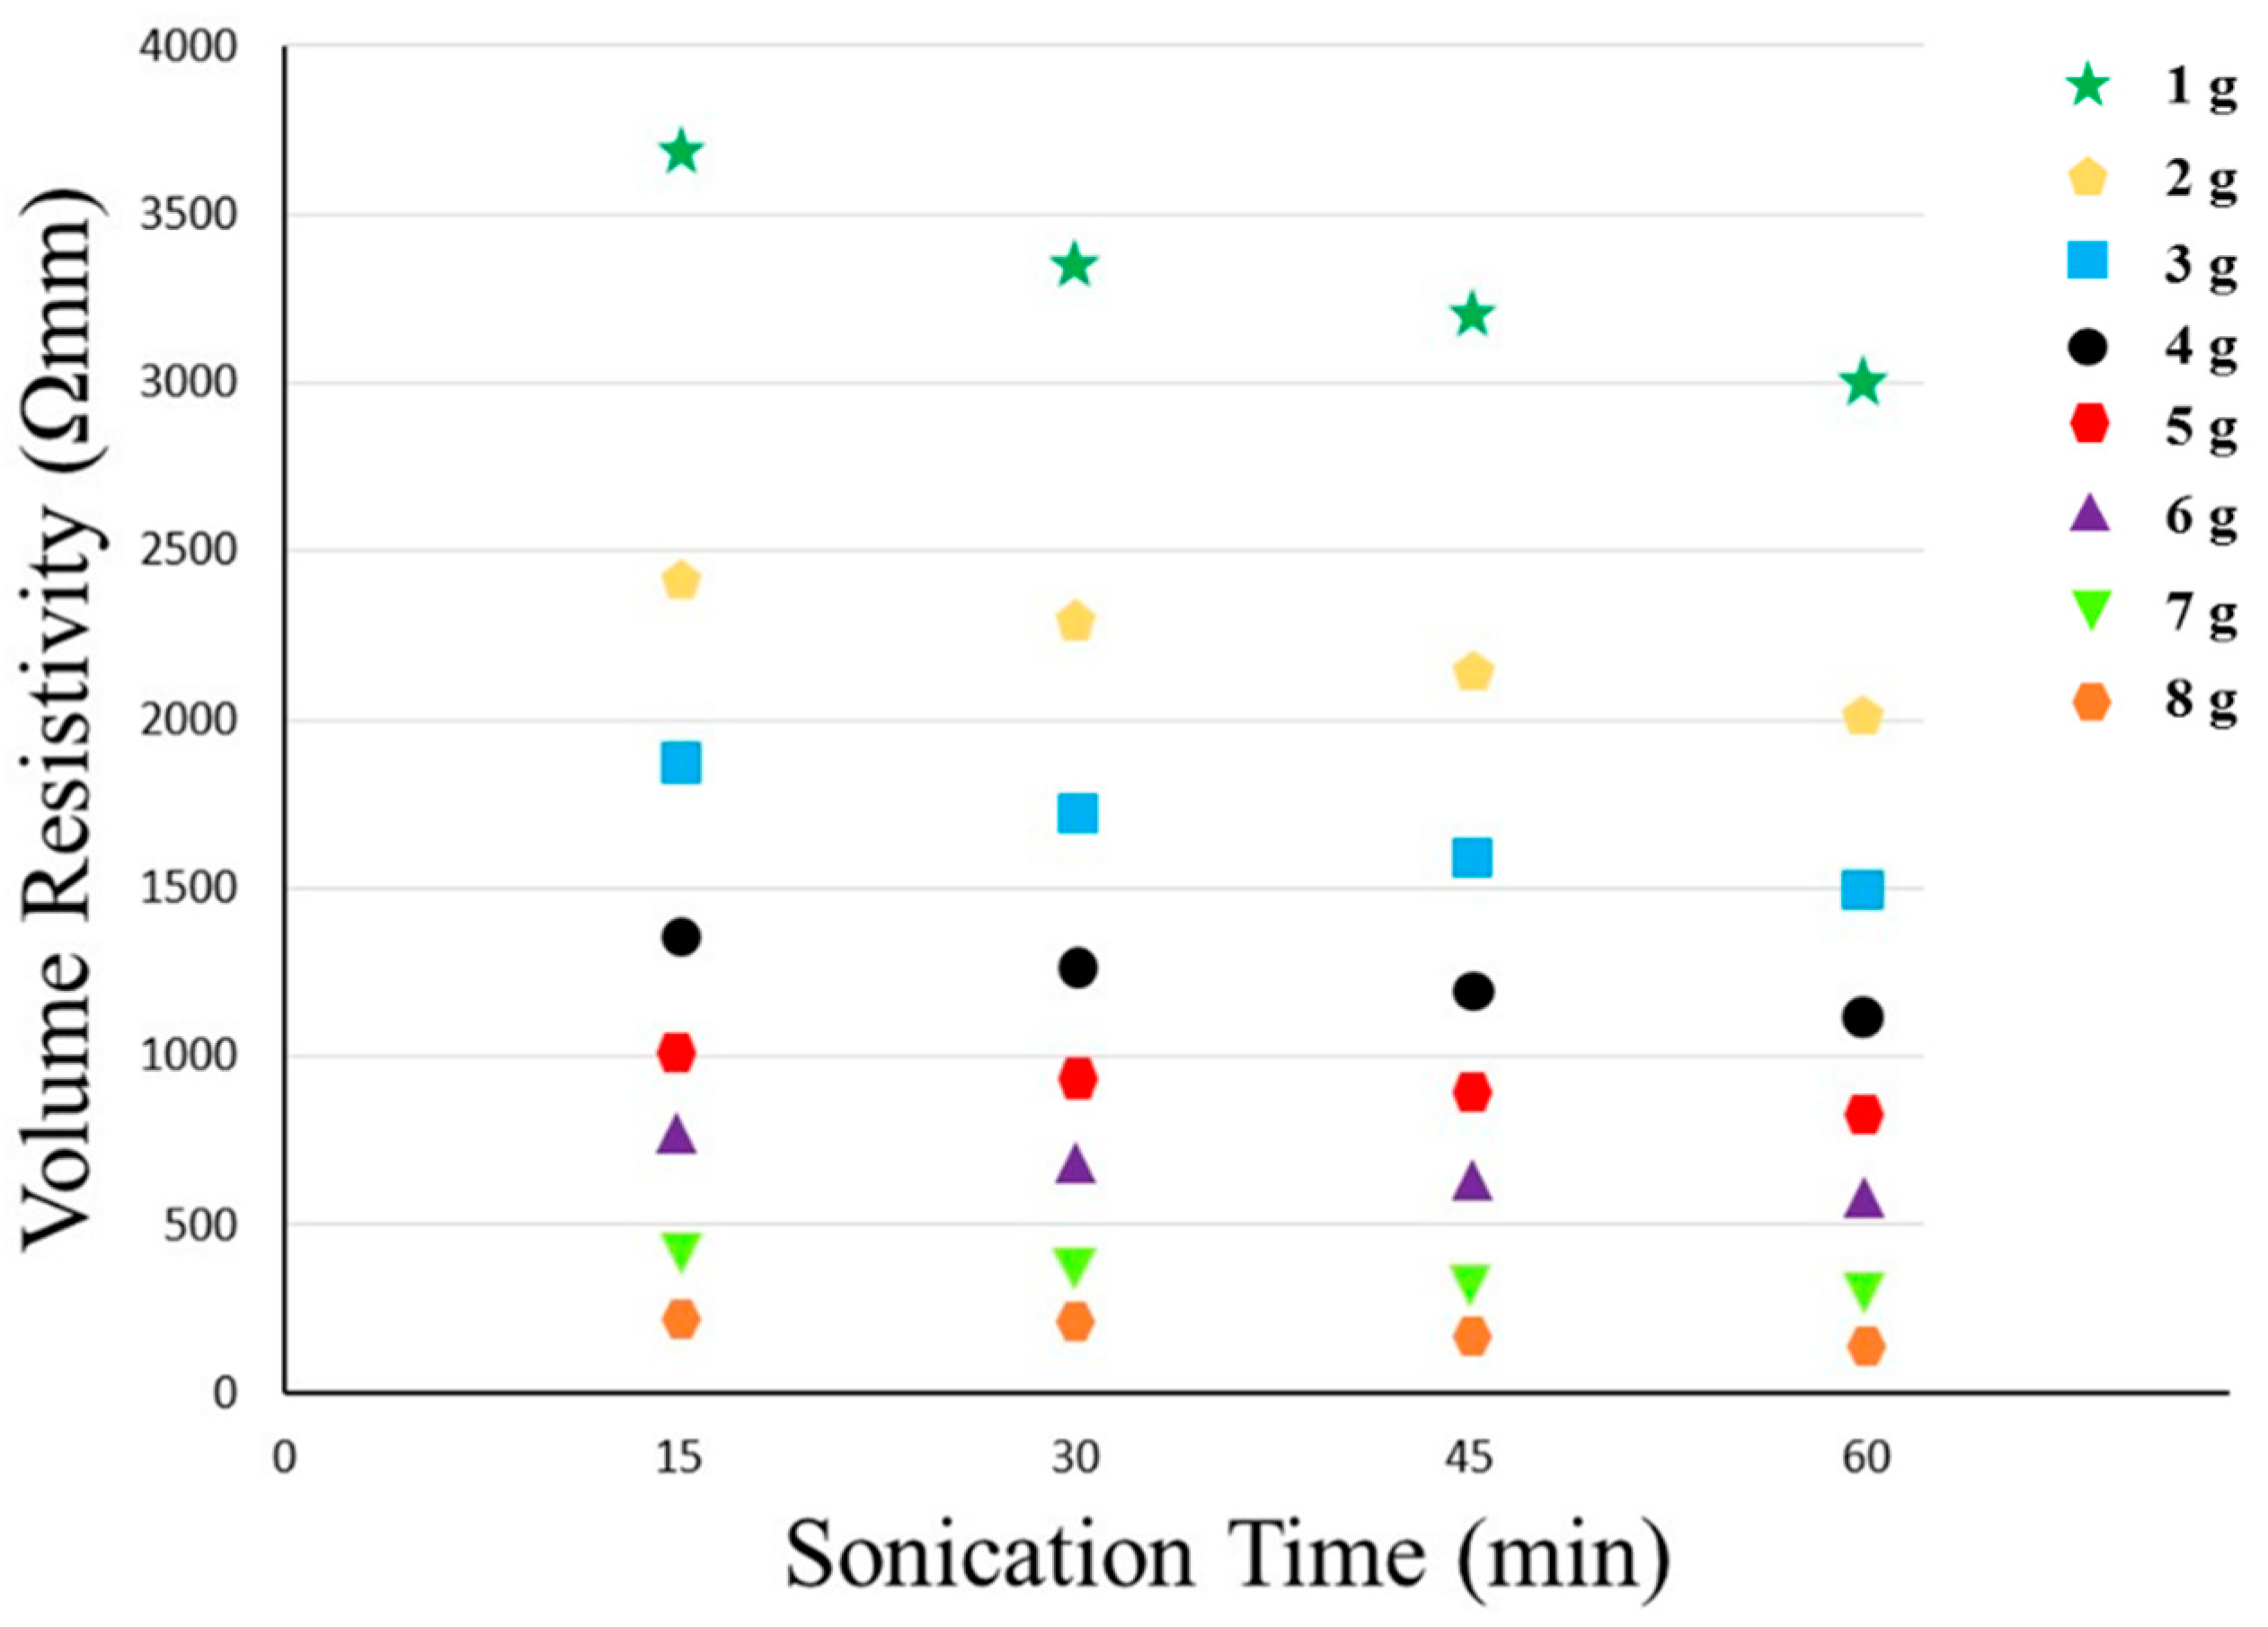
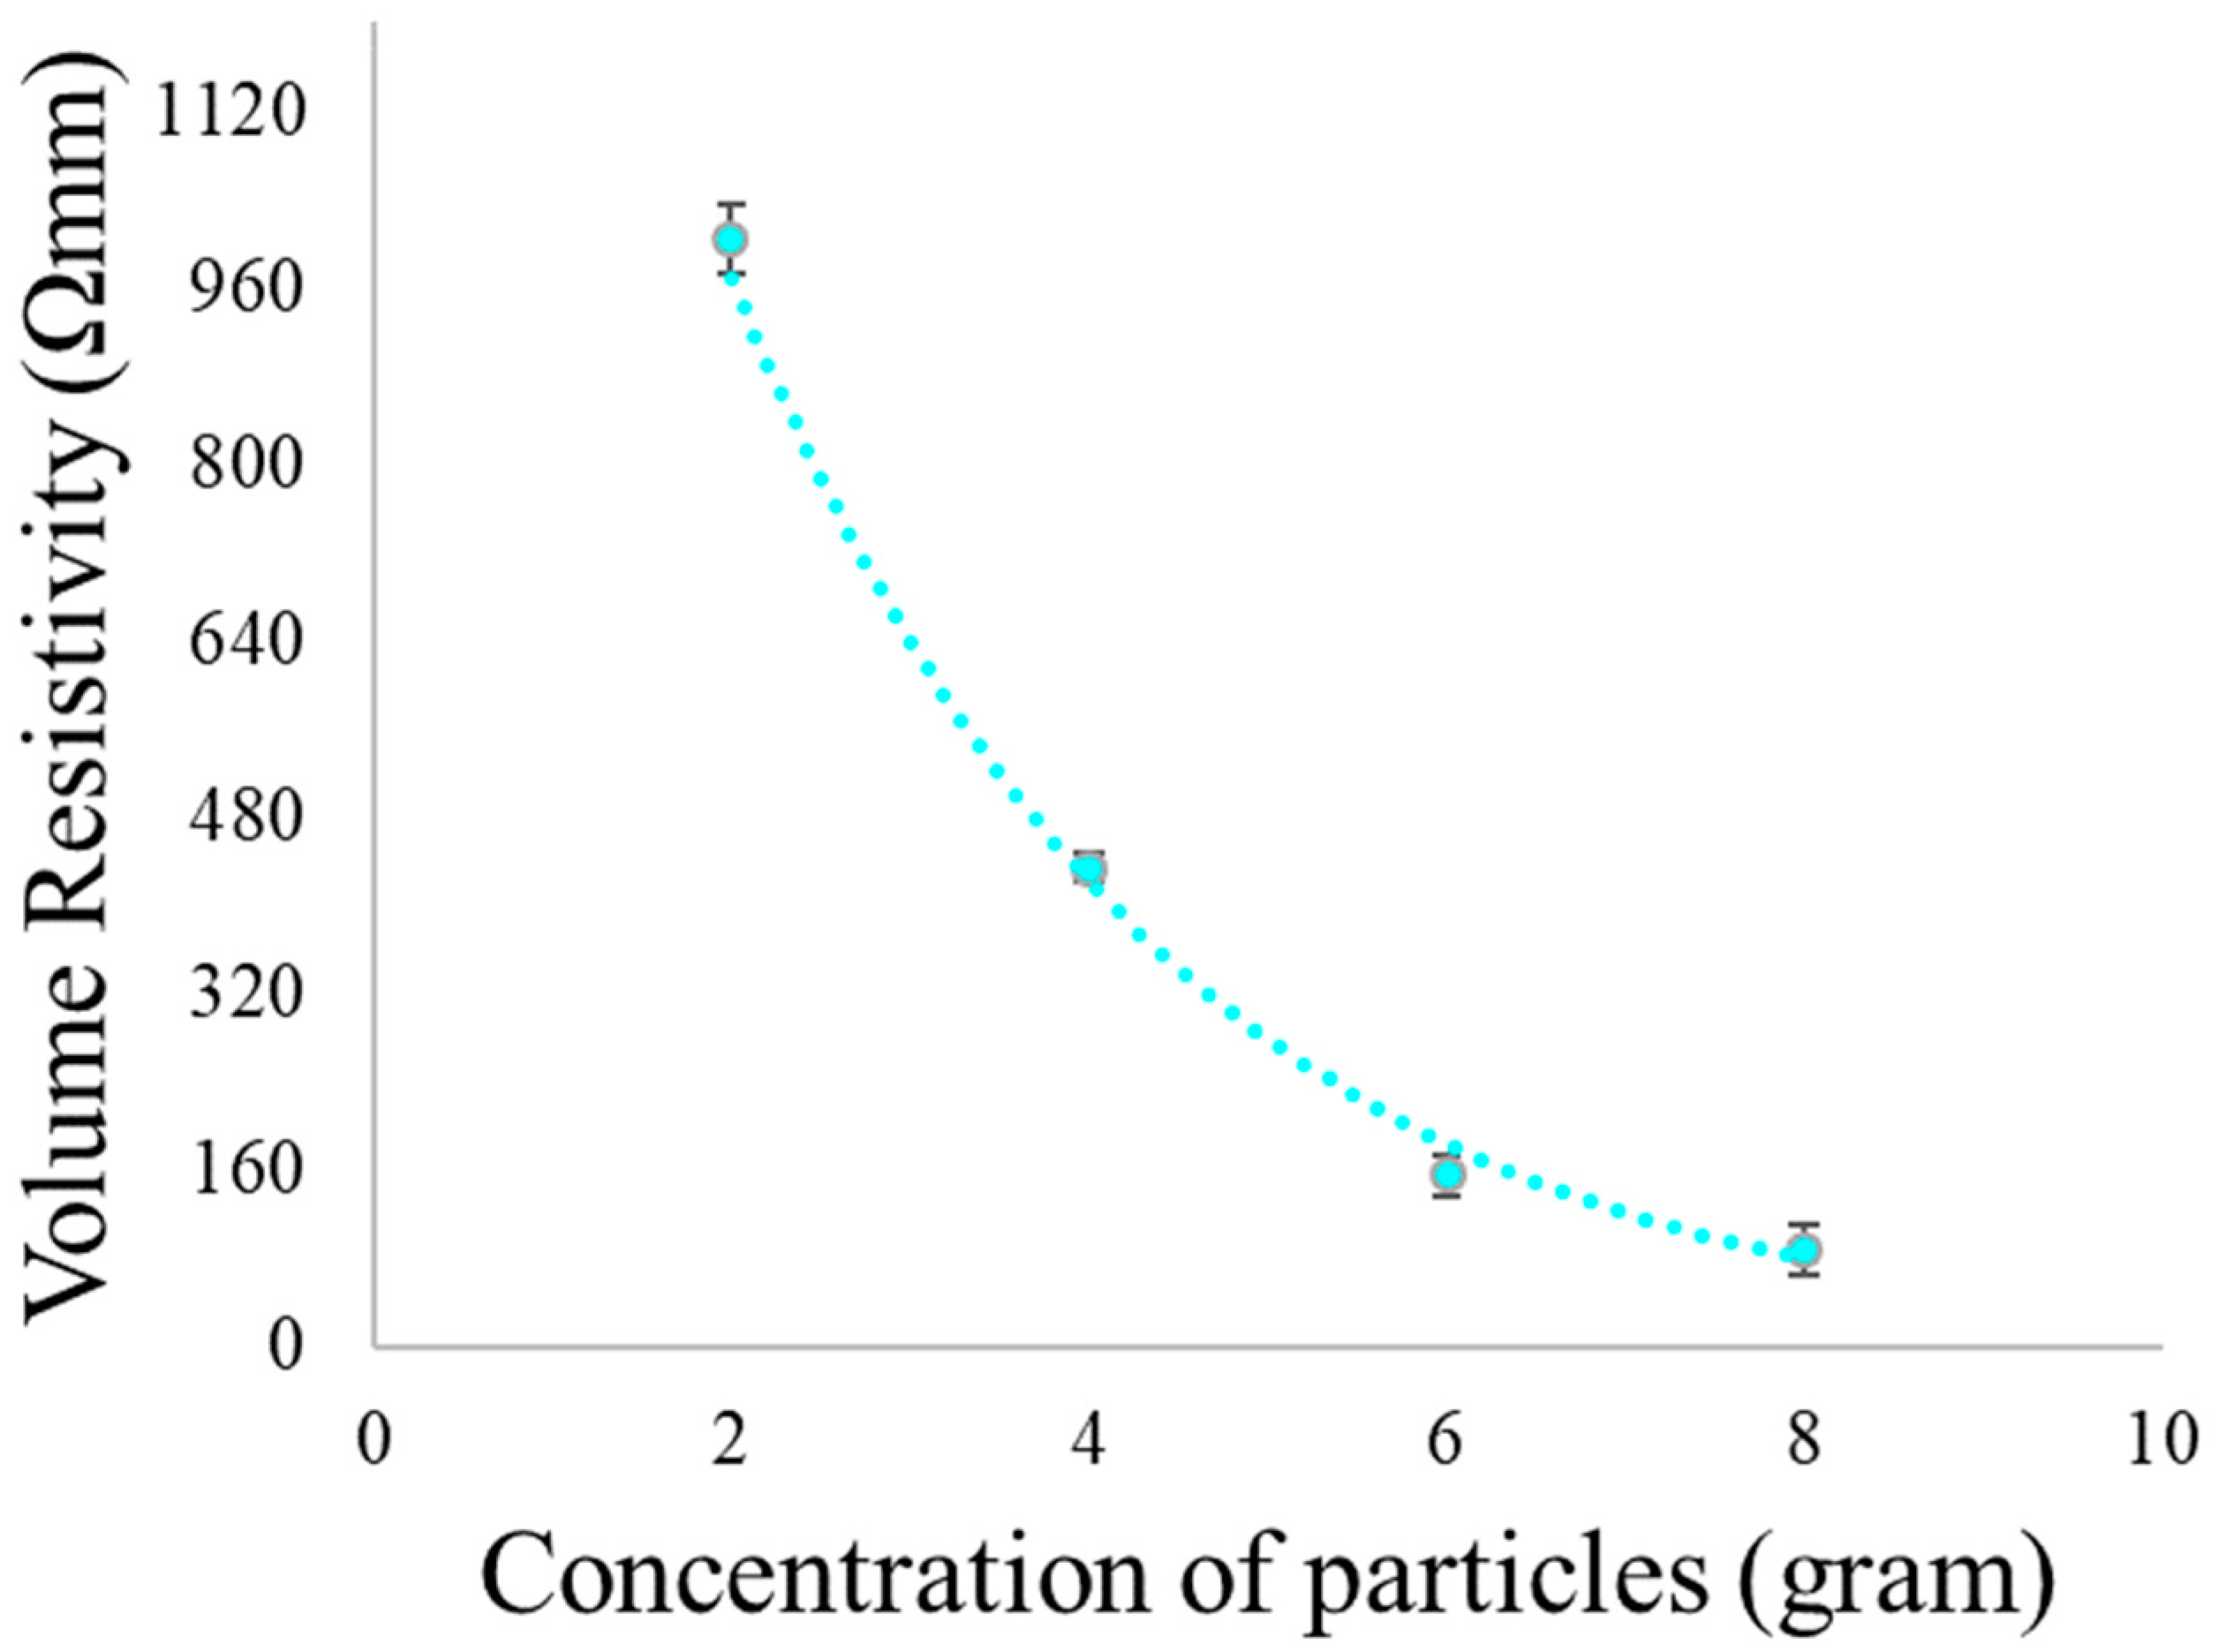
4.3.2. Electrical Resistivity of Conductive Paste and Composites
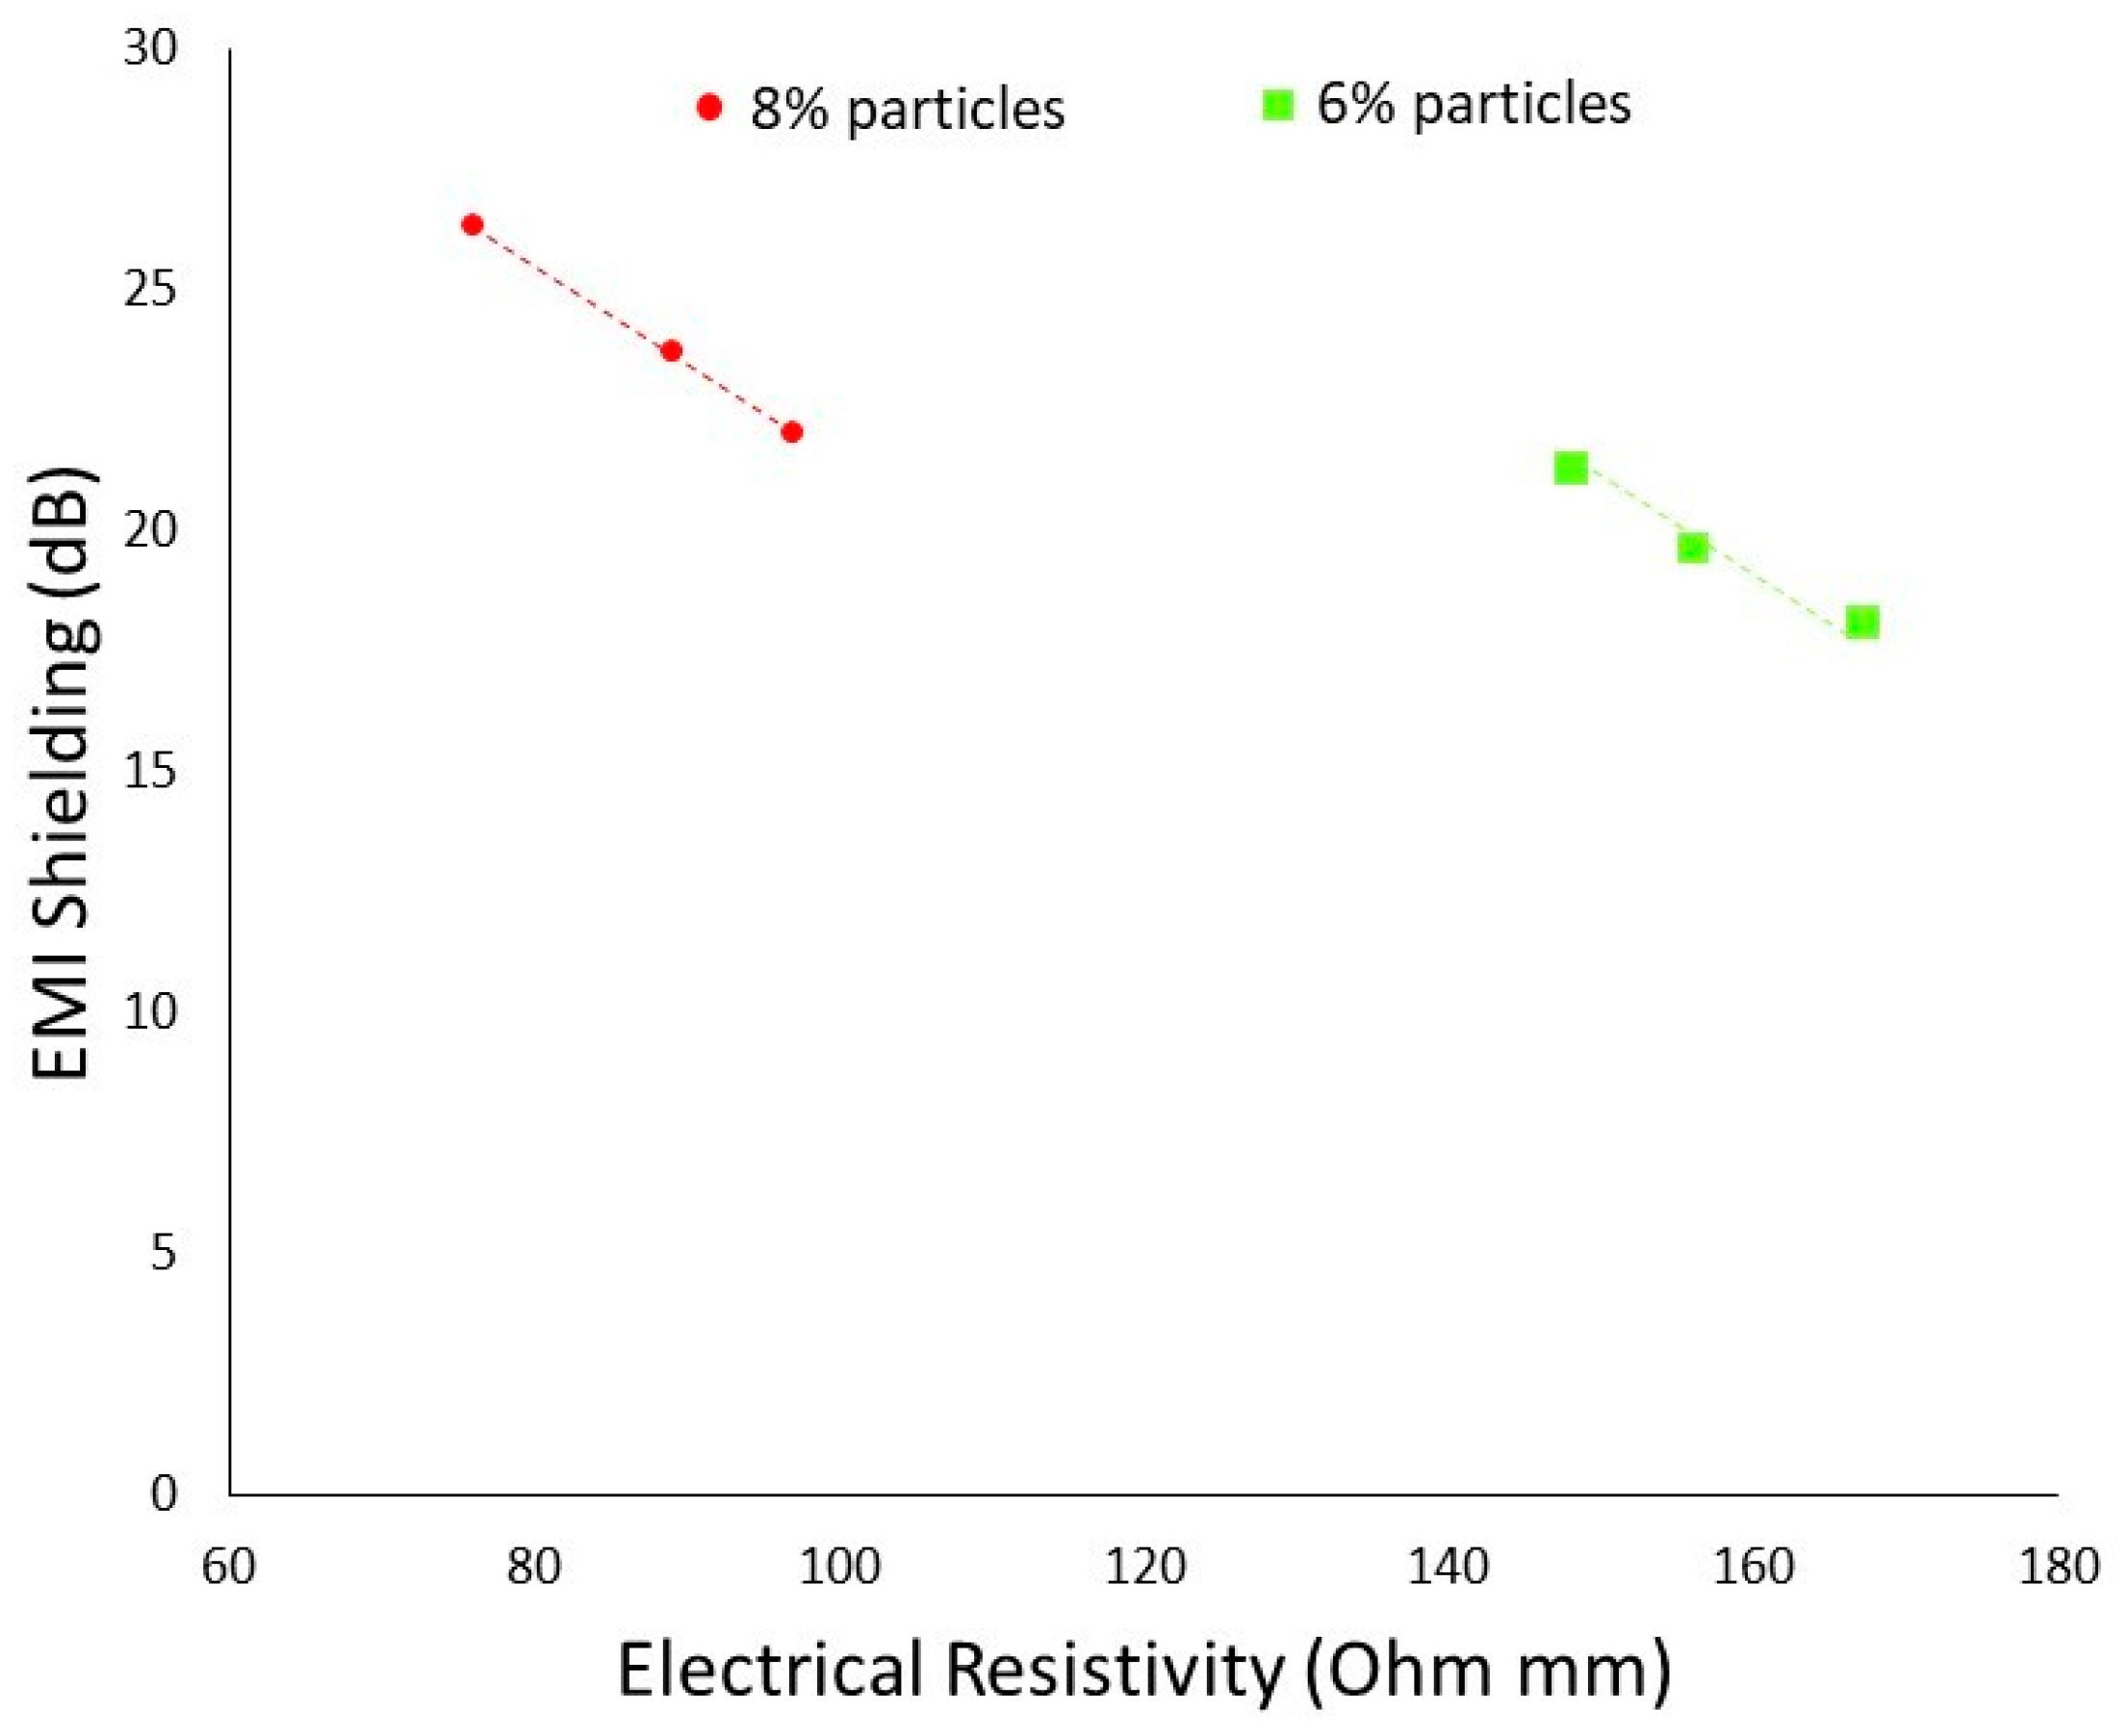
4.4. Electromagnetic Shielding of Fabricated Conductive Composites
4.4.1. Coaxial Transition Principle
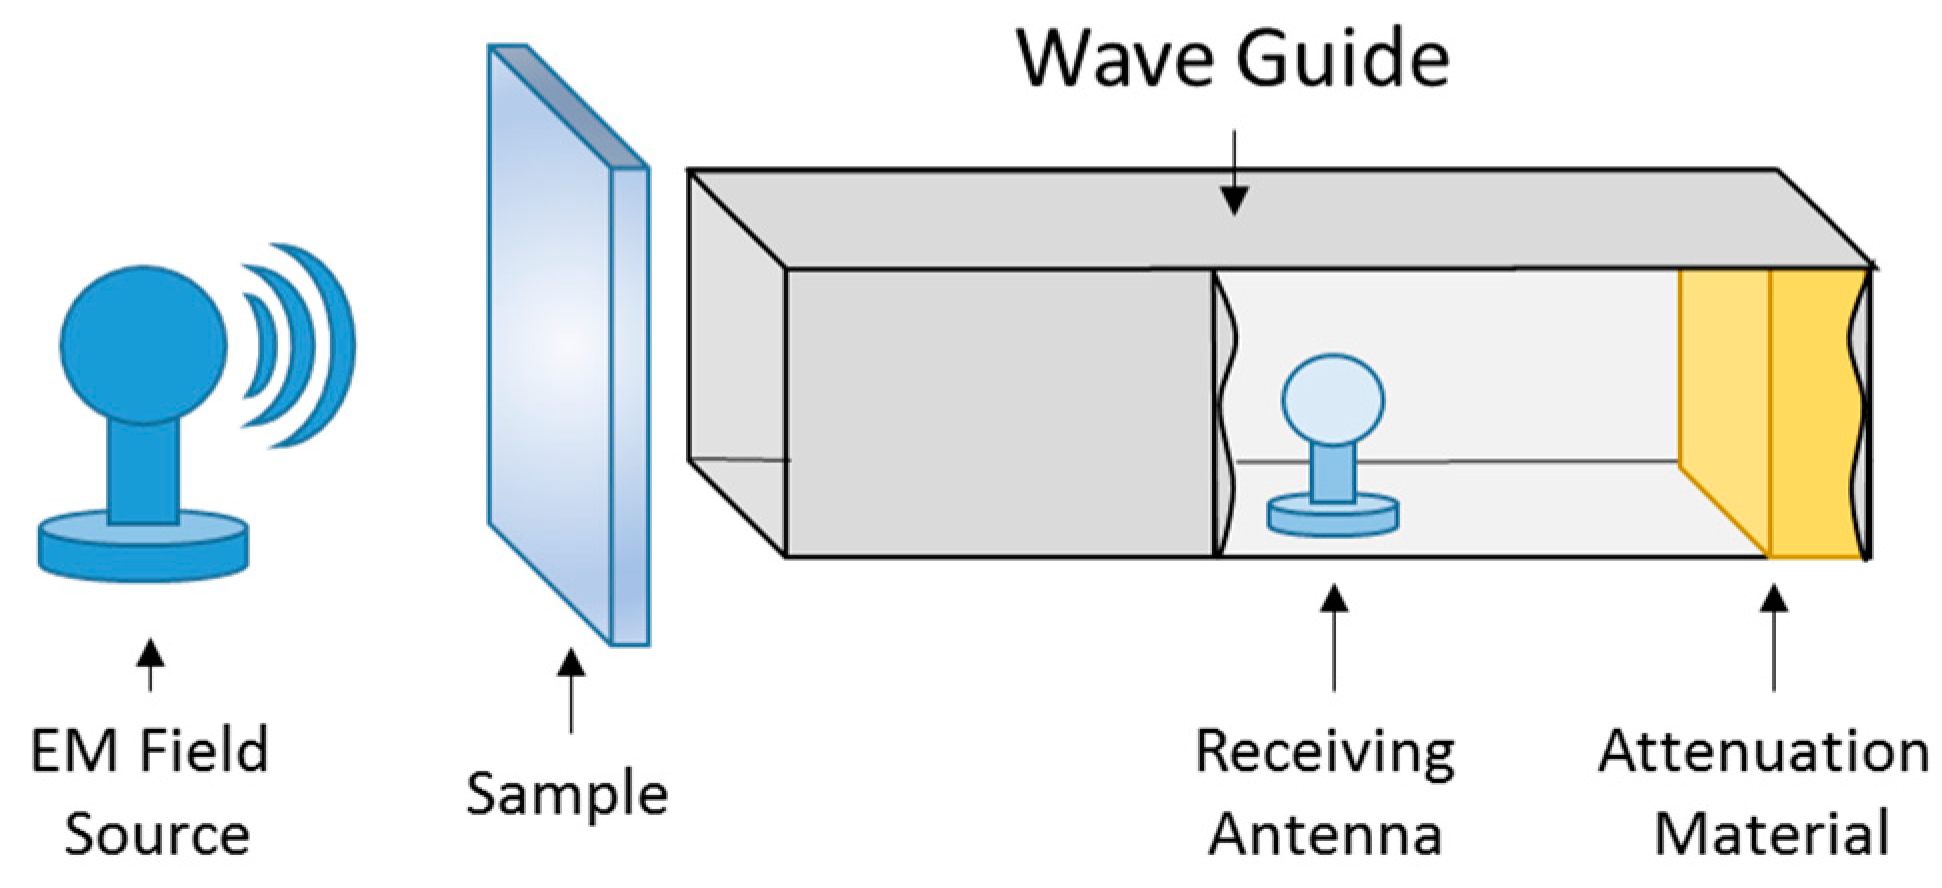
4.4.2. Waveguide Method
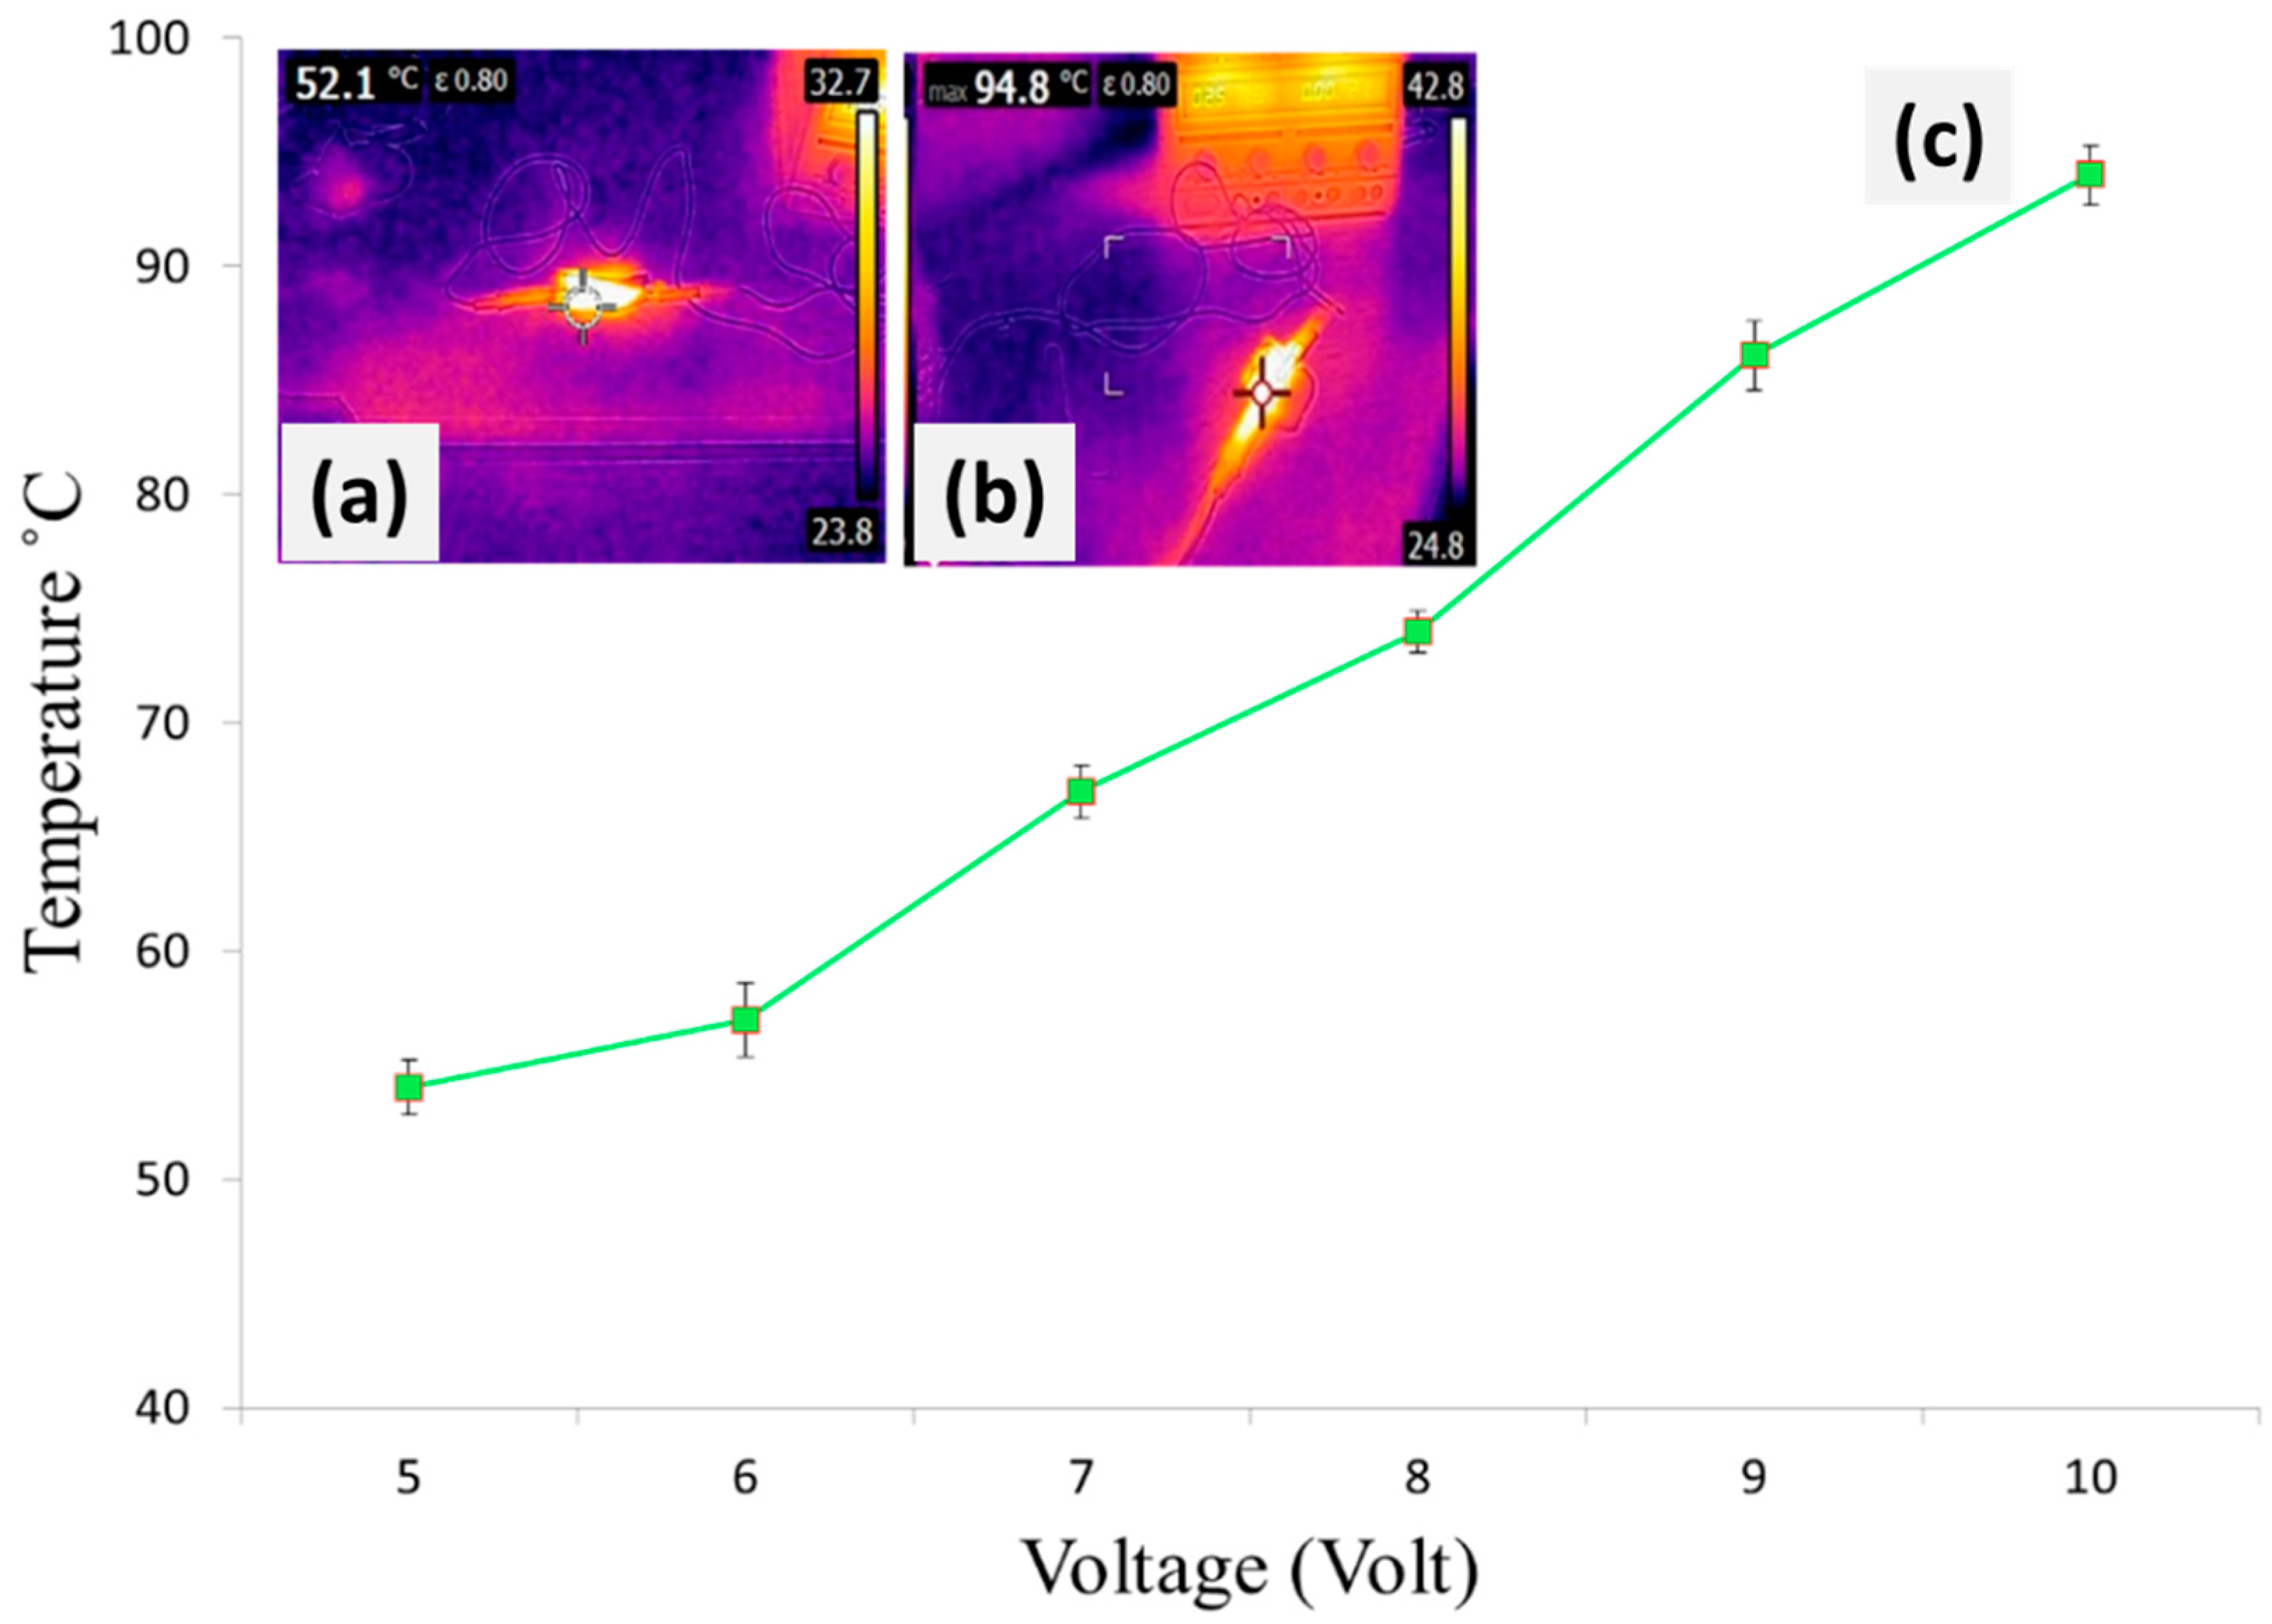
4.5. Heating Performance
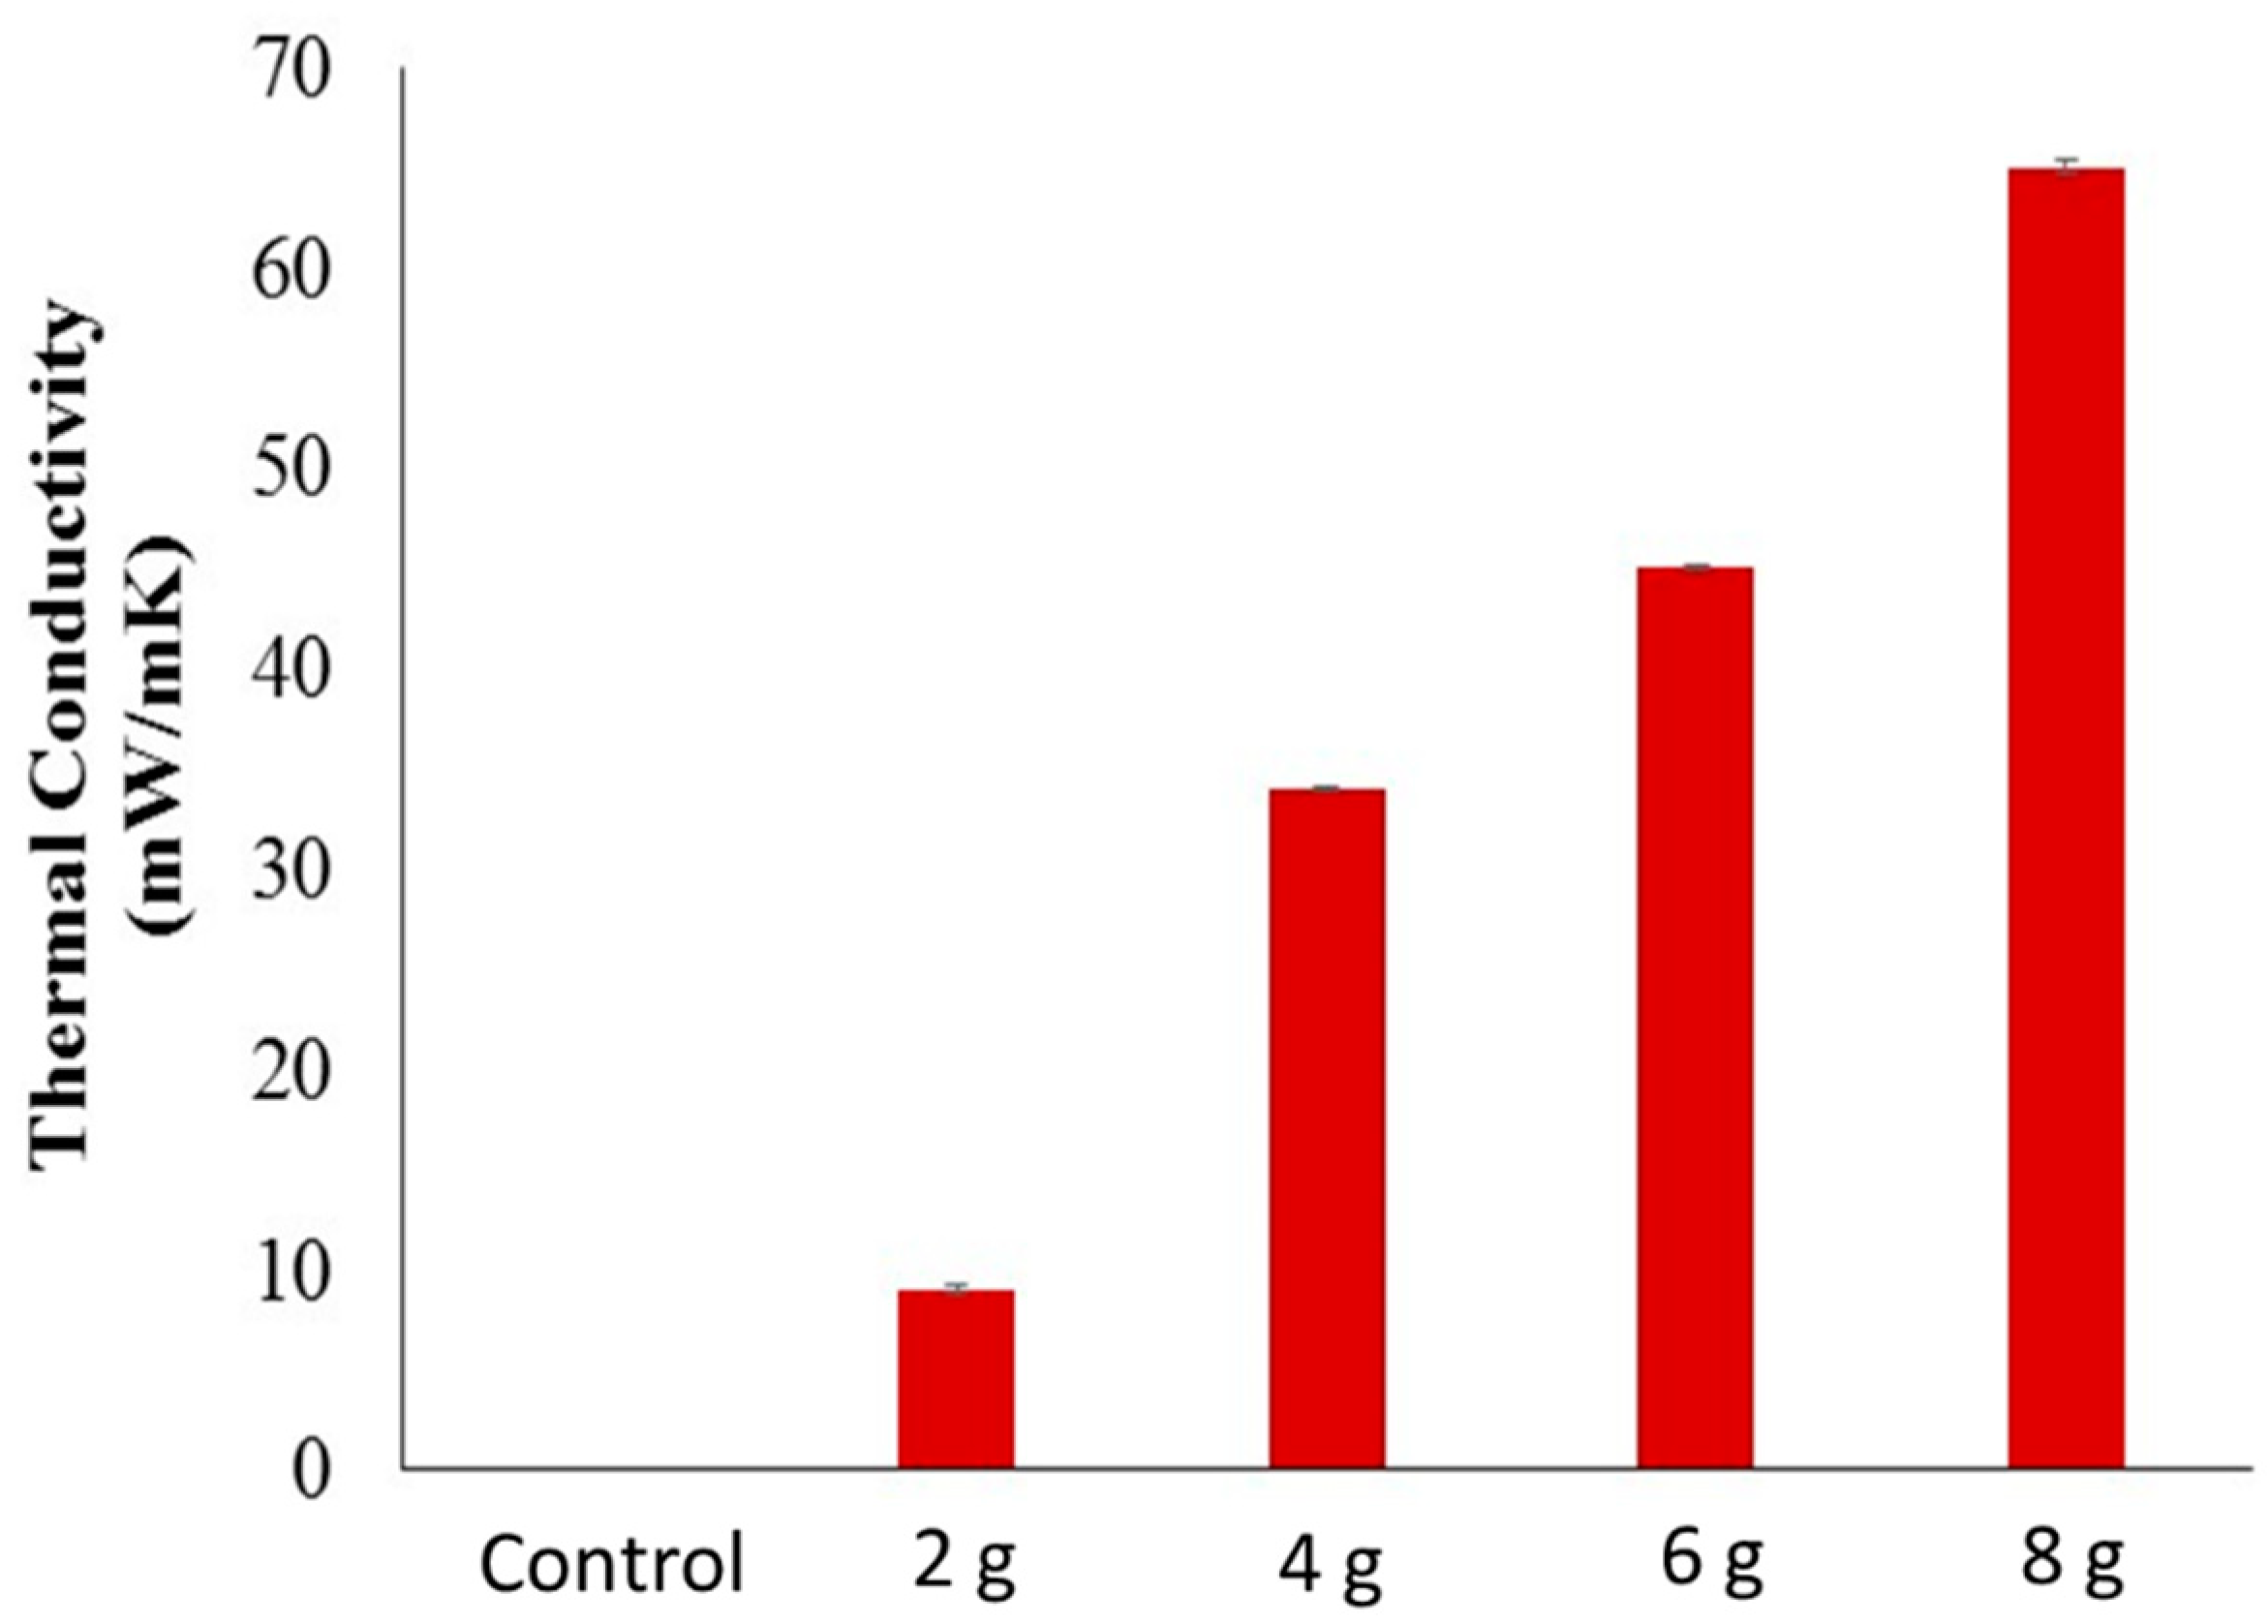
4.6. Thermal Conductivity
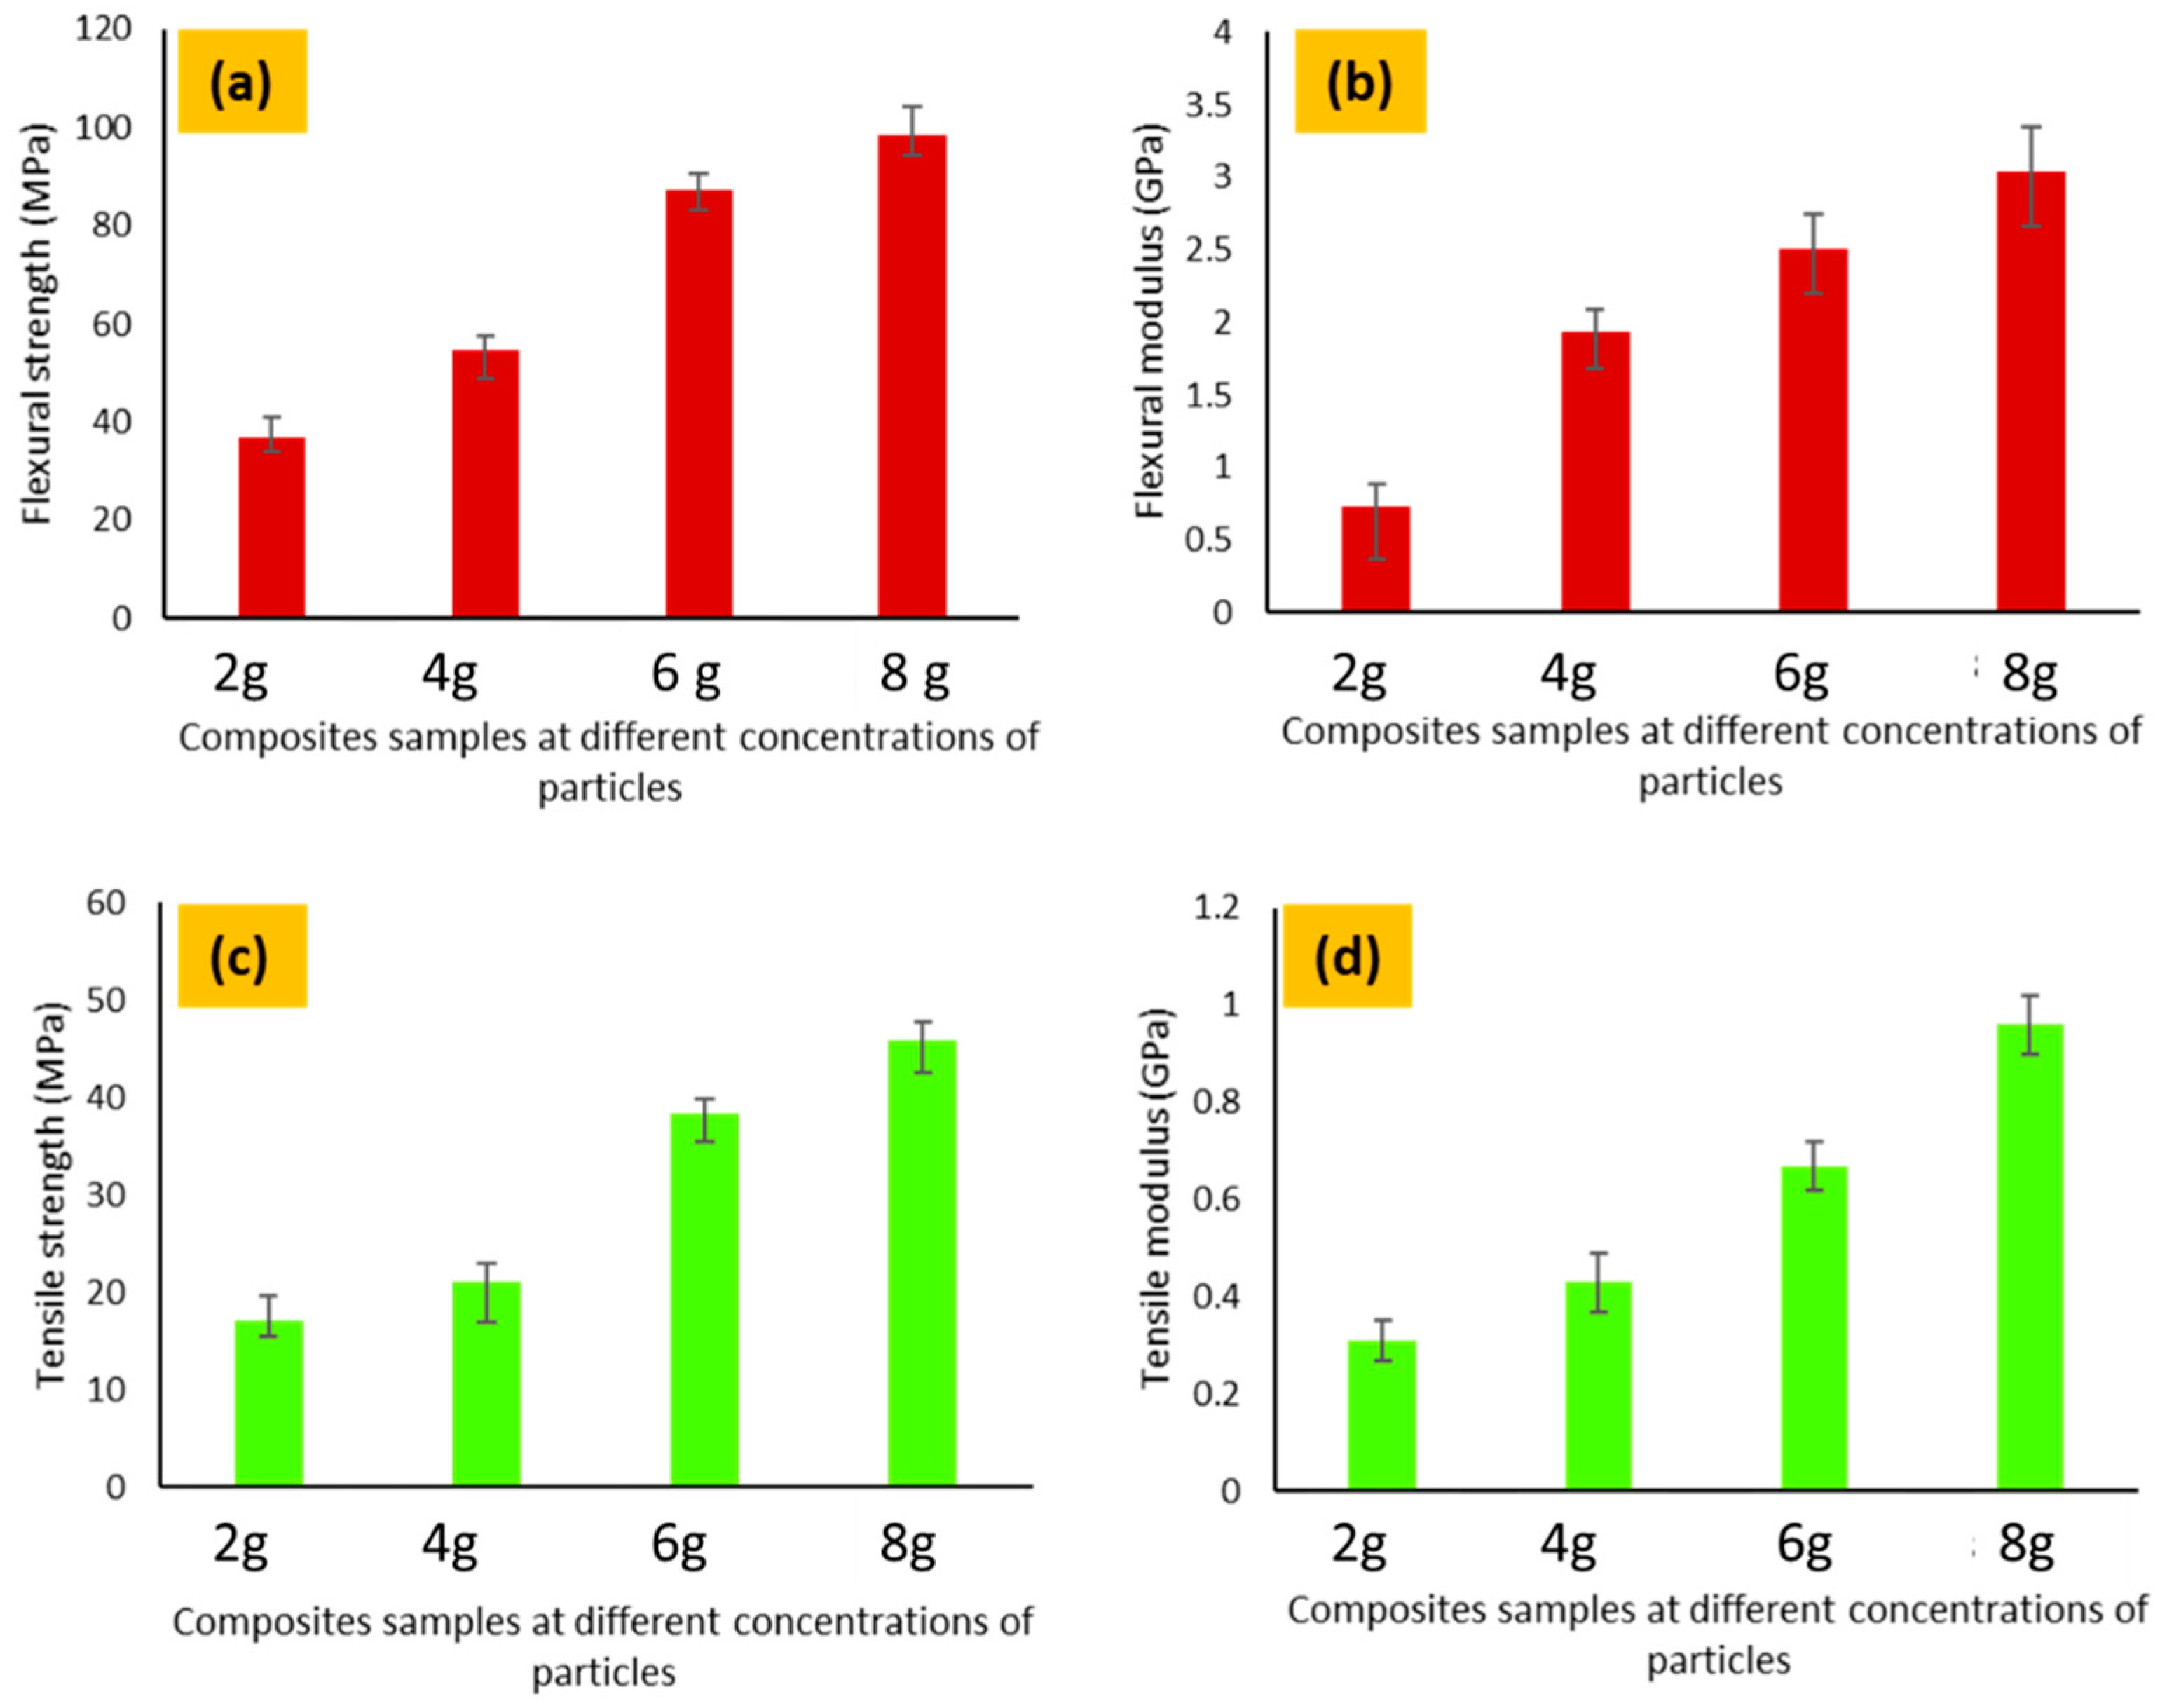
4.7. Mechanical Testing
5. Conclusions
Author Contributions
Funding
Institutional Review Board Statement
Informed Consent Statement
Data Availability Statement
Conflicts of Interest
References
- Ali, A.; Shaker, K.; Nawab, Y.; Jabbar, M.; Hussain, T.; Militky, J.; Baheti, V. Hydrophobic treatment of natural fibers and their composites—A review. J. Ind. Text. 2016, 47, 2153–2183. [Google Scholar] [CrossRef]
- Sapuan, S.M.; Pua, F.; El-Shekeil, Y.A.; AL-Oqla, F. Mechanical properties of soil buried kenaf fibre reinforced thermoplastic polyurethane composites. Mater. Des. 2013, 50, 467–470. [Google Scholar] [CrossRef] [Green Version]
- Ali1, A.; Shaker, K.; Nawab, Y.; Ashraf, M.; Basit, A.; Shahid, S.; Umair, M. Impact of hydrophobic treatment of jute on moisture regain and mechanical properties of composite material. J. Reinf. Plast. Compos. 2015, 34, 2059–2068. [Google Scholar] [CrossRef]
- Hsieh, C.-T.; Pan, Y.-J.; Lin, J.-H. Polypropylene/high-density polyethylene/carbon fiber composites: Manufacturing techniques, mechanical properties, and electromagnetic interference shielding effectiveness. Fibers Polym. 2017, 18, 155–161. [Google Scholar] [CrossRef]
- Ramanavicius, S.; Ramanavicius, A. Conducting Polymers in the Design of Biosensors and Biofuel Cells. Polymers 2021, 13, 49. [Google Scholar] [CrossRef] [PubMed]
- Kazemi, F.; Naghib, S.M.; Zare, Y.; Rhee, K.Y. Biosensing Applications of Polyaniline (PANI)-Based Nanocomposites: A Review. Polym. Rev. 2021, 61, 553–597. [Google Scholar] [CrossRef]
- Al-Oqla, F.M.; Sapuan, M.S.; Ishak, M.R.; Aziz, N.A. Selecting Natural Fibers for Bio-Based Materials with Conflicting Criteria. Am. J. Appl. Sci. 2015, 12, 64–71. [Google Scholar] [CrossRef] [Green Version]
- Mikinka, E.; Siwak, M. Recent advances in electromagnetic interference shielding properties of carbon-fibre-reinforced polymer composites—a topical review. J. Mater. Sci. Mater. Electron. 2021, 32, 24585–24643. [Google Scholar] [CrossRef]
- Choi, S.-M.; Shin, E.-J.; Zo, S.-M.; Rao, K.-M.; Seok, Y.-J.; Won, S.-Y.; Han, S.-S. Revised Manuscript with Corrections: Polyurethane-Based Conductive Composites: From Synthesis to Applications. Int. J. Mol. Sci. 2022, 23, 1938. [Google Scholar] [CrossRef]
- Wang, M.; Tang, X.-H.; Cai, J.-H.; Wu, H.; Shen, J.-B.; Guo, S.-Y. Construction, mechanism and prospective of conductive polymer composites with multiple interfaces for electromagnetic interference shielding: A review. Carbon 2021, 177, 377–402. [Google Scholar] [CrossRef]
- Hassan, T.; Salam, A.; Khan, A.; Khan, S.U.; Khanzada, H.; Wasim, M.; Khan, M.Q.; Kim, I.S. Functional nanocomposites and their potential applications: A review. J. Polym. Res. 2021, 28, 36. [Google Scholar] [CrossRef]
- Zhan, M.; Wool, R.P.; Xiao, J.Q. Electrical properties of chicken feather fiber reinforced epoxy composites. Compos. Part A Appl. Sci. Manuf. 2011, 42, 229–233. [Google Scholar] [CrossRef]
- Jia, W.; Segal, E.; Kornemandel, D.; Lamhot, Y.; Narkis, M.; Siegmann, A. Polyaniline–DBSA/organophilic clay nanocomposites: Synthesis and characterization. Synth. Met. 2003, 128, 115–120. [Google Scholar] [CrossRef]
- Hindermann-Bischoff, M. Electrical conductivity of carbon black–polyethylene composites Experimental evidence of the change of cluster connectivity in the PTC effect. Carbon 2001, 39, 375–382. [Google Scholar] [CrossRef]
- Raj, R.G.; Kokta, B.V.; Daneault, C. Wood flour as a low-cost reinforcing filler for polyethylene: Studies on mechanical properties. J. Mater. Sci. 1990, 25, 1851–1855. [Google Scholar] [CrossRef]
- Mohsin, M.E.A.; Arsad, A.; Gulrez, S.K.H.; Muhamad, Z.; Fouad, H.; Alothman, O.Y. Enhanced dispersion of carbon nanotubes in high density polyethylene matrix using secondary nanofiller and compatibilizer. Fibers Polym. 2015, 16, 129–137. [Google Scholar] [CrossRef]
- Bauhofer, W.; Kovacs, J.Z. A review and analysis of electrical percolation in carbon nanotube polymer composites. Compos. Sci. Technol. 2009, 69, 1486–1498. [Google Scholar] [CrossRef]
- Kim, Y.J.; Shin, T.S.; Choi, H.D.; Kwon, J.H.; Chung, Y.-C.; Yoon, H.G. Electrical conductivity of chemically modified multiwalled carbon nanotube/epoxy composites. Carbon 2005, 43, 23–30. [Google Scholar] [CrossRef]
- Kaur, G.; Adhikari, R.; Cass, P.; Bown, M.; Gunatillake, P. Electrically conductive polymers and composites for biomedical applications. RSC Adv. 2015, 5, 37553–37567. [Google Scholar] [CrossRef]
- Plackett, D.; Andersen, T.L.; Pedersen, W.B.; Nielsen, L. Biodegradable composites based on l-polylactide and jute fibers. Compos. Sci. Technol. 2003, 63, 1287–1296. [Google Scholar] [CrossRef]
- Militký, J.; Jabbar, A. Comparative evaluation of fiber treatments on the creep behavior of jute/green epoxy composites. Compos. Part B Eng. 2015, 80, 361–368. [Google Scholar] [CrossRef]
- Wei, X.-P.; Luo, Y.-L.; Xu, F.; Chen, Y.-S. Sensitive conductive polymer composites based on polylactic acid filled with multiwalled carbon nanotubes for chemical vapor sensing. Synth. Met. 2016, 215, 216–222. [Google Scholar] [CrossRef]
- Naeem, S.; Baheti, V.; Militky, J.; Ali, A. Multifunctional polylactic acid composites filled with activated carbon particles obtained from acrylic fibrous wastes. Polym. Compos. 2017, 40, 578–590. [Google Scholar] [CrossRef]
- Ho, M.-P.; Lau, K.-T.; Wang, H.; Hui, D. Improvement on the properties of polylactic acid (PLA) using bamboo charcoal particles. Compos. Part B Eng. 2015, 81, 14–25. [Google Scholar] [CrossRef]
- Ali, A.; Baheti, V.; Khan, M.Z.; Ashraf, M.; Militky, J. Development of electrically conductive composites based on recycled resources. J. Text. Inst. 2020, 111, 16–25. [Google Scholar] [CrossRef]
- Ali, A.; Nguyen, N.H.A.; Baheti, V.; Ashraf, M.; Militky, J.; Mansoor, T.; Noman, M.T.; Ahmad, S. Electrical conductivity and physiological comfort of silver coated cotton fabrics. J. Text. Inst. 2017, 109, 620–628. [Google Scholar] [CrossRef]
- Šafářová, V.; Tunakova, V.; Truhlář, M.; Militký, J. A new method and apparatus for evaluating the electromagnetic shielding effectiveness of textiles. Text. Res. J. 2016, 86, 44–56. [Google Scholar] [CrossRef]
- Wang, S.; Masoodi, R.; Brady, J.; George, B.R. Tensile Strength and Water Absorption Behavior of Recycled Jute-Epoxy Composites. J. Renew. Mater. 2013, 1, 279–288. [Google Scholar] [CrossRef]
- Behera, A.K.; Avancha, S.; Basak, R.K.; Sen, R.; Adhikari, B. Fabrication and characterizations of biodegradable jute reinforced soy based green composites. Carbohydr. Polym. 2012, 88, 329–335. [Google Scholar] [CrossRef]
- Ramasamy, N.; Arumugam, V.; Rajkumar, S. Surface modification of Kevlar fibre fabric and its influence on the properties of Kevlar/epoxy composites. Bull. Mater. Sci. 2019, 42, 173. [Google Scholar] [CrossRef] [Green Version]
- Cao, M.S.; Song, W.L.; Hou, Z.L.; Wen, B.; Yuan, J. The effect of temperatures and frequency on the dielectric property, electromagnetic interference and microwave absoroption of short carbon fiber/silica composites. Carbon 2010, 48, 788. [Google Scholar] [CrossRef]
- Watts, P.C.P.; Ponnampalam, D.R.; Hsu, W.K.; Barnes, A.; Chambers, B. The Complex Pemitivity of Multiwalled Carbon nano tube-polystyrene composite films in X-bands. Chem. Phys. Lett. 2003, 378, 609–614. [Google Scholar] [CrossRef]
- Ali, A.; Baheti, V.; Javaid, M.U.; Militky, J. Enhancement in ageing and functional properties of copper-coated fabrics by subsequent electroplating. Appl. Phys. A 2018, 124, 651. [Google Scholar] [CrossRef]
- Ugale, A.D.; Jagtap, R.V.; Pawar, D.; Datar, S.; Kale, S.N.; Alegaonkar, P.S. Nano-carbon: Preparation, Assessment, and Applications for NH3 Gas Sensor and Electromagnetic Interference Shielding. RSC Adv. 2016, 6, 97266–97275. [Google Scholar] [CrossRef]
- Ali, A.; Baheti, V.; Militky, J.; Khan, Z.; Tunakova, V.; Naeem, S. Copper coated multifunctional cotton fabrics. J. Ind. Text. 2018, 48, 448–464. [Google Scholar] [CrossRef]
- Hsieh, C.-T.; Pan, Y.-J.; Lou, C.-W.; Huang, C.-L.; Lin, Z.I.; Liao, J.-M.; Lin, J.-H. Polylactic acid/carbon fiber composites: Effects of functionalized elastomers on mechanical properties, thermal behavior, surface compatibility, and electrical characteristics. Fibers Polym. 2016, 17, 615–623. [Google Scholar] [CrossRef]
- Li, W.; Liu, L.; Shen, B. Effect of Ni-coated short carbon fibers on the mechanical and electrical properties of epoxy composites. Fibers Polym. 2013, 14, 1515–1520. [Google Scholar] [CrossRef]


| No of Composites Samples | Treatment | Sample ID | Concentrations of Carbon Particles (Grams) |
|---|---|---|---|
| 1 | Chemical treatment | CH1 | 2 |
| 2 | CH2 | 4 | |
| 3 | CH3 | 6 | |
| 4 | CH4 | 8 | |
| 5 | untreated | C5 | 0 |
Publisher’s Note: MDPI stays neutral with regard to jurisdictional claims in published maps and institutional affiliations. |
© 2022 by the authors. Licensee MDPI, Basel, Switzerland. This article is an open access article distributed under the terms and conditions of the Creative Commons Attribution (CC BY) license (https://creativecommons.org/licenses/by/4.0/).
Share and Cite
Ali, A.; Hussain, F.; Tahir, M.F.; Ali, M.; Zaman Khan, M.; Tomková, B.; Militky, J.; Noman, M.T.; Azeem, M. Fabrication of Conductive, High Strength and Electromagnetic Interference (EMI) Shielded Green Composites Based on Waste Materials. Polymers 2022, 14, 1289. https://doi.org/10.3390/polym14071289
Ali A, Hussain F, Tahir MF, Ali M, Zaman Khan M, Tomková B, Militky J, Noman MT, Azeem M. Fabrication of Conductive, High Strength and Electromagnetic Interference (EMI) Shielded Green Composites Based on Waste Materials. Polymers. 2022; 14(7):1289. https://doi.org/10.3390/polym14071289
Chicago/Turabian StyleAli, Azam, Fiaz Hussain, Muhammad Farrukh Tahir, Majid Ali, Muhammad Zaman Khan, Blanka Tomková, Jiri Militky, Muhammad Tayyab Noman, and Musaddaq Azeem. 2022. "Fabrication of Conductive, High Strength and Electromagnetic Interference (EMI) Shielded Green Composites Based on Waste Materials" Polymers 14, no. 7: 1289. https://doi.org/10.3390/polym14071289