
Effect of CuO and Graphene on PTFE Microfibers: Experimental and Modeling Approaches

 ,
,  and
and
Abstract
:
1. Introduction
2. Materials and Methods
2.1. CuO Nanoparticles Preparation Method
2.2. Preparation of the PTFE/CuO/G Nanocomposite
2.3. Characterization Techniques
2.4. Calculation Details
3. Results
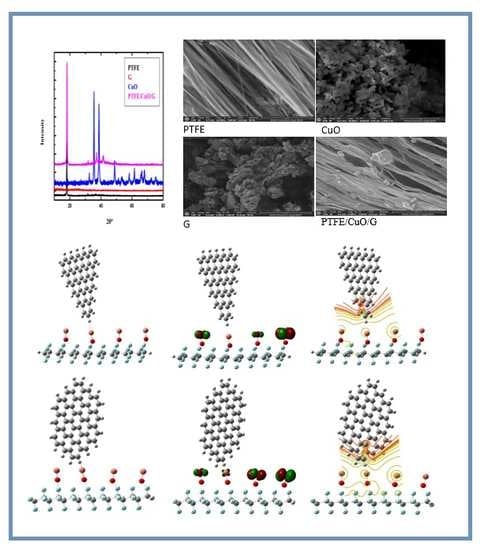
3.1. Characterization Result of the PTFE/CuO/G Composite
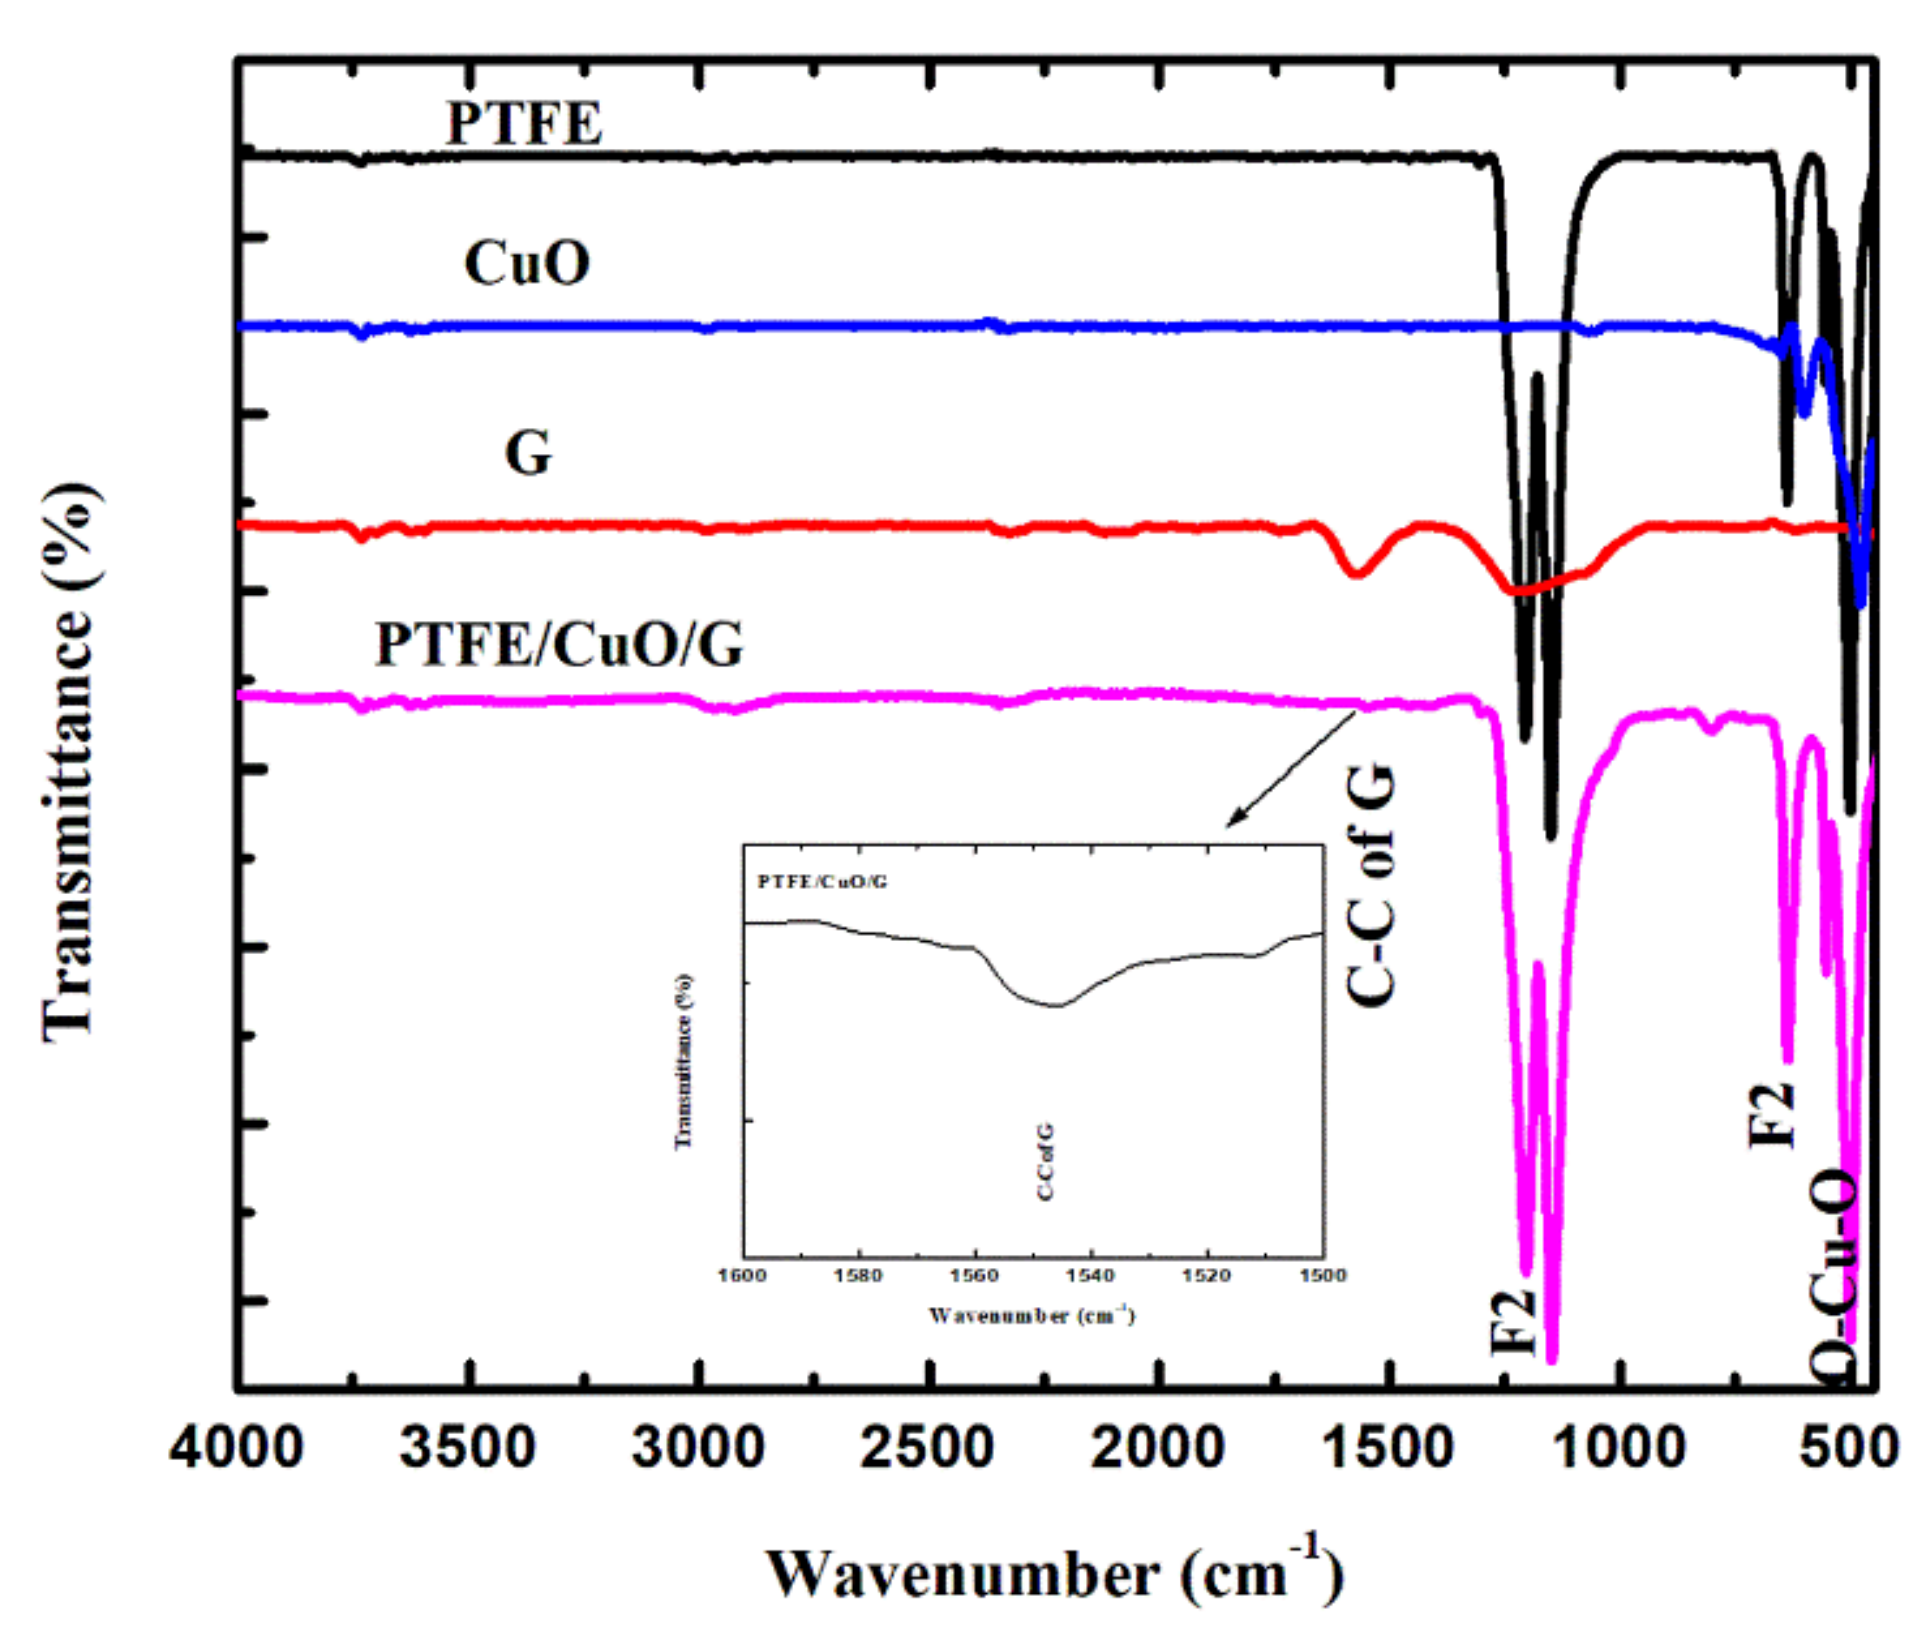
3.1.1. FTIR Result
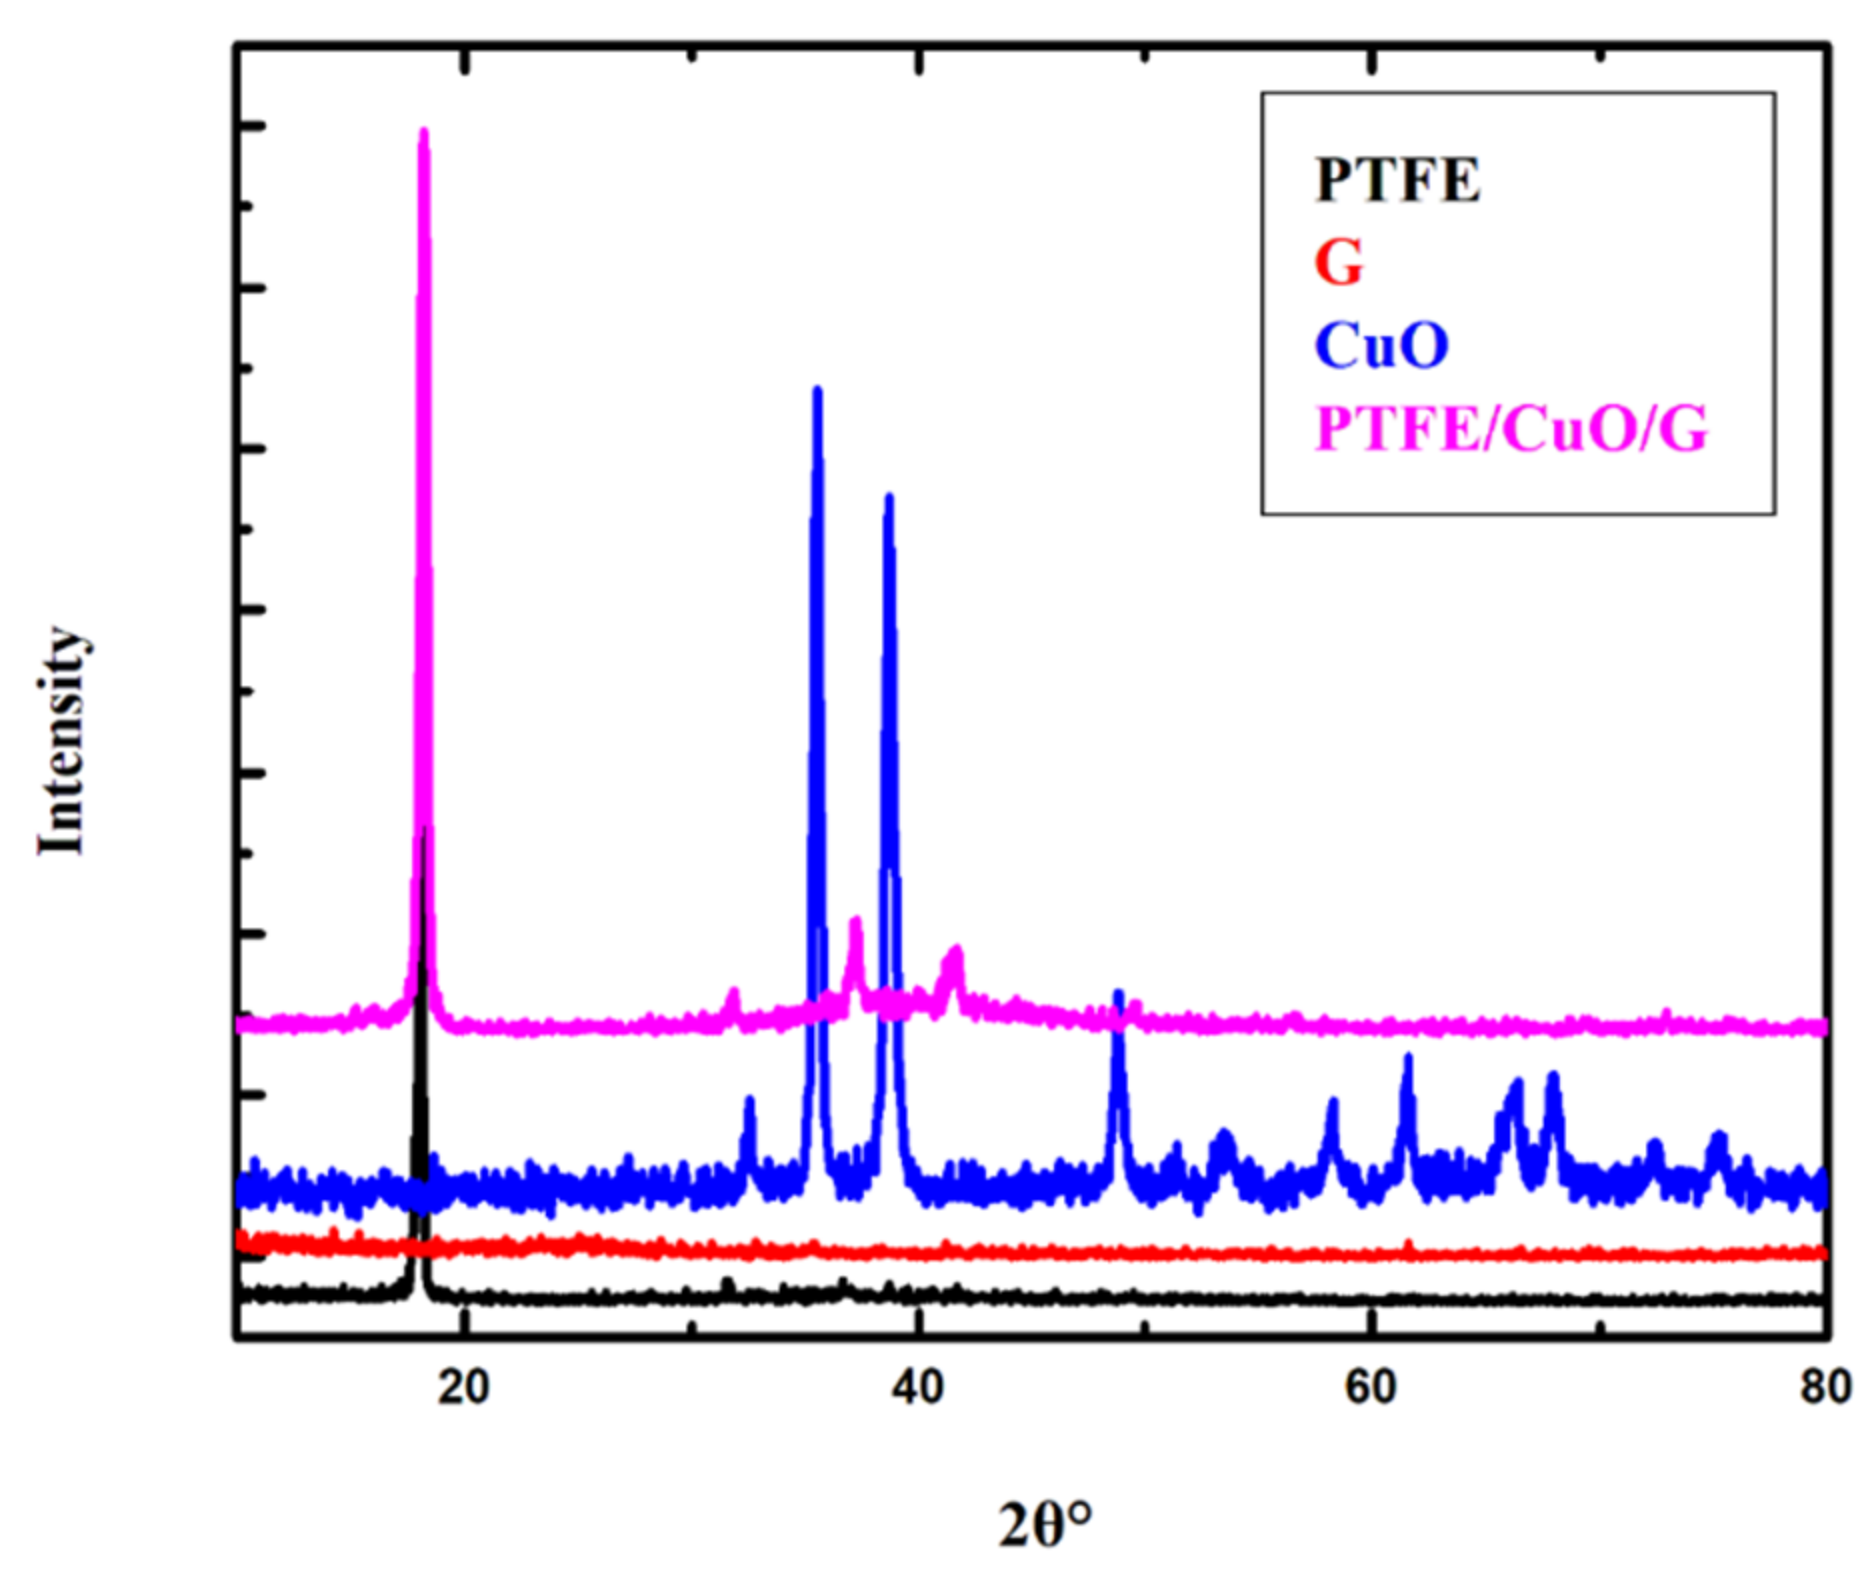
3.1.2. XRD Result
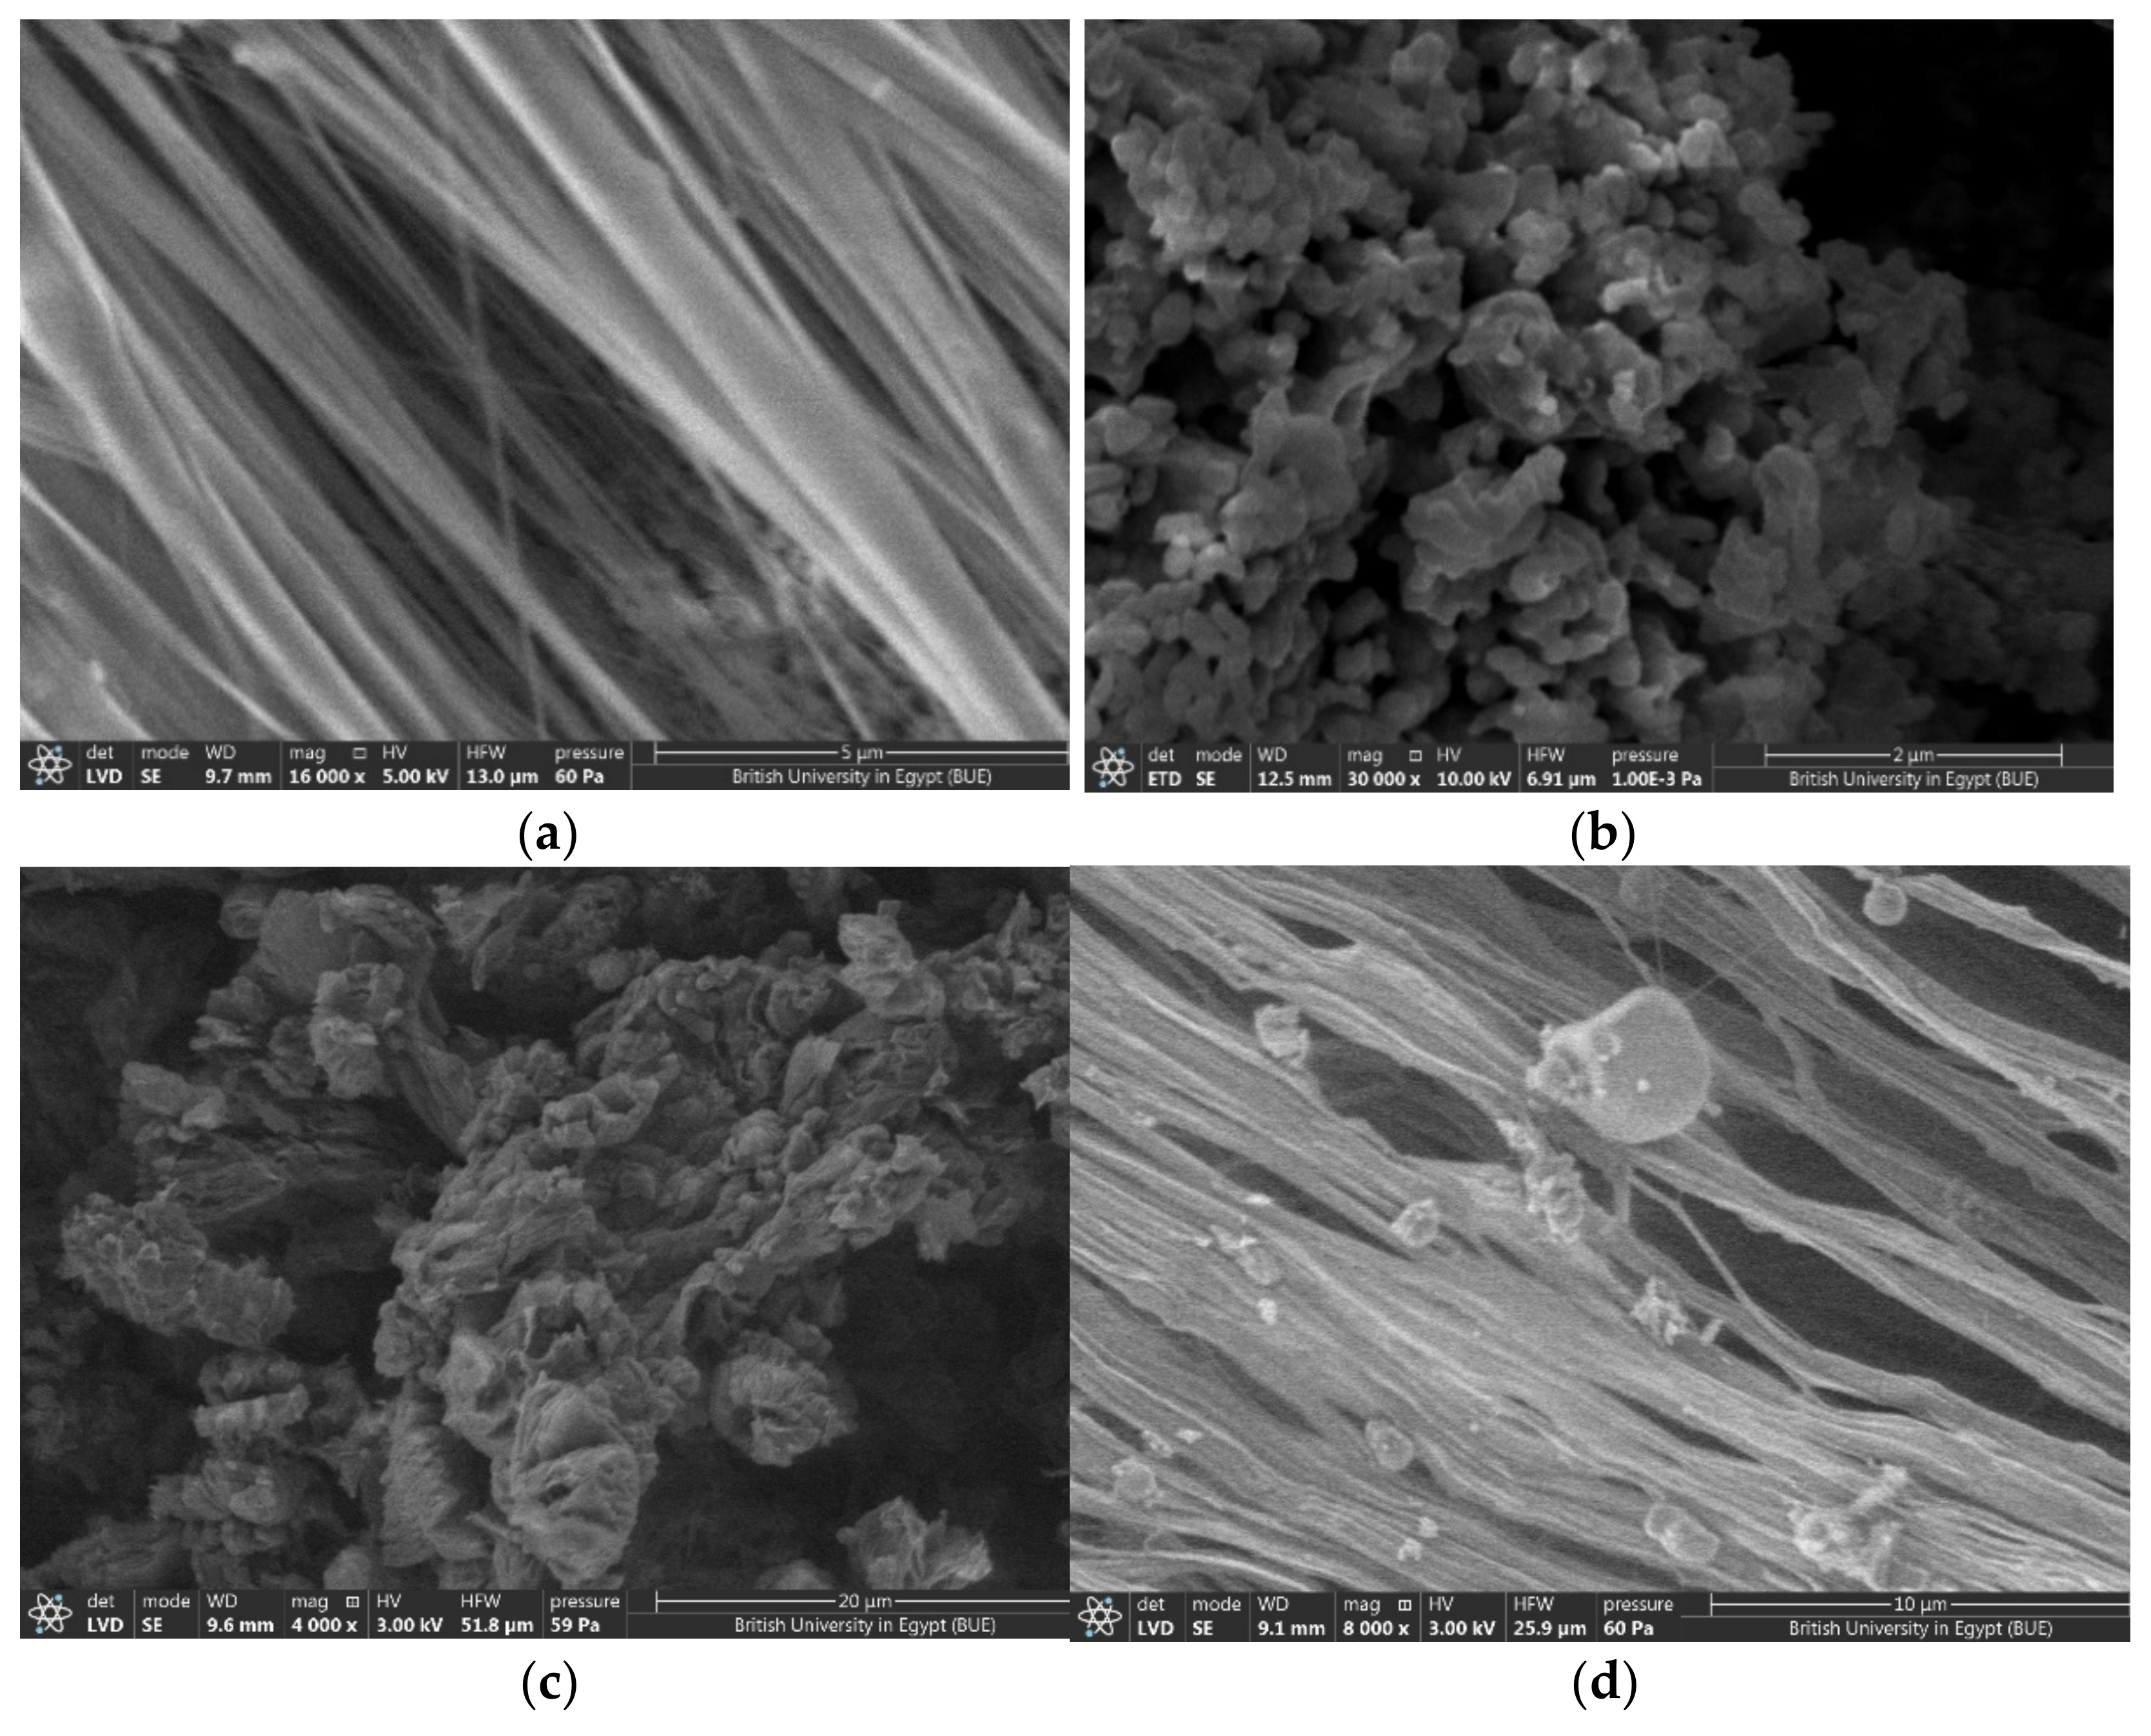
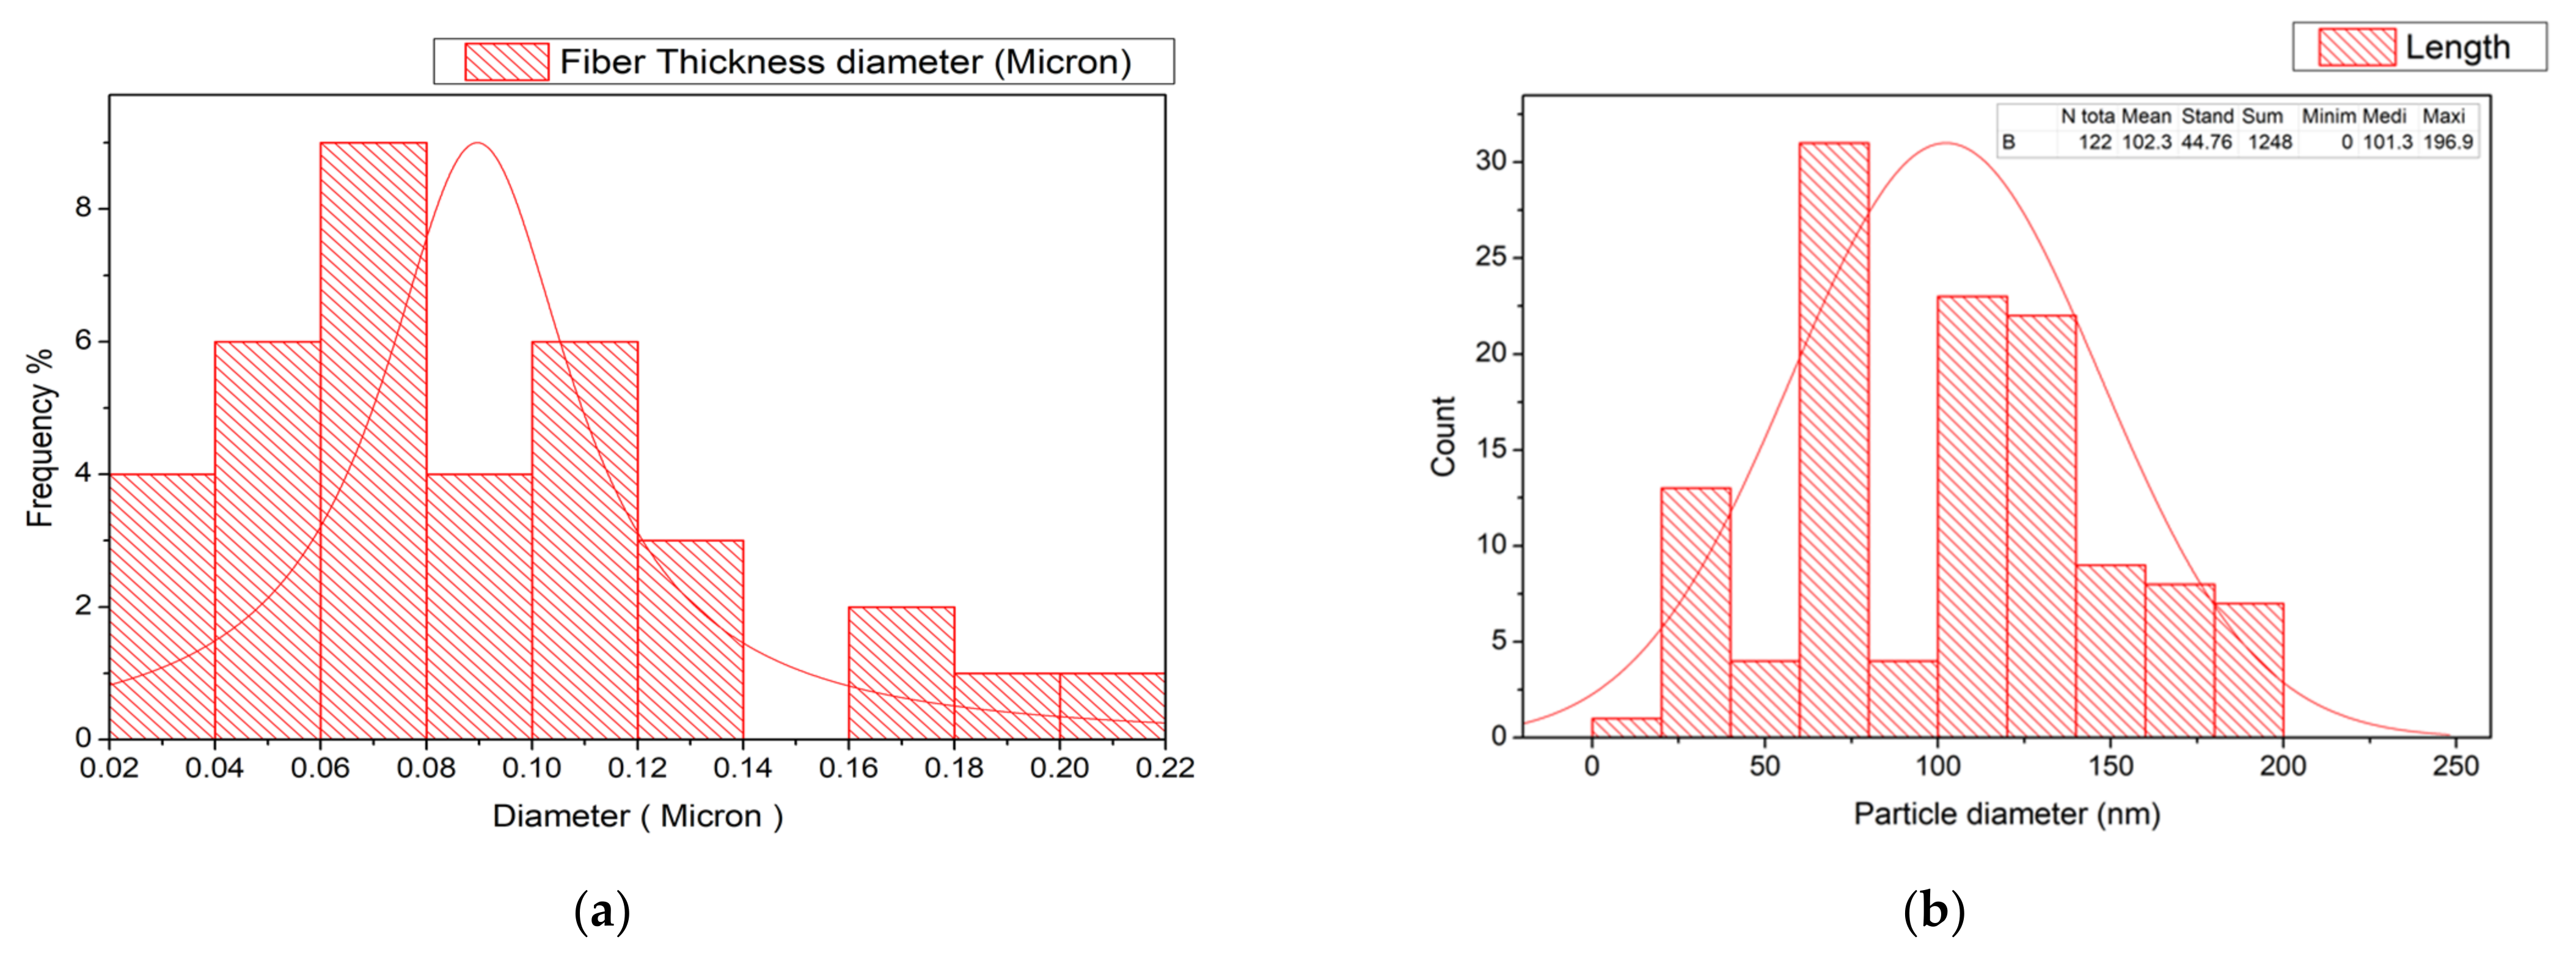
3.1.3. SEM Result
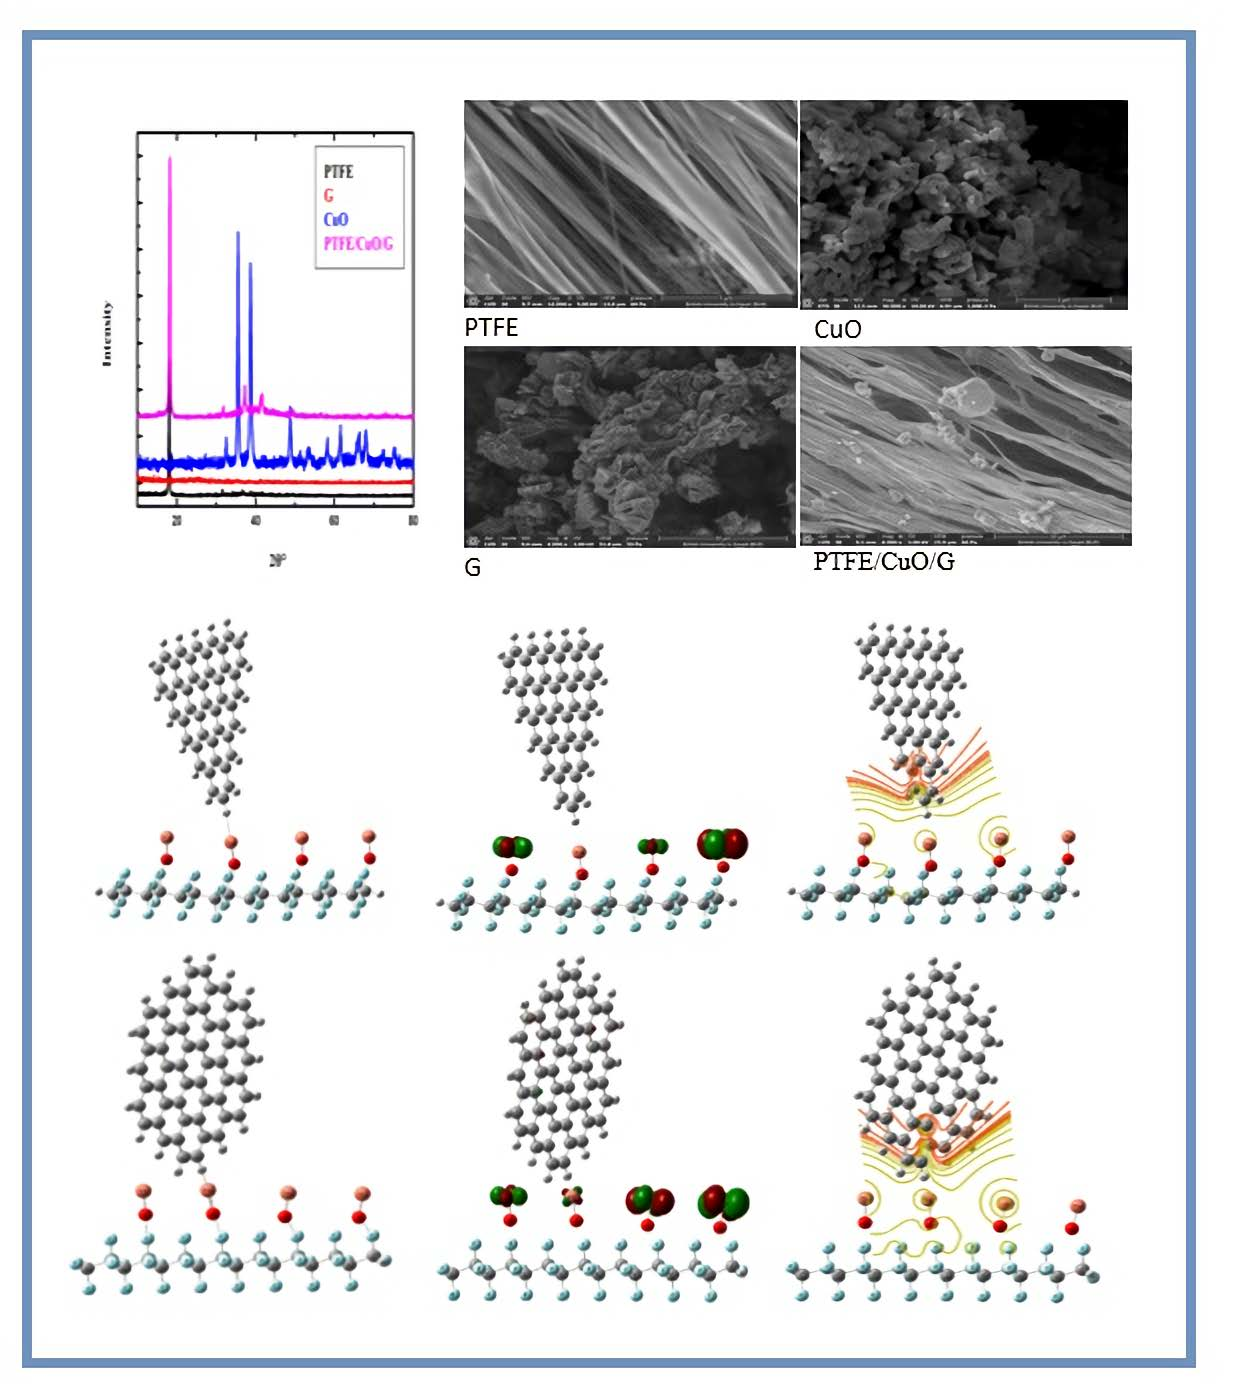
3.2. Designed Model Structures
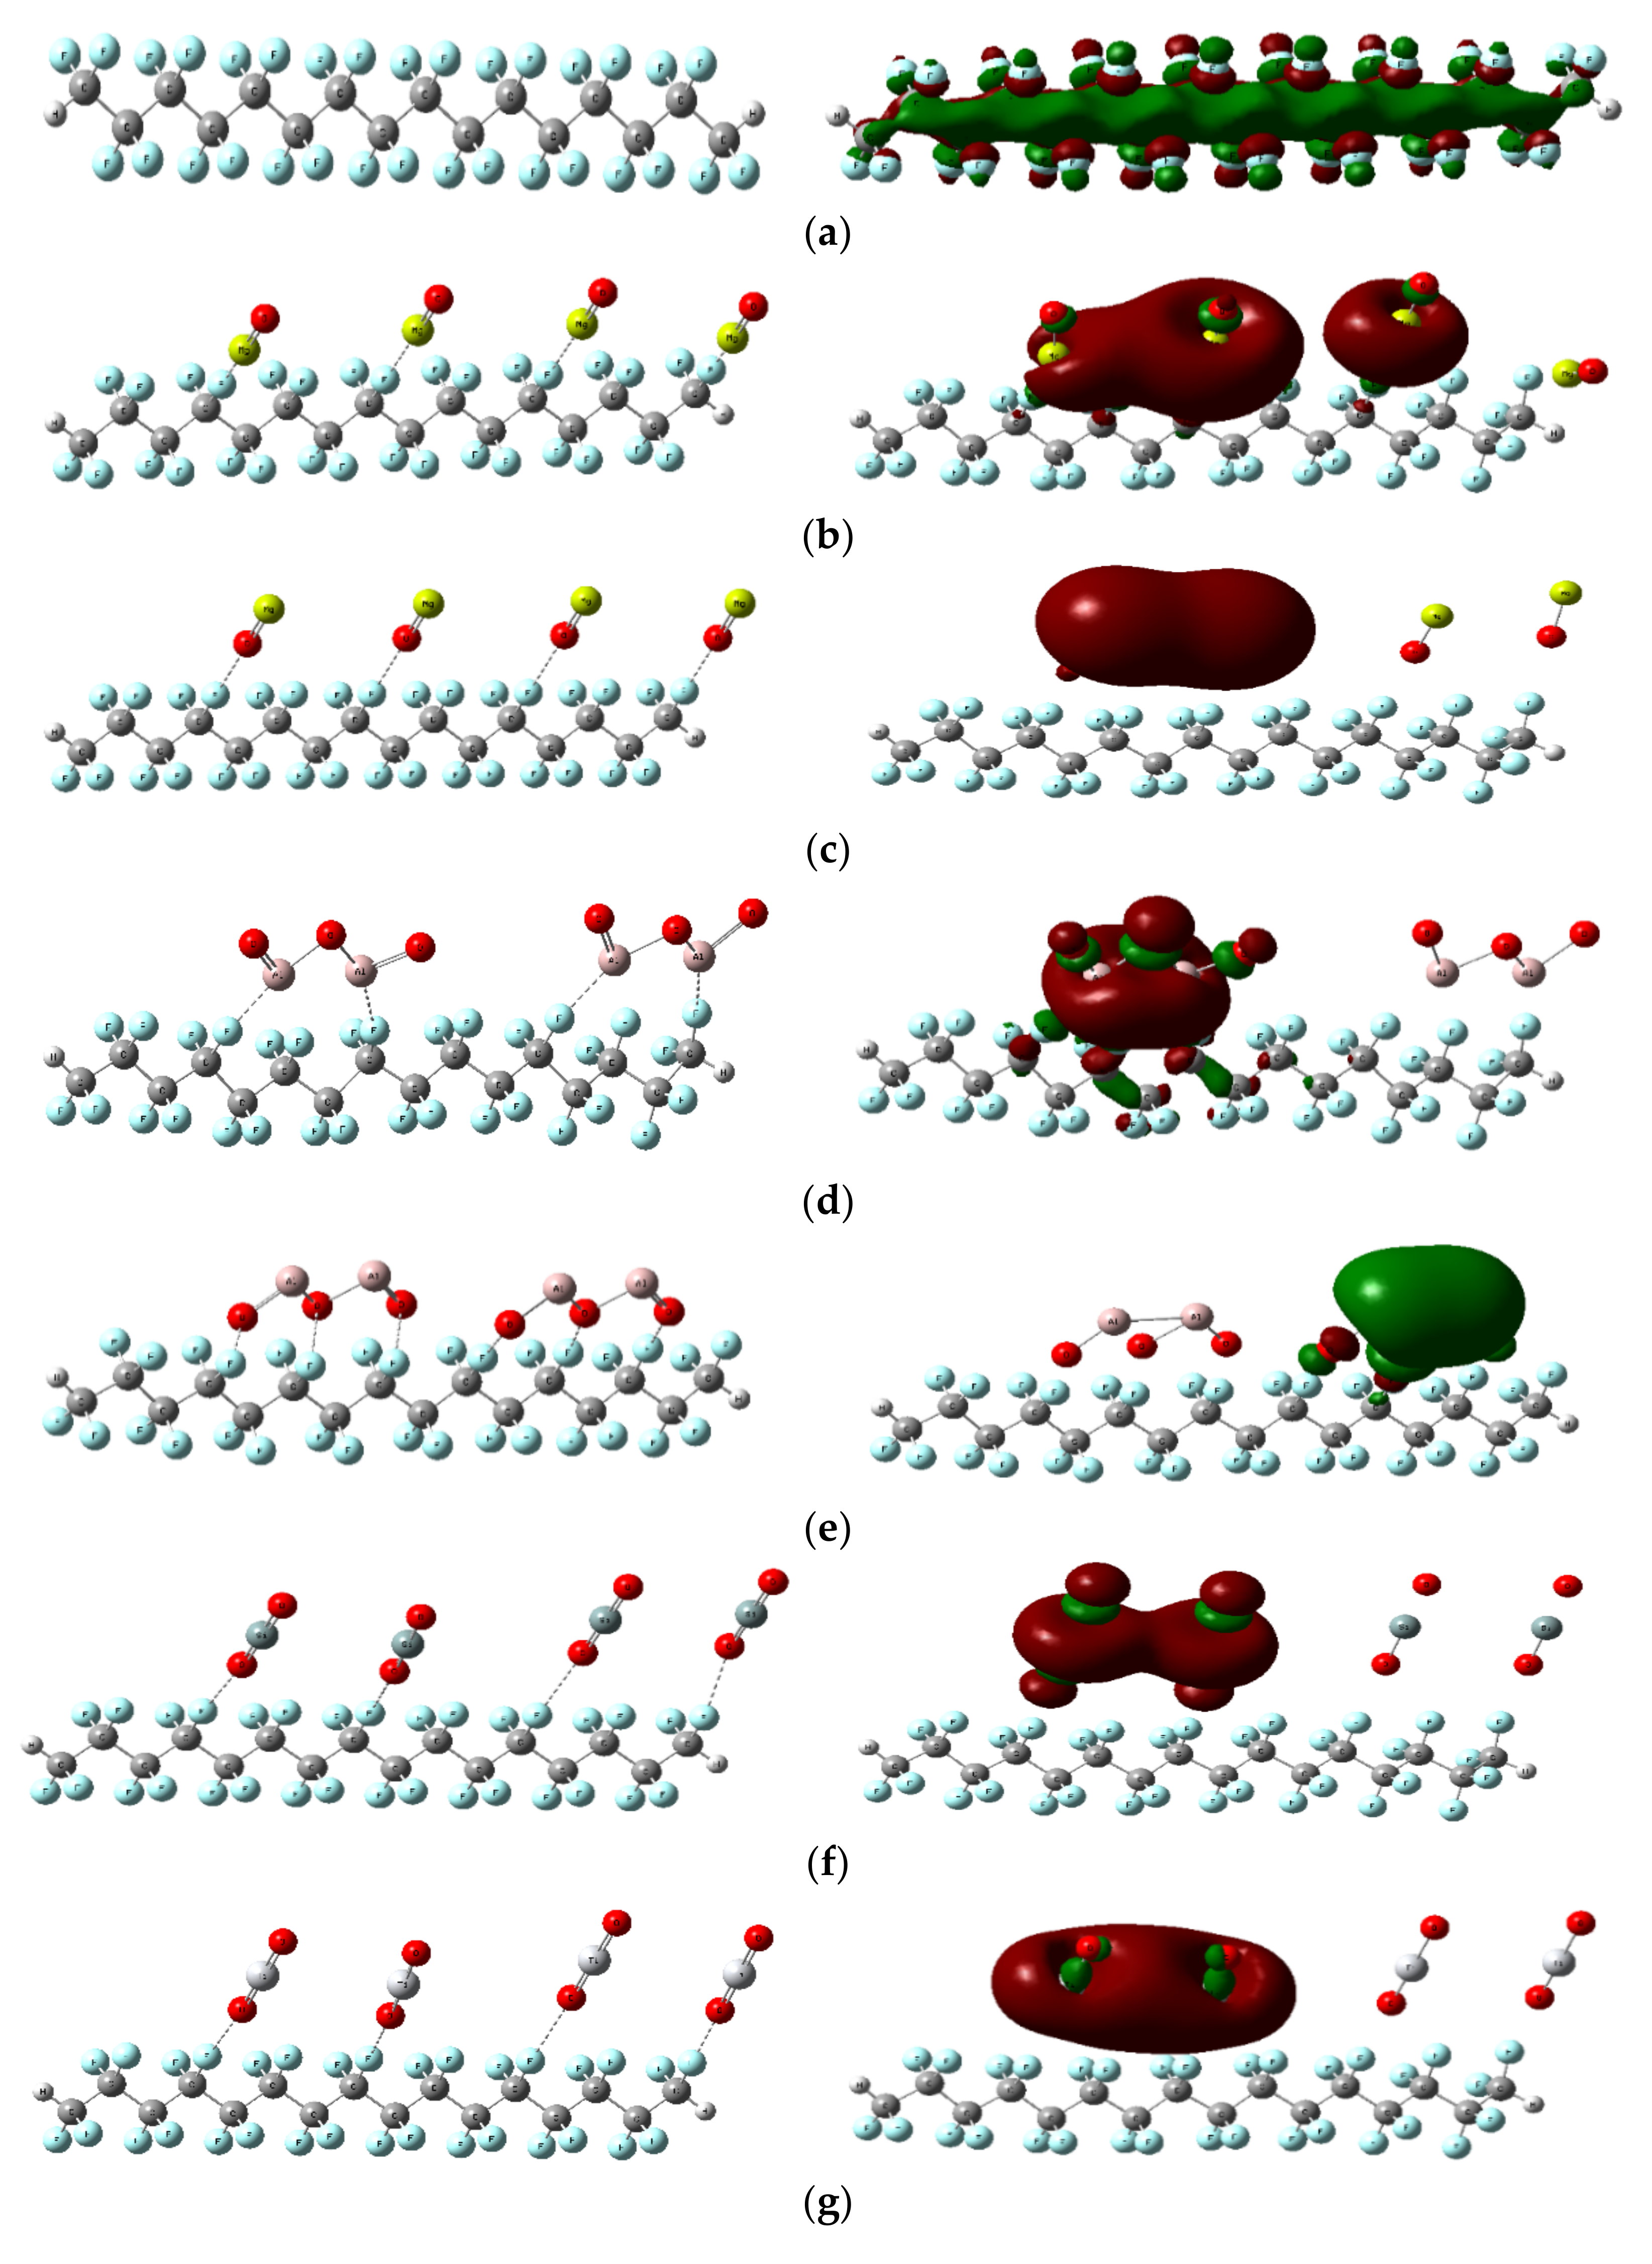
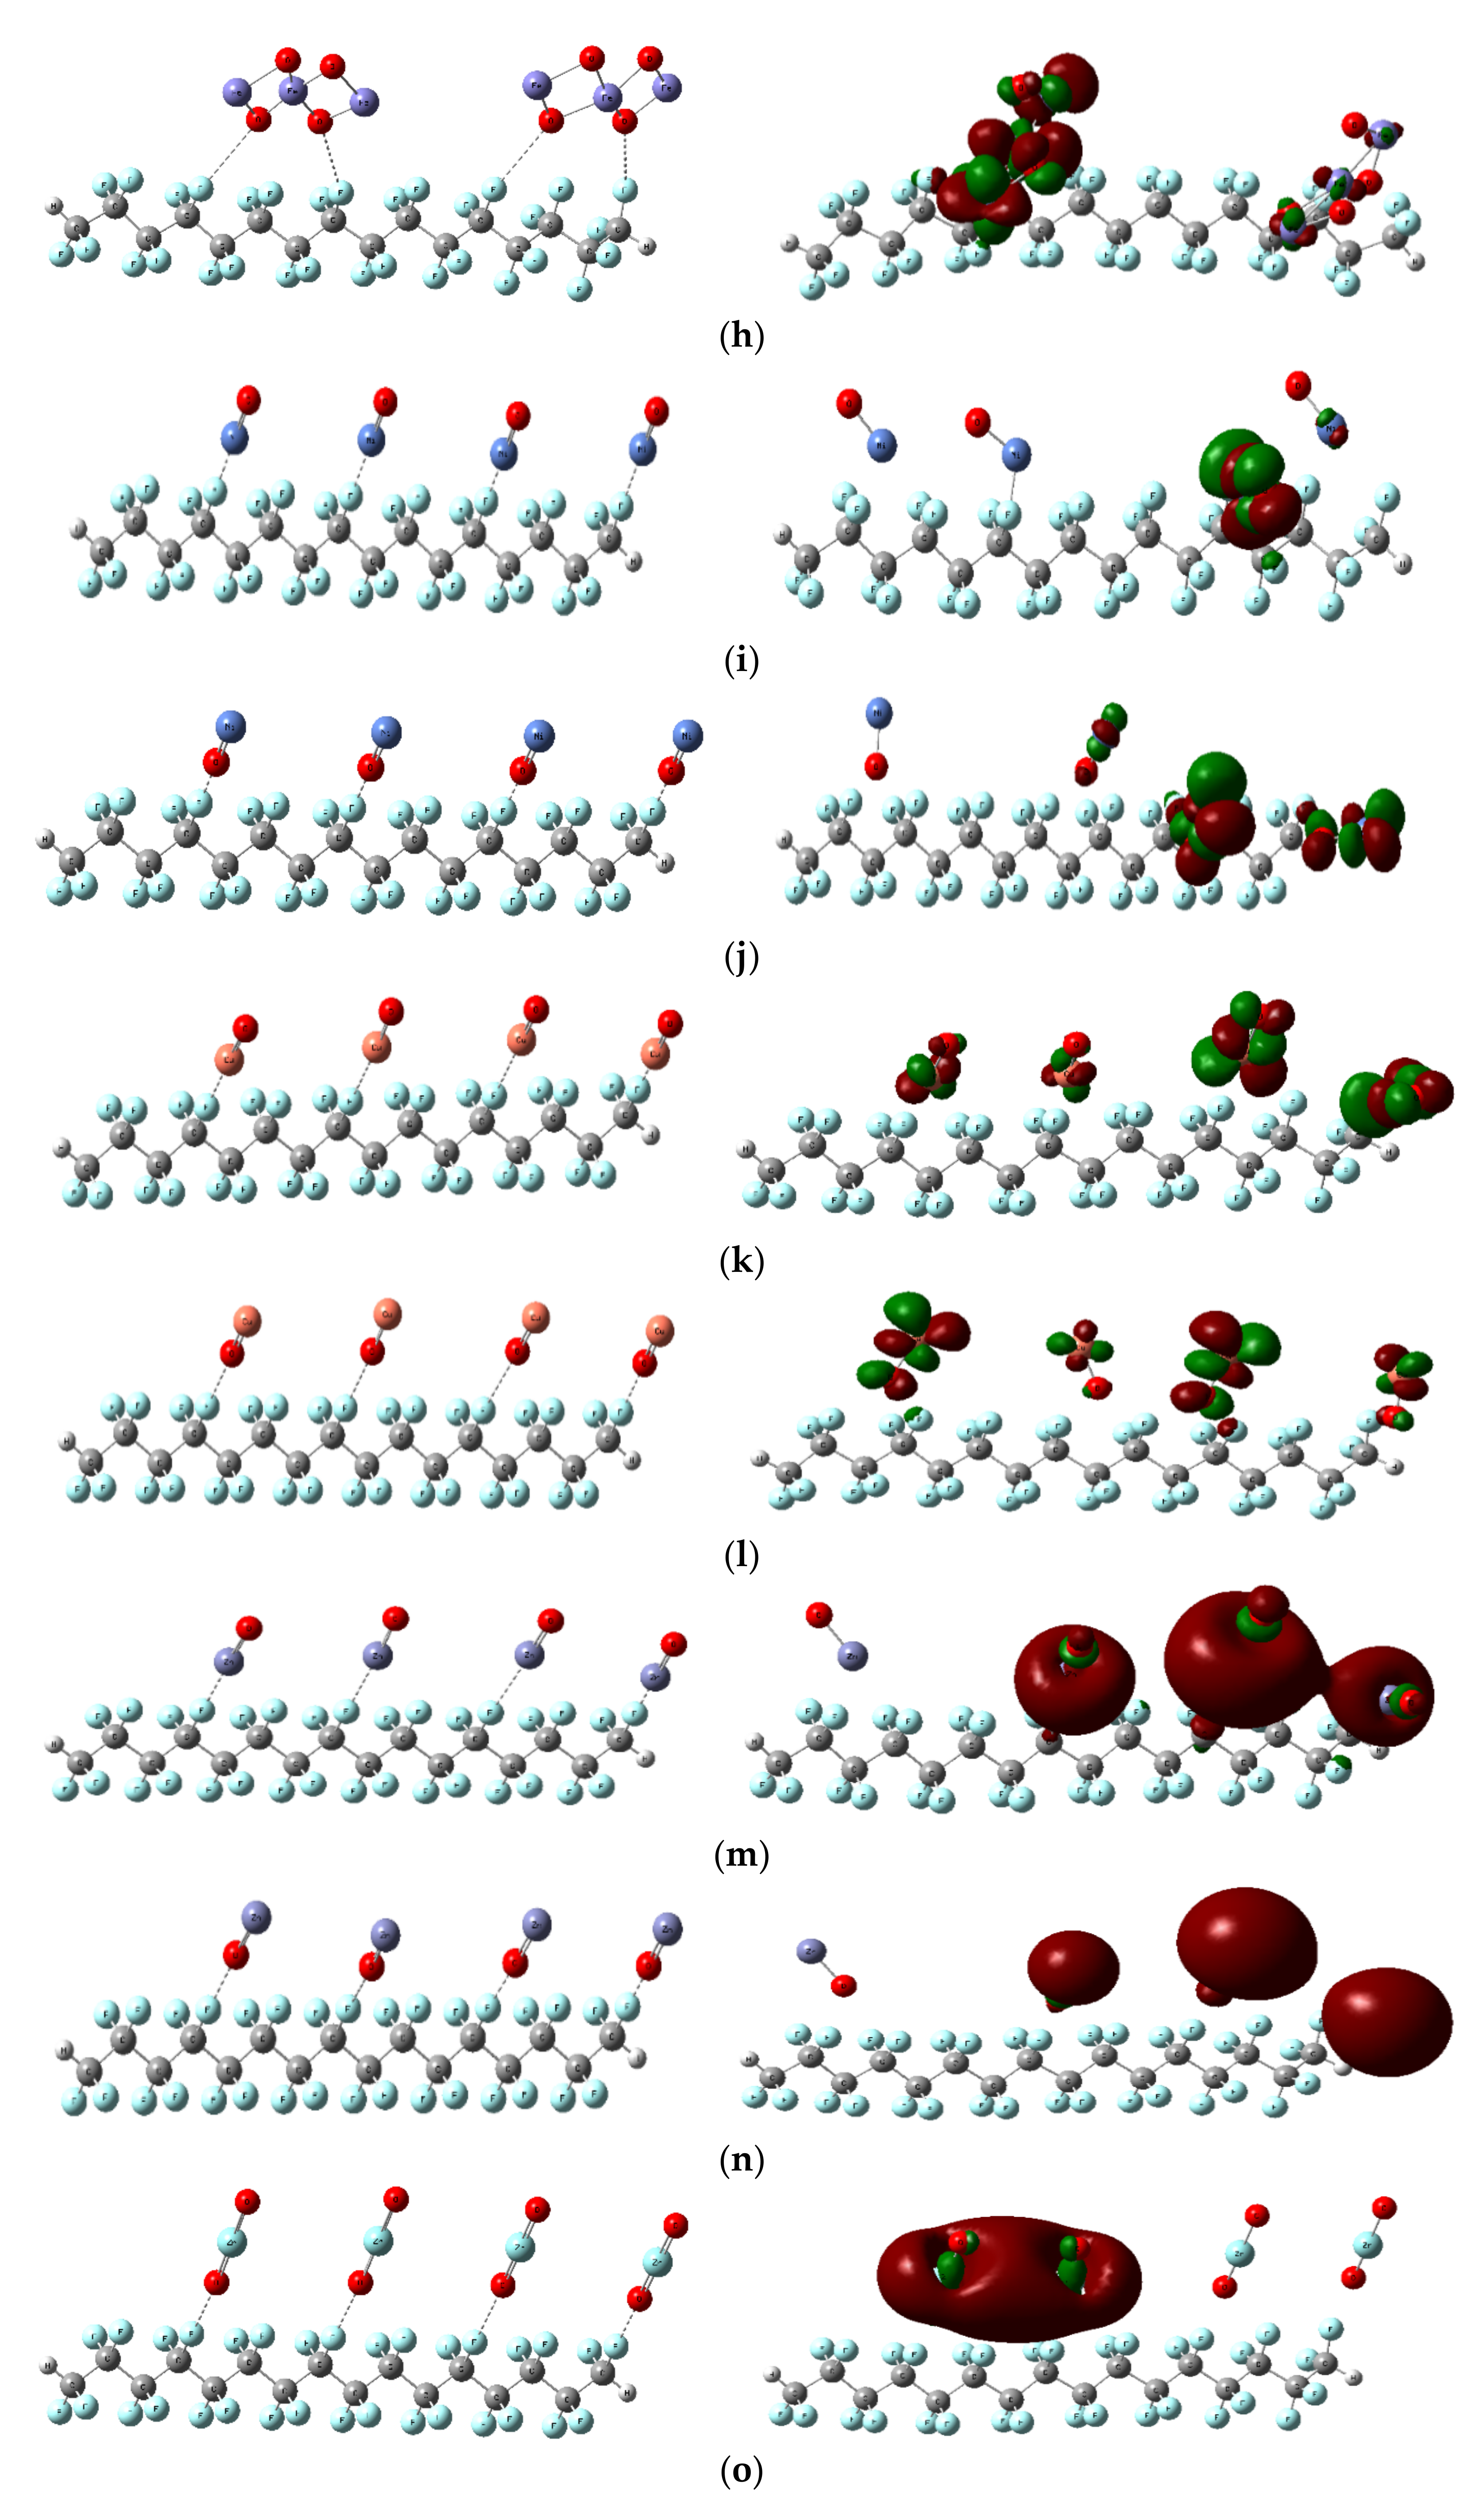
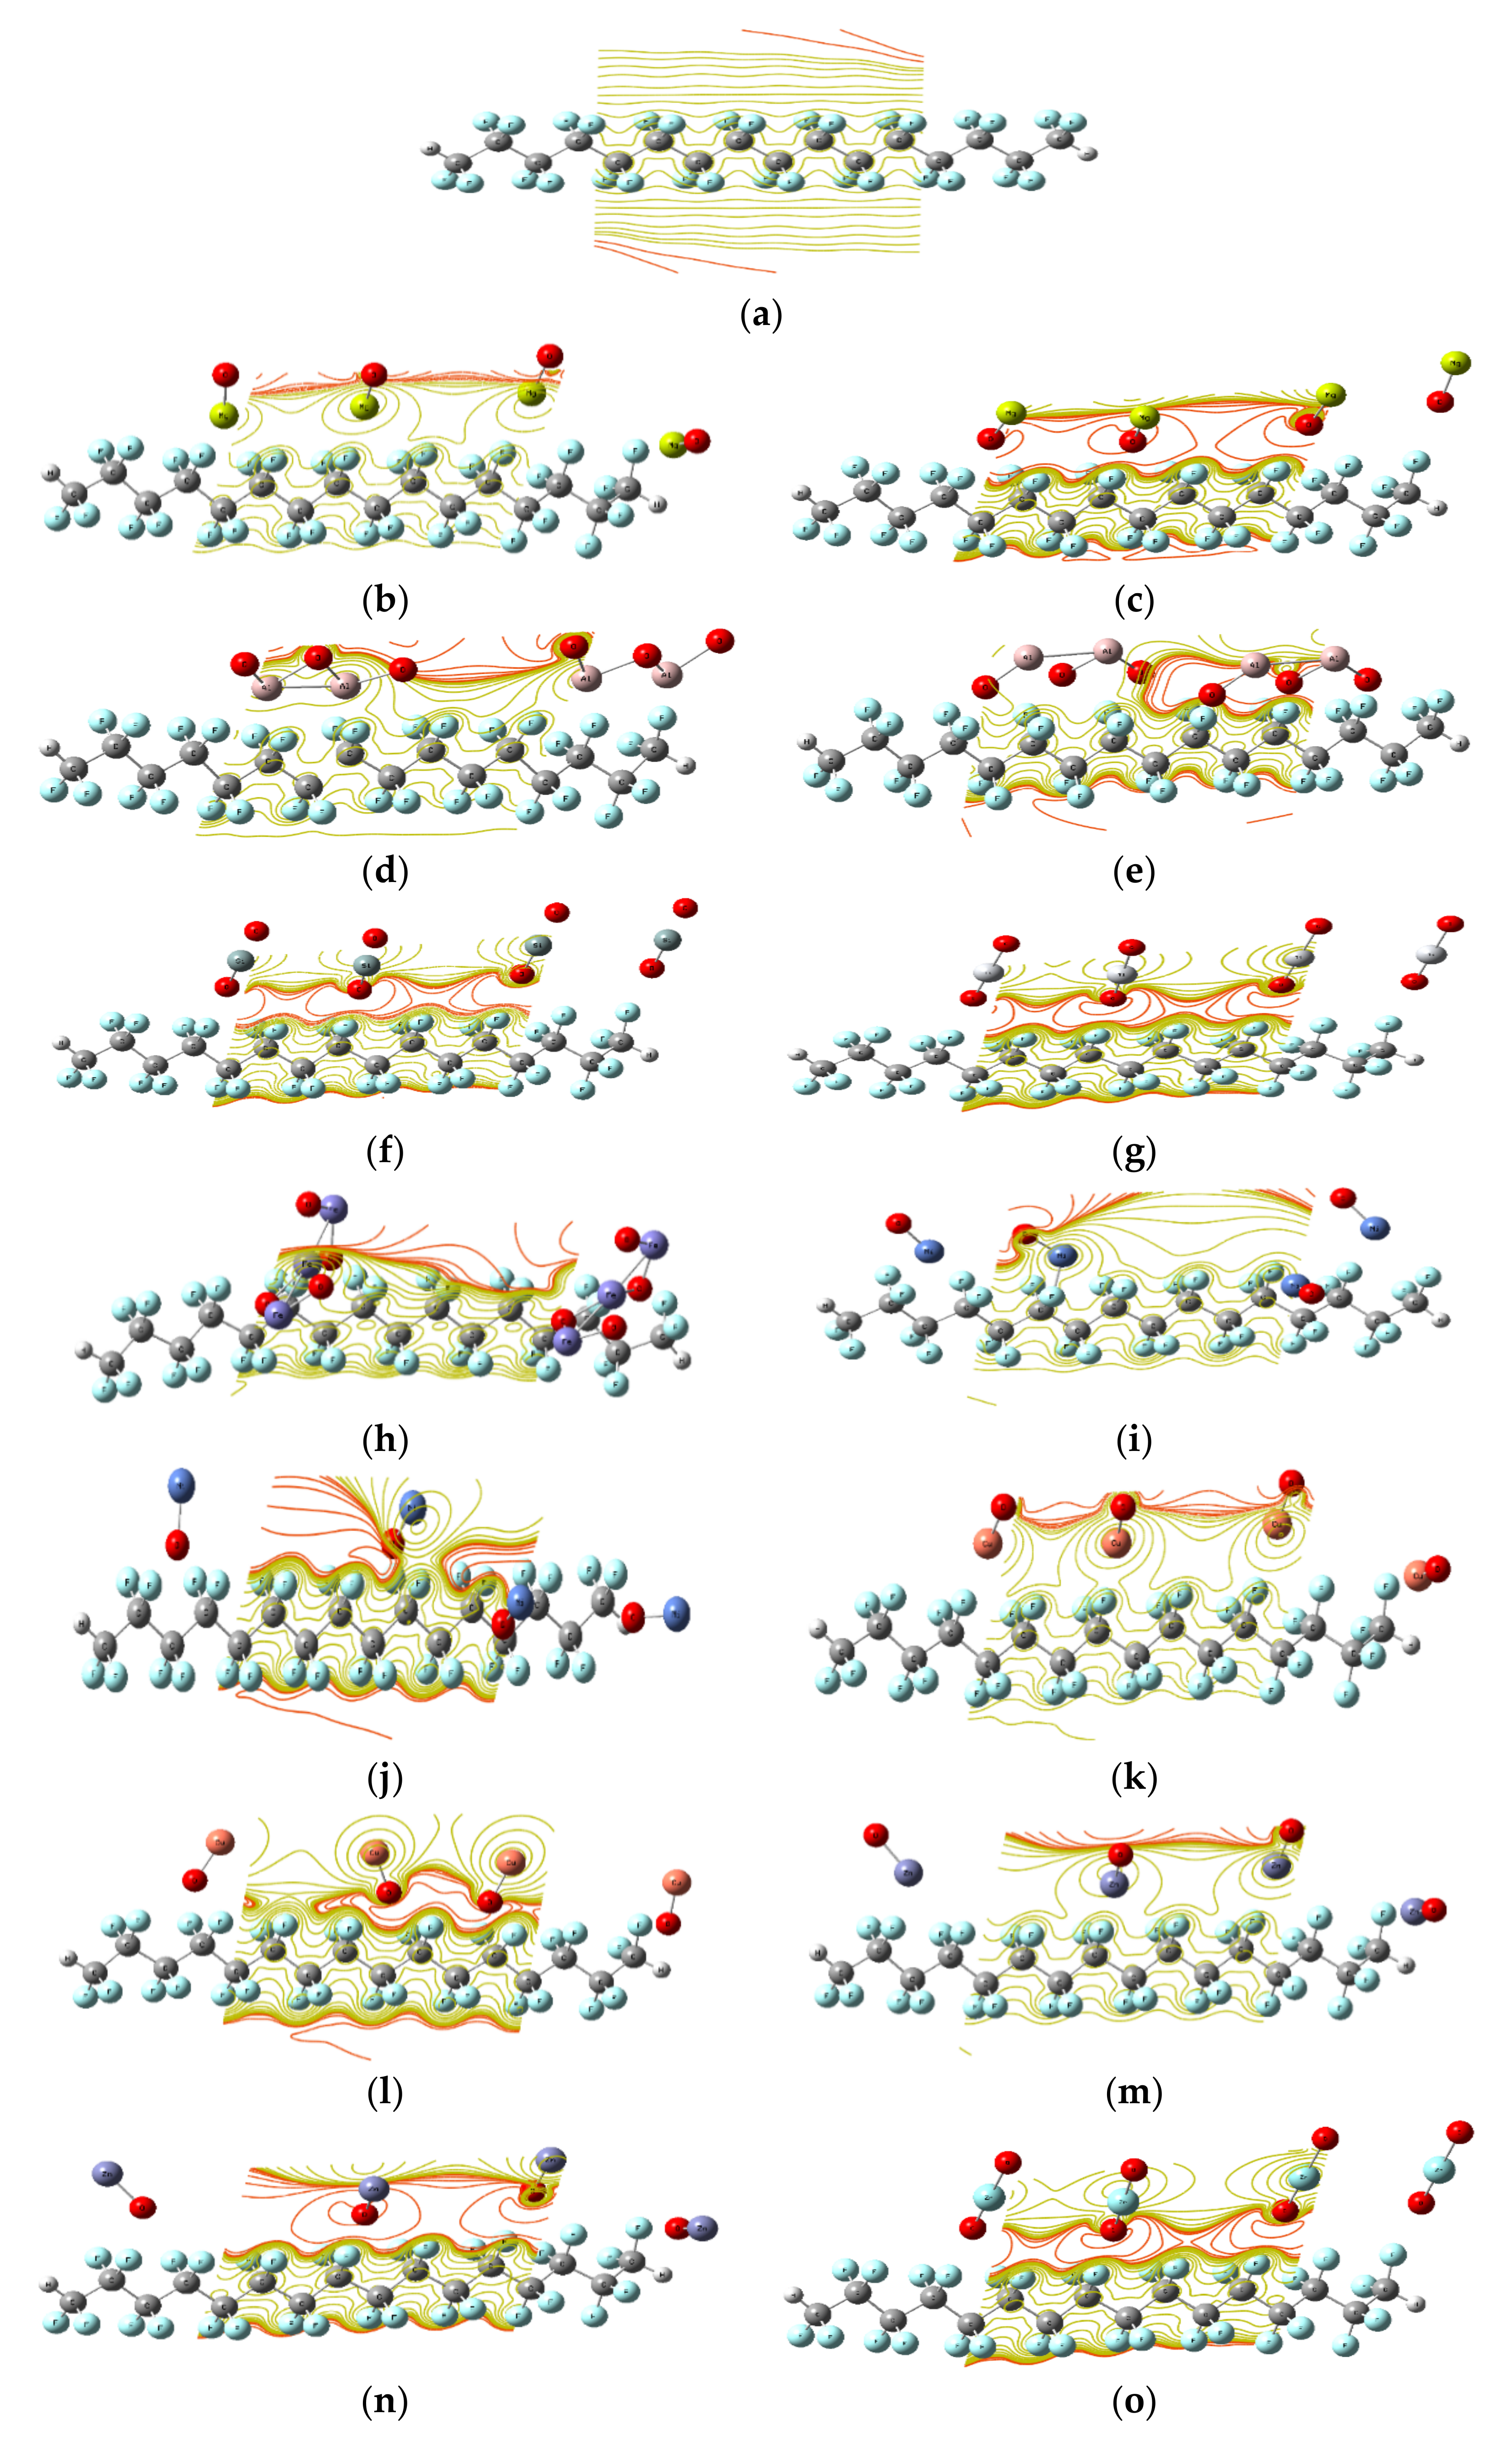
3.2.1. Interaction of PTFE with Different Metal Oxides
Distribution of HOMO/LUMO Orbitals
Molecular Electrostatic Potential (MESP)
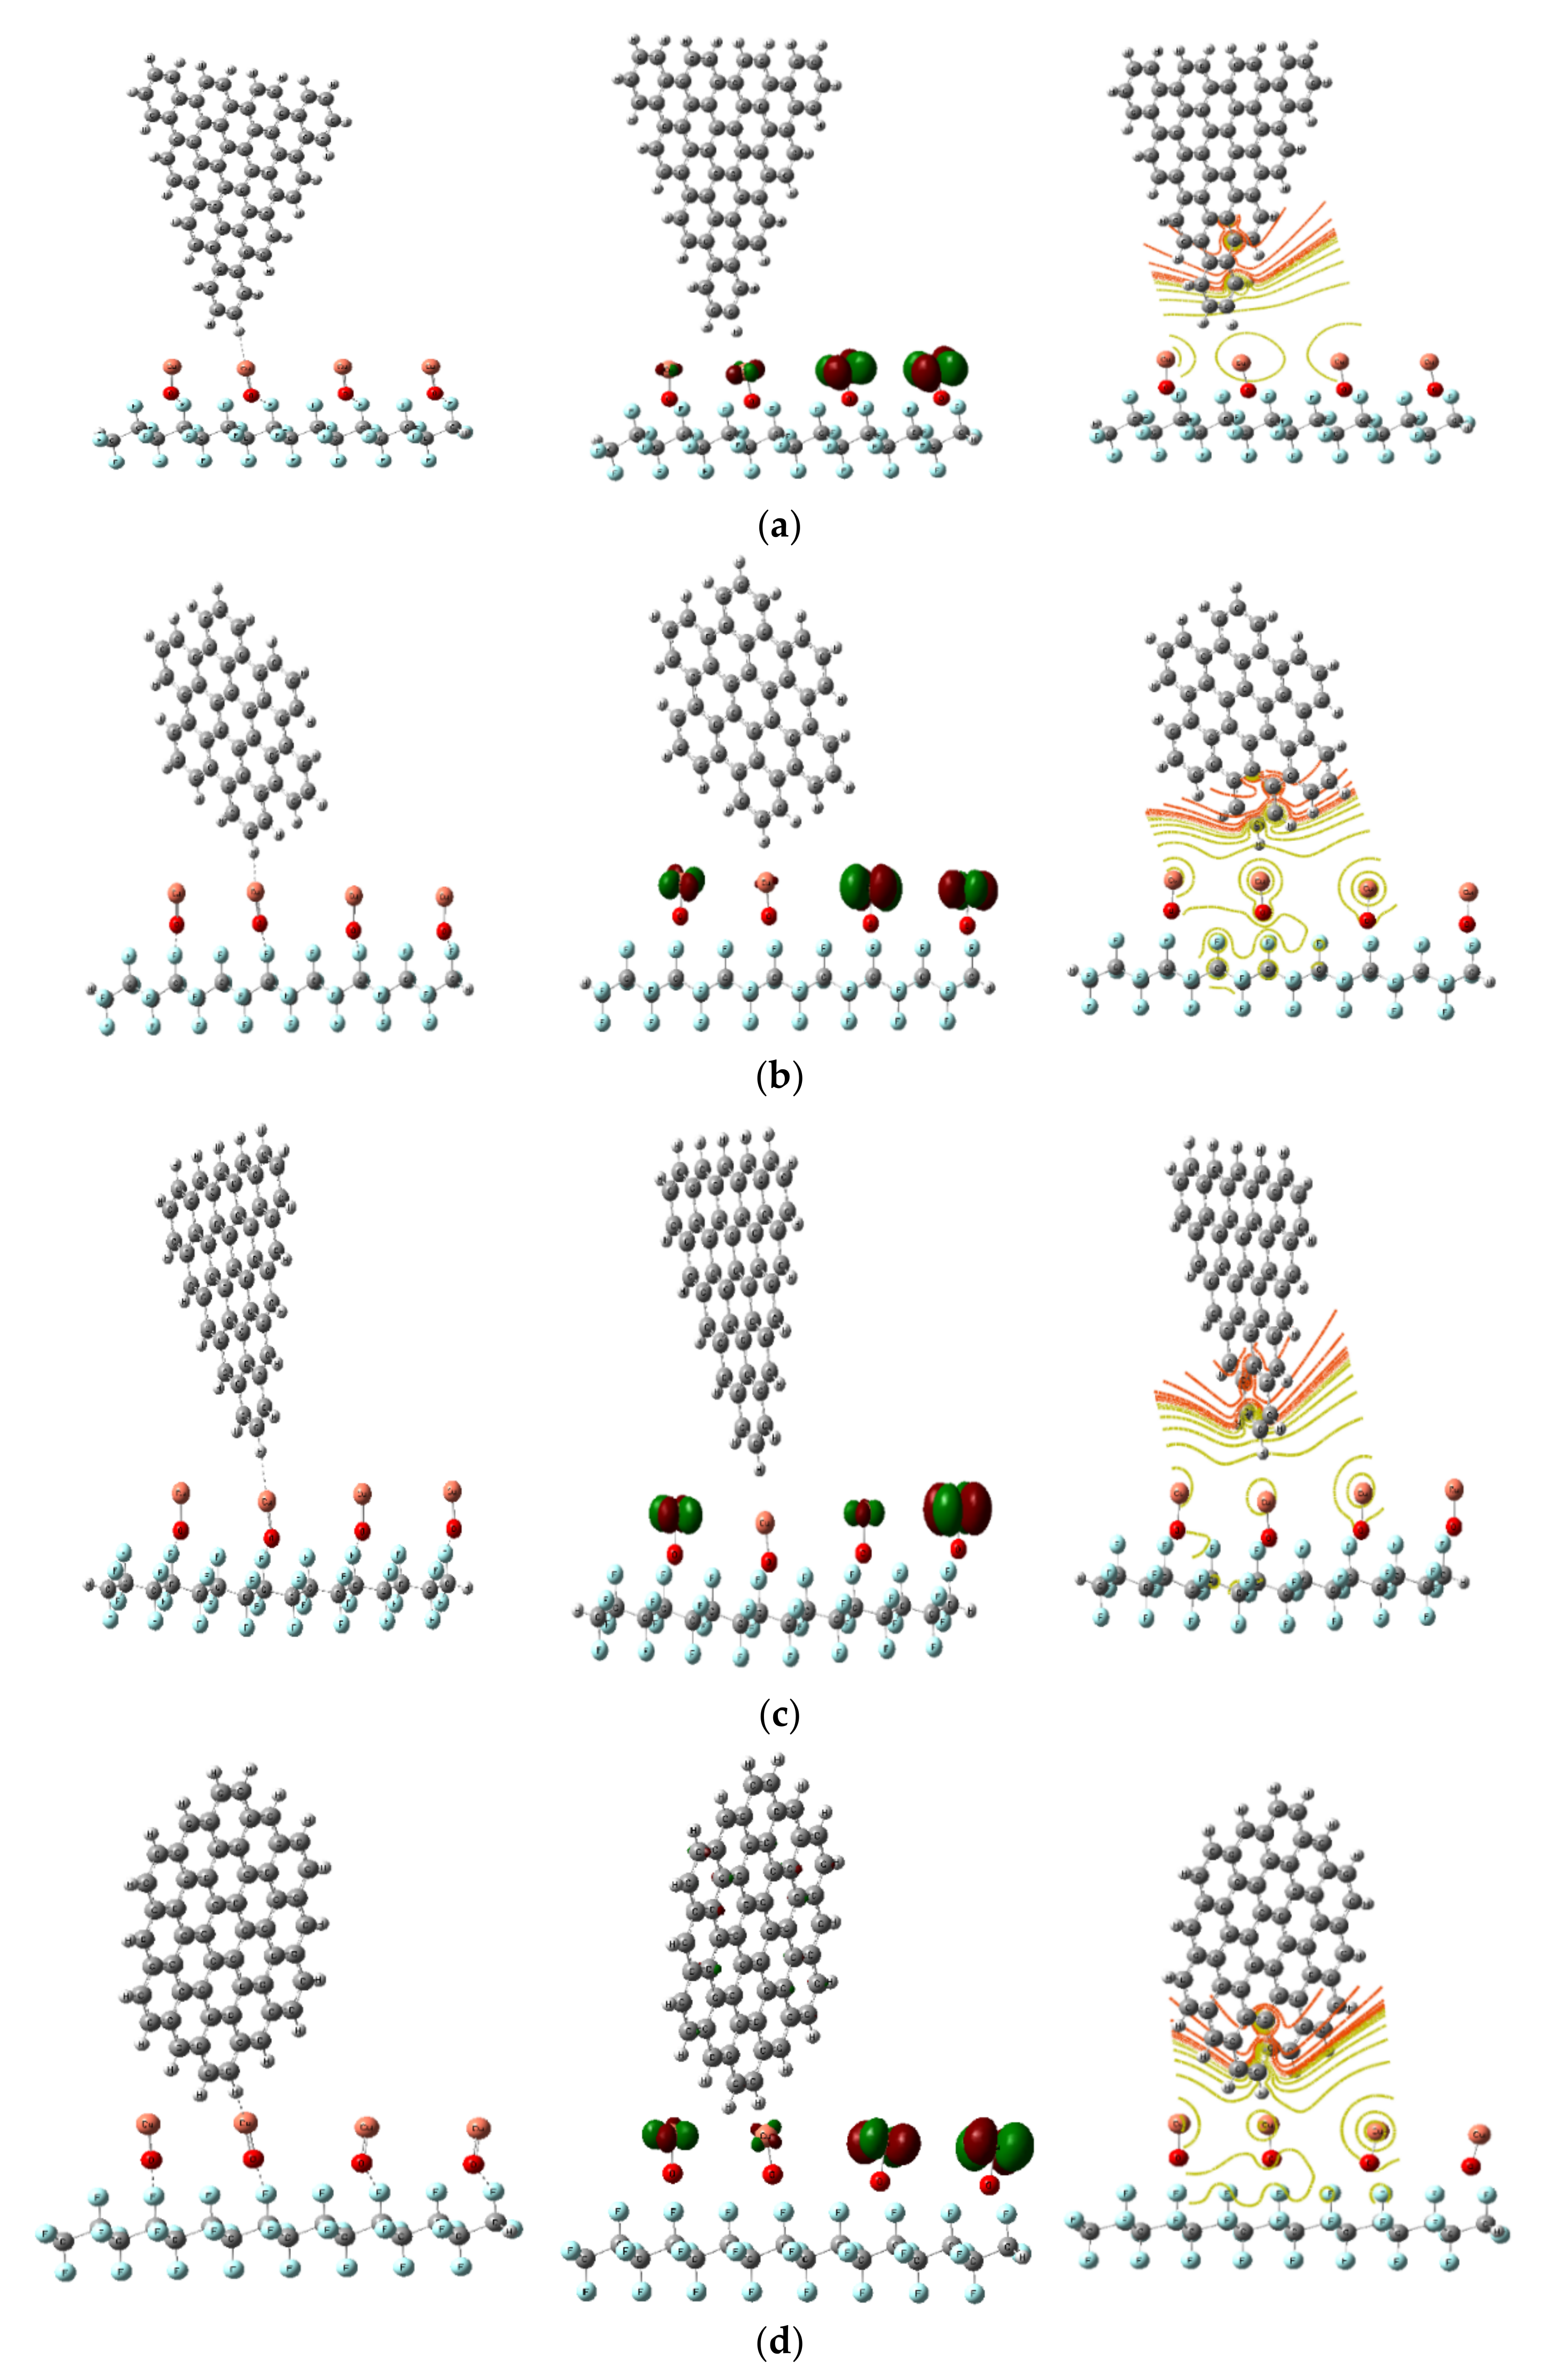
GQDs Interaction with PTFE/OCu
4. Conclusions
Author Contributions
Funding
Institutional Review Board Statement
Informed Consent Statement
Data Availability Statement
Acknowledgments
Conflicts of Interest
References
- Shabannia, R.; Abu Hassan, H. Controllable vertically aligned ZnO nanorods on flexible polyethylene naphthalate (PEN) substrate using chemical bath deposition synthesis. Appl. Phys. A 2014, 114, 579–584. [Google Scholar] [CrossRef]
- Bedia, E.L.; Murakami, S.; Kitade, T.; Kohjiya, S. Structural development and mechanical properties of polyethylene naphthalate/polyethylene terephthalate blends during uniaxial drawing. Polymer 2001, 42, 7299–7305. [Google Scholar] [CrossRef]
- Agrawal, N.; Munjal, S.; Ansari, M.Z.; Khare, N. Superhydrophobic palmitic acid modified ZnO nanoparticles. Ceram. Int. 2017, 43, 14271–14276. [Google Scholar] [CrossRef]
- Thabet, A.; Mubarak, Y.A.; Bakry, M. A review of nano-fillers effects on industrial polymers and their characteristics. Int. J. Eng. Sci. 2011, 39, 377–403. [Google Scholar]
- Aruniit, A.; Kers, J.; Majak, J.; Krumme, A.; Tall, K. Influence of hollow glass microspheres on the mechanical and physical properties and cost of particle reinforced polymer composites. Proc. Est. Acad. Sci. 2012, 61, 160. [Google Scholar] [CrossRef]
- Zhang, J.-N.; Wang, C.-Y.; Guo, Z.; Zhou, Y.-G.; Wu, H.-H. Prediction on electrical resistivity of thin-ply unidirectional composites considering electric tunnel effect. Polym. Compos. 2020, 41, 4318–4328. [Google Scholar] [CrossRef]
- Bhattacharya, M. Polymer Nanocomposites—A Comparison between Carbon Nanotubes, Graphene, and Clay as Nanofillers. Materials 2016, 9, 262. [Google Scholar] [CrossRef]
- Farhat, O.; Halim, M.M.; Abdullah, M.J.; Ali, M.K.M.; Ahmed, N.M.; Allam, N.K. Growth of vertically aligned ZnO nanorods on Teflon as a novel substrate for low-power flexible light sensors. Appl. Phys. A 2015, 119, 1197–1201. [Google Scholar] [CrossRef]
- Plirdpring, T.; Neamsong, P.; Prachachet, R.; Chananonnawathorn, C.; Lertvanithphol, T.; Pattantsetakul, V.; Limwichean, S.; Eiamchai, P.; Nuntawong, N.; Horprathum, M. Preparation of PTFE-coated SiO2 nanorod films for self-cleaning application. In AIP Conference Proceedings; AIP Publishing LLC: Melville, NY, USA, 2020; Volume 2279, p. 120005. [Google Scholar]
- Liang, Y.; Ju, J.; Deng, N.; Zhou, X.; Yan, J.; Kang, W.; Cheng, B. Super-hydrophobic self-cleaning bead-like SiO2@PTFE nanofiber membranes for waterproof-breathable applications. Appl. Surf. Sci. 2018, 442, 54–64. [Google Scholar] [CrossRef]
- Zhu, X.; Feng, S.; Zhao, S.; Zhang, F.; Xu, C.; Hu, M.; Zhong, Z.; Xing, W. Perfluorinated superhydrophobic and oleophobic SiO2@PTFE nanofiber membrane with hierarchical nanostructures for oily fume purification. J. Membr. Sci. 2020, 594, 117473. [Google Scholar] [CrossRef]
- Chen, X.M.; Liu, K.W.; Yang, Q.F. Study on preparation and mechanical properties of PTFE/nano-SiO2 composites. Chem. Res. Appl. 2007, 19, 831. [Google Scholar]
- Shen, J.; Top, M.; Pei, Y.; De Hosson, J. Wear and friction performance of PTFE filled epoxy composites with a high concentration of SiO2 particles. Wear 2015, 322–323, 171–180. [Google Scholar] [CrossRef]
- Chao, M.; Guo, C.; Feng, A.; Huang, Z.; Yang, Q.; Wu, G. Improved Thermal Conductivity and Mechanical Property of PTFE Reinforced with Al2O3. Nano 2019, 14, 1950064. [Google Scholar] [CrossRef]
- Badry, R.; Radwan, S.H.; Ezzat, D.; Ezzat, H.; Elhaes, H.; Ibrahim, M. Study of the Electronic Properties of Graphene Oxide/(PANi/Teflon). Biointerface Res. Appl. 2020, 10, 6926–6935. [Google Scholar]
- Ruijin, L.; Chao, L.; Yuan, Y.; Duan, Y.; Zhuang, A. Anti-icing performance of ZnO/SiO2/PTFE sandwich-nanostructure superhydrophobic film on glass prepared via RF magnetron sputtering. Mater. Lett. 2017, 206, 109–112. [Google Scholar]
- Moser, M.; Semprimoschnig, C.; Van Eesbeek, M.; Pippan, R. Surface and Bulk Degradation of Teflon® FEP Retrieved from the Hubble Space Telescope Solar Arrays. High Perform. Polym. 2008, 20, 429–446. [Google Scholar] [CrossRef]
- Dever, J.A.; De Groh, K.K.; Banks, B.A.; Townsend, J.A.; Barth, J.L.; Thomson, S.; Gregory, T.; Savagek, W. Environmental Exposure Conditions for Teflon® Fluorinated Ethylene Propylene on the Hubble Space Telescope. High Perform. Polym. 2000, 12, 125–139. [Google Scholar] [CrossRef]
- De Groh, K.K.; Martin, M. Thermal Contributions to the Degradation of Ground Laboratory and Space-Irradiated Teflon. J. Spacecr. Rocket. 2004, 41, 366–372. [Google Scholar] [CrossRef]
- Minton, T.K.; Wu, B.; Zhang, J.; Lindholm, N.F.; Abdulagatov, A.I.; O’Patchen, J.; George, S.M.; Groner, M.D. Protecting Polymers in Space with Atomic Layer Deposition Coatings. ACS Appl. Mater. Interfaces 2010, 2, 2515–2520. [Google Scholar] [CrossRef]
- Yeong, Y.H.; Gupta, M.C. Hot embossed micro-textured thin superhydrophobic Teflon FEP sheets for low ice adhesion. Surf. Coat. Technol. 2017, 313, 17–23. [Google Scholar] [CrossRef] [Green Version]
- Hegazy, M.A.; Ghoneim, R.; Ezzat, H.A.; Yahia, I.S.; Elhaes, H.; Ibrahim, M.A. Electronic and physical studies for Teflon FEP as a thermal control in low earth orbit reinforced with ZnO and SiO2 nanoparticles. J. Mol. Model. 2021, 27, 1–8. [Google Scholar] [CrossRef] [PubMed]
- Jucius, D.; Grigaliūnas, V.; Mikolajūnas, M.; Guobienė, A.; Kopustinskas, V.; Gudonytė, A.; Narmontas, P. Hot embossing of PTFE: Towards superhydrophobic surfaces. Appl. Surf. Sci. 2011, 257, 2353–2360. [Google Scholar] [CrossRef]
- Jucius, D.; Guobienė, A.; Grigaliūnas, V. Surface texturing of polytetrafluoroethylene by hot embossing. Appl. Surf. Sci. 2010, 256, 2164–2169. [Google Scholar] [CrossRef]
- Bhagat, S.D.; Gupta, M.C. Superhydrophobic microtextured polycarbonate surfaces. Surf. Coat. Technol. 2015, 270, 117–122. [Google Scholar] [CrossRef]
- Abdelsalam, H.; Elhaes, H.; Ibrahim, M. Tuning electronic properties in graphene quantum dots by chemical functionalization: Density functional theory calculations. Chem. Phys. Lett. 2018, 695, 138–148. [Google Scholar] [CrossRef]
- Ezzat, H.; Badry, R.; Yahia, I.S.; Zahran, H.Y.; Elhaes, H.; Ibrahim, M.A. Mapping the molecular electrostatic potential of carbon nanotubes. Biointerface Res. Appl. 2018, 8, 3539–3542. [Google Scholar]
- Badry, R.; Ghanem, A.S.; Ahmed, H.; Fahmy, A.; Elhaes, H.; Refaat, A. Effect of li, na, K, be, mg and ca on the electronic properties, geometrical parameters of carboxylic acids. Biointerface Res. Appl. Chem. 2018, 8, 3657–3660. [Google Scholar]
- Ibrahim, M. Molecular Modeling and FTIR Study for K, Na, Ca and Mg Coordination with Organic Acid. J. Comput. Theor. Nanosci. 2009, 6, 682–685. [Google Scholar] [CrossRef]
- Ibrahim, M.; Mahmoud, A.A. Computational Notes on the Reactivity of Some Functional Groups. J. Comput. Theor. Nanosci. 2009, 6, 1523–1526. [Google Scholar] [CrossRef]
- Elhaes, H.; Ezzat, H.; Morsy, M.; El-Khodary, S.A.; Yahia, I.S.; Zahran, H.Y.; Ibrahim, M.A. PVC/ZnO Nano-Composite as Gas Sensor for Natural Gas. Sens. Lett. 2018, 16, 513–516. [Google Scholar] [CrossRef]
- Abdelsalam, H.; Saroka, V.A.; Ali, M.; Teleb, N.H.; Elhaes, H.; Ibrahim, M.A. Stability and electronic properties of edge functionalized silicene quantum dots: A first principles study. Phys. E Low Dimens. Syst. Nanostruct. 2019, 108, 339–346. [Google Scholar] [CrossRef]
- Hummers, W.S., Jr. Preparation of graphitic oxide. J. Am. Chem. Soc. 1958, 80, 1339. [Google Scholar] [CrossRef]
- Frisch, M.J.; Trucks, G.W.; Schlegel, H.B.; Scuseria, G.E.; Robb, M.A.; Cheeseman, J.R.; Scalmani, G.; Barone, V.; Mennucci, B.; Petersson, G.A.; et al. Gaussian 09, Revision C.01; Gaussian, Inc.: Wallingford, CT, USA, 2010. [Google Scholar]
- Becke, A.D. Density-functional thermochemistry. III. The role of exact exchange. J. Chem. Phys. 1993, 98, 5648–5652. [Google Scholar] [CrossRef] [Green Version]
- Lee, C.; Yang, W.; Parr, R.G. Development of the Colic-Salvetti correlation-energy formula into a functional of the electron density. Phys. Rev. B 1988, 37, 785. [Google Scholar] [CrossRef] [PubMed] [Green Version]
- Vosko, S.H.; Wilk, L.; Nusair, M. Accurate spin-dependent electron liquid correlation energies for local spin density calculations: A critical analysis. Can. J. Phys. 1980, 58, 1200–1211. [Google Scholar] [CrossRef] [Green Version]
- Wang, C.; Chen, J.-R. Studies on surface graft polymerization of acrylic acid onto PTFE film by remote argon plasma initiation. Appl. Surf. Sci. 2007, 253, 4599–4606. [Google Scholar] [CrossRef]
- Hegazy, M.A.; El-Agamy, H.H. ICMMS-2: Comparative Study on Copper Oxide Nanocrystals Synthesized by Two Precipitation Methods. Egypt. J. Chem. 2021, 64, 7–8. [Google Scholar] [CrossRef]
- Kang, W.; Zhao, H.; Ju, J.; Shi, Z.; Qiao, C.; Cheng, B. Electrospun poly(tetrafluoroethylene) nanofiber membranes from PTFE-PVA-BA-H2O gel-spinning solutions. Fibers Polym. 2016, 17, 1403–1413. [Google Scholar] [CrossRef]
- Siddiqui, H.; Qureshi, M.S.; Haque, F.Z. Surfactant assisted wet chemical synthesis of copper oxide (CuO) nanostructures and their spectroscopic analysis. Optik 2016, 127, 2740–2747. [Google Scholar] [CrossRef]
- Andonovic, B.; Grozdanov, A.; Paunović, P.; Dimitrov, A.T. X-ray diffraction analysis on layers in graphene samples obtained by electrolysis in molten salts: A new perspective. Micro Nano Lett. 2015, 10, 683–685. [Google Scholar] [CrossRef]
- Petkov, V.; Ohta, T.; Hou, Y.; Ren, Y. Atomic-Scale Structure of nanocrystals by HighEnergy X-ray Diffraction and Atomic Pair Distribution Function Analysis Nanoparticles. J. Phys. Chem. C 2007, 111, 714–720. [Google Scholar] [CrossRef]
- Hall, B.D.; Zanchet, D.; Ugarte, D. Estimating nanoparticle size from diffraction measurements. J. Appl. Crystallogr. 2000, 33, 1335–1341. [Google Scholar] [CrossRef]
- Borkar, S.; Gu, B.; Dirmyer, M.; Delicado, R.; Sen, A.; Jackson, B.R.; Badding, J.V. Polytetrafluoroethylene nano/microfibers by jet blowing. Polymer 2006, 47, 8337–8343. [Google Scholar] [CrossRef]
- Radhakrishnan, A.A.; Beena, B.B. Structural and optical absorption analysis of CuO nanoparticles. Indian J. Adv. Chem. Sci. 2014, 2, 158–161. [Google Scholar]
- Hashim, A.; Hadi, A. Synthesis and characterization of (MgO–Y2O3–CuO) nanocomposites for novel humidity sensor application. Sens. Lett. 2017, 15, 858–861. [Google Scholar] [CrossRef]
- Ezzat, H.A.; Hegazy, M.A.; Nada, N.A.; Ibrahim, M.A. Effect of nano metal oxides on the electronic properties of cellulose, chitosan and sodium alginate. Biointerface Res. Appl. Chem. 2019, 9, 4143–4149. [Google Scholar]
- Politzer, P.; Laurence, P.R.; Jayasuriya, K. Molecular electrostatic potentials: An effective tool for the elucidation of biochemical phenomena. Environ. Health Perspect. 1985, 61, 191–202. [Google Scholar] [CrossRef]
- Zhang, Z.; Zhang, J.; Chen, N.; Qu, L. Graphene quantum dots: An emerging material for energy-related applications and beyond. Energy Environ. Sci. 2012, 5, 8869–8890. [Google Scholar] [CrossRef]


| Structure | TDM (Debye) | ΔE (eV) |
|---|---|---|
| PTFE | 00.000 | 8.510 |
| PTFE/MgO | 30.100 | 1.466 |
| PTFE/OMg | 27.449 | 1.327 |
| PTFE/Al2O3 | 22.477 | 1.102 |
| PTFE/O3Al2 | 12.709 | 0.407 |
| PTFE/OSiO | 00.231 | 3.226 |
| PTFE/OTiO | 04.722 | 1.366 |
| PTFE/Fe3O4 | 06.575 | 1.996 |
| PTFE/NiO | 19.260 | 0.579 |
| PTFE/ONi | 08.924 | 1.106 |
| PTFE/CuO | 20.532 | 0.506 |
| PTFE/OCu | 76.136 | 0.400 |
| PTFE/ZnO | 22.524 | 1.909 |
| PTFE/OZn | 19.137 | 2.317 |
| PTFE/OZrO | 07.526 | 0.938 |
| Structure | TDM (Debye) | ΔE (eV) |
|---|---|---|
| PTFE/OCu/GQD ATRI C60 | 20.421 | 0.480 |
| PTFE/OCu/GQD AHEX C42 | 16.439 | 0.432 |
| PTFE/OCu/GQD ZTRI C46 | 39.124 | 0.206 |
| PTFE/OCu/GQD ZHEX C54 | 17.571 | 0.433 |
Publisher’s Note: MDPI stays neutral with regard to jurisdictional claims in published maps and institutional affiliations. |
© 2022 by the authors. Licensee MDPI, Basel, Switzerland. This article is an open access article distributed under the terms and conditions of the Creative Commons Attribution (CC BY) license (https://creativecommons.org/licenses/by/4.0/).
Share and Cite
Hegazy, M.A.; Ezzat, H.A.; Yahia, I.S.; Zahran, H.Y.; Elhaes, H.; Gomaa, I.; Ibrahim, M.A. Effect of CuO and Graphene on PTFE Microfibers: Experimental and Modeling Approaches. Polymers 2022, 14, 1069. https://doi.org/10.3390/polym14061069
Hegazy MA, Ezzat HA, Yahia IS, Zahran HY, Elhaes H, Gomaa I, Ibrahim MA. Effect of CuO and Graphene on PTFE Microfibers: Experimental and Modeling Approaches. Polymers. 2022; 14(6):1069. https://doi.org/10.3390/polym14061069
Chicago/Turabian StyleHegazy, Maroof A., Hend A. Ezzat, Ibrahim S. Yahia, Heba Y. Zahran, Hanan Elhaes, Islam Gomaa, and Medhat A. Ibrahim. 2022. "Effect of CuO and Graphene on PTFE Microfibers: Experimental and Modeling Approaches" Polymers 14, no. 6: 1069. https://doi.org/10.3390/polym14061069