
Fast Evaluation and Comparison of the Energy Performances of Elastomers from Relative Energy Stored Identification under Mechanical Loadings


Abstract
:1. Introduction
- The mechanical response of some elastomers exhibits a hysteresis loop only when strain-induced crystallization (SIC) occurs, typically in case of unfilled natural rubber (NR) [18]. In this case, no self-heating accompanies the mechanical cycles, which indicates that SIC does not induce or has very little viscosity. This was first intuited by Clark [19] and confirmed by [20,21,22];
- If all the energy contained in the hysteresis loop were due to viscosity, the self-heating would be much higher than that observed experimentally, especially under repeated cycles.
- (a)
- The thermal dissipation (under non adiabatic test conditions). If heat is exchanged with the specimen’s outside, then a hysteresis loop in the stretch-stress relationship can theoretically form, the current temperature appearing in the elastic coupling. In most of the homogeneous tests (in terms of heat source field, see Section 2) performed, considering the thermal properties of elastomers and the loading rate relatively high, the thermal dissipation does not contribute significantly to the mechanical hysteresis;
- (b)
- The change in microstructure. In this case, all the work done to the system is not measured as an apparent temperature change (see for instance the recent studies by [27] on polyurea who concluded that a significant part of the mechanical energy is used by the material to reorganize or by Le Cam [22] who demonstrated that the mechanical hysteresis of the unfilled natural rubber he studied was entirely due to the difference in kinetics between crystallization and crystallite melting).
2. Thermodynamic Framework
2.1. Total Strain Energy Density and Energy Rate Involved in the Hysteresis Loop
2.2. Heat Sources
- -
- the intrinsic dissipation : this positive quantity corresponds to the heat production due to mechanical irreversibilities during the deformation process, for instance viscosity or damage;
- -
- the thermomechanical couplings : they correspond to the couplings between the temperature and the state variables, and describe reversible deformation processes. Consequently, their integration with respect to time over one thermodynamical cycle is null.
2.3. Identifying the Mean Intrinsic Dissipation
2.4. Energy Balance
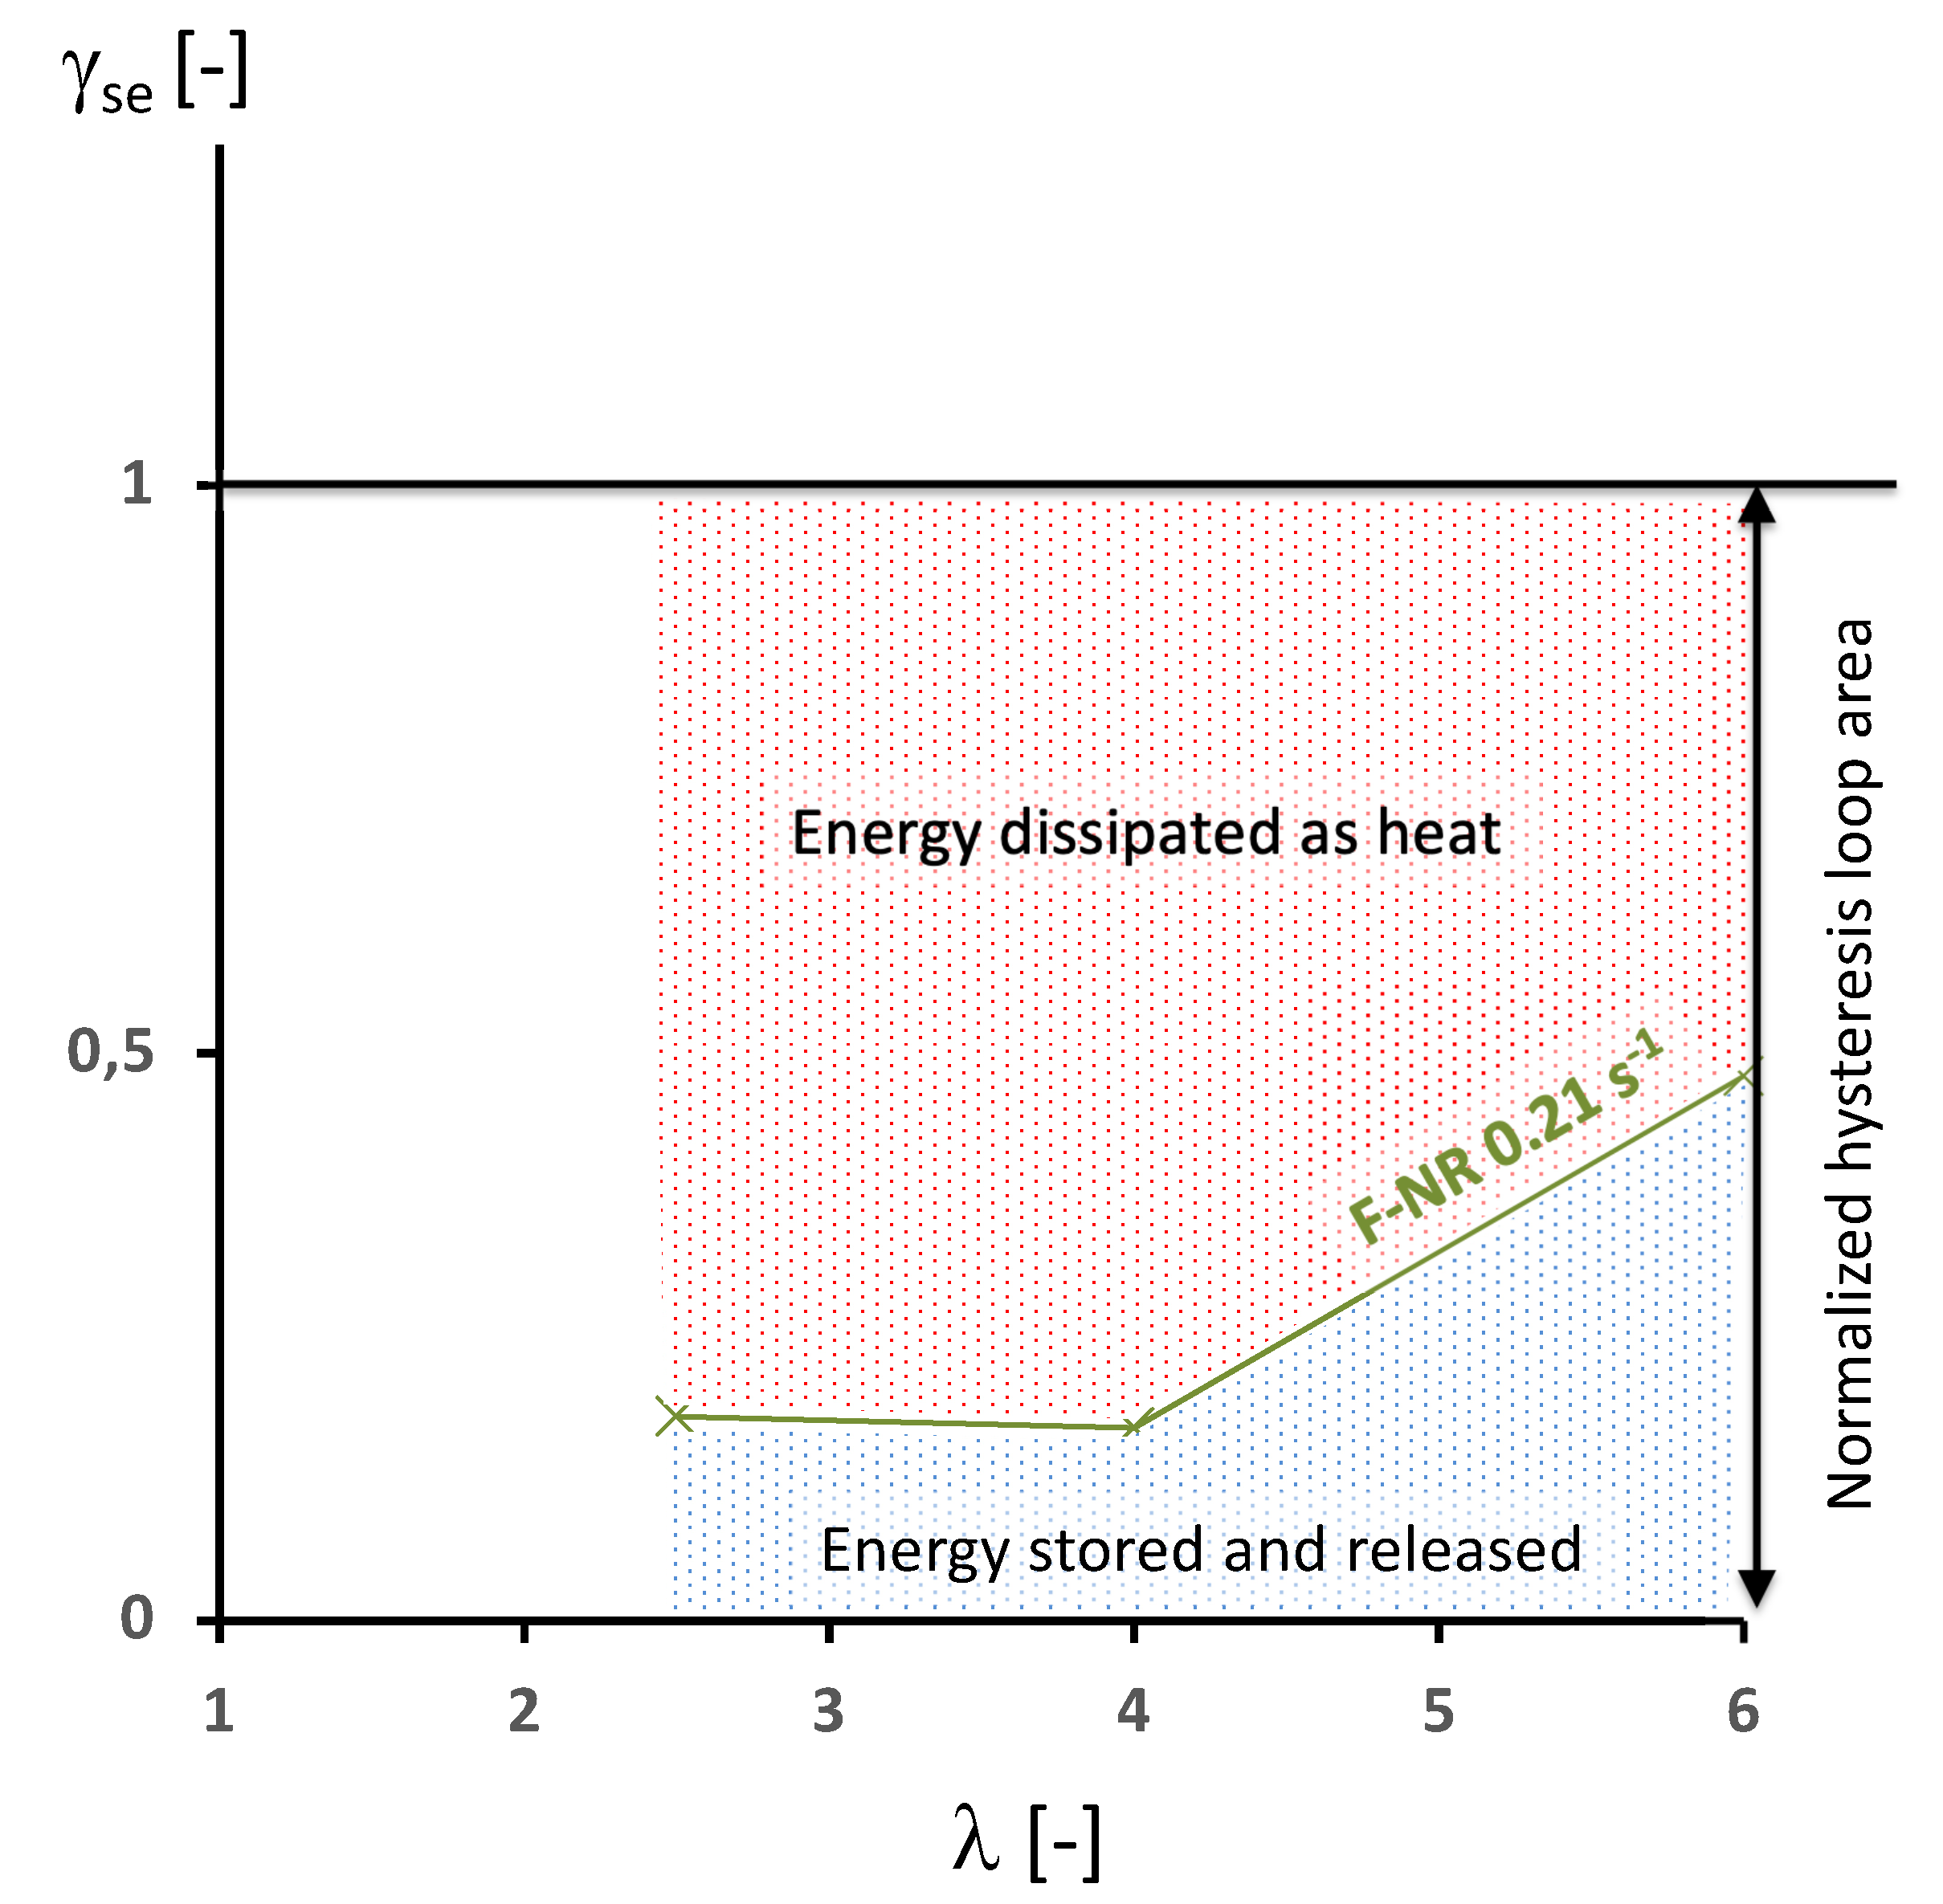
- if tends to 0, no energy is stored during the deformation. The whole hysteresis loop is due to the intrinsic dissipation,
- if tends to 1, the whole hysteresis loop is due to energy stored and no intrinsic dissipation is detected. This is typically the case in unfilled natural rubber [18], for which the energy stored in the crystallites is released with a different kinetics during their melting.
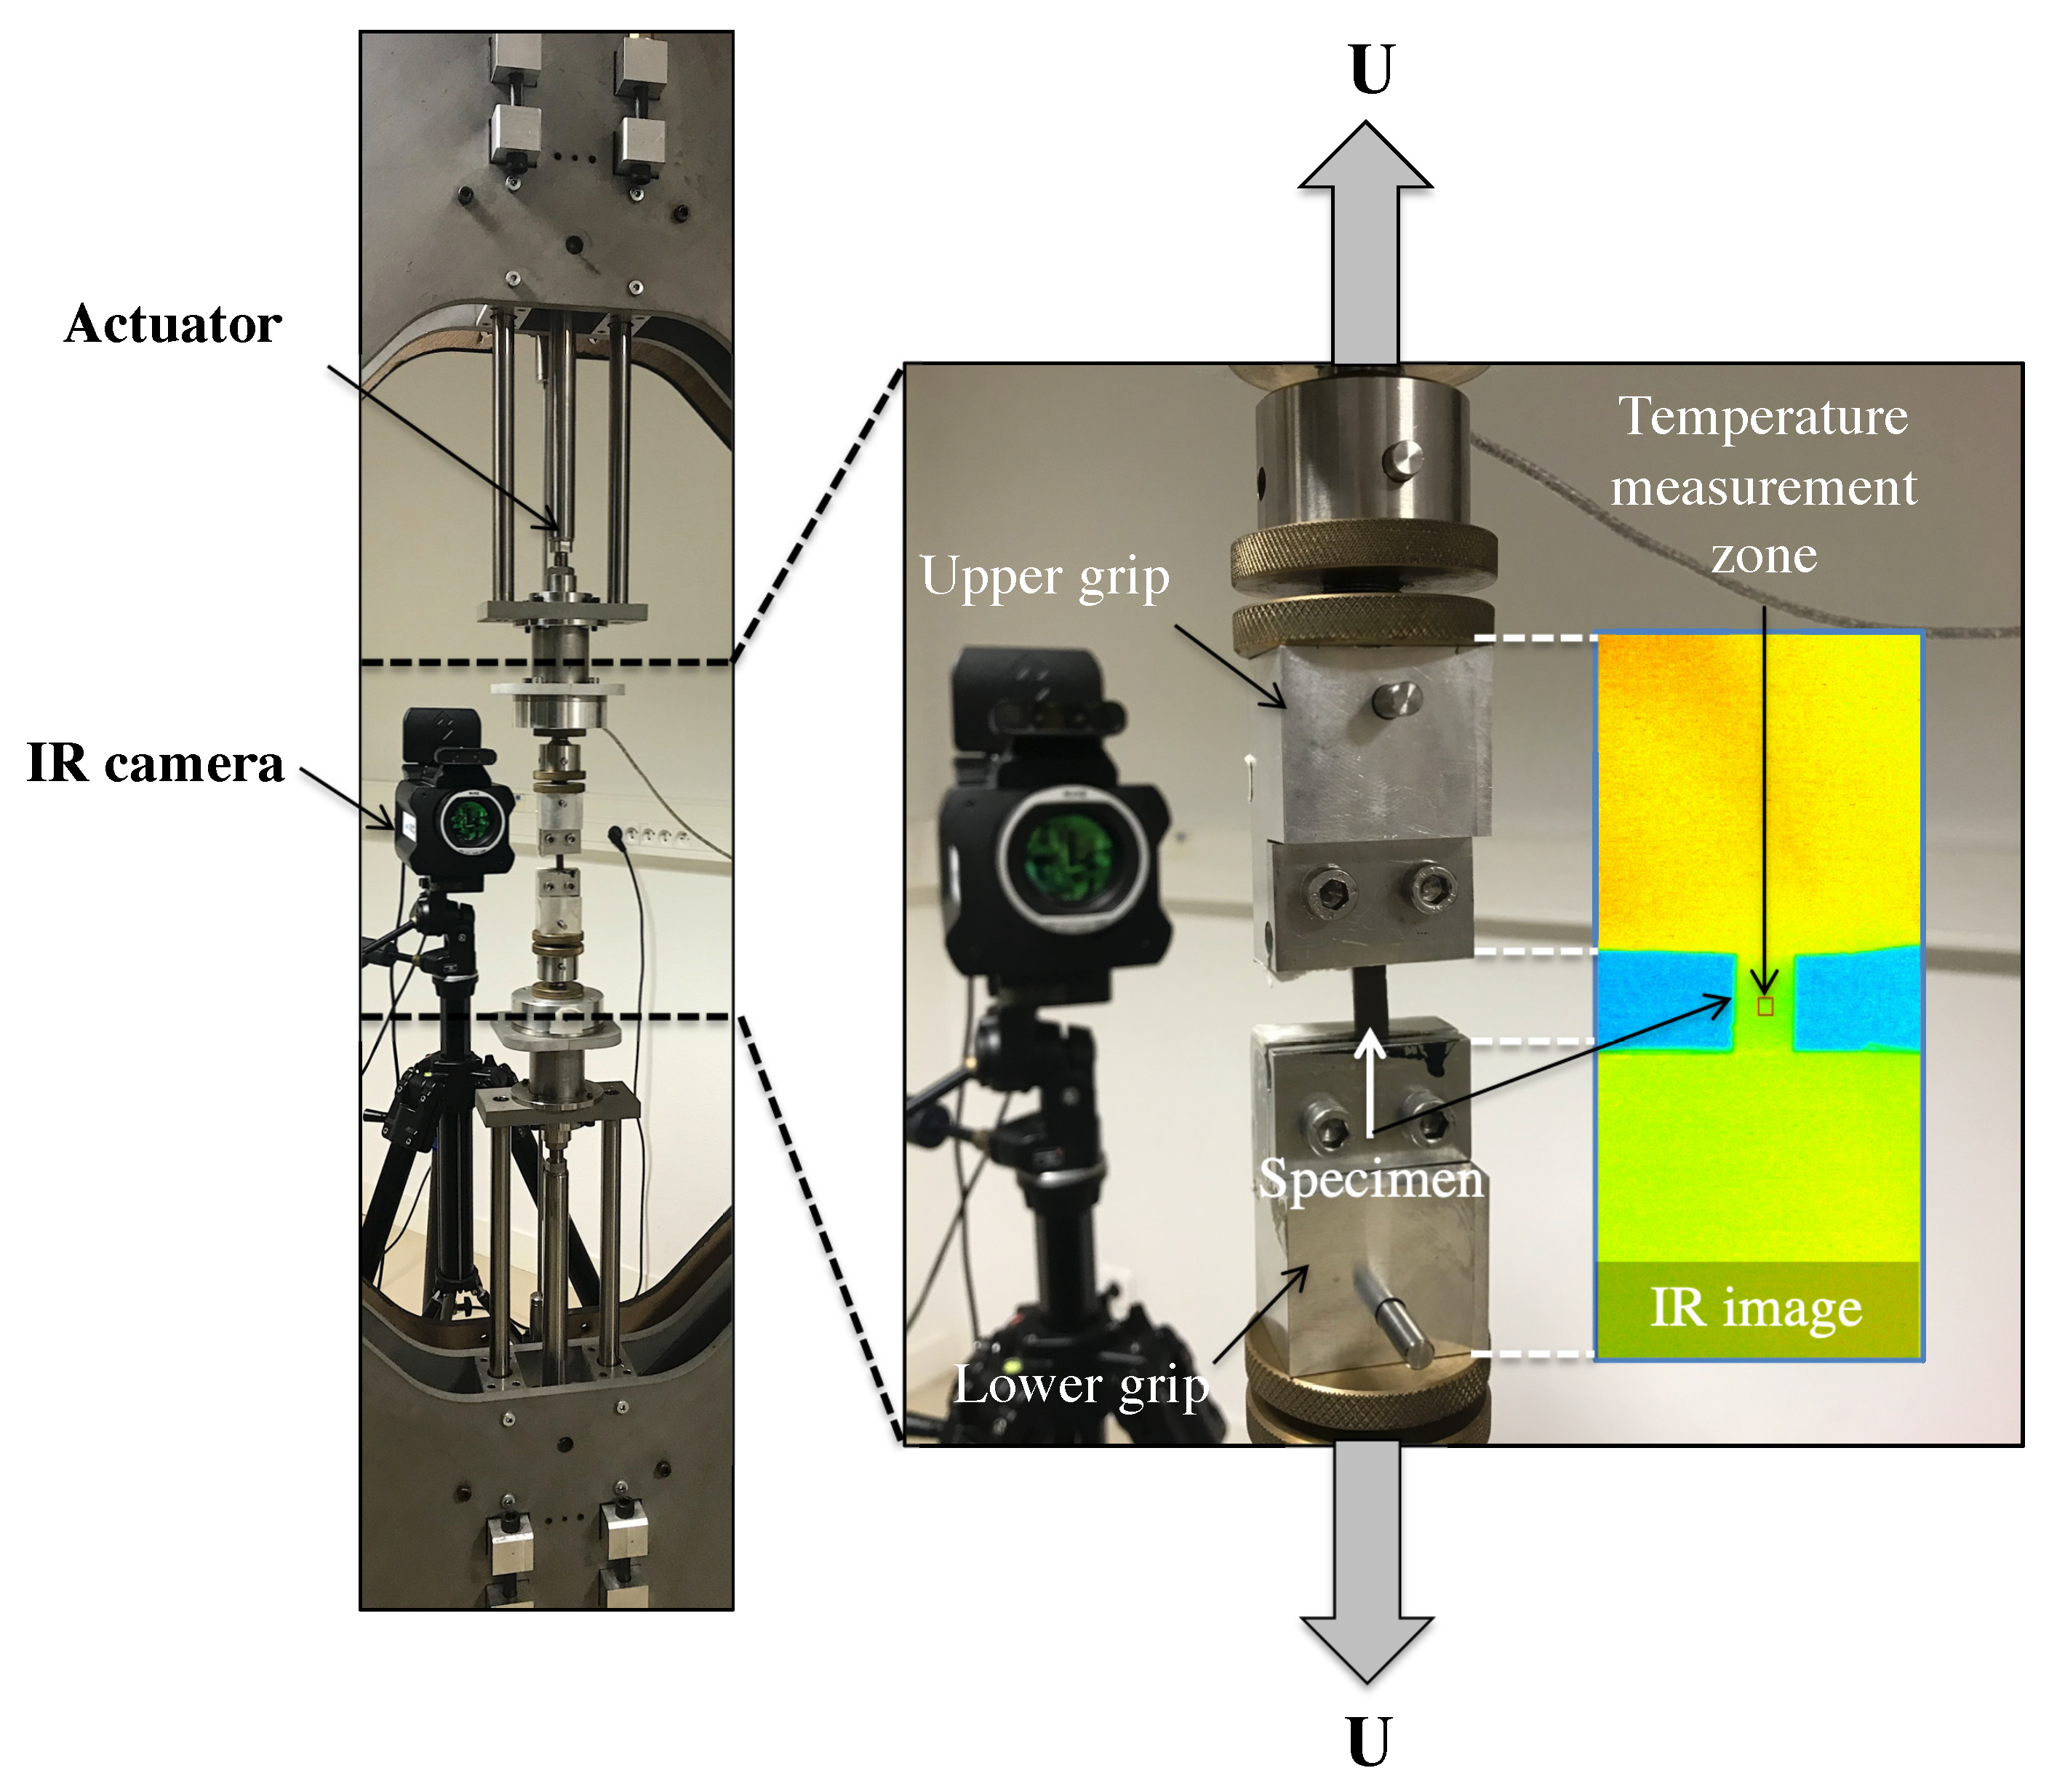
3. Overview of the Experimental Setups
- -
- -
- -
- an unfilled thermoplastic polyurethane, also crystallizable under tension, denoted TPU and studied in [45]. It is referred to as Irogran® A87H4615 TPU from the Huntsman corporation (The Woodlands, TX, USA). It is elaborated by reacting together a diisocyanate, a macro diol (long chain diol), which is a polyester in the present case, and a small molecule chain-extender (butane diol) [54].
Remark on the Temperature Measurement
4. Results and Discussion
5. Conclusions
Funding
Institutional Review Board Statement
Informed Consent Statement
Data Availability Statement
Acknowledgments
Conflicts of Interest
Abbreviations
| CB | Carbon Black |
| F-NR | Filled Natural Rubber |
| F-NBR | Filled Nitrile Butadiene Rubber (acrylonitrile rubber) |
| phr | part per hundred of rubber in weight |
| NR | Natural Rubber |
| SIC | Strain-Induced Crystallization |
| TPU | Thermoplastic PolyUrethane |
| U-NR | Unfilled Natural Rubber |
References
- Cadwell, S.M.; Merril, R.A.; Sloman, C.M.; Yost, F.L. Dynamic fatigue life of rubber. Ind. Eng. Chem. 1940, 12, 19–23. [Google Scholar]
- Beatty, J.R. Fatigue of rubber. Rubber Chem. Technol. 1964, 37, 1341–1364. [Google Scholar] [CrossRef]
- Mars, W.V.; Fatemi, A. A literature survey on fatigue analysis approaches for rubber. Int. J. Fatigue 2002, 24, 949–961. [Google Scholar] [CrossRef]
- Saintier, N.; Cailletaud, G.; Piques, R. Multiaxial fatigue life prediction for a natural rubber. Int. J. Fatigue 2006, 28, 530–539. [Google Scholar] [CrossRef] [Green Version]
- Le Cam, J.B.; Verron, E.; Huneau, B. Description of fatigue damage in carbon black filled natural rubber. Fatigue Fract. Eng. Mater. Struct. 2008, 31, 1031–1038. [Google Scholar] [CrossRef]
- Masquelier, I. Influence of Formulation on the Fatigue Properties of Elastomeric Materials. Ph.D. Thesis, Université de Bretagne Occidentale, Brest, France, 2014. [Google Scholar]
- Ruellan, B.; Le Cam, J.B.; Jeanneau, I.; Canévet, F.; Mortier, F.; Robin, E. Fatigue of natural rubber under different temperatures. Int. J. Fatigue 2019, 124, 544–557. [Google Scholar] [CrossRef]
- Greensmith, H.W.; Thomas, A.G. Rupture of rubber-III-Determination of tear properties. J. Polym. Sci. 1955, 18, 189–200. [Google Scholar] [CrossRef]
- Greensmith, H.W. Rupture of rubber-IV-Tear properties of vulcanizated containing carbon black. J. Polym. Sci. 1956, 21, 175–187. [Google Scholar] [CrossRef]
- Lindley, P. Non-relaxing crack growth and fatigue in a non-crystallizing rubber. Rubber Chem. Technol. 1974, 47, 1253–1264. [Google Scholar] [CrossRef]
- Lake, G.J.; Lindley, P.B. Role of ozone in dynamic cut growth of rubber. J. Appl. Polym. Sci. 1965, 9, 2031–2045. [Google Scholar] [CrossRef]
- Gent, A.N.; Liu, G.L.; Sueyasu, T. Effect of temperature and oxygen on the strength of elastomers. Rubber Chem. Technol. 1991, 64, 96–107. [Google Scholar] [CrossRef]
- Le Saux, V. Fatigue and Ageing of Rubbers under Marine and Thermal Environments: From Accelerated Tests to Structure Numerical Simulations. Ph.D. Thesis, Université de Bretagne Occidentale, Brest, France, 2010. [Google Scholar]
- Emminger, C.; Çakmak, U.D.; Preuer, R.; Graz, I.; Major, Z. Hyperelastic Material Parameter Determination and Numerical Study of TPU and PDMS Dampers. Materials 2021, 14, 7639. [Google Scholar] [CrossRef]
- Xie, Z.; Sebald, G.; Guyomar, D. Comparison of elastocaloric effect of natural rubber with other caloric effects on different-scale cooling application cases. Appl. Therm. Eng. 2017, 111, 914–926. [Google Scholar] [CrossRef]
- Coativy, G.; Haissoune, H.; Seveyrat, L.; Sebald, G.; Chazeau, L.; Chenal, J.M.; Lebrun, L. Elastocaloric properties of thermoplastic polyurethane. Appl. Phys. Lett. 2020, 117, 193903. [Google Scholar] [CrossRef]
- Candau, N.; Vives, E.; Fernández, A.I.; Maspoch, M.L. Elastocaloric effect in vulcanized natural rubber and natural/wastes rubber blends. Polymer 2021, 236, 124309. [Google Scholar] [CrossRef]
- Samaca Martinez, J.R.; Le Cam, J.B.; Balandraud, X.; Toussaint, E.; Caillard, J. Mechanisms of deformation in crystallizable natural rubber. Part 2: Quantitative calorimetric analysis. Polymer 2013, 54, 2727–2736. [Google Scholar] [CrossRef] [Green Version]
- Clark, G.L.; Kabler, M.; Blaker, E.; Ball, J.M. Hysteresis in crystallization of stretched vulcanized rubber from X-ray data. Ind. Eng. Chem. 1940, 32, 1474–1477. [Google Scholar] [CrossRef]
- Trabelsi, S. Etude Statique et Dynamique de la Cristallisation des Élastomères Sous Tension. Ph.D. Thesis, University of Paris 11, Paris, France, 2002. [Google Scholar]
- Samaca Martinez, J.R.; Le Cam, J.B.; Balandraud, X.; Toussaint, E.; Caillard, J. Mechanisms of deformation in crystallizable natural rubber. Part 1: Thermal characterization. Polymer 2013, 54, 2717–2726. [Google Scholar] [CrossRef]
- Le Cam, J.B. Energy storage due to strain-induced crystallization in natural rubber: The physical origin of the mechanical hysteresis. Polymer 2017, 127, 166–173. [Google Scholar] [CrossRef]
- D’Ambrosio, P.; De Tommasi, D.; Ferri, D.; Puglisi, G. A phenomenological model for healing and hysteresis in rubber-like materials. Int. J. Eng. Sci. 2008, 46, 293–305. [Google Scholar] [CrossRef]
- Dorfmann, K.N.G.F.A.; Ogden, R.W. Modelling dilatational stress softening of rubber. In Constitutive Models for Rubber III; Busfield, J., Muhr, A., Eds.; Balkema: London, UK, 2003; pp. 253–261. [Google Scholar]
- Rey, T.; Chagnon, G.; Favier, D.; Le Cam, J.B. Hyperelasticity with rate-independent microsphere hysteresis model for rubberlike materials. Comput. Mater. Sci. 2014, 90, 89–98. [Google Scholar] [CrossRef] [Green Version]
- Vandenbroucke, A.; Laurent, H.; Hocine, N.A.; Rio, G. A Hyperelasto-Visco-Hysteresis model for an elastomeric behaviour: Experimental and numerical investigations. Comput. Mater. Sci. 2010, 48, 495–503. [Google Scholar] [CrossRef]
- Mott, P.; Giller, C.; Fragiadakis, D.; Rosenberg, D.; Roland, C. Deformation of polyurea: Where does the energy go? Polymer 2016, 105, 227–233. [Google Scholar] [CrossRef]
- Marco, Y.; Huneau, B.; Masquelier, I.; Le Saux, V.; Charrier, P. Prediction of fatigue properties of natural rubber based on the descriptions of the cracks population and of the dissipated energy. Polym. Test. 2017, 59, 67–74. [Google Scholar] [CrossRef] [Green Version]
- Li, L.; Ji, H.; Yang, H.; Zhang, L.; Zhou, X.; Wang, R. Itaconate Based Elastomer as a Green Alternative to Styrene–Butadiene Rubber for Engineering Applications: Performance Comparison. Processes 2020, 8, 1527. [Google Scholar] [CrossRef]
- Lee, S.H.; Park, S.Y.; Chung, K.H.; Jang, K.S. Phlogopite-Reinforced Natural Rubber (NR)/Ethylene-Propylene-Diene Monomer Rubber (EPDM) Composites with Aminosilane Compatibilizer. Polymers 2021, 13, 2318. [Google Scholar] [CrossRef]
- Maciejewska, M.; Sowińska, A.; Grocholewicz, A. Zinc Complexes with 1,3-Diketones as Activators for Sulfur Vulcanization of Styrene-Butadiene Elastomer Filled with Carbon Black. Materials 2021, 14, 3804. [Google Scholar] [CrossRef] [PubMed]
- Araujo-Morera, J.; Verdugo-Manzanares, R.; González, S.; Verdejo, R.; Lopez-Manchado, M.A.; Hernández Santana, M. On the Use of Mechano-Chemically Modified Ground Tire Rubber (GTR) as Recycled and Sustainable Filler in Styrene-Butadiene Rubber (SBR) Composites. J. Compos. Sci. 2021, 5, 68. [Google Scholar] [CrossRef]
- Surya, I.; Waesateh, K.; Masa, A.; Hayeemasae, N. Selectively Etched Halloysite Nanotubes as Performance Booster of Epoxidized Natural Rubber Composites. Polymers 2021, 13, 3536. [Google Scholar] [CrossRef]
- Farren, W.S.; Taylor, G.I. The Heat Developed during Plastic Extension of Metals. Proc. R. Soc. Lond. Math. Phys. Eng. Sci. 1925, 107, 422–451. [Google Scholar]
- Taylor, G.I.; Quinney, H. The Latent Energy Remaining in a Metal after Cold Working. Proc. R. Soc. Lond. Math. Phys. Eng. Sci. 1934, 143, 307–326. [Google Scholar] [CrossRef]
- Chrysochoos, A. Energy balance for elastic plastic deformation at finite strain (in French). J. Méc. Appl. 1985, 5, 589–614. [Google Scholar]
- Chrysochoos, A.; Maisonneuve, O.; Martin, G.; Caumon, H.; Chezeau, J.O. Plastic and dissipated work and stored energy. Nucl. Eng. Des. 1989, 114, 323–333. [Google Scholar] [CrossRef]
- Mason, J.; Rosakis, A.; Ravichandran, G. On the strain and strain rate dependence of the fraction of plastic work converted to heat: An experimental study using high speed infrared detectors and the Kolsky bar. Mech. Mater. 1994, 17, 135–145. [Google Scholar] [CrossRef]
- Rittel, D. On the conversion of plastic work to heat during high strain rate deformation of glassy polymers. Mech. Mater. 1999, 31, 131–139. [Google Scholar] [CrossRef]
- Oliferuk, W.; Maj, M.; Raniecki, B. Experimental analysis of energy storage rate components during tensile deformation of polycrystals. Mater. Sci. Eng. A 2004, 374, 77–81. [Google Scholar] [CrossRef]
- Rittel, D. An investigation of the heat generated during cyclic loading of two glassy polymers. Part I: Experimental. Mech. Mater. 2000, 32, 131–147. [Google Scholar] [CrossRef]
- Rittel, D.; Rabin, Y. An investigation of the heat generated during cyclic loading of two glassy polymers. Part II: Thermal analysis. Mech. Mater. 2000, 32, 149–159. [Google Scholar] [CrossRef]
- Benaarbia, A.; Chrysochoos, A.; Robert, G. Kinetics of stored and dissipated energies associated with cyclic loadings of dry polyamide 6.6 specimens. Polym. Test. 2014, 34, 155–167. [Google Scholar] [CrossRef] [Green Version]
- Benaarbia, A.; Chrysochoos, A.; Robert, G. Influence of relative humidity and loading frequency on the PA6.6 thermomechanical cyclic behavior: Part II. Energy aspects. Polym. Test. 2015, 41, 92–98. [Google Scholar] [CrossRef] [Green Version]
- Lachhab, A.; Robin, E.; Le Cam, J.B.; Mortier, F.; Tirel, Y.; Canevet, F. Energy stored during deformation of crystallizing TPU foams. Strain 2018, 54, e12271. [Google Scholar] [CrossRef]
- Loukil, M.; Corvec, G.; Robin, E.; Miroir, M.; Le Cam, J.B.; Garnier, P. Stored energy accompanying cyclic deformation of filled rubber. Eur. Polym. J. 2018, 98, 448–455. [Google Scholar] [CrossRef]
- Khiem, V.; Le Cam, J.B.; Charlès, S.; Itskov, M. Thermodynamics of strain-induced crystallization in filled natural rubber under uni- and biaxial loadings. Part I: Complete energetic characterization and crystallinity evaluation. J. Mech. Phys. Solids 2022, 159, 104701. [Google Scholar] [CrossRef]
- Marchal, J. Cristallisation des Caoutchoucs Chargés et Non Chargés Sous Contrainte: Effet sur les Chaînes Amorphes. Ph.D. Thesis, Université de Paris 11, Paris, France, 2006. [Google Scholar]
- Chrysochoos, A.; Huon, V.; Jourdan, F.; Muracciole, J.; Peyroux, R.; Wattrisse, B. Use of full-Field digital image correlation and infrared thermography measurements for the thermomechanical analysis of material behaviour. Strain 2010, 46, 117–130. [Google Scholar] [CrossRef]
- Caborgan, R. Contribution à L’analyse Expérimentale du Comportement Thermomécanique du Caoutchouc Naturel. Ph.D. Thesis, Université de Montpellier, Montpellier, France, 2011. [Google Scholar]
- Chrysochoos, A. Analyse du comportement des matériaux par thermographie Infra Rouge. Colloq. Photomécanique 1995, 95, 201–211. [Google Scholar]
- Chrysochoos, A.; Louche, H. An infrared image processing to analyse the calorific effects accompanying strain localisation. Int. J. Eng. Sci. 2000, 38, 1759–1788. [Google Scholar] [CrossRef]
- Charlès, S.; Le Cam, J.B. Inverse identification from heat source fields: A local approach applied to hyperelasticity. Strain 2020, 56, e12334. [Google Scholar] [CrossRef]
- Primel, A.; Ferec, J.; Ausias, G.; Tirel, Y.; Veille, J.M.; Grohens, Y. Solubility and interfacial tension of thermoplastic polyurethane melt in super-critical carbon dioxide and nitrogen. J. Supercrit. Fluids 2017, 122, 52–57. [Google Scholar] [CrossRef]
- Toki, S.; Fujimaki, T.; Okuyama, M. Strain-induced crystallization of natural rubber as detected real-time by wide-angle X-ray diffraction technique. Polymer 2000, 41, 5423–5429. [Google Scholar] [CrossRef]
- Trabelsi, S.; Albouy, P.A.; Rault, J. Effective local deformation in stretched filled rubber. Macromolecules 2003, 36, 9093–9099. [Google Scholar] [CrossRef]
- Grady, B.; Cooper, S. Thermoplastic elastomers. In The Science and Technology of Rubber; Mark, J.E., Erman, B., Eirich, F.R., Eds.; Elsevier Inc.: San Diego, CA, USA, 2005; pp. 555–618. [Google Scholar]
- Blundell, D.; Eeckhaut, G.; Fuller, W.; Mahendrasingam, A.; Martin, C. Real time SAXS/stress-strain studies of thermoplastic polyurethanes at large strains. Polymer 2002, 43, 5197–5207. [Google Scholar] [CrossRef]
- Yeh, F.; Hsiao, B.; Sauer, B.; Michael, S.; Siesler, H. In-situ studies of structure development during deformation of a segmented poly(urethane-urea) elastomer. Macromolecules 2003, 36, 1940–1954. [Google Scholar] [CrossRef]
- Unsal, E.; Yalcin, B.; Yilgor, I.; Yilgor, E.; Cakmak, M. Real time mechano-optical study on deformation behavior of PTMO/CHDI-based polyetherurethanes under uniaxial extension. Polymer 2009, 50, 4644–4655. [Google Scholar] [CrossRef]
- Scetta, G.; Euchler, E.; Ju, J.; Selles, N.; Heuillet, P.; Ciccotti, M.; Creton, C. Self-Organization at the Crack Tip of Fatigue-Resistant Thermoplastic Polyurethane Elastomers. Macromolecules 2021, 54, 8726–8737. [Google Scholar] [CrossRef]


| Ingredient | U-NR [21] | F-NR [47] |
|---|---|---|
| Natural rubber NR | 100 | 100 |
| Carbon black | 0 | 20–30 |
| Antioxidant | 1.9 | 2–4 |
| Stearic acid | 2 | 2 |
| Zinc oxide ZnO | 2.5 | 10 |
| Accelerator | 1.6 | 2–4 |
| Sulfur | 1.6 | 1.5 |
| Materials | |||
|---|---|---|---|
| Reference | U-NR | F-NR | TPU |
| [21] | [47] | [45] | |
| Filler type | - | CB | - |
| and amount (phr) | 0 | 20–30 | |
| Crystallizable under strain | Yes | Yes | Yes |
| Specimen geometry (mm): Width × Length × thickness | 5 × 10 × 1.4 | 10 × 24 × 2 | 9 × 20 × 5 |
| Testing machine | Instron 5543, one moving grip | Homemade biaxial tensile machine, symmetric loading | Instron 5543, one moving grip |
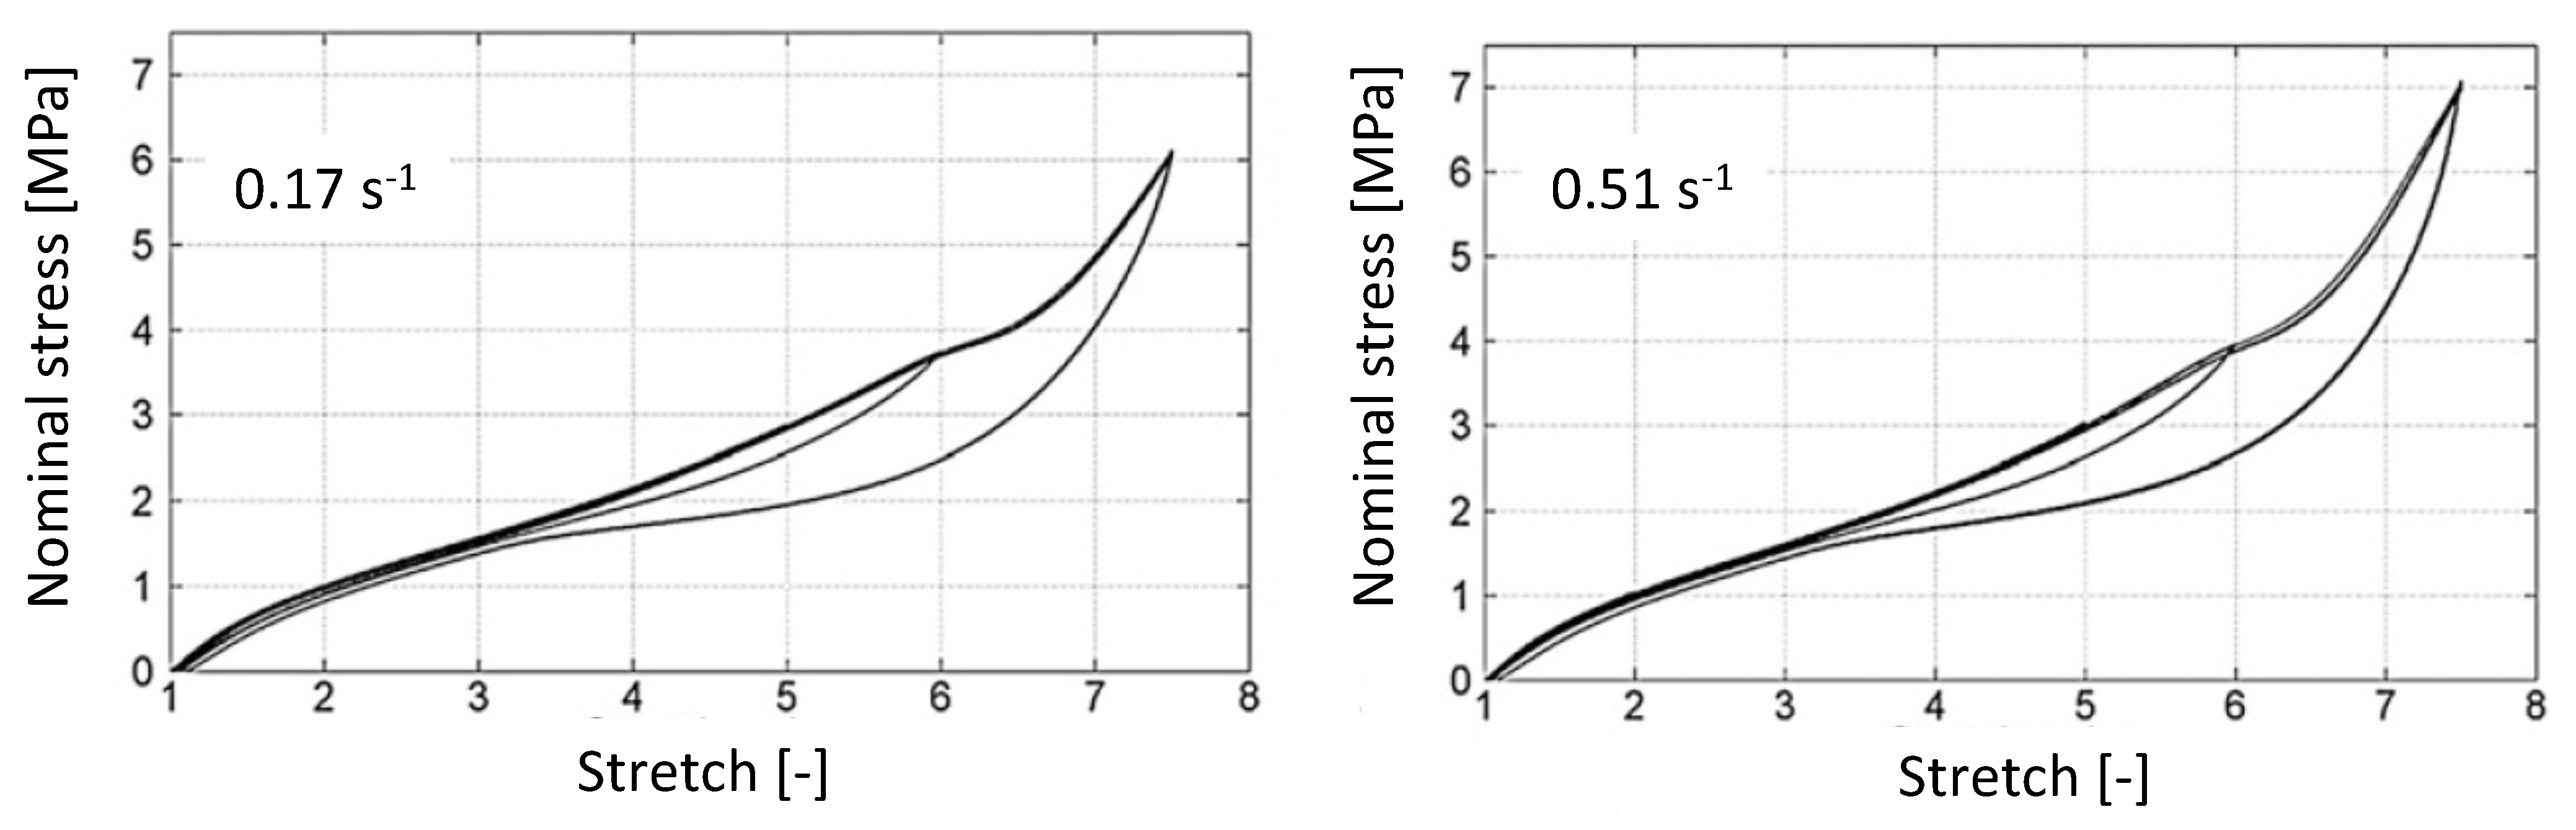
| Mechanical loading | 3 cycles at 2, 5, 6 and 7.5 | 3 cycles at 2.5, 4 and 6 | 5 cycles at 1.5, 2, 2.5 and 3 |
| Constant loading rate (mm/min)/strain rate (s) | ±100 and ±300/±0.17 and ±0.51 | ±300/±0.21 | ±100 and ±300/±0.08 and ±0.25 |
| Infrared camera, resolution | Cedip Jade III, 320 × 240 px | FLIR X6540sc, 640 × 512 px | FLIR X6540sc, 640 × 512 px |
| Motion compensation technique | Yes | No | Yes |
Publisher’s Note: MDPI stays neutral with regard to jurisdictional claims in published maps and institutional affiliations. |
© 2022 by the author. Licensee MDPI, Basel, Switzerland. This article is an open access article distributed under the terms and conditions of the Creative Commons Attribution (CC BY) license (https://creativecommons.org/licenses/by/4.0/).
Share and Cite
Le Cam, J.-B. Fast Evaluation and Comparison of the Energy Performances of Elastomers from Relative Energy Stored Identification under Mechanical Loadings. Polymers 2022, 14, 412. https://doi.org/10.3390/polym14030412
Le Cam J-B. Fast Evaluation and Comparison of the Energy Performances of Elastomers from Relative Energy Stored Identification under Mechanical Loadings. Polymers. 2022; 14(3):412. https://doi.org/10.3390/polym14030412
Chicago/Turabian StyleLe Cam, Jean-Benoît. 2022. "Fast Evaluation and Comparison of the Energy Performances of Elastomers from Relative Energy Stored Identification under Mechanical Loadings" Polymers 14, no. 3: 412. https://doi.org/10.3390/polym14030412