
Rapid Selective Detection and Quantification of β-Blockers Used in Doping Based on Molecularly Imprinted Nanoparticles (NanoMIPs)

 , , and
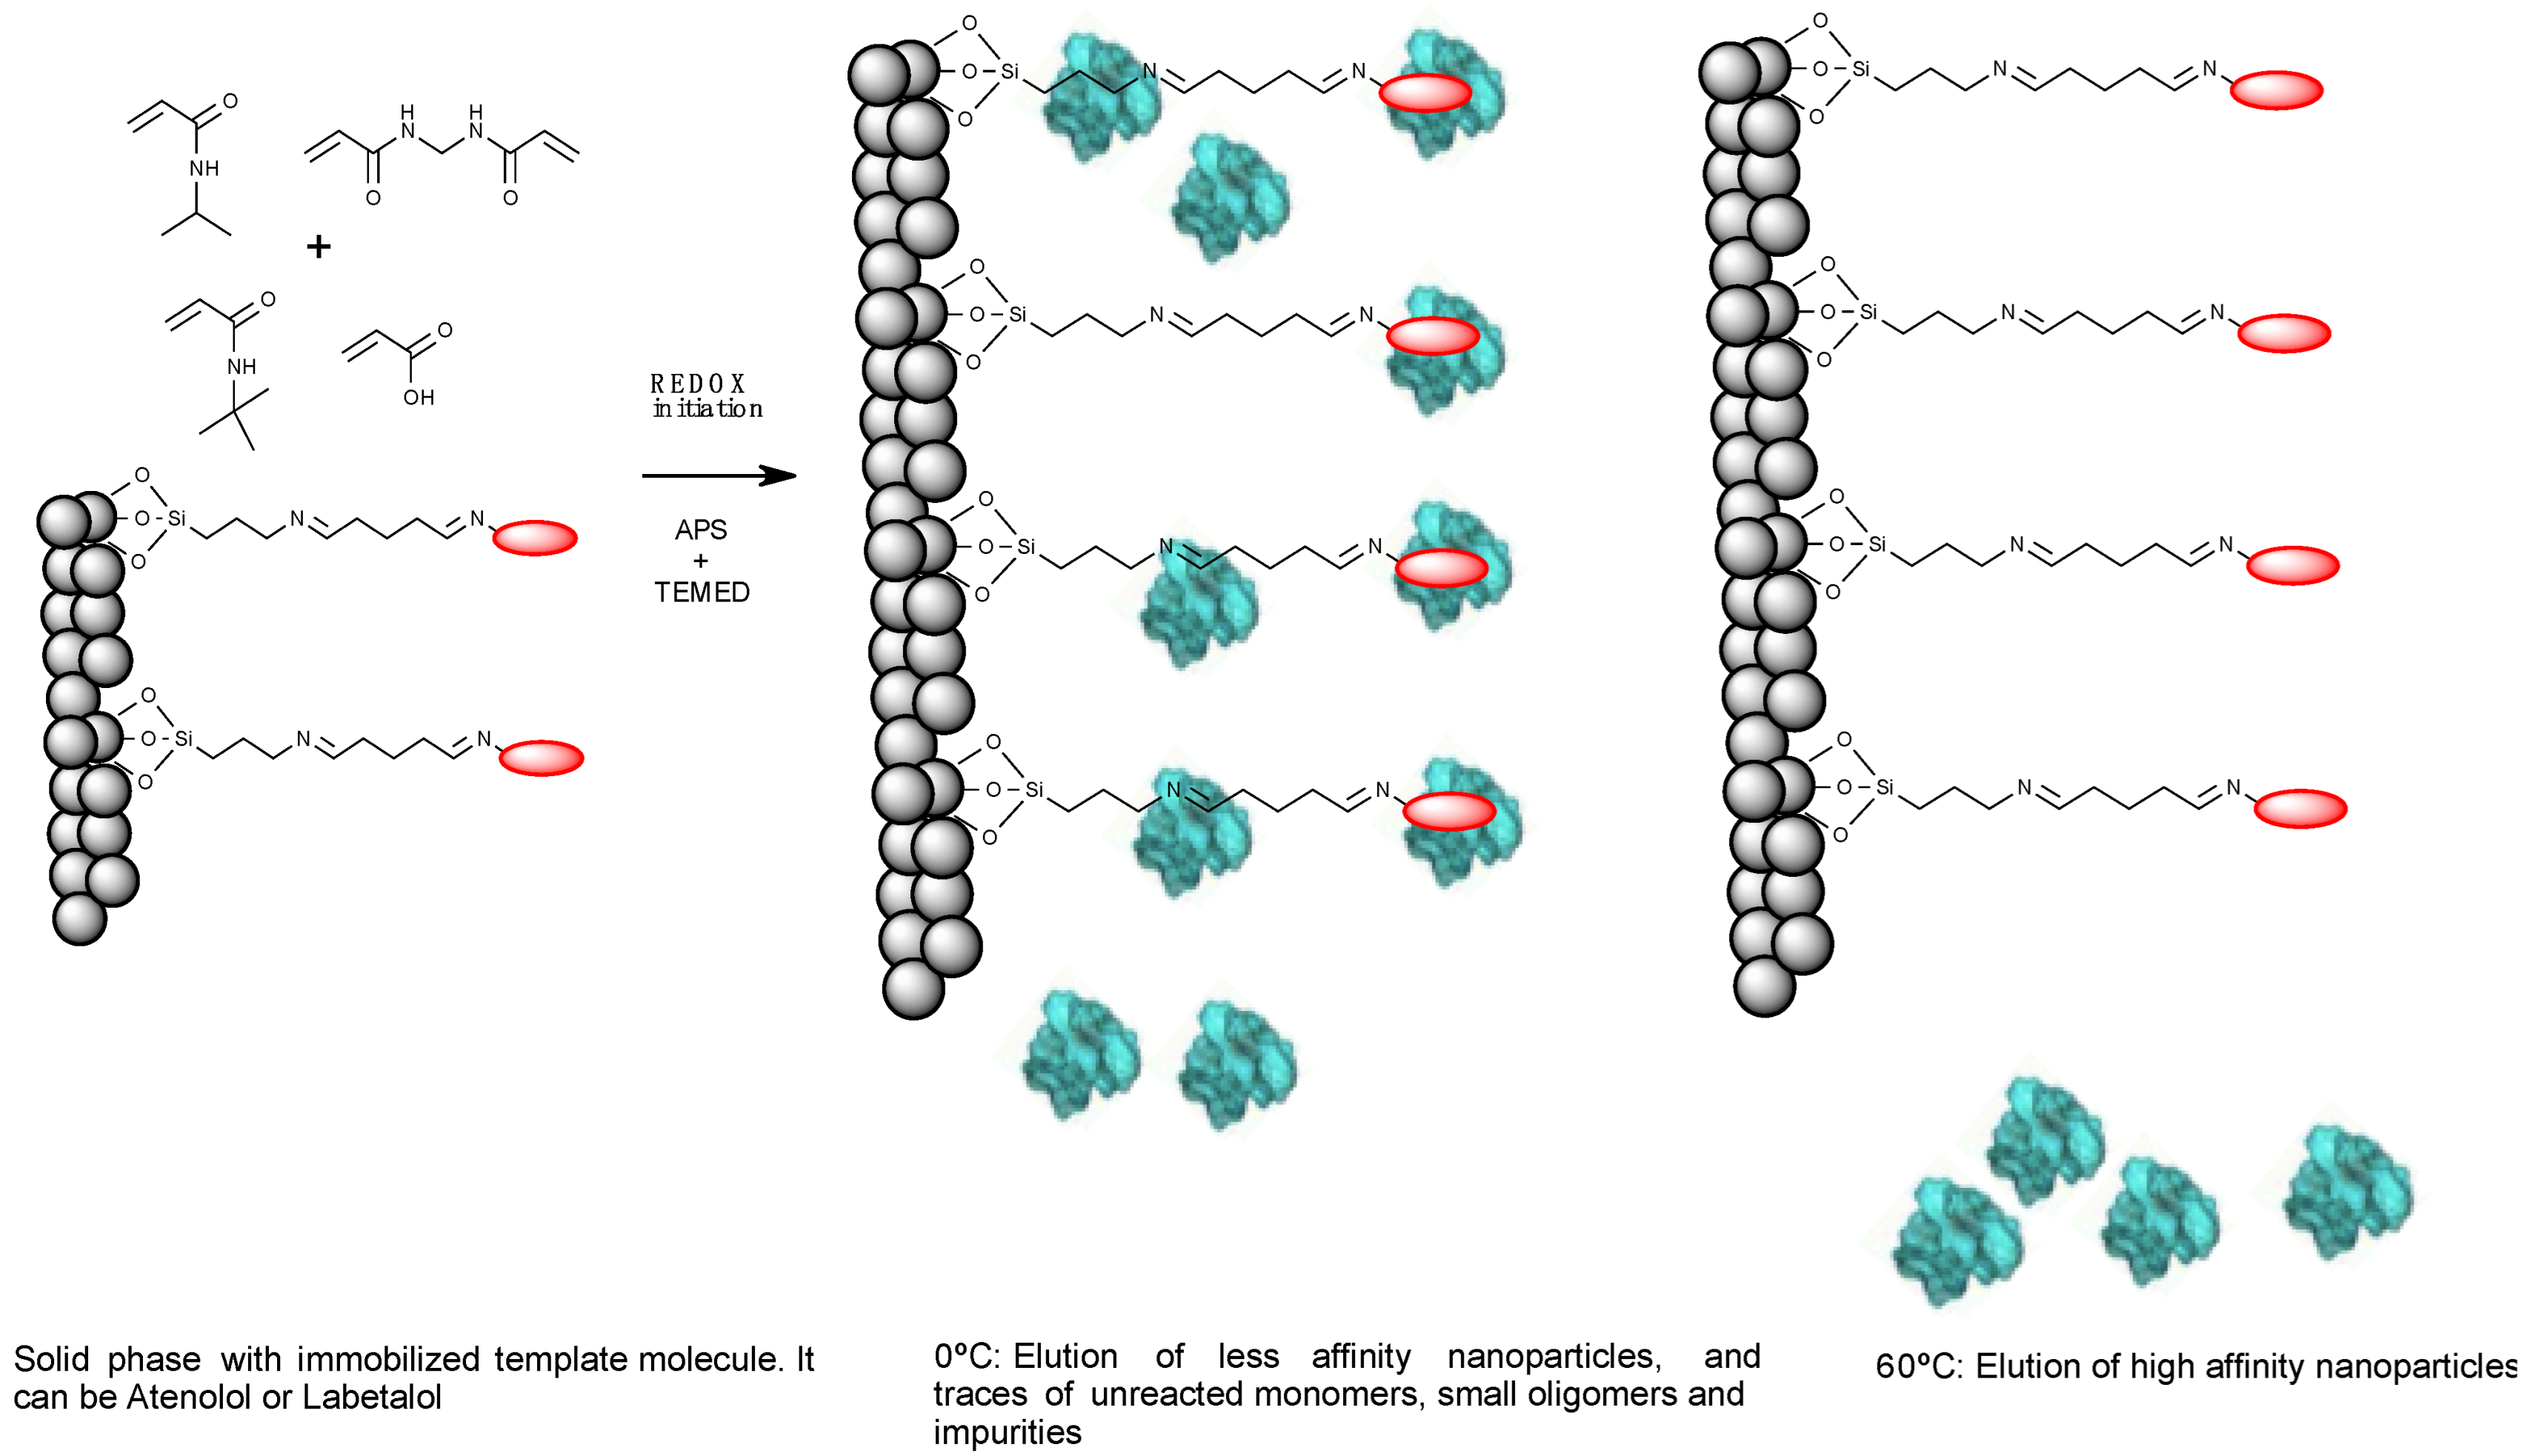
Abstract
:1. Introduction
2. Materials and Methods
2.1. Preparation of Solid-Phase with Immobilized Templates
2.2. Synthesis and Purification of NanoMIPs-A and NanoMIPs-L
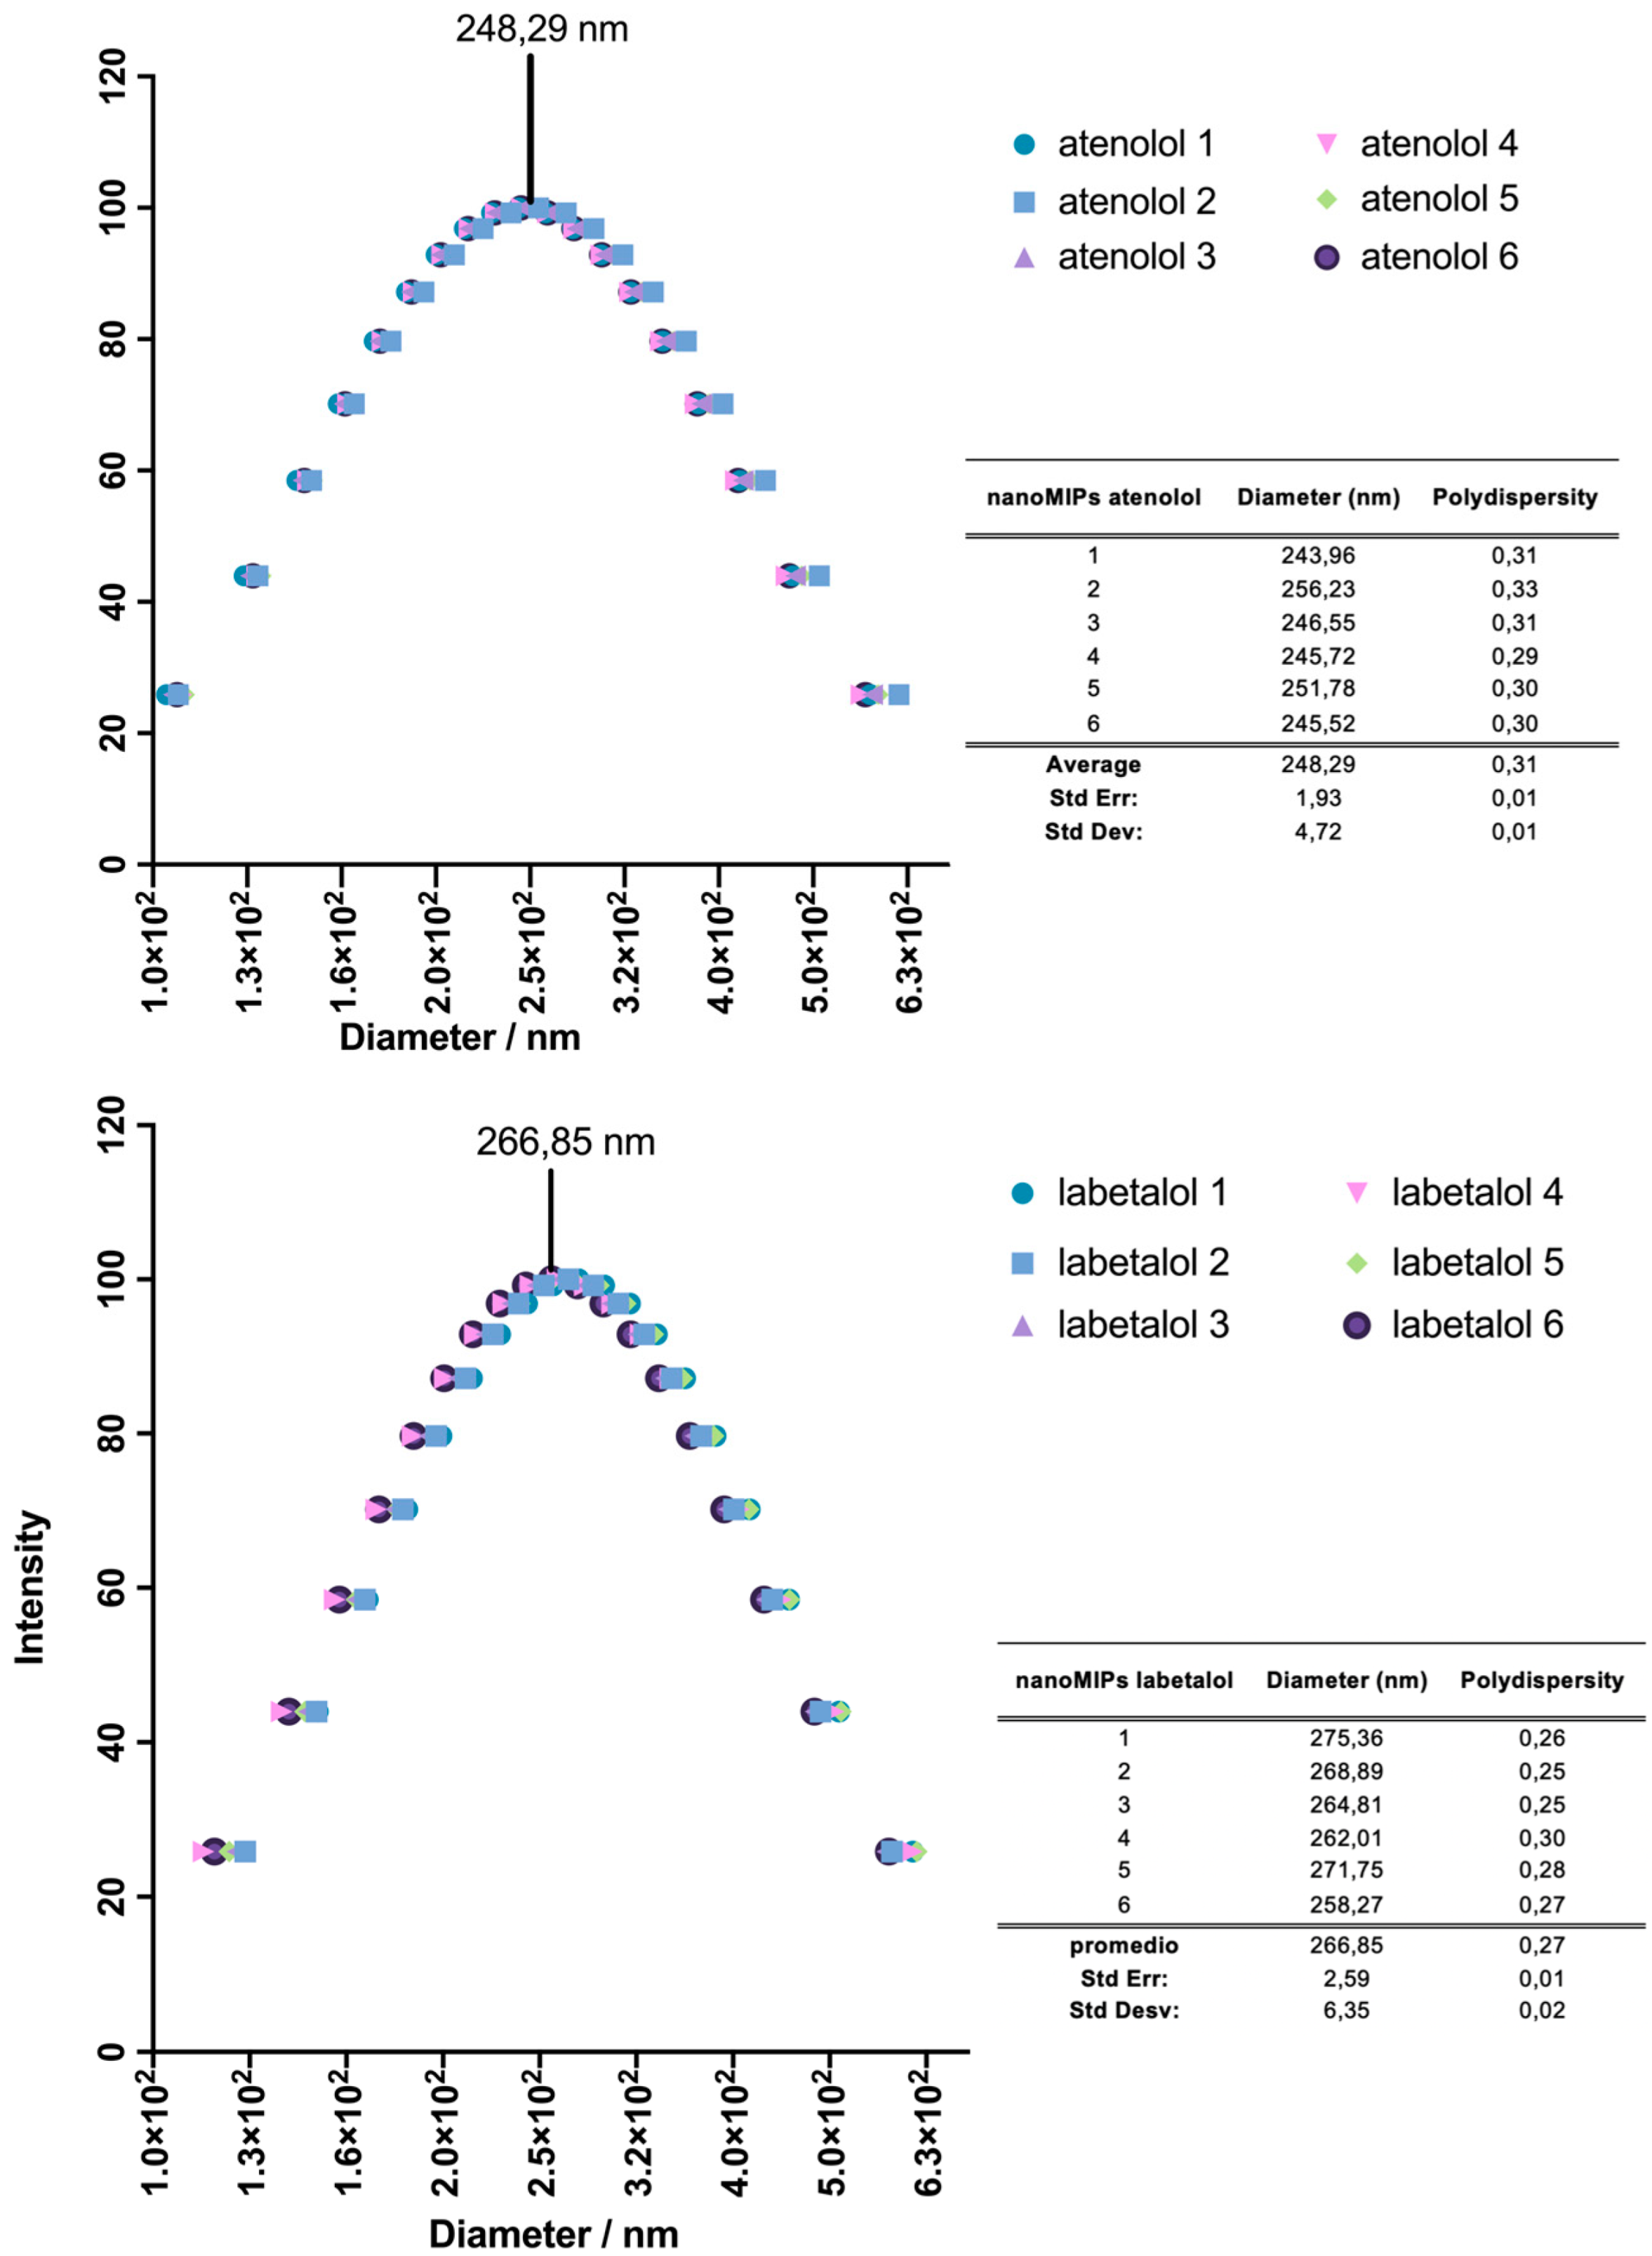
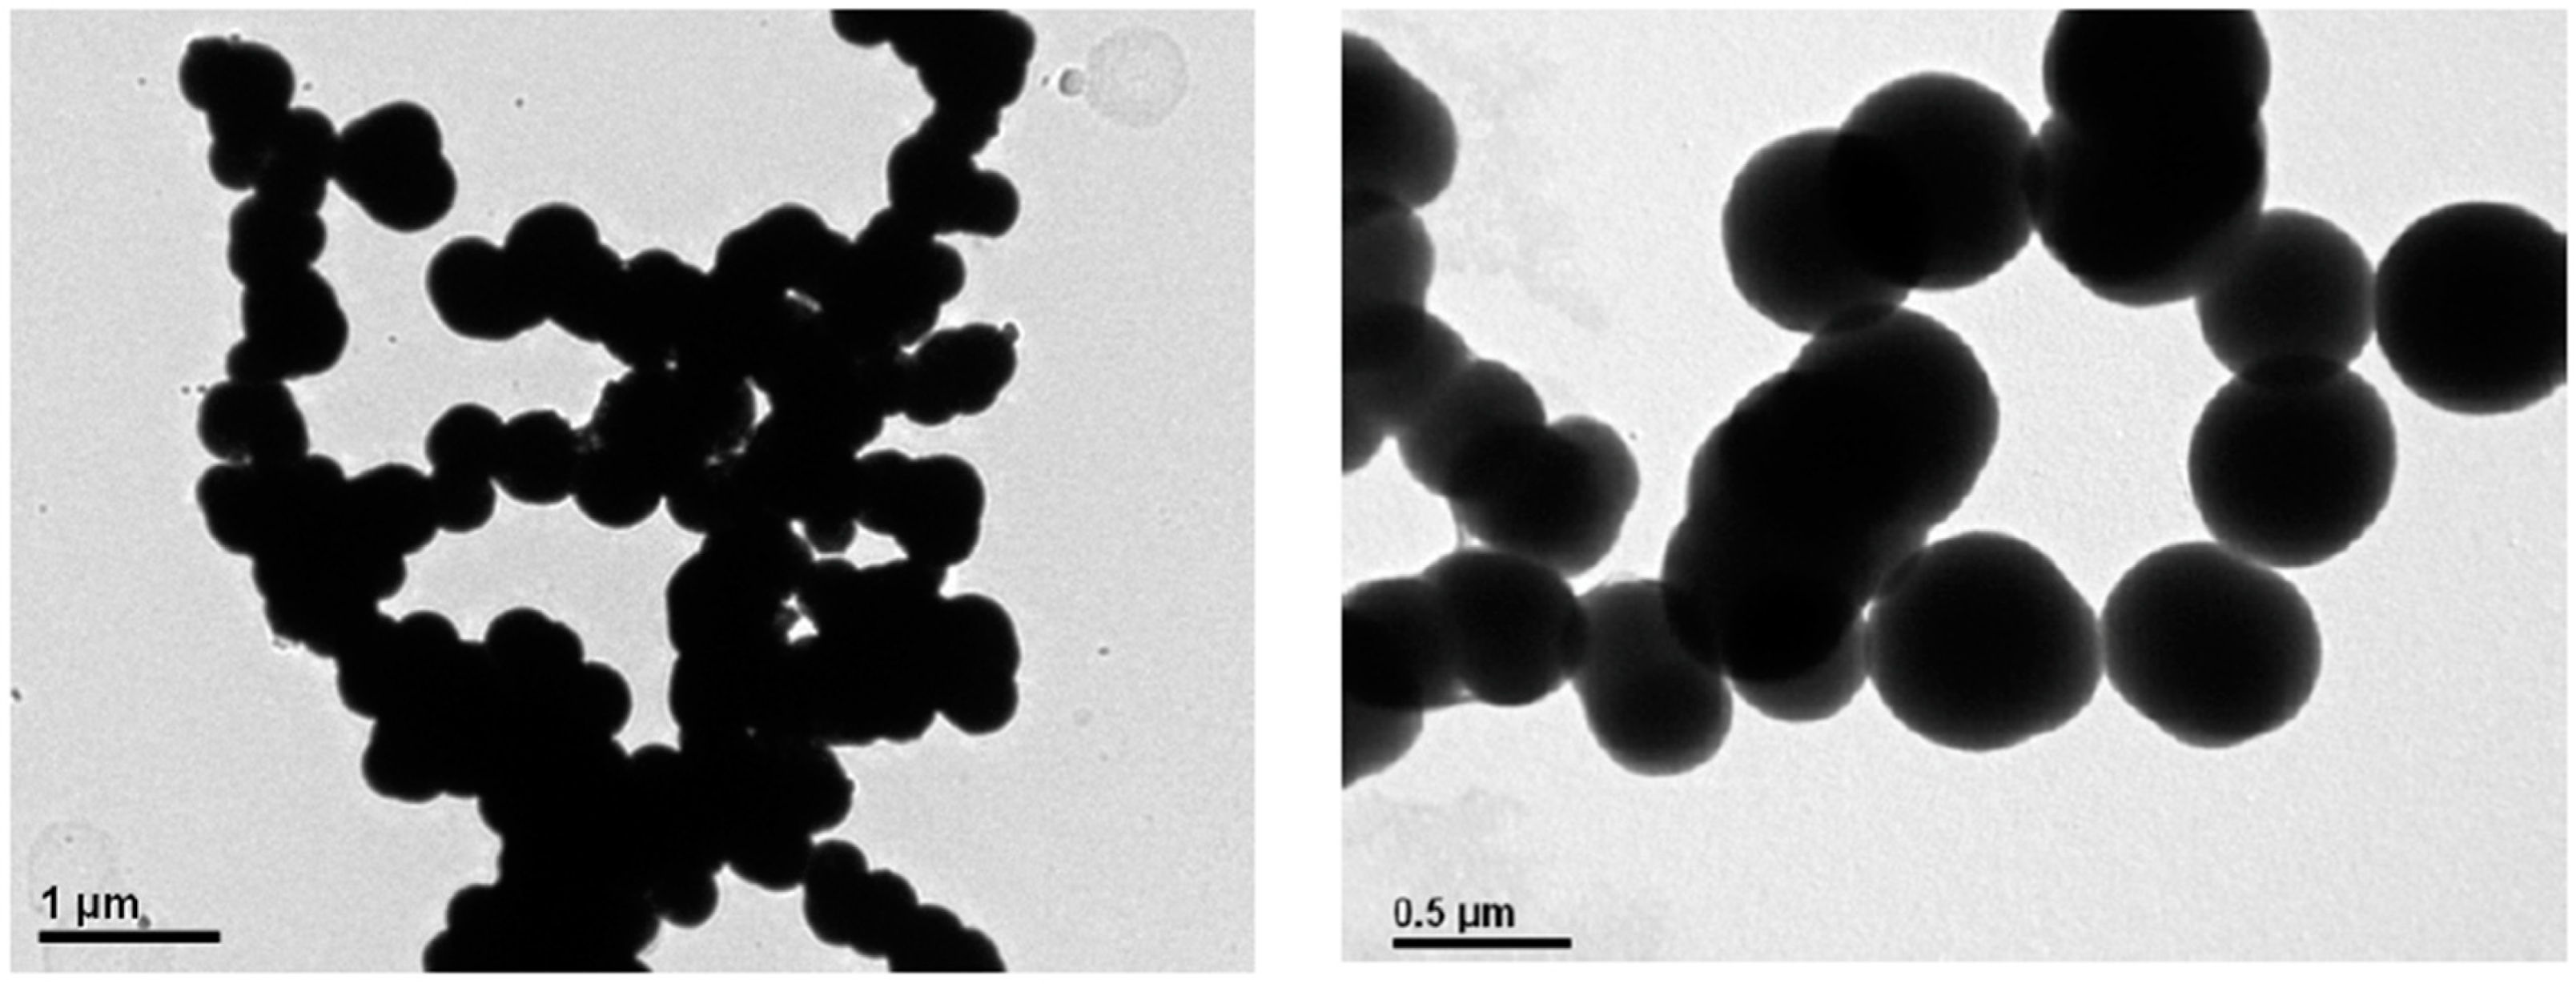
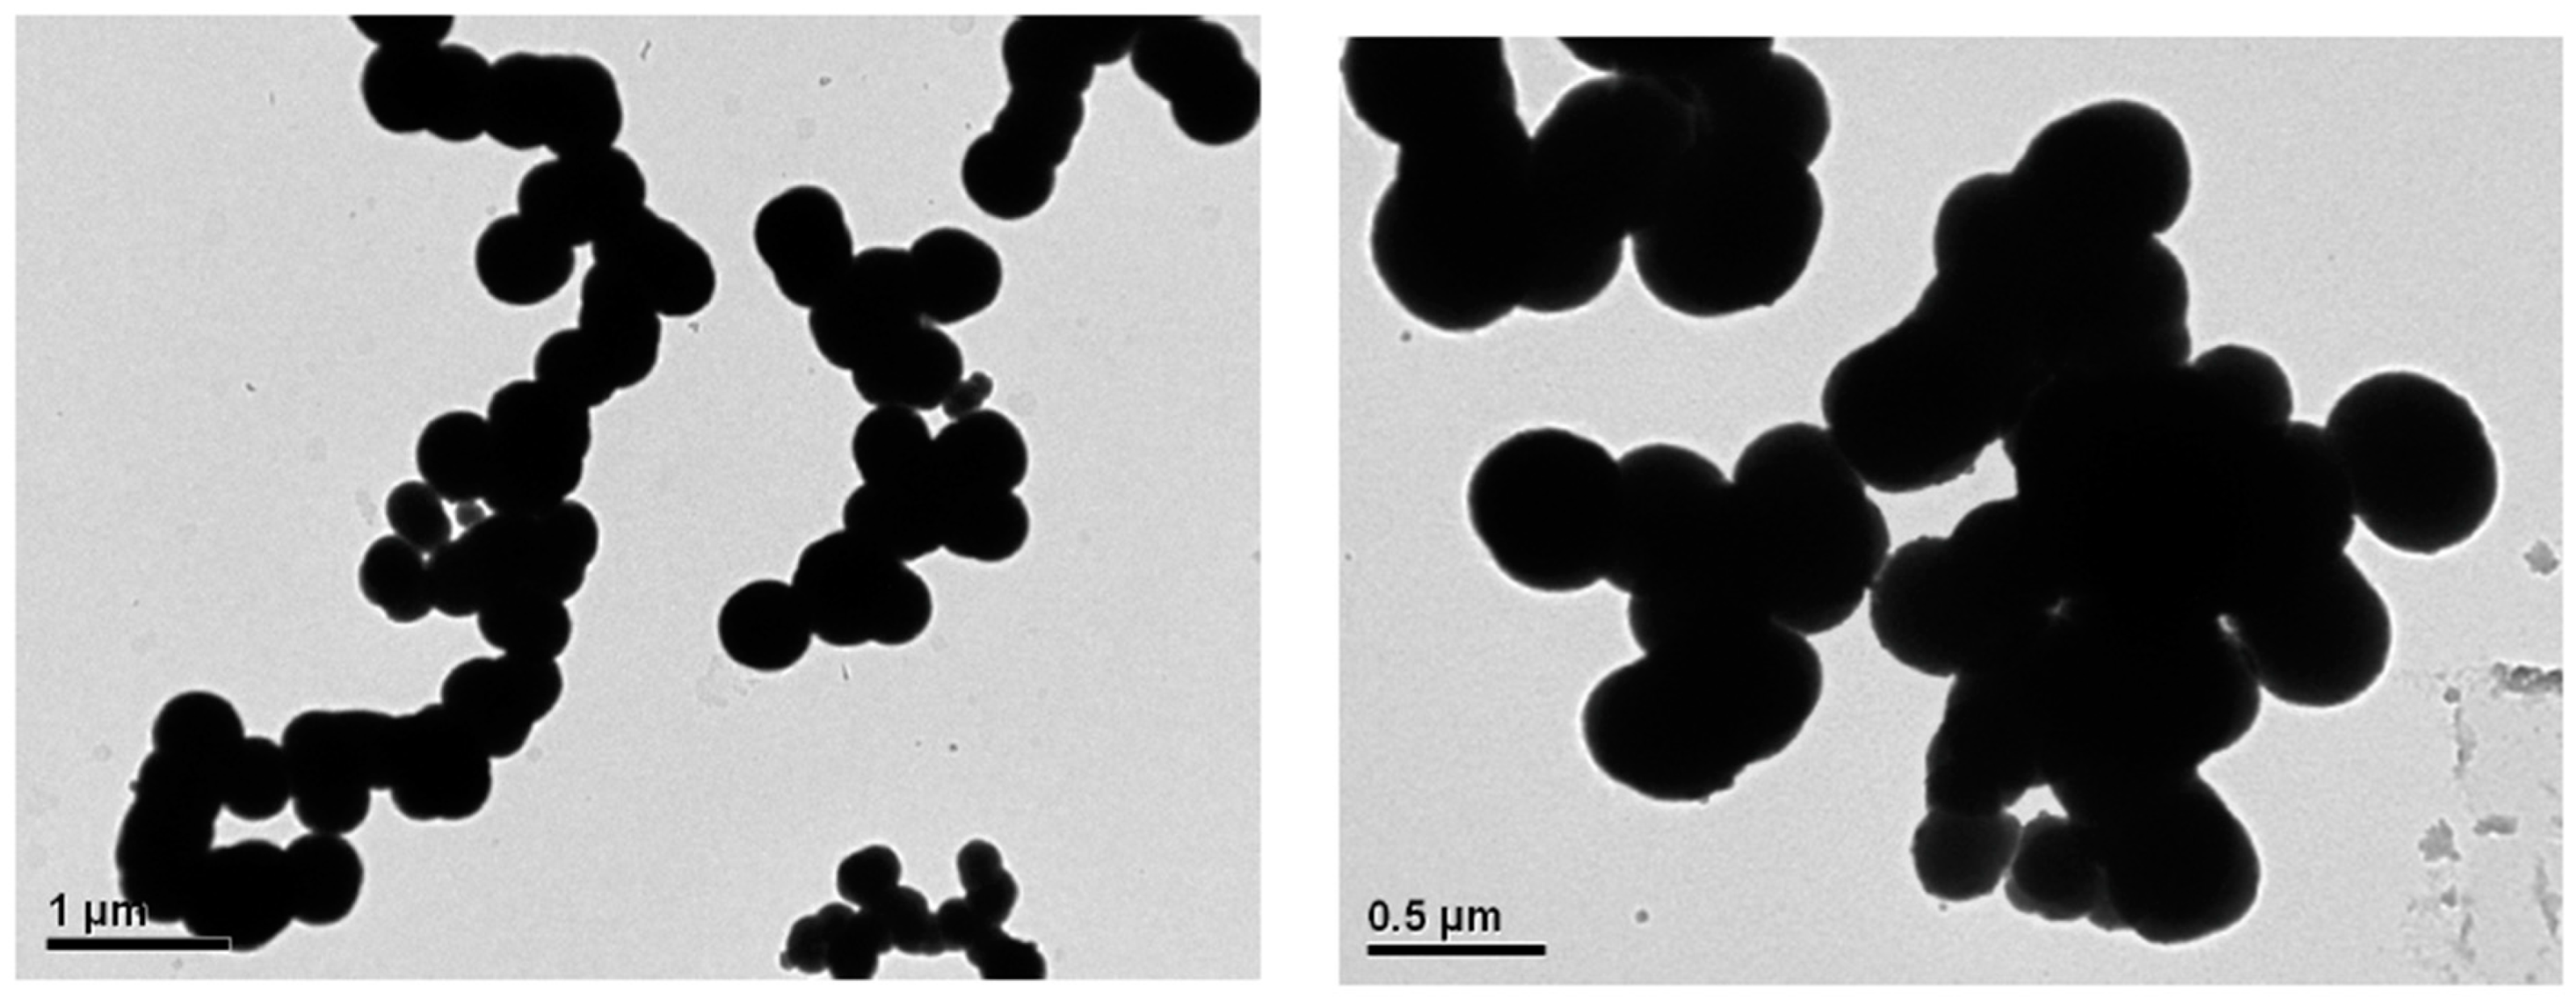
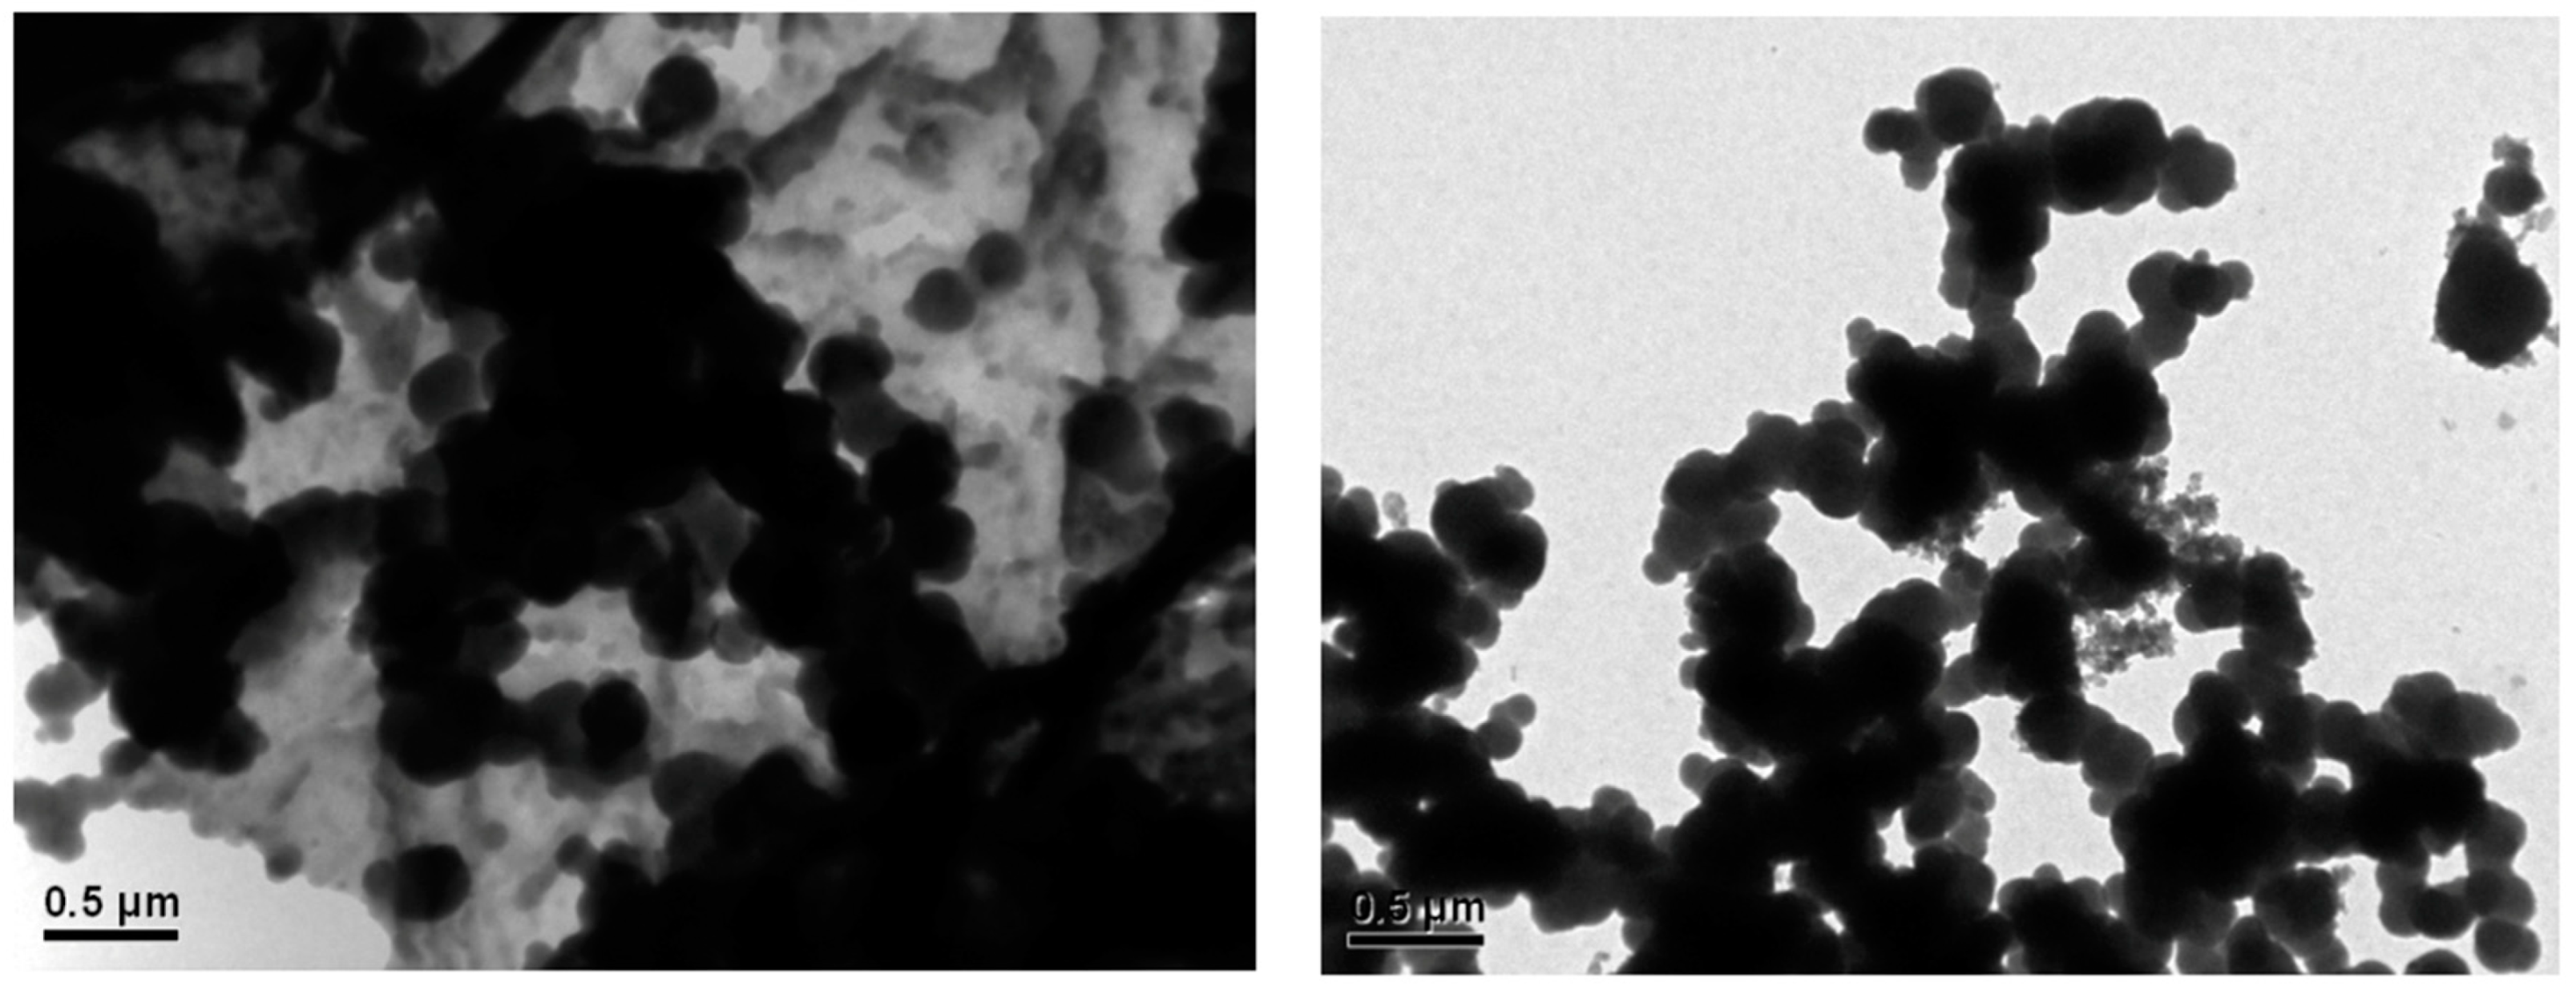
2.3. Characterization of the Size and Shape of NanoMIPs
2.4. Enzyme Linked Immunosorbent Assay (Pseudo-ELISA)
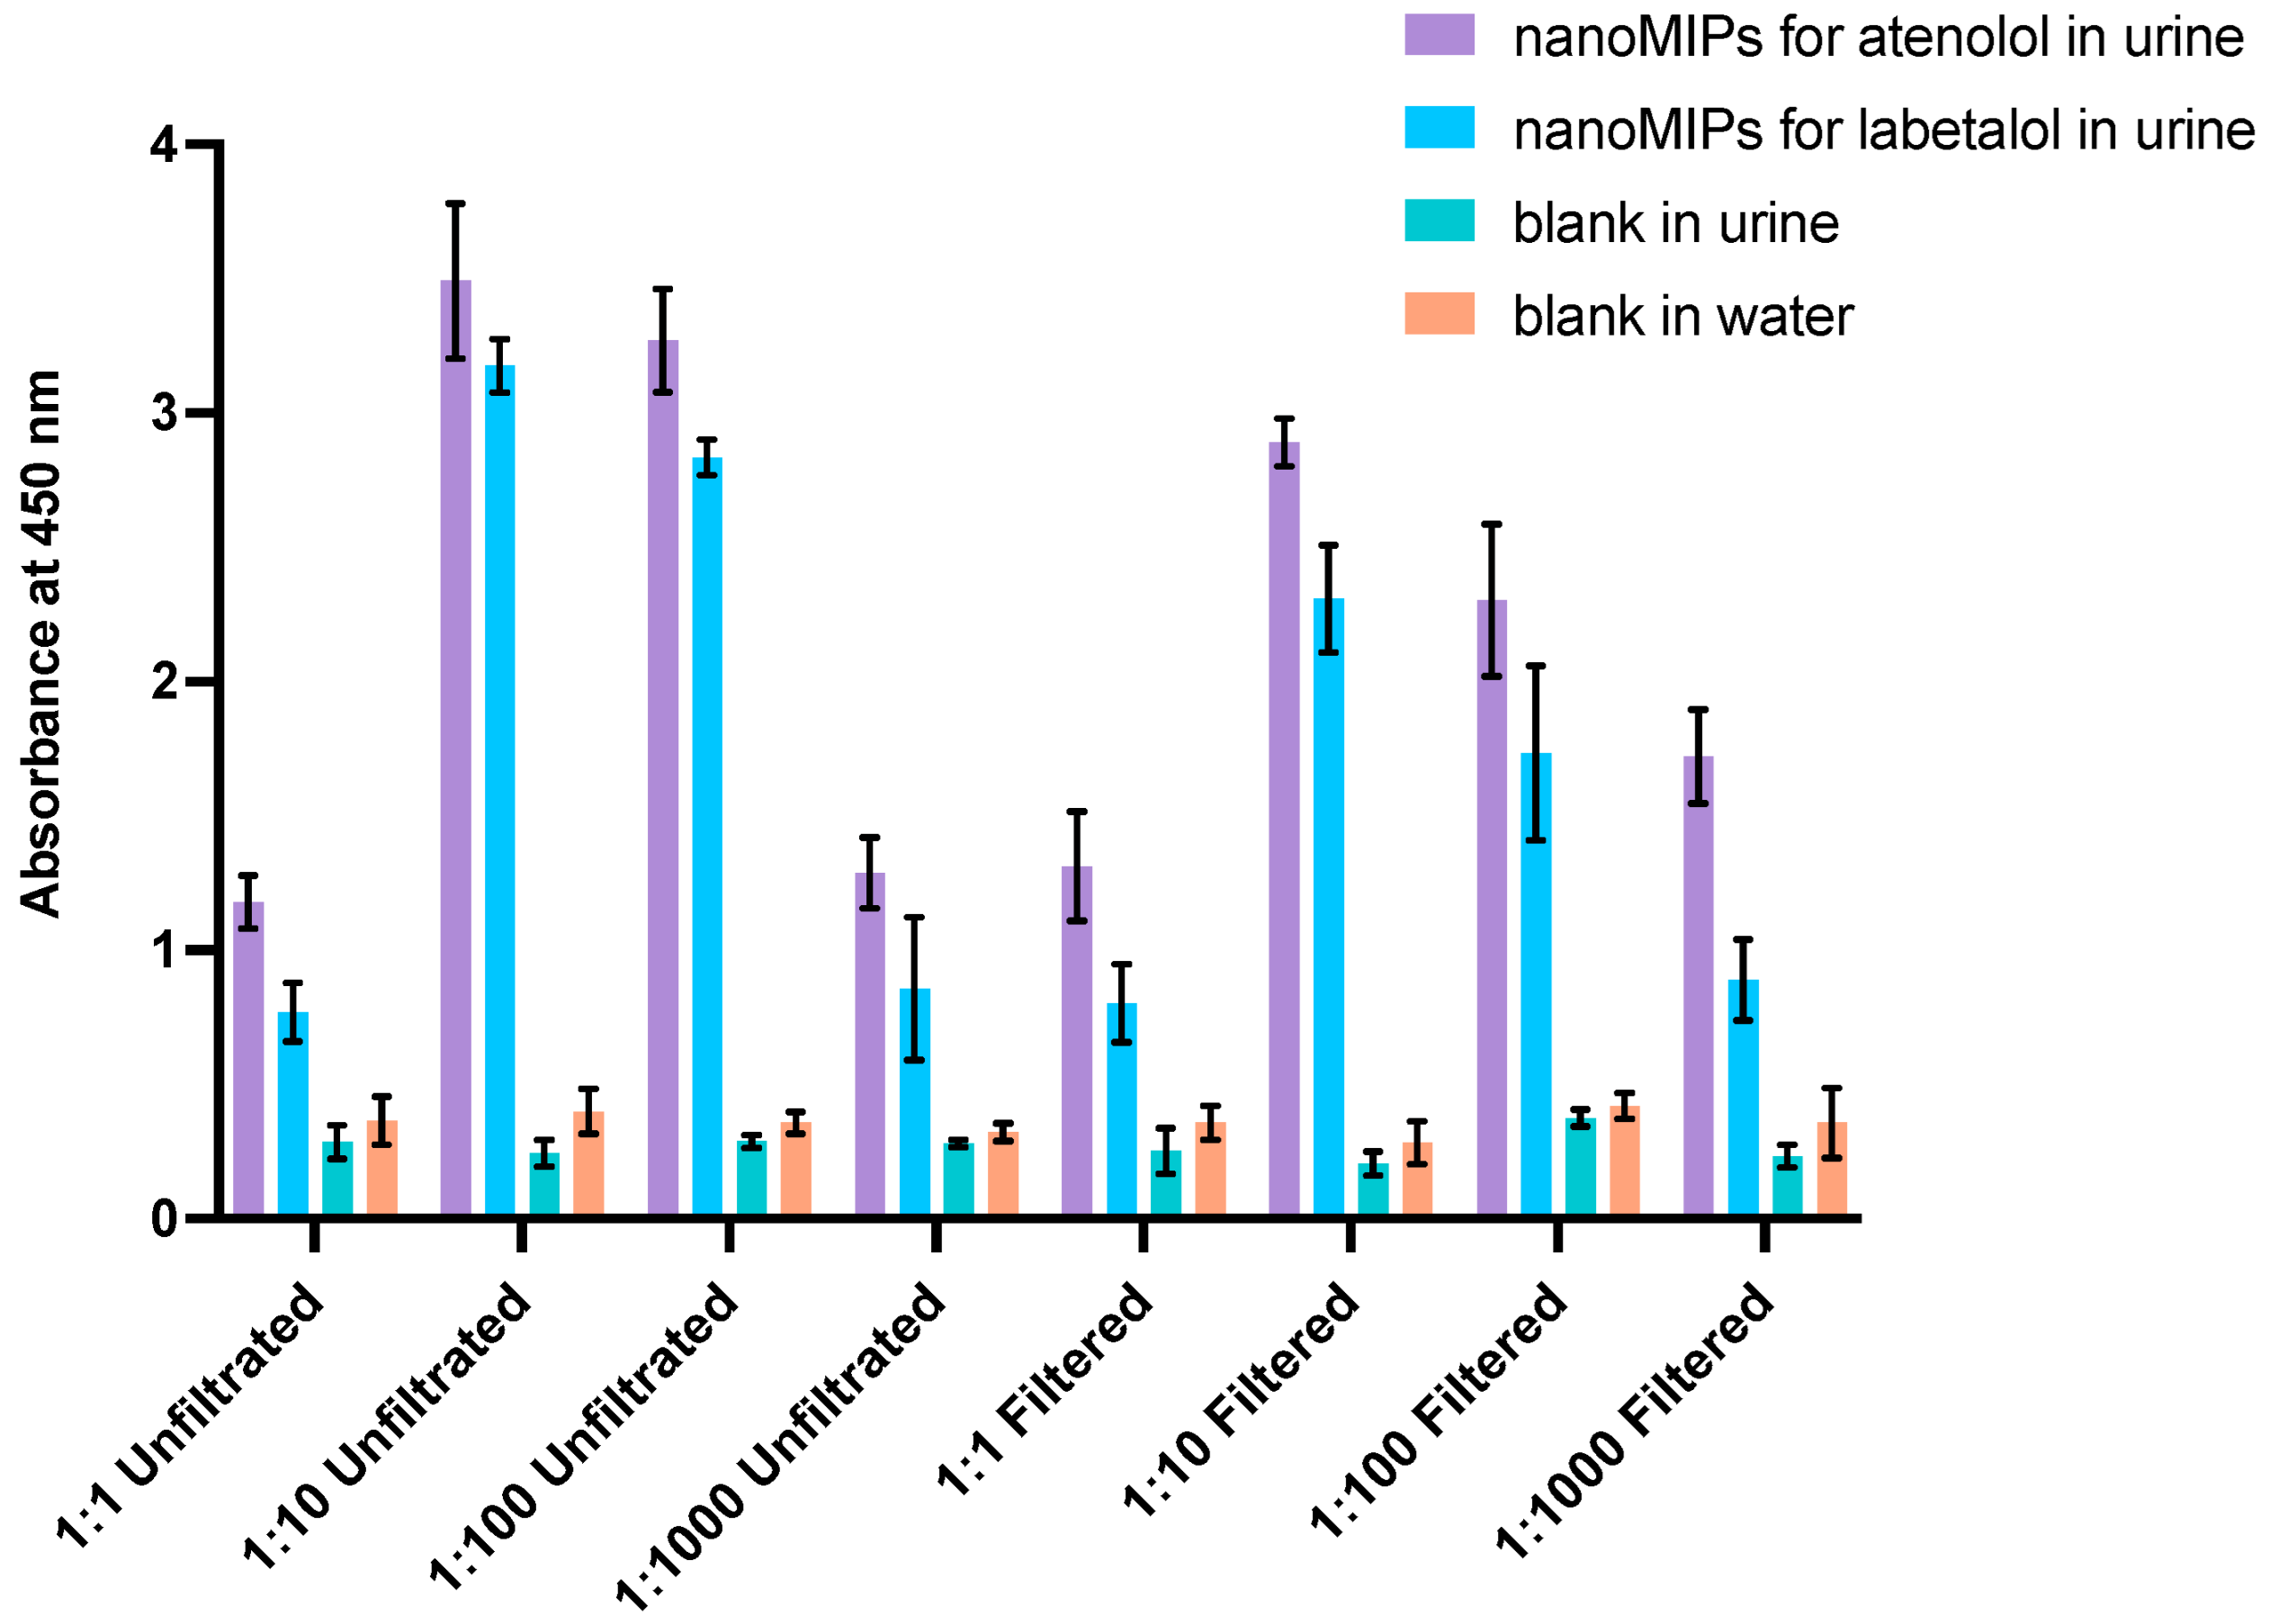
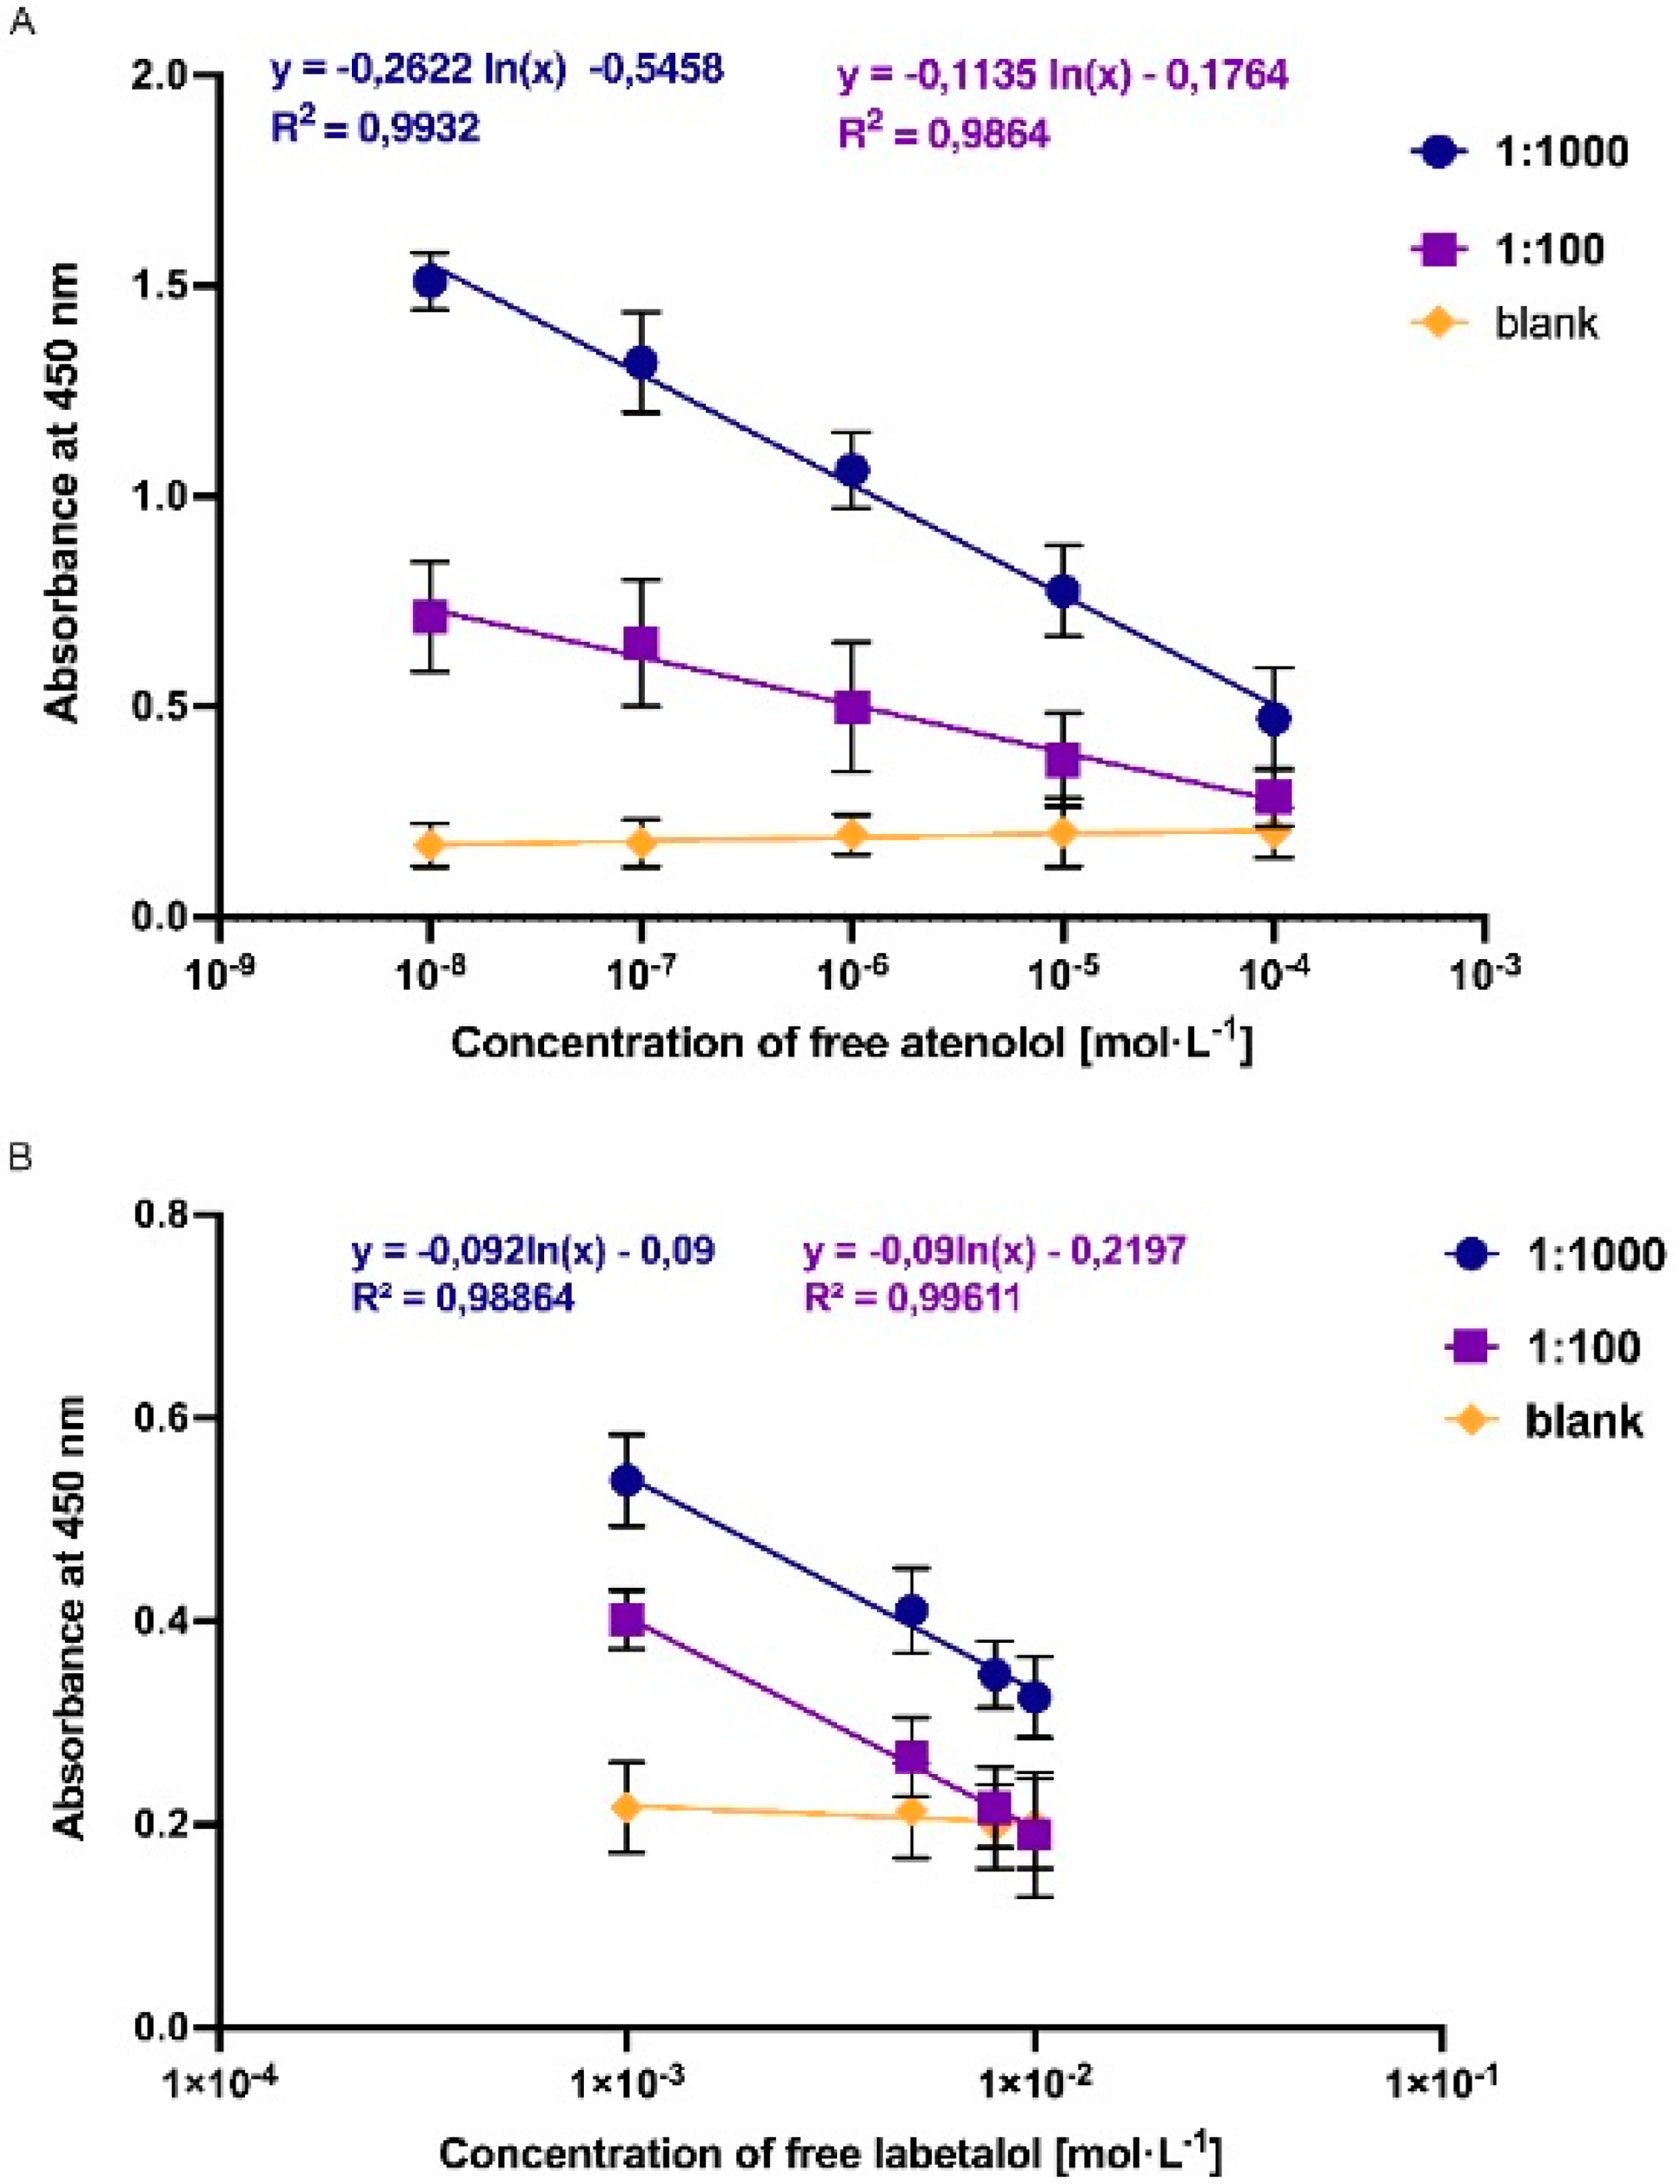
2.5. Analysis of Atenolol and Labetalol in Urine Samples
2.6. Competitive Pseudo-ELISA Assay to Analyze cross Reactivity of the NanoMIPs-A and NanoMIPs-L
3. Results and Discussion
3.1. Synthesis and Characterisation of NanoMIPs-A and NanoMIPs-L
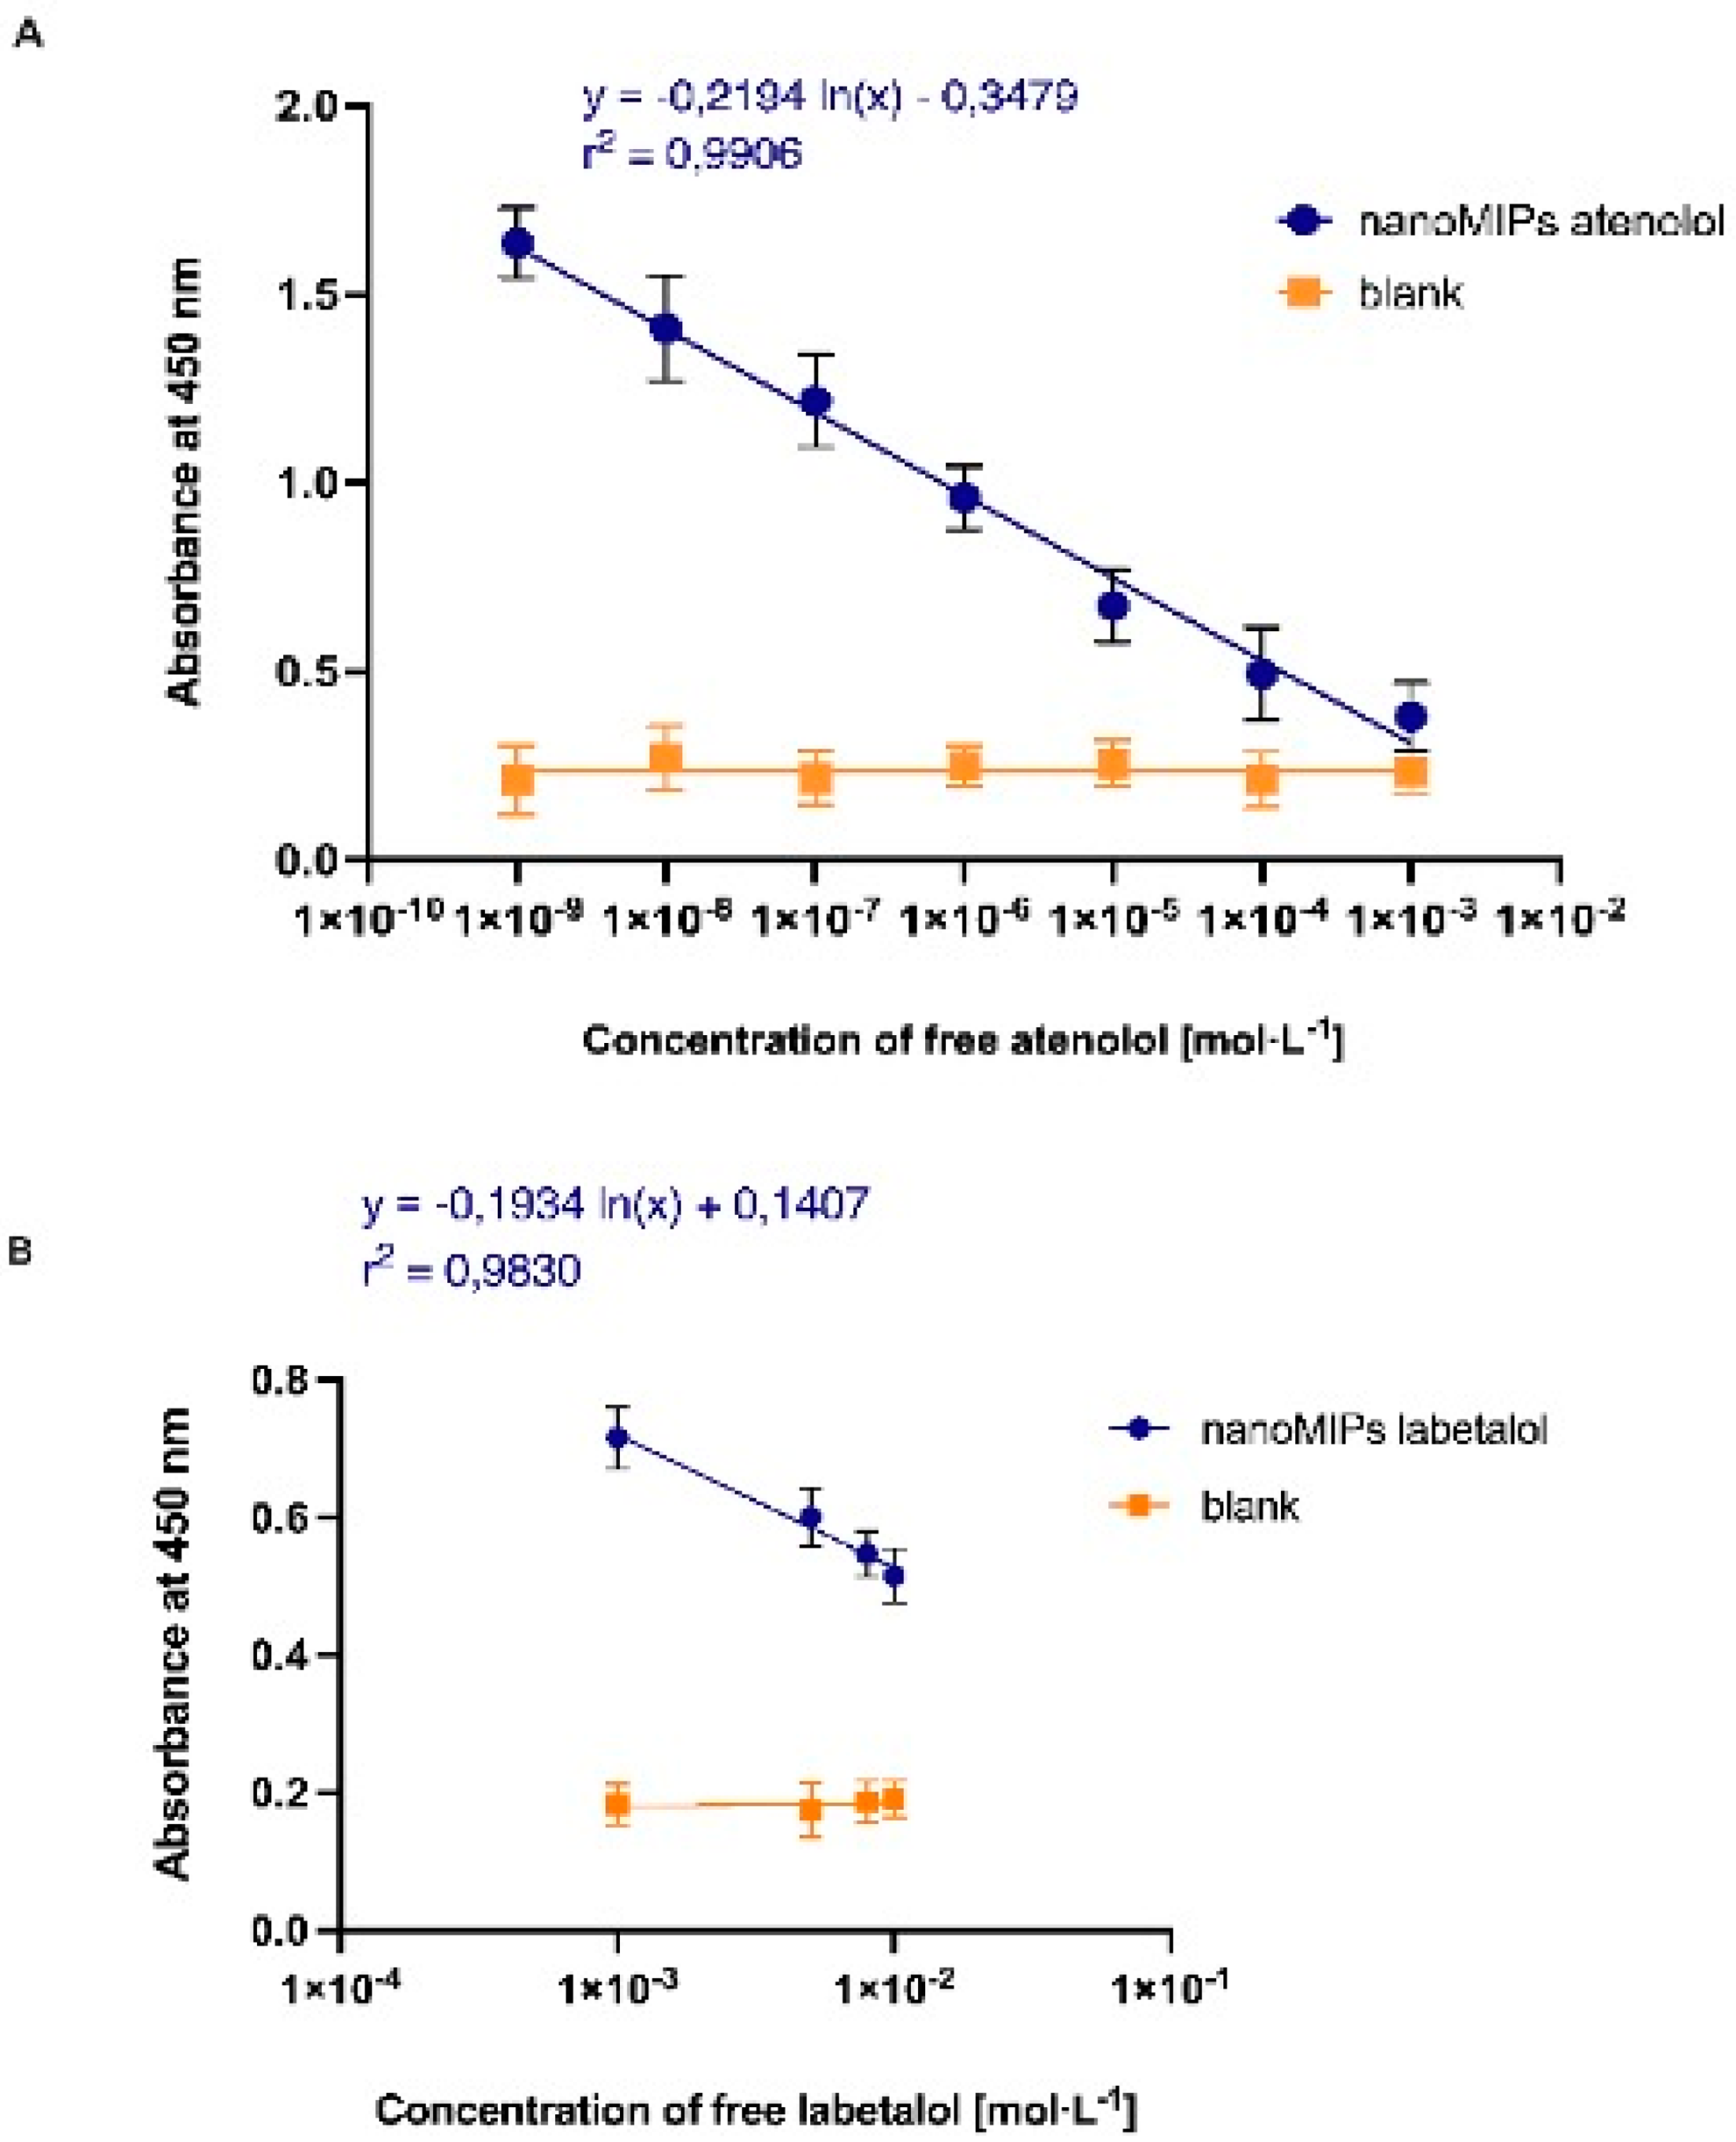
3.2. Testing the Affinity and Selectivity of NanoMIPs-A and NanoMIPs-L Using Pseudo-ELISA Assay
4. Conclusions
Supplementary Materials
Author Contributions
Funding
Conflicts of Interest
References
- Yang, Y.; Wang, Y.; Bao, Z.; Yang, Q.; Zhang, Z.; Ren, Q. Progress in the Enantioseparation of beta-Blockers by Chromatographic Methods. Molecules 2021, 26, 468. [Google Scholar] [CrossRef] [PubMed]
- Martínez-Milla, J.; Raposeiras-Roubín, S.; Pascual-Figal, D.A.; Ibáñez, B. Role of Beta-blockers in Cardiovascular Disease in 2019. Rev. Española De Cardiol. 2019, 72, 844–852. [Google Scholar] [CrossRef]
- Black, J. Reflections on drug research. Br. J. Pharmacol. 2010, 161, 1204–1216. [Google Scholar] [CrossRef]
- Salinas, A.M. Atenolol in uncomplicated hypertension: Time for changes. Lancet Neurol. 2010, 9, 652. [Google Scholar] [CrossRef] [PubMed]
- Akbar, S.; Alorainy, M.S. The current status of beta blockers’ use in the management of hypertension. Saudi Med. J. 2014, 35, 1307–1317. [Google Scholar] [PubMed]
- Meyer, M.; LeWinter, M.M. Heart Rate and Heart Failure With Preserved Ejection Fraction: Time to Slow β-Blocker Use? Circ. Heart Fail. 2019, 12, e006213. [Google Scholar] [CrossRef] [PubMed]
- The World Anti-Doping Agency (WADA). The World Anti-Doping Agency (WADA) Publishes Four New Technical Documents. 2019. Available online: https://www.sportsintegrityinitiative.com/wada-publishes-four-new-technical-documents/ (accessed on 23 May 2019).
- Hackney, A.C. (Ed.) Beta Blockers. In Doping, Performance-Enhancing Drugs, and Hormones in Sport: Mechanisms of Action and Methods of Detection; Elsevier: Amsterdam, The Netherlands, 2018; pp. 103–111. [Google Scholar]
- Elmongy, H.; Abdel-Rehim, M. Saliva as an alternative specimen to plasma for drug bioanalysis: A review. TrAC Trends Anal. Chem. 2016, 83, 70–79. [Google Scholar] [CrossRef]
- Hopfgartner, G.; Bourgogne, E. Quantitative high-throughput analysis of drugs in biological matrices by mass spectrometry. Spectro. Rev. 2003, 22, 195–214. [Google Scholar] [CrossRef]
- Oliveira, D.; de Araújo, A.; Ribeiro, W.; Silva, D.; Duarte, A.C.; de Sousa, V.; Pereira, H.G. Screening method of mildronate and over 300 doping agents by reversed-phase liquid chromatography-high resolution mass spectrometry. J. Pharm. Biomed. Anal. 2021, 195, 113870. [Google Scholar] [CrossRef]
- Liang, Y.; Liu, J.; Zhong, Q.; Huang, T.; Zhou, T. An automatic online solid-phase dehydrate extraction-ultra-high performance supercritical fluid chromatography-tandem mass spectrometry system using a dilution strategy for the screening of doping agents in human urine. Anal. Chim. Acta 2020, 1101, 184–192. [Google Scholar] [CrossRef]
- Thevis, M.; Walpurgis, K.; Thomas, A. Analytical Approaches in Human Sports Drug Testing: Recent Advances, Challenges, and Solutions. Anal. Chem. 2019, 92, 506–523. [Google Scholar] [CrossRef] [PubMed]
- Hackney, A.C. (Ed.) Overview: Doping in sport. In Doping, Performance-Enhancing Drugs, and Hormones in Sport: Mechanisms of Action and Methods of Detection; Elsevier: Amsterdam, The Netherlands, 2018; pp. 1–12. [Google Scholar]
- National Institute of Helath (NIH). MedlinePlus. Drugs, Herbs and Supplements; National Institute of Helath: Bethesda, ML, USA, 2019.
- Sharma, A.; Tok, A.I.Y.; Alagappan, P.; Liedberg, B. Point of care testing of sports biomarkers: Potential applications, recent advances and future outlook. TrAC Trends Anal. Chem. 2021, 142, 116327. [Google Scholar] [CrossRef]
- Nicoli, R.; Guillarme, D.; Leuenberger, N.; Baume, N.; Robinson, N.; Saugy, M.; Veuthey, J.-L. Analytical Strategies for Doping Control Purposes: Needs, Challenges, and Perspectives. Anal. Chem. 2016, 88, 508–523. [Google Scholar] [CrossRef] [PubMed]
- Moczko, E.; Díaz, R.; Rivas, B.; García, C.; Pereira, E.; Piletsky, S.; Cáceres, C. Molecularly Imprinted Nanoparticles Assay (MINA) in Pseudo ELISA: An Alternative to Detect and Quantify Octopamine in Water and Human Urine Samples. Polymers 2019, 11, 1497. [Google Scholar] [CrossRef] [PubMed] [Green Version]
- Chianella, I.; Guerreiro, A.; Moczko, E.; Caygill, J.S.; Piletska, E.V.; Sansalvador, I.M.P.D.V.; Whitcombe, M.J.; Piletsky, S.A. Direct Replacement of Antibodies with Molecularly Imprinted Polymer Nanoparticles in ELISA—Development of a Novel Assay for Vancomycin. Anal. Chem. 2013, 85, 8462–8468. [Google Scholar] [CrossRef] [Green Version]
- Fischman, S.; Ofran, Y. Computational design of antibodies. Curr. Opin. Struct. Biol. 2018, 51, 156–162. [Google Scholar] [CrossRef]
- Egloff, P.; Zimmermann, I.; Arnold, F.M.; Hutter, C.A.J.; Morger, D.; Opitz, L.; Poveda, L.; Keserue, H.-A.; Panse, C.; Roschitzki, B.; et al. Engineered peptide barcodes for in-depth analyses of binding protein libraries. Nat. Methods 2019, 16, 421–428. [Google Scholar] [CrossRef]
- Xu, J.J.; Miao, H.H.; Wang, J.X.; Pan, G.Q. Molecularly Imprinted Synthetic Antibodies: From Chemical Design to Biomedical Applications. Small 2020, 16, 1906644. [Google Scholar] [CrossRef]
- Moczko, E.; Guerreiro, A.; Cáceres, C.; Piletska, E.; Sellergren, B.; Piletsky, S.A. Epitope approach in molecular imprinting of antibodies. J. Chromatogr. B 2019, 1124, 1–6. [Google Scholar] [CrossRef]
- Cáceres, C.; Moczko, E.; Basozabal, I.; Guerreiro, A.; Piletsky, S. Molecularly Imprinted Nanoparticles (NanoMIPs) Selective for Proteins: Optimization of a Protocol for Solid-Phase Synthesis Using Automatic Chemical Reactor. Polymers 2021, 13, 314. [Google Scholar] [CrossRef]
- Canfarotta, F.; Poma, A.; Guerreiro, A.; Piletsky, S. Solid-phase synthesis of molecularly imprinted nanoparticles. Nat. Protoc. 2016, 11, 443–455. [Google Scholar] [CrossRef] [PubMed]
- Yoshimi, Y.; Oino, D.; Ohira, H.; Muguruma, H.; Moczko, E.; Piletsky, S.A. Size of Heparin-Imprinted Nanoparticles Reflects the Matched Interactions with the Target Molecule. Sensors 2019, 19, 2415. [Google Scholar] [CrossRef] [PubMed] [Green Version]
- Cáceres, C.; Canfarotta, F.; Chianella, I.; Pereira, E.; Moczko, E.; Esen, C.; Guerreiro, A.; Piletska, E.; Whitcombe, M.J.; Piletsky, S.A. Does size matter? Study of performance of pseudo-ELISAs based on molecularly imprinted polymer nanoparticles prepared for analytes of different sizes. Analyst 2016, 141, 1405–1412. [Google Scholar] [CrossRef] [Green Version]
- Chen, L.; Wang, X.; Lu, W.; Wu, X.; Li, J. Molecular imprinting: Perspectives and applications. Chem. Soc. Rev. 2016, 45, 2137–2211. [Google Scholar] [CrossRef] [PubMed]
- Mattsson, L.; Xu, J.; Preininger, C.; Bui, B.T.S.; Haupt, K. Competitive fluorescent pseudo-immunoassay exploiting molecularly imprinted polymers for the detection of biogenic amines in fish matrix. Talanta 2018, 181, 190–196. [Google Scholar] [CrossRef]
- Subrahmanyam, S.; Guerreiro, A.; Poma, A.; Moczko, E.; Piletska, E.; Piletsky, S. Optimisation of experimental conditions for synthesis of high affinity MIP nanoparticles. Eur. Polym. J. 2013, 49, 100–105. [Google Scholar] [CrossRef]
- Smolinska-Kempisty, K.; Guerreiro, A.; Canfarotta, F.; Cáceres, C.; Whitcombe, M.; Piletsky, S. A comparison of the performance of molecularly imprinted polymer nanoparticles for small molecule targets and antibodies in the ELISA format. Sci. Rep. 2016, 6, 37638. [Google Scholar] [CrossRef] [Green Version]
- Mahon, C.; Fulton, D. Mimicking nature with synthetic macromolecules capable of recognition. Nat. Chem. 2014, 6, 665–672. [Google Scholar] [CrossRef]
- Poma, A.; Guerreiro, A.; Caygill, S.; Moczko, E.; Piletsky, S. Automatic reactor for solid-phase synthesis of molecularly imprinted polymeric nanoparticles (MIP NPs) in water. RSC Adv. 2014, 4, 4203–4206. [Google Scholar] [CrossRef] [Green Version]
- El-Schich, Z.; Zhang, Y.; Feith, M.; Beyer, S.; Sternbæk, L.; Ohlsson, L.; Stollenwerk, M.; Wingren, A.G. Molecularly imprinted polymers in biological applications. Biotechniques 2020, 69, 406–419. [Google Scholar] [CrossRef]
- Haupt, K.; Rangel, P.X.M.; Bui, B.T.S. Molecularly Imprinted Polymers: Antibody Mimics for Bioimaging and Therapy. Chem. Rev. 2020, 120, 9554–9582. [Google Scholar] [CrossRef] [PubMed]
- Mistry, J.; Guerreiro, A.; Moczko, E.; Piletska, E.; Karim, K.; Piletsky, S.A. Analysis of cooperative interactions in molecularly imprinted polymer nanoparticles. Mol. Imprinting 2015, 3, 55–64. [Google Scholar] [CrossRef]
- Moczko, E.; Poma, A.; Guerreiro, A.; Sansalvador, I.P.D.V.; Caygill, S.; Canfarotta, F.; Whitcombe, M.; Piletsky, S. Surface-modified multifunctional MIP nanoparticles. Nanoscale 2013, 5, 3733–3741. [Google Scholar] [CrossRef] [PubMed] [Green Version]
- Moczko, E.; Guerreiro, A.; Piletska, E.; Piletsky, S. PEG-Stabilized Core–Shell Surface-Imprinted Nanoparticles. Langmuir 2013, 29, 9891–9896. [Google Scholar] [CrossRef] [Green Version]
- Shutov, R.V.; Guerreiro, A.; Moczko, E.; De Vargas-Sansalvador, I.P.; Chianella, I.; Whitcombe, M.J.; Piletsky, S.A. Introducing MINA—The Molecularly Imprinted Nanoparticle Assay. Small 2014, 10, 1086–1089. [Google Scholar] [CrossRef] [Green Version]
- Hoshino, Y.; Kodama, T.; Okahata, Y.; Shea, K.J. Peptide Imprinted Polymer Nanoparticles: A Plastic Antibody. J. Am. Chem. Soc. 2008, 130, 15242–15243. [Google Scholar] [CrossRef]


Publisher’s Note: MDPI stays neutral with regard to jurisdictional claims in published maps and institutional affiliations. |
© 2022 by the authors. Licensee MDPI, Basel, Switzerland. This article is an open access article distributed under the terms and conditions of the Creative Commons Attribution (CC BY) license (https://creativecommons.org/licenses/by/4.0/).
Share and Cite
Cáceres, C.; del Pilar Garcia Morgado, M.; Bozo, F.C.; Piletsky, S.; Moczko, E. Rapid Selective Detection and Quantification of β-Blockers Used in Doping Based on Molecularly Imprinted Nanoparticles (NanoMIPs). Polymers 2022, 14, 5420. https://doi.org/10.3390/polym14245420
Cáceres C, del Pilar Garcia Morgado M, Bozo FC, Piletsky S, Moczko E. Rapid Selective Detection and Quantification of β-Blockers Used in Doping Based on Molecularly Imprinted Nanoparticles (NanoMIPs). Polymers. 2022; 14(24):5420. https://doi.org/10.3390/polym14245420
Chicago/Turabian StyleCáceres, César, Macarena del Pilar Garcia Morgado, Freddy Celis Bozo, Sergey Piletsky, and Ewa Moczko. 2022. "Rapid Selective Detection and Quantification of β-Blockers Used in Doping Based on Molecularly Imprinted Nanoparticles (NanoMIPs)" Polymers 14, no. 24: 5420. https://doi.org/10.3390/polym14245420