2. Experimental Section
Materials. Poly(ethylene glycol) (PEG, M
n = 4000 g·mol
−1), epichlorohydrin (99%), sodium hydride (60% dispersion in mineral oil), (3-aminopropyl)triethoxysilane (APTES, 98%), Amberlite
® IRC120 H (hydrogen form), lithium hydroxide (>98%), acetonitrile (99.5%) and anhydrous ethanol (99.5%) were purchased from Sigma-Aldrich (Saint-Quentin Fallavier, France) and used as received. 2-chloroethanesulfonyl chloride (96%) and trifluoromethanesulfonamide (>98%) were purchased from TCI (Zwijndrecht, Belgium). The triethylammonium vinyl sulfonyl(trifluoromethane sulfonyl)imide (VSTFSI-triethylammonium) was prepared as described in our previous work [
21]. All solvents and other reagents were synthesis-grade products and used without further purification.
Nuclear magnetic resonance (NMR). 1H, 19F and 7Li NMR spectra were recorded on a Bruker AVANCE 400 MHz machine using deuterated solvents such as CDCl3 or DMSO-d6.
Synthesis of α,ω-diepoxy-PEO (diepoxy–PEO). The diepoxy–PEO was prepared according to a procedure in the literature with some adaptations [
22]. Briefly, α,ω-dihydroxyl poly(ethylene glycol) of 4000 g·mol
−1 (25.0 g, 6.23 mmol) was dissolved in 300 mL of toluene and dried with azeotropic distillation using a Dean–Stark apparatus. The hydroxyl end-groups of the PEG were then converted into sodium alkoxide by its reaction with sodium hydride (10 eq, 2.5 g, 62.30 mmol) at 40 °C for 2 h. After this time, epichlorohydrin (12 eq, 6.0 mL, 74.76 mmol) was slowly added to the solution, and the mixture was stirred at 40 °C overnight. After the reaction, the mixture was filtered and the polymer was precipitated in diethyl ether, filtered, washed with diethyl ether and dried under vacuum at room temperature. The coupling yield was quantitative.
1H NMR (400 MHz, CDCl
3) δ (ppm): 3.90–3.35 (m, 363H, -CH
2-CH
2-O-), 3.15 (m, 2H, CH of epoxide ring), 2.78 and 2.60 (m, 4H, CH
2 of epoxide ring).
Synthesis of lithium vinyl-STFSI (VSTFSILi). Amberlite ®IRC 120-H form ion-exchange resin (150 g) was successively washed with deionized water (2 × 500 mL), 1M LiOH (3 × 500 mL) and deionized water (6 × 500 mL) until a neutral pH was obtained. The resin beads were then loaded into a column of 3.5 cm outside diameter. Elution across the column of 10 g of triethylammonium vinyl-STFSI dissolved in 150 mL of water/ethanol (95:5, v/v) mixture, producing an aqueous solution of vinyl-STFSILi. The outflow was set at approximately one drop per second to enhance the cation exchange. This operation is repeated two more times with new Amberlite IR120 Li (50 g). The resulting solution was washed with dichloromethane (3 × 100 mL) to remove any traces of triethylammonium vinyl-STFSI. Water and ethanol were removed using a rotary evaporator at 50 °C. The lithium vinyl-STFSI was dried under vacuum at 60 °C for 24 h and stored under argon. Yield: 95%. 1H NMR (300 MHz, DMSO-d6, δ ppm): 6.72 (dd, J = 16.1, 10.4 Hz, 1H), 5.90 (d, J = 16.6 Hz, 1H), 5.72 (d, J = 9.9 Hz, 1H).19F NMR (376 MHz, DMSO-d6, δ ppm): −77.64.
Synthesis of Hybrid Single-Ion conducting electrolyte (HySI). The electrolytes were prepared using a sol–gel process involving diepoxy–PEO, lithium vinyl-STFSI (VSTFSILi) and APTES (
Figure 1). Typically, VSTFSILi (0.16300 g, 0.665 mmol, 1.4 eq) and anhydrous ethanol (1 mL) are introduced in a round bottom flask. The resulting solution was then heated at 80 °C. (3-aminopropyl)triethoxysilane (0.0946 mL, 0.479 mmol, 2.0 eq) was added dropwise to the solution and the mixture was stirred at 80 °C for 24 h. Then, diepoxy–PEO (0.58511 g, 0.146 mmol, 0.6 eq) dissolved in 1 mL of anhydrous ethanol was added to the reaction mixture. After complete addition, the reaction was continued for 24 h. After this time, anhydrous ethanol (10 mL) and 25.9 µL of acidic water at pH = 1.5 were subsequently added to the reaction mixture and the reaction continued for 1 h. After this time, the reaction mixture was poured into a PTFE dish and crosslinked at room temperature for 1 h, then at 100 °C for 24 h. The resulting HySI are homogeneous, transparent and crack-free films with good mechanical strength and a good degree of elasticity. Their thickness is comprised between 35 µm and 90 µm.
Table 1 summarizes all experimental data used for the synthesis of various hybrid single-ion electrolytes.
For each electrolyte, the weight fraction of silica species, denoted by SiO
1.5, was calculated by assuming each silicon atom was surrounded by three oxygen atoms and one alkyl group in the hybrid:
where
is the SiO
1.5 molecular mass (52 g·mol
−1),
nAPTES is the molar number of APTES,
Mpropylamine is the molecular mass of the aminopropyl of the APTES (58 g·mol
−1),
mPEO is the PEO mass, and
mVSTFSILi is the mass of the lithium vinyl-STFSI.
Different electrolytes were prepared by varying the lithium content (EO/Li ratio) and, thus, the inorganic/PEO ratios. For clarity, the HySI electrolytes are denoted by HySI_wVSTFSILi, with wVSTFSILi as the VSTFSILi weight fraction (in percent) throughout the text.
Table 2 summarizes the composition of the produced HySI electrolytes. For each sample, the sum of
wVSTFSILi and the PEO (
wPEO) and SiO
1.5 (
wSiO1.5) weight fractions is not equal to 100% due to the presence of APTES aminopropyl residual fragments. In addition, two additional series of hybrid electrolytes were synthesized to focus on the understanding of the relationships between chemistry structure and electrolyte properties. The first one has the same silica composition as HySI_20 but is lithium-free (HySI_0,
Table 1, entry 1) and the second one has a similar lithium concentration as HySI_20 but contains double the silica. These electrolytes were synthesized by adding to the reaction mixture either triethoxymethyl silane (TEMS) (
Table 1, entry 5) or tetraethoxysilane (TEOS) (
Table 1, entry 6), and are denoted by HySI_20_TEOS and HySI_20_TEMS, respectively. The compositions of these last three materials are also added to
Table 2.
Differential Scanning Calorimetry (DSC). The analysis of the thermodynamic behavior of the HySI electrolytes was conducted on a Mettler Toledo GC 20 TA DSC using a heat/cool/heat cycle from −100 °C to 125 °C and at a heating and cooling rate of 10 °C·min
−1. Since the sample thermal history can alter the results, the first cycle was used to place all the electrolytes in the same state (similar crystallization conditions); then, the second and subsequent cycles were reproducible. The second heating cycle was used to analyze the thermogram and determine first the glass transition temperature (
Tg) of the HySI electrolytes with the tangent line methods. Then, from the PEO endothermic peak, the PEO melting temperature (
Tm) was determined as being the intersection point of the signal baseline and the inflectional tangent at the beginning of the melting peak. The PEO degree of crystallinity (
χc) was calculated from the melting enthalpy (
Hm, determined by melting peak integration) and weight fraction of PEO (
wPEO) according to:
where
is the melting enthalpy of a 100% crystalline PEO taken as 195 J.g
−1 [
23].
Rheometric experiments. The viscoelastic properties of the HySI electrolytes were studied using an Anton Paar MCR 302 (Modular Compact Rheometer) equipped with 8 mm diameter disposable aluminum parallel disks. Before the measurements, the samples were stored in a desiccator containing calcium chloride to remove any trace of residual water. The samples were maintained at 75 °C—well above Tm—and were pressed to a gap width of around 0.8 mm under a constant flow of dry air. The storage modulus (G′) and loss modulus (G″) were measured as a function of frequency, from 0.1 to 100 rad·s−1, by dynamically shearing the electrolyte at a fixed strain of 1%.
Small- and Wide-Angle X-ray Scattering (SAXS/WAXS). Measurements were carried out on a Xeuss 2.0 HR SAXS/WAXS instrument from Xenocs. The instrument uses a microfocused Cu Kα source with a wavelength of 1.54 Å and a PILATUS3 detector (Dectris). The experiments were performed at two sample-to-detector distances, 2490 mm with a collimated beam size of 0.5 × 0.5 mm and 333 mm with a collimated beam size of 0.8 × 0.8 mm, respectively, allowing them to achieve a broad scattering vector (q) range of 0.004–1.8 Å−1, with a good overlap between the two configurations. Electrolyte films were molded into a polypropylene ring and sealed between two Kapton sheets. Samples were placed onto a homemade sample holder thermalized with a circulating water flow coupled with a Huber bath, allowing control of the temperature of the samples up to 65 °C. Samples’ transmissions were measured precisely. Scattering from the empty beam, Kapton sheets and darkfield was measured independently and subtracted from the samples’ scattering according to standard procedures to obtain scattering in absolute units (cm−1). All samples were measured over the following temperature cycle: first at 25 °C, then heated up at 60 °C and cooled back to 25 °C. A waiting time of 60 min was used between each step of the cycle to ensure the proper thermalization of the samples.
Li symmetric cell assembly. The electrolytes were placed in an Argon-filled glove box (Campus, Jacomex, Dagneux, France) with ultralow water and O2 content (<1 ppm) for at least a week prior to any further experiments. There, an electrolyte disk (14 mm diameter) was placed onto a Li metal disk (10 mm diameter), and the two were co-laminated in temperature (80 °C) and pressure (3 bars) in a homemade calendering apparatus to ensure intimate interfacial contact. Another Li disk was subsequently placed onto the remaining uncovered electrolyte face, and the cell was calendered again. The resulting Li symmetric cell was then placed in a conventional CR2032 coin cell and sealed using a crimper (manual crimper, Hohsen, Tokyo, Japan).
Ionic transport properties. After assembly, the coin cells were taken out of the glove box and placed in a climatic chamber (Clima Temperatur Systeme) and connected to a multipotentiostat with impedance capabilities (VMP300, BioLogic, Seyssinet-Pariset, France). There, the cells were kept at 80 °C for a day. Then, electrochemical impedance spectroscopy (EIS) was performed at different temperatures from 80 °C to 100 °C by steps of 10 °C followed by a cooling scan down to 30 °C and a second heating scan from 35 to 95 °C, also by 10 °C steps. At each temperature, and after temperature equilibration, EIS was performed from 7 MHz to 0.3 Hz using an excitation voltage between 20 and 80 mV. The treatment of the EIS spectra is based on a subtractive methodology [
24] detailed in the
Section 3. This permits the extraction of the different contributions from the EIS spectra. Therefore, a resistance (
Ri) of a contribution i at a temperature (
T) is linked to the ionic conductivity (
σi) according to:
where
l is the average electrolyte thickness measured after the experiments and
S is the active surface area equivalent to that of the Li electrodes.
In this study, only the cooling and second heating scans are presented as the two data sets that are in agreement with each other. In addition, results are provided with a standard deviation calculated based on the measurements of at least three cell replicates per electrolyte composition.
Moreover, as for PEO-based electrolytes, the VTF equation [
25] is used to fit the
σ-
T relationship for
T >
Tm according to:
where
σ0 is a pre-exponential factor proportional to the fraction of free ions,
Ea is pseudo-activation energy,
R is the ideal gas constant (8.314 J·K
−1·mol
−1) and
T0 is the ideal glass transition temperature generally taken as
Tg—50.
Moreover, the dielectric constant (
εi) of a contribution i is calculated based on the corresponding capacity (
Ci) and the cell dimensions such as:
where
ε0 is the vacuum permittivity (8.854 10
−12 F·m
−1).
Ci is calculated thanks to the equivalent circuit parameters used to fit the impedance of the contribution i, such as the resistance
Ri and those from the Constant Phase Element (CPE), namely the pseudo-capacity (
Qi) and the phase (
ni) such as:
The Li symmetric coin cells were also used to determine the cationic transference number (
t+) at 80 °C. For
t+, the Bruce and Vincent methodology [
26,
27] was employed. The protocol consists in applying a small potentiostatic step, Δ
V = 20 mV, to the cell and recording the current (
I) until a steady-state current (
Iss) is obtained, combined. In addition, an EIS spectrum is recorded before the polarization to determine the
of the electrolyte resistance and at the end of the polarization to determine the
of the final Li/electrolyte interface resistance.
A typical example of a polarization step performed at 80 °C on a Li symmetric cell comprising the HySI_33 electrolyte is provided in
Figure S1. The transport number is calculated thanks to the equation proposed by Watanabe et al. [
28]:
3. Results and Discussion
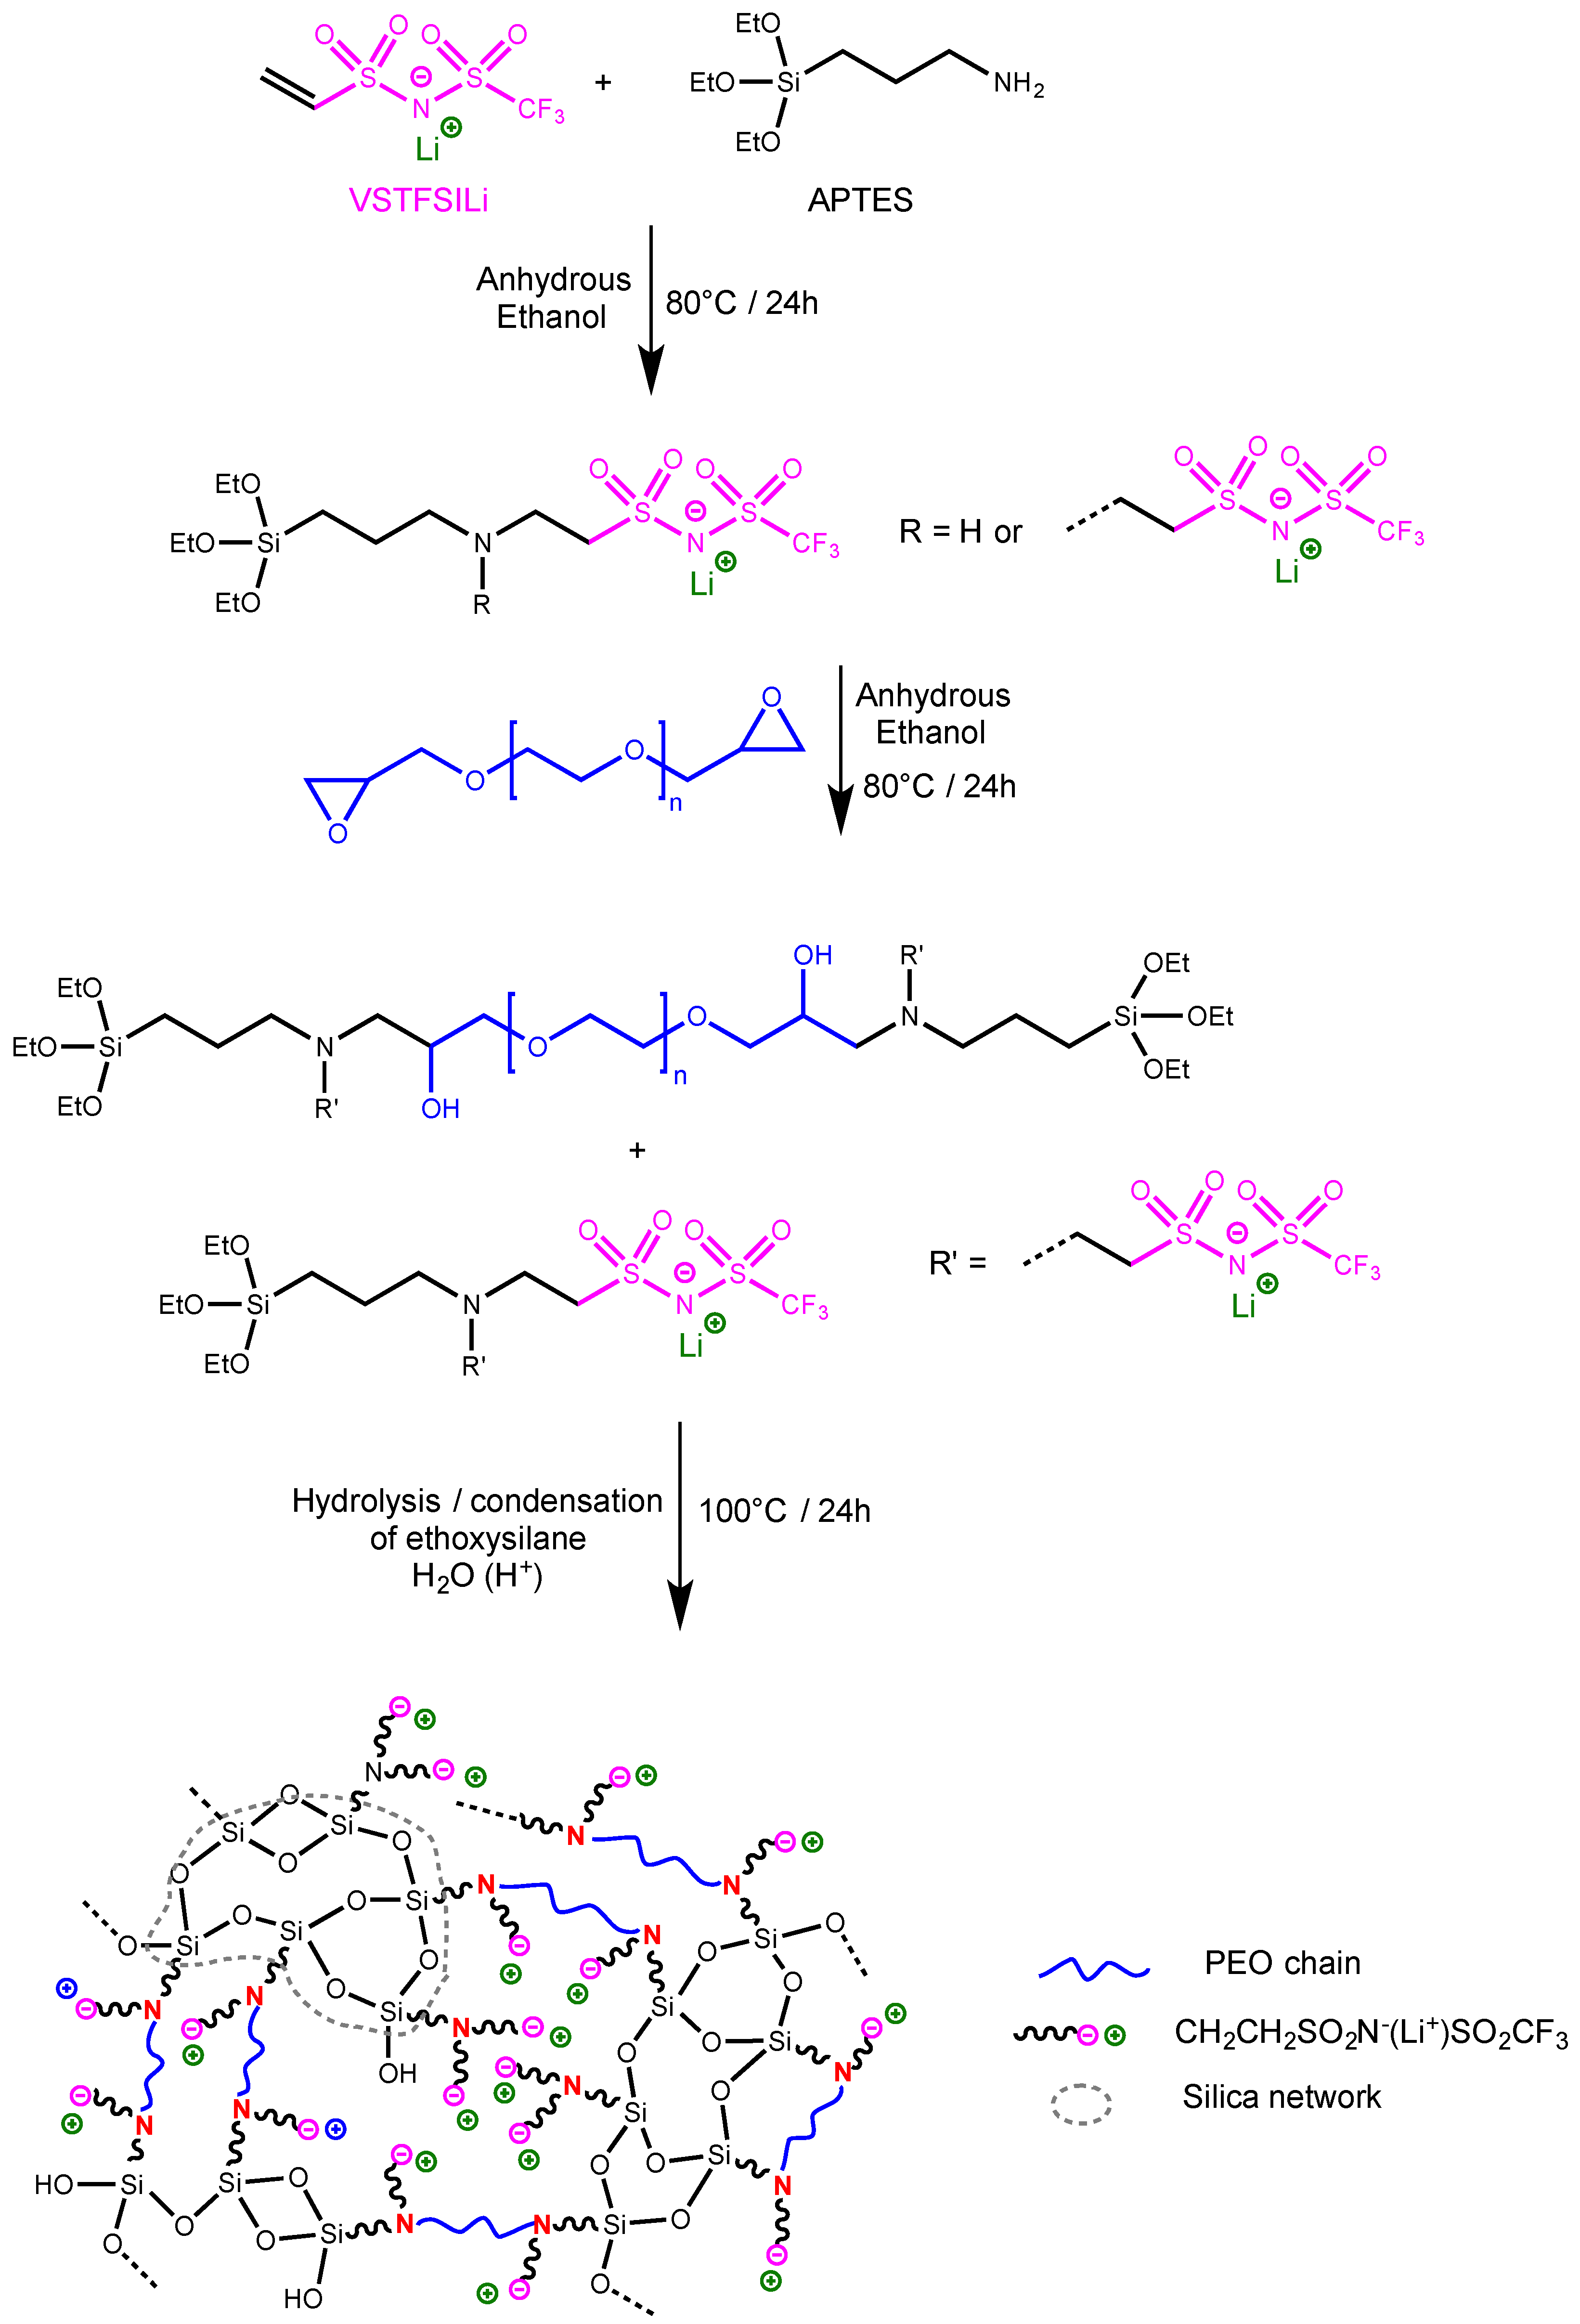
The procedure used for the preparation of the crosslinked single-ion silica-PEO hybrid electrolyte (HySI) is a one-pot synthesis, depicted in
Figure 1, based on a three-step reaction involving diepoxy–PEO, lithium vinyl-STFSI (VSTFSILi) and 3-Aminopropyltriethoxysilane (APTES) and using eco-friendly ethanol as solvent. In the first step (
Figure 1), the Michael reaction between VSTFSILi and the amine function of APTES leads to APTES-lithium ethyl-STFSI intermediate product. In this kind of Michael addition reaction, it is well known that each primary amine of APTES can react with two VSTFSILi. In the present study, the molar ratio
(
Table 1) between reactive functions of APTES and VSTFSILi varied from 1.22 to 1.66. Thus, at the end of the first step, we have statistically a mixture of APTES functionalized either with one or two STFSILi functions (
Figure 1). The
1H NMR spectrum of the crude product (
Figure S2) exhibits the presence of signals of the expected Michael adduct at 3.08 ppm labelled (g) and 2.83 ppm labelled (f) corresponding to the –CH
2CH
2SO
2N
(−)SO
2CF
3 anion. However, the signal of a secondary amine is difficult to observe because the NH bonds are polar and their protons are mobile. The presence of STFSI functionality was furthermore confirmed by
19F and
7Li NMR analysis with the fluorine and lithium signal at −77.57 ppm (
Figure S3a) and at −1.05 ppm (
Figure S3b), respectively. In the second step (
Figure 1), the secondary amine groups of APTES-functionalized STFSILi react with epoxy functions of diepoxy–PEO at 80 °C for 24 h until the total disappearance of epoxy functions as verified by
1H NMR analysis (not shown here). In the last step, the hydrolysis of the alkoxysilane molecules was initiated by catalytic amounts of acidic water. The heat treatment allows the formation of -Si-O-Si- linkages and produces the silicate framework [
20]. After a heat treatment at 100 °C for 24 h, flexible and self-supported crosslinked electrolyte membranes with thicknesses between 35 and 90 μm were obtained. Each HySI was conceived by fixing the targeted molar ratio of EO/Li and then calculating the number of APTES so that the molar ratio
was equal to 1 (
Table 1, entries 2–8). Thus, the concentration of SiO
1.5 in hybrid electrolytes is indirectly conditioned by the EO/Li ratios. Various HySI were synthesized by varying EO/Li ratio and, thus, the SiO
1.5 concentration.
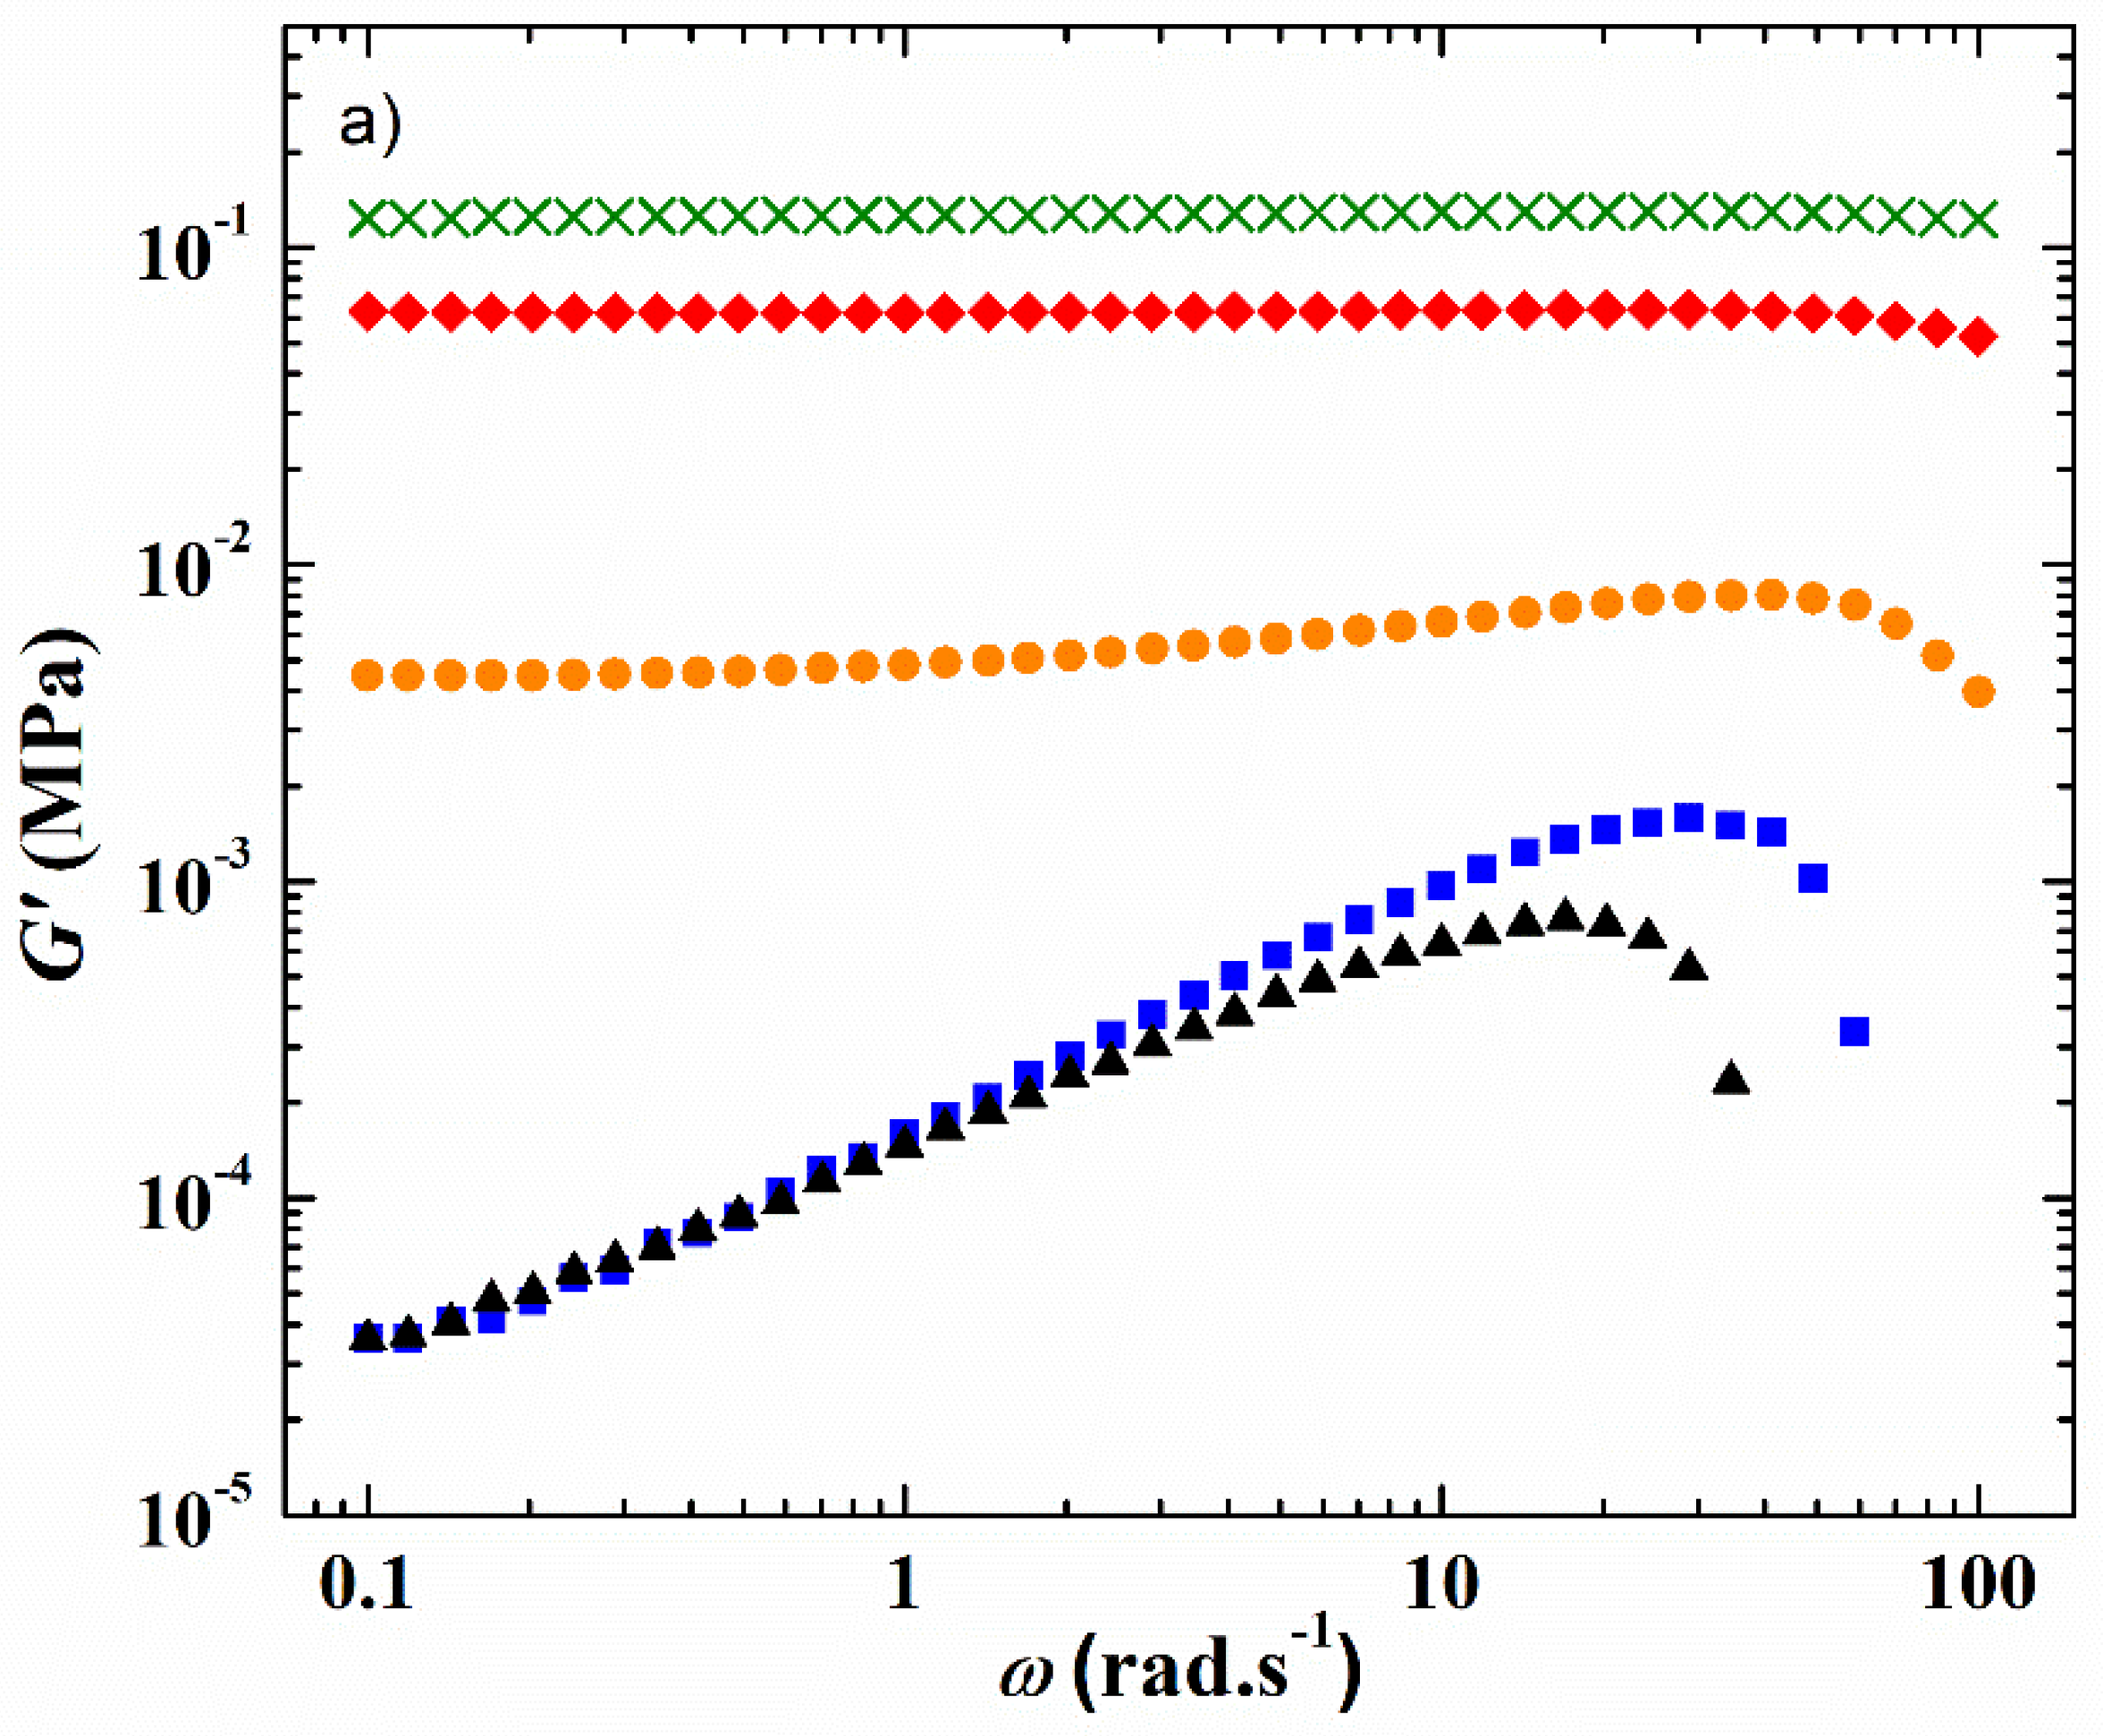
The viscoelastic properties at a constant strain of 1% of the HySI electrolytes corresponding to the variation of the storage G′ and loss G″ modulus at 75 °C as a function of the angular frequency (
ω) are displayed in
Figure 2a,b, respectively. At such a temperature, all the electrolytes are in a melted state (see
Figure 3). For the HySI electrolytes with
wVSTFSILi ≤ 20, G′ is higher than G″ all over the studied angular frequency range, indicating solid-like viscoelastic behavior. In addition, at a given salt content, G′ is almost independent of
ω due to the silica crosslinking sites that mitigate the stress relaxations in the hybrid materials. Moreover, G′ decreases with an increase of salt concentration, and thus silica content, typically from 0.12 MPa down to 5 kPa for
wVSTFSILi of 15 and 20, respectively. The loss modulus G″ increases slightly with
ω with values in the range of 1 kPa. Conversely, for the highest concentrated electrolytes, HySI_25 and HySI_33, G′ is lower than G″, and both parameters increase with
ω indicating liquid-like behavior. Such a difference in the viscoelastic behavior may be due to a smaller extent of crosslinking within these materials. Indeed, based on the SAXS/WAXS analysis, the two highest concentrated electrolytes are the more heterogeneous materials with large TFSI clusters surrounding the silica crosslinking sites. Therefore, the TFSI anion may prevent an overall high degree of crosslinking leading to liquid-like properties.
In addition, as for the material thermal properties, the presence of Li salt has an important influence on the HySI viscoelastic properties due to its plasticizing effect. Similar to the literature data on PEO and PEO salt-in-polymer blends, [
29,
30] the comparison of the viscoelastic properties of HySI_0 and HySI_20, displayed in
Figure S4, shows that G″ lies in the same range while G′ decreases by almost one order of magnitude when salt is present in the hybrid materials.
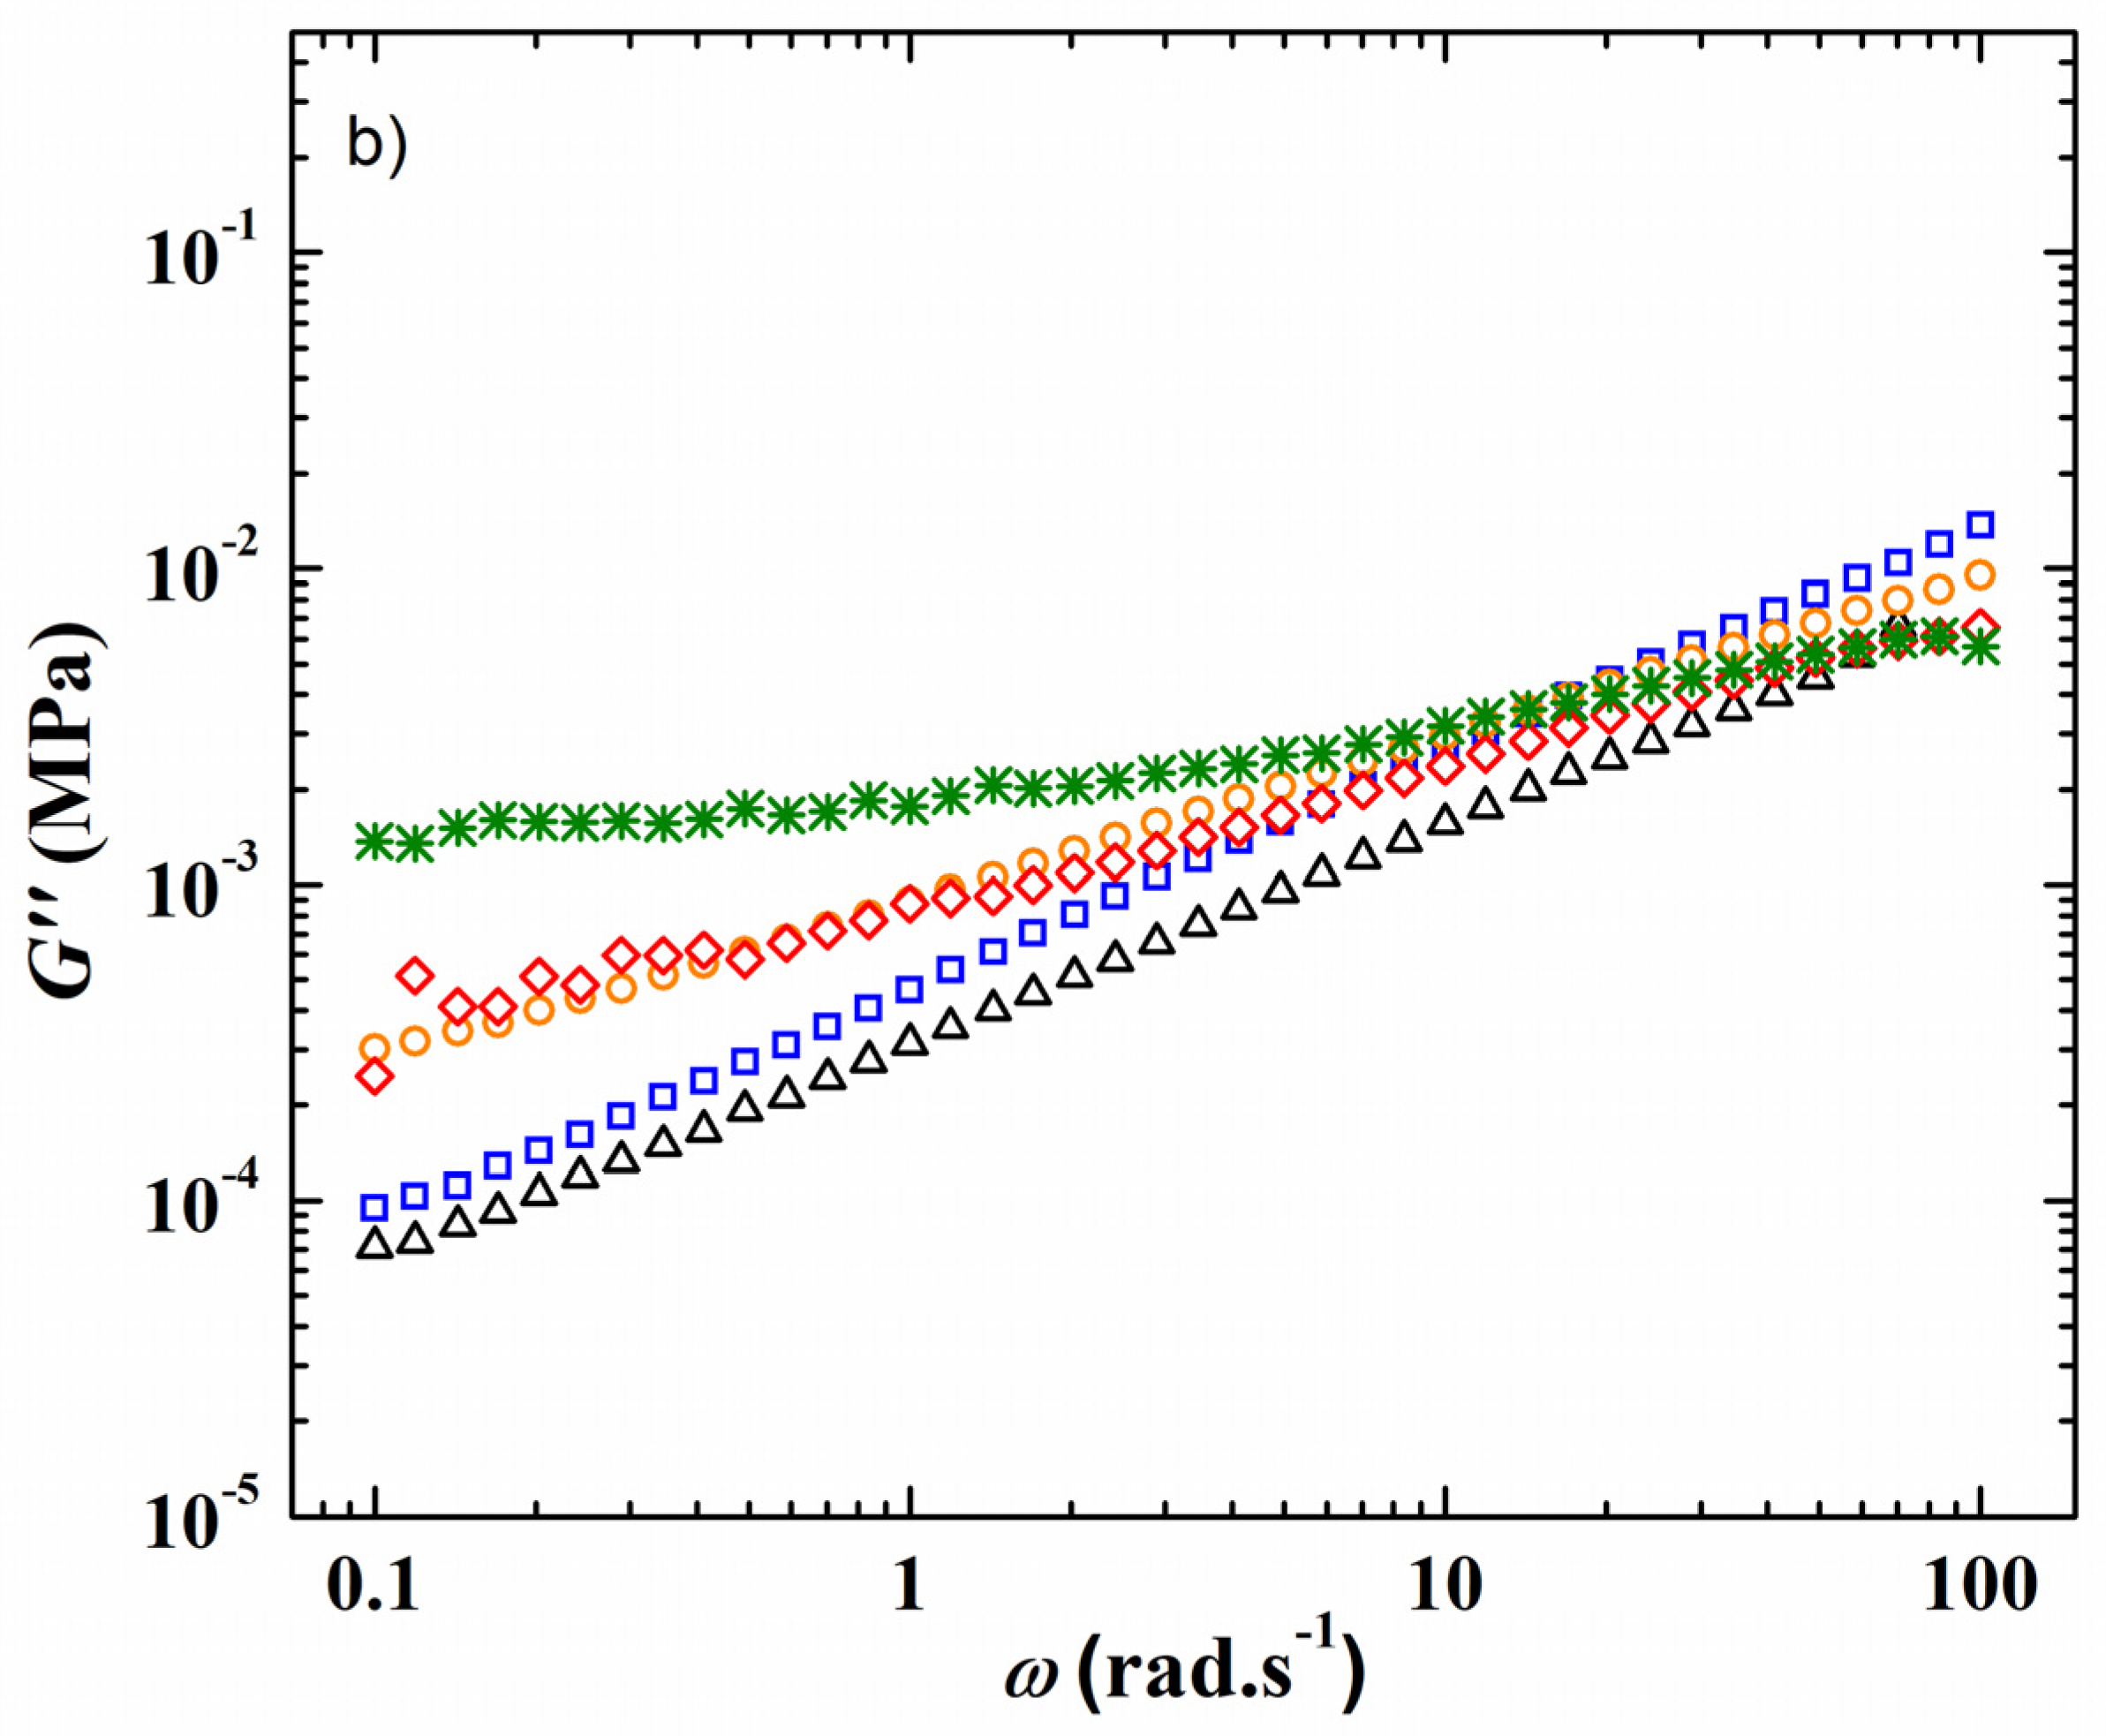
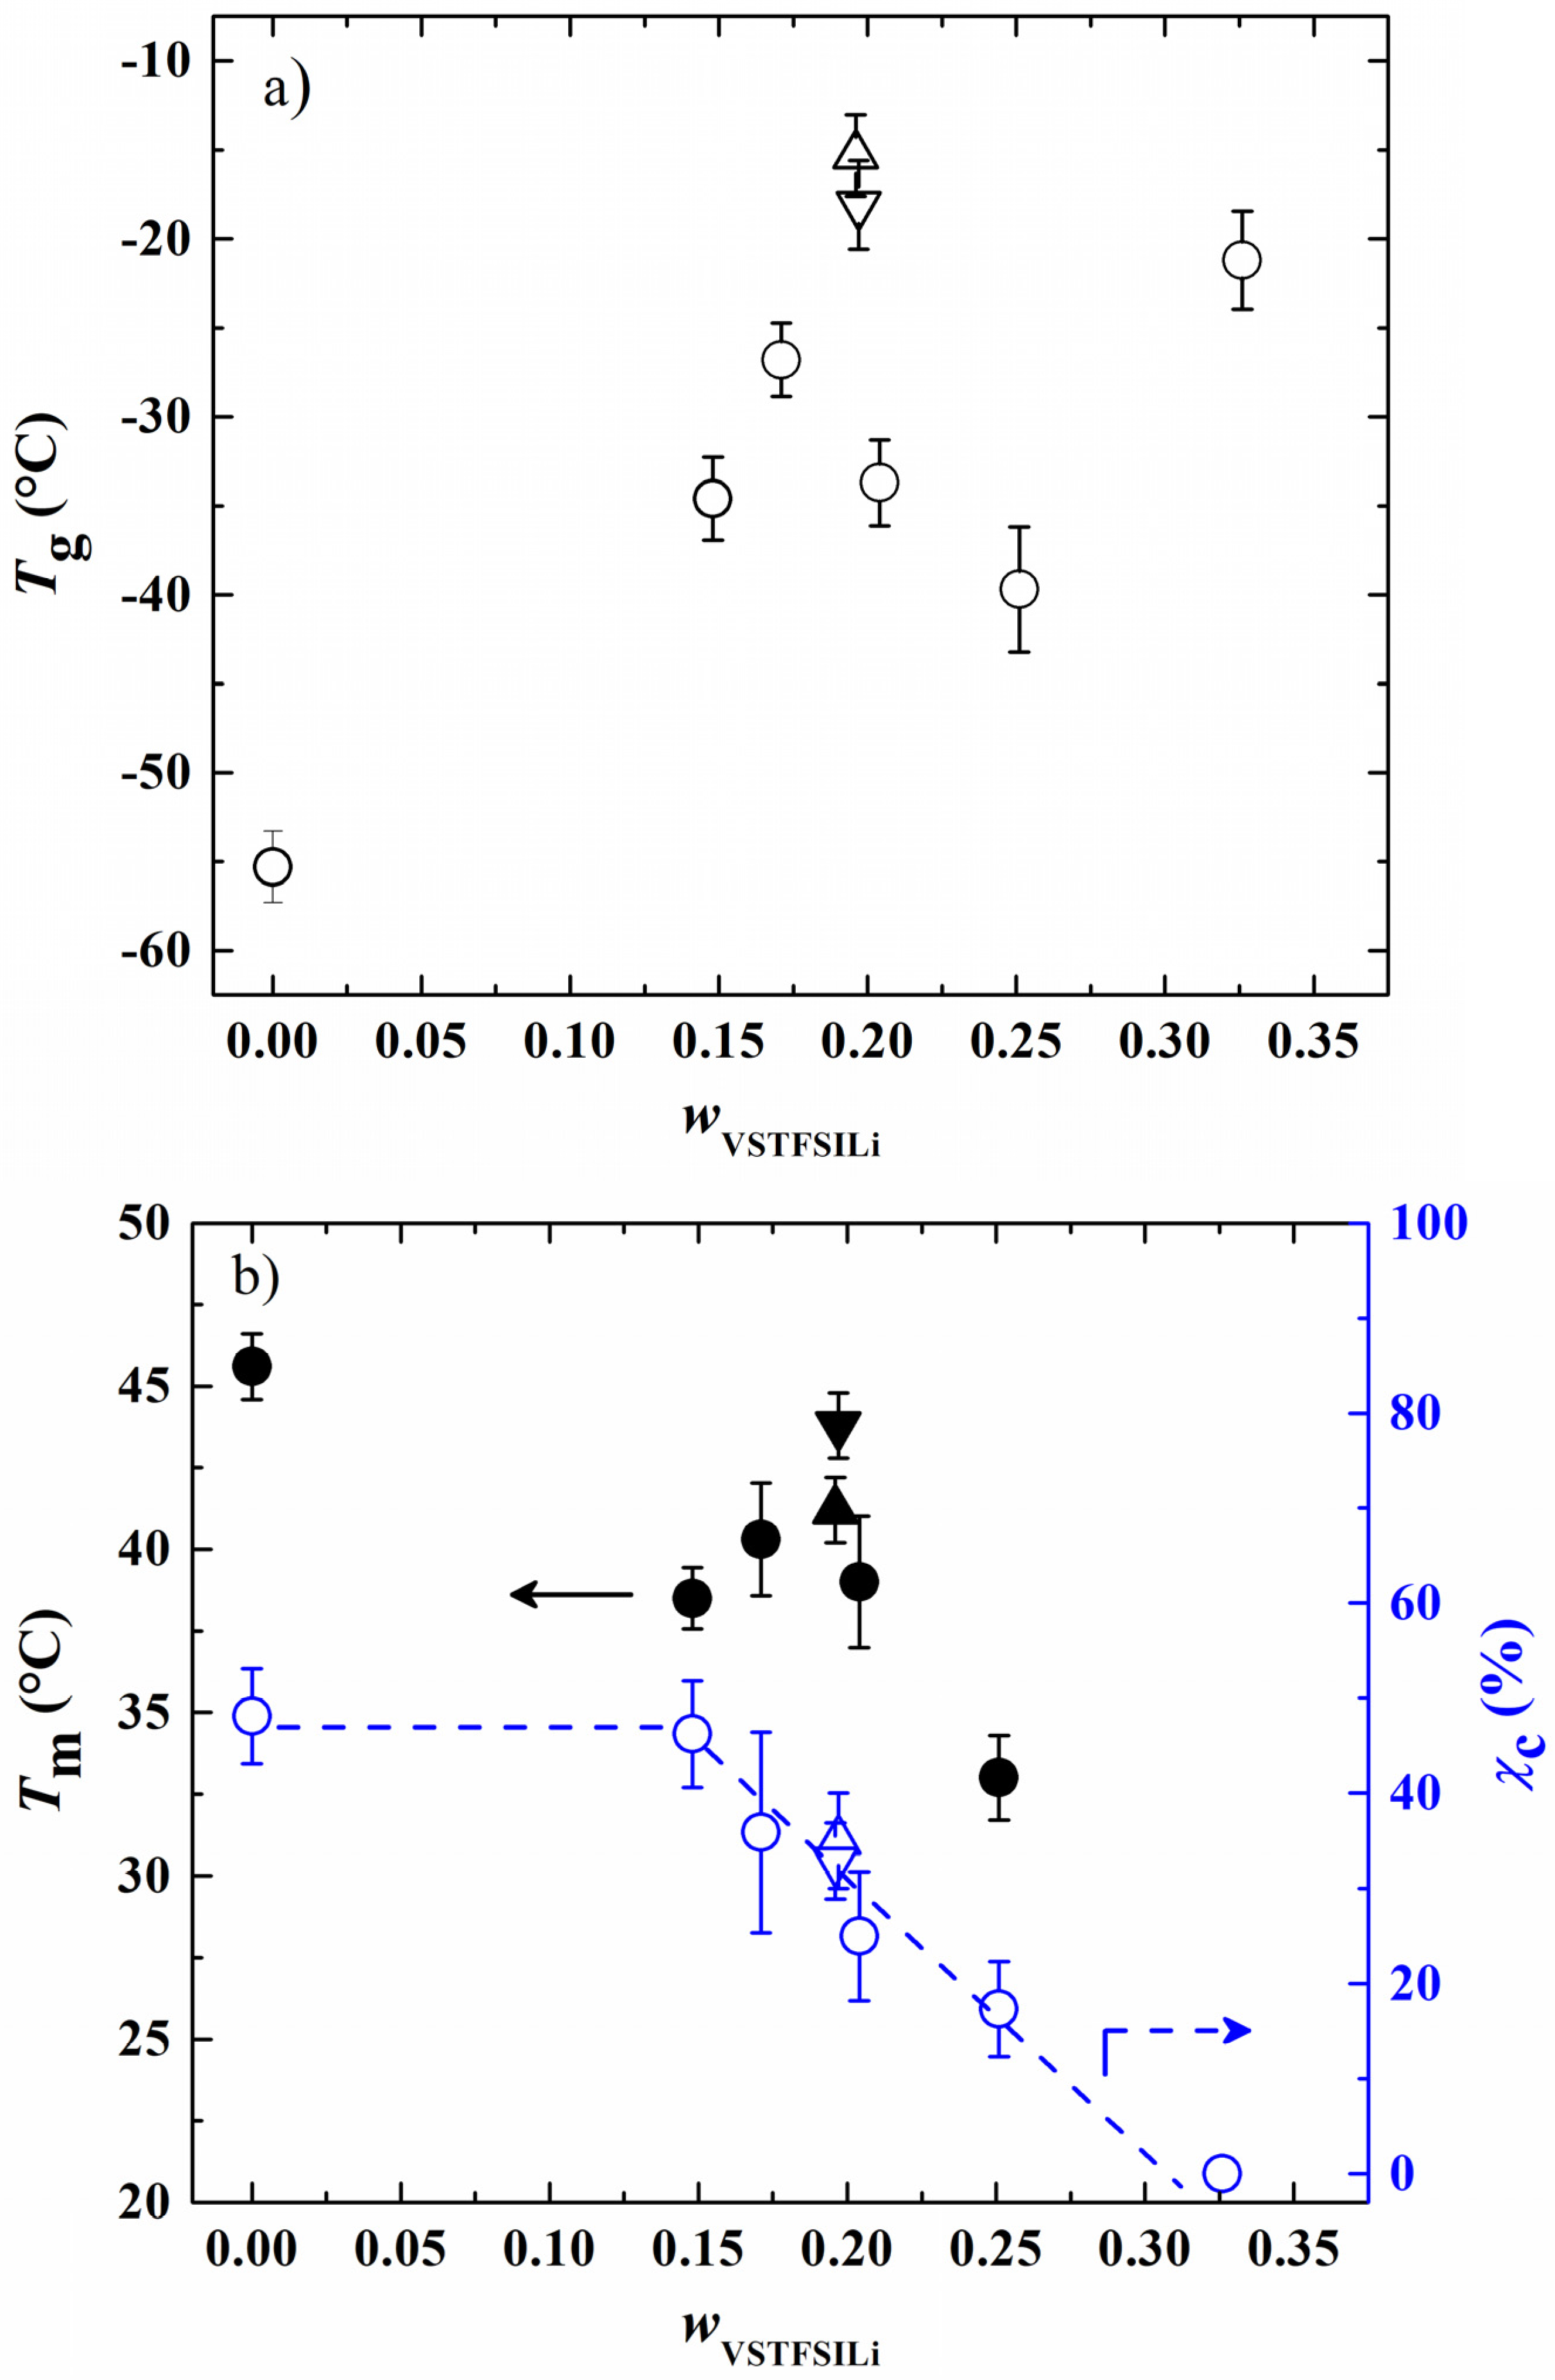
Figure 3 shows the DSC thermograms of different HySI electrolytes during the second heating scan. Typically, the thermograms present two characteristic transitions, one step at temperatures below 0 °C ascribed to the glass transition temperature (
Tg) and one endothermic peak at temperatures around 35 °C related to the PEO melting temperature. No melting peak was observed for the highest concentrated electrolyte (HySI_33), and for HySI_25, a small crystallization peak at about 14.5 °C was present only during the heating run, suggesting that its crystallization process was not complete during the cooling run. In addition,
Figure S5 displays the thermograms of the HySI_0, HySI_20_TEMS and HySI_20_TEOS samples having a similar temperature profile than the other electrolytes.
From each thermogram,
Tg and
Tm were determined as well as the degree of crystallinity (χ
c, Equation (2)). In
Figure 4a,b,
Tg,
Tm and χ
c were plotted as a function of weight fraction of vinyl-STFSILi (
wVSTFSILi). Globally, the
Tg of studied HySI has the tendency to increase with the lithium content from −55.3 °C up to −21.2 °C in HySI_0 and HySI_33, respectively. Such a trend is similar to that encounter in PEO-based dual ion-conducting polymer electrolytes where increasing the salt content typically leads to an increase in
Tg [
31,
32,
33]. Indeed, the Li cations are typically coordinated by several EO sites, forming several ionic bonds that reduce the PEO chain dynamic and thus increase
Tg. For 14.8 <
wVSTFSILi < 25.1%,
Tg fluctuates around an average value of −33.7 ± 5.3 °C. Two competitive effects may explain this behavior; the
Tg dependance with the lithium content and the effect of the inorganic SiO
1.5 crosslinking sites on the mobility of the EO segments, the microstructure of the materials. As mentioned in the synthesis paragraph, by fixing the molar ratio
r2 = 1, the content of silica and lithium in HySI electrolytes is intimately linked together. Thus, it is difficult to distinguish the influence of these two effects. Therefore, the HySI_20_TEOS and HySI_20_TEMS that possess double the silica content were prepared, and their
Tg value was compared to that of HySI_20 (
Figure 4a). The
Tg of the HySI_20_TEOS (−18.1 °C) and HySI_20_TEMS (−15.3 °C) samples are 15 to 18 °C higher than that of HySI_20 (−33.7 °C). For a given lithium content, an increase in the silica concentration, and thus the crosslinking sites, increases the PEO chain’s rigidity and hence its
Tg. This result seems to demonstrate that the SiO
1.5 content pilots the dynamic of the PEO chains and affects the
Tg values of HySI electrolytes. This influence was less pronounced in samples having silica fractions lower than 4 wt% (
Table 2, entries 2–4 and 7) since the
Tg of these samples hardly varies around an average value of −33.7 °C.
In
Figure 4b,
Tm decreases with
wVSTFSILi between 45.6 (
wVSTFSILi = 0 wt%) and 33 °C (
wVSTFSILi = 25 wt%) while there is no
Tm for the HySI_33 (
wVSTFSILi = 32.6 wt%) electrolyte. Such dependencies, already reported in the literature by several authors, [
31,
32,
33] have been attributed to the coordination of the cation by ether oxygens of PEO. In addition, a smooth maximum at
wVSTFSILi of 17% is observed for the salty HySI electrolytes. In the article, the word salt designates the crosslinked VSTFSILi on the polymer matrix to create the single-ion behavior. Herein, since PEO chains are covalently bonded to the 3D silica networks, this can affect the crystallization of PEO due to the restriction imposed by the silica network. Indeed, the melting temperatures of HySI_20_TEOS and HySI_20_TEMS are higher than the one of HySI_20. Moreover, similarly to PEO-based electrolytes, χ
c decreases linearly with
wVSTFSILi from 46.2% (HySI_15) down to zero (HySI_33). Because of their high
Tg and
Tm values (less interesting for conductive property), HySI_20_TEOS and HySI_20_TEMS samples were not further studied.
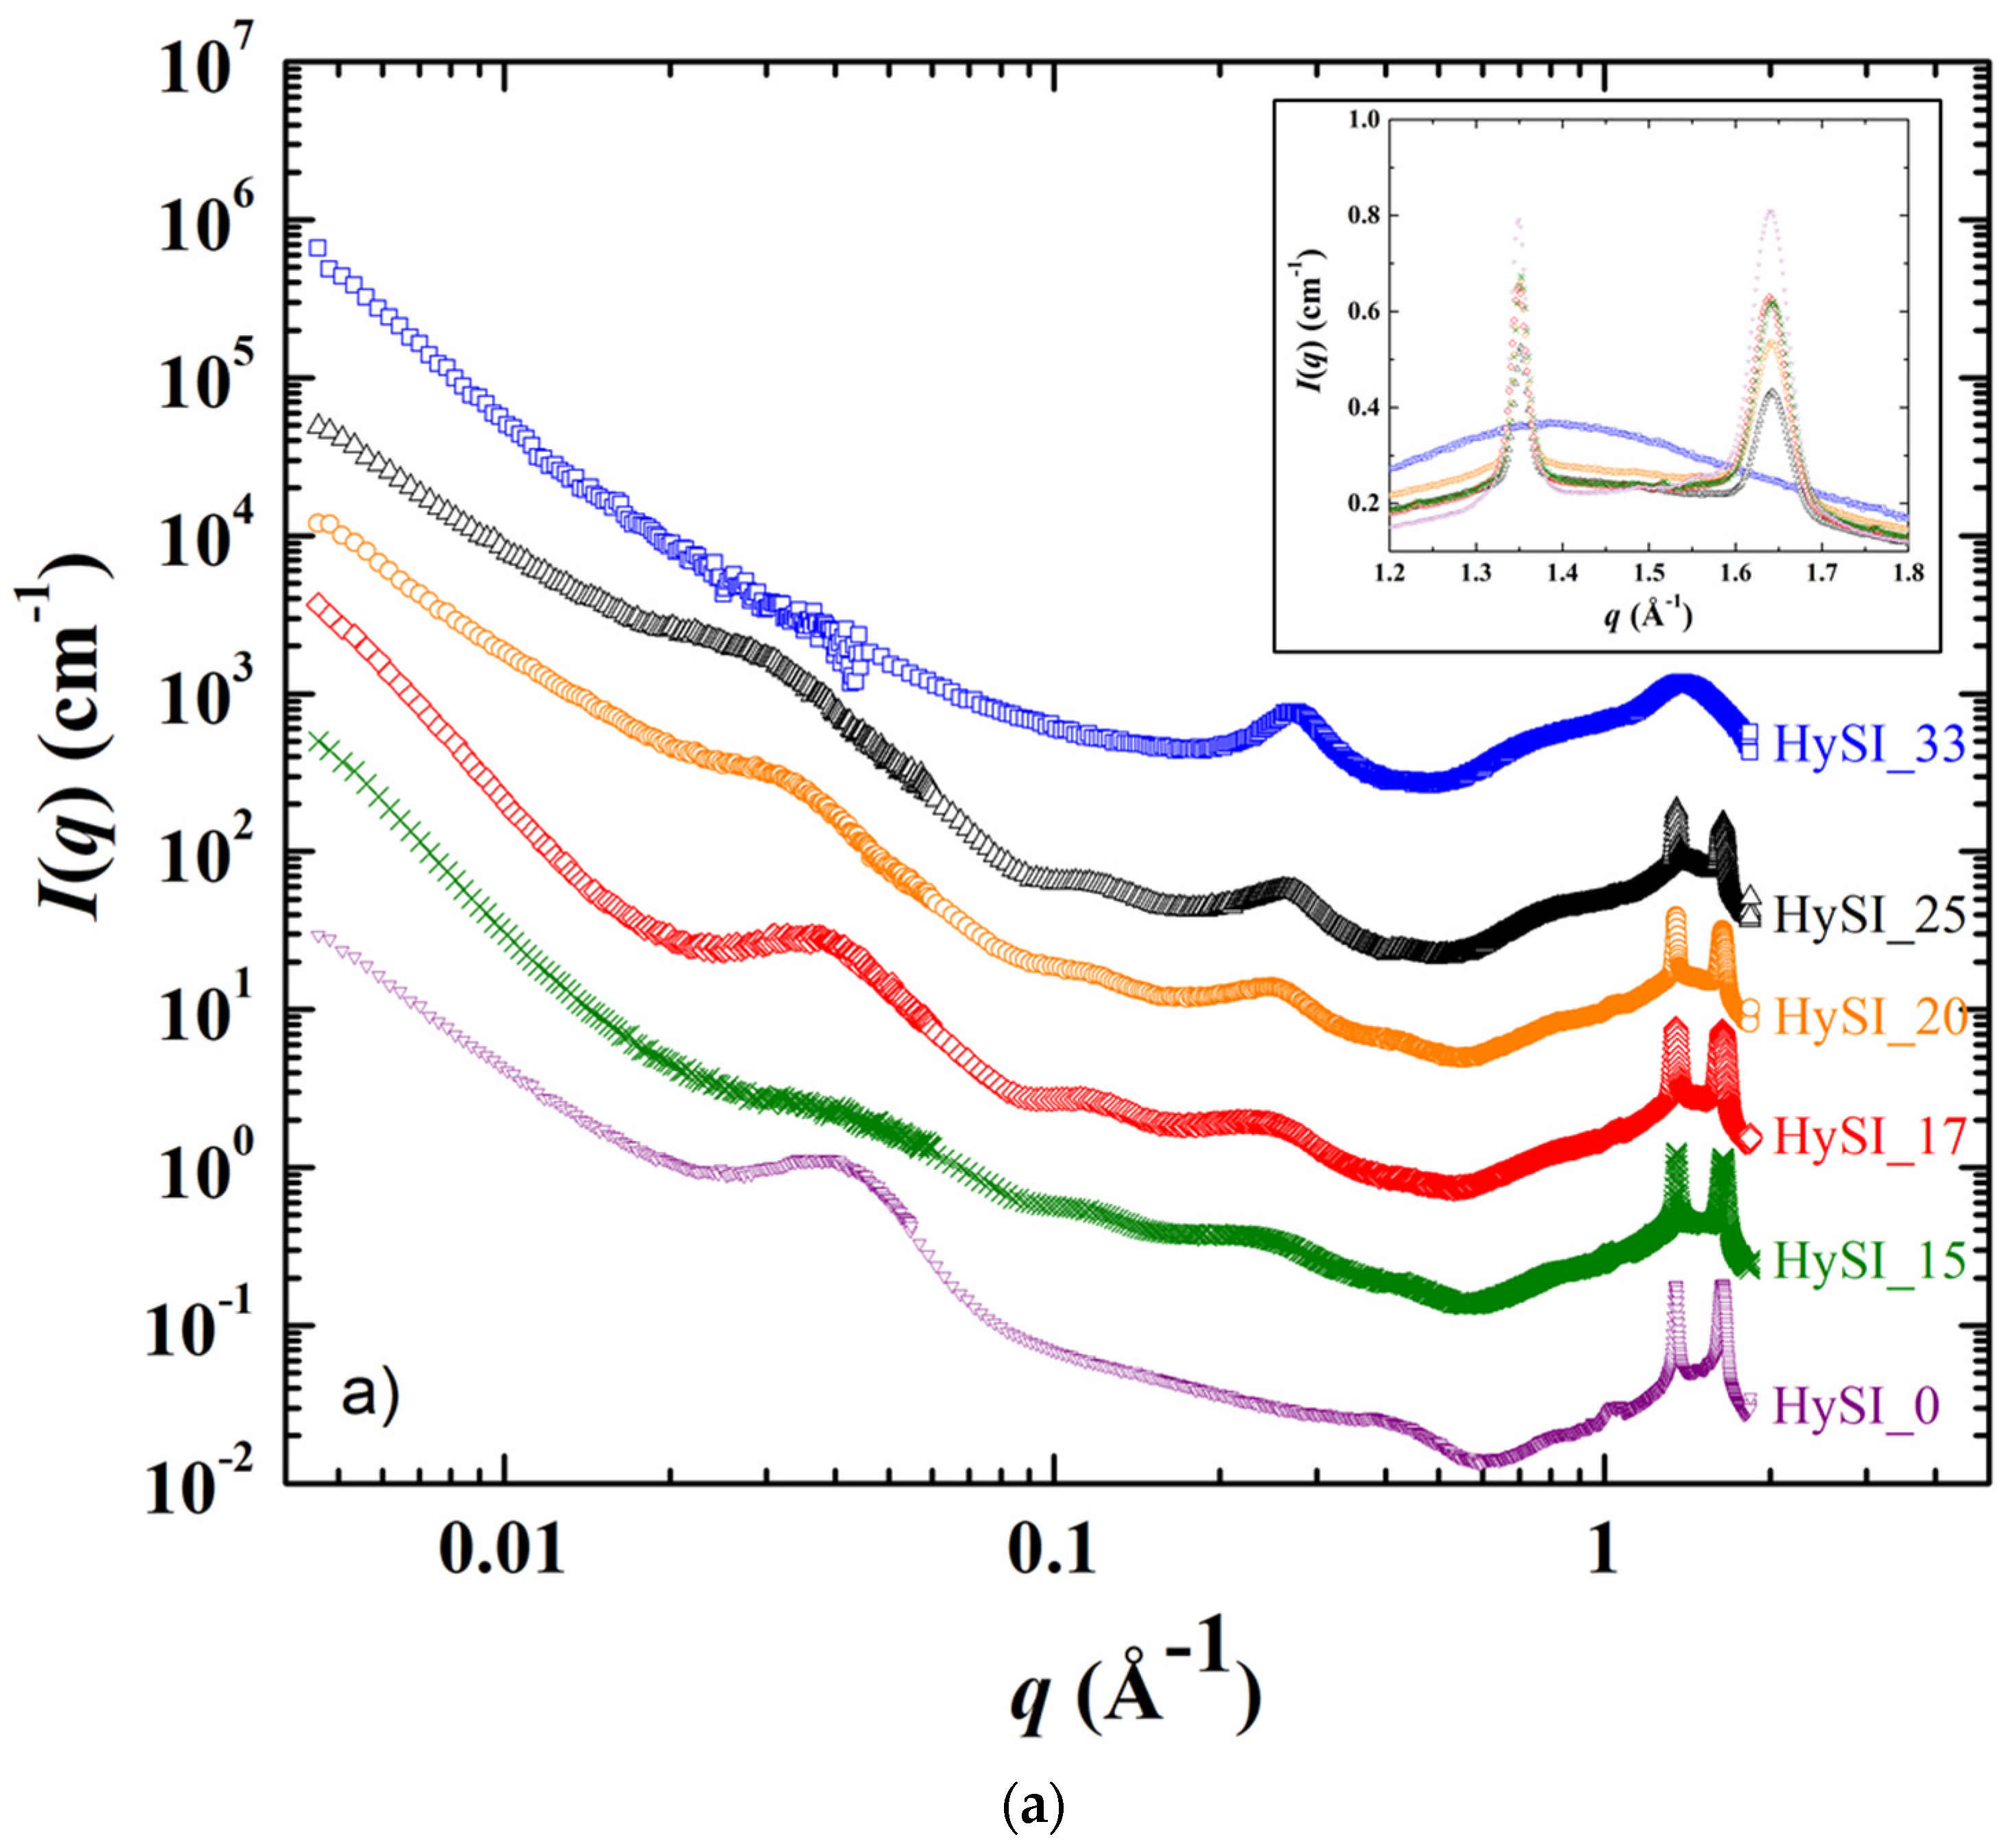
The SAXS/WAXS scattering patterns displaying the scattering intensity
I(
q) as a function of the scattering vector
q of the electrolytes and of the salt-free sample at 25 °C and 60 °C are shown in
Figure 5a,b. In
Figure 5a, the scattering pattern from most of the samples can be divided into four domains over the whole
q range: (i) at the lowest
q, a scattering decay like
q−α with α in between −3 and 4; (ii) a broad correlation peak around 0.035 Å
−1, followed by other well-defined peaks at larger
q in the 0.05–0.2 Å
−1 range for all samples except HySI_33; (iii) a correlation peak at ~0.26 Å
−1, except for the salt-free sample (HySI_0); and (iv) two crystalline peaks at very large
q* at 1.35 and 1.64 Å
−1, except for HySI_33 sample where only a large amorphous diffuse ring arises.
As the HySI_33 sample is the only one that does not crystallize at 25 °C (see
Figure 3b), the absence of the diffraction peaks (at
q* = 1.35 and 1.64 Å
−1) and correlation peaks at intermediate
q in the 25 °C scattering curve (
Figure 5a) demonstrates that such structural features come from the PEO crystalline structure. Indeed, they completely disappear when the electrolytes are heated at 60 °C, i.e., above their melting temperature (
Figure 5b). The crystalline peaks correspond to distances in the crystallized PEO of 4.65 Å and 3.8 Å [
34]. The large correlation peak at ~0.035 Å
−1 and the other correlation peaks at intermediate
q originate from the lamellar stacking of the crystallized PEO; the main peak being the first order peak and the other ones its harmonics. The exact positions of such peaks are difficult to precisely determine as they are superimposed with the overall scattering decay at law
q, which varies from one sample to another, and with the broadening of correlation peak at 0.26 Å
−1. Nevertheless, the distance between lamella is estimated to be about ~180 Å (2π/0.035). In addition, the intensity of the crystalline peaks decreases with increasing salt content. They are similar for HySI_15 and HySI_17 and progressively broaden for HySI_20 and HySI_25 (see inset of
Figure 5a). The crystalline peak intensity is highest for the sample without salt which means that the presence of salt reduces the PEO crystallinity. This result is in accordance with the decrease of the degree of crystallinity χ
c with
wVSTFSILi calculated from DSC (see
Figure 4b).
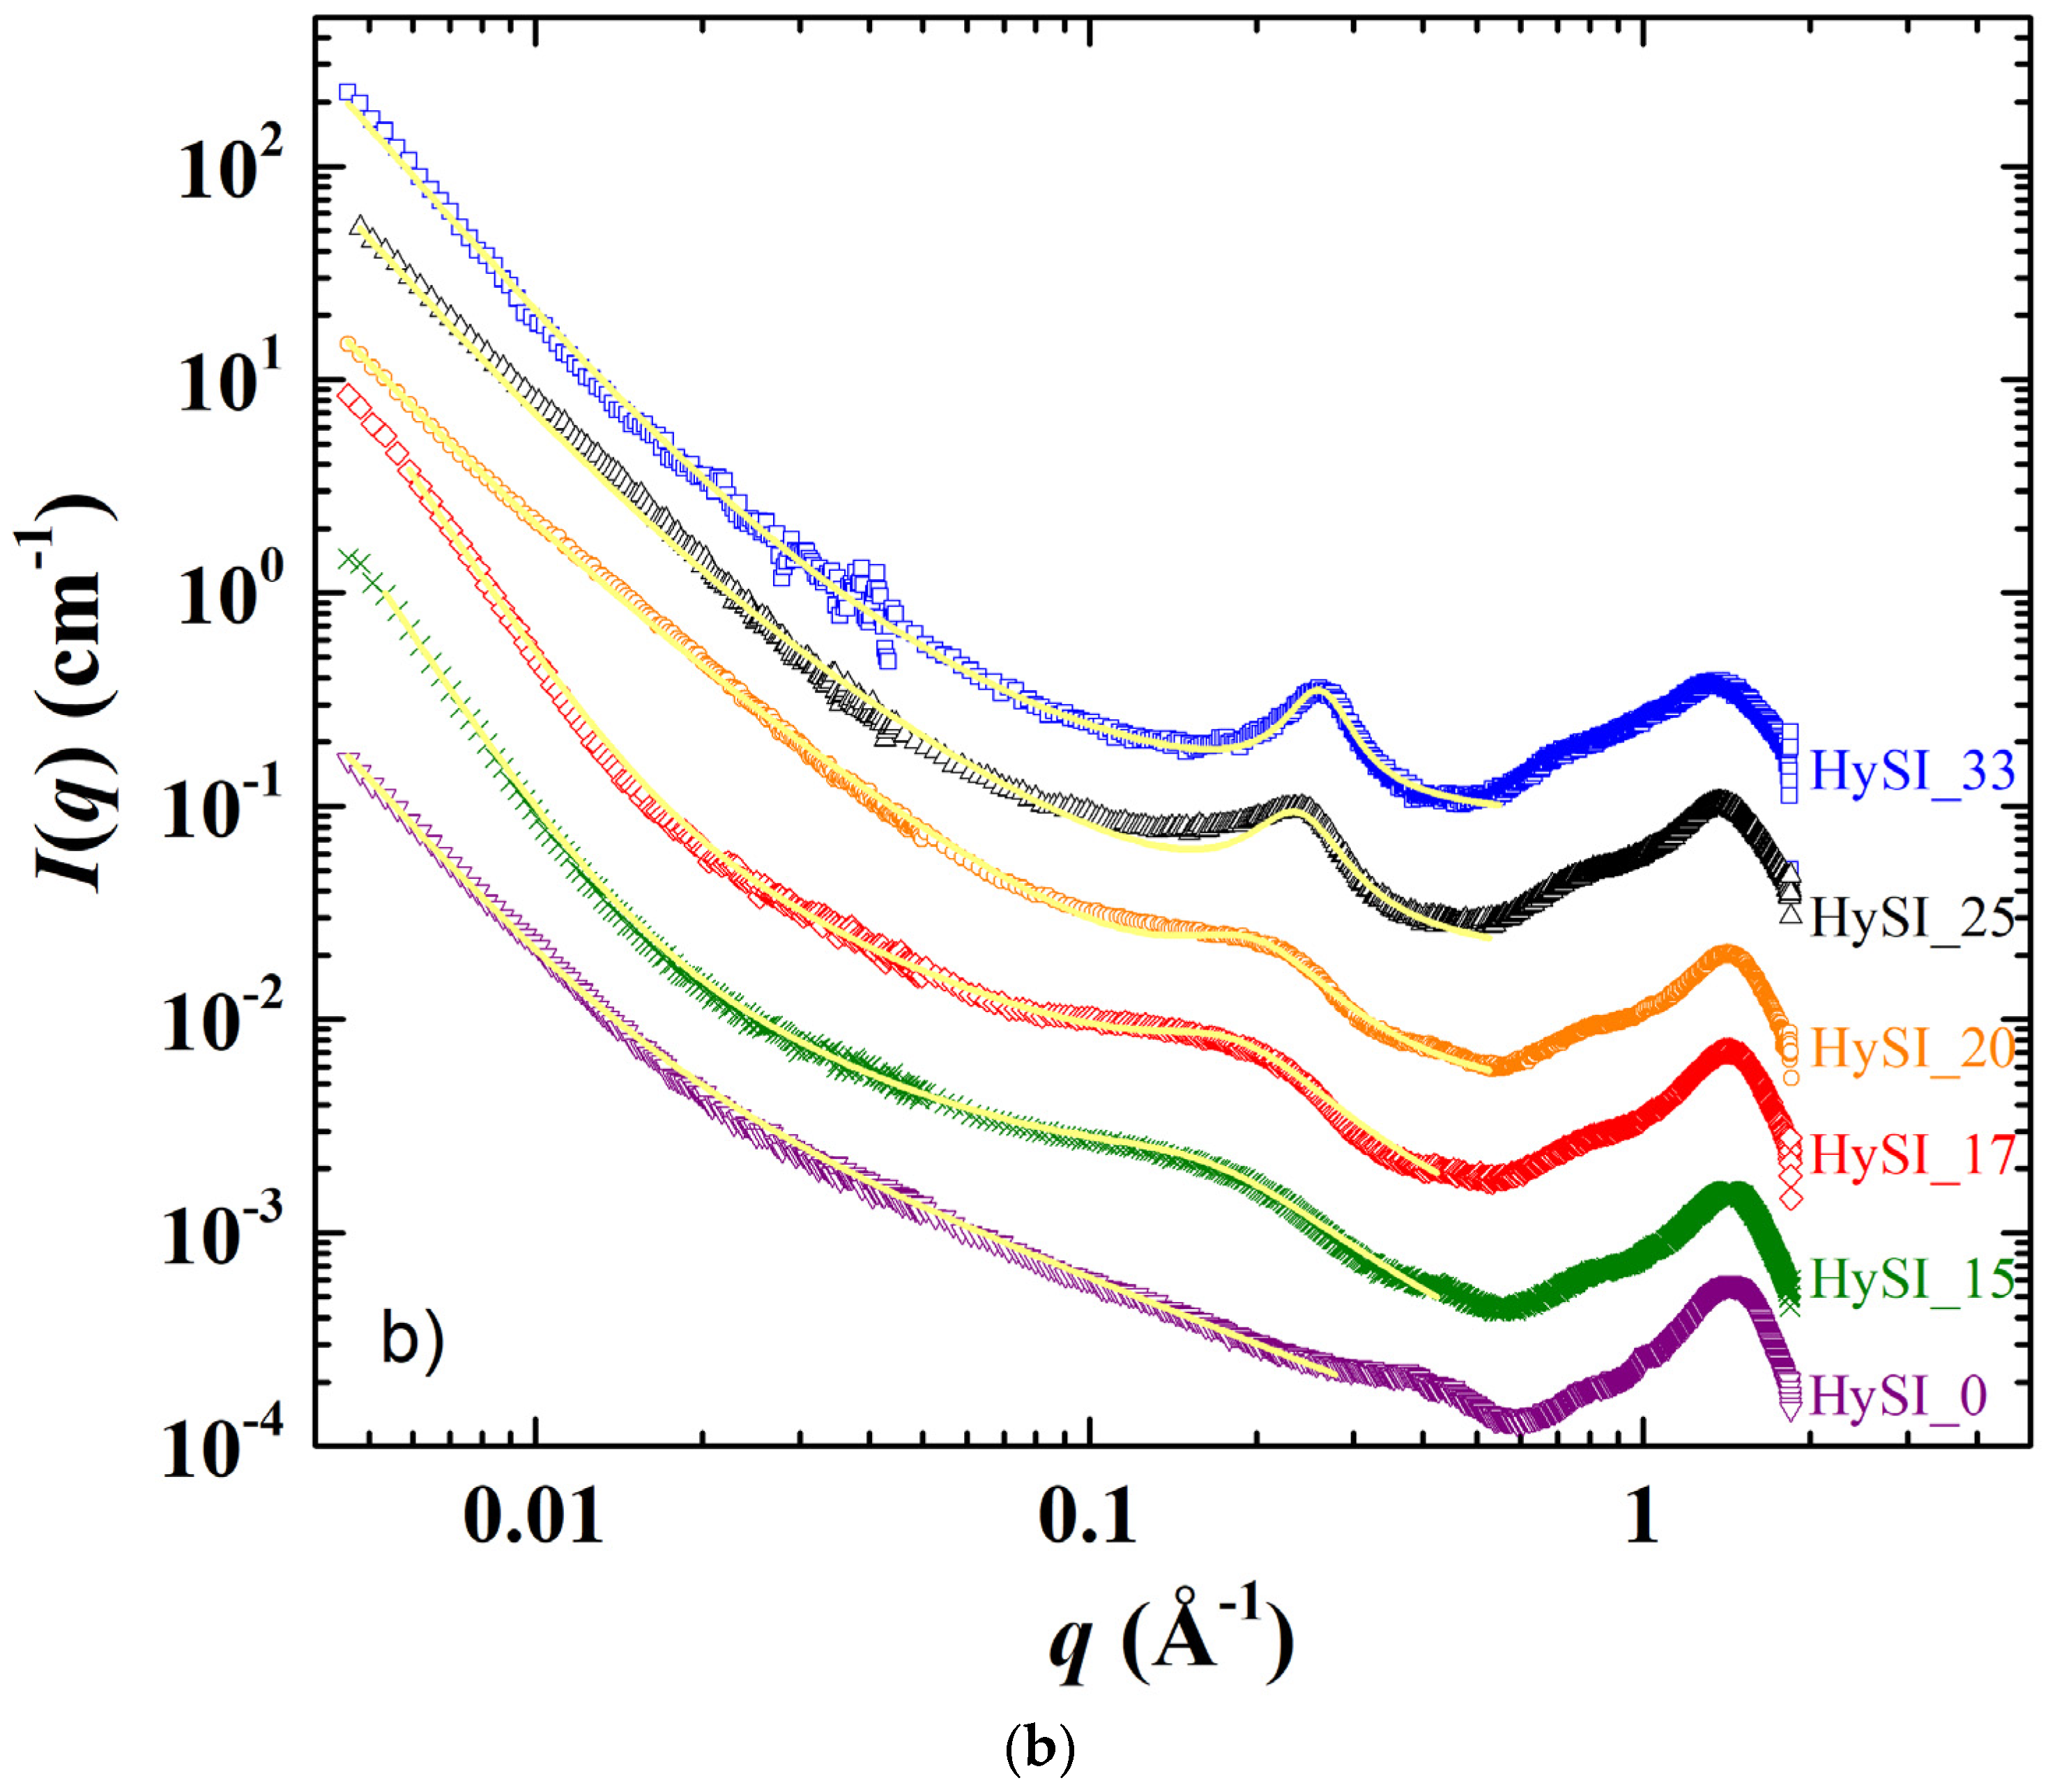
The data at 60 °C (
Figure 5b) enable the identification of the structural features that are not associated with the PEO crystalline parts, namely a scattering decay at the lowest
q following a power law ranging between
q−3 and
q−4 (for
q < ~0.04 Å
−1), another scattering decay with a much smaller lower power law (
q−1.7 −
q−1) at intermediate
q, and the correlation peak at ~0.26 Å
−1. The scattering decay at the lowest
q comes from some fluctuations/heterogeneities of the electron-scattering length density within the samples. It is difficult to assess their exact origin as the samples contain three types of scatterers: PEO chains, grafted TFSI anions and silica crosslinkers. Given that both TFSI anions and silica species are located at the PEO chain ends and are the only species that contain atoms having a mass significantly larger than those of oxygen (sulfur for TFSI and silicone for silica), it is reasonable to assume that the scattering obtained at low
q comes from the existence of domains either rich in silica and/or TFSI or rich in PEO. In other words, such scattering originates from the structure of the crosslinkers network. Indeed, it is also present for the salt-free sample that does not contain TFSI anions, demonstrating that the silica crosslinked nodes are not distributed evenly within the materials at a large scale. The value of the α exponent of the
q−α decay is linked to the morphology of the crosslinkers network. For the salt-free sample (HySI_0) and for the electrolytes with the higher salt concentration (HySI_20, HySI_25, and HySI_33), α equals 3 which reveals the presence of strong inhomogeneities within the sample. When α = 4, as for HySI_15 and HySI_17, we recover a typical Porod scattering that comes from the surface scattering of 3D objects. In these electrolytes, the PEO domains likely reach a large size, i.e., the sample displays locally a spatial phase separation. This is consistent with the fact that the PEO crystallite domains are the largest at 25 °C for such samples, as evidenced by the low width and high intensity of the crystalline peaks at large
q (see inset
Figure 5a). Remarkably, the low
q scattering does not vary upon a 25–60–25 °C temperature cycle as shown in
Figure S6, demonstrating that the electrolyte structure at a mesoscopic scale does not evolve upon PEO crystallization or melting. Indeed, over the temperature cycle, the PEO chains recrystallize in a similar fashion, as the 25 °C SAXS spectra of the electrolytes after heating at 60 °C superimposes, also at high
q, with those recorded at 25 °C before heating. This indirectly demonstrates the high mechanical strength of the solid network, as a fragile loose network would have probably reorganized itself upon the formation/disappearance of PEO spherulites.
The other important structural feature is the correlation peak in the 0.1–0.3 Å
−1 range for all electrolytes except the salt-free one (HySI_0), showing that the grafted TFSI induces the structuration at a local scale with a given characteristic size. Such a peak is intense at a well-defined position
q* at 0.26 Å
−1 for HySI_33, then progressively broadens and shifts towards lower
q when decreasing salt content. In order to receive more quantitative insight into the structural parameters of the different samples, the SAXS scattering data at 60 °C were fitted with an ad hoc model over the entire
q range, from 0.006 Å
−1 to 0.5 Å
−1, composed of the three contributions described above. The intensity was fitted by the sum of three terms: two power laws to describe the intermediate and low
q regions (
I~
q−α or
q−β) with their respective exponents α and
β and the correlation peak at large
q by a Lorentzian distribution enabling the determination of its position
and width λ. In addition, for the salt-free sample, only the two power laws were considered. The equation of the ad hoc model is thus:
where
I is the normalized scattered intensity; A, B and C are pre-factors of the Lorentzian term;
β and
α are exponents of power laws at low and intermediate
q range, respectively; and
and
represent the peak position and peak broadening parameters for Lorentzian distribution.
The results of the fits are also added in
Table S1. For the correlation peak, it gives a well-defined structure (
λ = 0.038 Å
−1) with a characteristic size
d0 (=2π/
q0) of 24.15 Å in direct space for the highest concentrated electrolyte (HySI_33), then
d0 increases continuously with the decrease of the salt content up to 47.6 Å for HySI_15, associated with an increase in the broadening up to
λ = 0.105 Å
−1. In the crosslinked electrolyte, the emergence of this characteristic size originates from the differences of electron scattering length density in the three-component system (amorphous PEO with only light atoms, TFSI and SiO
1.5 with Si and S heavier atoms, S being those that scatter most). The samples for which such a peak is visible contain mainly PEO and TFSI (15–33 wt.%), the silica content being rather low (below 4.2 wt.%). Given that the correlation peak only arises with TFSI, it is likely that this peak comes mainly from correlations between TFSI molecules, either individually and/or most probably in cluster domains. This is consistent with the electrolytes comprising the larger TFSI content that induce shorter distances in real space. As the VSTFSILi/silica network would have a homogenous 3D organization, they would be separated by a typical mean distance
dmean that would scale with the volume density of molecules
ρTFSI such as
ρTFSI ~ 1/
dmean3 due to dilution. Therefore,
Figure S7 represents 1/
d03, with
d0 obtained from SAXS fitting, as a function of
wVSTFSILi. The behavior is linear suggesting a rather homogenous distribution of VSTFSILi/Silica clusters within the TFSI-rich domains. At last, the silica content in the hybrid materials seems to have little influence on the TFSI network structure. Indeed, the whole structure of the HySI_20_TEOS and HySI_20_TEMS are very close to those of the HySI_20, both at 25 °C and 60 °C (see
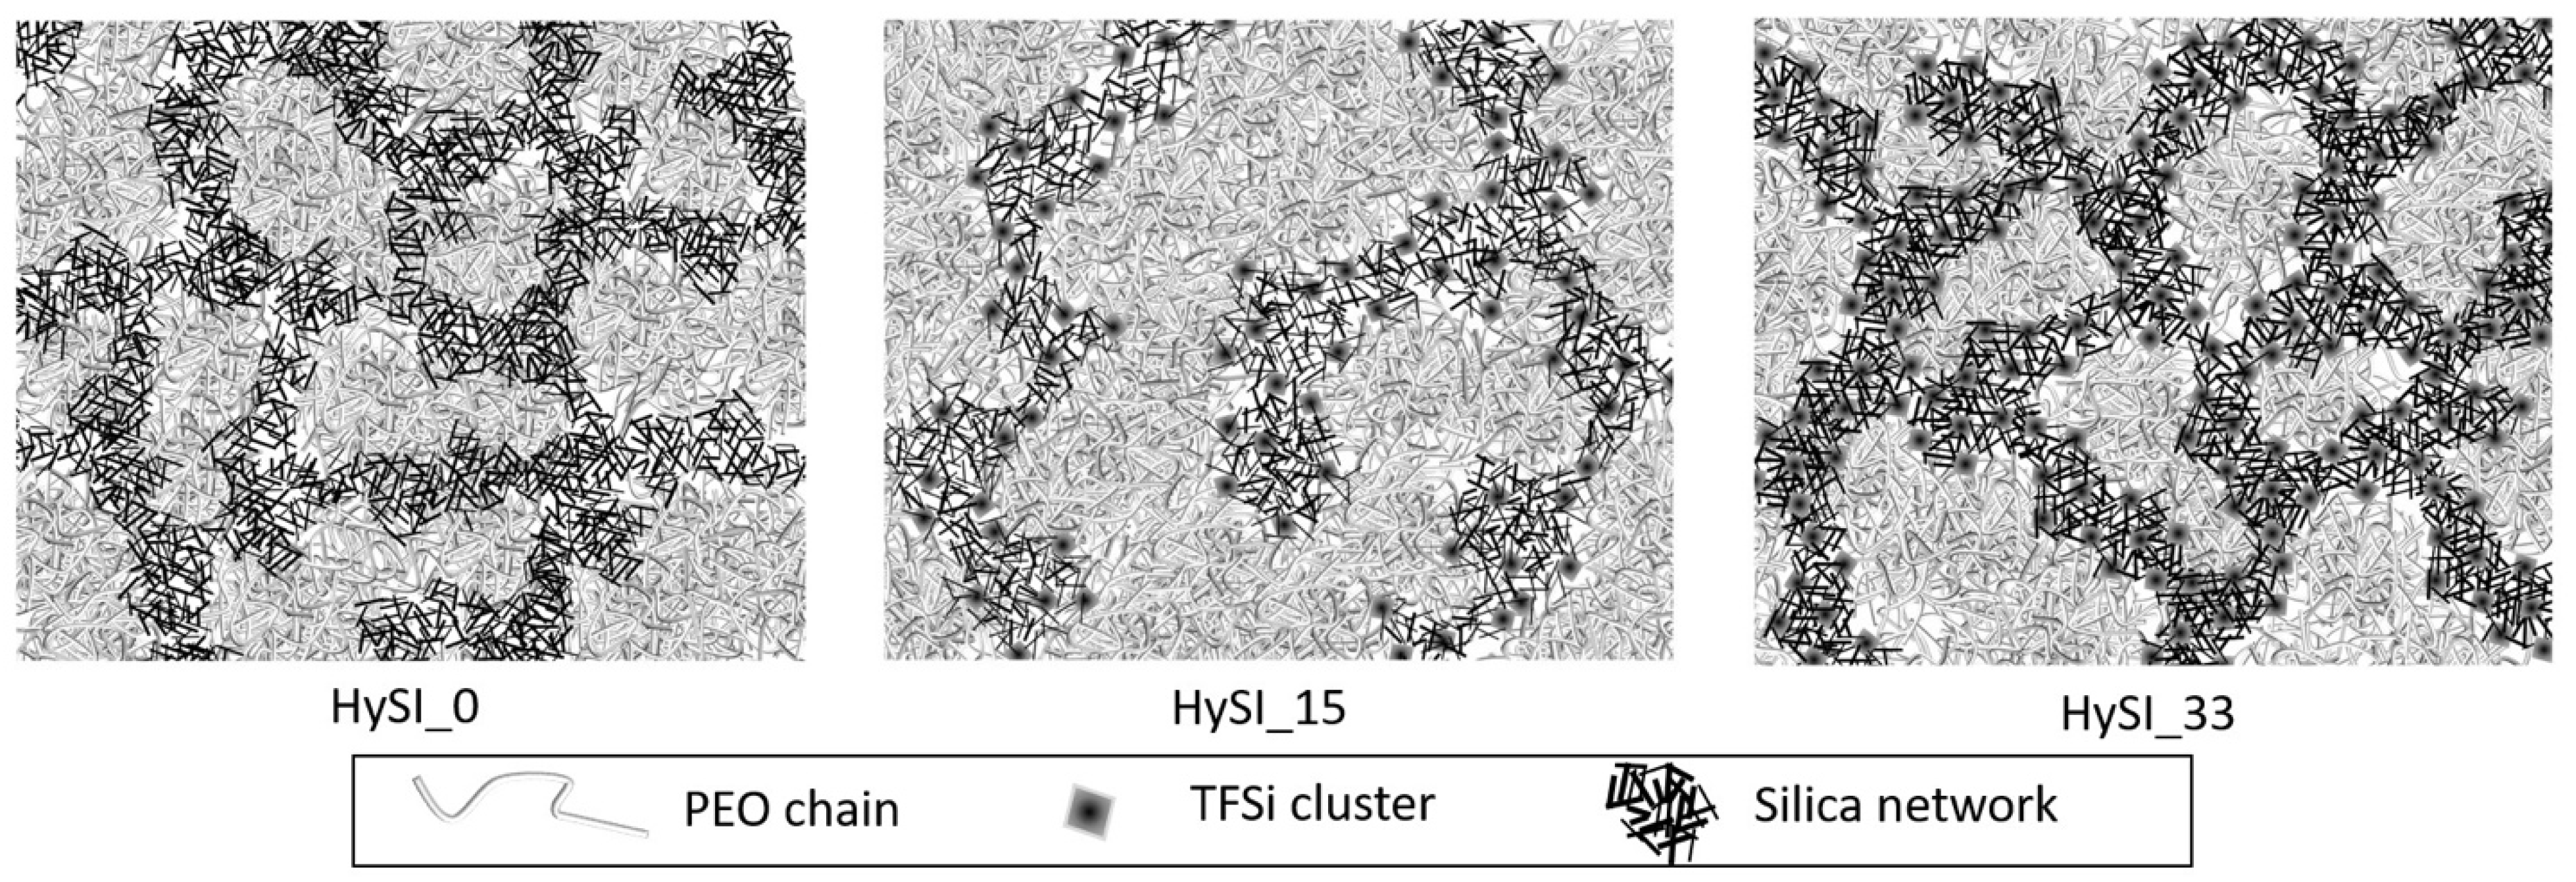
Figure S8). Finally, to illustrate these findings, a schematic network of hybrid electrolytes is proposed in
Figure 6. For small values of
wVSTFSILi, such as HySI_15, larger PEO domains are observed with a distance inter-islet around 50 Å, and finally for the highest concentrated electrolytes, such as HySI_33, smaller PEO domains are observed with a distance inter-isled around 25 Å. The islets of silicic bridges crosslinked are more or less interconnected during the crosslinking process, and the PEO phase does not change the microstructure. In fact, the nanostructure of the HySI does not change before and after heating at 60 °C. The degree of local organization decreases in proportion to the decrease in silica and in salt as a consequence. The presence of a rich-PEO phase and of the rich-TFSI phase containing the silica (TFSI/SiO
1.5) at 60 °C in the HySI shows a mesostructured network, so the impacts on the ionic transport properties are discussed.
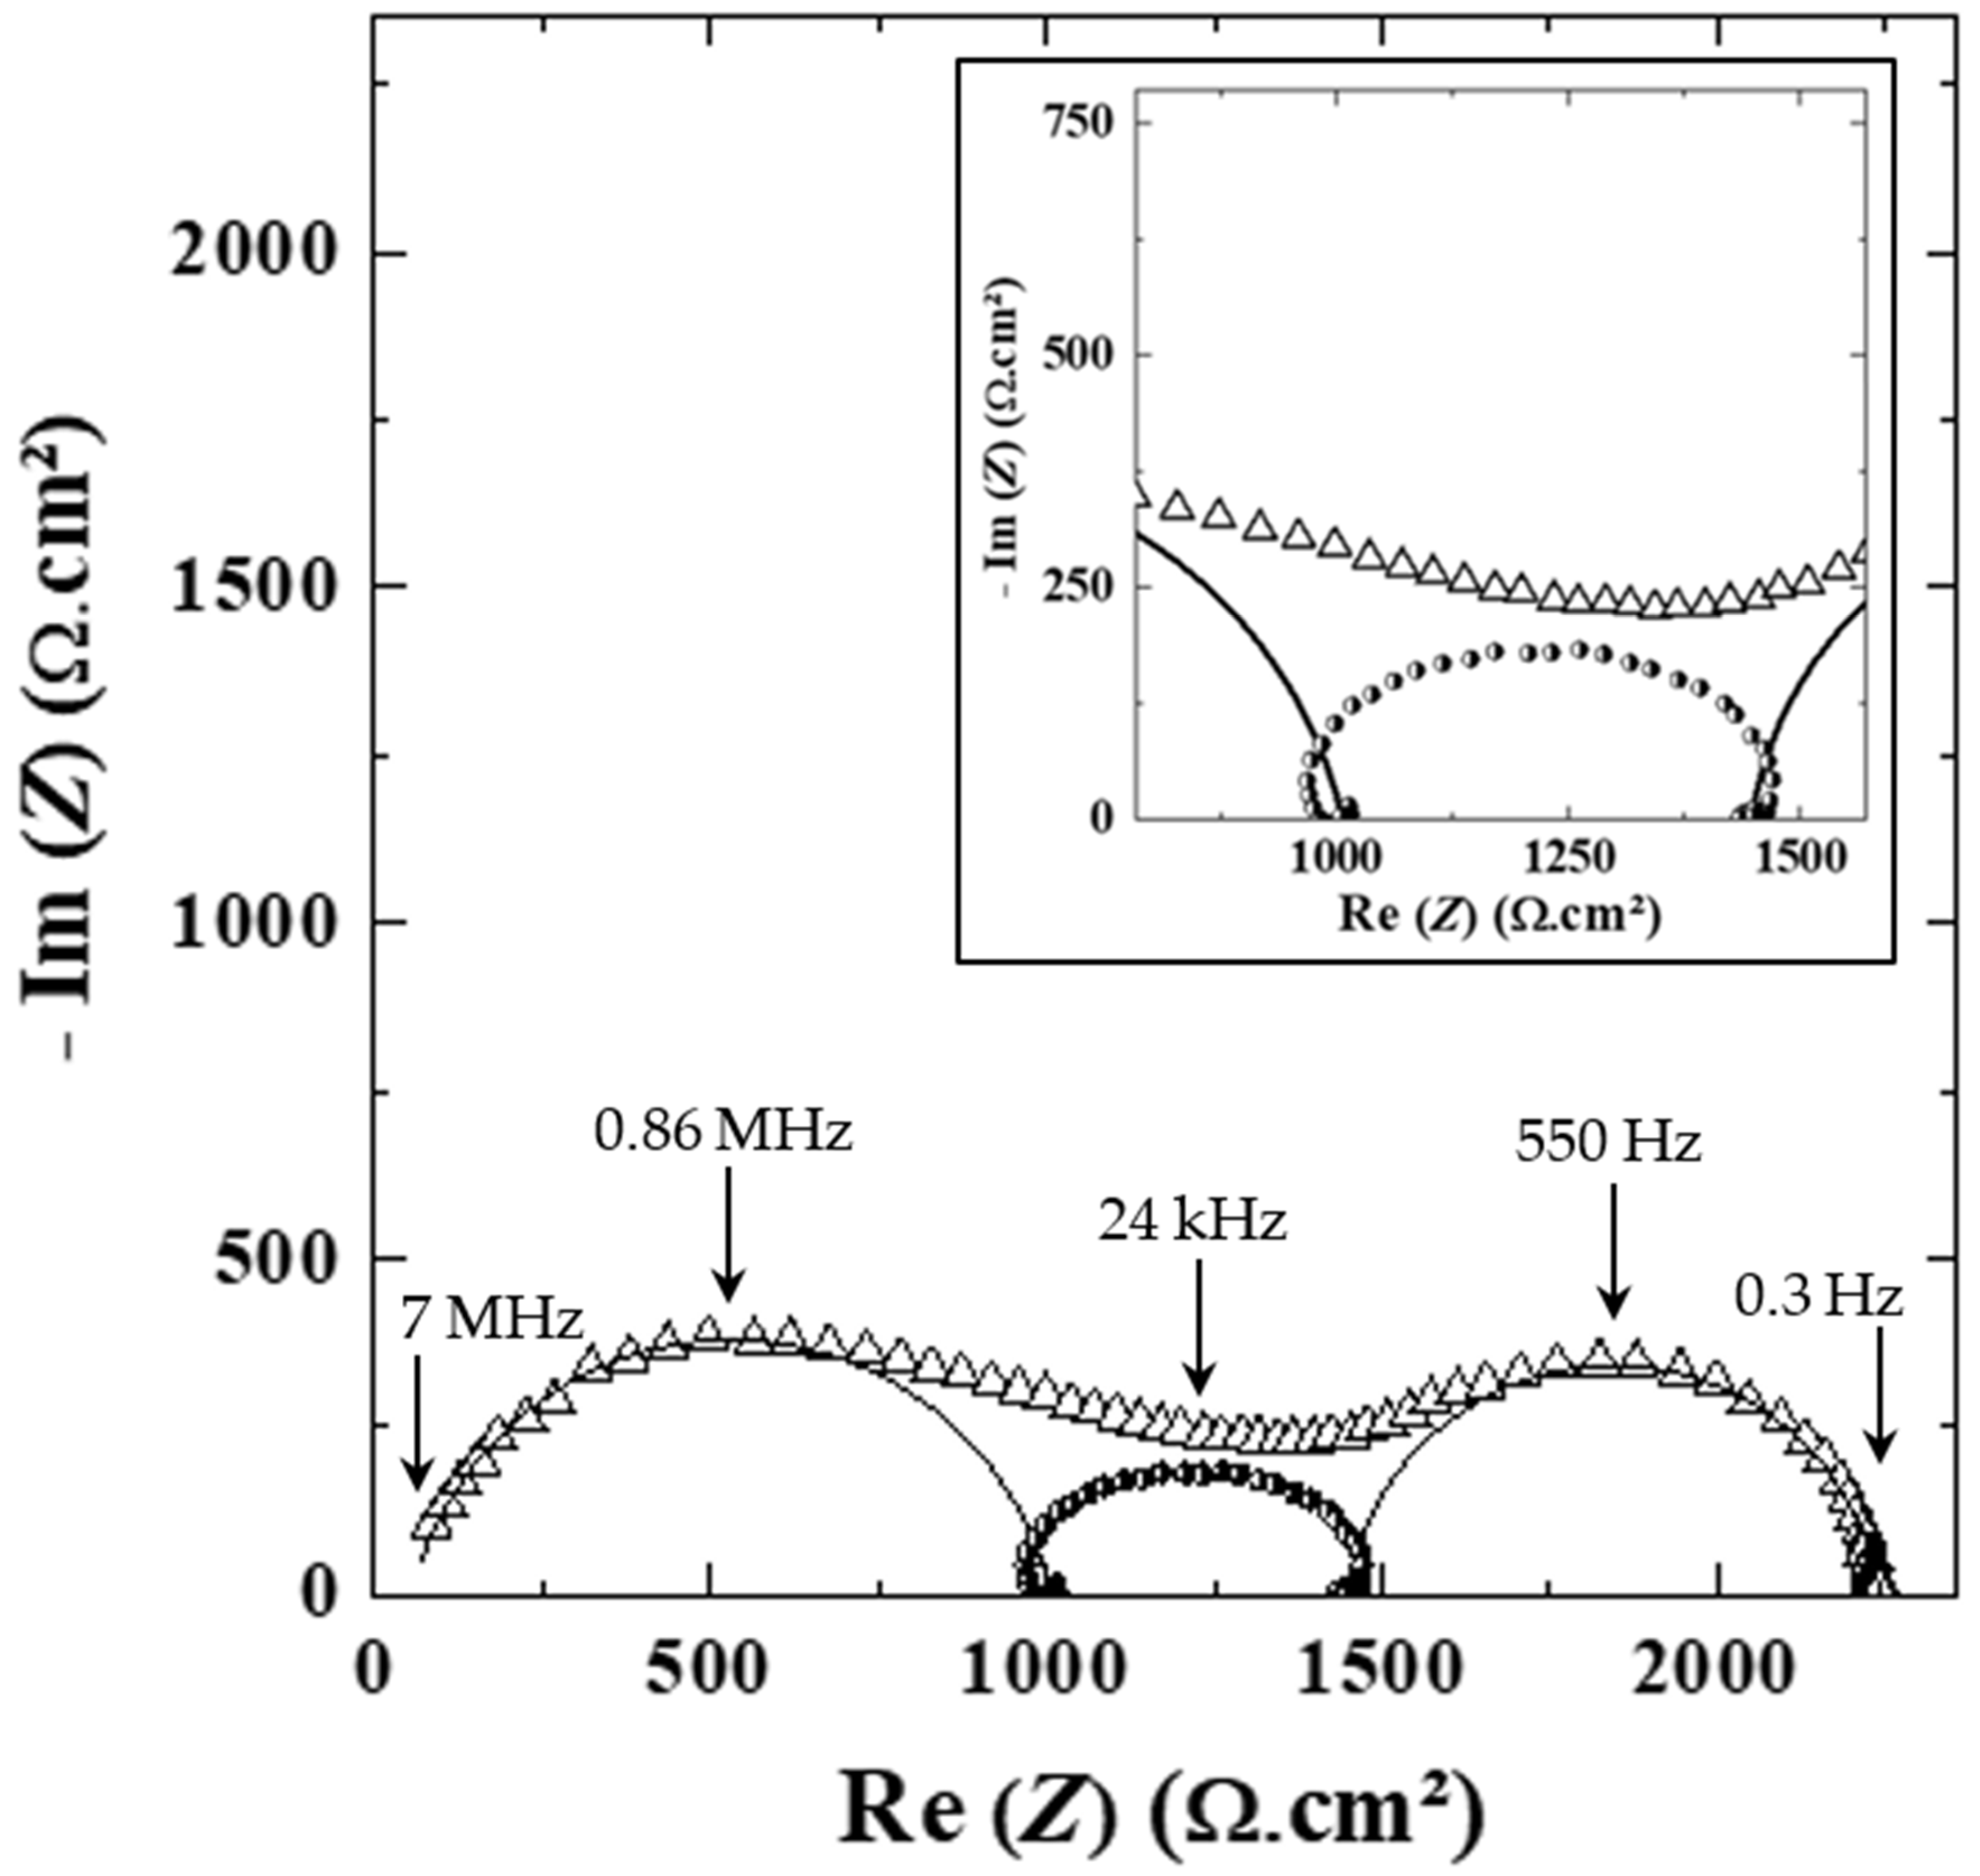
To analyze the ionic transport properties and the Li/electrolyte interface, electrochemical impedance spectroscopy (EIS) was performed on a series of Li symmetric cells comprising the HySI electrolytes. A typical EIS spectrum of the HySI_25 electrolyte recorded at 60 °C is presented in
Figure 7. The experimental spectrum can be decomposed into two main frequency (
f) domains with
f > 4 kHz; a loop with a large frequency distribution from high to medium
f is ascribed to the overall bulk contribution, followed by a clean arc of a circle at lower
f corresponding to the Li/electrolyte interface (
fc = 550 Hz) [
35]. Those features are observed for all the EIS spectra of the electrolytes within the explored temperature range, i.e., from 30 °C to 100 °C. For completeness,
Figure S9 displays the impedance spectra at 60 °C of the other HySI electrolytes with
wVSTFSILi of 15, 17, 20 and 33. The first loop starts with a clean arc of a circle (
fc around 1 MHz) with a “tail” up to a few kHz with no clear contribution such as R//CPE; it cannot embed a sole process and can be at least decomposed into a high frequency (
f > 100 kHz) and a medium frequency (100 <
f < 4 kHz) contribution. Therefore, to obtain insight into the underlying contributions without arbitrary parameters, a methodology based on spectra differences [
24] was employed to separate the different
f domains at high (HF), medium (MF) and low (LF) frequency.
Firstly, the HF arc of circles is fitted with an electric equivalent circuit composed of resistance (
R) in parallel to a Constant Phase Element (
CPE):
R//
CPE. The result of the fit is shown in
Figure S10a and
Figure 7. This fitted HF contribution (
fc = 0.86 MHz) is subtracted from the experimental data leading to a subtracted spectrum, shown in
Figure S10b, comprising the remaining MF and LF contributions shifted by a constant value corresponding to the HF resistance. Then, the LF contribution is fitted by another R//CPE circuit (
fc = 550 Hz), as shown in
Figure S10b and
Figure 7, and subtracted to the initial subtracted spectrum, leading to a remaining loop slightly depressed and deformed at HF and LF, which corresponds to the MF contribution as added in
Figure S10c and
Figure 7. It is worth noticing that this loop cannot be fitted properly by a simple R//CPE (see the inset of
Figure 7, a zoom on this contribution at MF). Moreover, from this methodology, the characteristic frequencies at 60 °C taken as the apex frequencies of the HF, MF and LF domains are plotted as a function of
wVSTFSILi in
Figure S11. For all the electrolytes, the three contributions are present. Therefore, this methodology based on successive subtraction steps permits a robust method to deconvolute different contributions with a large frequency distribution located within a close frequency range.
To identify the main contributions related to the HF and MF processes, the dielectric constant (
εHF) of the HF contribution was calculated based on the results of the fits, listed in
Table S2, using both resistance and constant phase element parameters (see Equation (5)).
εHF is on average 7.5 ± 1.0 with a slightly lower value for the highest concentrated electrolytes. In addition, the average value of
εHF is almost independent of the temperature. In the literature, the dielectric constant of PEO electrolytes ranges from 4 to 7.5 [
36,
37,
38,
39].
Moreover, based on the SAXS analysis (see
Figure 5a,b), the HySI electrolytes are heterogeneous compounds at the meso/microscale with the presence of PEO- and TFSI/SiO
1.5-rich domains, the latter comprising the salt and the silica crosslinked nodes. We thus attribute the HF (0.86 MHz) contribution to the major PEO-rich phase, and the following complex contribution at MF (24 kHz) to the presence of the minor TFSI/SiO
1.5 domains. The co-existence of those two phases leads to the convoluted contributions observed in the impedance spectra for
f > 4 kHz as the Li
+ cation has to transfer through the PEO and the TFSI/SiO
1.5 rich domains.
As during ionic transport, the ions move through the PEO- and TFSI/SiO
1.5- rich domains. According to the microstructure, we assume that they behave as in nanostructured ceramics with the grain (PEO-rich) and alternate grain boundaries (TFSI/SiO
1.5-rich) [
40], the two contributions being then considered in series. The effective conductivity (
σt) of the HySI can be calculated based on Equation (3), considering that the effective resistance of the membrane is the sum of the HF and MF resistances. In addition, one can calculate the apparent ionic conductivity due to both contributions normalizing the resistances by the geometrical factor of the membrane, such as:
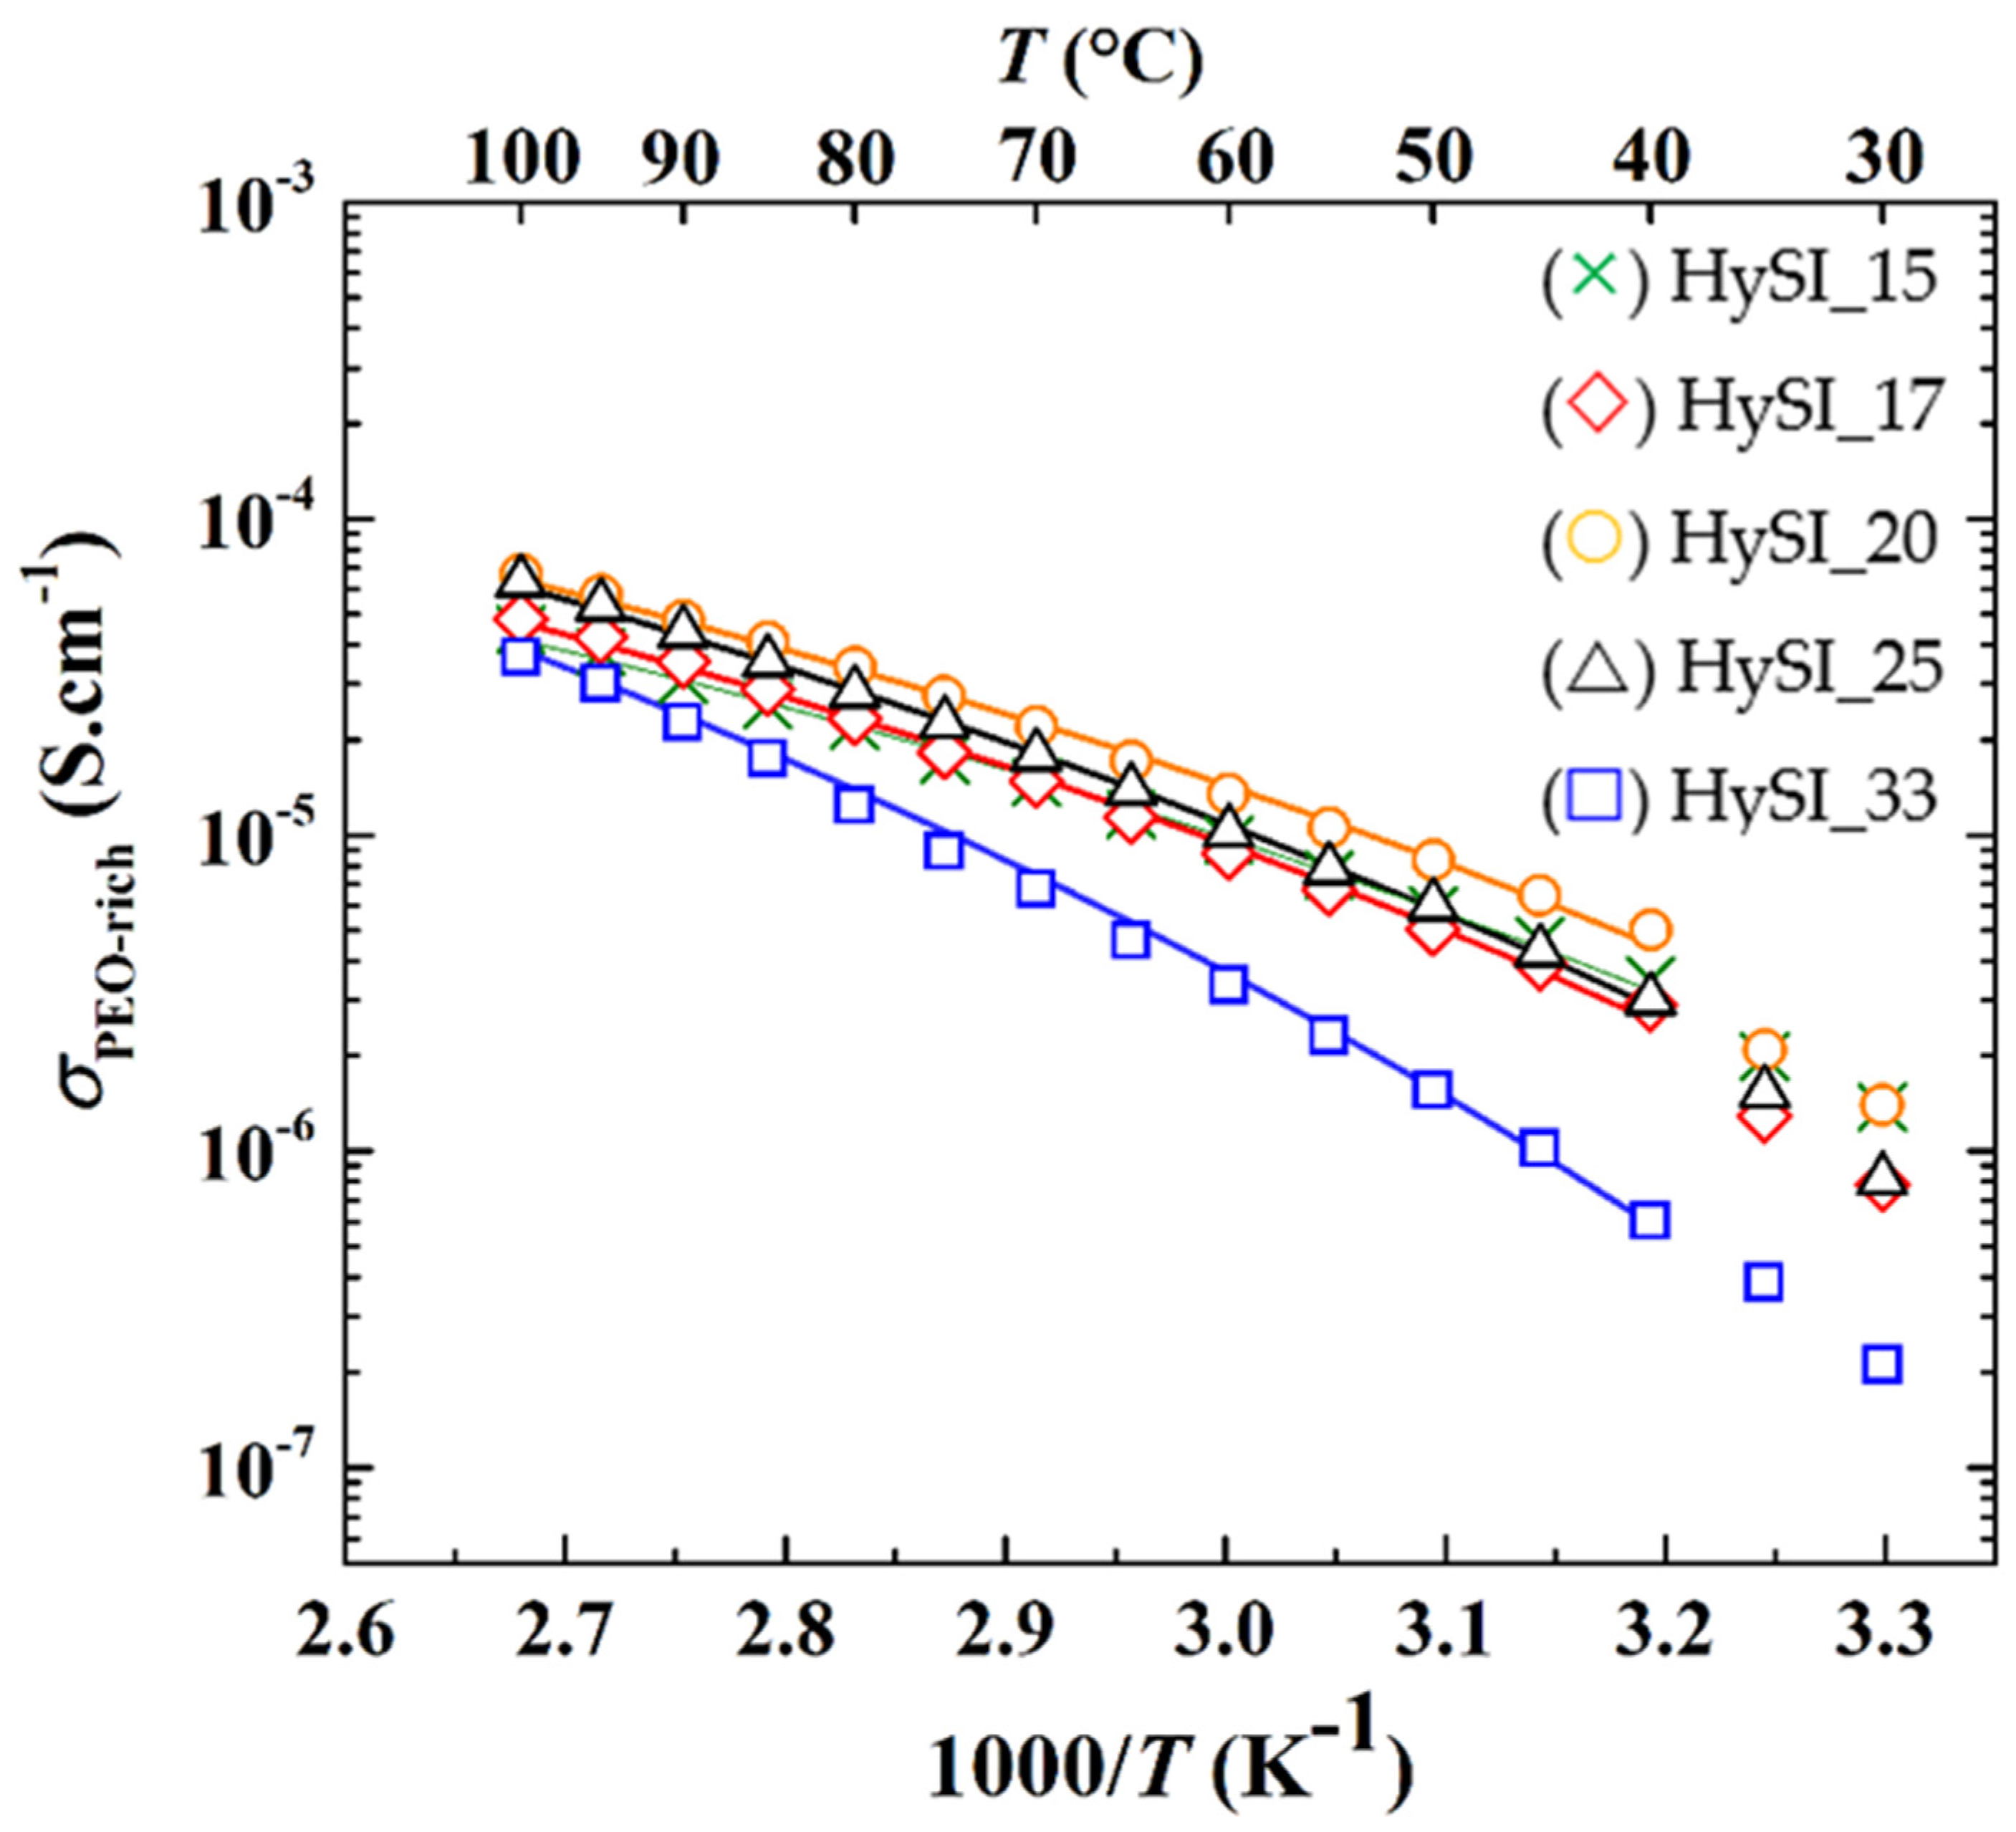
The apparent ionic conductivity of the PEO (
σPEO) is then plotted as a function of the inverse of the temperature in
Figure 8. The conductivity of the PEO phase of the HySI electrolytes follows a typical VTF behavior for PEO-based electrolytes [
41], with a break at about 40 °C corresponding to
Tm (see
Figure 4b), except for HySI_33 as this electrolyte remains amorphous in the explored temperature range. In addition, the conductivity of the PEO phase of the HySI_33 electrolyte remains lower than all the other compositions. Except for HySI_33,
σPEO ranges from about 4 × 10
−6 to 5 × 10
−5 S·cm
−1 at 40 and 100 °C, respectively. These values are similar to those encountered in single-ion conductor block copolymer electrolytes based on PEO but synthesized via a more complex, multi-step and time-consuming route [
42]. The ionic conductivity of the PEO-rich phase in the amorphous state was then fitted using the VTF Equation (4). The ideal glass transition temperature (
T0) is taken as being
Tg—50 while the two other parameters of the VTF equation,
σ0 and
Ea, were left free. The results of the best fit (
χ2 > 0.99) are added to
Figure 8, showing the good agreement between experimental and fitted data. For completeness, the fitted parameters,
σ0 and
Ea, are plotted as a function of
wVSTFSILi in
Figure S12. For
wVSTFSILi < 0.25, the pseudo-activation energy is close to that of PEO/LiTFSI electrolytes [
43] of about 7.8 kJ·mol
−1 while the pre-exponential factor is in the same range as those found in single-ion conductor block copolymer electrolytes based on PEO [
42]. These results confirm that the ionic transport mechanism in HF contribution of the crosslinked hybrid electrolyte is similar to that encountered in PEO-based electrolytes. At a higher salt content, with
wVSTFSILi of 0.25 and 0.33, the VTF parameters deviate from that of PEO-based electrolytes with a steady increase in
σ0 while
Ea tends to reach a plateau value at about 11.2 kJ·mol
−1. Such increases in
Ea with the number of crosslinked nodes are also reported in other materials in the literature [
44,
45]. Indeed, at higher concentrations, while there is a higher fraction of free ions (
σ0 in
Figure S12) to move within the electrolyte, the ionic transport via the movements of the polymer chain is more difficult. This can be related to the presence of large TFSI domains comprising the silica crosslinked nodes (see
Figure 6).
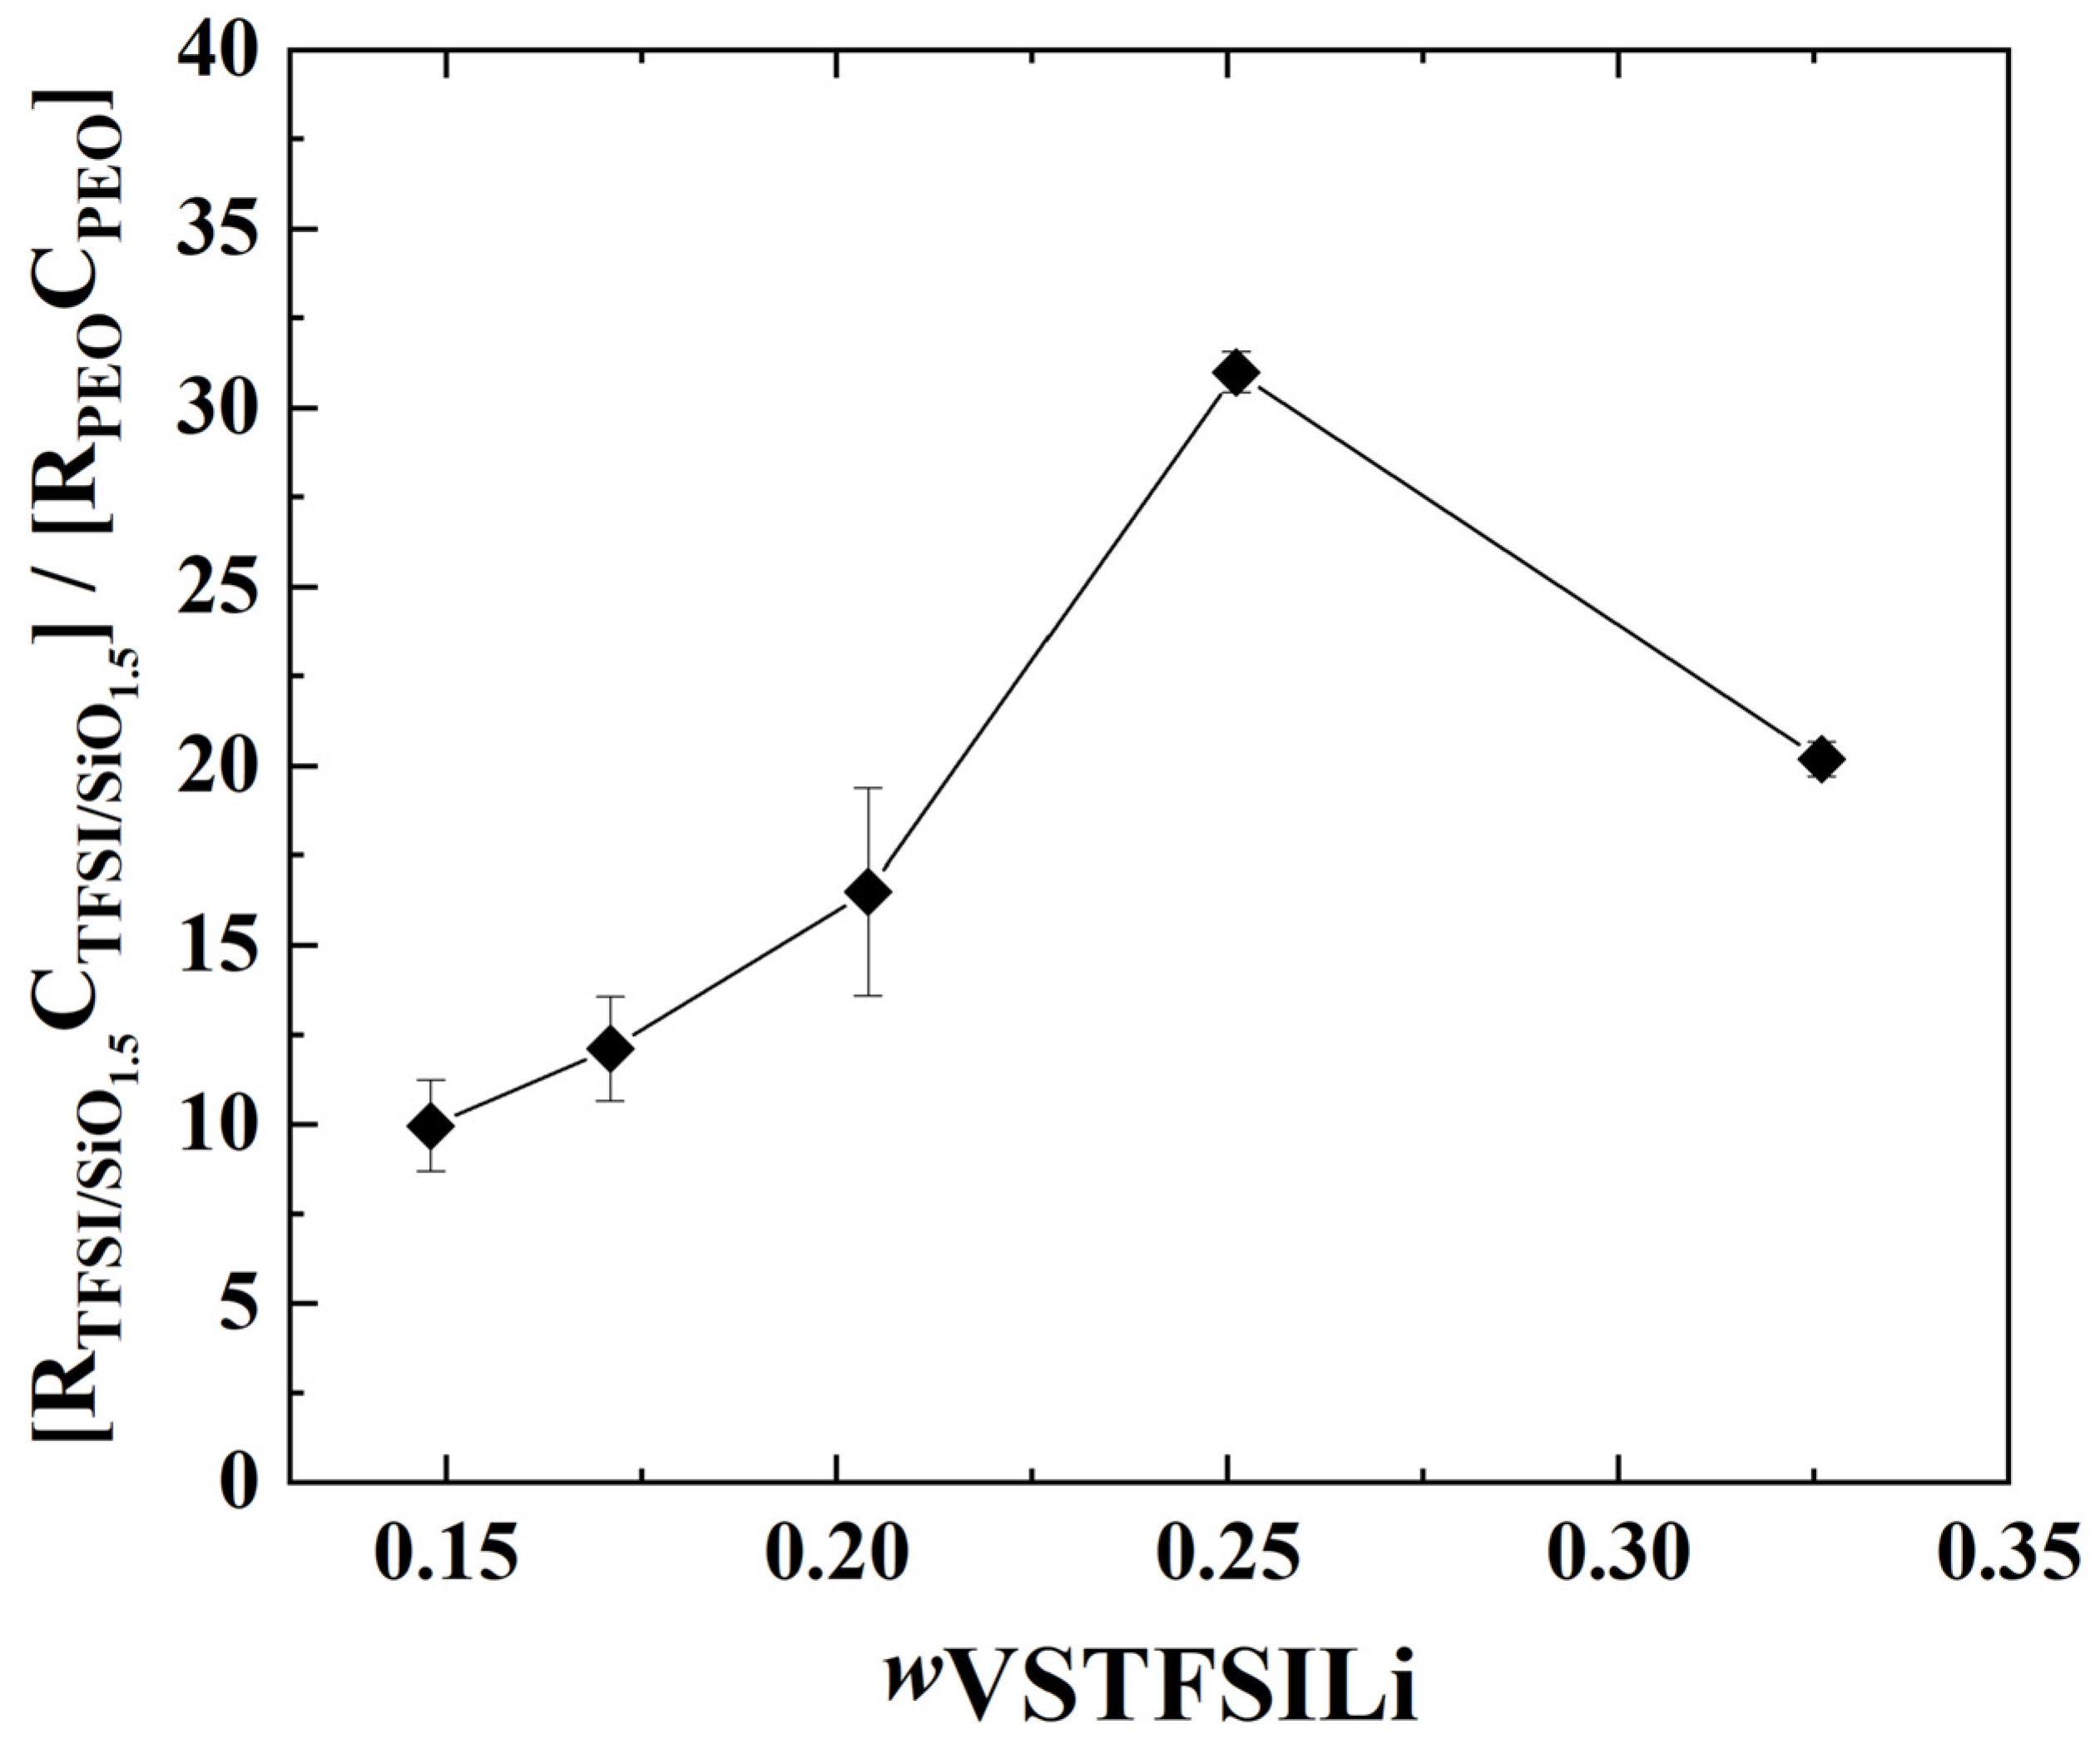
Unfortunately, the precise geometrical factor of each phase (TFSI and PEO rich) cannot be determined accurately, especially for the minor TFSI/SiO
1.5-rich domain; however, at a given temperature, the characteristic frequency
at the apex of each material contribution is proportional to the ratio σ
ι over dielectric constant
according to:
. If we assume that the dielectric properties of the two phases are similar [
46], the ratio of the
for the PEO-rich and TFSI/SiO
1.5-rich domains is proportional to the ratio of the true conductivity of each domain, PEO-rich and TFSI/SiO
1.5-rich
fc(HF)/
fc(MF) =
σ(HF)/
σ(MF). Herein, a factor between 10 and 30 is obtained at 60 °C from the EIS fits (see
Figure 9); that ratio decreases linearly with the TFSI/SiO
1.5 wt%, which suggests less blocking behavior of the MF contribution at a higher TFSI/ SiO
1.5 concentration. This increase may be due to the specific microstructure change as a function of the SiO
1.5 wt.% and VSTFSILi wt.%, as illustrated in
Figure 6.
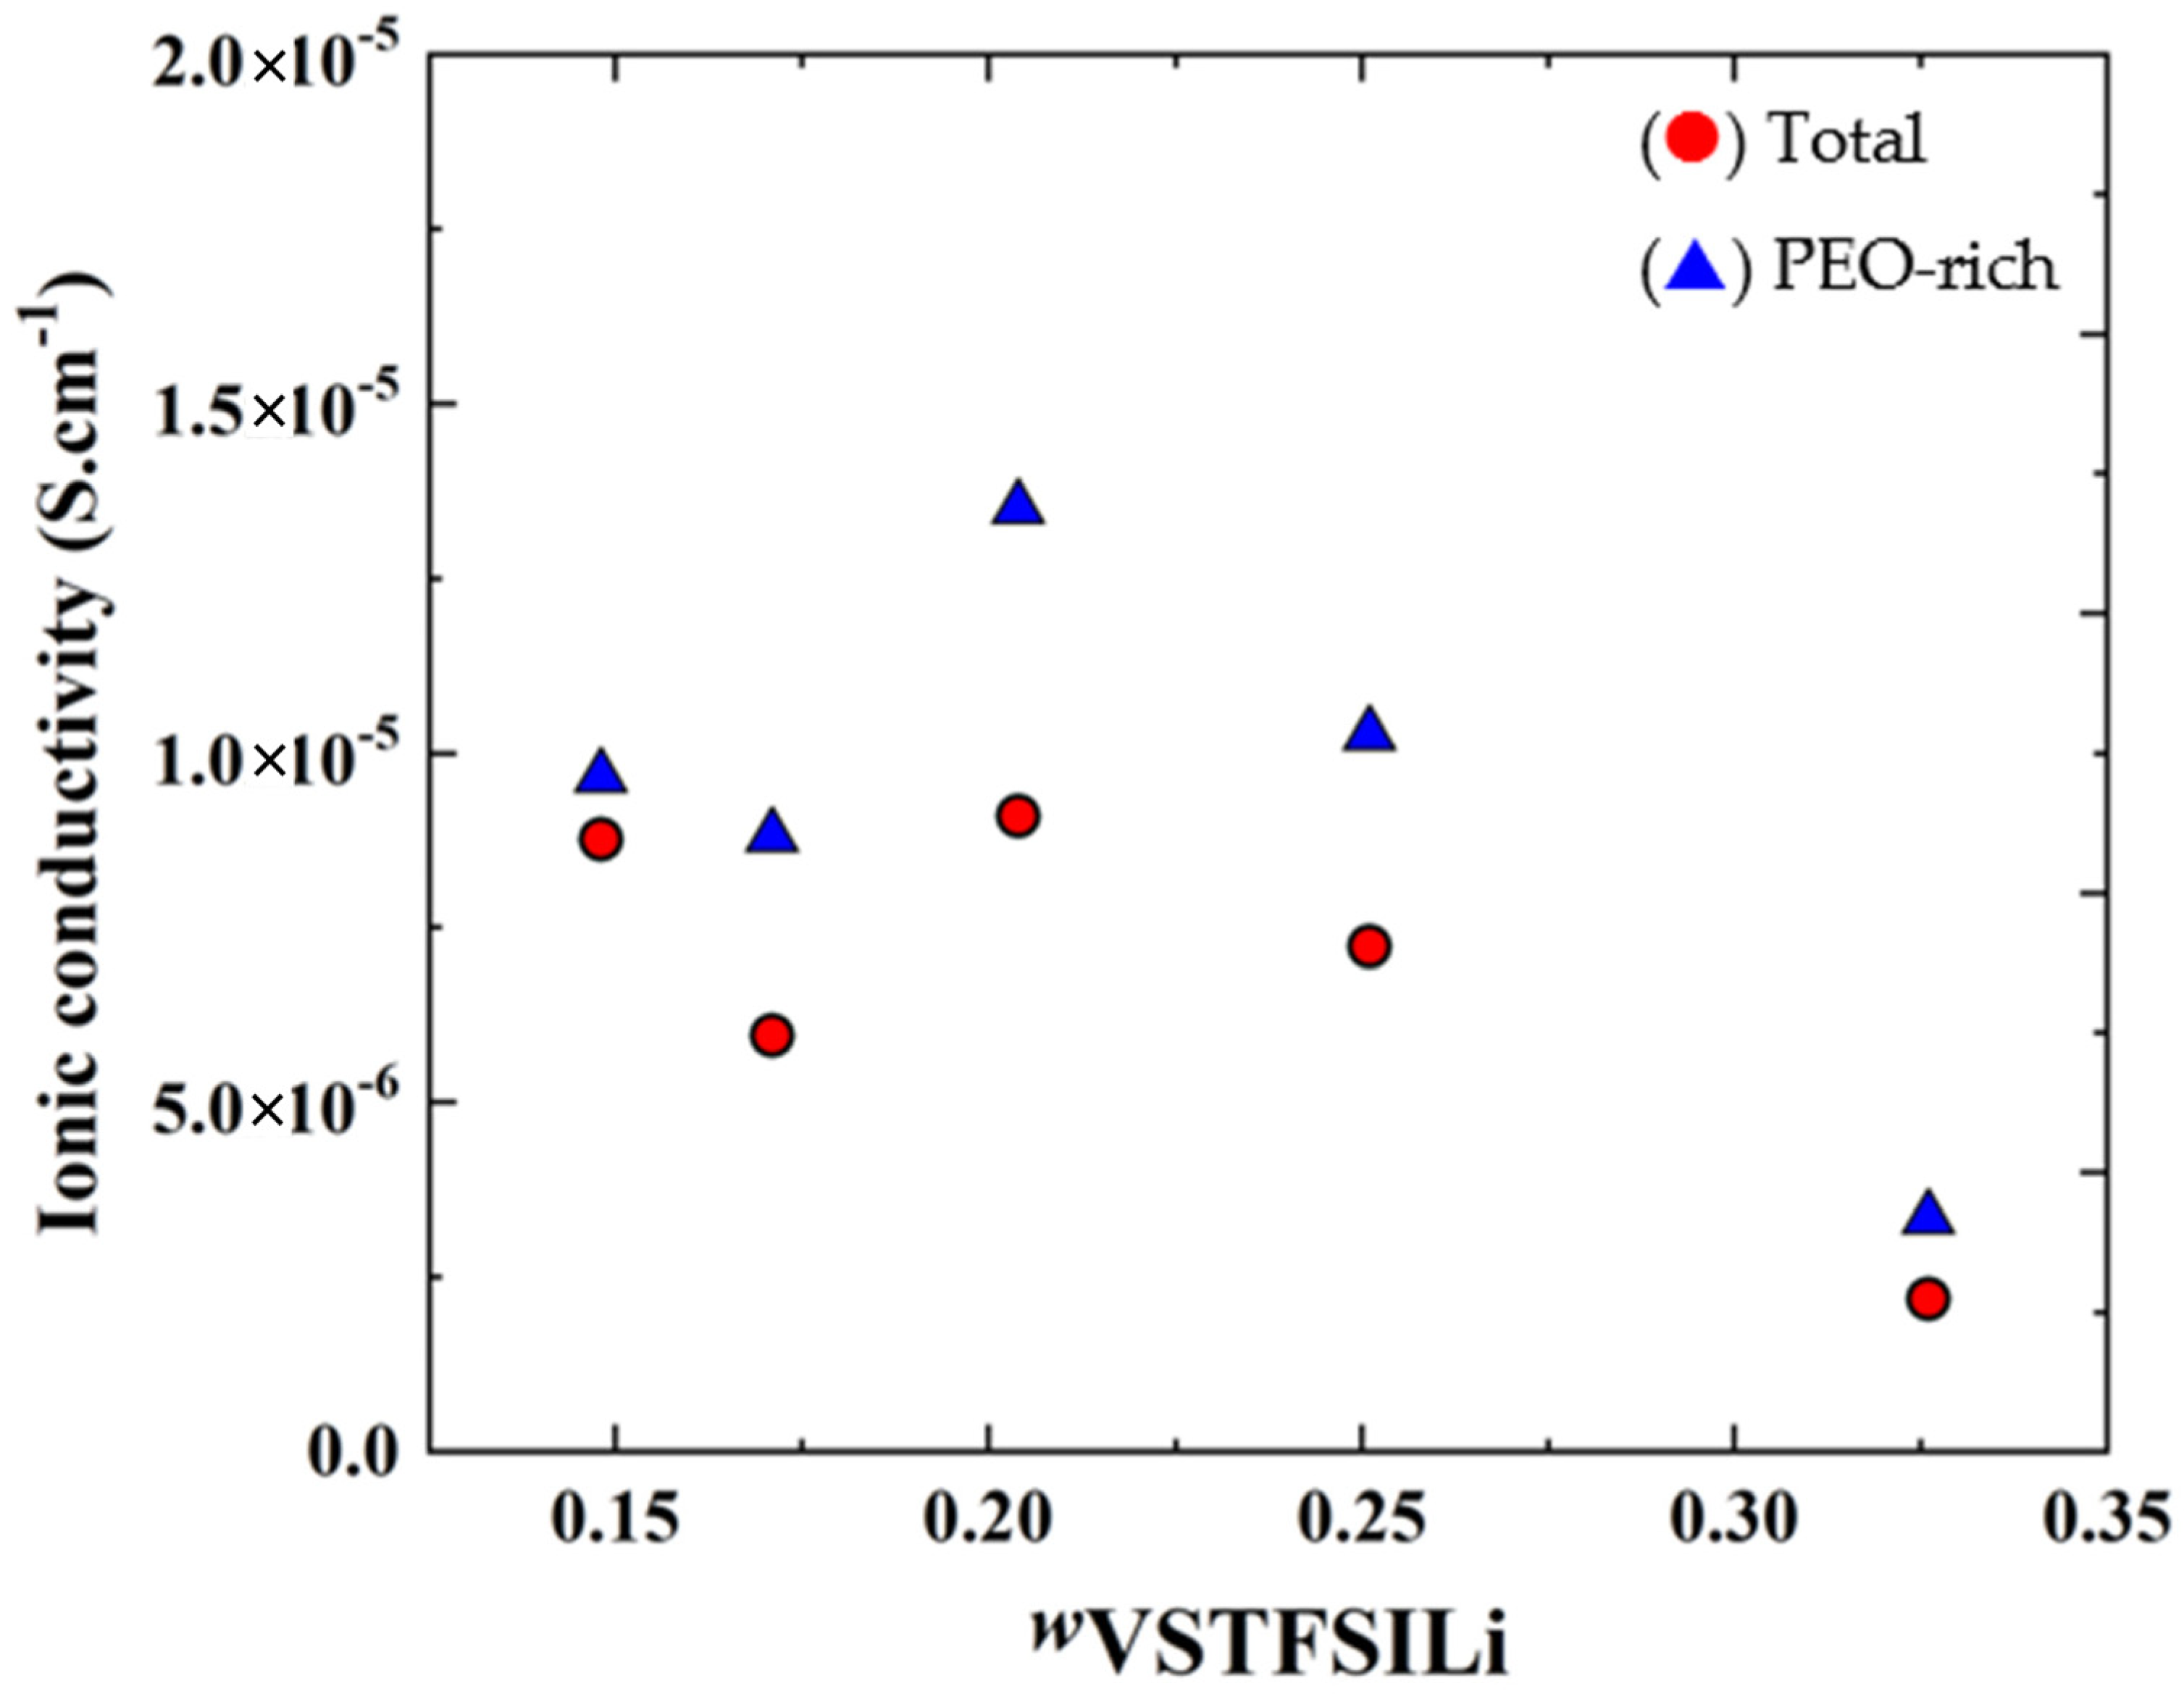
Figure 10 represents the isothermal conductivities at 60 °C of the HySI (total, effective), PEO-rich domains and as a function of
wVSTFSILi. As seen in
Figure 8,
σPEO has a smooth dependence on the salt content with a maximum
wVSTFSILi of 0.204. This material is among the best dry single-ion polymer electrolytes with a good compromise between low cost, easy scale-up synthesis, and good mechanical properties [
35,
41,
47].
σTotal also has a smooth dependency with
wVSTFSILi due to a microstructural effect, such as an increase of the density and fractal dimension from 1D to 2D of the TFSI/ SiO
1.5 network.
Finally, the cationic transference number (
t+) was determined at 80 °C for each HySI electrolyte using electrochemical methodologies applied to Li symmetric cells based on a chronoamperometric experiment (see
Figure S1). For
t+, the PEO and TFSI/SiO
1.5 phases were considered as a whole that drives the effective conductivity of the materials, i.e., the electrolyte resistance to consider in Equation (7) is the sum of
RPEO and
RTFSI.
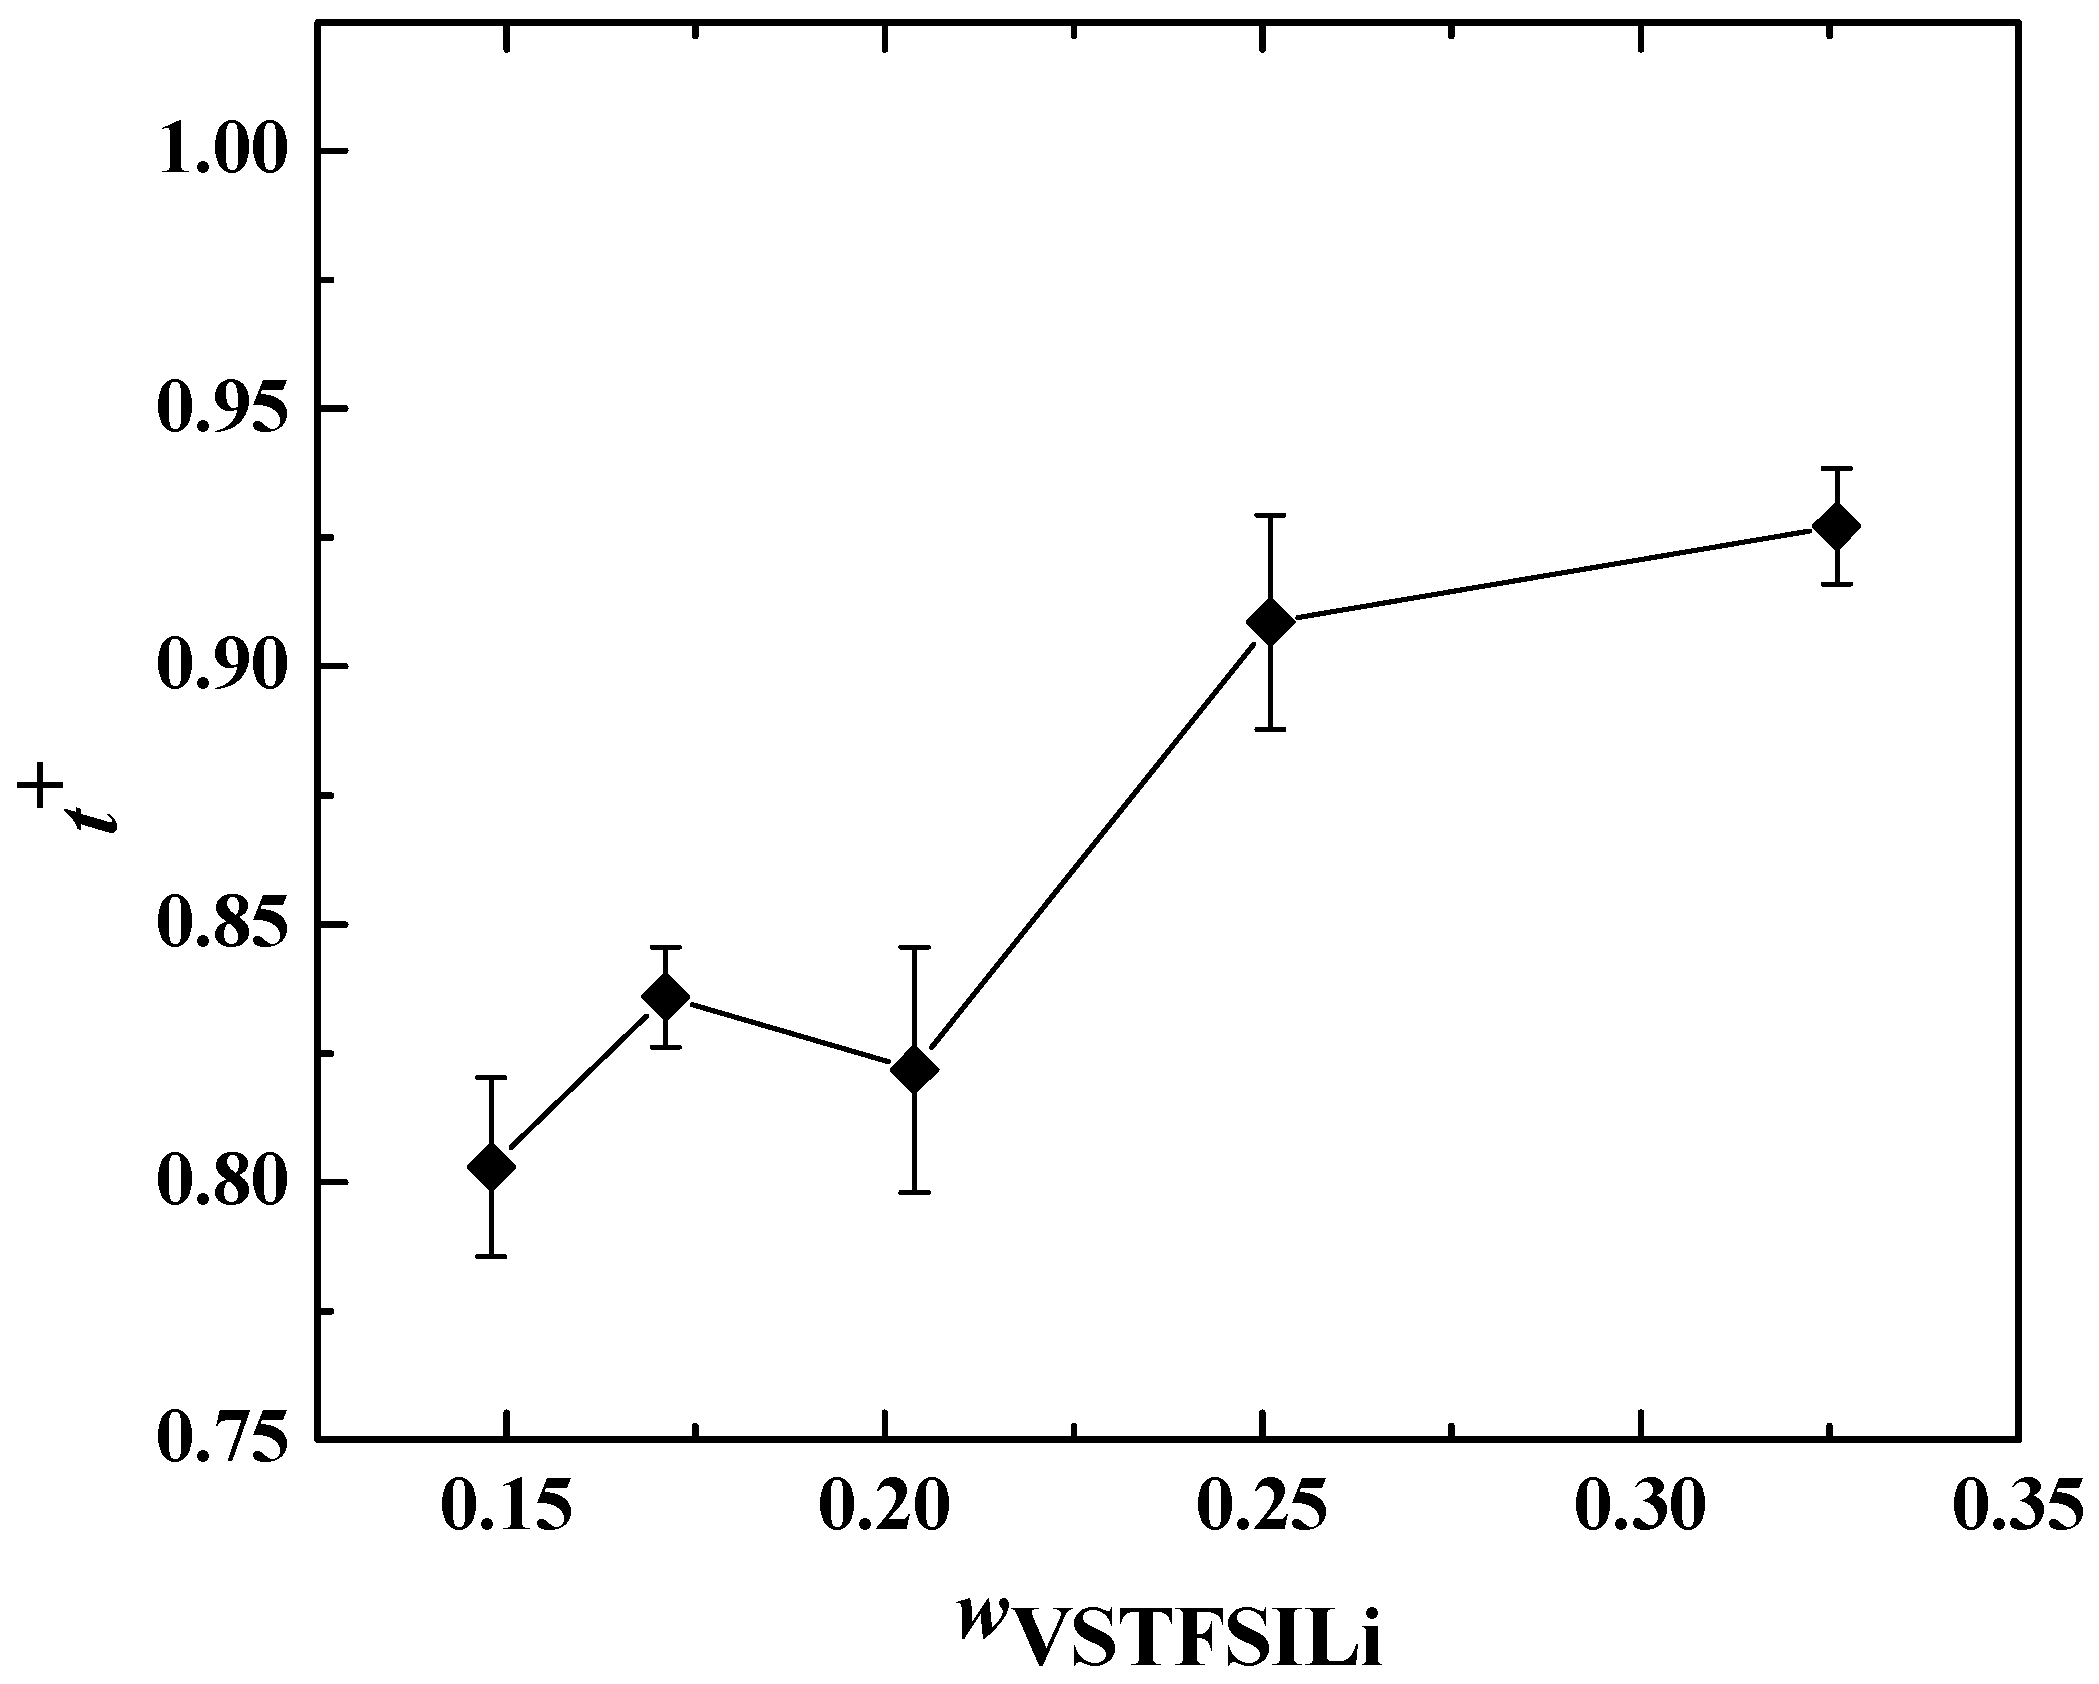
In
Figure 11,
t+ is plotted as a function of
wVSTFSILi at 80 °C.
t+ remains constant at low salt concentrations for
wVSTFSILi < 0.25, with an average value of 0.83 ± 0.02, then becomes higher than 0.9 for higher salt content. Such values are consistent with the literature data on single-ion conducting polymer electrolytes [
32,
42,
48,
49]. Theoretically,
t+ equals 1 as, by design, the TFSI anions are grafted onto the crosslinked nodes. However, experimentally, the cationic transference number of single-ion conducting polymer electrolytes is typically between 0.8 and 1 [
30]. This effect is mainly ascribed to the stability of the passive layers at the Li/electrolyte interface playing a role in the interfacial resistance and the steady-state current used to calculate
t+ (Equation (7)) [
50].

 ,
, 


