
Penetration Routes of Oxygen and Moisture into the Insulation of FR-EPDM Cables for Nuclear Power Plants

Abstract
:
1. Introduction
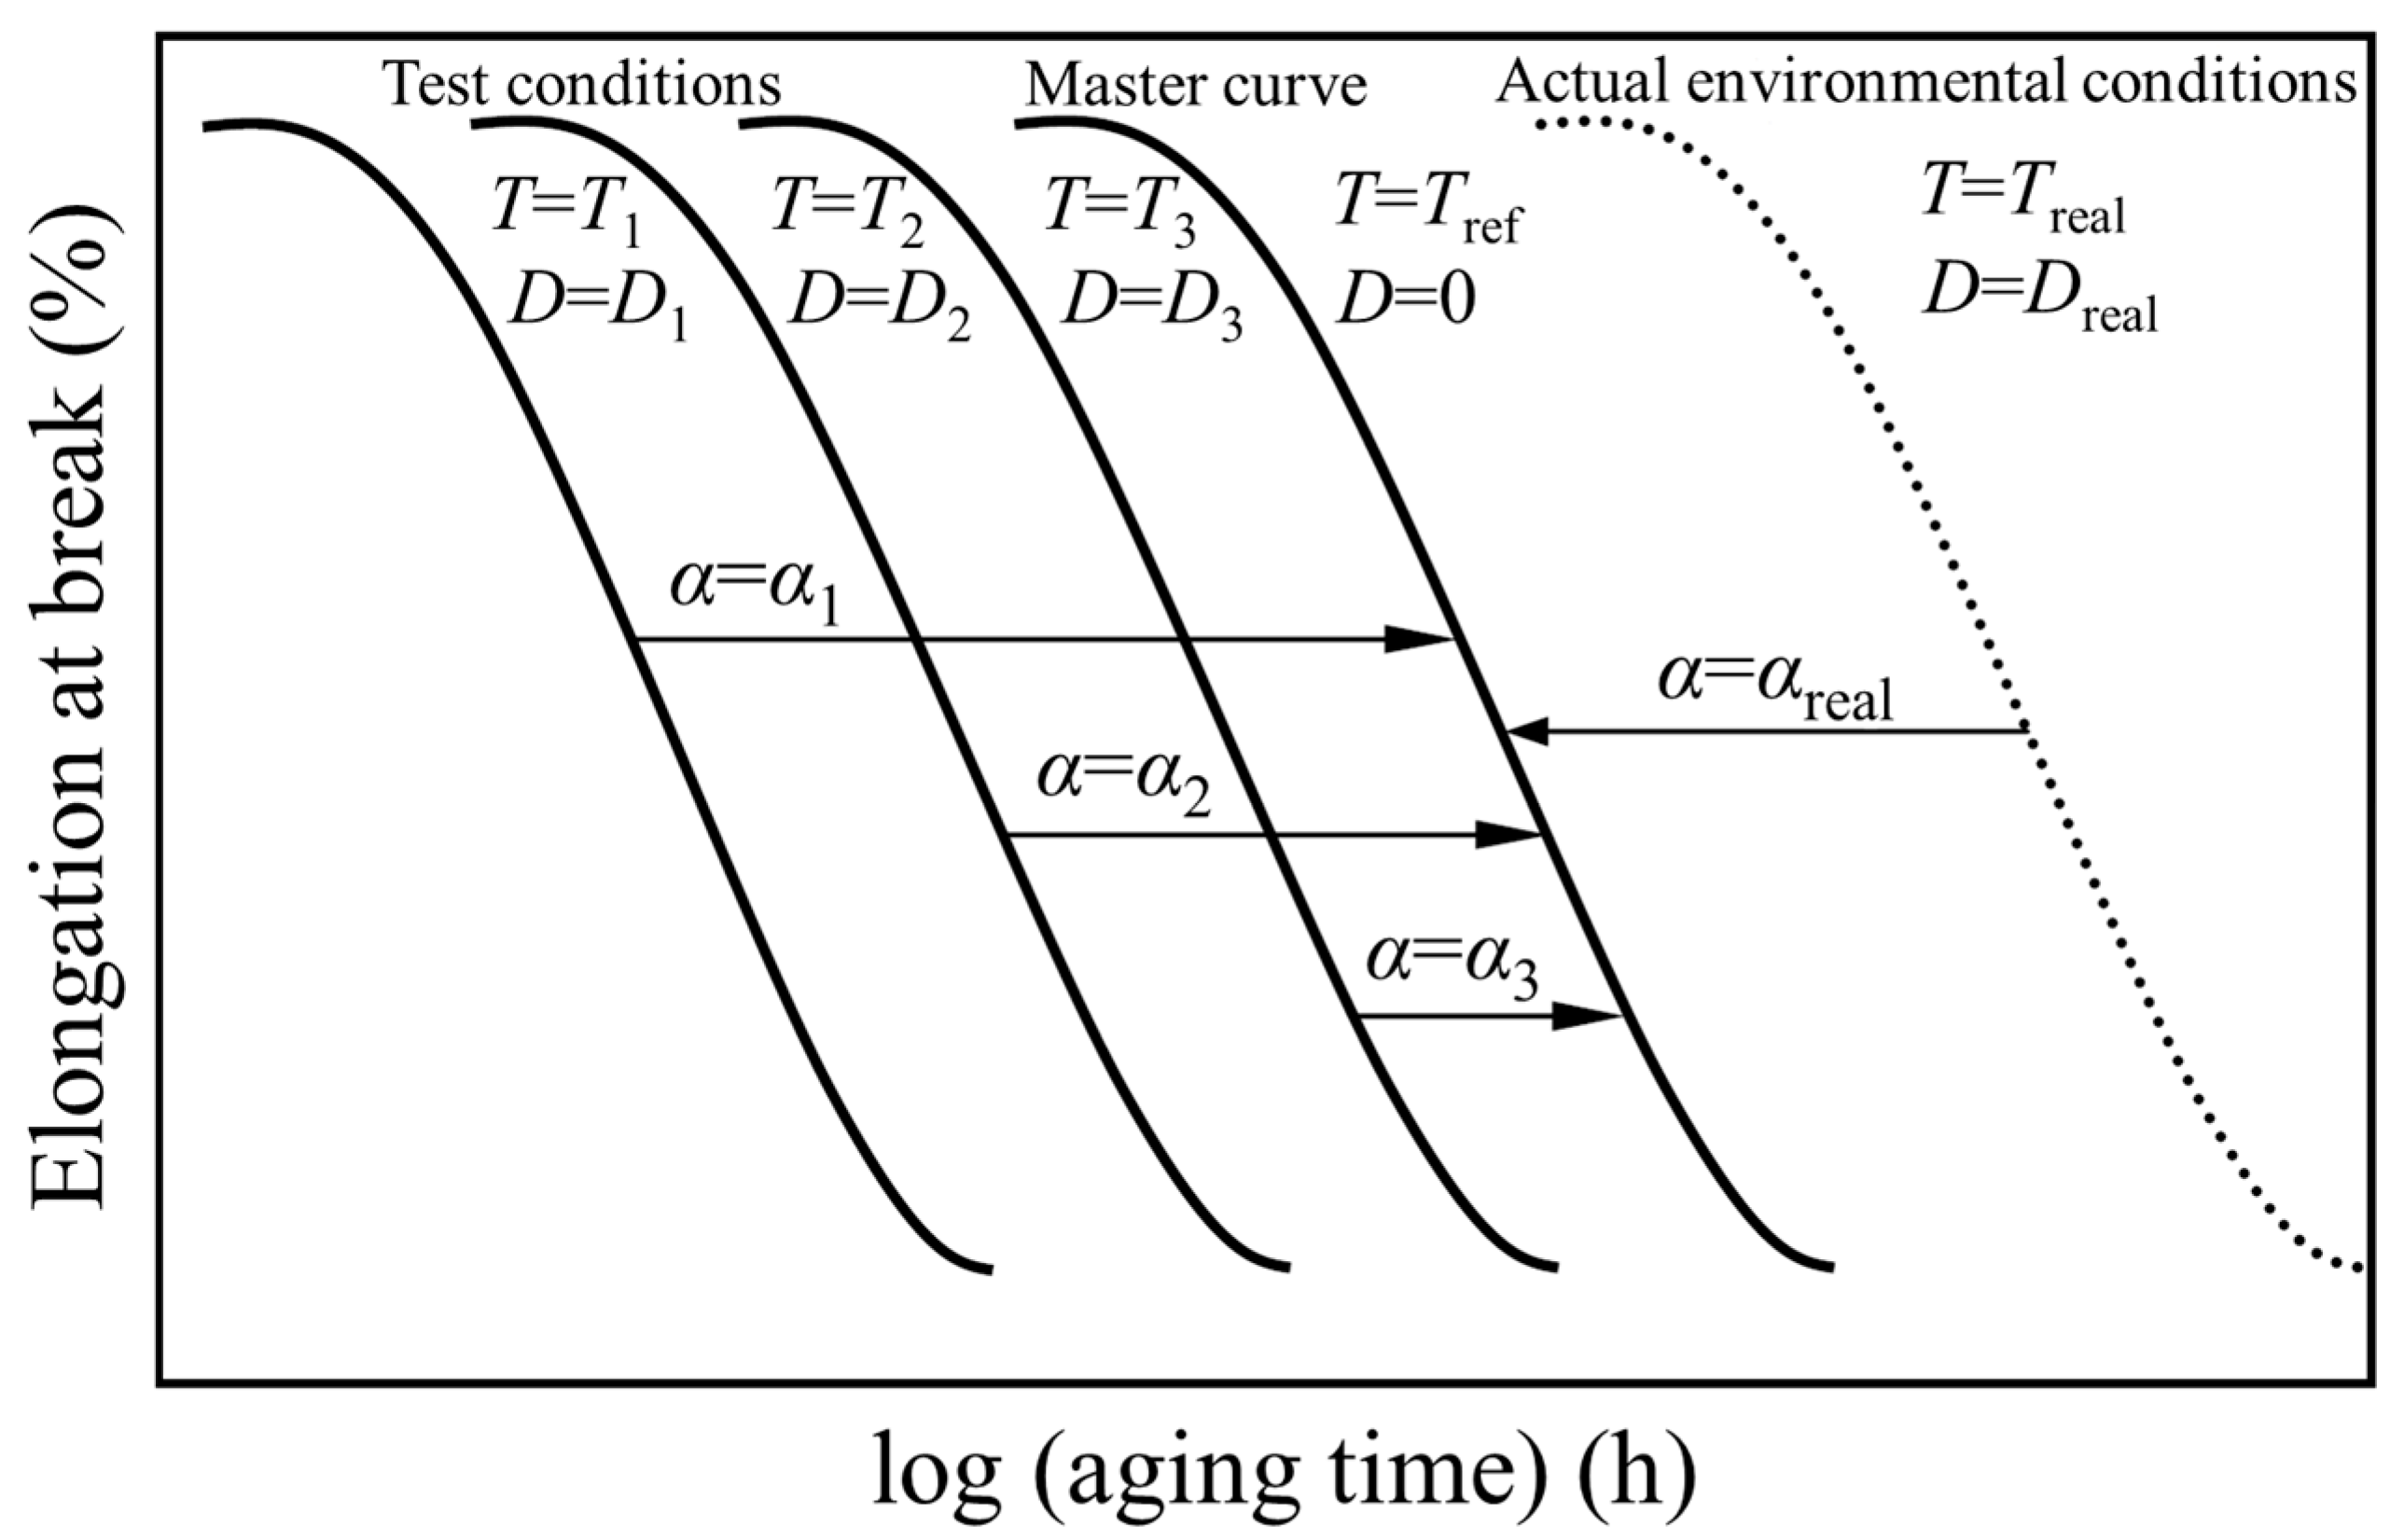
2. Superposition of Time-Dependent Data
3. Samples and Experimental Procedures
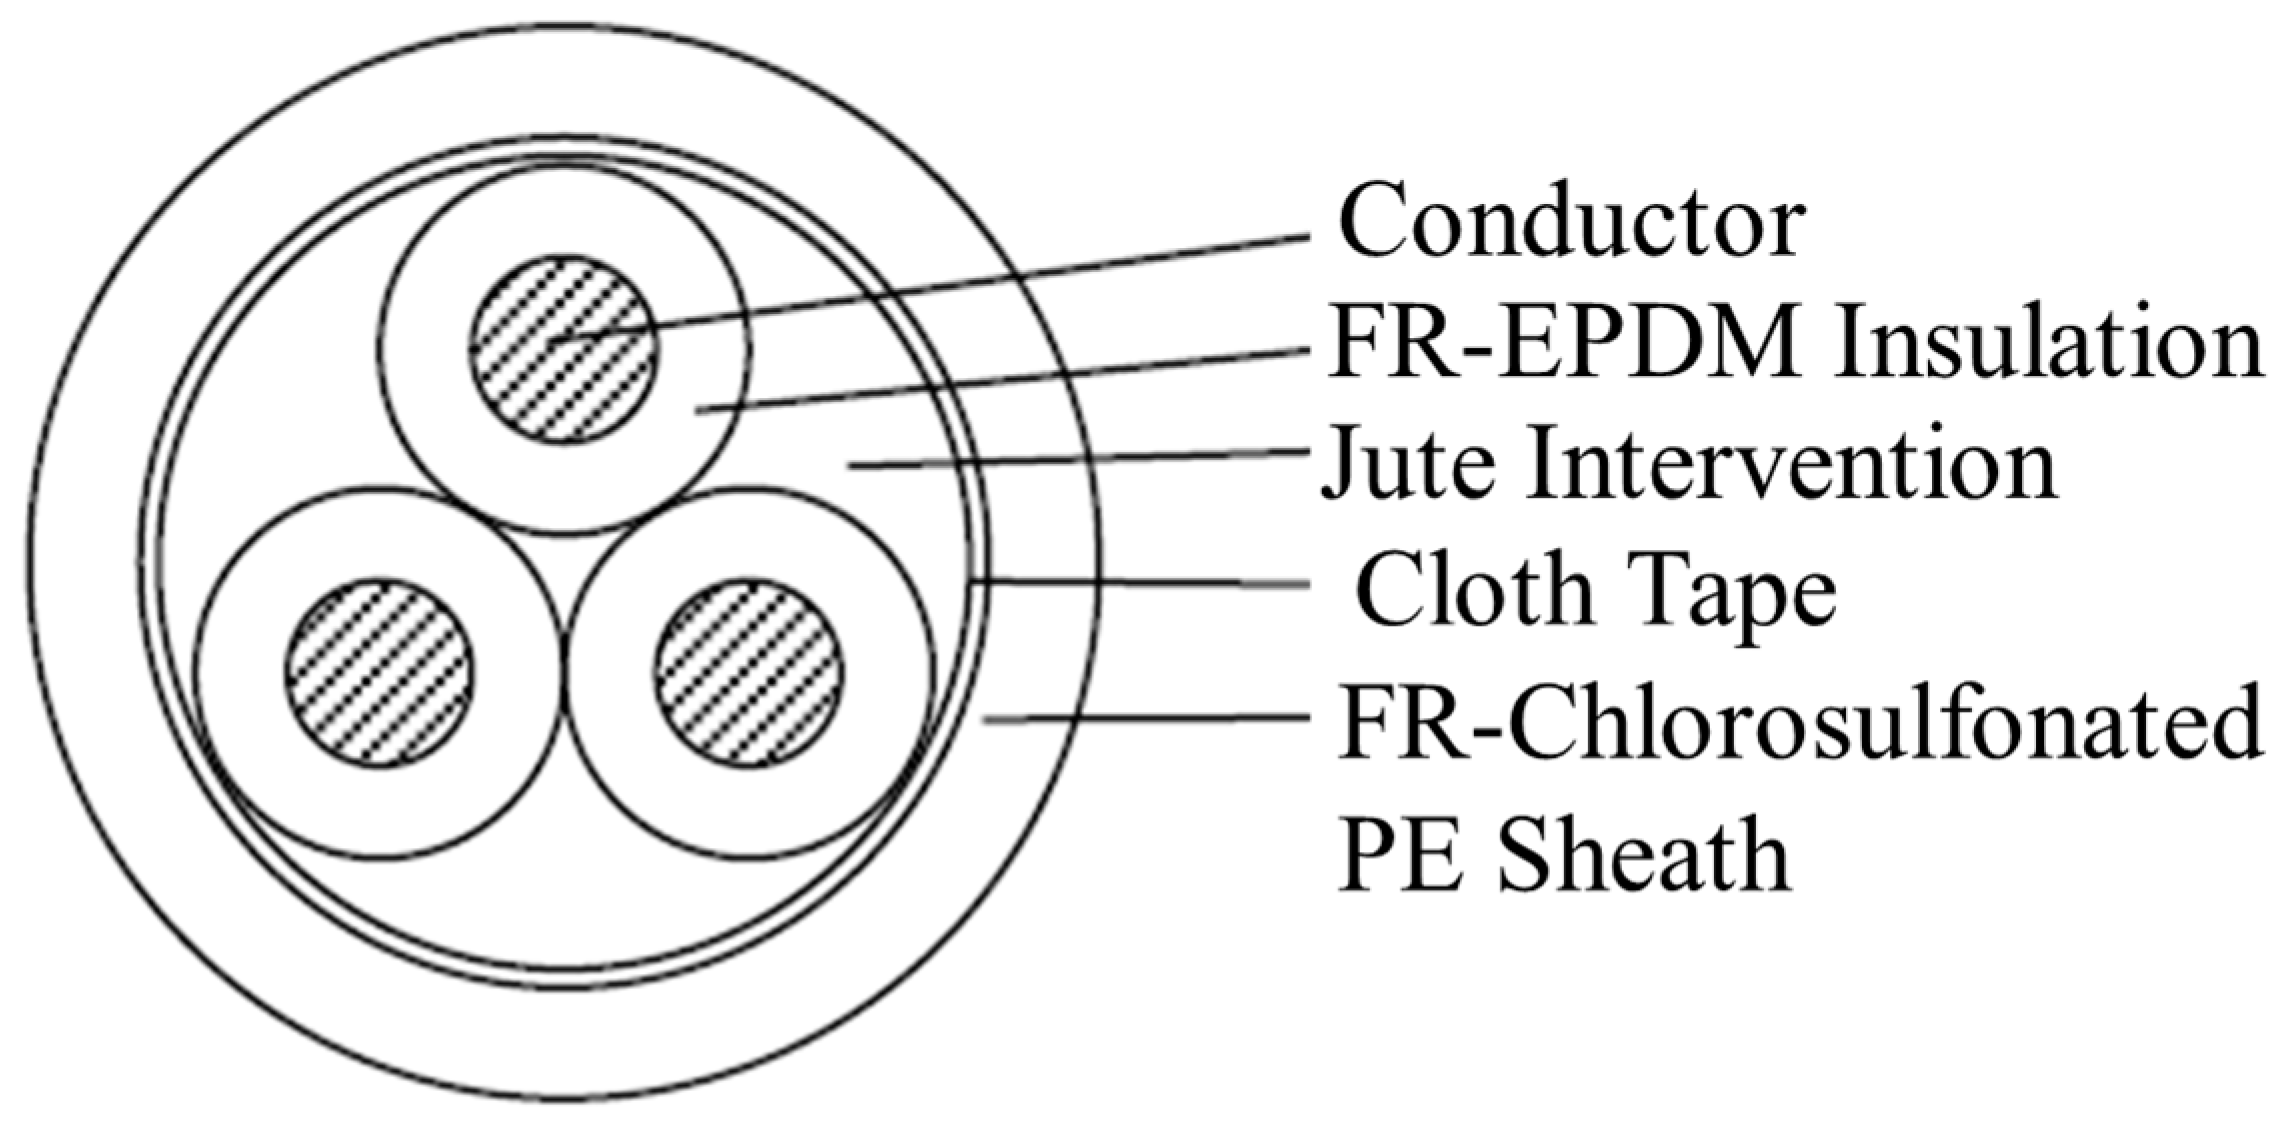
3.1. Samples
3.2. Experimental Procedures
4. Results
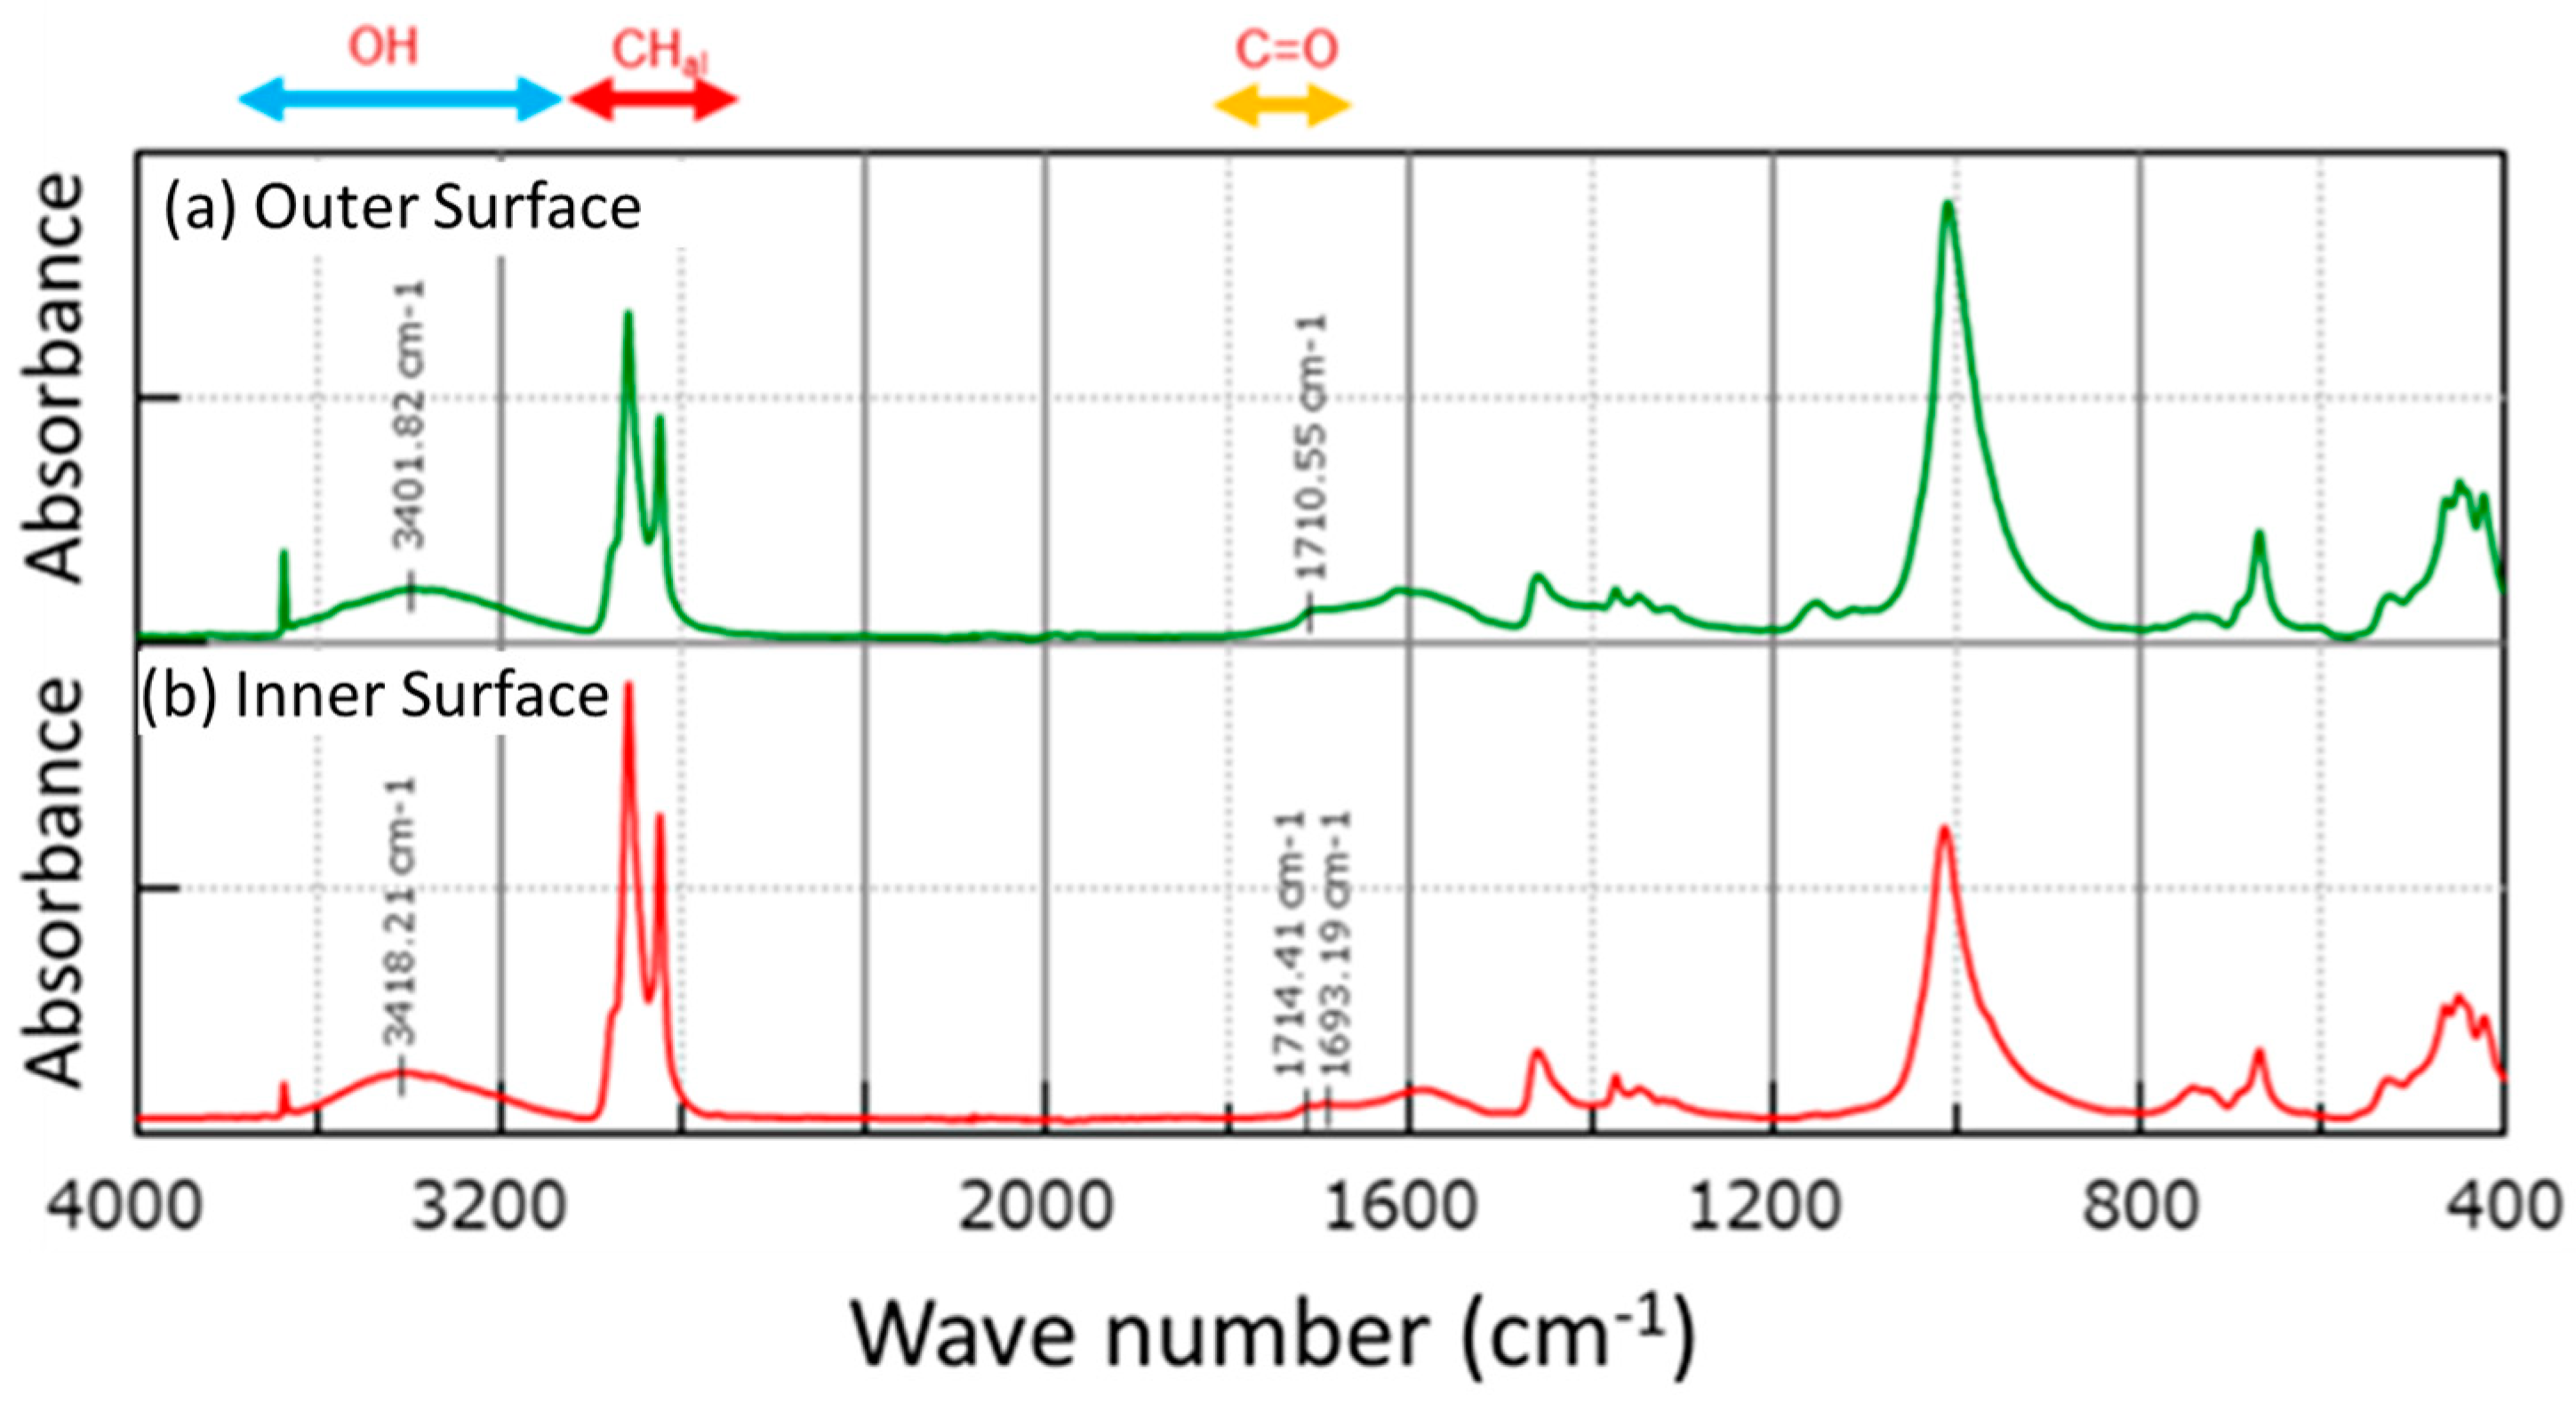
4.1. FT-MIR Spectra
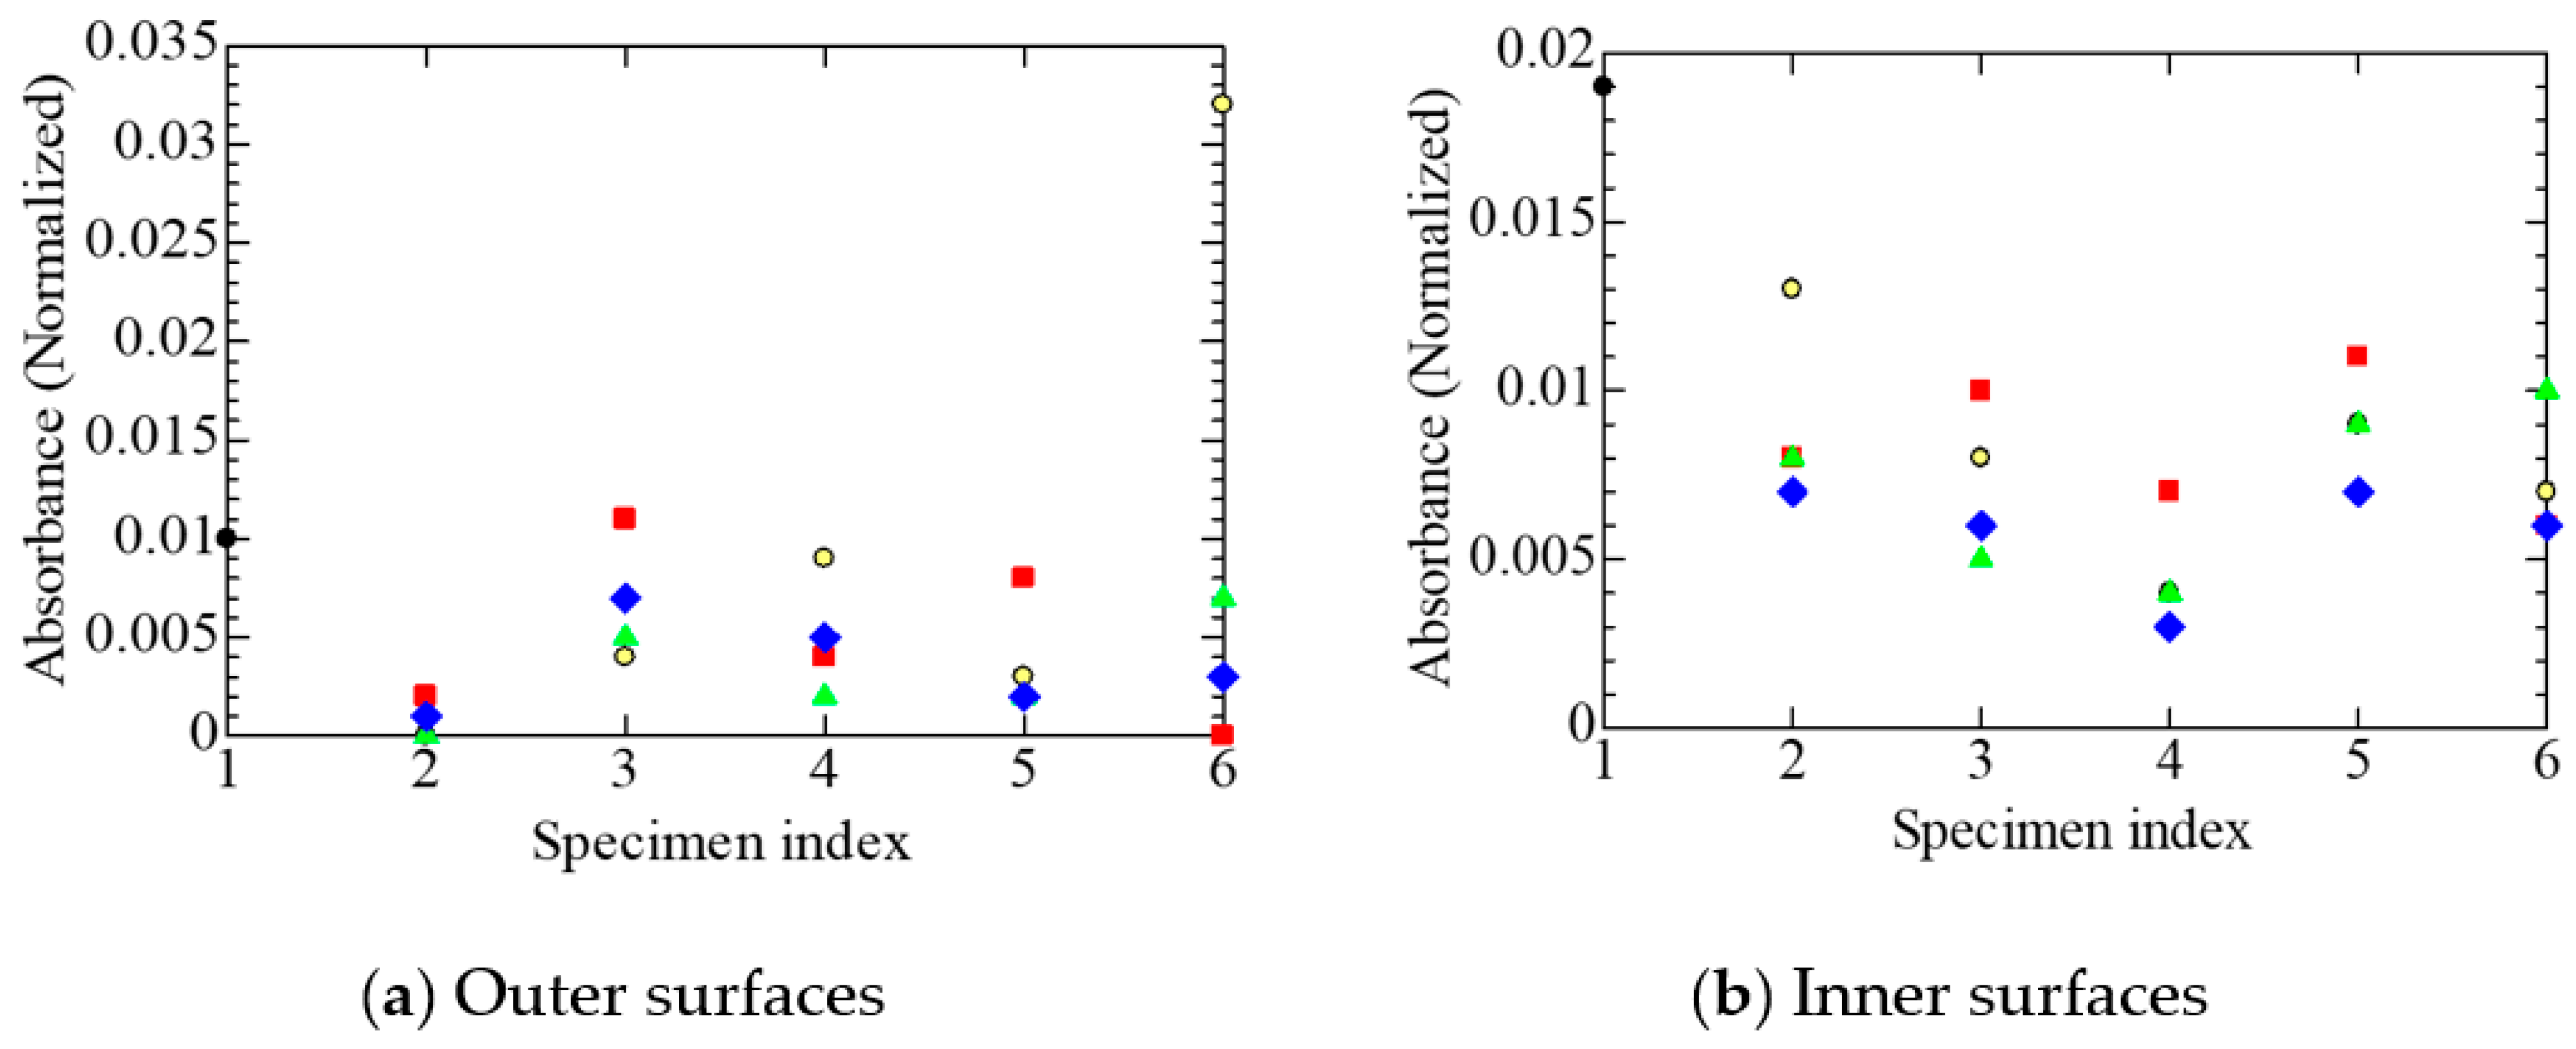
4.2. Carbonyl Groups
4.2.1. Acid Type
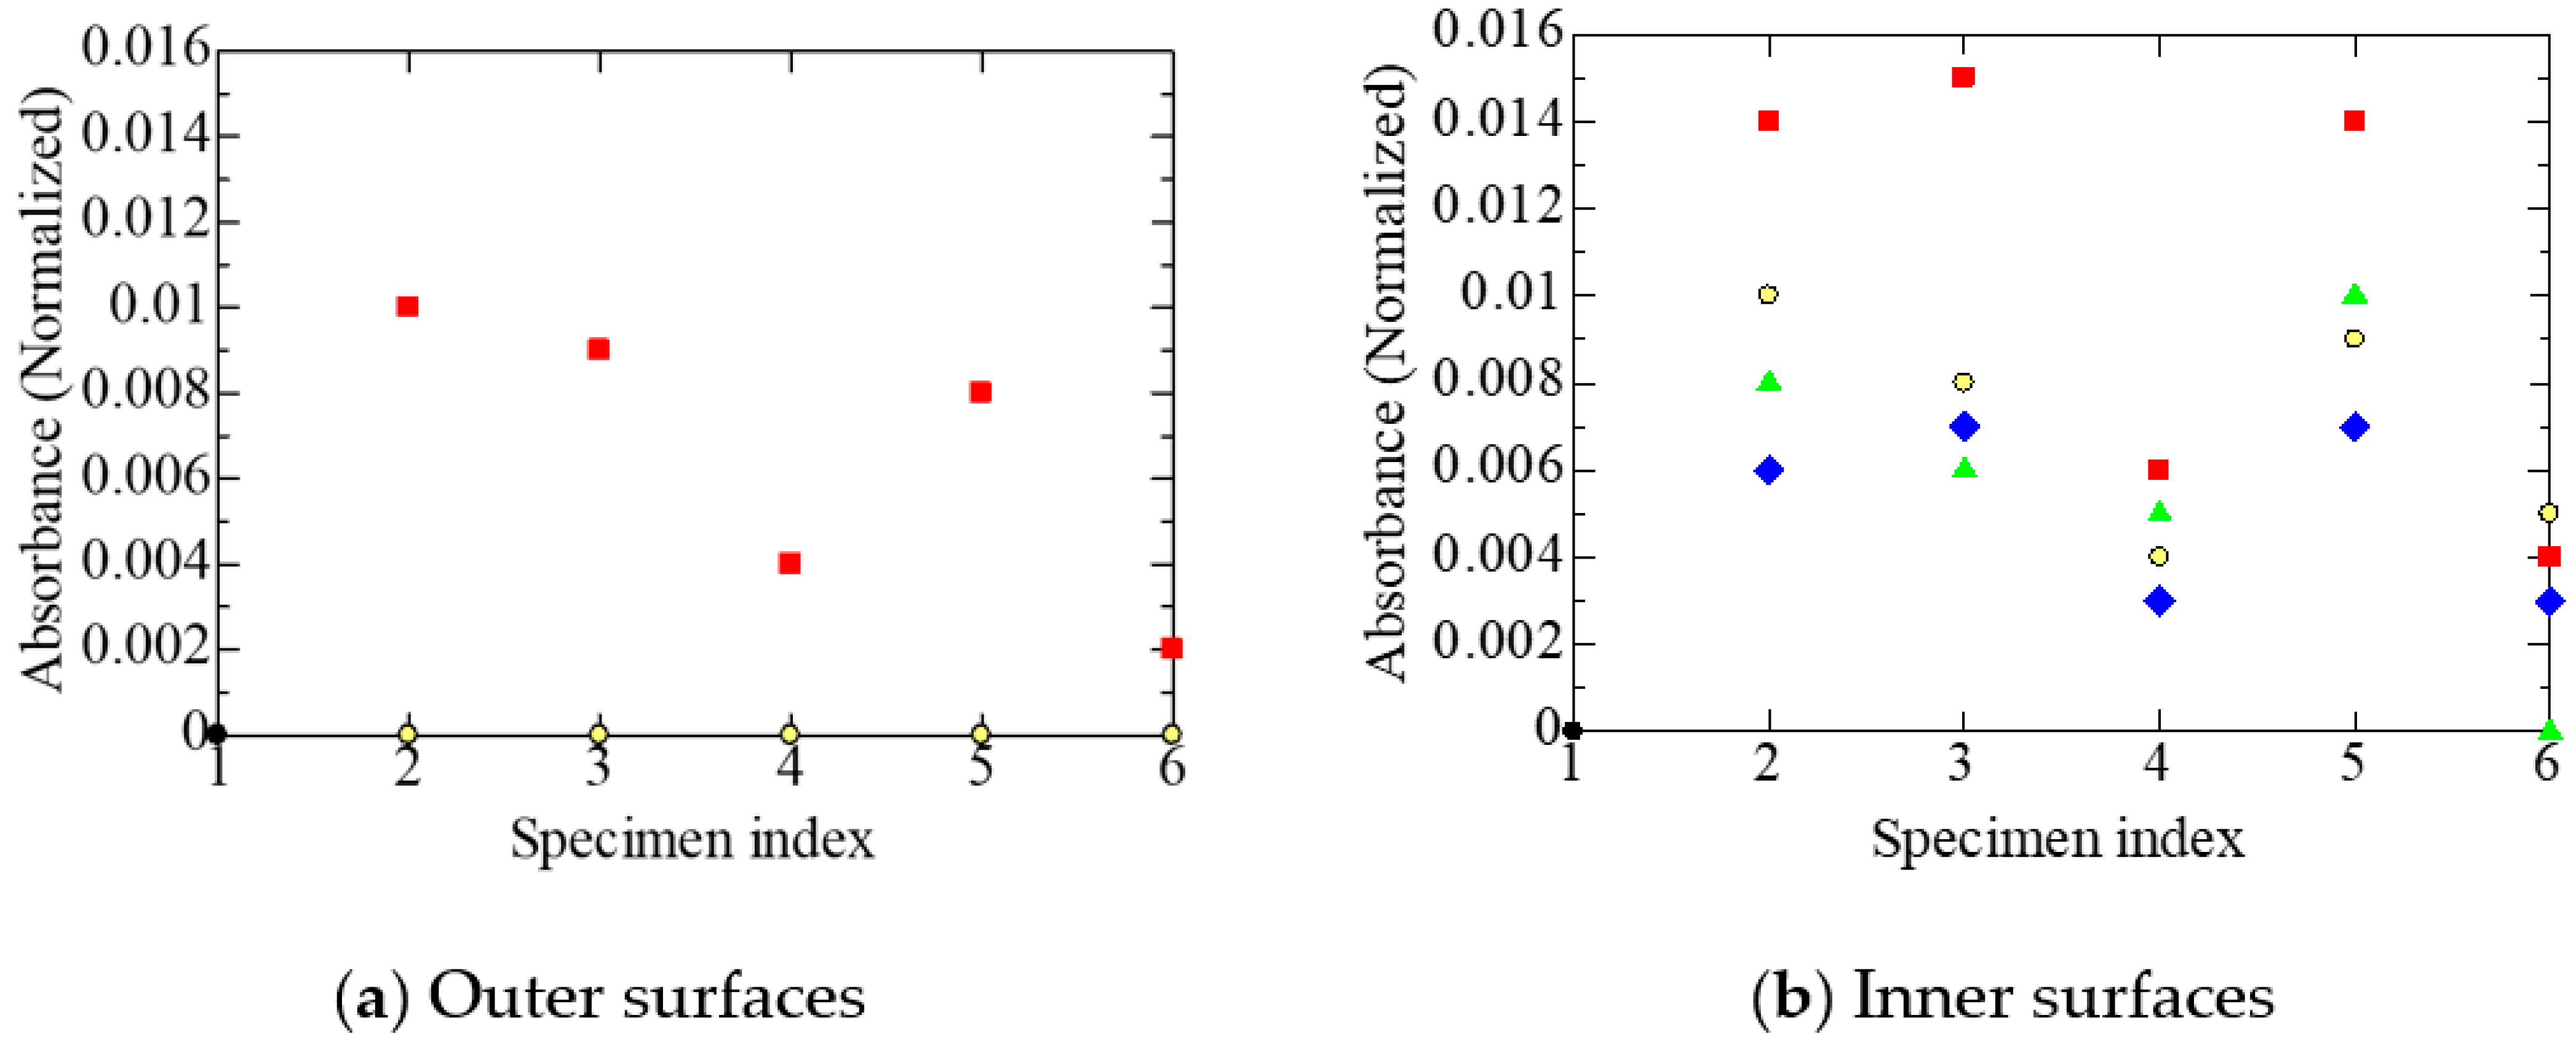
4.2.2. Ester Type
4.2.3. Penetration Path of Oxygen
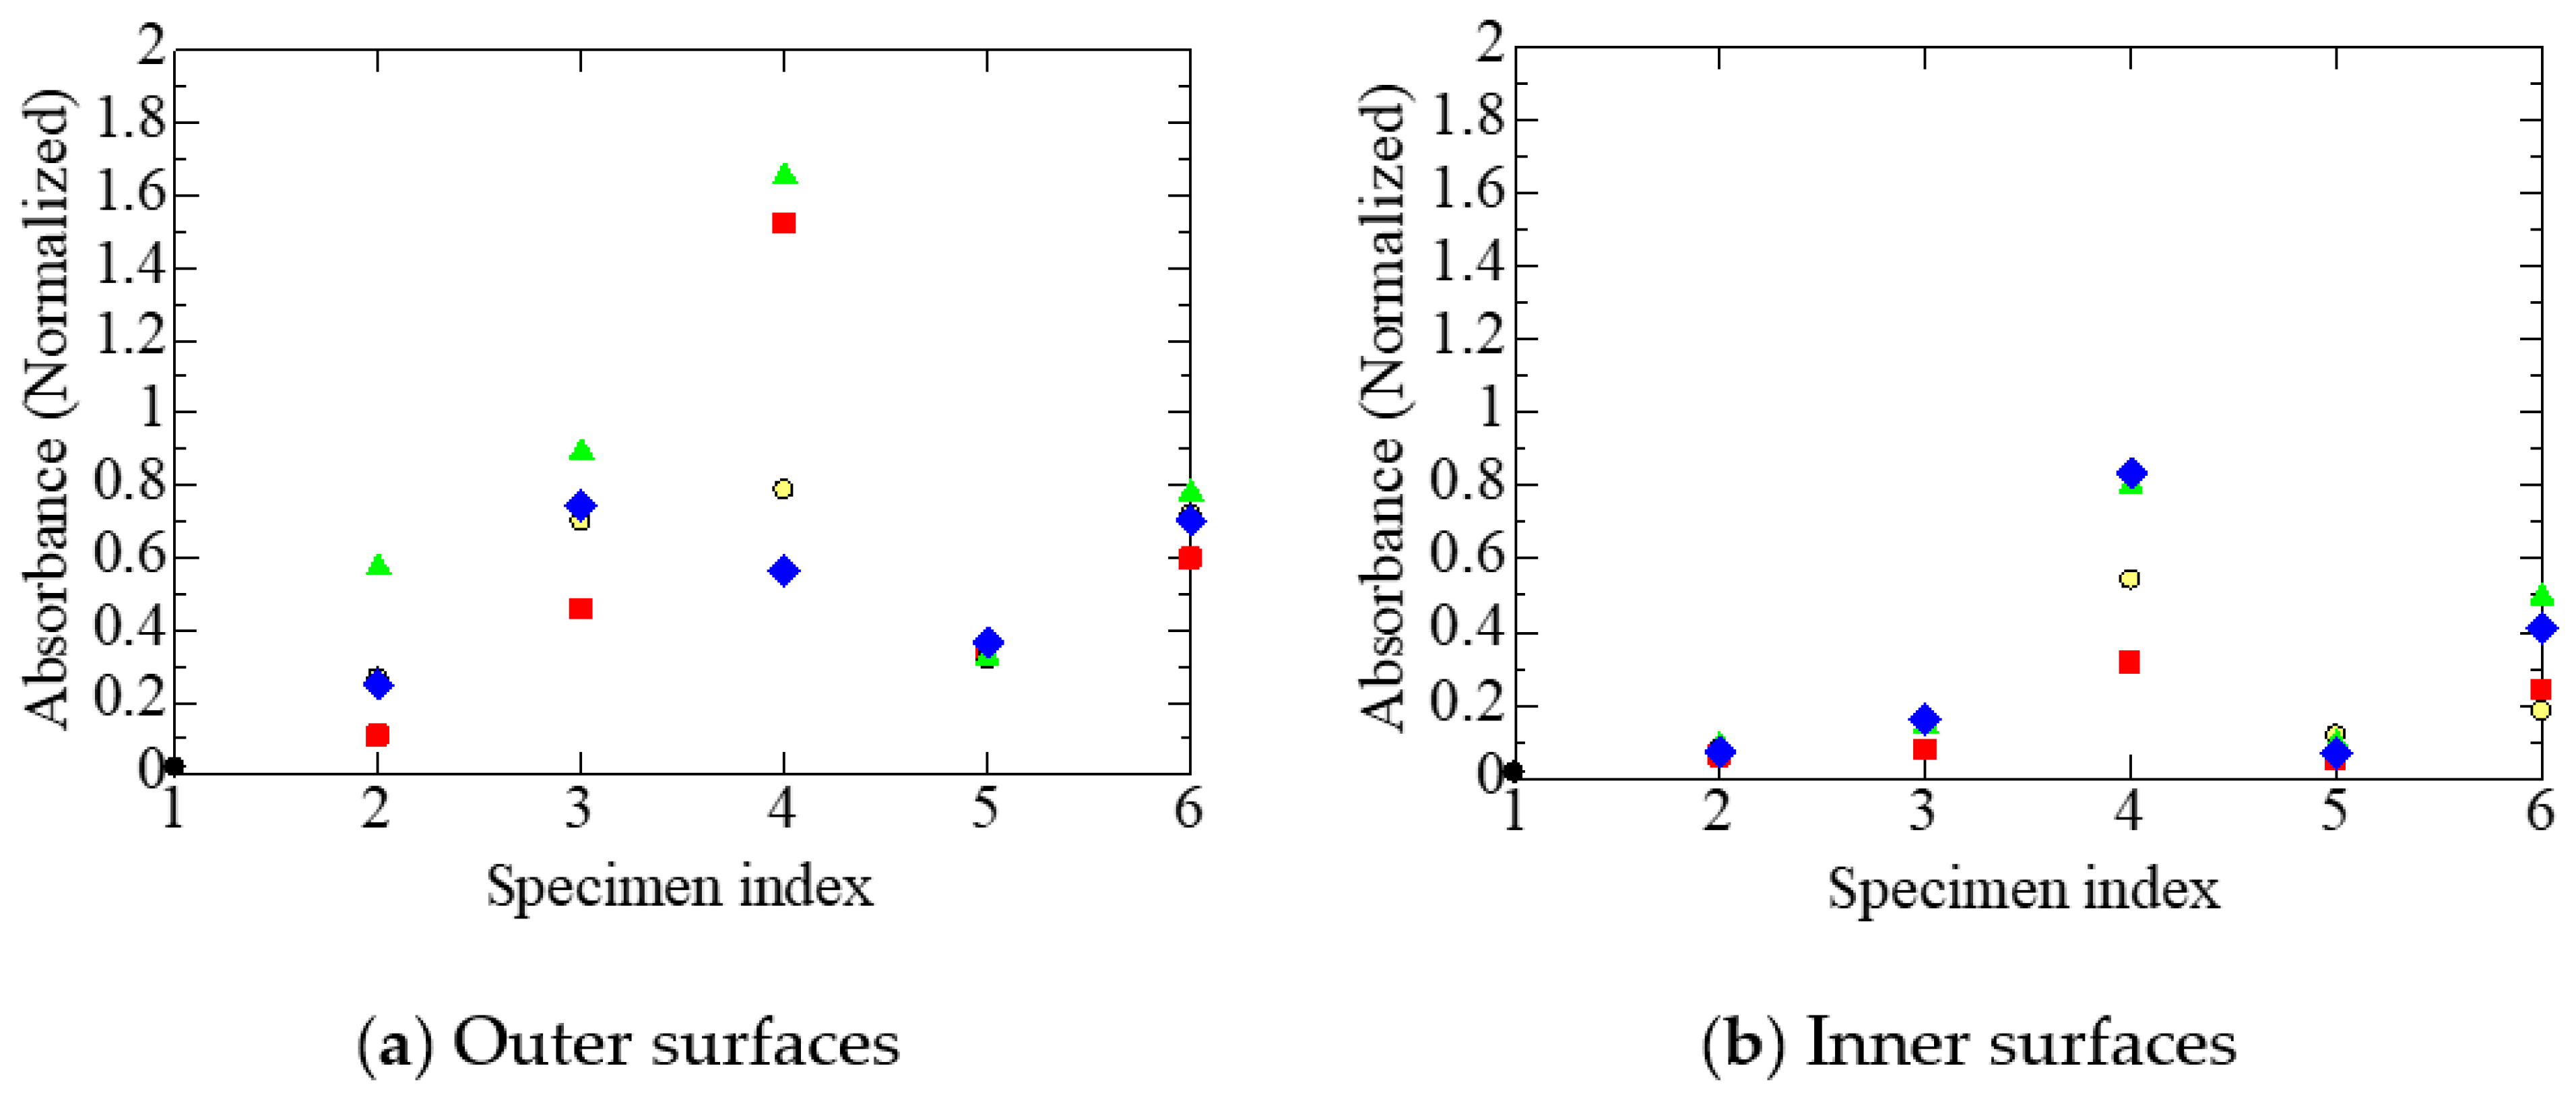
4.3. OH Groups
4.4. TG-DTA Spectra
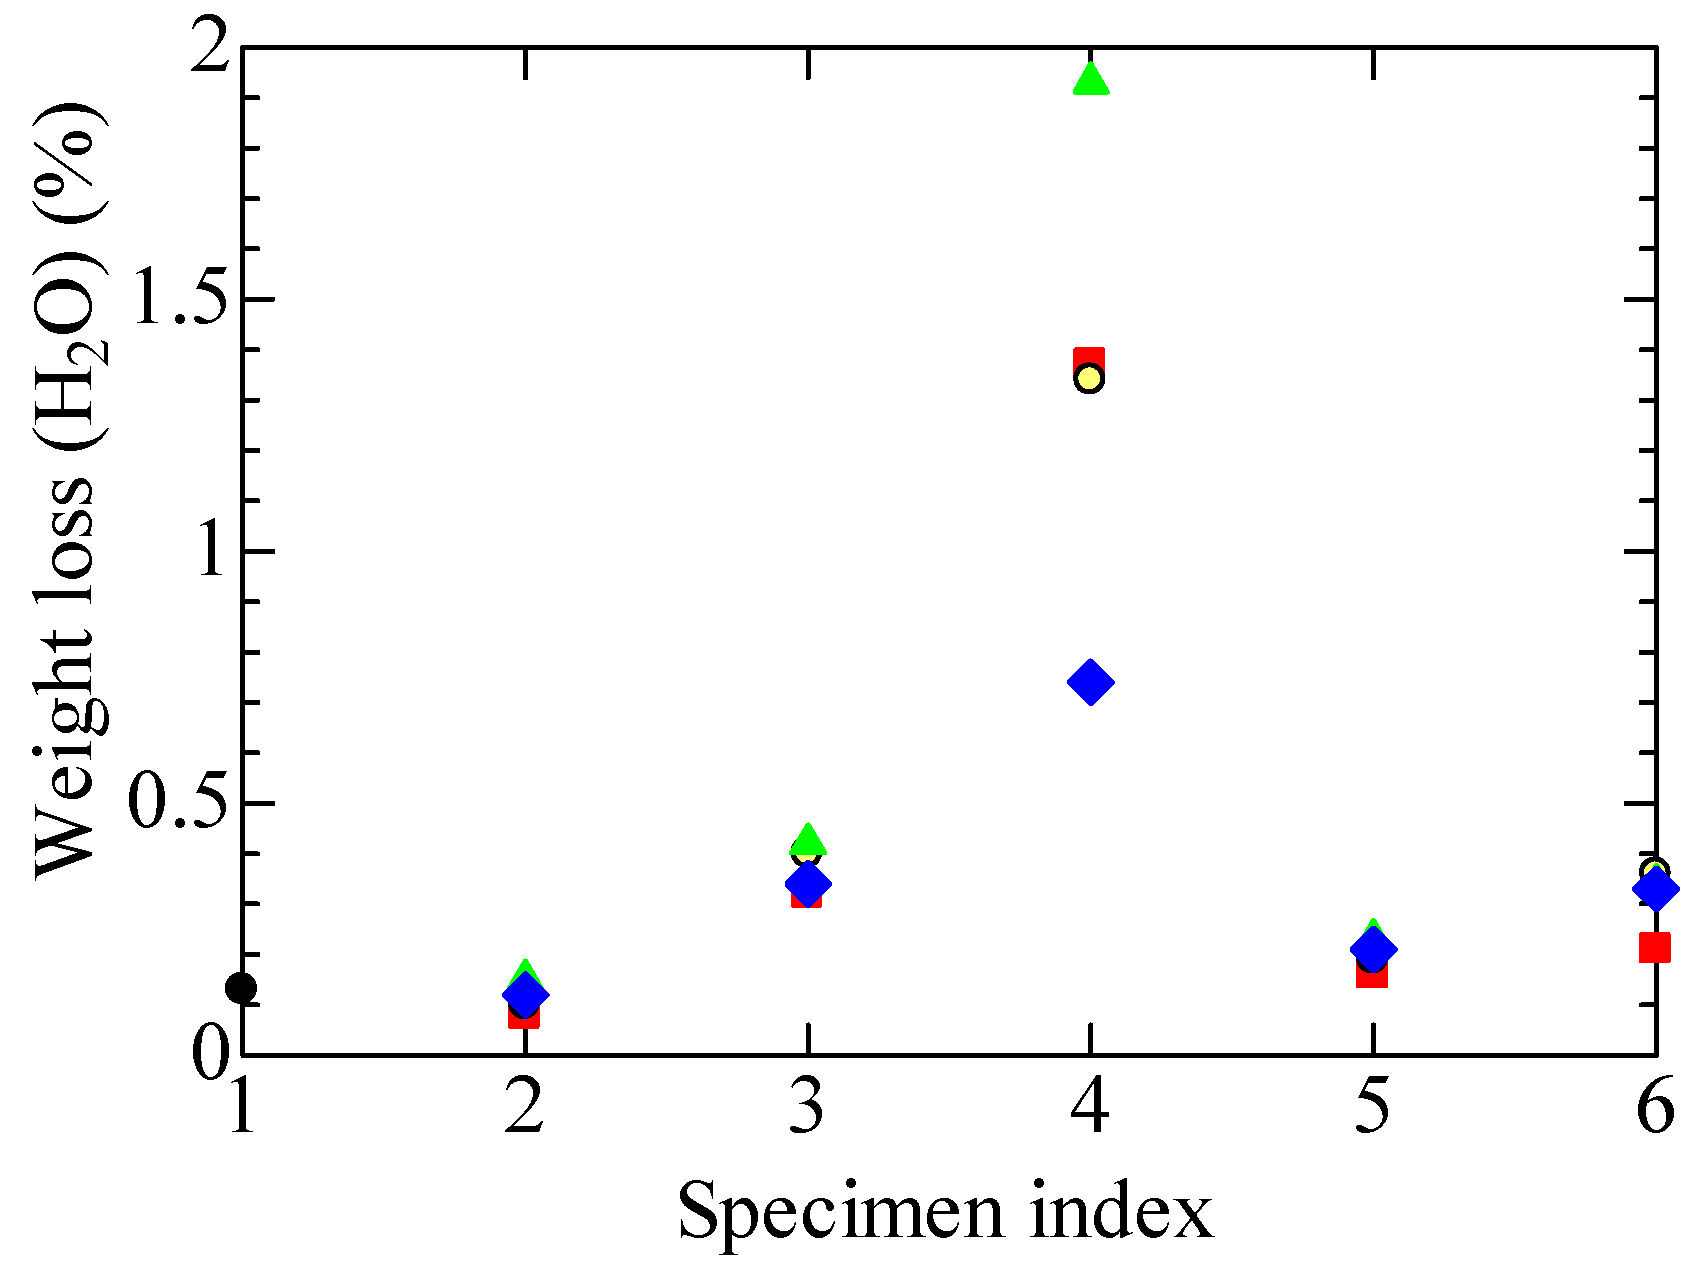
4.4.1. Desorption of Moisture
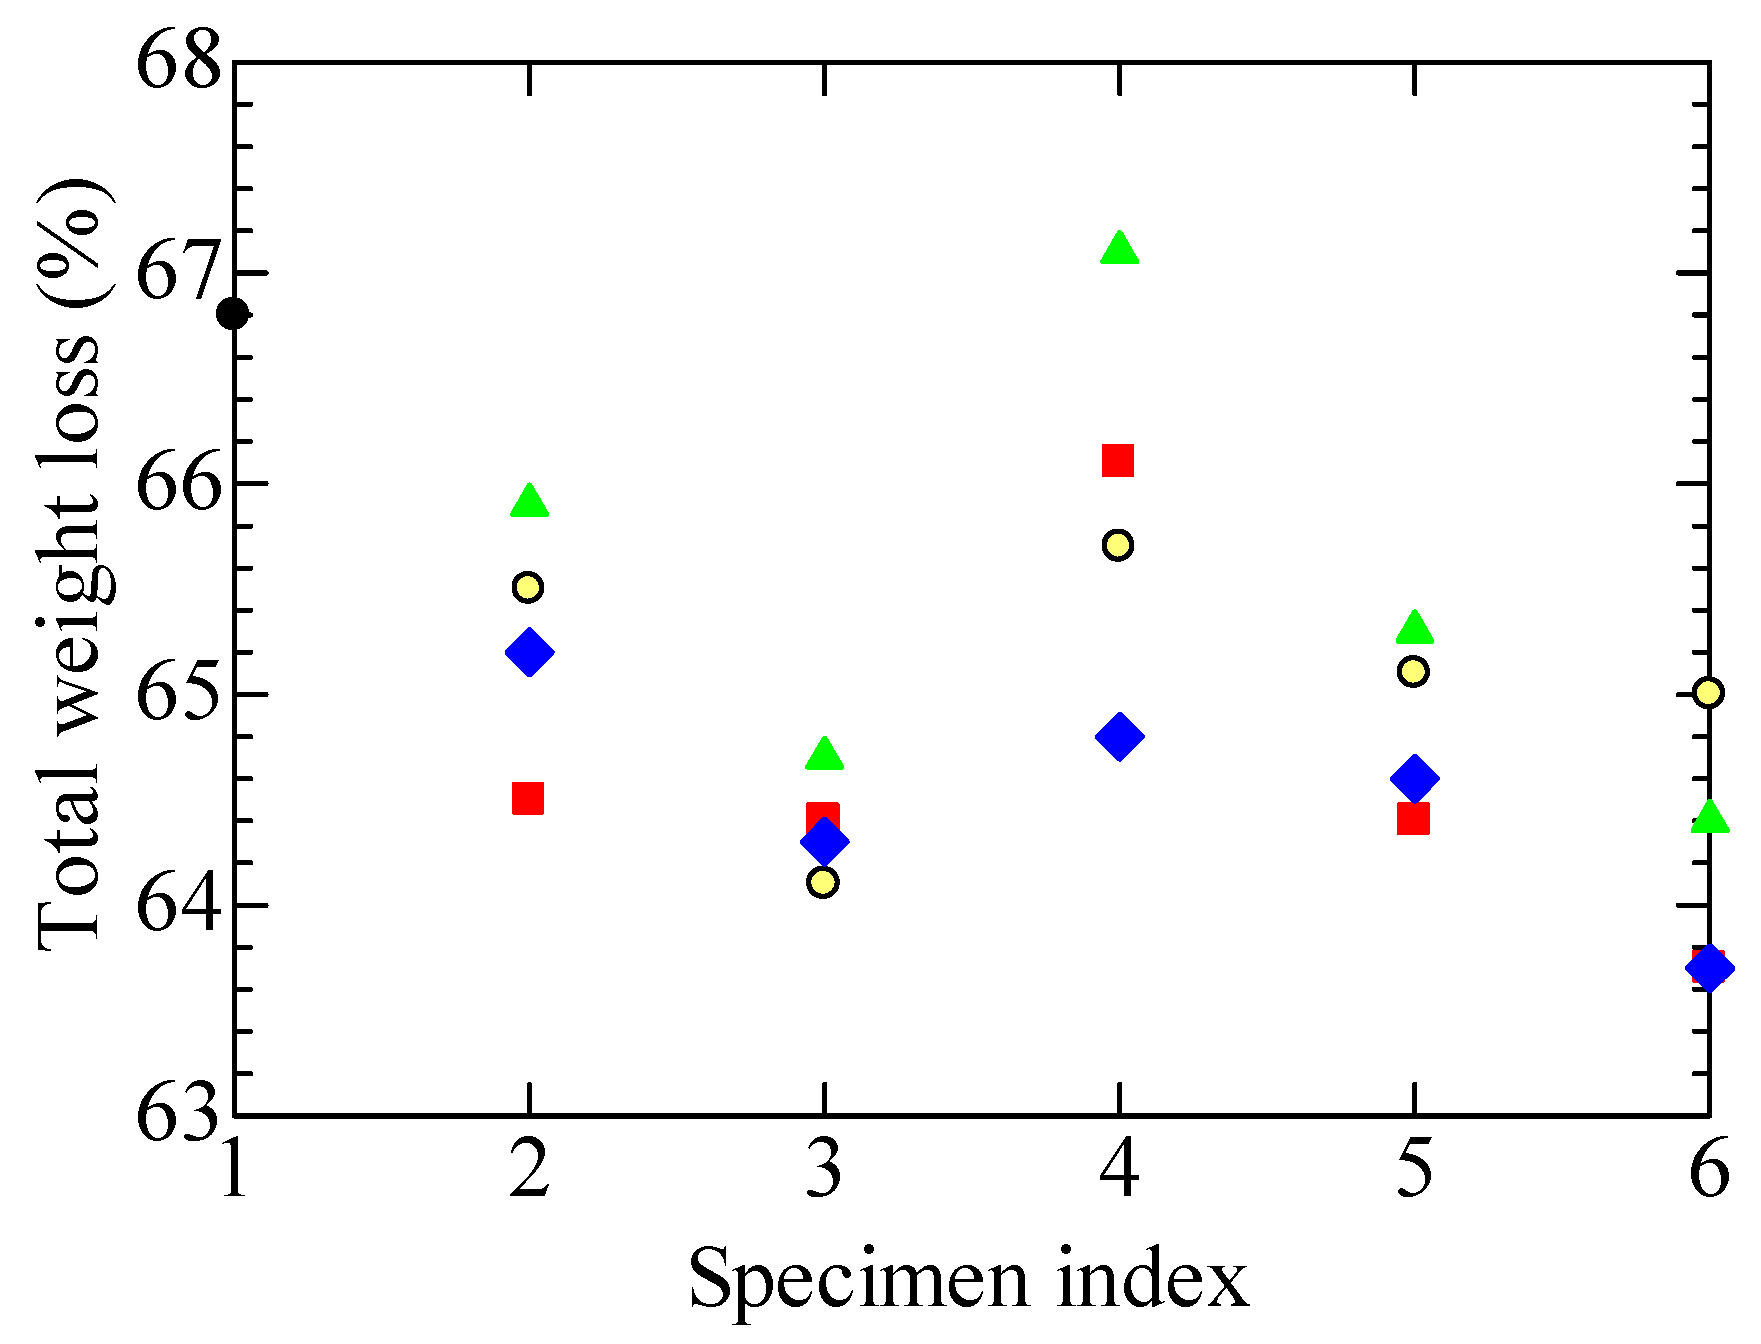
4.4.2. Total Weight Loss
4.5. Gel Fraction and Degree of Swelling
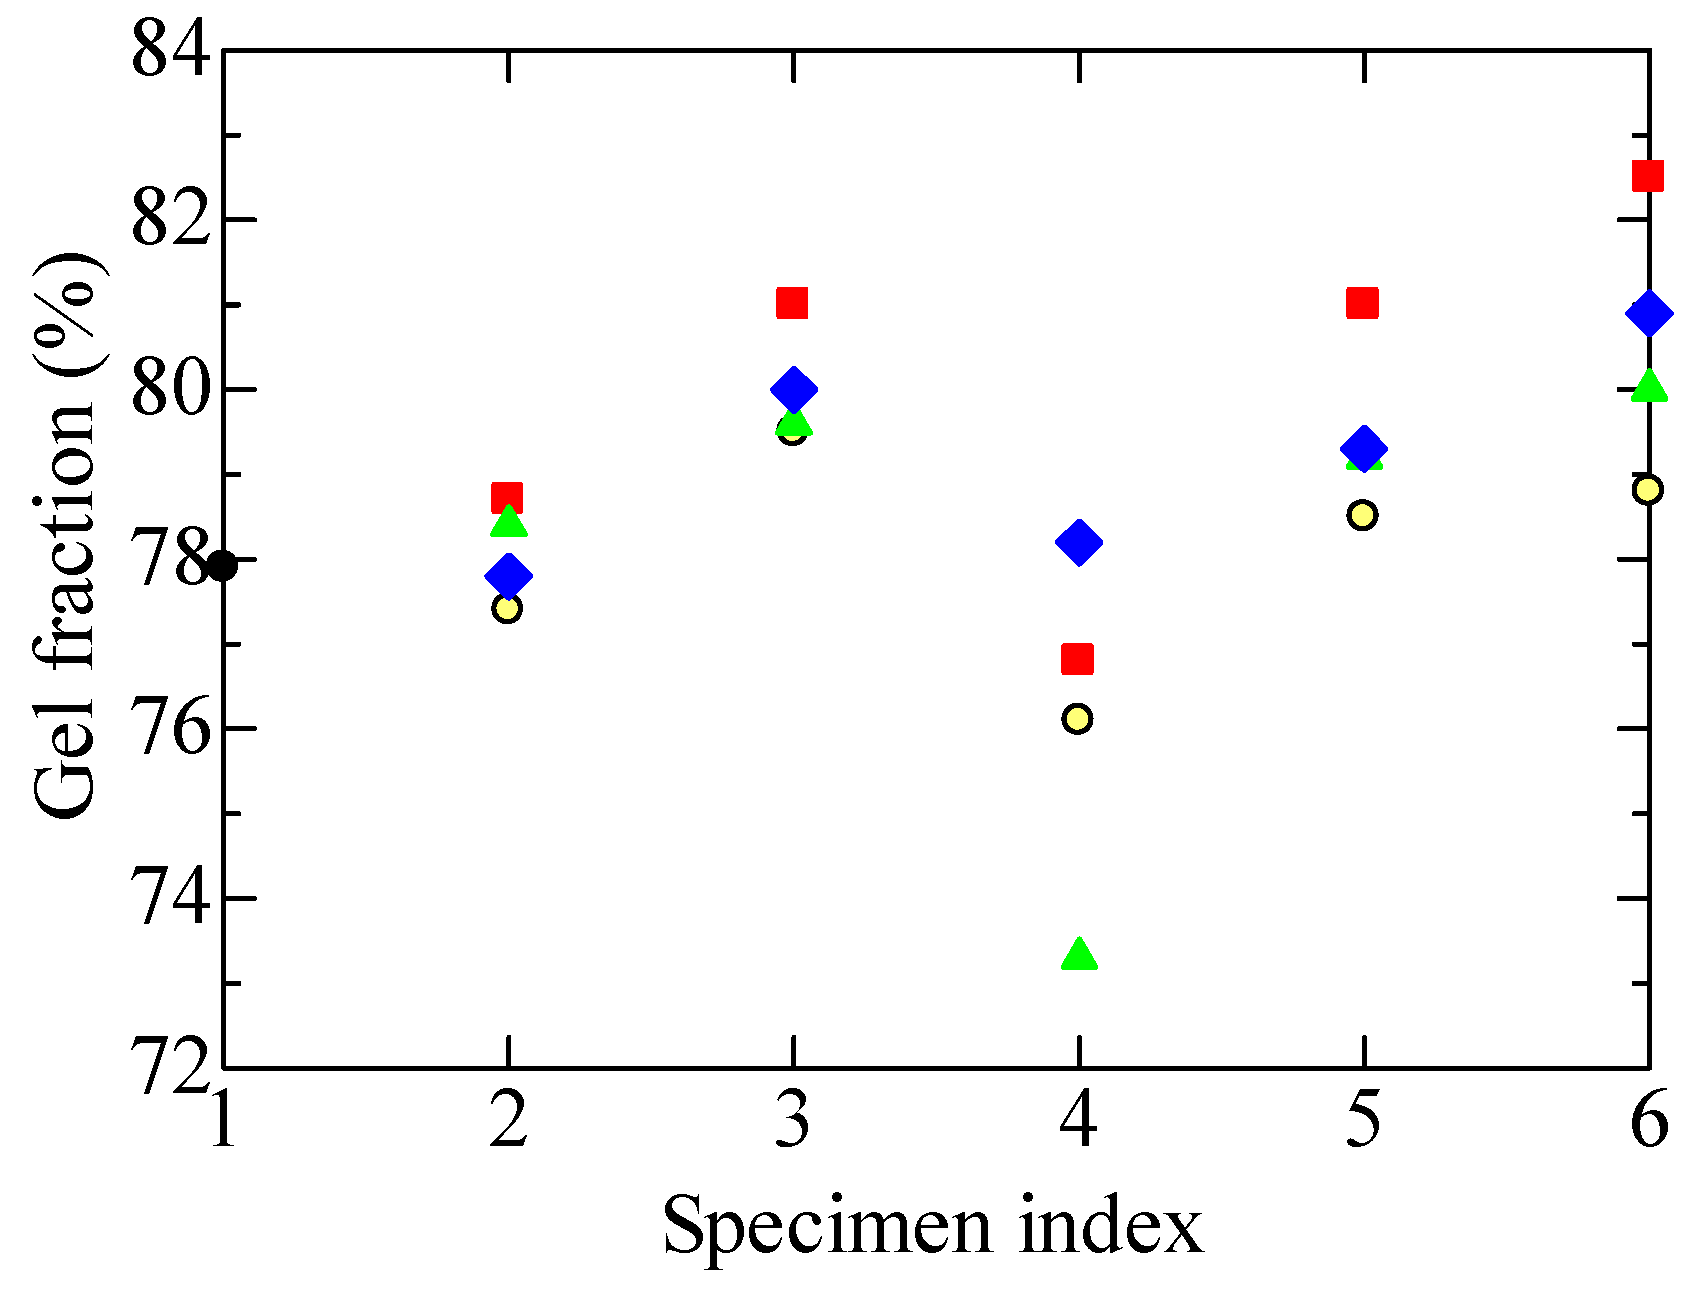
4.5.1. Gel Fraction
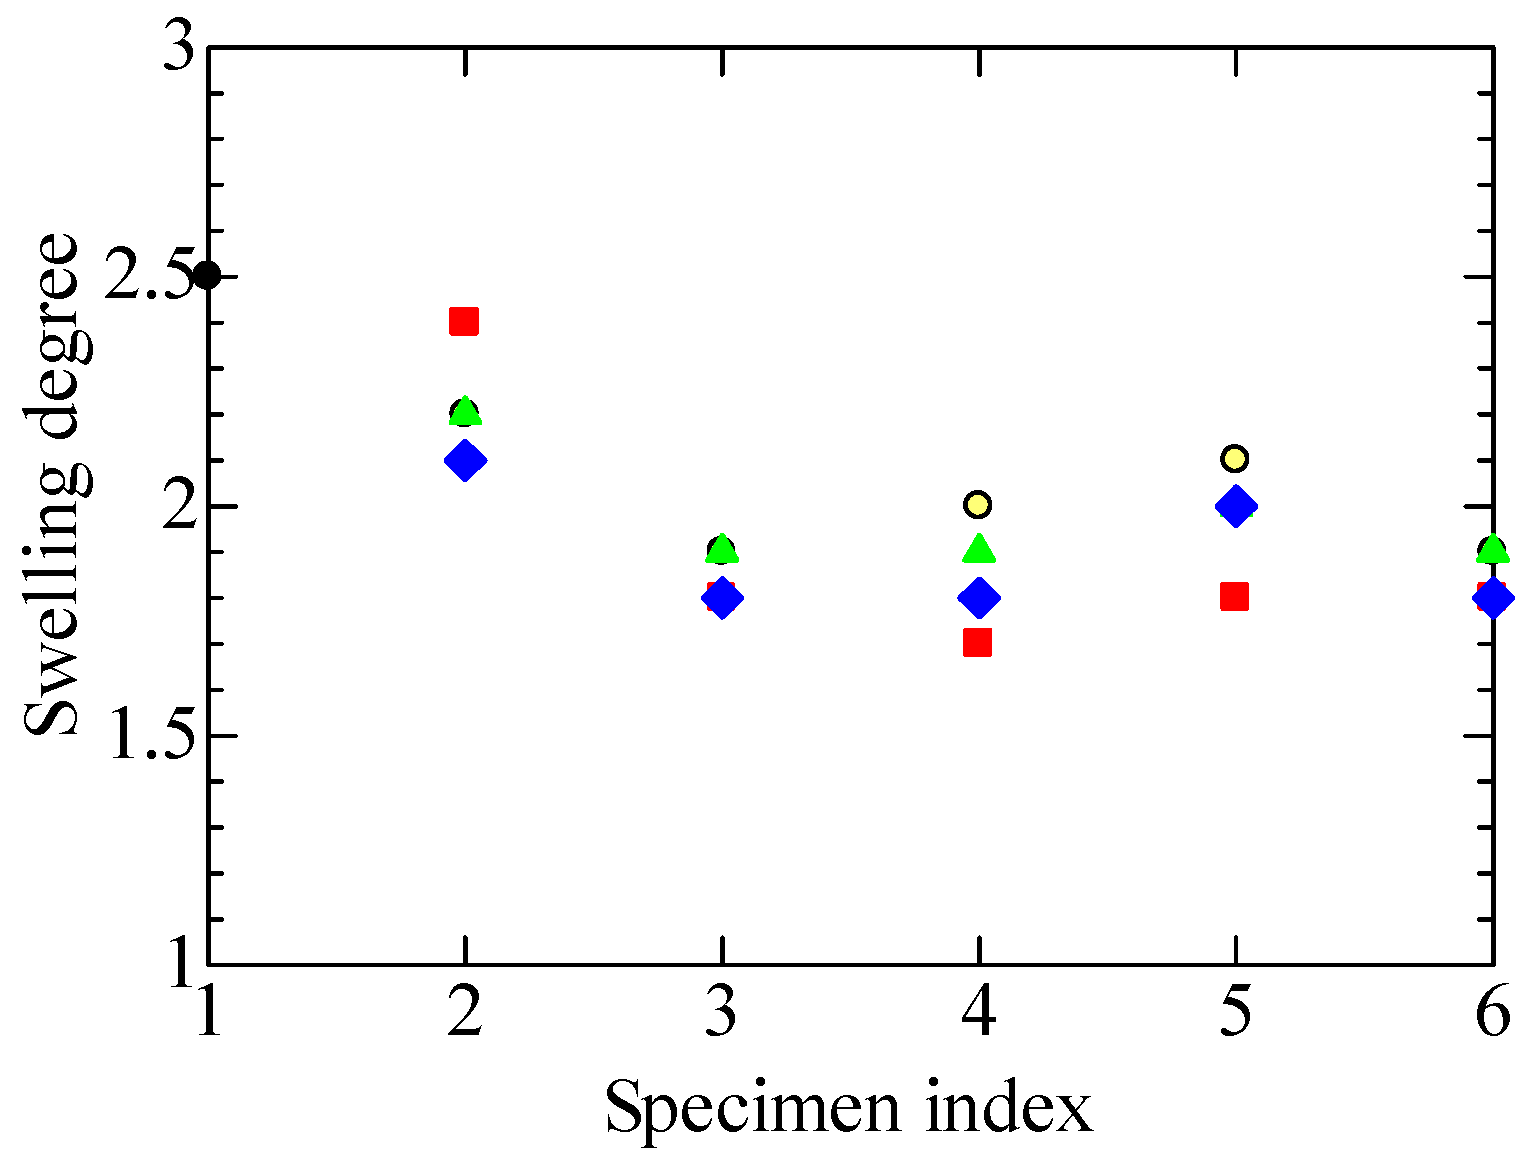
4.5.2. Degree of Swelling
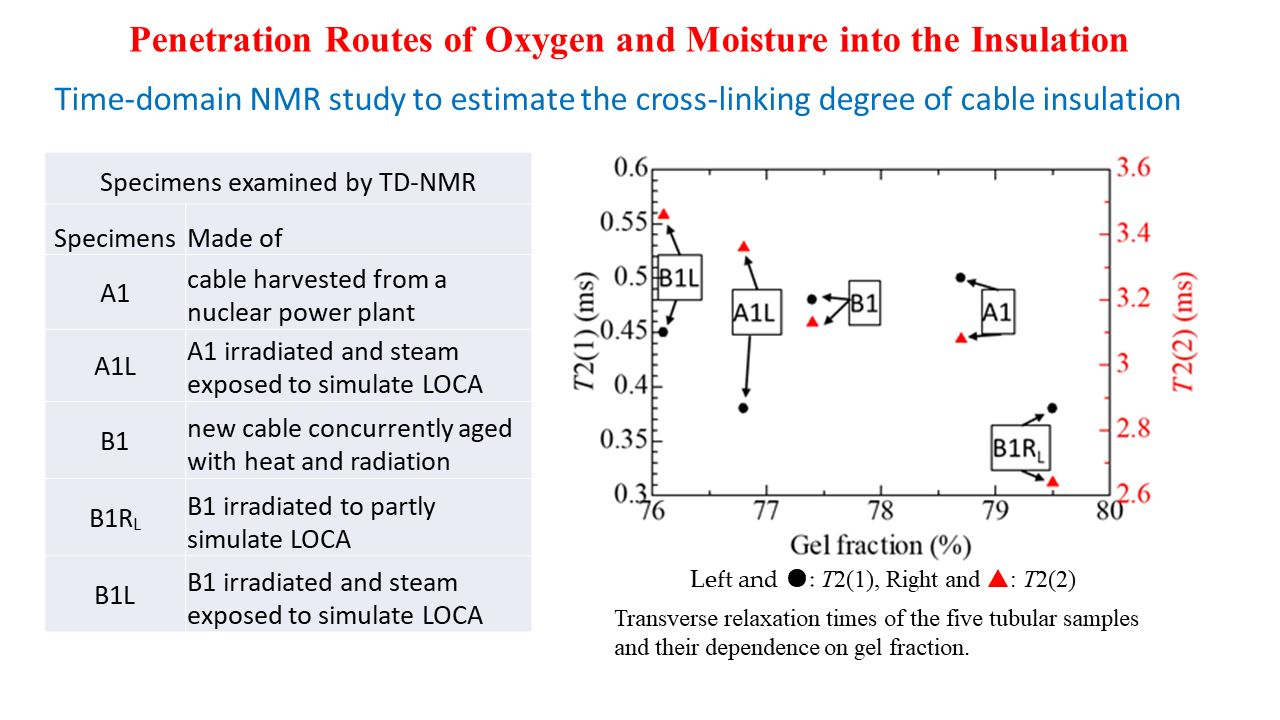
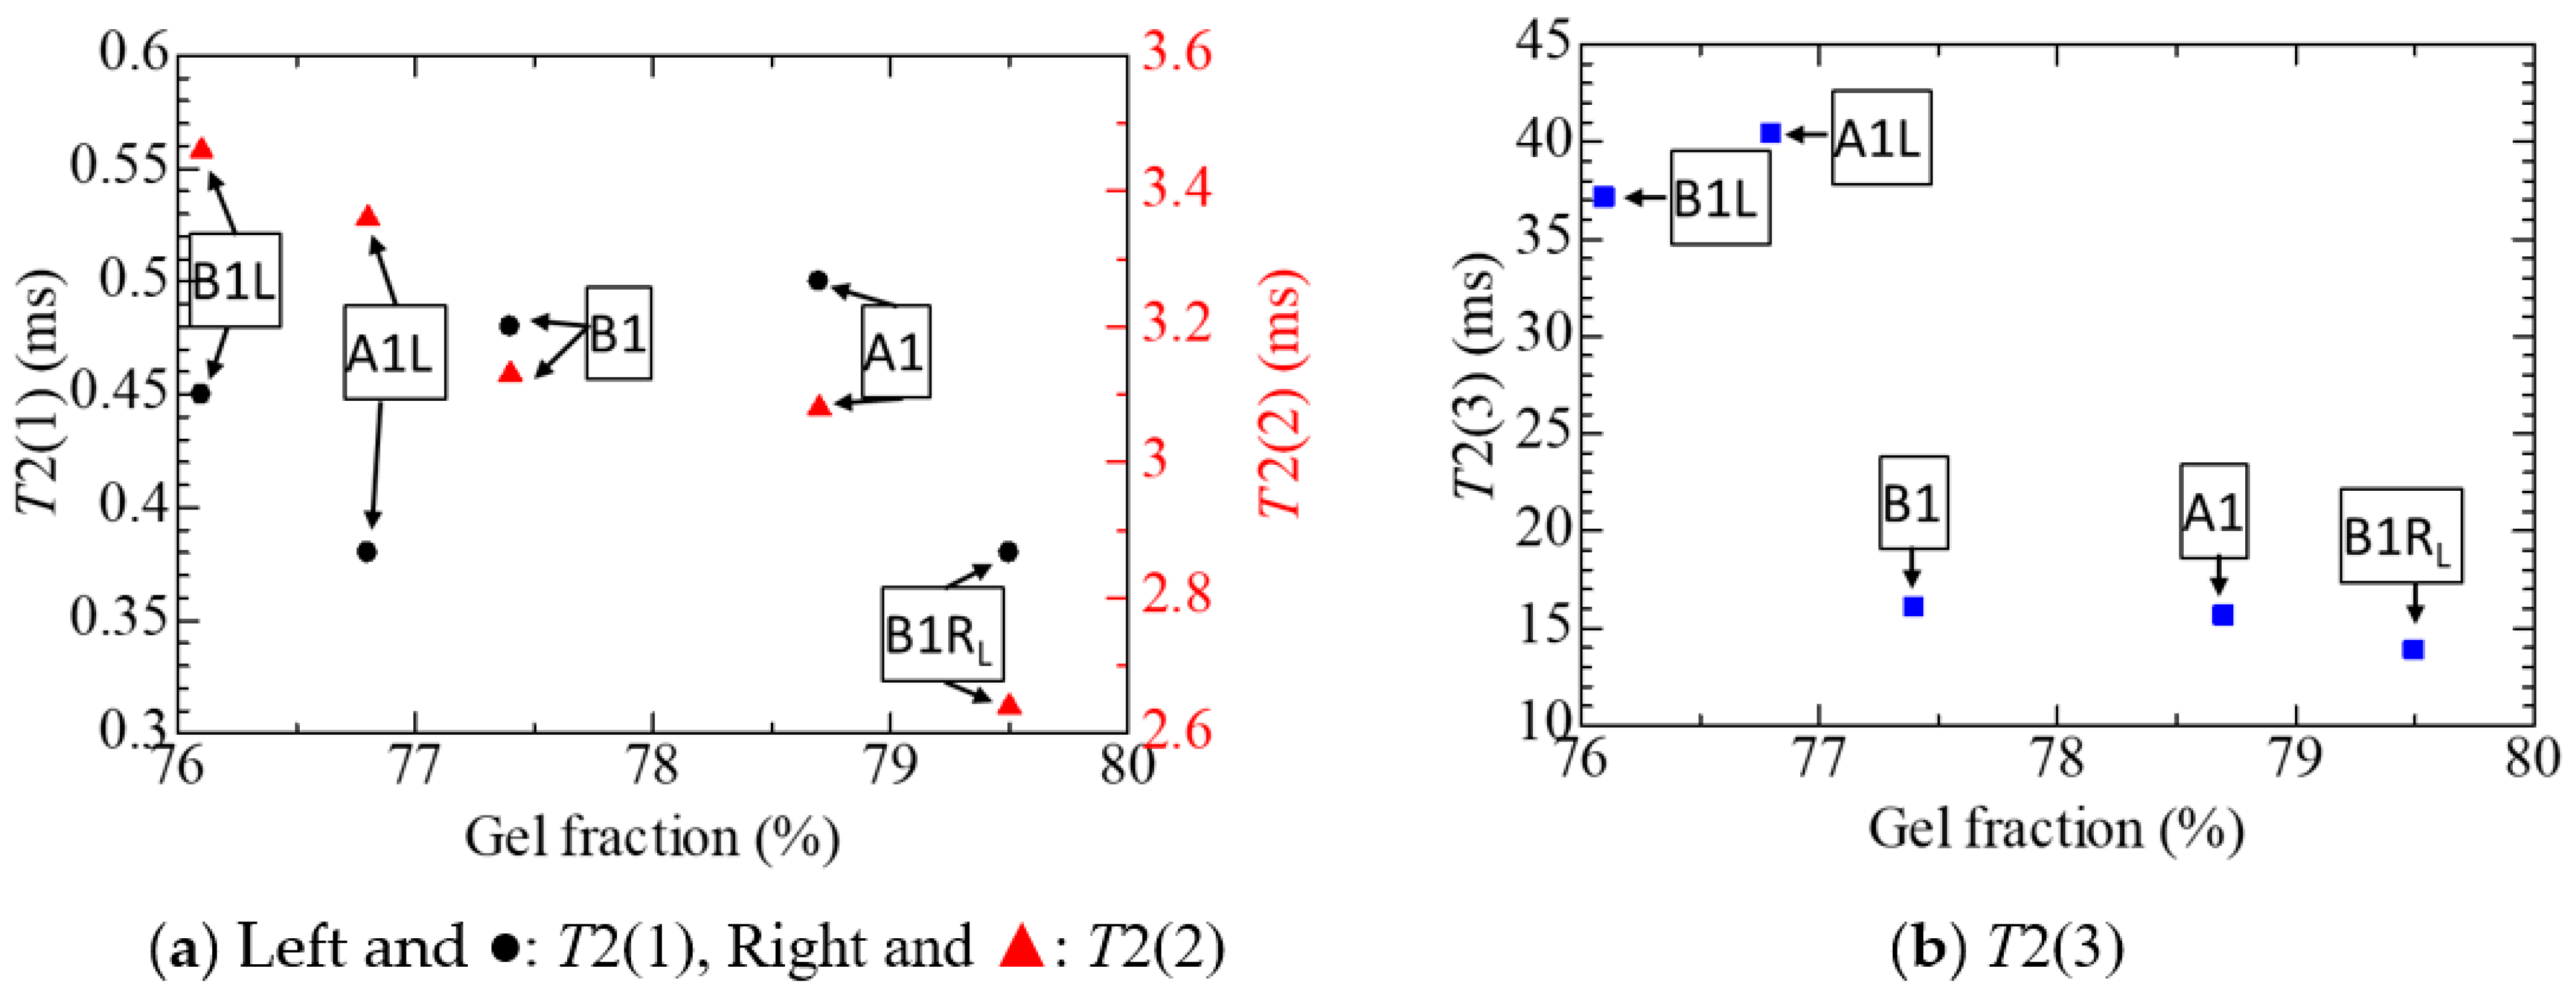
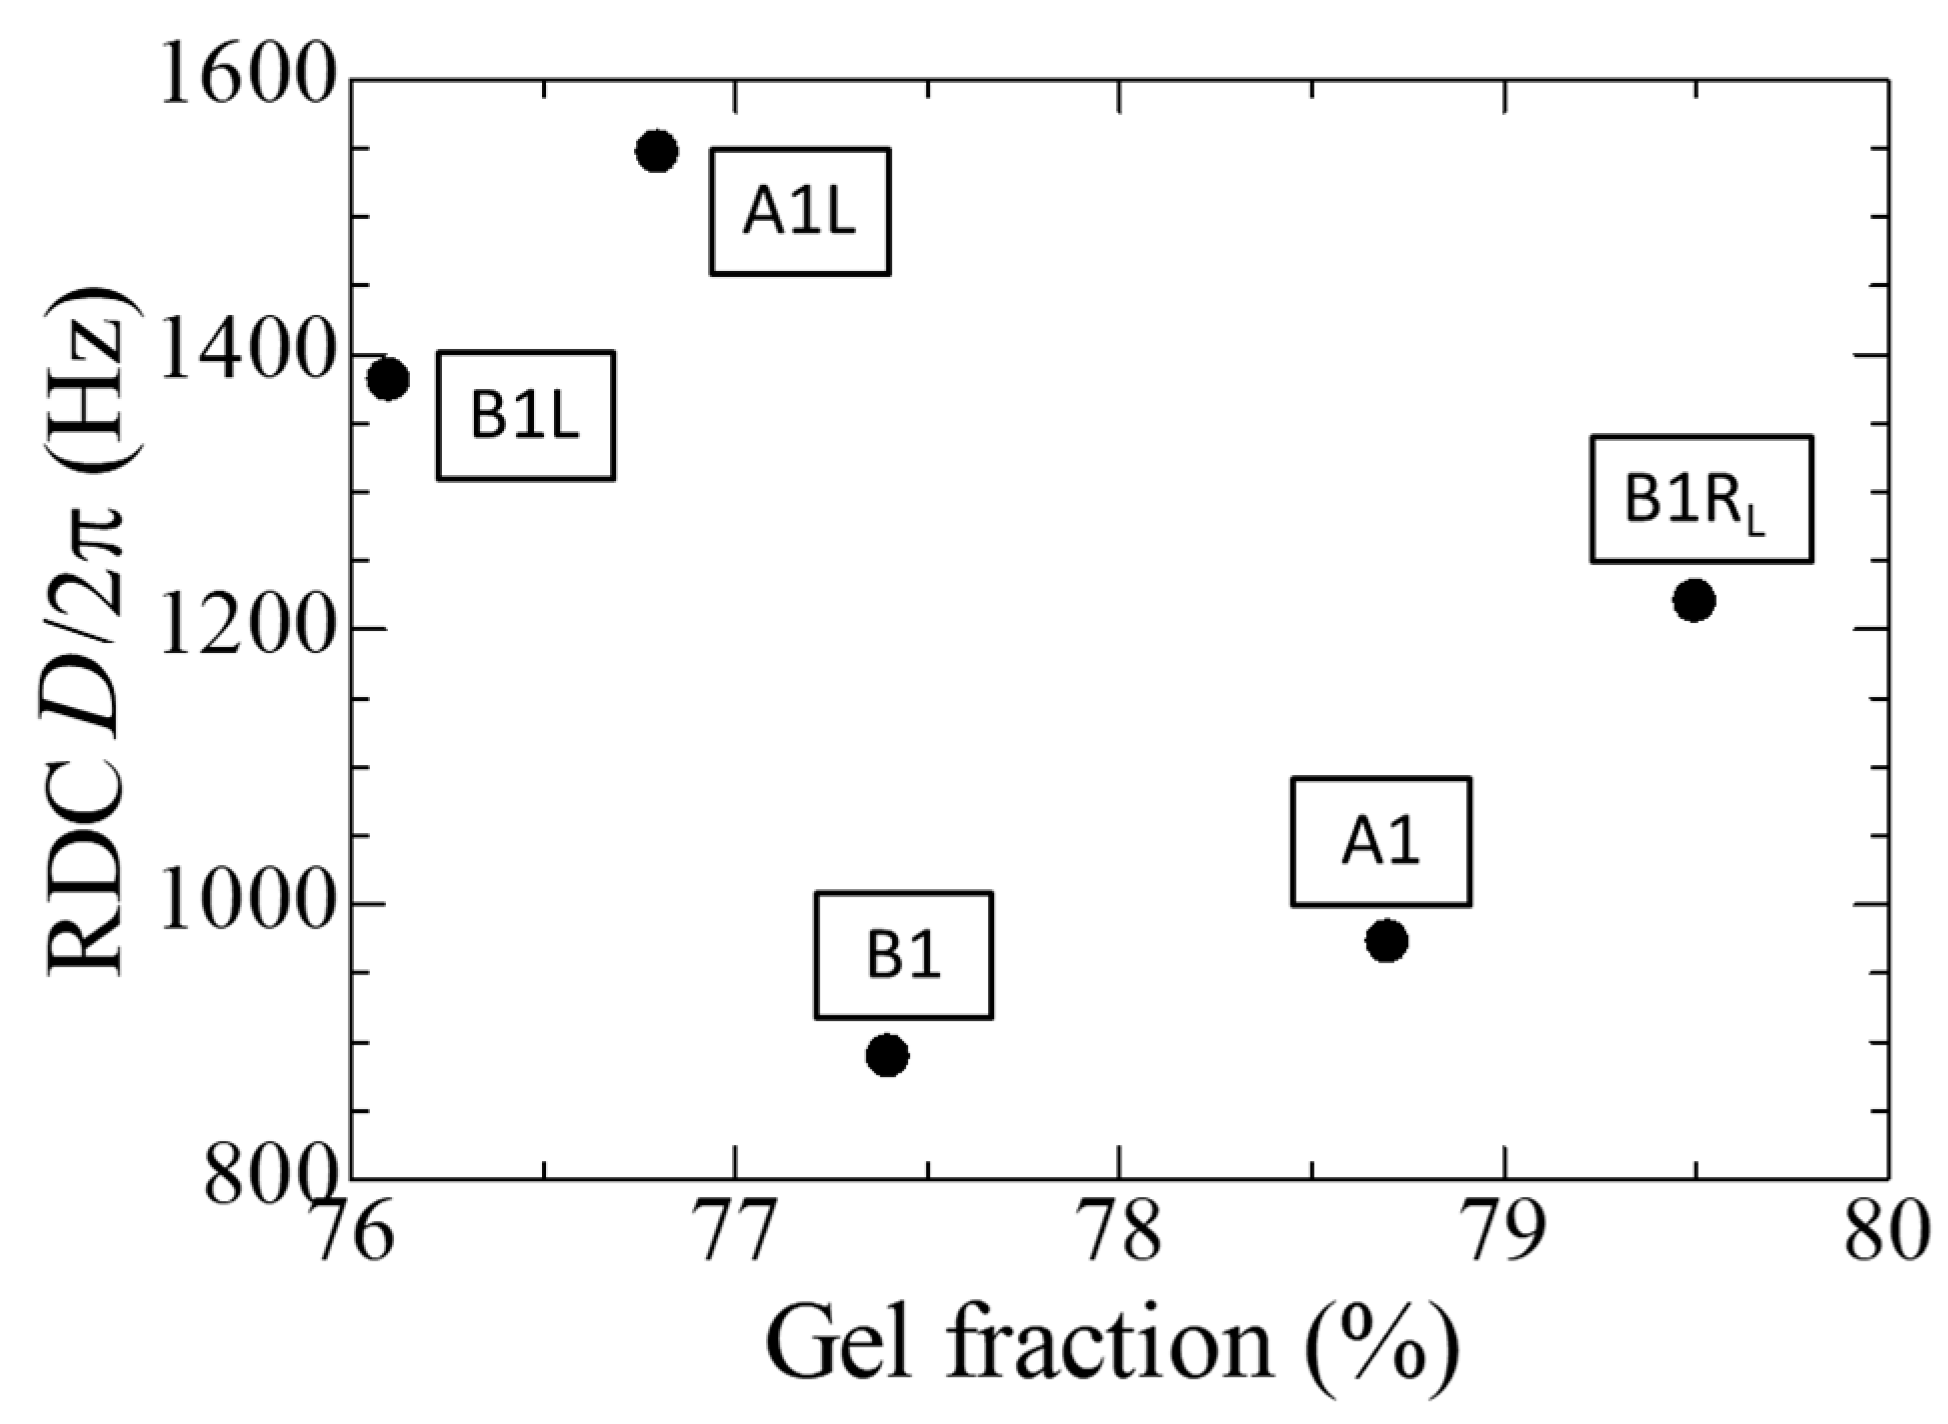
4.6. NMR
4.7. Summary of Experimental Results
5. Conclusions
Author Contributions
Funding
Institutional Review Board Statement
Informed Consent Statement
Data Availability Statement
Conflicts of Interest
References
- Light Water Reactor Sustainability (LWRS) Program. Available online: https://www.energy.gov/ne/nuclear-reactor-technologies/light-water-reactor-sustainability-lwrs-program (accessed on 22 September 2022).
- Liu, S.; Fifield, L.S.; Bowler, N. Aging mechanisms of filled cross-linked polyethylene (XLPE) cable insulation material exposed to simultaneous thermal and gamma radiation. Radiat. Phys. Chem. 2021, 185, 109486. [Google Scholar] [CrossRef]
- TeaM Cables H2020 Euratom Research Project—Home. Available online: https://www.team-cables.eu (accessed on 22 September 2022).
- Suraci, S.V.; Fabiani, D.; Mazzocchetti, L.; Giorgini, L. Degradation Assessment of Polyethylene-Based Material Through Electrical and Chemical-Physical Analyses. Energies 2020, 13, 650. [Google Scholar] [CrossRef] [Green Version]
- Miyazaki, Y.; Hirai, N.; Ohki, Y. Effects of heat and gamma-rays on mechanical and dielectric properties of cross-linked polyethylene. IEEE Trans. Dielectr. Electr. Insul. 2020, 27, 1998–2006. [Google Scholar] [CrossRef]
- Liu, Z.; Miyazaki, Y.; Hirai, N.; Ohki, Y. Comparison of the effects of heat and gamma irradiation on the degradation of cross-linked polyethylene. IEEJ Trans. Electr. Electron. Eng. 2020, 15, 24–29. [Google Scholar] [CrossRef]
- Yang, Z.; Kaneko, T.; Hirai, N.; Ohki, Y. Aging behavior of flame-retardant cross-linked polyethylene in nuclear power plant environments. IEEJ Trans. Electr. Electron. Eng. 2019, 14, 1133–1138. [Google Scholar] [CrossRef]
- Yamaguchi, H.; Ishii, H.; Hirai, N.; Ohki, Y. Degradation of mechanical and dielectric properties of flame-retardant ethylene propylene rubber by thermal aging. IEEJ Trans. Electr. Electron. Eng. 2020, 15, 488–495. [Google Scholar] [CrossRef]
- You, J.; Yamaguchi, H.; Ishii, H.; Hirai, N.; Ohki, Y. Degradation of flame-retardant ethylene-propylene-diene rubber by radiation and steam. IEEJ Trans. Electr. Electron. Eng. 2020, 15, 1572–1579. [Google Scholar] [CrossRef]
- Zhou, H.; Hanafusa, W.; Udo, K.; Hirai, N.; Ohki, Y. Aging behavior of flame-retardant cross-linked polyolefin under thermal and radiation stresses. IEEE Trans. Dielectr. Electr. Insul. 2021, 28, 303–309. [Google Scholar] [CrossRef]
- Zhou, H.; Hirai, N.; Ohki, Y. Various characteristics of severely aged flame-retardant cross-linked polyolefin. IEEJ Trans. Electr. Electron. Eng. 2021, 16, 1556–1562. [Google Scholar] [CrossRef]
- Kaneko, T.; Ito, S.; Minakawa, T.; Hirai, N.; Ohki, Y. Degradation mechanisms of silicone rubber under different aging conditions. Polym. Degrad. Stab. 2019, 168, 108936. [Google Scholar] [CrossRef]
- Ito, S.; Miyazaki, Y.; Hirai, N.; Ohki, Y. Effects of gamma irradiation on the degradation of silicone rubber by steam exposure. J. Nucl. Sci. Technol. 2021, 58, 166–172. [Google Scholar] [CrossRef]
- Ishii, H.; Hirai, N.; Ohki, Y. Comparison of degradation behavior between soft and hard epoxy resins. J. Nucl. Sci. Technol. 2020, 58, 620–628. [Google Scholar] [CrossRef]
- Ohki, Y.; Ishii, H.; Hirai, N. Degradation of soft epoxy resin for cable penetrations induced by simulated severe accidents. Energies 2021, 14, 6932. [Google Scholar] [CrossRef]
- Ohki, Y.; Hirai, N. Thermal ageing of soft and hard epoxy resins. High Volt. 2022, 1–9. [Google Scholar] [CrossRef]
- IAEA. Assessment and Management of Ageing of Major Nuclear Power Plant Components Important to Safety: In-Containment Instrumentation and Control Cables; IAEA-TECDOC-1188; IAEA: Vienna, Austria, 2000; Volume II, pp. 76–83. [Google Scholar]
- Japan Nuclear Energy Safety Organization. Chapter V Assessments, Section 3 Method of Setting Up Accelerated aging Condition. In The Final Report of the Project of “Assessment of Cable Aging for Nuclear Power Plants”; JNES-SS-0903; Japan Nuclear Energy Safety Organization: Tokyo, Japan, 2009; pp. 212–217. [Google Scholar]
- Nuclear Power Division, Kansai Electric Power; (Mihama, Fukui, Japan). Personal communication, 2021.
- Japan Nuclear Energy Safety Organization. Chapter III Cable Aging Evaluation Test, Section 1 Test Program. In The Final Report of the Project of “Assessment of Cable Aging for Nuclear Power Plants”; JNES-SS-0903; Japan Nuclear Energy Safety Organization: Tokyo, Japan, 2009; pp. 52–56. [Google Scholar]
- Ohki Laboratory, Waseda University. Integrity Evaluation Study of Electrical and Instrumentation Equipment; Annual Report 2021; Nuclear Regulation Authority of Japan: Tokyo, Japan, 2022; in preparation for publication. (In Japanese)
- Utsuzawa, S.; Donaldson, M.; Song, Y.-Q. Ringing cancellation in Carr-Purcell-Meiboom-Gill-type sequences. Magn. Reson. Lett. 2022, 2, 233–242. [Google Scholar] [CrossRef]
- Linde, E.; Verardi, L.; Pourmand, P.; Fabiani, D.; Gedde, U. Nondestructive condition monitoring of aged ethylene-propylene copolymer cable insulation samples using dielectric spectroscopy and NMR spectroscopy. Polym. Test. 2015, 46, 72–78. [Google Scholar] [CrossRef]
- Prestegard, J.H.; Al-Hashimi, H.M.; Tolman, J.R. NMR structures of biomolecules using field oriented media and residual dipolar couplings. Q. Rev. Biophys. 2000, 33, 371–424. [Google Scholar] [CrossRef]
- Maxwell, R.S.; Balazs, B. Residual dipolar coupling for the assessment of cross-link density changes in γ-irradiated silica-PDMS composite materials. J. Chem. Phys. 2002, 116, 10492–10502. [Google Scholar] [CrossRef]
- Li, X.; Yuan, L.; Liu, D.; Li, Z.; Chen, J.; Yuan, K.; Xiang, J.; Huang, Y. High sulfur-containing organosulfur polymer composite cathode embedded by monoclinic S for lithium sulfur batteries. Energy Storage Mater. 2020, 26, 570–576. [Google Scholar] [CrossRef]
- Wikipedia Spin-Spin Relaxation. Available online: https://en.wikipedia.org/wiki/Spin%E2%80%93spin_relaxation (accessed on 22 September 2022).
- Saalwächter, K.; Gottlieb, M.; Liu, R.; Oppermann, W. Gelation as studied by proton multiple-quantum NMR. Macromolecules 2007, 40, 1555. [Google Scholar] [CrossRef]
- Fuse, N.; Misaka, H.; Homma, H.; Okamoto, T. Mechanism Elucidation of Degradation Dynamics of Ethylene Propylene Rubber Cable Insulations Sampled from Nuclear Power Containment using Additional Aging. IEEE Trans. Dielectr. Electr. Insul. 2016, 23, 730–737. [Google Scholar] [CrossRef]
- Yang, L.; Ohki, Y.; Hirai, N.; Hanada, S. Aging of poly(ether ether ketone) by heat and gamma rays—Its degradation mechanism and effects on mechanical, dielectric and thermal properties. Polym. Degrad. Stab. 2017, 142, 117–128. [Google Scholar] [CrossRef]


| Sample 1 | Gamma-Ray Irradiation | |||
|---|---|---|---|---|
| Temp. | Dose Rate | Period | Symbol | |
| °C | Gy/h | h | ||
| A1 | 61 | 2 × 10⁻⁴ | 29 years 2 | ■ |
| B0 | - | - | ● | |
| B1 | 100 | 100 | 1997 |  |
| B2 | 100 | 150 | 1431 | ▲ |
| B3 | 100 | 200 | 1126 | ◆ |
| Group Number | Specimen |
|---|---|
| 1 | New undegraded tubular specimen B0 |
| 2 | A1 harvested from NPP and B1 to B3 artificially aged equivalently |
| 3 | A1RL and B1RL to B3RL received LOCA-simulating irradiation |
| 4 | A1L and B1L to B3L received simulated LOCA |
| 5 | A1RS and B1RS to B3RS received SA-simulating irradiation |
| 6 | A1S and B1S to B3S received simulated SA |
| Wave Number (cm−1) | Assignment | Origin |
|---|---|---|
| 3800–3200 | OH | H2O |
| 3000–2800 | CHal | Aliphatic (EPDM) |
| around 1720 | C=Oest | Ester carbonyl |
| around 1700 | C=Oacid | Acid carbonyl |
| 1460, 1380 | CH2, CH3 | Aliphatic (EPDM) |
| 1010 | Mg-O | Talc |
| 720 | -(CH2)n- n ≥ 4 | Aliphatic (EPDM) |
Publisher’s Note: MDPI stays neutral with regard to jurisdictional claims in published maps and institutional affiliations. |
© 2022 by the authors. Licensee MDPI, Basel, Switzerland. This article is an open access article distributed under the terms and conditions of the Creative Commons Attribution (CC BY) license (https://creativecommons.org/licenses/by/4.0/).
Share and Cite
Ohki, Y.; Hirai, N.; Okada, S. Penetration Routes of Oxygen and Moisture into the Insulation of FR-EPDM Cables for Nuclear Power Plants. Polymers 2022, 14, 5318. https://doi.org/10.3390/polym14235318
Ohki Y, Hirai N, Okada S. Penetration Routes of Oxygen and Moisture into the Insulation of FR-EPDM Cables for Nuclear Power Plants. Polymers. 2022; 14(23):5318. https://doi.org/10.3390/polym14235318
Chicago/Turabian StyleOhki, Yoshimichi, Naoshi Hirai, and Sohei Okada. 2022. "Penetration Routes of Oxygen and Moisture into the Insulation of FR-EPDM Cables for Nuclear Power Plants" Polymers 14, no. 23: 5318. https://doi.org/10.3390/polym14235318