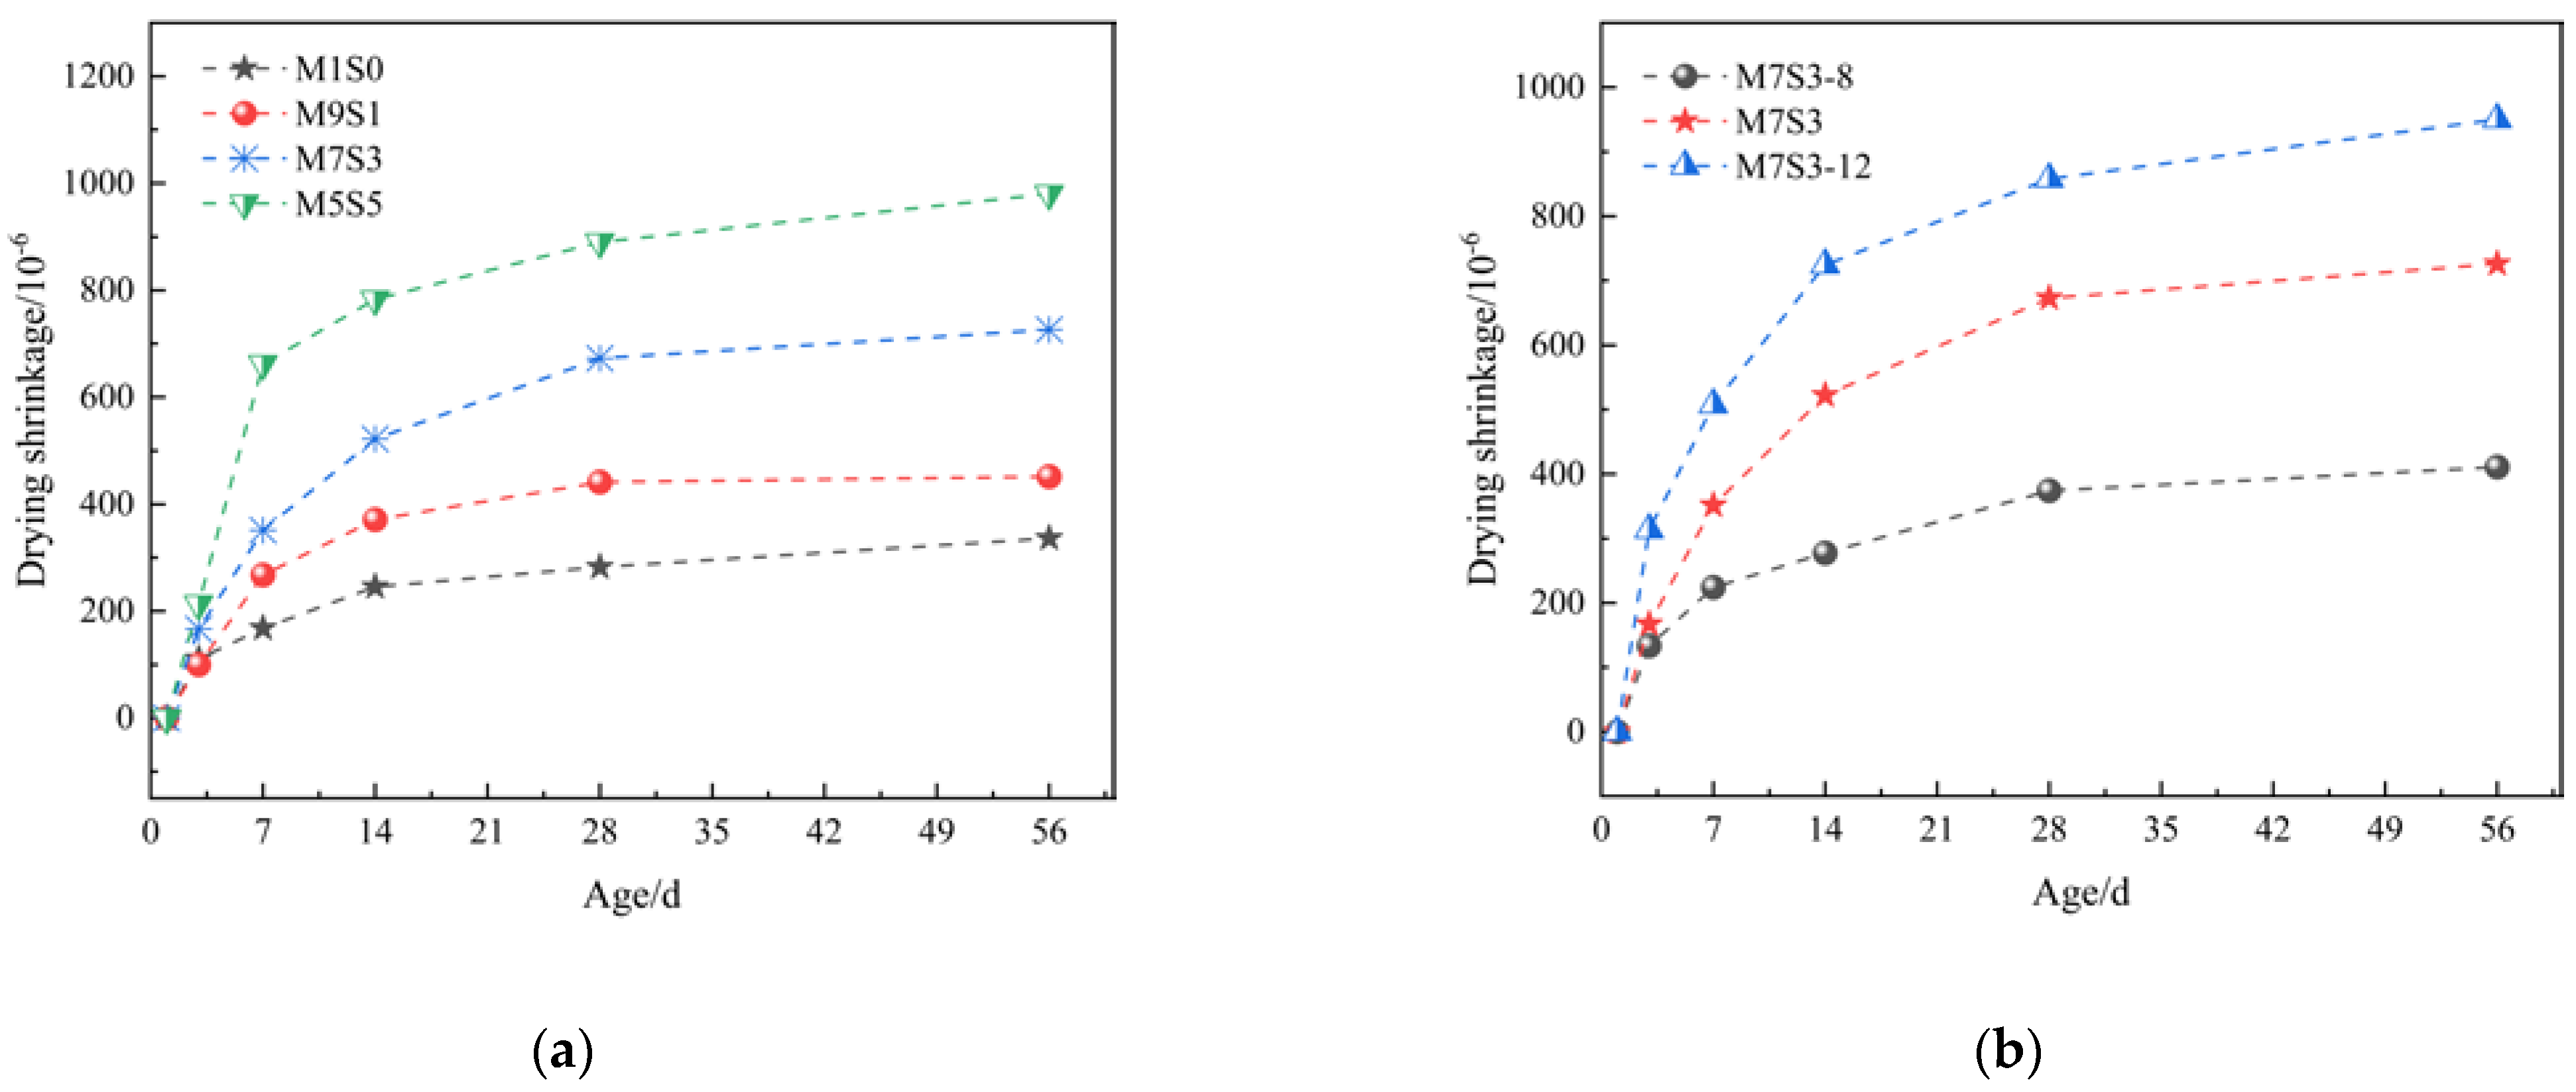
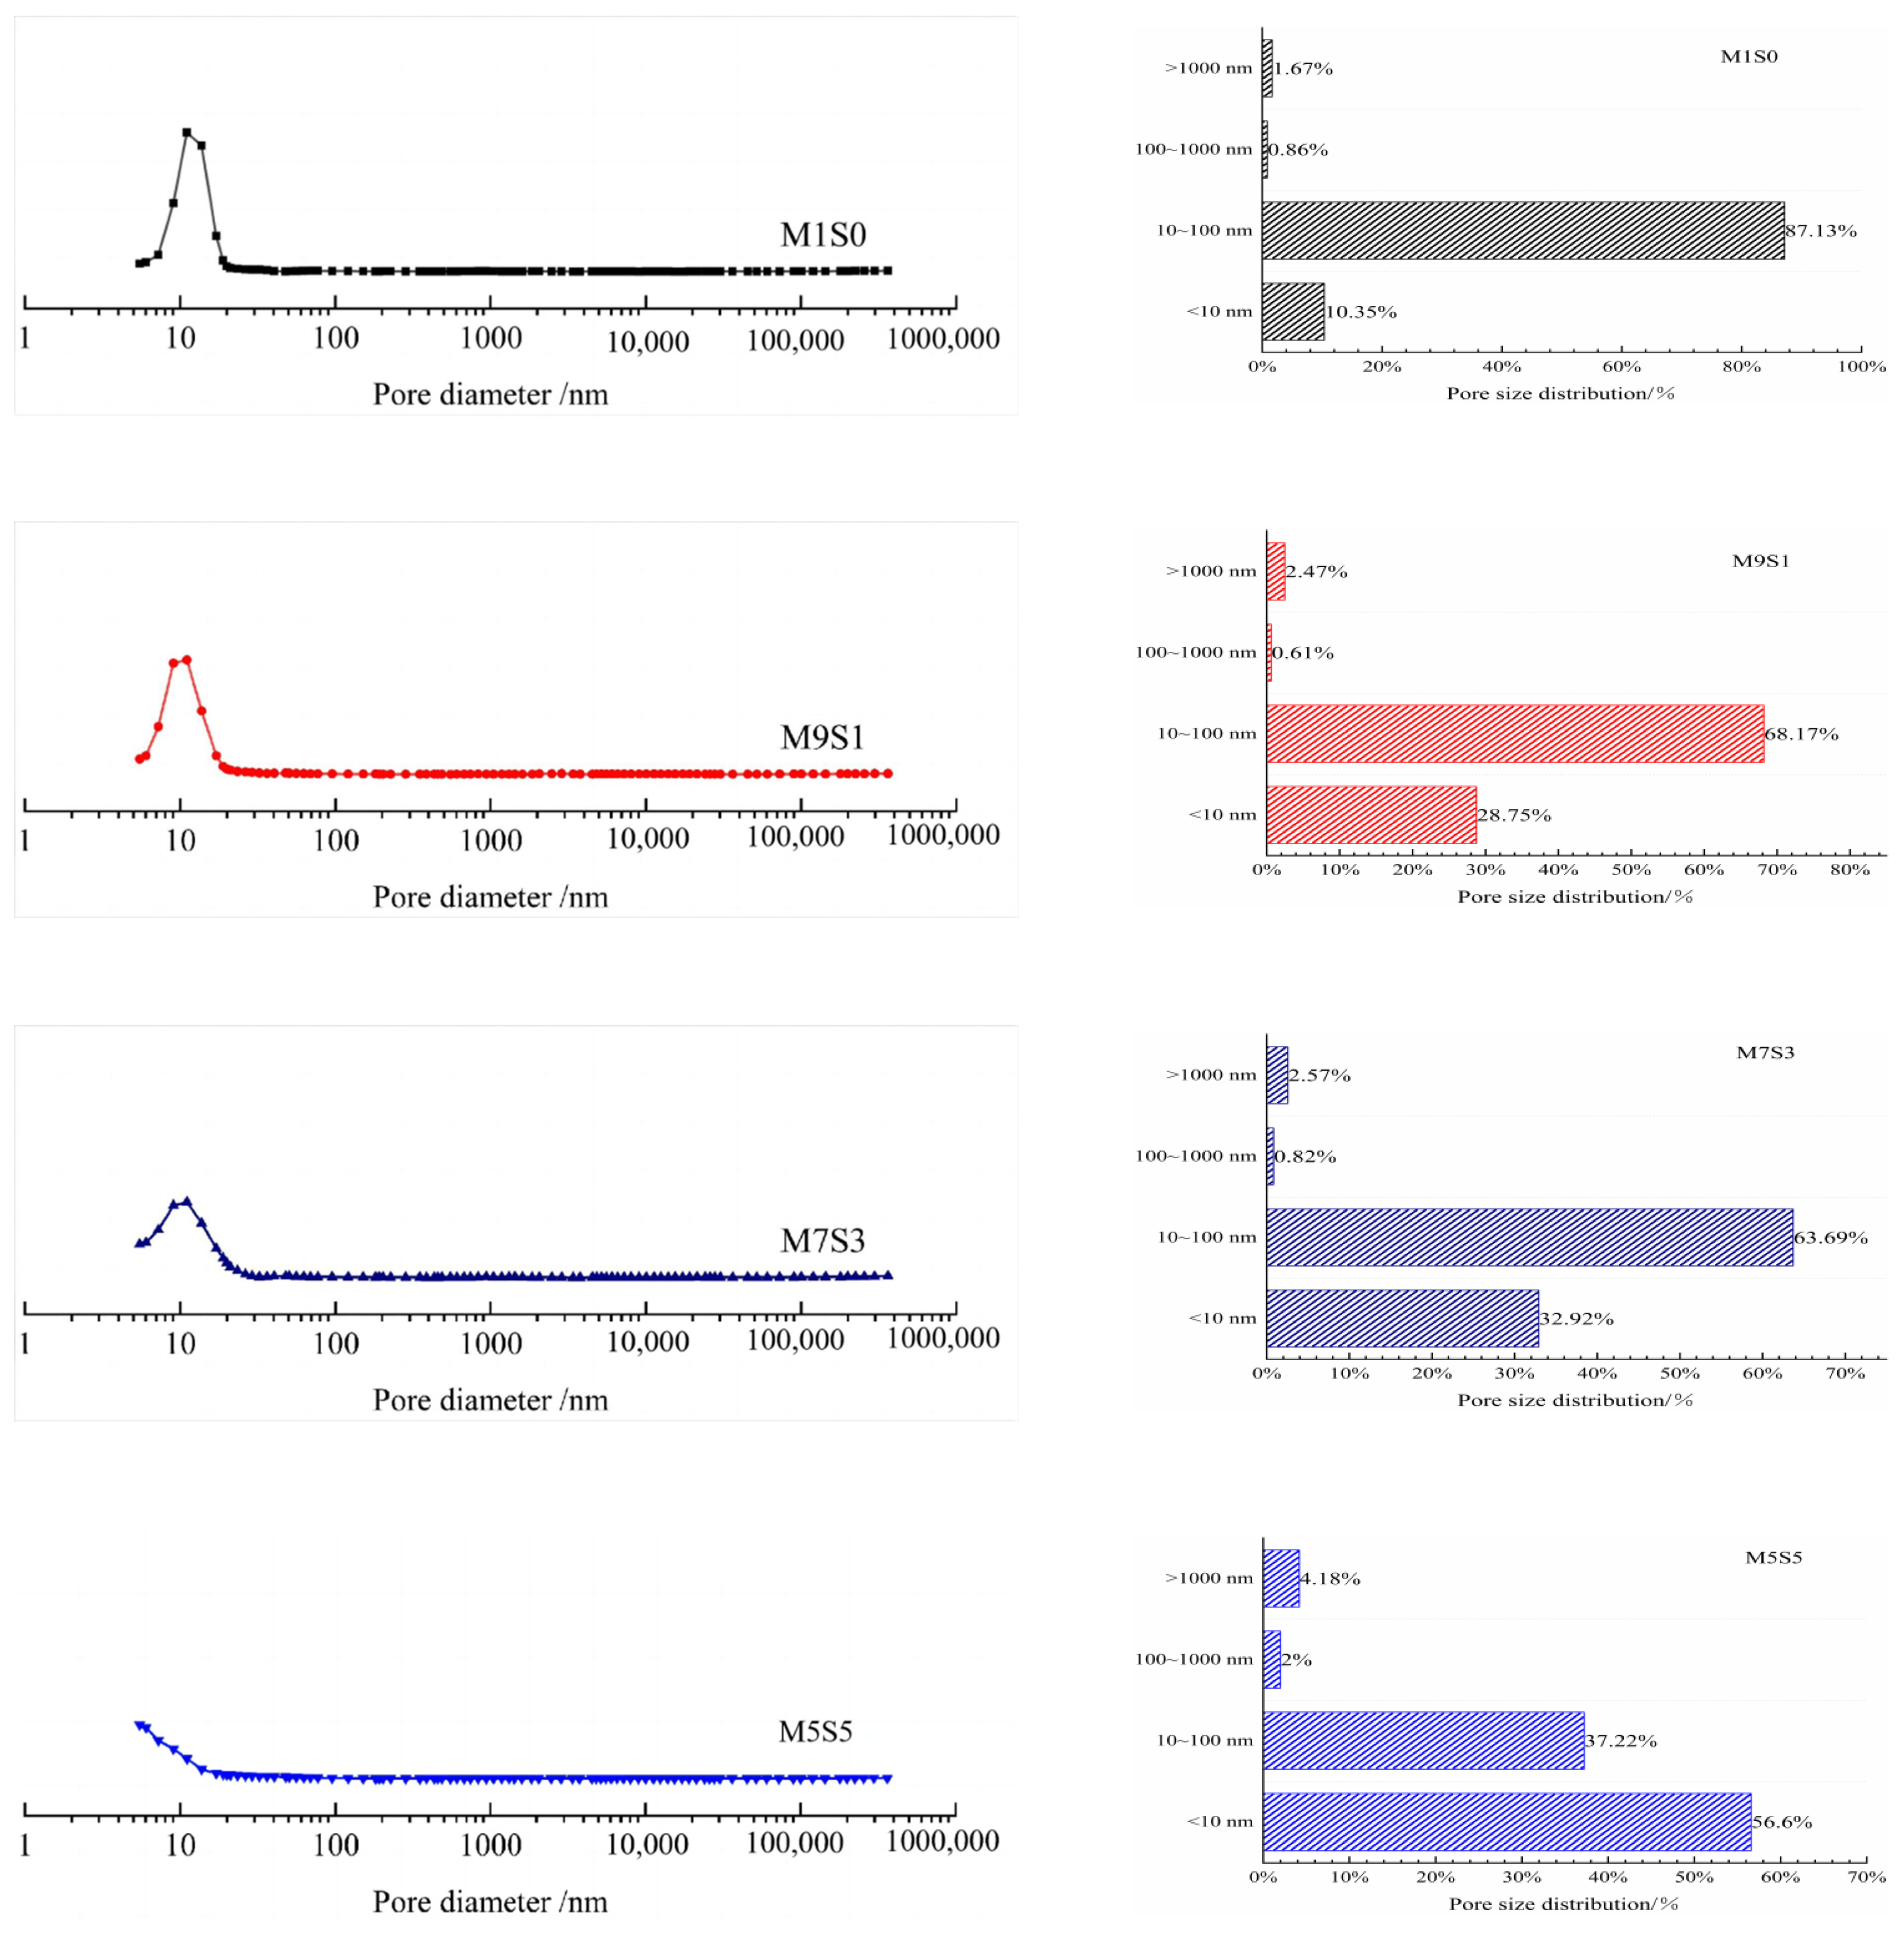
3.7.1. Comparison of Pore Size Distribution of the AAMS Composite Cementitious Materials
The effects of different slag contents and Na
2O contents on the pore size distribution of the AAMS composite cementitious material is shown in
Figure 10, and the pore structural parameters are listed in
Table 4. In
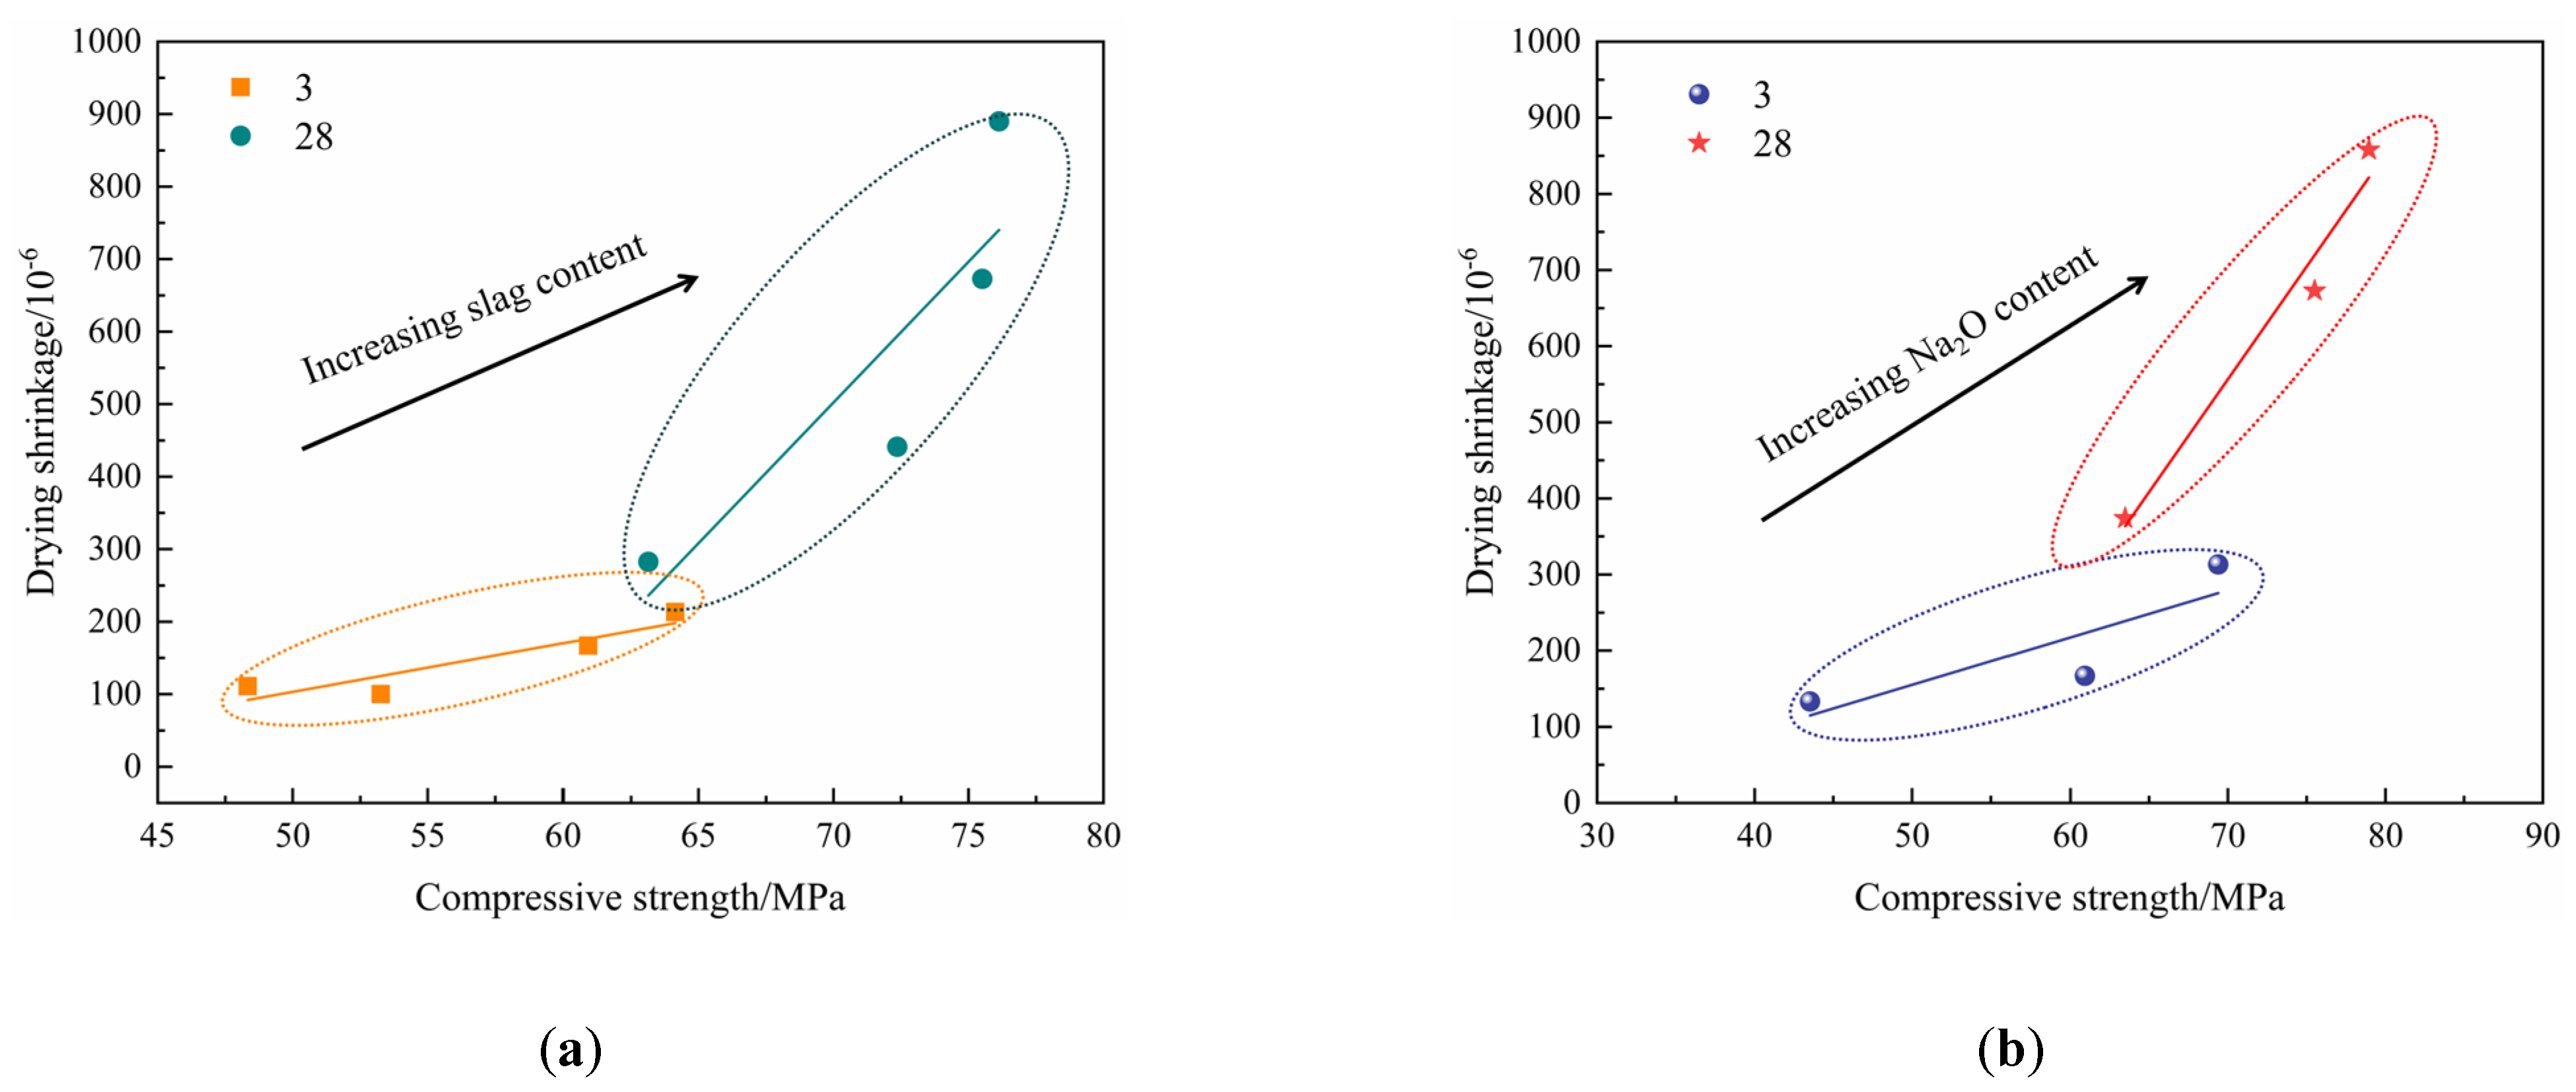
Figure 10, the pore size distribution curves of the cementitious materials with 0, 10%, and 30% slag contents were roughly similar in shape, and the slag content did not lead to formation of too many capillary pores and too few gel pores in the cementitious materials. The pore volume of the AAMS composite cementitious material decreased when the slag content was increased to 50%, and the most likely pore diameter was in the range 1–10 nm. When the slag content was 50%, the curve shape for the range of pore sizes in the AAMS composite cementitious material differed from the pore size distribution curve when the slag contents were 0, 10%, and 30%. The peak value of the AAMS material at approximately 10 nm decreased with increasing slag content, which meant that the increase in slag content made the AAMS composite cementitious material less likely to exhibit the maximum pore size and a more uniform pore structure distribution.
Based on previous studies [
55], the different pores were classified into the following categories: gel pores (<10 nm), transition pores (10–100 nm), capillary pores (100–1000 nm), and macropores (>1000 nm). The distribution of pore volume showed that the pores of the AAMS composite cementitious materials were mainly distributed in the range of 10 nm–100 nm. With an increase in slag content, the number of transition pores of the AAMS material decreased, and the number of gel pores increased. When the slag content was 50%, the proportion of transition pores in the AAMS material decreased by 57.28% compared with a slag content of 0, while the gel pores increased by 446.85%. As seen from
Table 4, the total pore volume and porosity of the AAMS material showed decreases with increasing slag content, and this was consistent with the study of Yang et al. [
26]. It was further suggested that incorporation of slag generated more C-A-S-H gels, which refined the pore structure of the cementitious material, made the pore distribution more uniform, and increased the compressive strength of the cementitious material. However, the drying shrinkage of the AAMS composite cementitious materials increased due to the substantial shrinkage of the C-A-S-H gels themselves [
56].
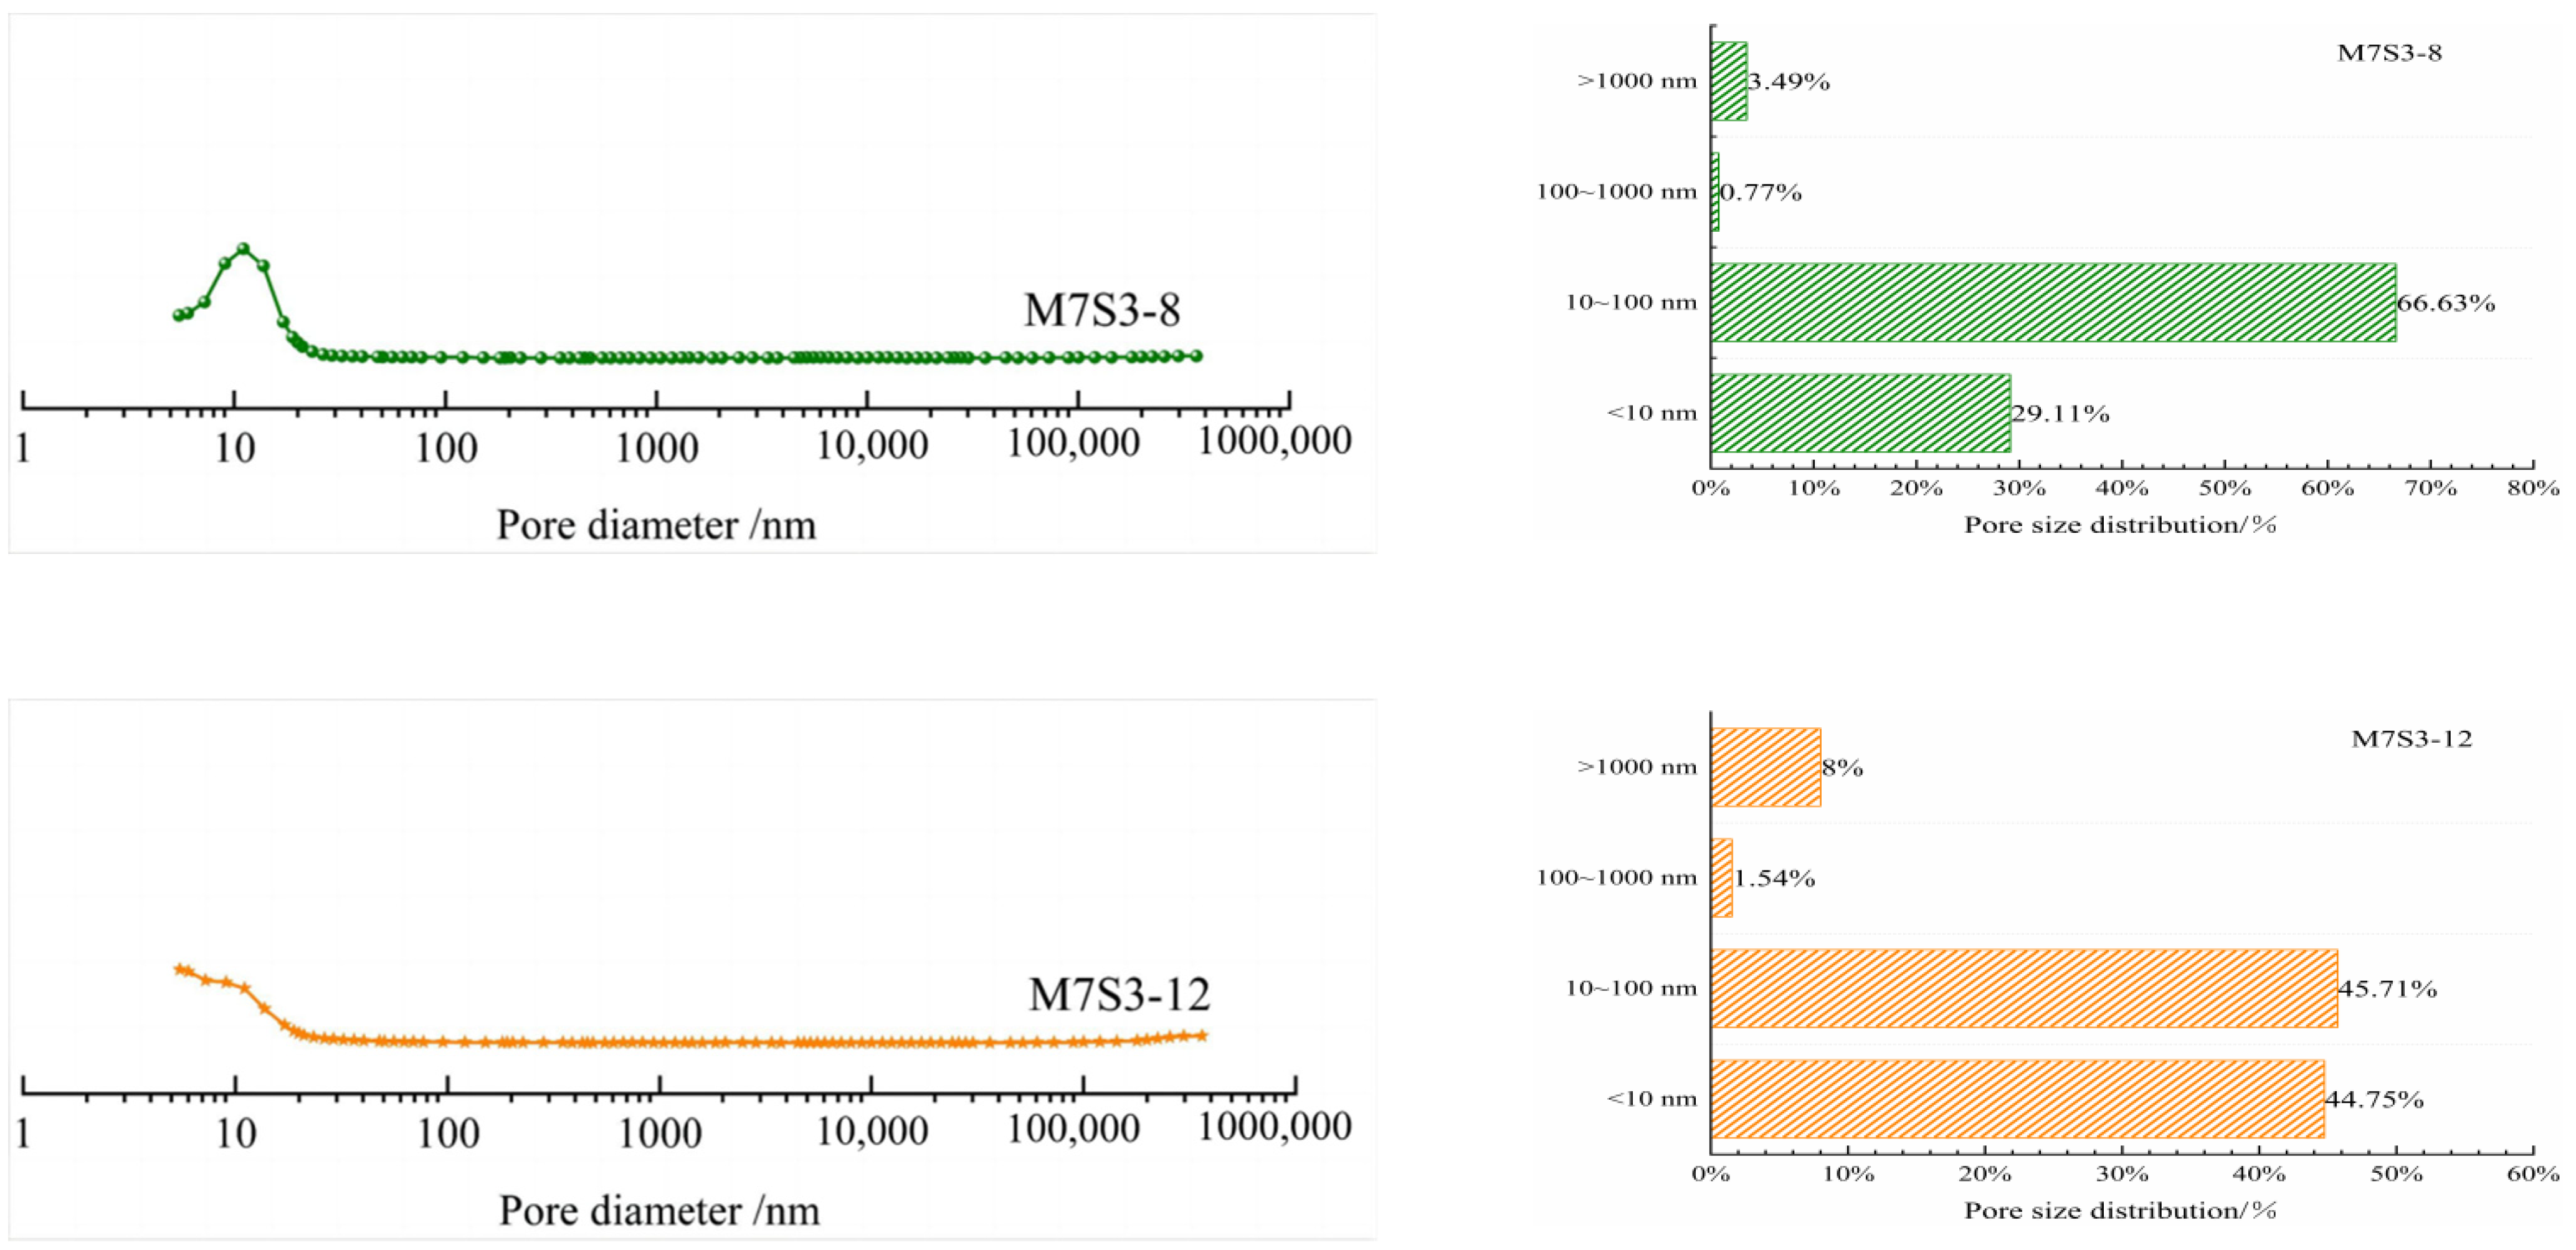
With increases in the Na
2O content, the pore size distribution curve for the AAMS composite cementitious material retained similar shapes, and the most likely pore diameter for the AAMS material was approximately 11 nm for Na
2O contents of 8% and 10%, and the most likely pore diameter was in the range of 1–10 nm for a Na
2O content of 12%. The peak value of the pore size distribution curve at approximately 10 nm decreased with increasing Na
2O content, which indicated that the highly alkaline environment favored a more complete reaction of the AAMS composite cementitious material, resulting in a denser internal structure and a more uniform pore structure distribution. As shown in
Figure 10 and
Table 4, the number of transition pores in the AAMS material decreased, and the number of gel pores increased with increasing Na
2O content, and the transition pores of the AAMS material decreased by 4.41% and 31.40% and the gel pores were larger by 13.09% and 53.59% when the Na
2O content was 8% relative to when the Na
2O contents were 10% and 12%, respectively. Similarly, the higher Na
2O content decreased the total pore volume and porosity of the AAMS material, and these results are consistent with those of Zhan et al. [
22]. This is because the highly alkaline environment promoted the dissolution and decomposition of metakaolin and slag particles, which led to refinement of the synthetic gel pores, an increase in the proportion of gel pores, and an increase in capillary tension; this generated an increase in the drying shrinkage of the AAMS materials.
3.7.2. Comparative Analysis of the Fractal Dimension of AAMS Composite Cementitious Materials
At present, there are multiple models based on MIP testing to study the fractal dimension of the pore structures of cement-based cementitious materials. The Menger sponge model, space-filling model, pore axis fractal model, and fractal model based on thermodynamic relationships are relatively mature. Among these models, the Menger sponge model is the most widely used. The Menger sponge model, space-filling model, and pore axis fractal model all weaken the pore structure into an ideal mathematical geometry when modeling and then obtain a solution for the fractal dimension. These assumptions may cause differences between the model and the actual pore structure, resulting in calculation deviations. However, the fractal model related to the thermodynamic relationship is based on the principle that an increase in the surface energy of the mercury liquid surface generated by mercury pressure is equal to the work done by the external force on the mercury, and the assumption reached for the pore structure while solving for the fractal dimension is closer to the actual situation, so it may be more suitable than other models for calculating the fractal dimension of the concrete pore fractal dimension of the structure. However, most of the current models for fractal dimensions were developed for studying cement-based materials, and few of them were generated for studying alkali-activated cementitious materials [
26,
57,
58,
59]. Therefore, in this study, the Menger sponge model and fractal model based on thermodynamic relationships were used to compare and analyze the fractal dimension of AAMS composite cementitious materials, and the relationships between fractal dimension and porosity, total pore area, average pore size, median pore size, compressive strength, and drying shrinkage for AAMS composite cementitious materials were considered.
The principle of the Menger sponge model is as follows [
60]: a cube m with the original side length of
R is divided equally, and a small cube with the side length of
R/m is newly generated. After removing
n of them according to a certain rule, the number of remaining cubes is
m3 –
n. The pore fractal dimension
Df after
k iterations of this rule satisfies Equation (2):
where
V is the amount of mercury in the pore, in mL·g
−1, and
D is the pore diameter, in nm.
The principle of the fractal model based on the thermodynamic relationship is as follows [
59]: when measuring the relationship between pore volume and pore diameter for a porous substance by using the mercury pressure method, the work done on the mercury by the external environment is equal to the increase in surface energy of the mercury liquid entering the pore, so the pressure
p applied to the mercury and the amount of incoming mercury
V satisfy Equation (3).
where
σ is the surface tension of the mercury, in N·m
−1;
θ is the contact angle between the mercury and the sample, in degrees;
S is the surface area of the substance to be measured, in m
2; and
V is the hole volume of the object to be measured, in m
3.
Through dimensional analysis, the fractal scale of the pore surface area
S of a porous material can be correlated with the pore diameter
D and pore volume
V to obtain an expression for the fractal model. For the mercury injection stage, Equation (3) can be approximated as a discrete form, as shown in Equation (4):
where
is the average pressure of the
i-th mercury injection, in Pa; ∆
Vi is the volume of the
i-th mercury injection, in m
3;
n is the number of times the pressurized mercury was injected;
Dn is the diameter of the pore corresponding to the
n-th mercury injection, in m;
V is the cumulative volume of the
n-th pressurized mercury injection, in m
3; and
C is a constant.
Equations (2) and (5) indicate that calculation of the fractal dimension for the pore structure based on the MIP test can be transformed into the problem of studying the slope of a logarithmic function with respect to the pore volume, pore diameter, and incoming mercury pressure.
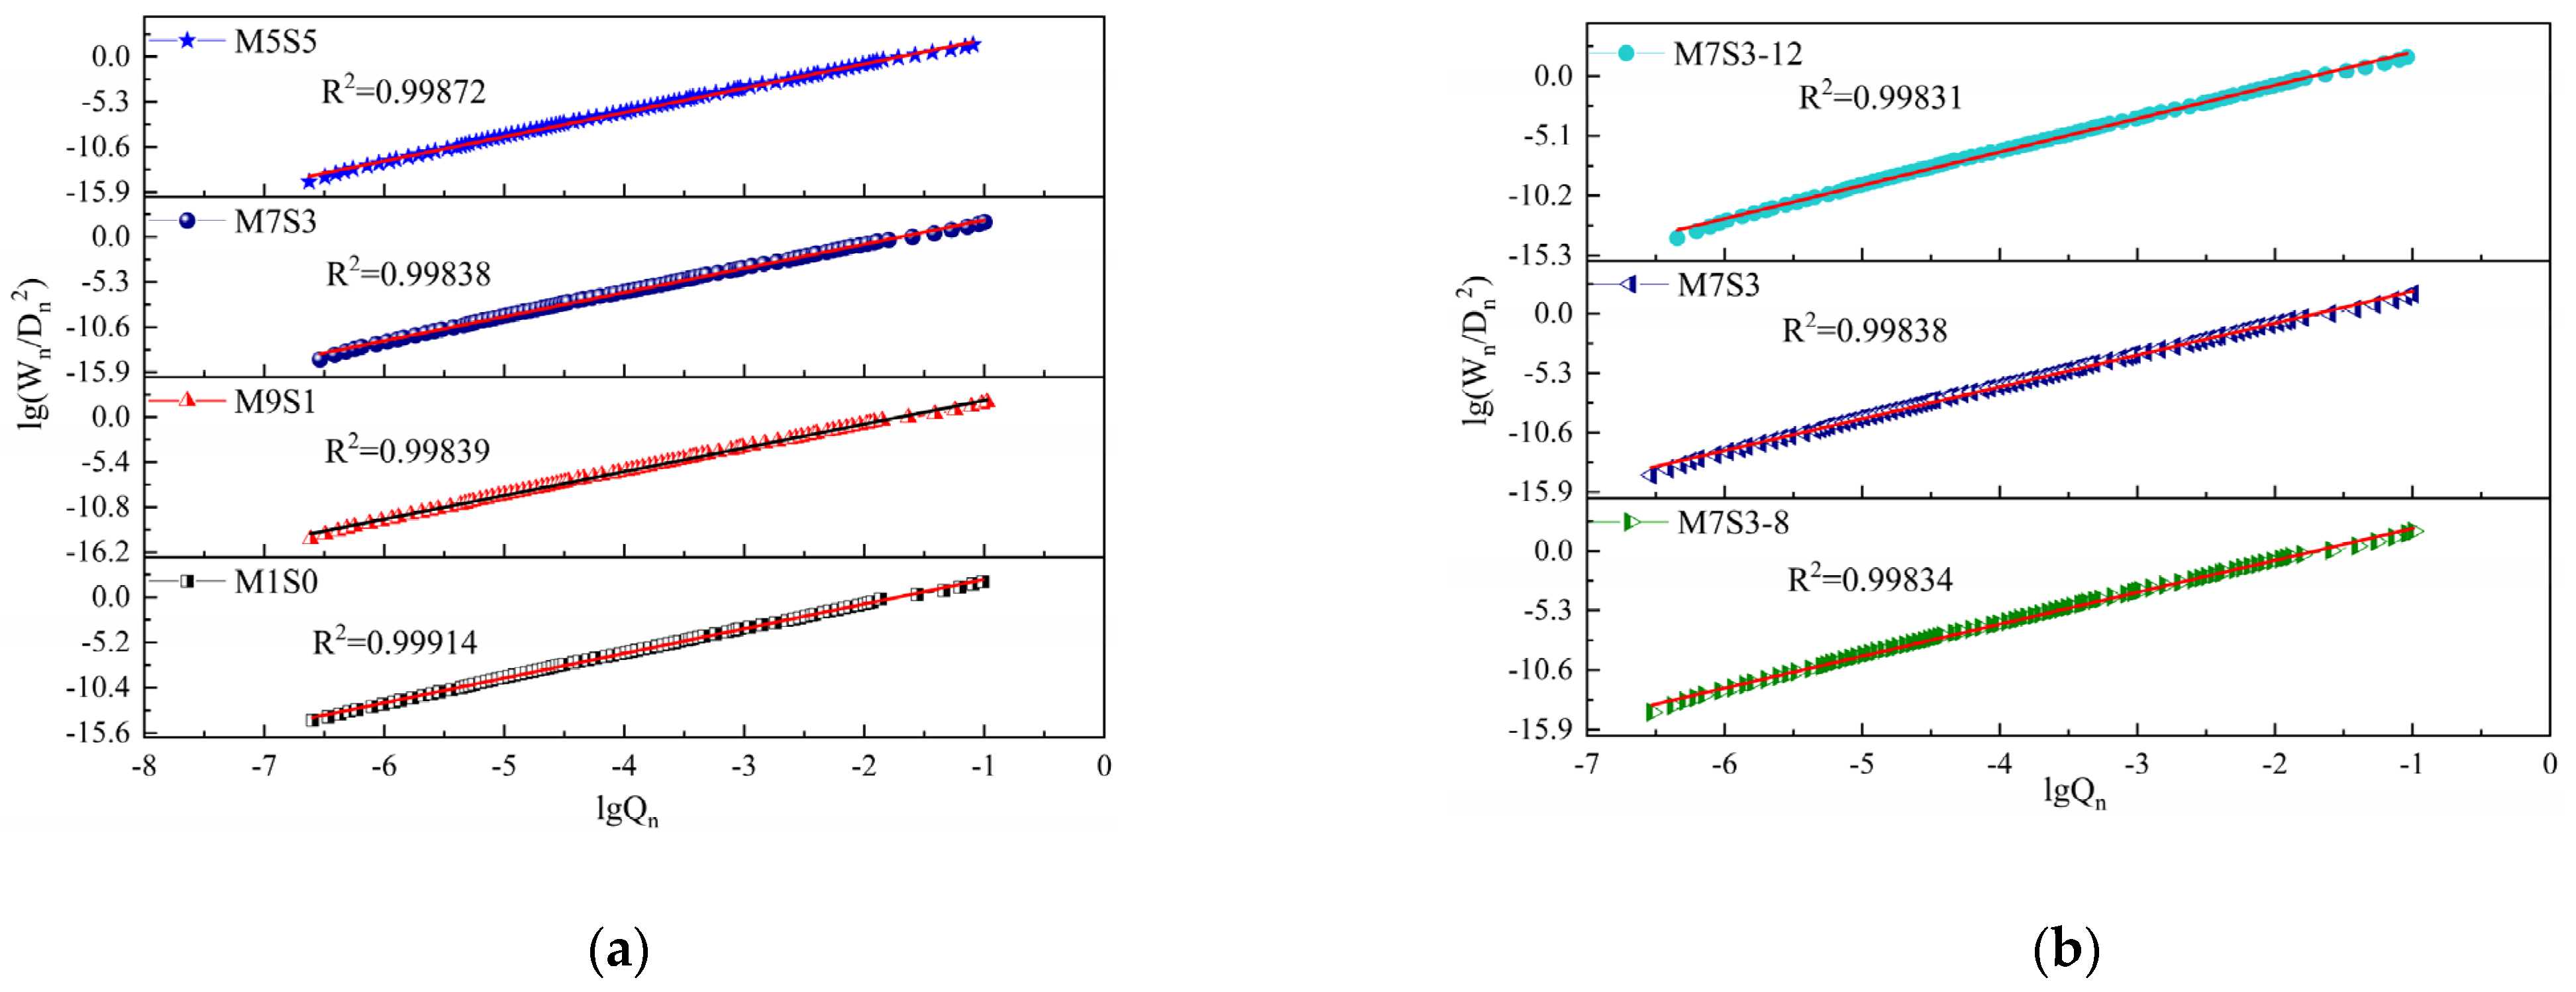
The pore structure scatter data obtained by the two mathematical models used in calculating the fractal dimension are shown in
Figure 11 and
Figure 12.
Figure 11 and
Figure 12 show that when calculated based on the sponge model, the M1S0, M9S1, and M1S1 groups showed close linear relationships (the square of the correlation coefficient R
2 > 0.9), and the correlation coefficients of M7S3, M7S3-8, and M7S3-12 were all less than 0.9, which showed that the result of the sponge model was relatively discrete. The significance of the correlation coefficient value as used in this paper is referred to in “MedCalc statistical analysis method and application” [
61], as shown in
Table 5. The correlation coefficient R
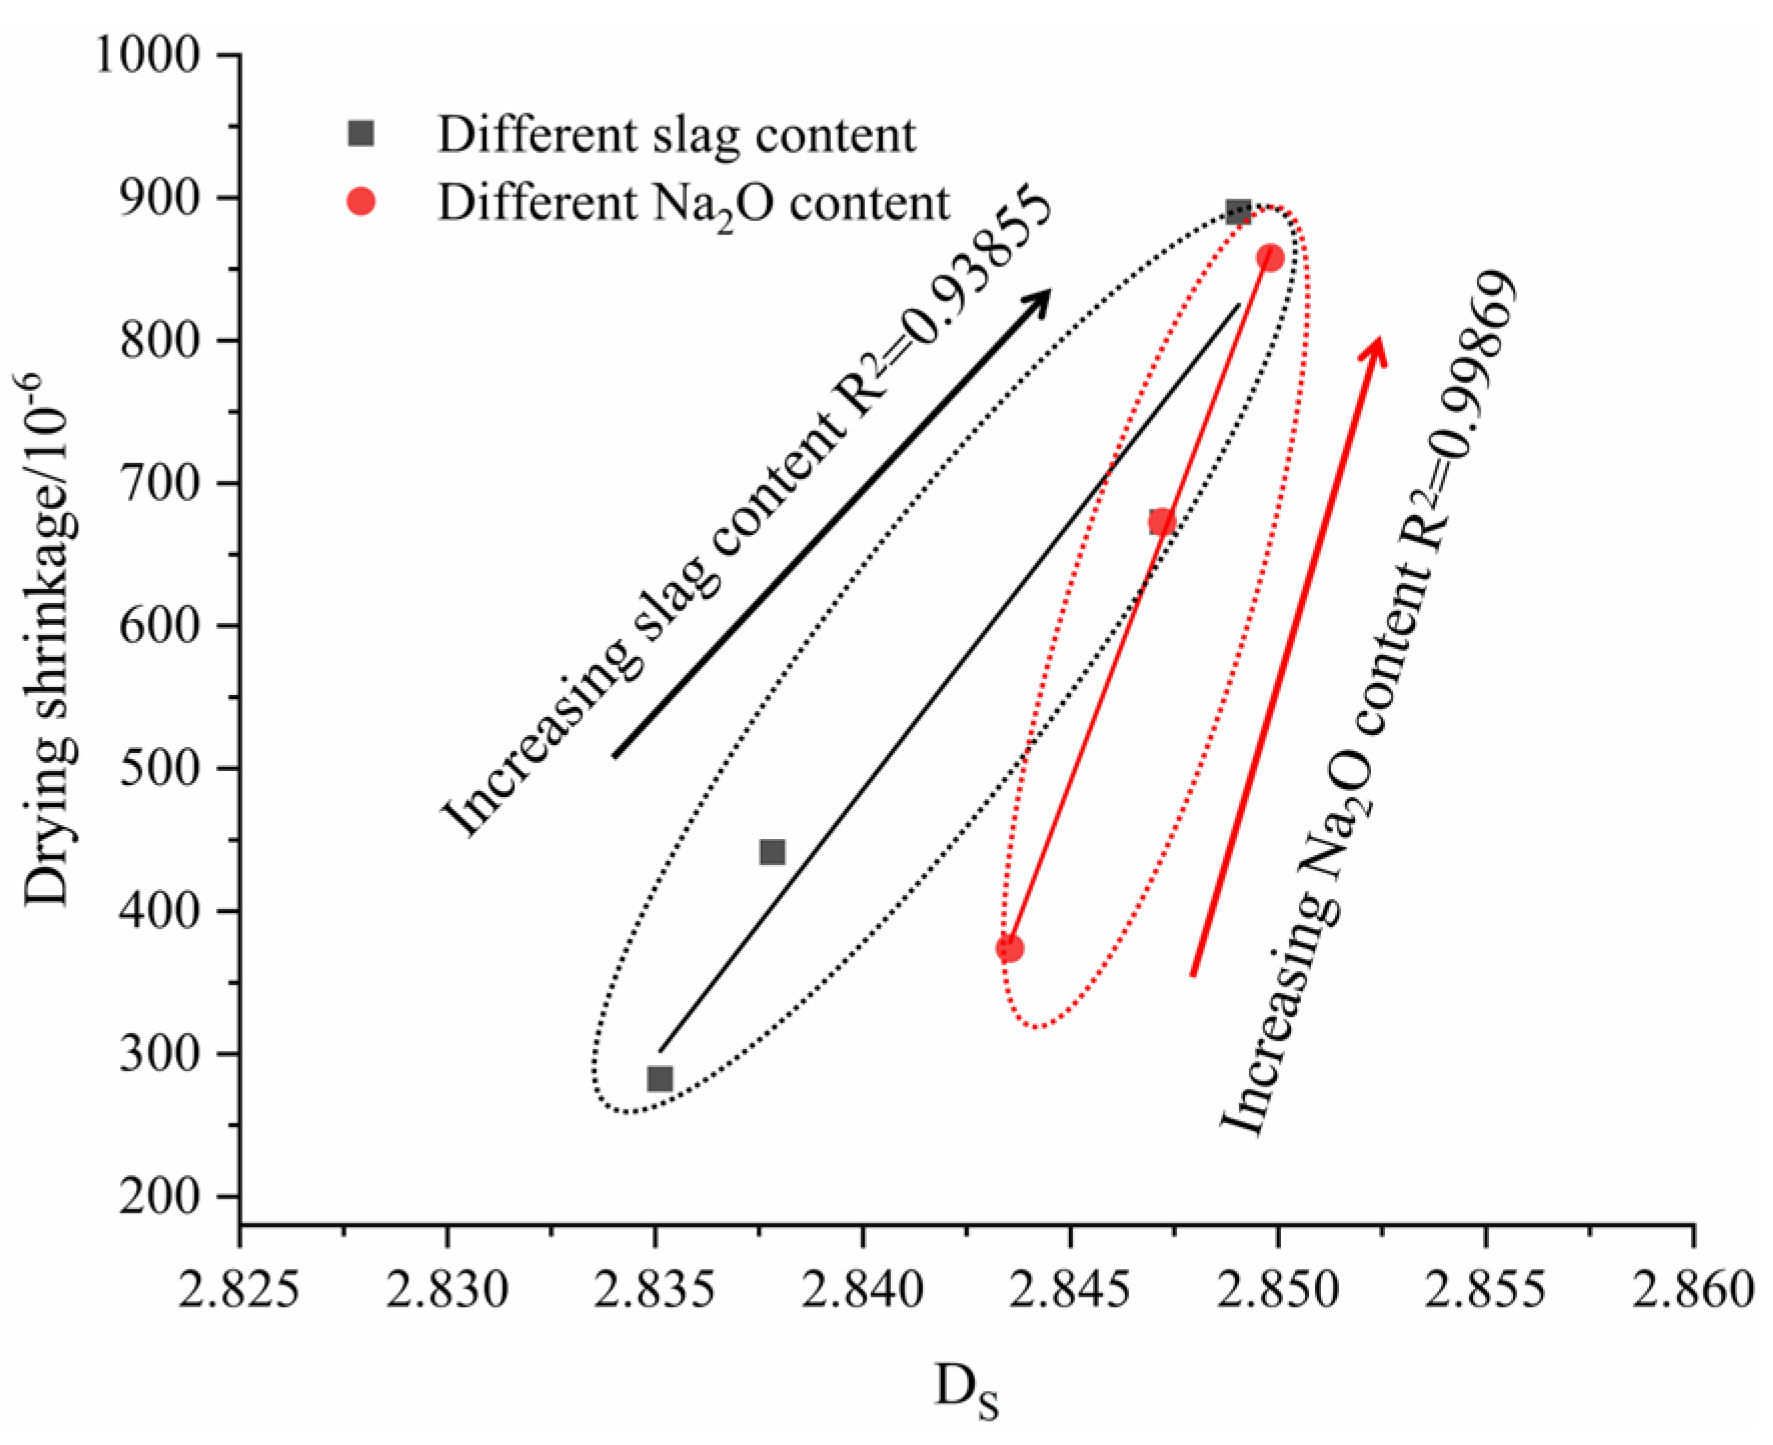
2 of the pore structure calculated by the thermodynamic model was above 0.99, which meant that the fractal model based on the thermodynamic relationship reflected the pore size distribution over the whole pore size measurement range.
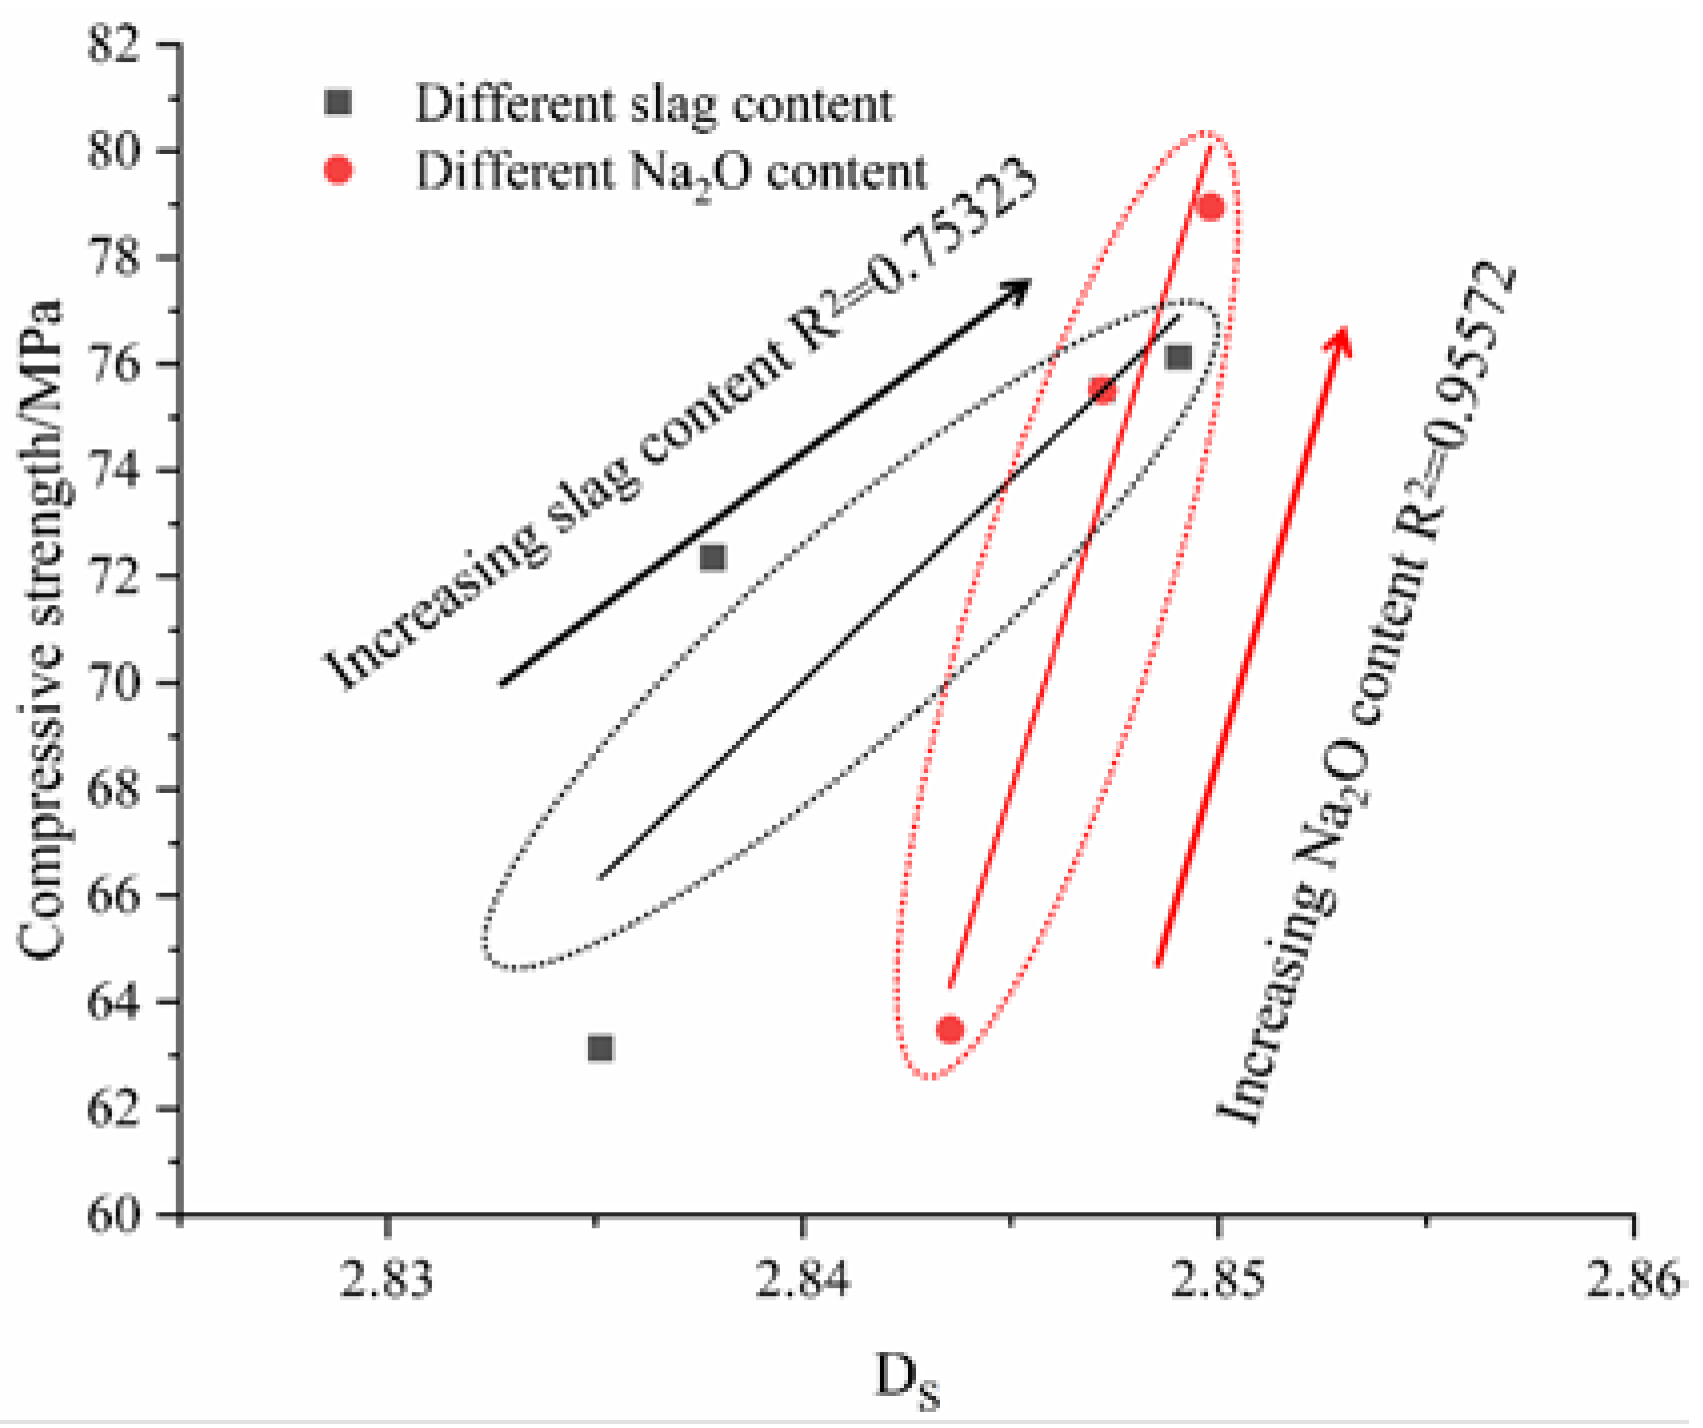
Table 6 shows that the conclusions reached with the two models were basically the same; that is, with increasing slag content and Na
2O content, the fractal dimension of the AAMS composite cementitious material increased. However, the fractal dimension of the pore structure of the AAMS material in the fractal model based on the thermodynamic relationship was between 2.83 and 2.85, while the values calculated with the Menger sponge model were between 3.2 and 3.4. From the basic concepts of topology and fractal theory [
62], the fractal dimension of the specimen was greater than 2.0, which indicated that the pore distribution pattern of the specimen was irregular and complex and could not be described by Euclidean geometry. The larger the fractal dimension, the more complex the pores, which was indicated by the high percentage of gel pores (<10 nm) and transition pores (10–100 nm) in the pore size distribution (see
Figure 10). Considering that the fractal dimensions of the pore structures of cementitious materials in general are between 2.0 and 3.0, it can be concluded that the fractal model based on the thermodynamic relationship is better; therefore, in the subsequent study, the fractal model based on the thermodynamic relationship was chosen for further discussion.
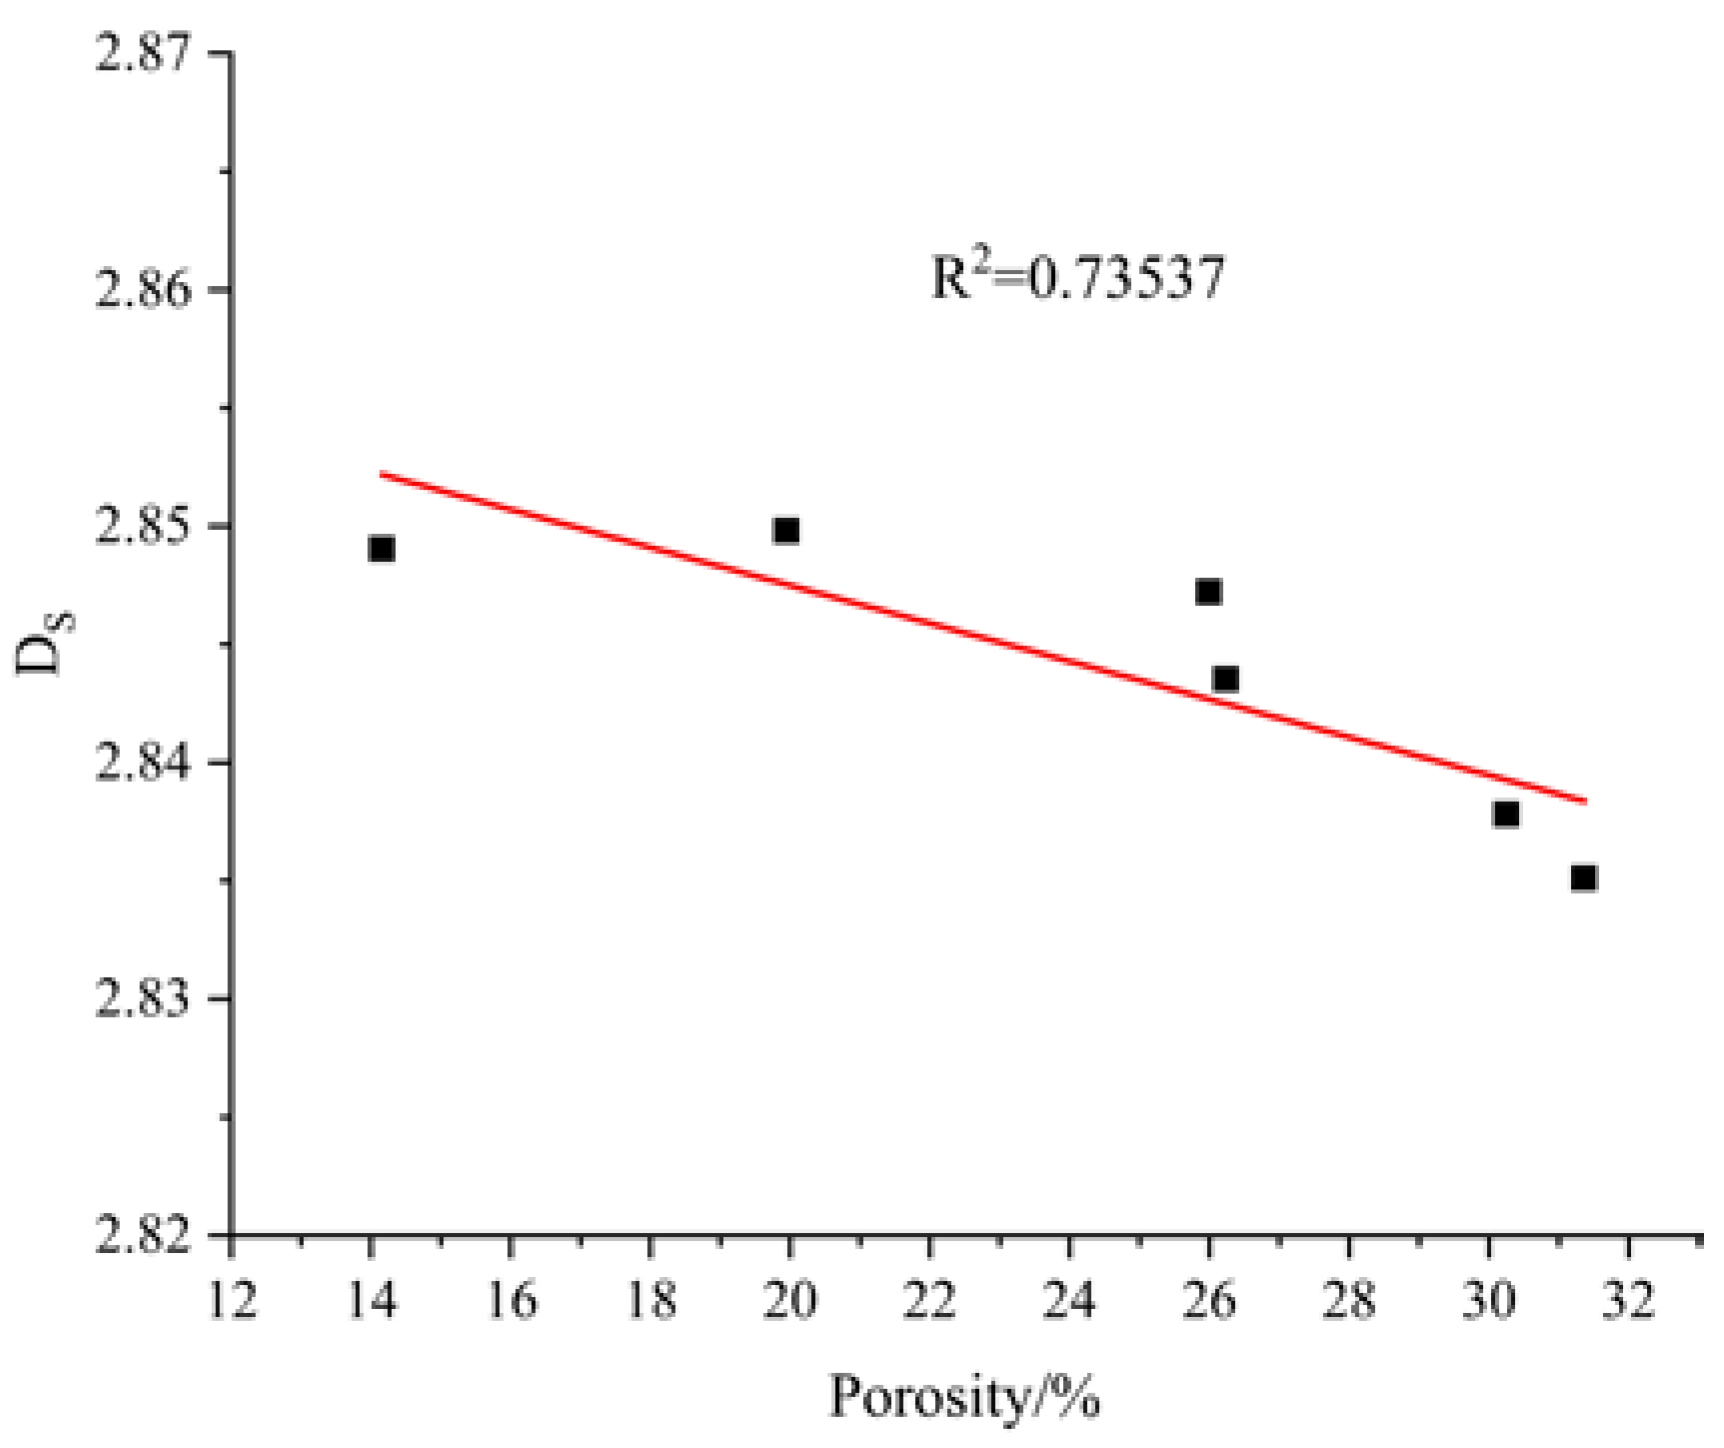
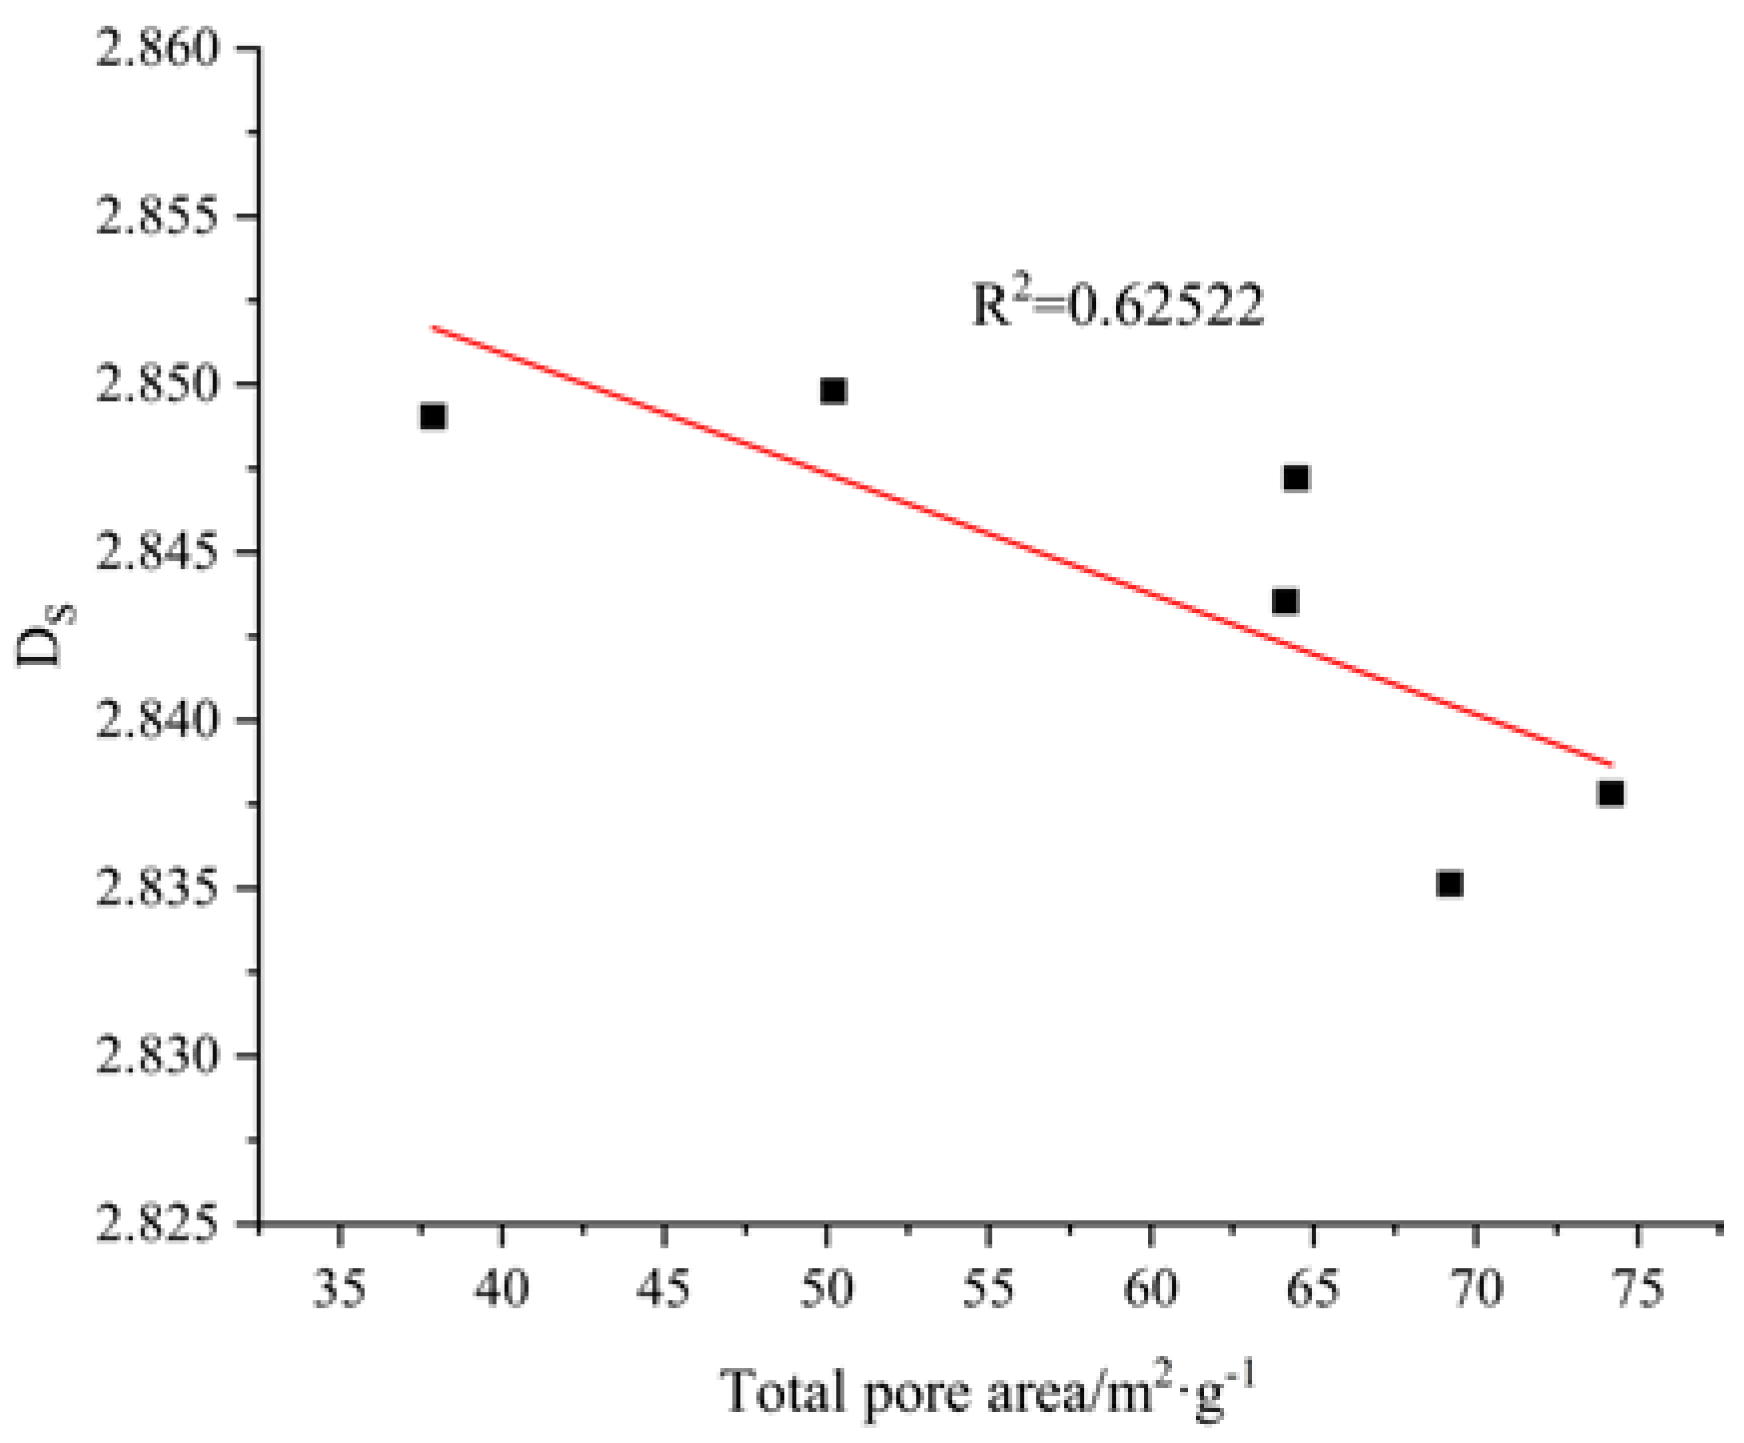
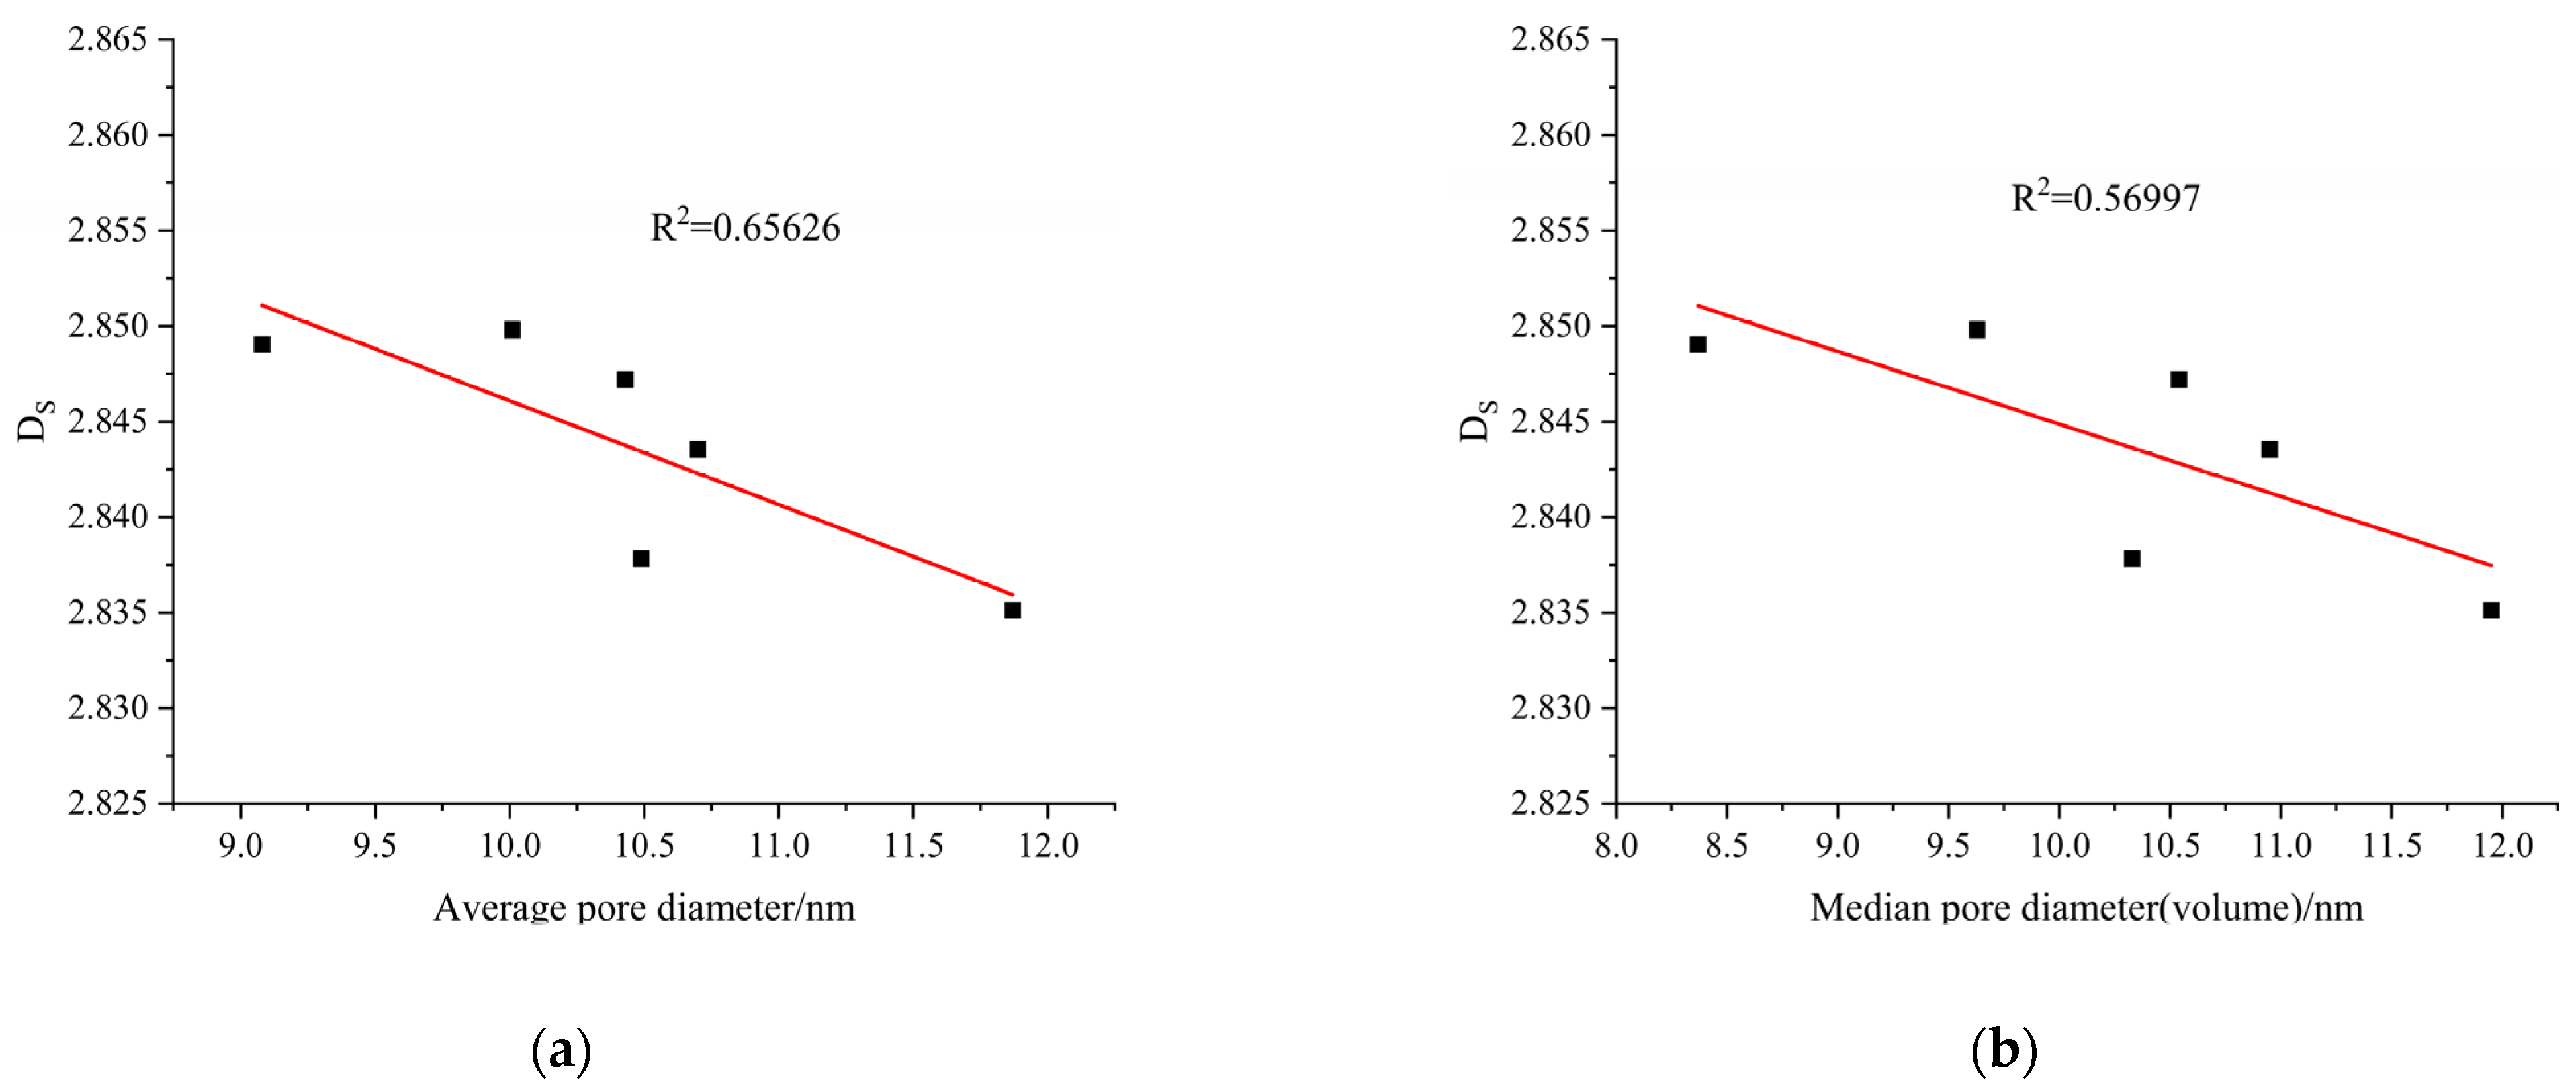
In summary, incorporation of the slag powder and the increase in Na2O content improved the pore structures of the AAMS composite cementitious materials but also made the pore structure complex, so the fractal dimension increased.


