
The Aging Performance of PVDF in Acid Oil and Gas Medium

Abstract
:1. Introduction
2. Experimental
2.1. Sample Preparation
2.2. Test Process
2.3. Performance Test and Characterization
2.3.1. Weight Change
2.3.2. Macromechanical Performance
2.3.3. Thermal Performance Analysis
2.3.4. Composition Analysis
2.3.5. Microstructure Characterization
3. Results and Discussion
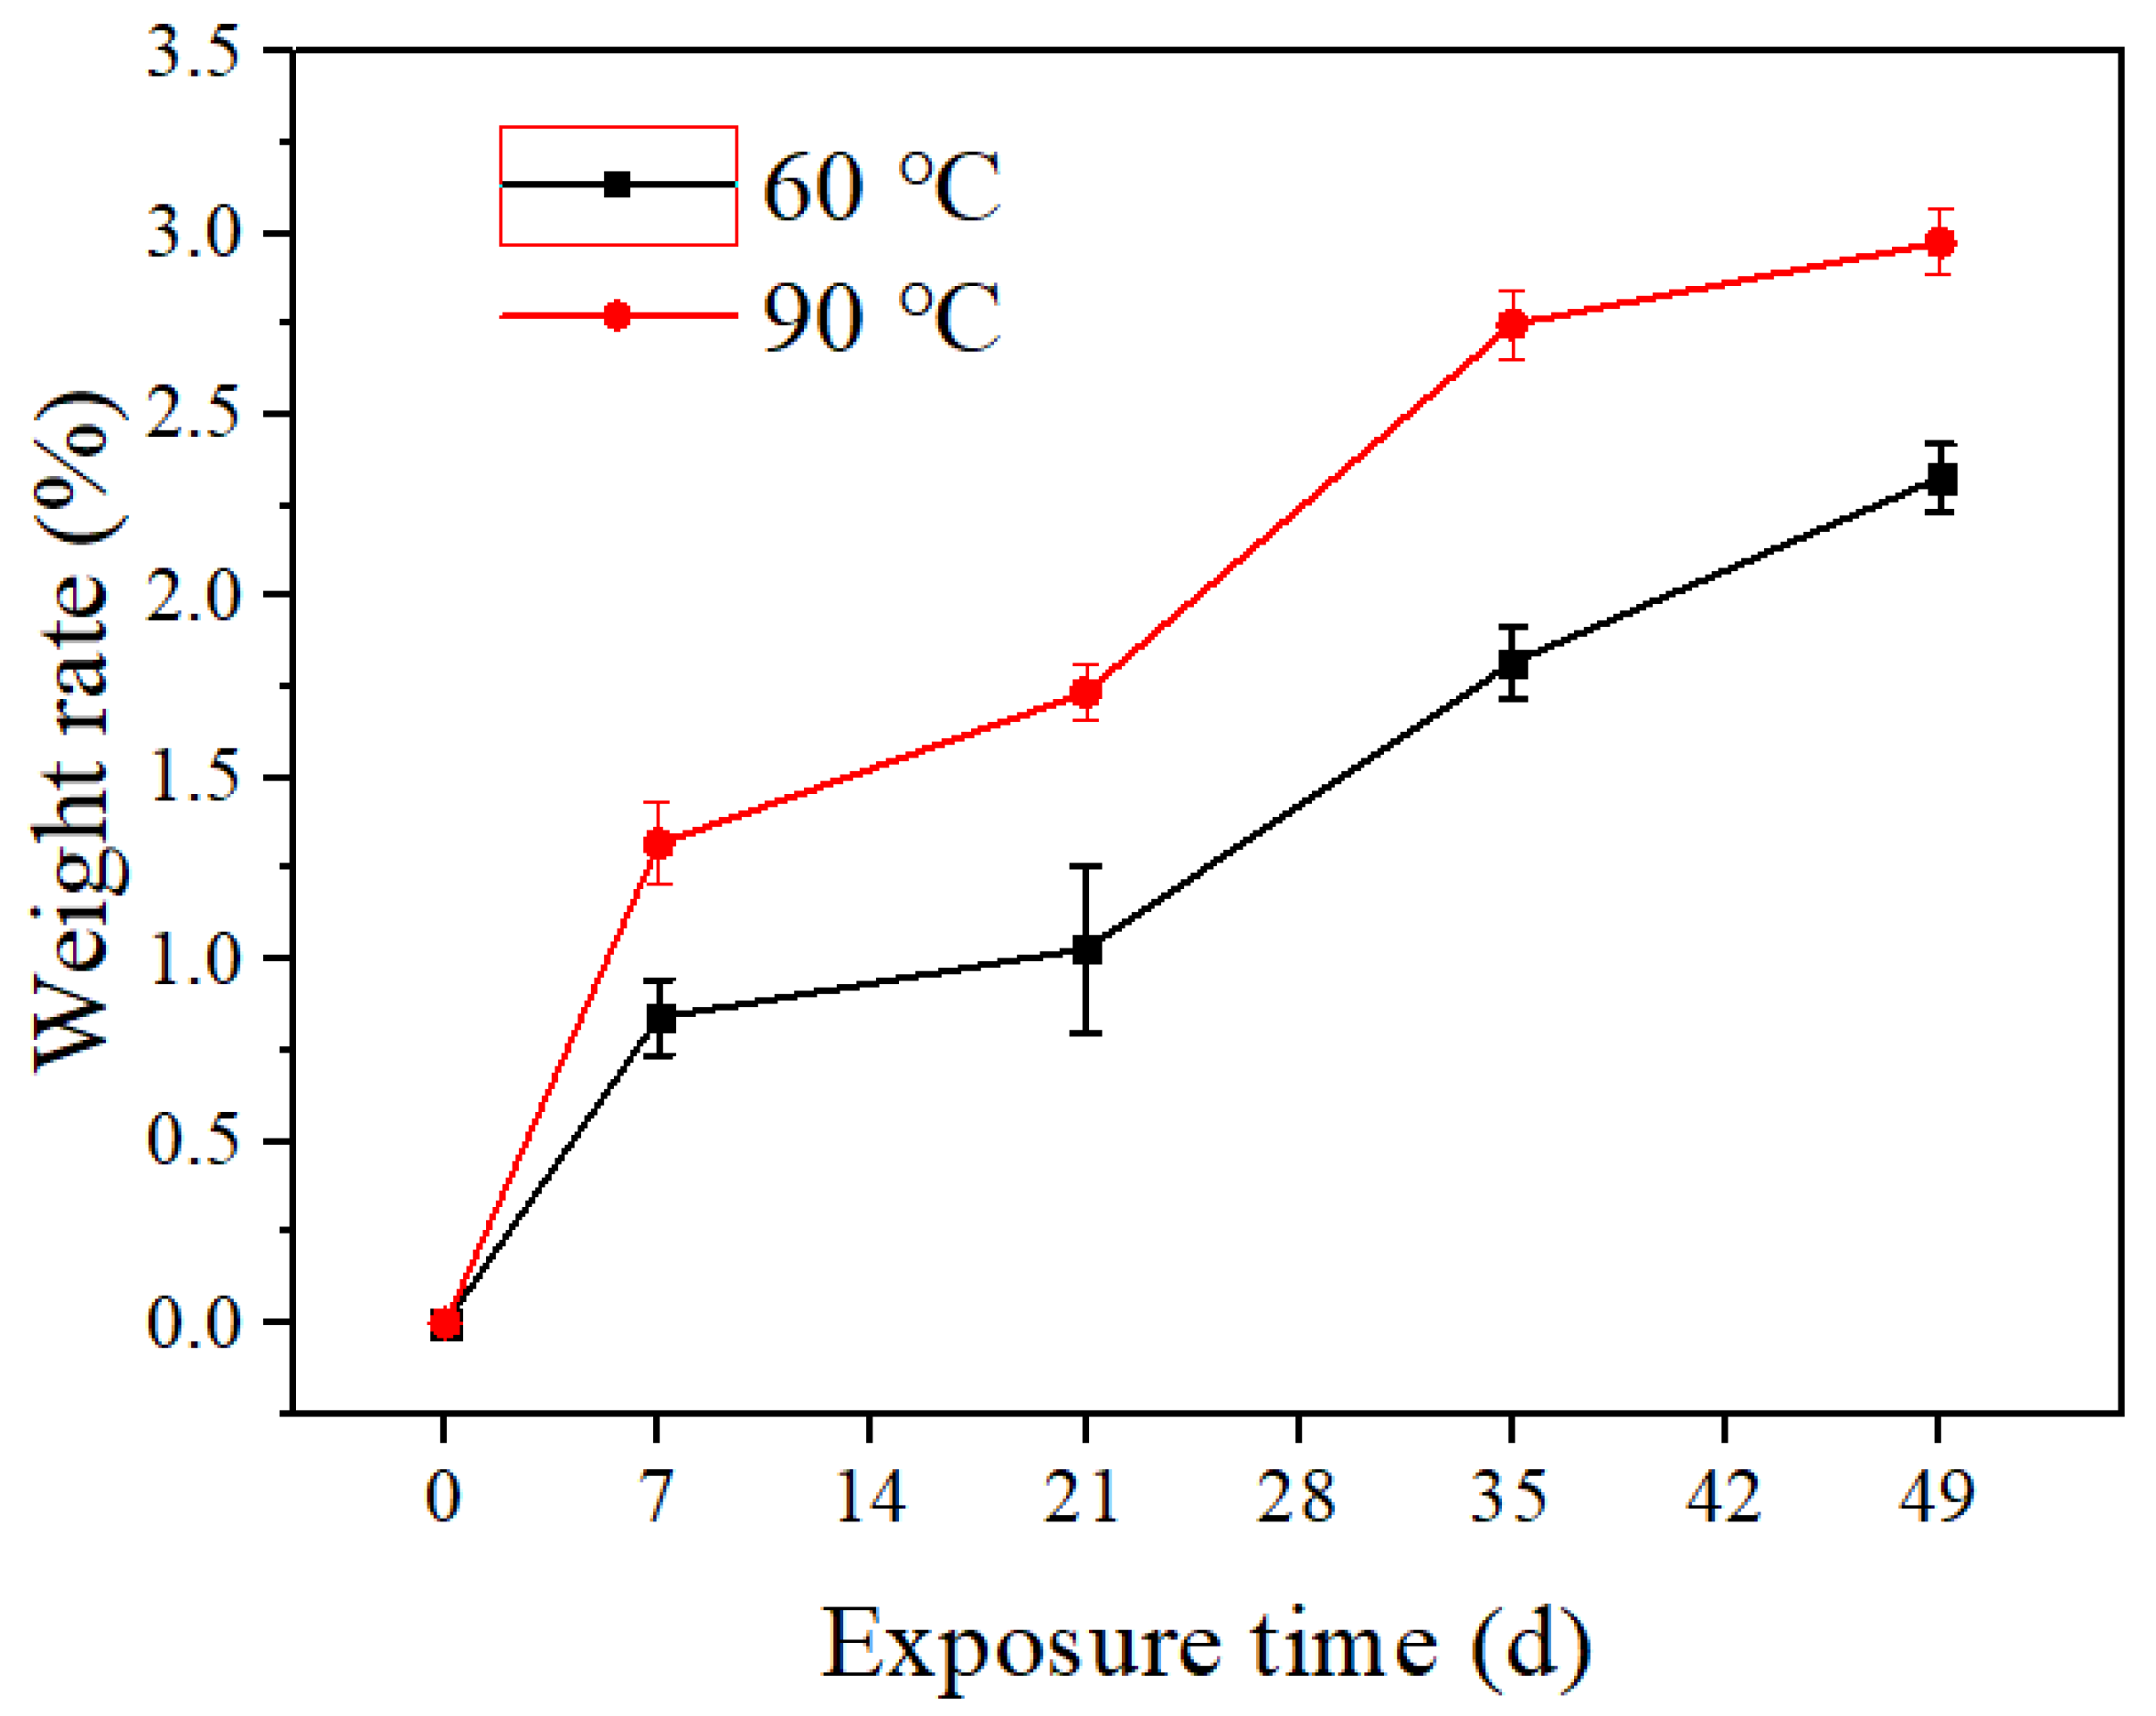
3.1. Weight Change
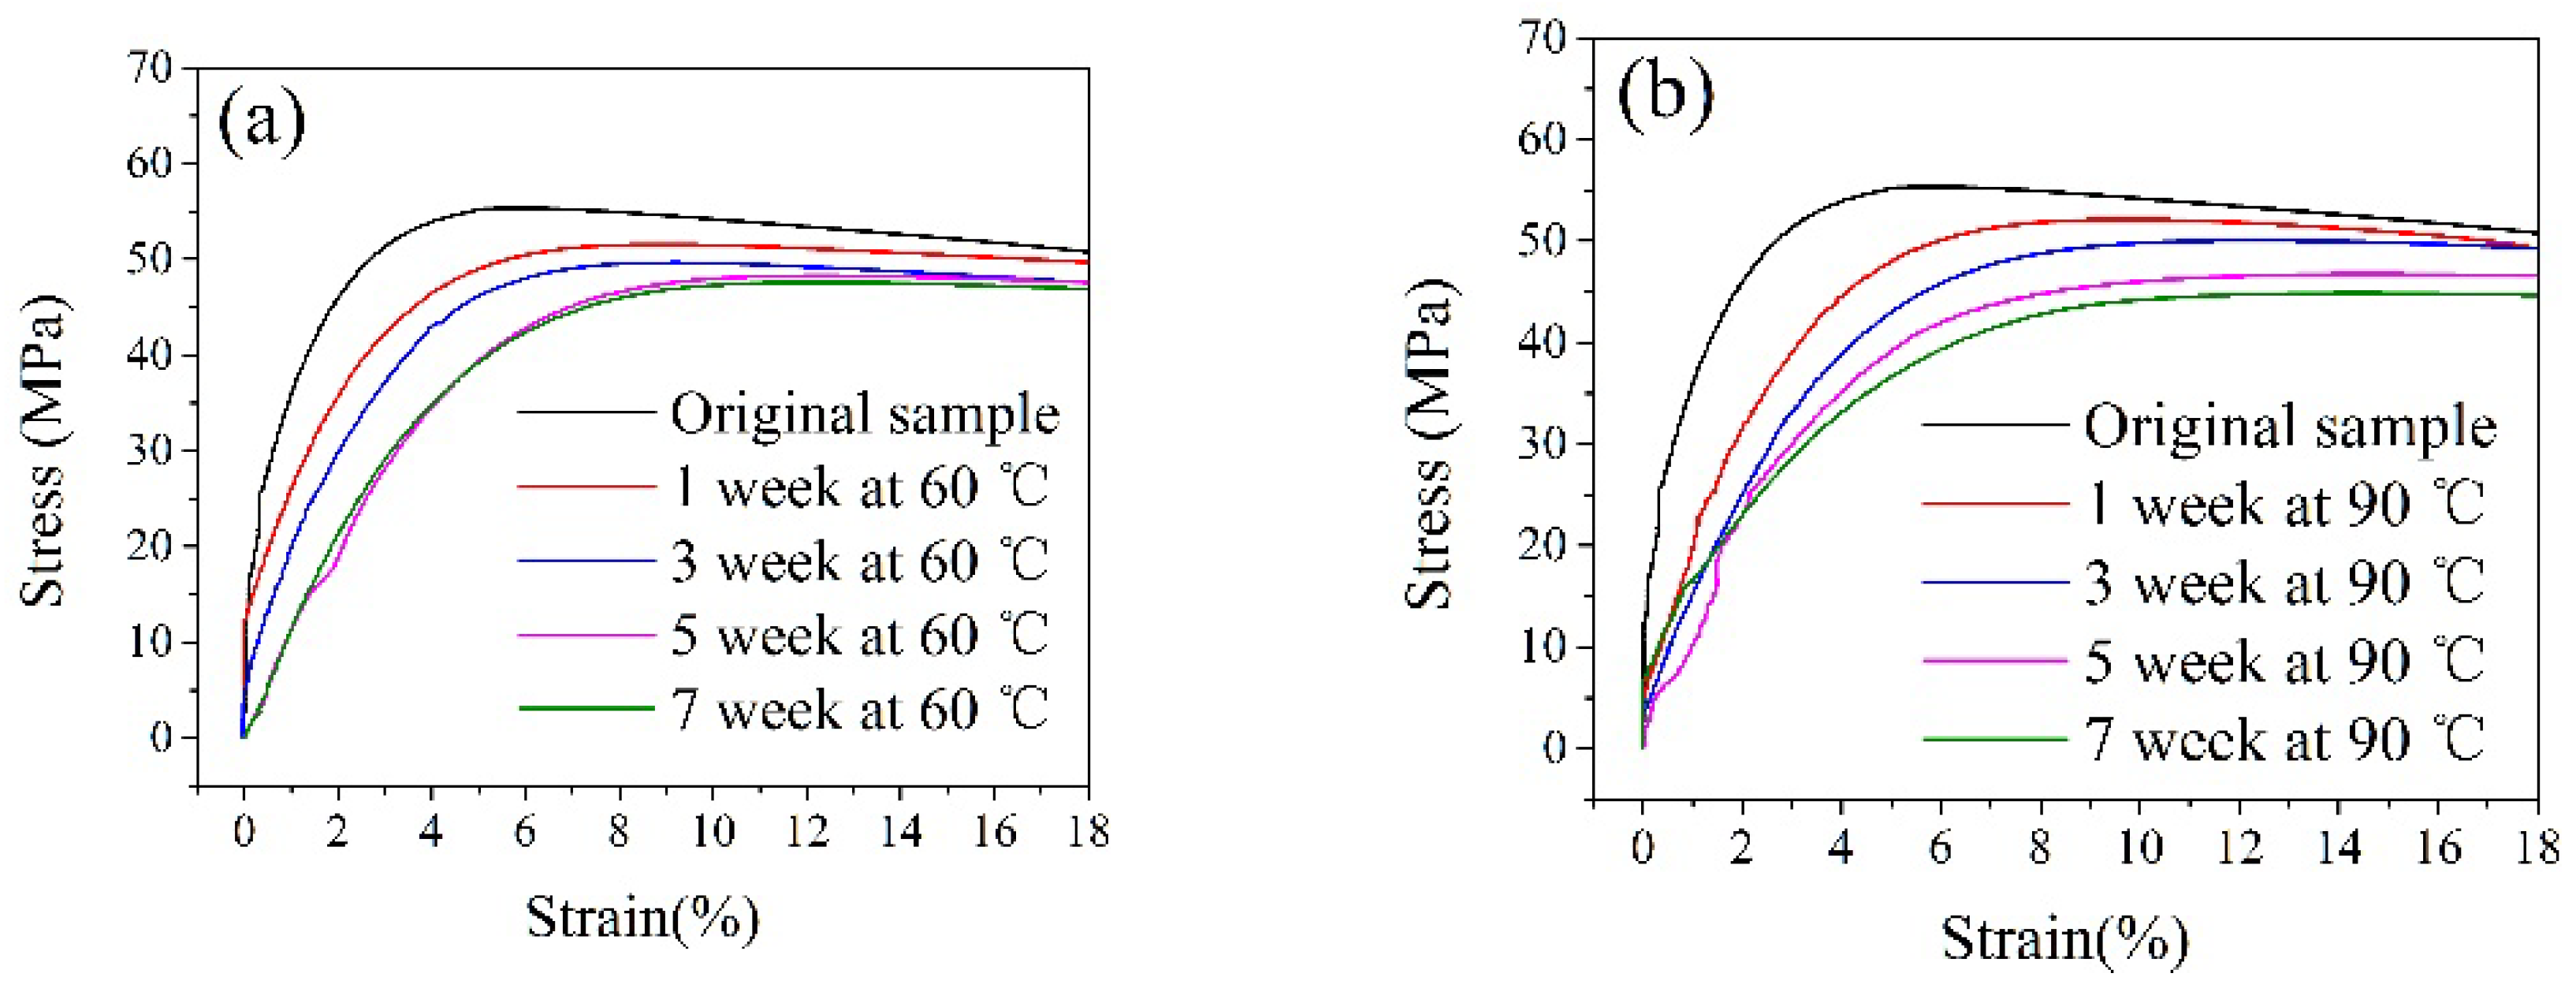
3.2. Macromechanical Performance
3.3. Thermal Performance Analysis
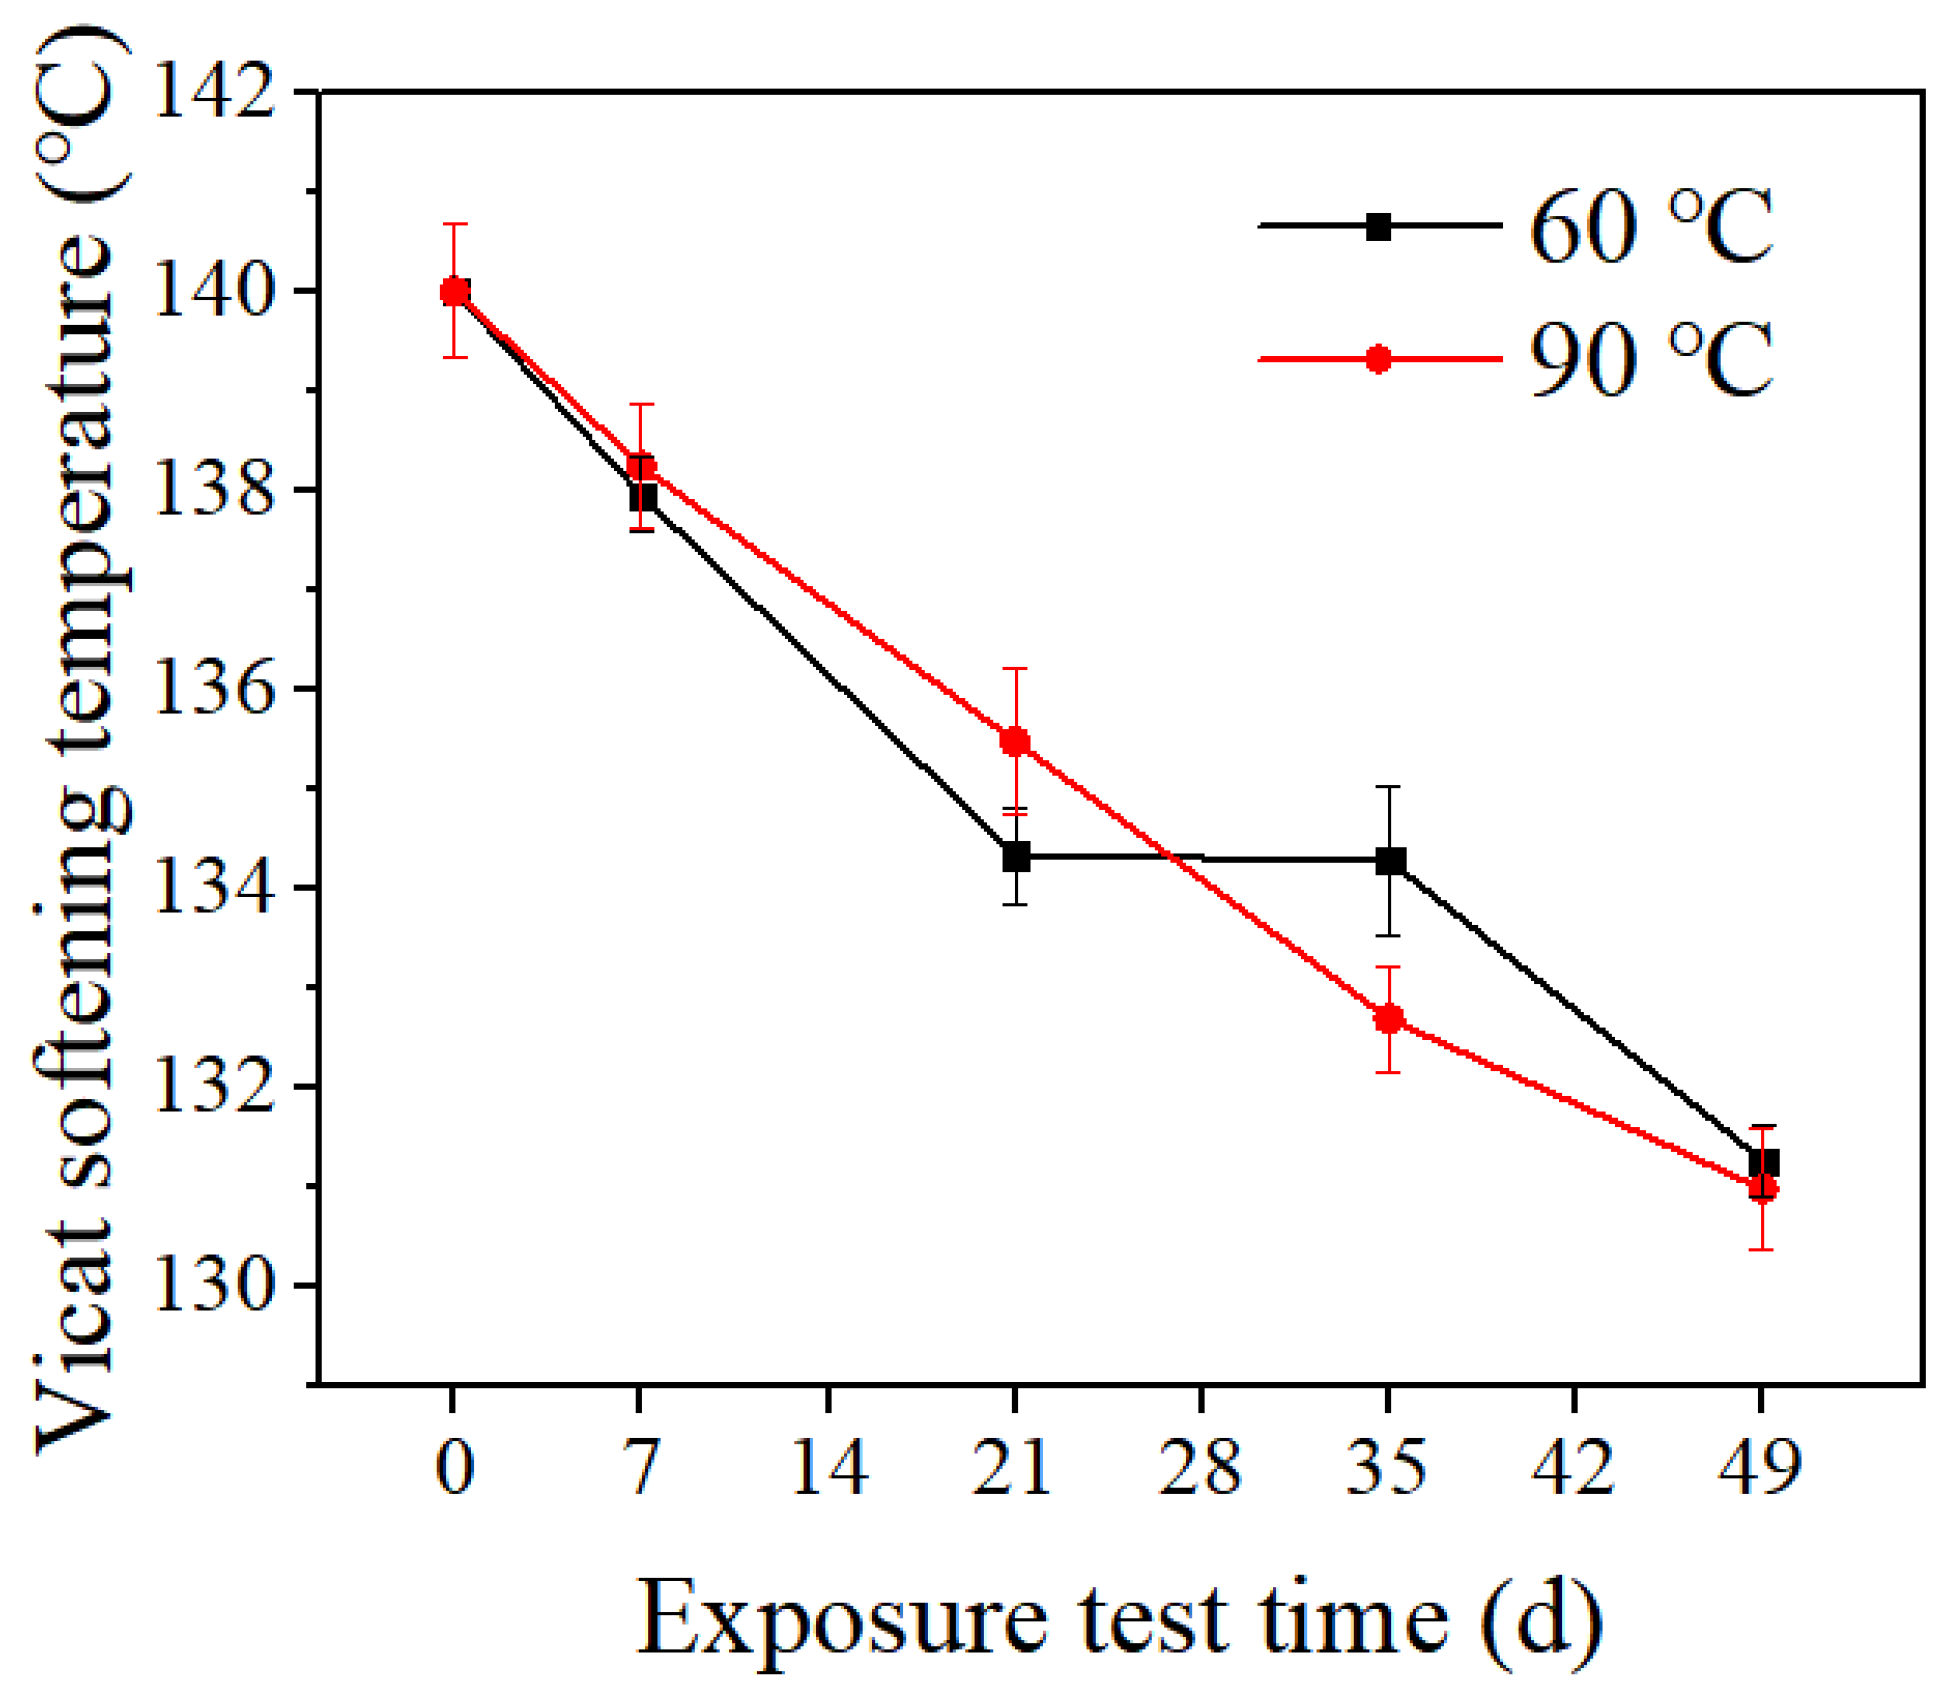
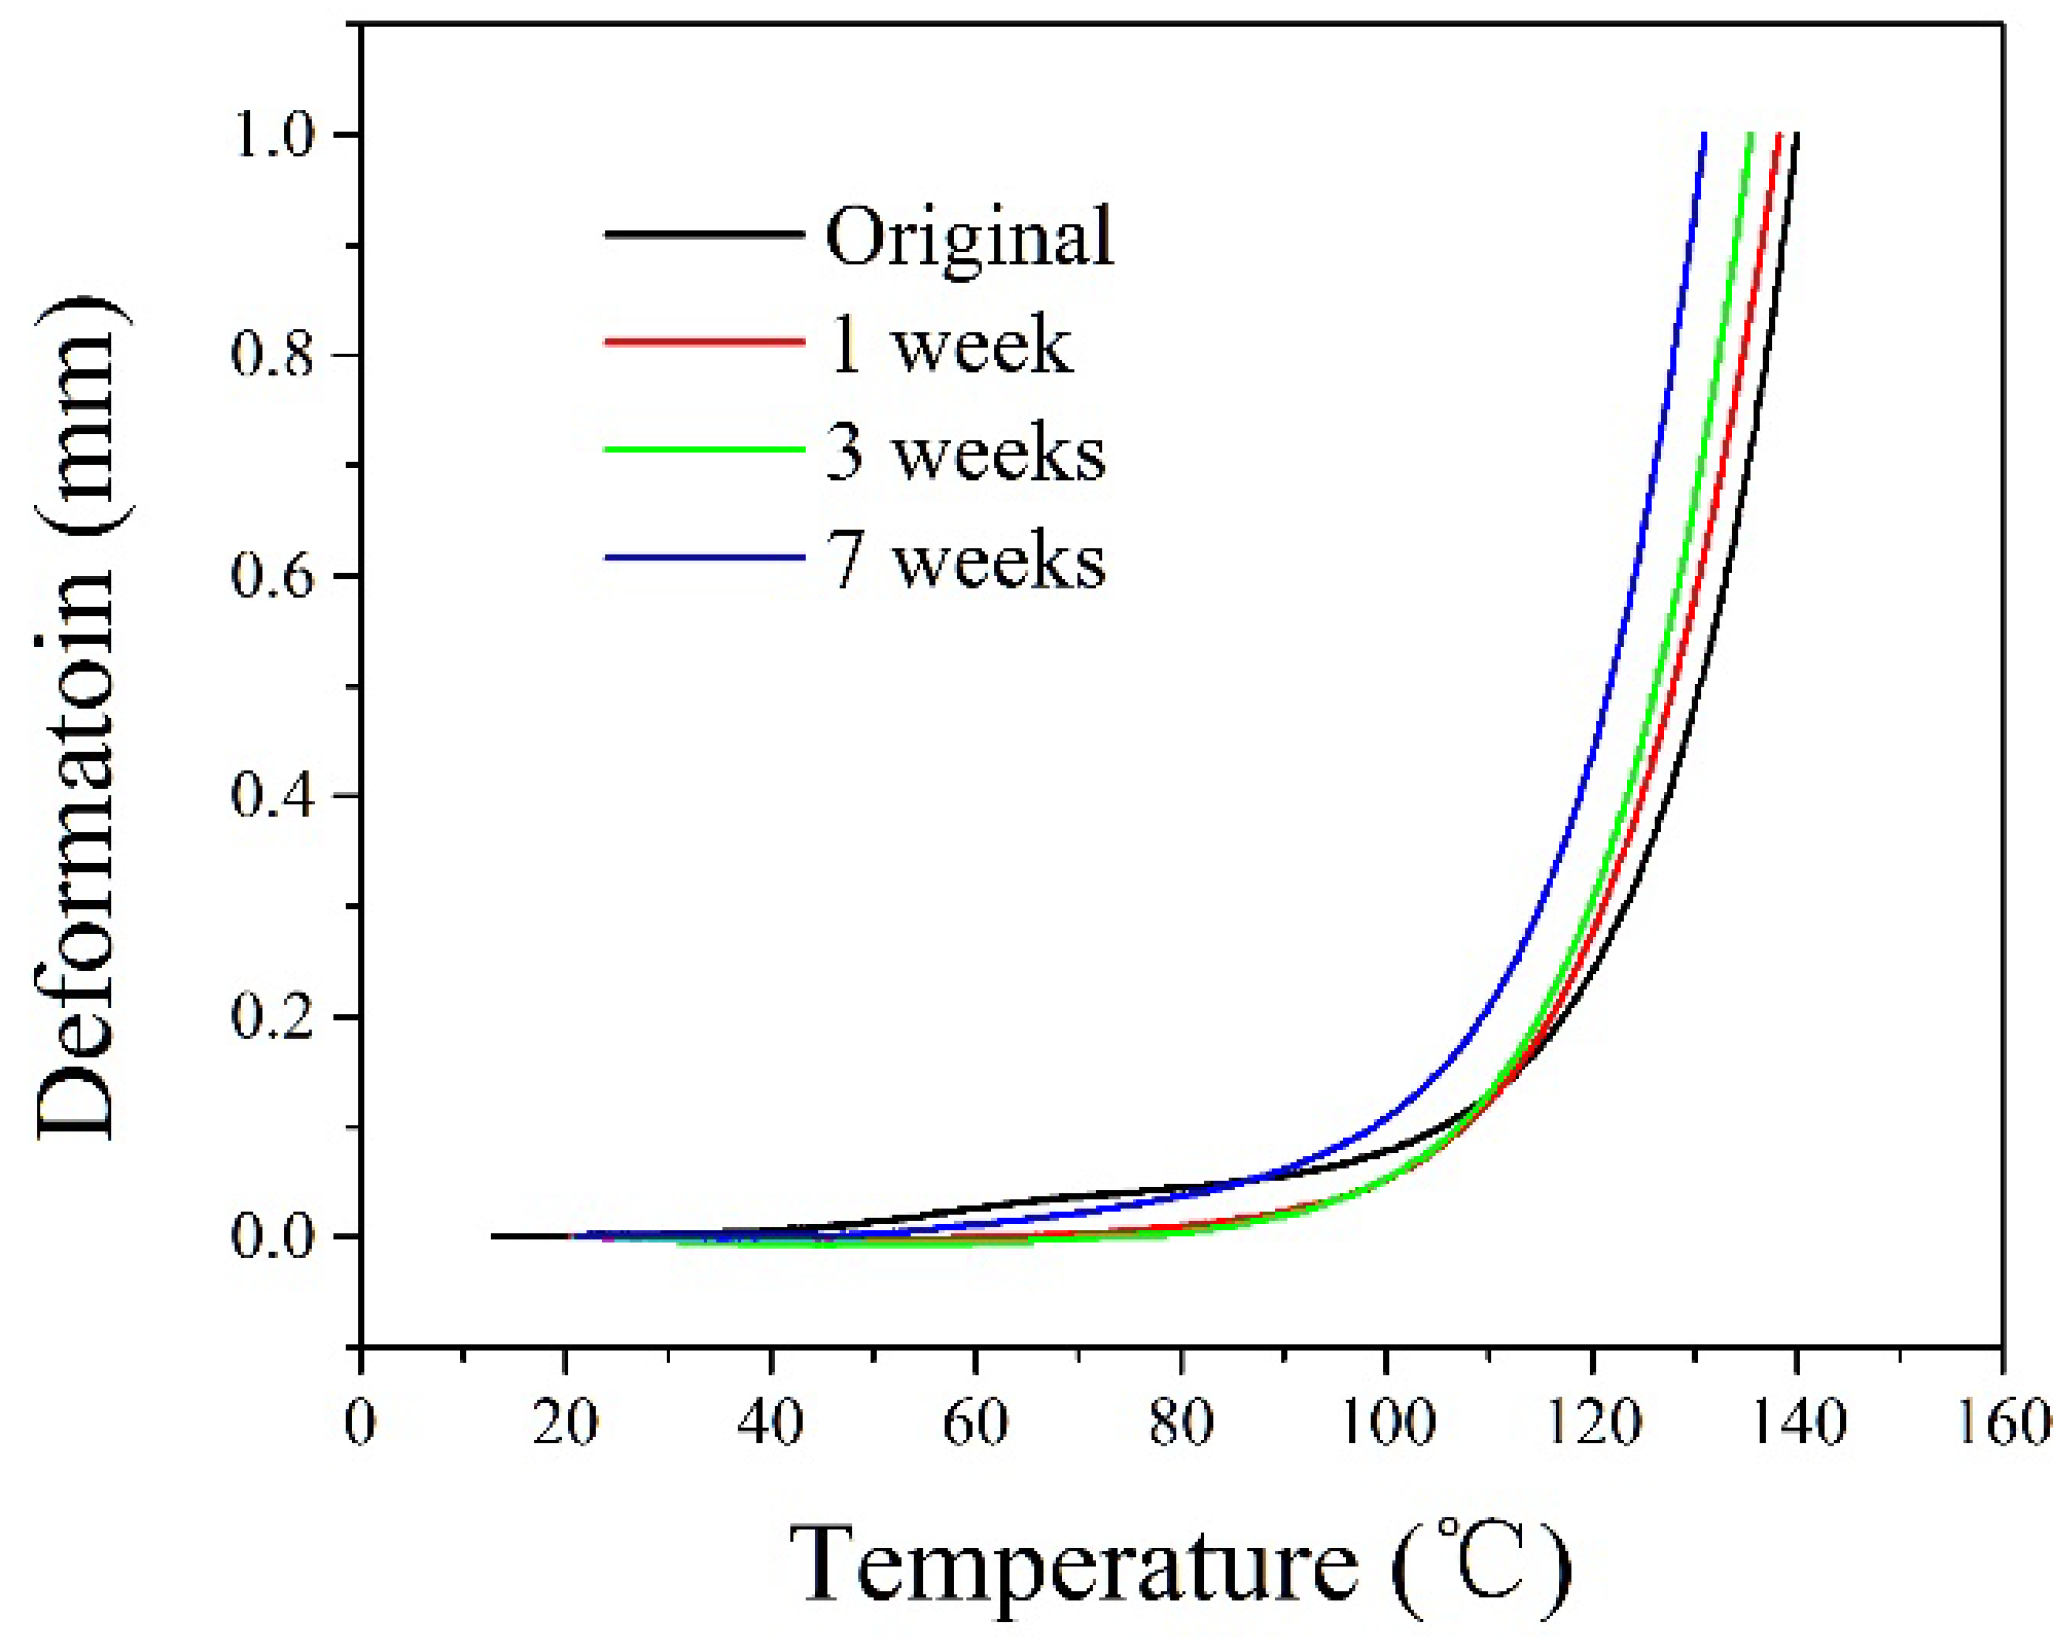
3.3.1. Vicat Softening Temperature
3.3.2. Melting and Crystallization Curve
3.4. Composition Analysis
3.5. Microstructure Characterization
3.6. Comprehensive Analysis
4. Conclusions
Author Contributions
Funding
Institutional Review Board Statement
Data Availability Statement
Acknowledgments
Conflicts of Interest
References
- Miao, J.; Yuan, J.; Han, Y.; Xu, X.; Li, L.; Wang, K. Corrosion Behavior of P110 low alloy steel in the CO2-saturated Simulated Oilfield Formation Water with Element Sulfur Addition. Rare Met. Mater. Eng. 2018, 47, 1965–1972. [Google Scholar]
- Qi, G.; Wu, Y.; Qi, D.; Wei, B.; Li, H.; Ding, N.; Cai, X. Experimental study on the thermostable property of aramid fiber reinforced PE-RT pipes. Nat. Gas Ind. B 2015, 2, 461–466. [Google Scholar] [CrossRef] [Green Version]
- Qi, D.; Li, H.; Cai, X.; Ding, N.; Zhang, S.; Yan, M. Application and qualification of reinforced thermoplastic pipes in Chinese oilfields. In Proceedings of the ICPTT, Beijing, China, 26–29 October 2011. [Google Scholar]
- Saharudin, M.S.; Atif, R.; Shyhab, I.; Inam, F. The degradation of mechanical properties in polymer nano-composites exposed to liquid media—A review. RSC Adv. 2016, 6, 1076–1089. [Google Scholar] [CrossRef] [Green Version]
- Khalid, H.U.; Ismail, M.C.; Nosbi, N. Permeation damage of polymer liner in oil and gas pipelines: A review. Polymers 2020, 12, 2307. [Google Scholar] [CrossRef] [PubMed]
- Zhang, D.; Li, H.; Qi, D.; Ding, N.; Shao, X.; Wei, B.; Cai, X. Gas Permeation behaviors of high-density polyethylene as a liner material of flexible pipes. Nat. Gas Ind. 2017, 37, 104–109. [Google Scholar]
- Kim, H.; Lee, S.; Shin, Y.R.; Choi, Y.-N.; Yoon, J.; Ryu, M.; Lee, J.W.; Lee, H. Durable superhydrophobic poly(vinylidene fluoride) (PVDF)-based nanofibrous membranes for reusable air filters. Appl. Polym. Mater. 2022, 4, 338–347. [Google Scholar] [CrossRef]
- Gacougnolle, J.L.; Castagnet, S.; Werth, M. Post-mortem analysis of failure in polyvinylidene fluoride pipes tested under constant pressure in the slow crack growth regime. Eng. Fail. Anal. 2006, 13, 96–109. [Google Scholar] [CrossRef]
- Hodgkinson, J.M.; Shamsuddin, S.R.; Asp, L.; Langstrom, R.; Bismarck, A. Carbon fibre reinforced PVDF pipe. In Proceedings of the 19th International Conference on Composite Materials, Montreal, QC, Canada, 28 July–2 August 2013. [Google Scholar]
- Zhang, X.; Chu, H.; Li, H.; Qi, G.; Feng, J.; Gao, X.; Yang, W. Permeation Characteristics of CH4 in PVDF with Crude Oil-Containing. Polymers 2022, 14, 2723. [Google Scholar] [CrossRef]
- Qi, G.; Yan, H.; Qi, D.; Wei, B.; Li, H. Analysis of cracks in polyvinylidene fluoride lined reinforced thermoplastic pipe used in acidic gas fields. Eng. Fail. Anal. 2019, 99, 26–33. [Google Scholar]
- Schoeffl, P.F.; Bradler, P.R.; Lang, R.W. Yielding and crack growth testing of polymers under severe liquid media conditions. Polym. Test. 2014, 40, 225–233. [Google Scholar] [CrossRef] [Green Version]
- Yang, Y.; Duan, H.; Zhang, G.; Long, S.; Yang, J.; Wang, X. Effect of the contribution of crystalline and amorphous phase on tensile behavior of poly (phenylene sulfide). J. Polym. Res. 2013, 20, 198. [Google Scholar] [CrossRef]
- Ritums, J.E.; Mattozzi, A.; Gedde, U.W.; Hedenqvist, M.S.; Bergman, G.; Palmlöf, M. Mechanical properties of high-density polyethylene and crosslinked high-density polyethylene in crude oil and its components. J. Polym. Sci. Part B Polym. Phys. 2010, 44, 641–648. [Google Scholar] [CrossRef]
- Chen, G.; Liu, C.; Yue, H.; Zhu, Y.; Zhang, G. Radial Compressive Properties of Fiber-Reinforced Thermoset Composites Pipe with Thermoplastic Polyvinylidene Fluoride Inner Liner. Polym. Mater. Sci. Eng. 2017, 33, 88–94,99. [Google Scholar]
- Mayandi, K.; Rajini, N.; Ayrilmis, N.; Indira Devi, M.P.; Siengchin, S.; Mohammad, F.; Al-Lohedan, H.A. An overview of endurance and ageing performance under various environmental conditions of hybrid polymer composites. J. Mater. Res. Technol. 2020, 9, 15962–15988. [Google Scholar] [CrossRef]
- Qi, G.; Yan, H.; Qi, D.; Li, H.; Kong, L.; Ding, H. Investigations of polyethylene of raised temperature resistance service performance using autoclave test under sour medium conditions. e-Polymers 2021, 21, 346–354. [Google Scholar] [CrossRef]
- Qi, D.; Yan, H.; Li, H.; Qi, G.; Kong, L.; Ding, H. Performance Evaluation of Polyamide-12 Pipe Serviced in Acid Oil and Gas Environment. J. Fail. Anal. Prev. 2021, 21, 2170–2176. [Google Scholar]
- Qi, G.; Qi, D.; Yan, H.; Wei, B.; Li, H. Advance in Environmental Stress Cracking Study of Thermoplastic Pipes Used in Oil and Gas Field. Polym. Mater. Sci. Eng. 2018, 34, 179–183. [Google Scholar]
- Chudnovsky, A.; Zhou, Z.; Zhang, H.; Sehanobish, K. Lifetime assessment of engineering thermoplastics. Int. J. Eng. Sci. 2012, 59, 108–139. [Google Scholar] [CrossRef]
- Yarysheva, A.Y.; Bagrov, D.V.; Rukhlya, E.G.; Yarysheva, L.M.; Volynskii, A.L.; Bakeev, N.F. First direct microscopic study of the crazed polymer structure stabilized by a liquid medium. Dokl. Phys. Chem. 2011, 440, 198–200. [Google Scholar] [CrossRef]
- Yang, Y.; Nair, A.K.N.; Sun, S. Adsorption and diffusion of methane and carbon dioxide in amorphous regions of cross-linked polyethylene: A molecular simulation study. Ind. Eng. Chem. Res. 2019, 58, 8426–8436. [Google Scholar] [CrossRef]
- Craster, B.; Jones, T.G. Permeation of a Range of Species through Polymer Layers under Varying Conditions of Temperature and Pressure: In Situ Measurement Methods. Polymers 2019, 11, 1056. [Google Scholar] [CrossRef] [Green Version]
- Raheem, H.; Craster, B.; Seshia, A. Analysis of Permeation and Diffusion Coefficients to Infer Aging Attributes in Polymers Subjected to Supercritical CO2 and H2 Gas at High Pressures. Polymers 2022, 14, 3741. [Google Scholar] [CrossRef]
- De Leon, A.C.C.; da Silva, Í.G.M.; Pangilinan, K.D.; Chen, Q.; Caldona, E.B.; Advincula, R.C. High performance polymers for oil and gas applications. React. Funct. Polym. 2021, 162, 104878. [Google Scholar] [CrossRef]
- Bagrov, D.V.; Yarysheva, A.Y.; Rukhlya, E.G.; Yarysheva, L.M.; Volynskii, A.L.; Bakeev, N.F. Atomic force microscopic study of the structure of high-density polyethylene deformed in liquid medium by crazing mechanism. J. Microsc. 2014, 253, 151–160. [Google Scholar] [CrossRef] [PubMed]
- Yarysheva, A.Y.; Rukhlya, E.G.; Yarysheva, L.M.; Bagrov, D.V.; Volynskii, A.L.; Bakeev, N.F. The structural evolution of high-density polyethylene during crazing in liquid medium. Eur. Polym. J. 2015, 66, 458–469. [Google Scholar] [CrossRef]
- Voultzatis, I.S.; Papaspyrides, C.D.; Tsenoglou, C.J.; Roussis, C. Diffusion of Model Contaminants in High-Density Polyethylene. Macromol. Mater. Eng. 2007, 292, 272–284. [Google Scholar] [CrossRef]


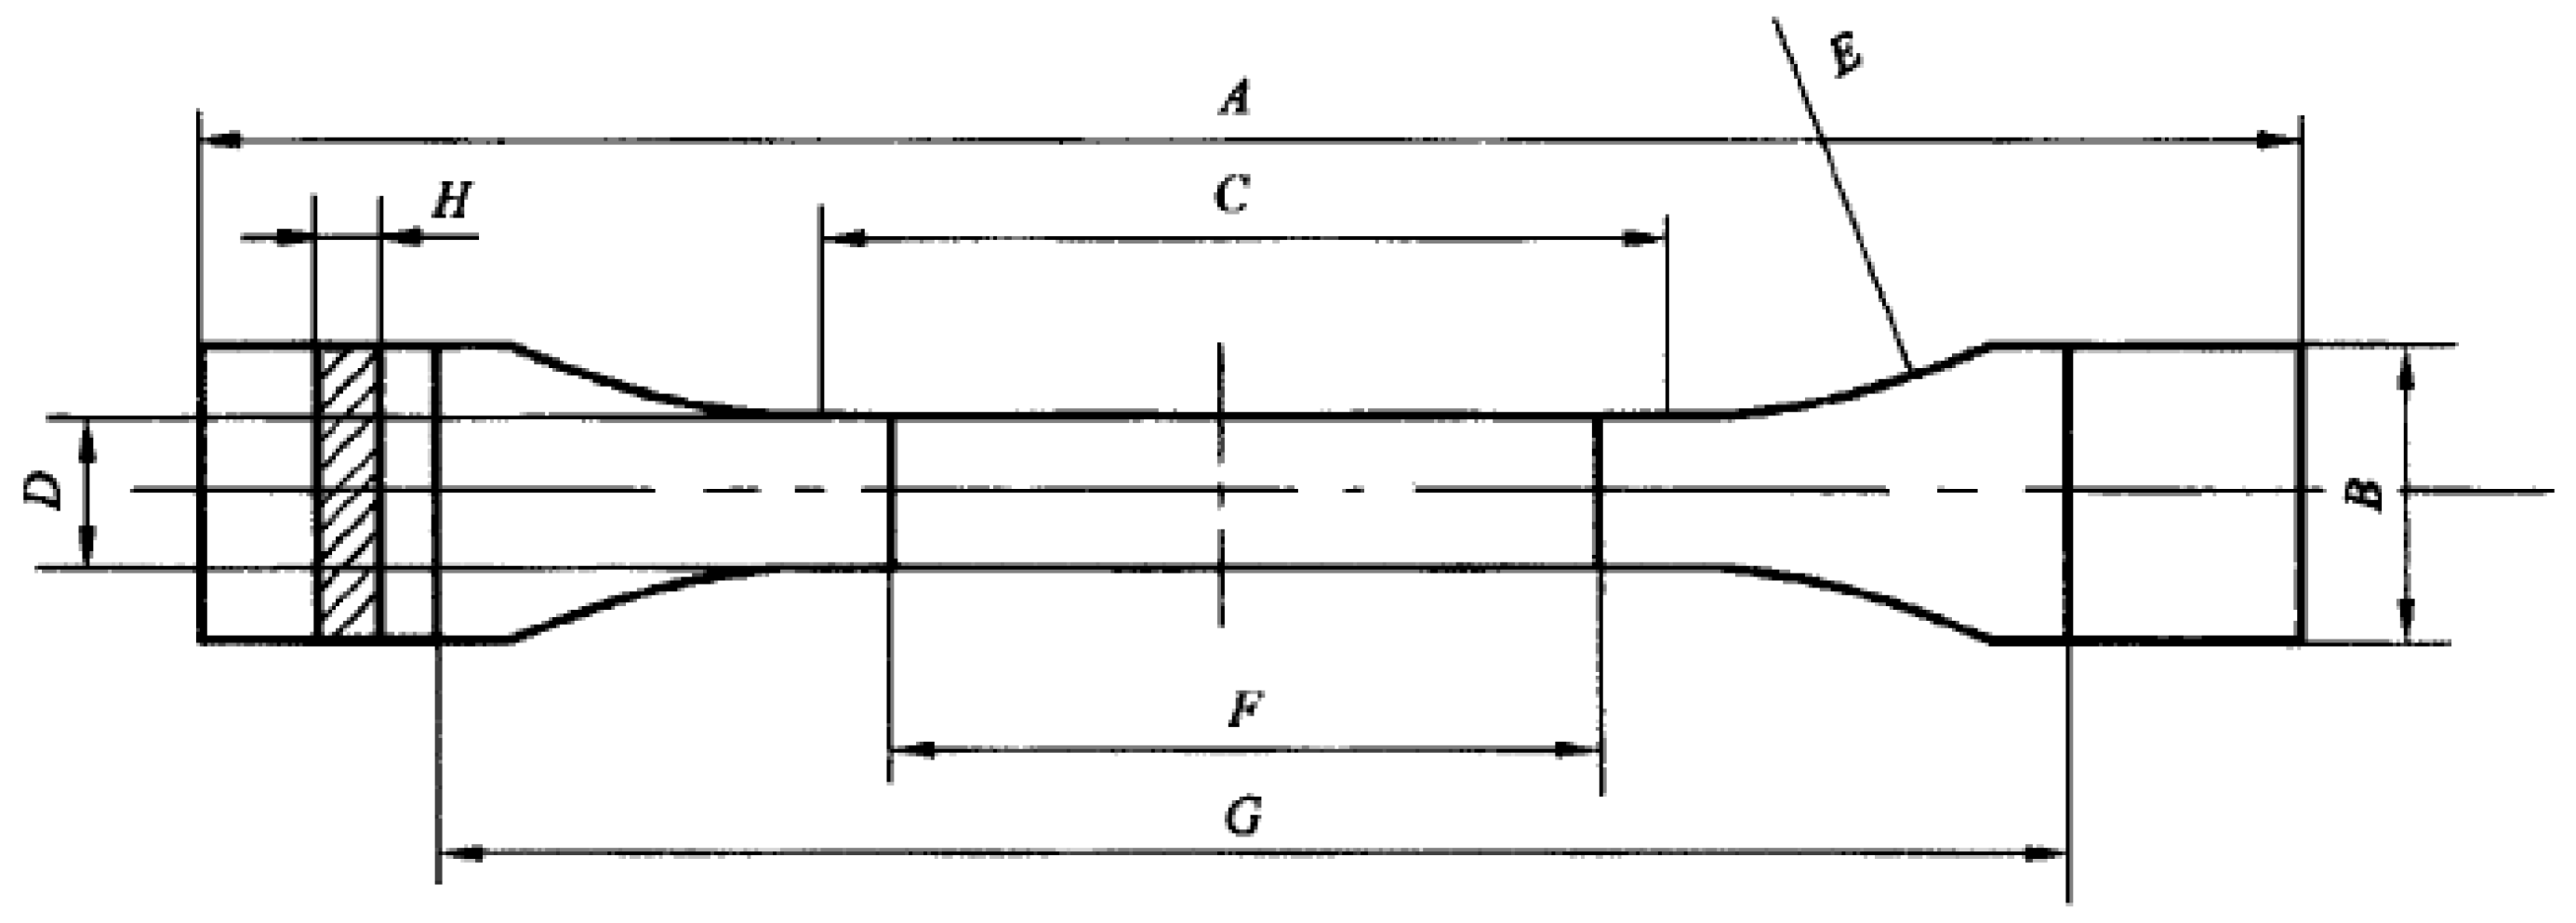
| Serial Number | Description | Size (mm) |
|---|---|---|
| A | Minimum total length | 150 |
| B | End width | 20 ± 0.2 |
| C | Parallel part length | 60 ± 0.5 |
| D | Parallel part width | 10 ± 0.2 |
| E | Radius | 60 |
| F | Distance between markings | 50 ± 0.5 |
| G | Distance between clamps | 115 ± 0.5 |
| H | Wall thickness | wall thickness of the pipe |
| Test Medium | Composition | Proportion (%) |
|---|---|---|
| Gas phase (30%) | CO2 | 10 |
| H2S | 10 | |
| CH4 | 80 | |
| Liquid phase (70%) | Heptane | 70 |
| Cyclohexane | 20 | |
| Toluene | 10 |
Publisher’s Note: MDPI stays neutral with regard to jurisdictional claims in published maps and institutional affiliations. |
© 2022 by the authors. Licensee MDPI, Basel, Switzerland. This article is an open access article distributed under the terms and conditions of the Creative Commons Attribution (CC BY) license (https://creativecommons.org/licenses/by/4.0/).
Share and Cite
Qi, G.; Yan, H.; Qi, D.; Li, H.; Zhang, Z. The Aging Performance of PVDF in Acid Oil and Gas Medium. Polymers 2022, 14, 4244. https://doi.org/10.3390/polym14194244
Qi G, Yan H, Qi D, Li H, Zhang Z. The Aging Performance of PVDF in Acid Oil and Gas Medium. Polymers. 2022; 14(19):4244. https://doi.org/10.3390/polym14194244
Chicago/Turabian StyleQi, Guoquan, Hongxia Yan, Dongtao Qi, Houbu Li, and Zhao Zhang. 2022. "The Aging Performance of PVDF in Acid Oil and Gas Medium" Polymers 14, no. 19: 4244. https://doi.org/10.3390/polym14194244