
Stress Relaxation Behavior of Poly(Methyl Methacrylate)/Graphene Composites: Ultraviolet Irradiation

Abstract
:1. Introduction
2. Kelvin Representation of the Standard Linear Solid Model
3. Experimental
4. Results and Discussion
5. Conclusions
Supplementary Materials
Author Contributions
Funding
Institutional Review Board Statement
Informed Consent Statement
Data Availability Statement
Conflicts of Interest
References
- Wochnowski, C.; Metev, S.S.; Sepold, G. UV–laser-assisted modification of the optical properties of polymethylmethacrylate. Appl. Surf. Sci. 2000, 154, 706–711. [Google Scholar] [CrossRef]
- Balamurugan, A.; Kannan, S.; Selvaraj, V.; Rajeswari, S. Development and spectral characterization of poly (methyl methacrylate)/hydroxyapatite composite for biomedical applications. Trends Biomater. Artif. Organs 2004, 18, 41–45. [Google Scholar]
- Yang, H.H.; Huang, M.; Wu, J.; Lan, Z.; Hao, S.; Lin, J. The polymer gel electrolyte based on poly (methyl methacrylate) and its application in quasi-solid-state dye-sensitized solar cells. Mater. Chem. Phys. 2008, 110, 38–42. [Google Scholar] [CrossRef]
- Zhu, Y.; Jiang, P.; Huang, X. Poly (vinylidene fluoride) terpolymer and poly (methyl methacrylate) composite films with superior energy storage performance for electrostatic capacitor application. Compos. Sci. Technol. 2019, 179, 115–124. [Google Scholar] [CrossRef]
- Ali, U.; Karim, K.J.B.A.; Buang, N.A. A review of the properties and applications of poly (methyl methacrylate) (PMMA). Polym. Rev. 2015, 55, 678–705. [Google Scholar] [CrossRef]
- Hollick, E.J.; Spalton, D.J.; Ursell, P.G.; Pande, M.V.; Barman, S.A.; Boyce, J.F.; Tilling, K. The effect of polymethylmethacrylate, silicone, and polyacrylic intraocular lenses on posterior capsular opacification 3 years after cataract surgery. Ophthalmology 1999, 106, 49–55. [Google Scholar] [CrossRef]
- Gupta, L.; Aparna, I.N.; Bhat, S.; Ginjupalli, K. Effect of comonomer of methacrylic acid on flexural strength and adhesion of Staphylococcus aureus to heat polymerized poly (methyl methacrylate) resin: An in vitro study. J. Indian Prosthodont. Soc. 2017, 17, 149. [Google Scholar]
- Street, D.P.; Ledford, W.K.; Allison, A.A.; Patterson, S.; Pickel, D.L.; Lokitz, B.S.; Messman, J.M.; Kilbey, S.M., II. Self-complementary multiple hydrogen-bonding additives enhance thermomechanical properties of 3D-printed PMMA structures. Macromolecules 2019, 52, 5574–5582. [Google Scholar] [CrossRef]
- Chew, K.W.; Tan, K.W. The effects of ceramic fillers on PMMA-based polymer electrolyte salted with lithium triflate, LiCF3SO3. Int. J. Electrochem. Sci. 2011, 6, 5792–5801. [Google Scholar]
- Sun, D.; Miyatake, N.; Sue, H.J. Transparent PMMA/ZnO nanocomposite films based on colloidal ZnO quantum dots. Nanotechnology 2007, 18, 215606. [Google Scholar] [CrossRef]
- Avella, M.; Errico, M.E.; Martuscelli, E. Novel PMMA/CaCO3 nanocomposites abrasion resistant prepared by an in situ polymerization process. Nano Lett. 2001, 1, 213–217. [Google Scholar] [CrossRef]
- Lee, C.; Wei, X.; Kysar, J.W.; Hone, J. Measurement of the elastic properties and intrinsic strength of monolayer graphene. Science 2008, 321, 385–388. [Google Scholar] [CrossRef] [PubMed]
- Bolotin, K.; Sikes, K.; Jiang, Z.; Klima, M.; Fudenberg, G.; Hone, J.; Kim, P.; Stormer, H. Ultrahigh electron mobility in suspended graphene. Solid State Commun. 2008, 146, 351–355. [Google Scholar] [CrossRef]
- Balandin, A.A.; Ghosh, S.; Bao, W.; Calizo, I.; Teweldebrhan, D.; Miao, F.; Lau, C.N. Superior thermal conductivity of single-layer graphene. Nano Lett. 2008, 8, 902–907. [Google Scholar] [CrossRef]
- Li, D.; Müller, M.B.; Gilje, S.; Kaner, R.B.; Wallace, G.G. Processable aqueous dispersions of graphene nanosheets. Nat. Nanotechnol. 2008, 3, 101–105. [Google Scholar] [CrossRef]
- Huang, X.; Qi, X.; Boey, F.; Zhang, H. Graphene-based composites. Chem. Soc. Rev. 2012, 41, 666–686. [Google Scholar] [CrossRef]
- Wan, Y.-J.; Tang, L.-C.; Yan, D.; Zhao, L.; Li, Y.-B.; Wu, L.-B.; Jiang, J.-X.; Lai, G.-Q. Improved dispersion and interface in the graphene/epoxy composites via a facile surfactant-assisted process. Compos. Sci. Technol. 2013, 82, 60–68. [Google Scholar] [CrossRef]
- Gonçalves, G.; Marques, P.A.; Barros-Timmons, A.; Bdkin, I.; Singh, M.K.; Emami, N.; Grácio, J. Graphene oxide modified with PMMA via ATRP as a reinforcement filler. J. Mater. Chem. 2010, 20, 9927–9934. [Google Scholar] [CrossRef] [Green Version]
- Ramanathan, T.; Abdala, A.A.; Stankovich, S.; Dikin, D.A.; Herrera-Alonso, M.; Piner, R.D.; Adamson, D.H.; Schniepp, H.C.; Chen, X.; Ruoff, R.S.; et al. Functionalized graphene sheets for polymer nanocomposites. Nat. Nanotechnol. 2008, 3, 327–331. [Google Scholar] [CrossRef]
- Chen, G.-H.; Wu, D.-J.; Weng, W.-G.; Yan, W.-L. Preparation of polymer/graphite conducting nanocomposite by intercalation polymerization. J. Appl. Polym. Sci. 2001, 82, 2506–2513. [Google Scholar] [CrossRef]
- Jang, J.Y.; Kim, M.S.; Jeong, H.M.; Shin, C.M. Graphite oxide/poly(methyl methacrylate) nanocomposites prepared by a novel method utilizing macroazoinitiator. Compos. Sci. Technol. 2009, 69, 186–191. [Google Scholar] [CrossRef]
- Vladimirov, N.G.; Gitsov, I. Polymerization Initiated by Graphite Intercalation Compounds Revisited: One-Pot Synthesis of Amphiphilic Pentablock Copolymers. Macromol 2022, 2, 184–193. [Google Scholar] [CrossRef]
- Yousif, E.; Haddad, R. Photodegradation and photostabilization of polymers, especially polystyrene. SpringerPlus 2013, 2, 1–32. [Google Scholar] [CrossRef] [PubMed]
- Bottino, F.A.; Cinquegrani, A.R.; Di Pasquale, G.; Leonardi, L.; Pollicino, A. Chemical modifications, mechanical properties and surface photo-oxidation of films of polystyrene (PS). Polym. Test. 2004, 23, 405–411. [Google Scholar] [CrossRef]
- Delobelle, P.; Guillot, L.; Dubois, C.; Monney, L. Photo-oxidation effects on mechanical properties of epoxy matrixes: Young’s modulus and hardness analyses by nano-indentation. Polym. Degrad. Stab. 2002, 77, 465–475. [Google Scholar] [CrossRef]
- Wochnowski, C.; Eldin, M.S.; Metev, S. UV-laser-assisted degradation of poly (methyl methacrylate). Polym. Degrad. Stab. 2005, 89, 252–264. [Google Scholar] [CrossRef]
- Razavi, N.M. Creep and stress relaxation behavior of polypropylene, metallocene-prepared polyethylene and their blends. Iran. J. Chem. Eng. 2012, 9, 60–69. [Google Scholar]
- Reis, P.N.B.; Silva, M.P.; Santos, P. Stress relaxation in delaminated carbon/epoxy composites. Fibers Polym. 2019, 20, 1284–1289. [Google Scholar] [CrossRef]
- Schiavi, A.; Prato, A. Evidences of non-linear short-term stress relaxation in polymers. Polym. Test. 2017, 59, 220–229. [Google Scholar] [CrossRef]
- Plaseied, A.; Fatemi, A. Deformation response and constitutive modeling of vinyl ester polymer including strain rate and temperature effects. J. Mater. Sci. 2008, 43, 1191–1199. [Google Scholar] [CrossRef]
- Papanicolaou, G.C.; Kontaxis, L.C.; Koutsomitopoulou, A.F.; Zaoutsos, S.P. Stress relaxation behavior of starch powder-epoxy resin composites. J. Appl. Polym. Sci. 2015, 132, 41697. [Google Scholar] [CrossRef]
- Mohammadian-Gezaz, S.; Karrabi, M. Study on the Stress Relaxation of Nano Clay-Rubber Nanocomposites Considering Standard Linear Solid Model. J. Rubber Res. 2017, 20, 20–32. [Google Scholar] [CrossRef]
- Ariyama, T.; Mori, Y.; Kaneko, K. Tensile properties and stress relaxation of polypropylene at elevated temperatures. Polym. Eng. Sci. 1997, 37, 81–90. [Google Scholar] [CrossRef]
- Yan, W.; Fang, L.; Heuchel, M.; Kratz, K.; Lendlein, A. Modeling of stress relaxation of a semi-crystalline multiblock copolymer and its deformation behavior. Clin. Hemorheol. Microcirc. 2015, 60, 109–120. [Google Scholar] [CrossRef]
- Heuchel, M.; Cui, J.; Kratz, K.; Kosmella, H.; Lendlein, A. Relaxation based modeling of tunable shape recovery kinetics observed under isothermal conditions for amorphous shape-memory polymers. Polymer 2010, 51, 6212–6218. [Google Scholar] [CrossRef]
- Vaidyanathan, T.K.; Vaidyanathan, J. Validity of predictive models of stress relaxation in selected dental polymers. Dent. Mater. 2015, 31, 799–806. [Google Scholar] [CrossRef]
- Tripathi, S.N.; Saini, P.; Gupta, D.; Choudhary, V. Electrical and mechanical properties of PMMA/reduced graphene oxide nanocomposites prepared via in situ polymerization. J. Mater. Sci. 2013, 48, 6223–6232. [Google Scholar] [CrossRef]
- Ferrari, A.C.; Meyer, J.C.; Scardaci, V.; Casiraghi, C.; Lazzeri, M.; Mauri, F.; Piscanec, S.; Jiang, D.; Novoselov, K.S.; Roth, S.; et al. Raman spectrum of graphene and graphene layers. Phys. Rev. Lett. 2006, 97, 187401. [Google Scholar] [CrossRef] [Green Version]
- Lopez-Diaz, D.; Holgado, M.L.; Garcia-Fierro, J.L.; Velazquez, M.M. evolution of the Raman spectrum with the chemical composition of graphene oxide. J. Phys. Chem. C 2017, 121, 20489–20497. [Google Scholar] [CrossRef]
- Osawa, Z.; Fukuda, Y. Photo-degradation of blends of polycarbonate and poly (methyl methacrylate). Polym. Degrad. Stab. 1991, 32, 285–297. [Google Scholar] [CrossRef]
- Torikai, A.; Ohno, M.; Fueki, K. Photodegradation of poly (methyl methacrylate) by monochromatic light: Quantum yield, effect of wavelengths, and light intensity. J. Appl. Polym. Sci. 1990, 41, 1023–1032. [Google Scholar] [CrossRef]
- Huggins, M.L. The viscosity of dilute solutions of long-chain molecules. IV. Dependence on concentration. J. Am. Chem. Soc. 1942, 64, 2716–2718. [Google Scholar] [CrossRef]
- Flory, P.J. Principles of Polymer Chemistry; Cornell University Press: Ithaca, NY, USA, 1953. [Google Scholar]
- American Polymer Standards Corporation. Available online: http://www.ampolymer.com/Mark-Houwink.html (accessed on 21 March 2022).
- Kemp, H.R. The Effect of Temperature and Pressure on Equilibria: A Derivation of the van’t Hoff Rules. J. Chem. Educ. 1987, 64, 482–484. [Google Scholar] [CrossRef]
- Lagakos, N.; Jarzynski, J.; Cole, J.H.; Bucaro, J.A. Frequency and temperature dependence of elastic moduli of polymers. J. Appl. Phys. 1986, 59, 4017–4031. [Google Scholar] [CrossRef]
- Ferry, D. Viscoelastic Properties of Polymers, 3rd ed.; Wiley: New York, NY, USA, 1980. [Google Scholar]
- Aklonis, J.J.; MacKnight, W.J. Introduction to Polymer Viscoelasticity, 2nd ed.; Wiley: New York, NY, USA, 1983. [Google Scholar]


| FGs (wt%) | Fracture Stress (MPa) | Young’s Modulus (GPa) | Elongation at Break (%) | ||||||
|---|---|---|---|---|---|---|---|---|---|
| 0 (J/cm2) | 11.3 (J/cm2) | 22.61 (J/cm2) | 0 (J/cm2) | 11.3 (J/cm2) | 22.61 (J/cm2) | 0 (J/cm2) | 11.3 (J/cm2) | 22.61 (J/cm2) | |
| 0 | 60.98 ± 1.43 | 35.97 ± 3.27 | 28.11 ± 3.43 | 1.23 ± 0.02 | 1.16 ± 0.04 | 1.08 ± 0.02 | 7.39 ± 0.34 | 3.57 ± 0.64 | 2.97 ± 0.21 |
| 0.3 | 65.94 ± 1.42 | 40.53 ± 5.31 | 36.05 ± 3.18 | 1.30 ± 0.04 | 1.29 ± 0.03 | 1.21 ± 0.04 | 8.02 ± 0.46 | 4.21 ± 0.33 | 3.66 ± 0.54 |
| 0.7 | 70.53 ± 1.05 | 48.76 ± 2.40 | 39.08 ± 5.48 | 1.41 ± 0.02 | 1.31 ± 0.03 | 1.25 ± 0.04 | 9.53 ± 0.57 | 4.55 ± 0.42 | 4.06 ± 0.70 |
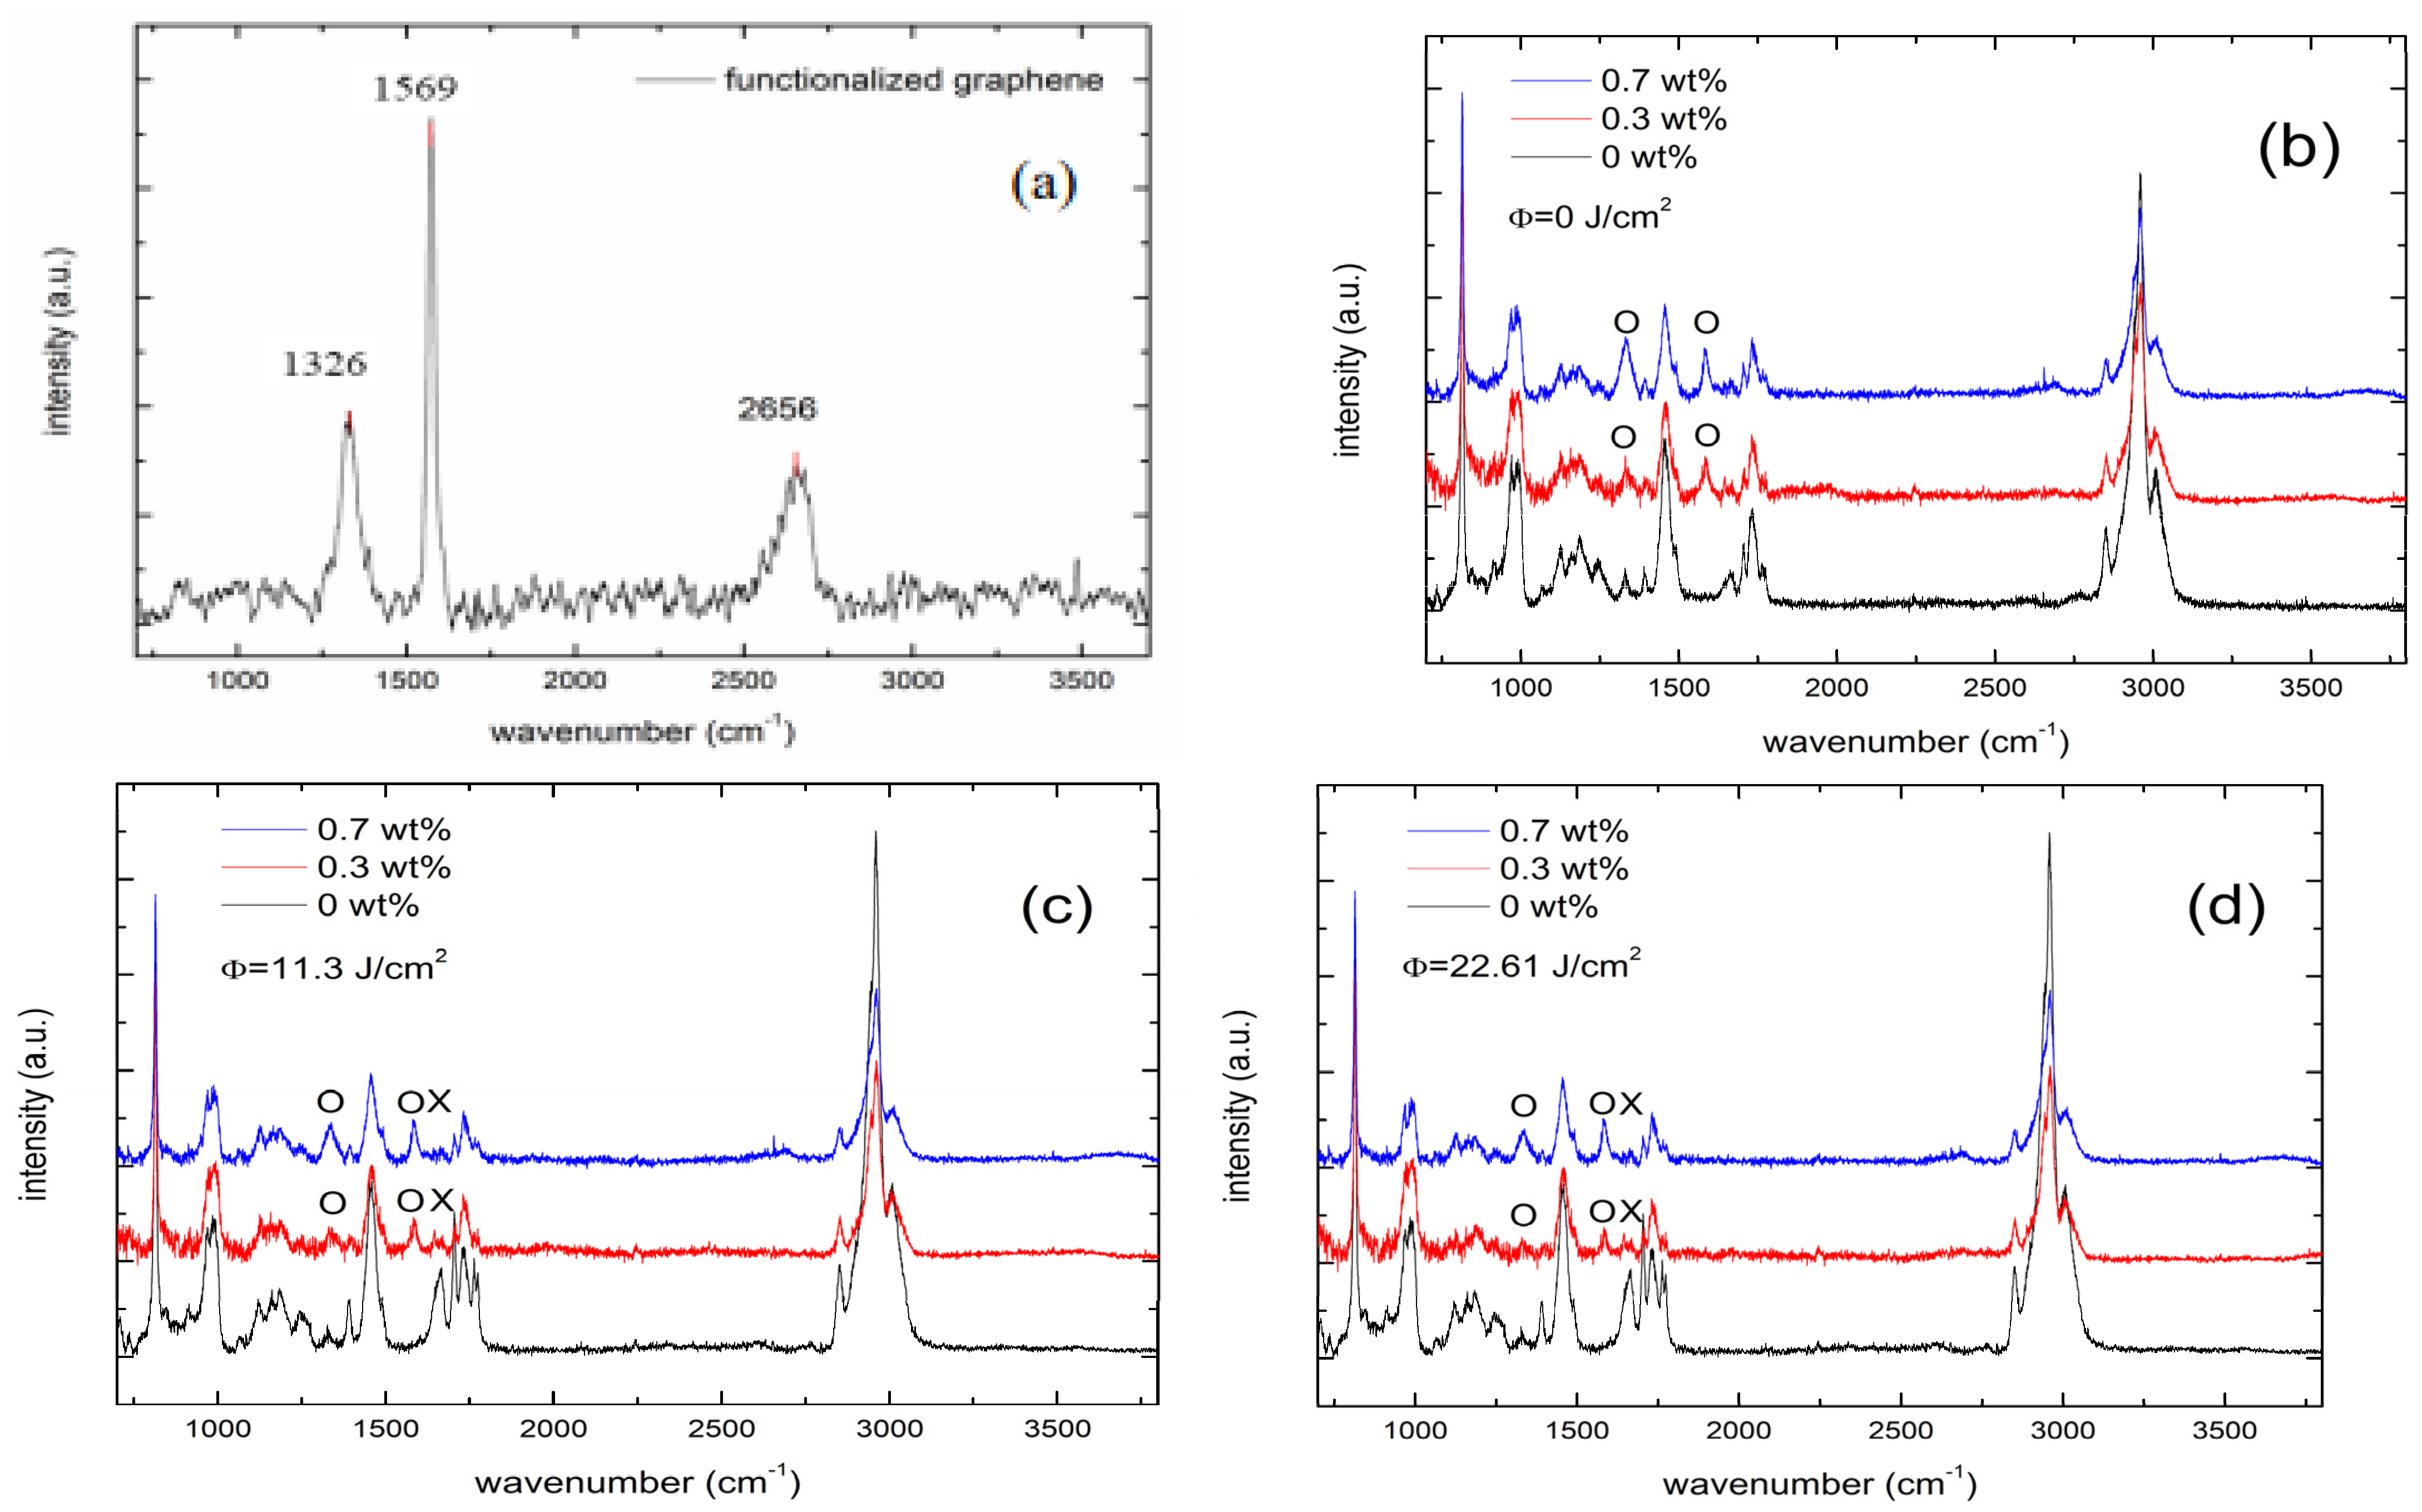
| FGs (wt%) | UV Dose (J/cm2) | ID | IG | ID/IG |
|---|---|---|---|---|
| 100 | 0 | 18.22 | 46.46 | 0.39 |
| 0.3 | 0 | 44.68 | 48.05 | 0.93 |
| 11.3 | 36.18 | 45.96 | 0.79 | |
| 22.61 | 25.65 | 37.48 | 0.68 | |
| 0.7 | 0 | 62.48 | 52.15 | 1.20 |
| 11.3 | 42.04 | 44.83 | 0.94 | |
| 22.61 | 39.15 | 50.81 | 0.77 |
| FGs | Dose | ||
|---|---|---|---|
| 0 J/cm2 | 11.3 J/cm2 | 22.61 J/cm2 | |
| 0 wt% | 1.32 × 10⁵ | 9.61 × 10⁴ | 5.04 × 10⁴ |
| 0.3 wt% | 1.51 × 10⁵ | 1.09 × 10⁵ | 8.48 × 10⁴ |
| 0.7 wt% | 1.62 × 10⁵ | 1.23 × 10⁵ | 8.86 × 10⁴ |
| FGs | Dose | ||
|---|---|---|---|
| 0 J/cm2 | 11.3 J/cm2 | 22.6 J/cm2 | |
| 0 wt% | −21.08 kJ/mol | −19.14 kJ/mol | −18.97 kJ/mol |
| 0.3 wt% | −21.20 kJ/mol | −19.49 kJ/mol | −18.32 kJ/mol |
| 0.7 wt% | −21.36 kJ/mol | −19.56 kJ/mol | −18.11 kJ/mol |
| Temperature | 80 °C | 70 °C | 60 °C | 50 °C | ||||||||
|---|---|---|---|---|---|---|---|---|---|---|---|---|
| FGs (wt%) | 0 | 0.3 | 0.7 | 0 | 0.3 | 0.7 | 0 | 0.3 | 0.7 | 0 | 0.3 | 0.7 |
| E1k (GPa) | 0.9 | 0.95 | 0.95 | 0.95 | 1.02 | 1.02 | 1.02 | 1.07 | 1.07 | 1.06 | 1.1 | 1.1 |
| E2k (GPa) | 0.7 | 0.84 | 0.84 | 1.35 | 1.47 | 1.47 | 2.01 | 2.33 | 2.33 | 3. | 3.3 | 3.3 |
| η2k (GPa × min) | 9. | 10. | 9.8 | 14 | 15. | 15.1 | 20. | 25 | 24.8 | 29 | 32 | 35 |
| βs (min) | 0.178 | 0.179 | 0.212 | 0.164 | 0.166 | 0.164 | 0.152 | 0.136 | 0.128 | 0.140 | 0.138 | 0.119 |
| R2 | 0.990 | 0.994 | 0.995 | 0.989 | 0.986 | 0.986 | 0.992 | 0.986 | 0.988 | 0.988 | 0.982 | 0.991 |
| Temperature | 80 °C | 70 °C | 60 °C | 50 °C | ||||||||
|---|---|---|---|---|---|---|---|---|---|---|---|---|
| FGs (%) | 0 | 0.3 | 0.7 | 0 | 0.3 | 0.7 | 0 | 0.3 | 0.7 | 0 | 0.3 | 0.7 |
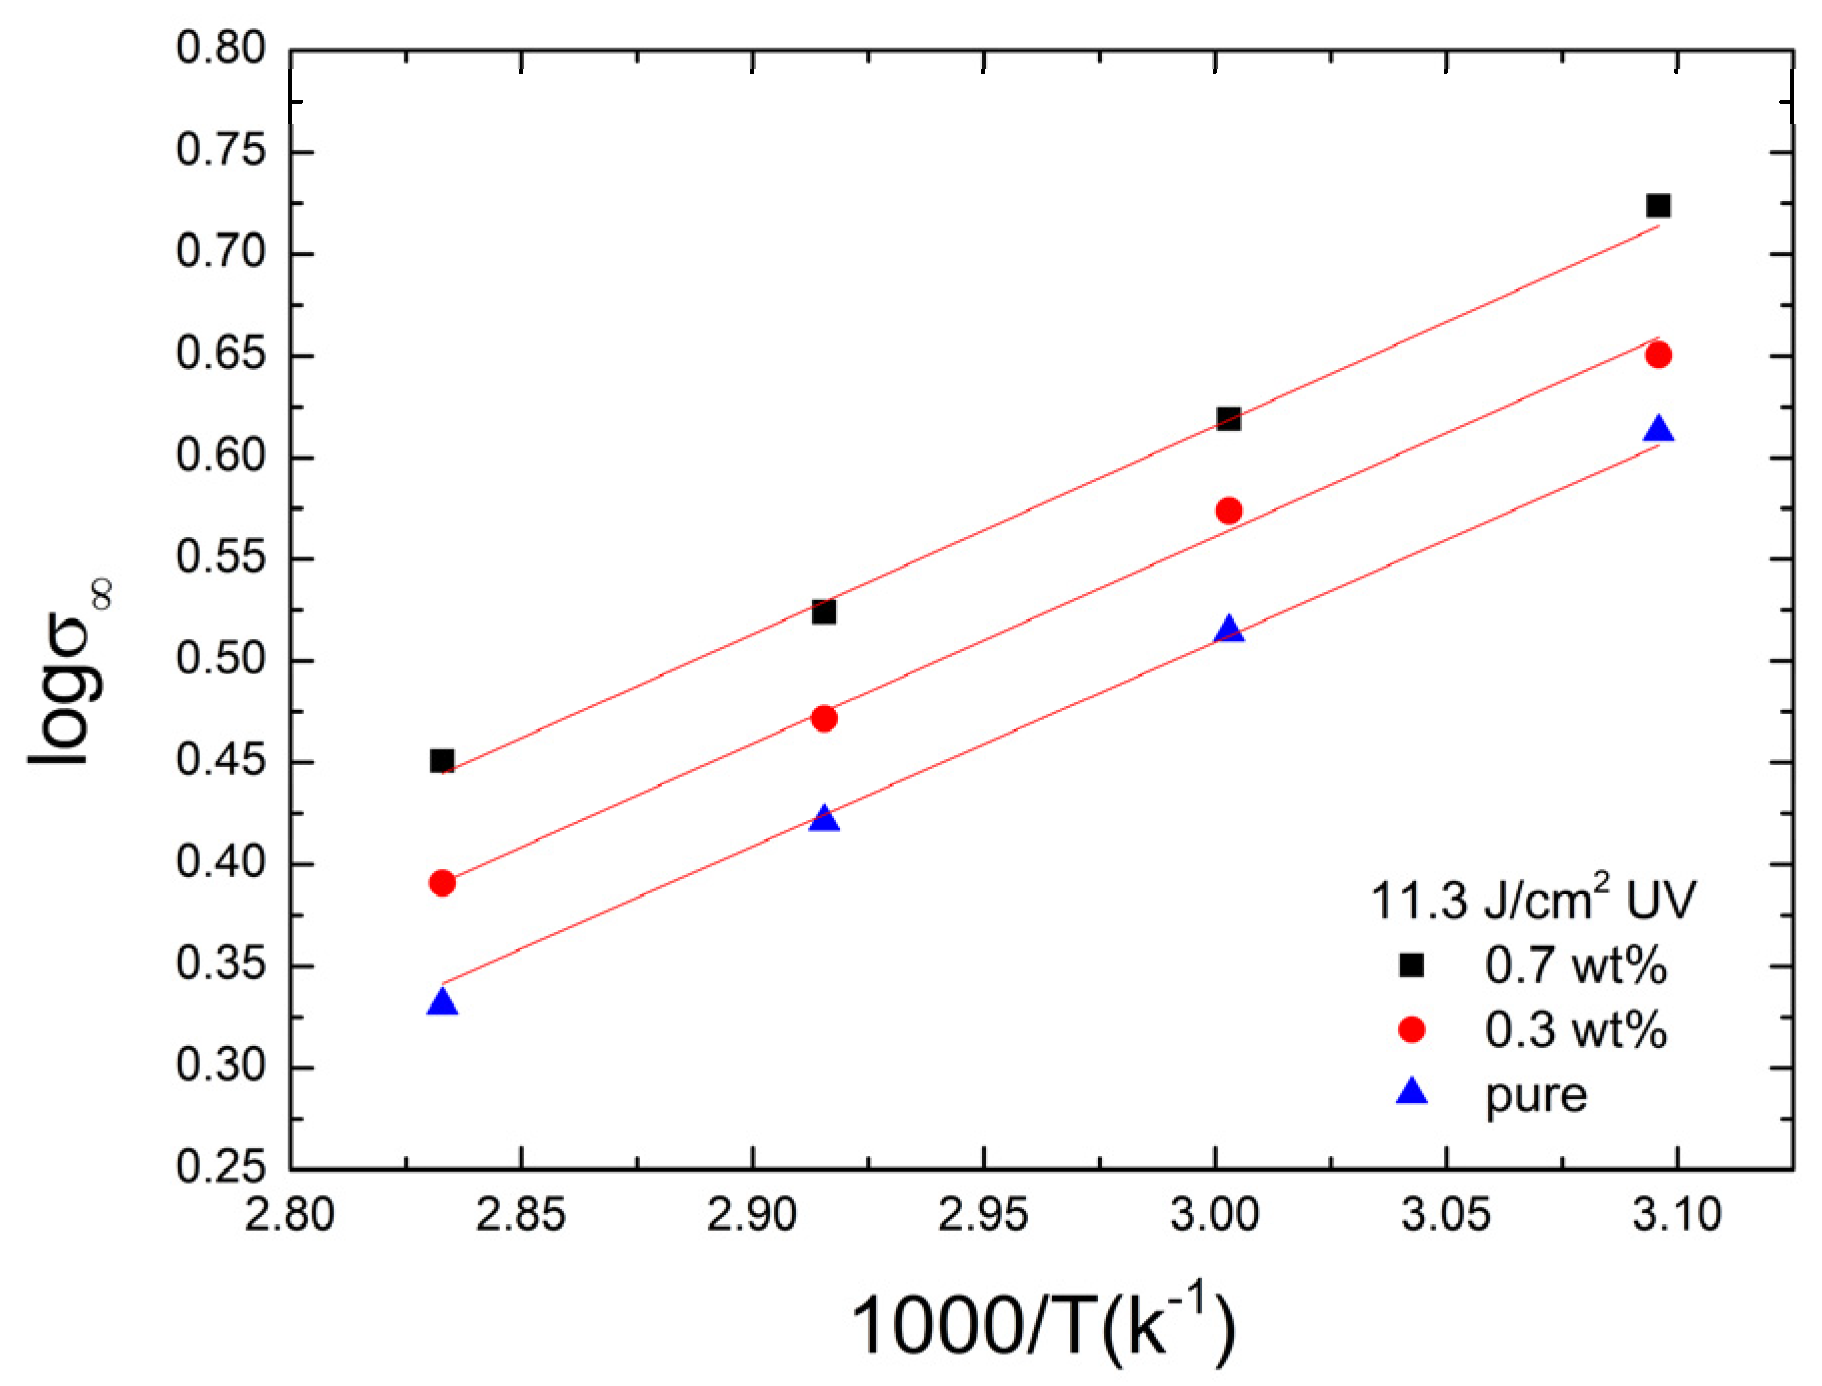
| E1m (GPa) | 0.394 | 0.446 | 0.475 | 0.558 | 0.602 | 0.675 | 0.677 | 0.733 | 0.826 | 0.783 | 0.825 | 0.899 |
| E2m (GPa) | 0.506 | 0.504 | 0.585 | 0.392 | 0.418 | 0.415 | 0.343 | 0.337 | 0.314 | 0.277 | 0.275 | 0.261 |
| η2m (GPa × min) | 2.848 | 2.817 | 2.76 | 2.388 | 2.517 | 2.533 | 2.266 | 2.476 | 2.46 | 1.977 | 2.00 | 2.19 |
| βs (min) | 0.178 | 0.179 | 0.212 | 0.164 | 0.166 | 0.164 | 0.152 | 0.136 | 0.128 | 0.140 | 0.138 | 0.119 |
| R2 | 0.990 | 0.994 | 0.995 | 0.989 | 0.986 | 0.986 | 0.992 | 0.986 | 0.988 | 0.988 | 0.982 | 0.991 |
| Dose FGs | 0 J/cm2 | 11.3 J/cm2 | 22.6 J/cm2 | |||
|---|---|---|---|---|---|---|
| Qη (kJ/mol) | R2 | Qη (kJ/mol) | R2 | Qη (kJ/mol) | R2 | |
| 0 wt% | 39.47 | 0.994 | 36.63 | 0.995 | 28.66 | 0.990 |
| 0.3 wt% | 49.99 | 0.993 | 37.84 | 0.979 | 28.52 | 0.996 |
| 0.7 wt% | 61.39 | 0.962 | 40.87 | 0.992 | 33.68 | 0.960 |
Publisher’s Note: MDPI stays neutral with regard to jurisdictional claims in published maps and institutional affiliations. |
© 2022 by the authors. Licensee MDPI, Basel, Switzerland. This article is an open access article distributed under the terms and conditions of the Creative Commons Attribution (CC BY) license (https://creativecommons.org/licenses/by/4.0/).
Share and Cite
Ju, Y.-C.; Chiang, D.; Tsai, M.-Y.; Ouyang, H.; Lee, S. Stress Relaxation Behavior of Poly(Methyl Methacrylate)/Graphene Composites: Ultraviolet Irradiation. Polymers 2022, 14, 4192. https://doi.org/10.3390/polym14194192
Ju Y-C, Chiang D, Tsai M-Y, Ouyang H, Lee S. Stress Relaxation Behavior of Poly(Methyl Methacrylate)/Graphene Composites: Ultraviolet Irradiation. Polymers. 2022; 14(19):4192. https://doi.org/10.3390/polym14194192
Chicago/Turabian StyleJu, Yu-Cheng, Donyau Chiang, Ming-Yen Tsai, Hao Ouyang, and Sanboh Lee. 2022. "Stress Relaxation Behavior of Poly(Methyl Methacrylate)/Graphene Composites: Ultraviolet Irradiation" Polymers 14, no. 19: 4192. https://doi.org/10.3390/polym14194192