

Thermo-Hydro-Glycol Ageing of Polyamide 6,6: Microstructure-Properties Relationships

Abstract
:
1. Introduction
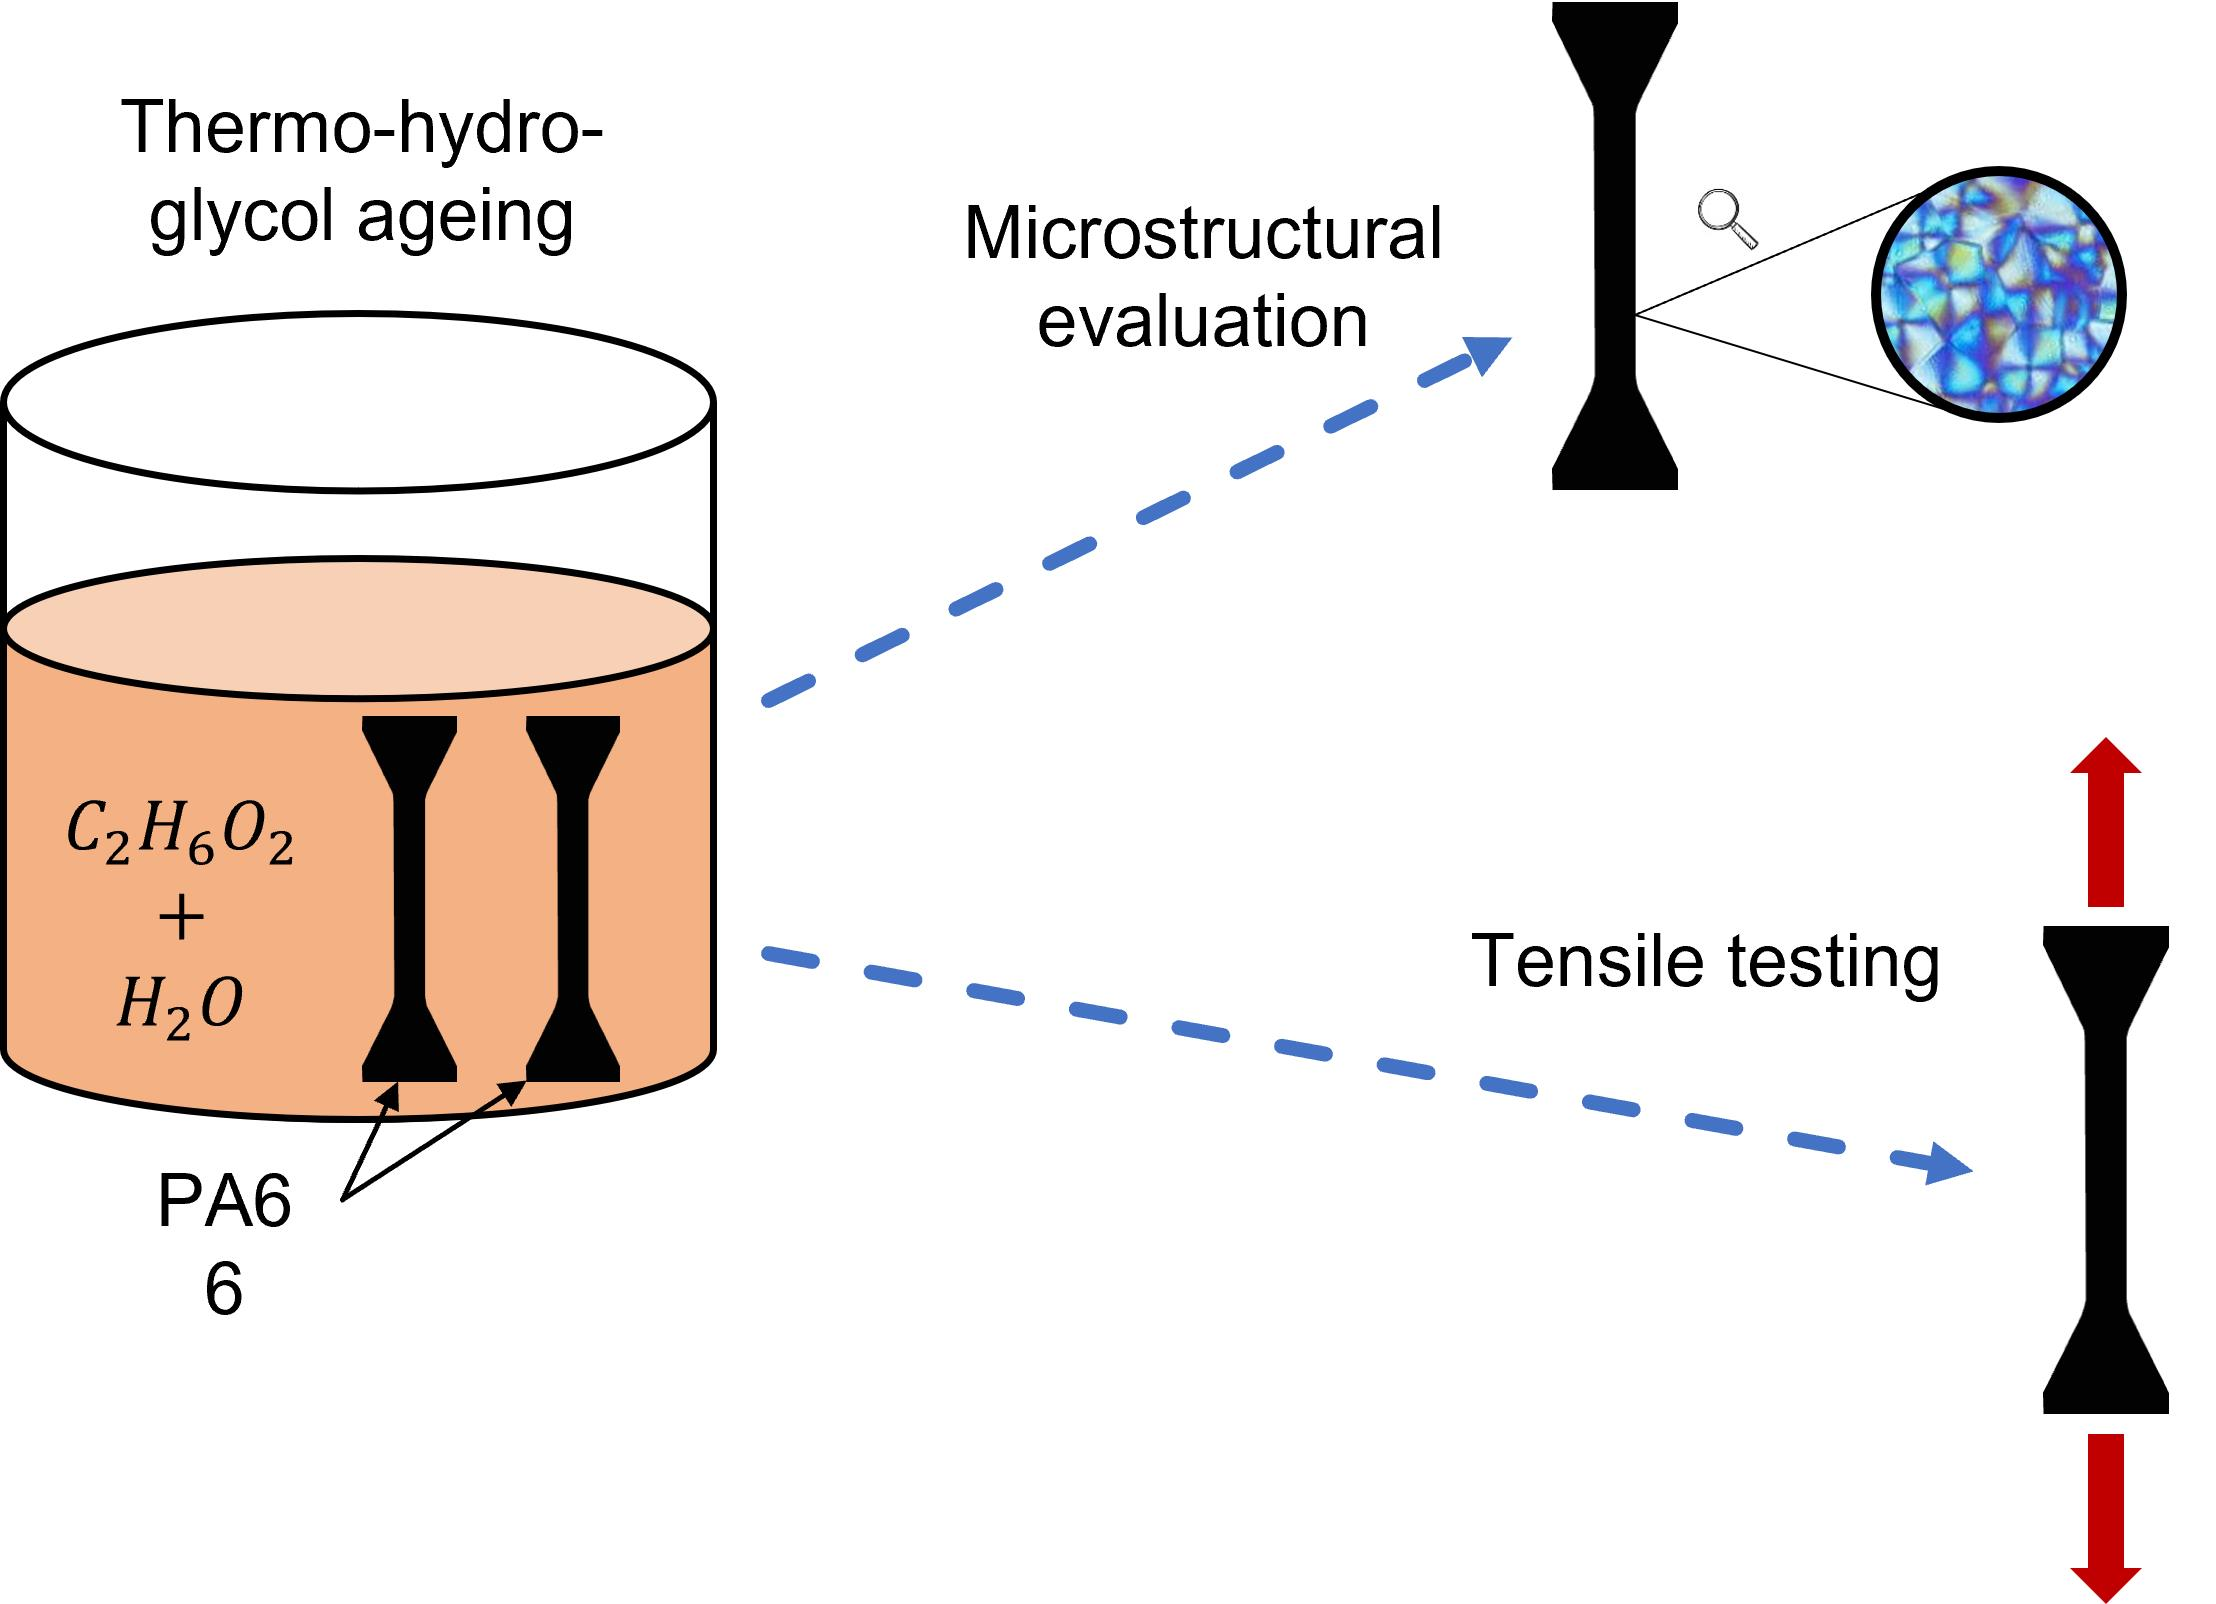
2. Materials and Methods
2.1. Materials
2.2. Steric Exclusion Chromatography
2.3. Polarized Light Microscopy
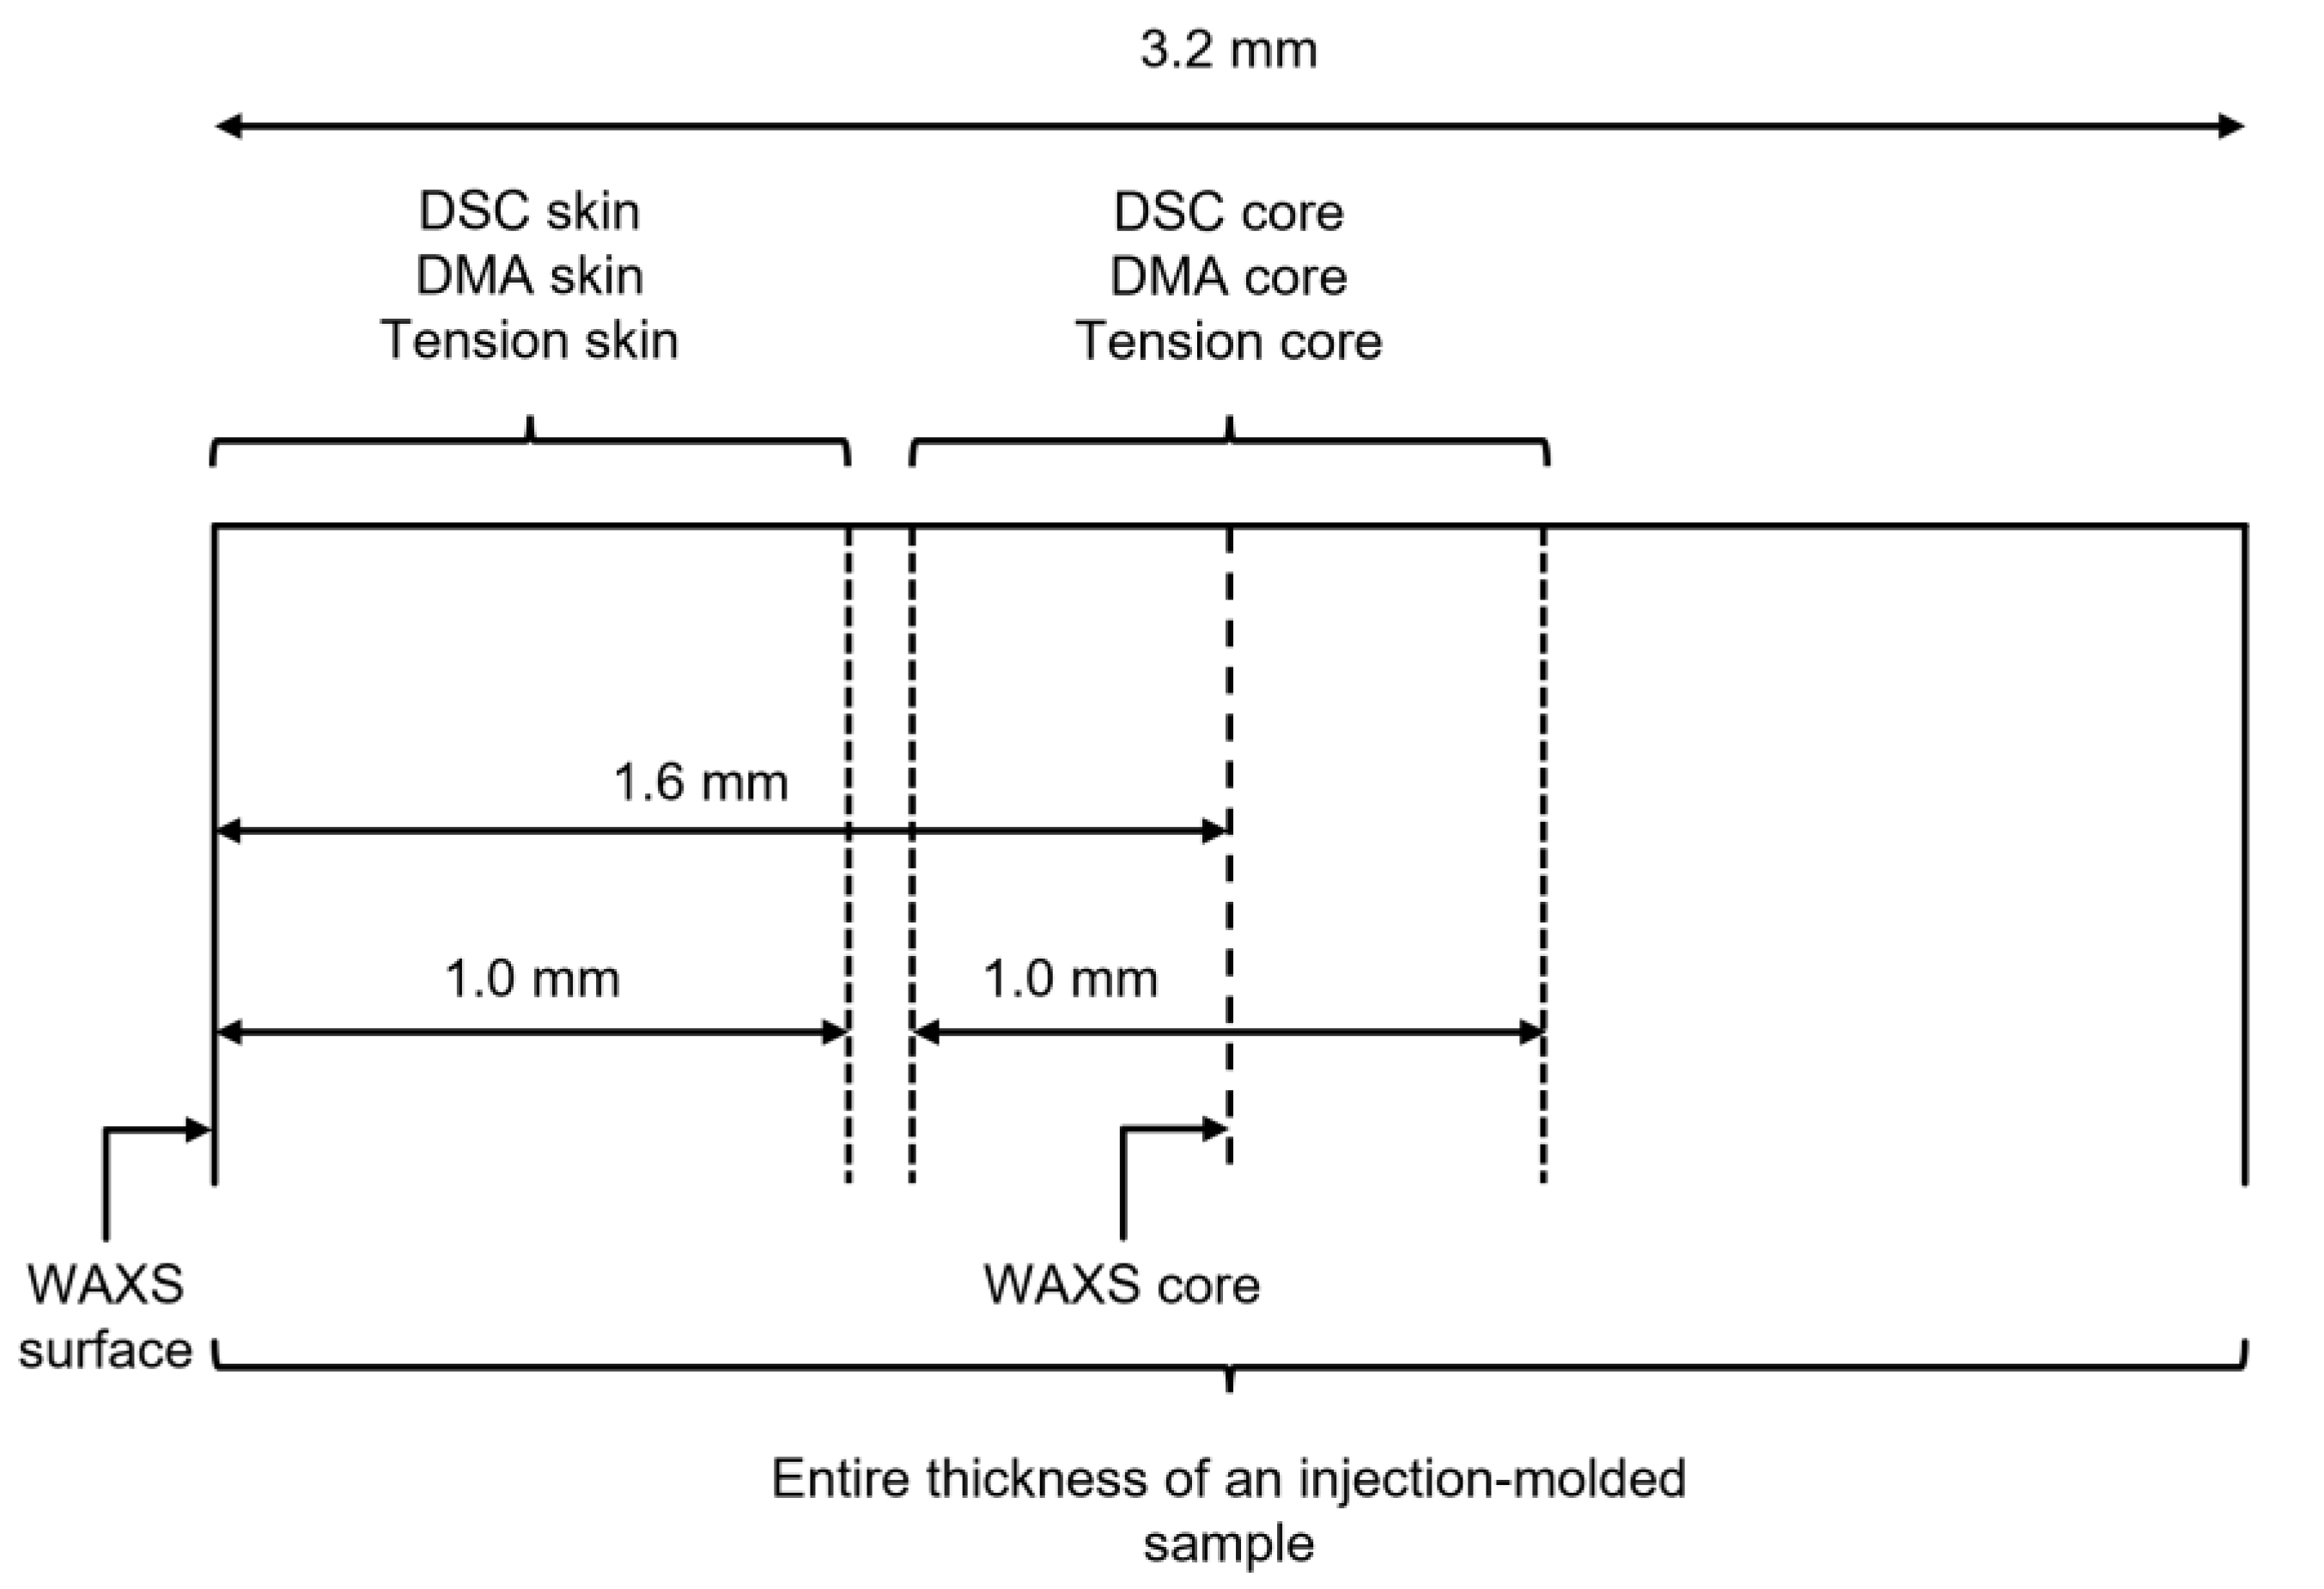
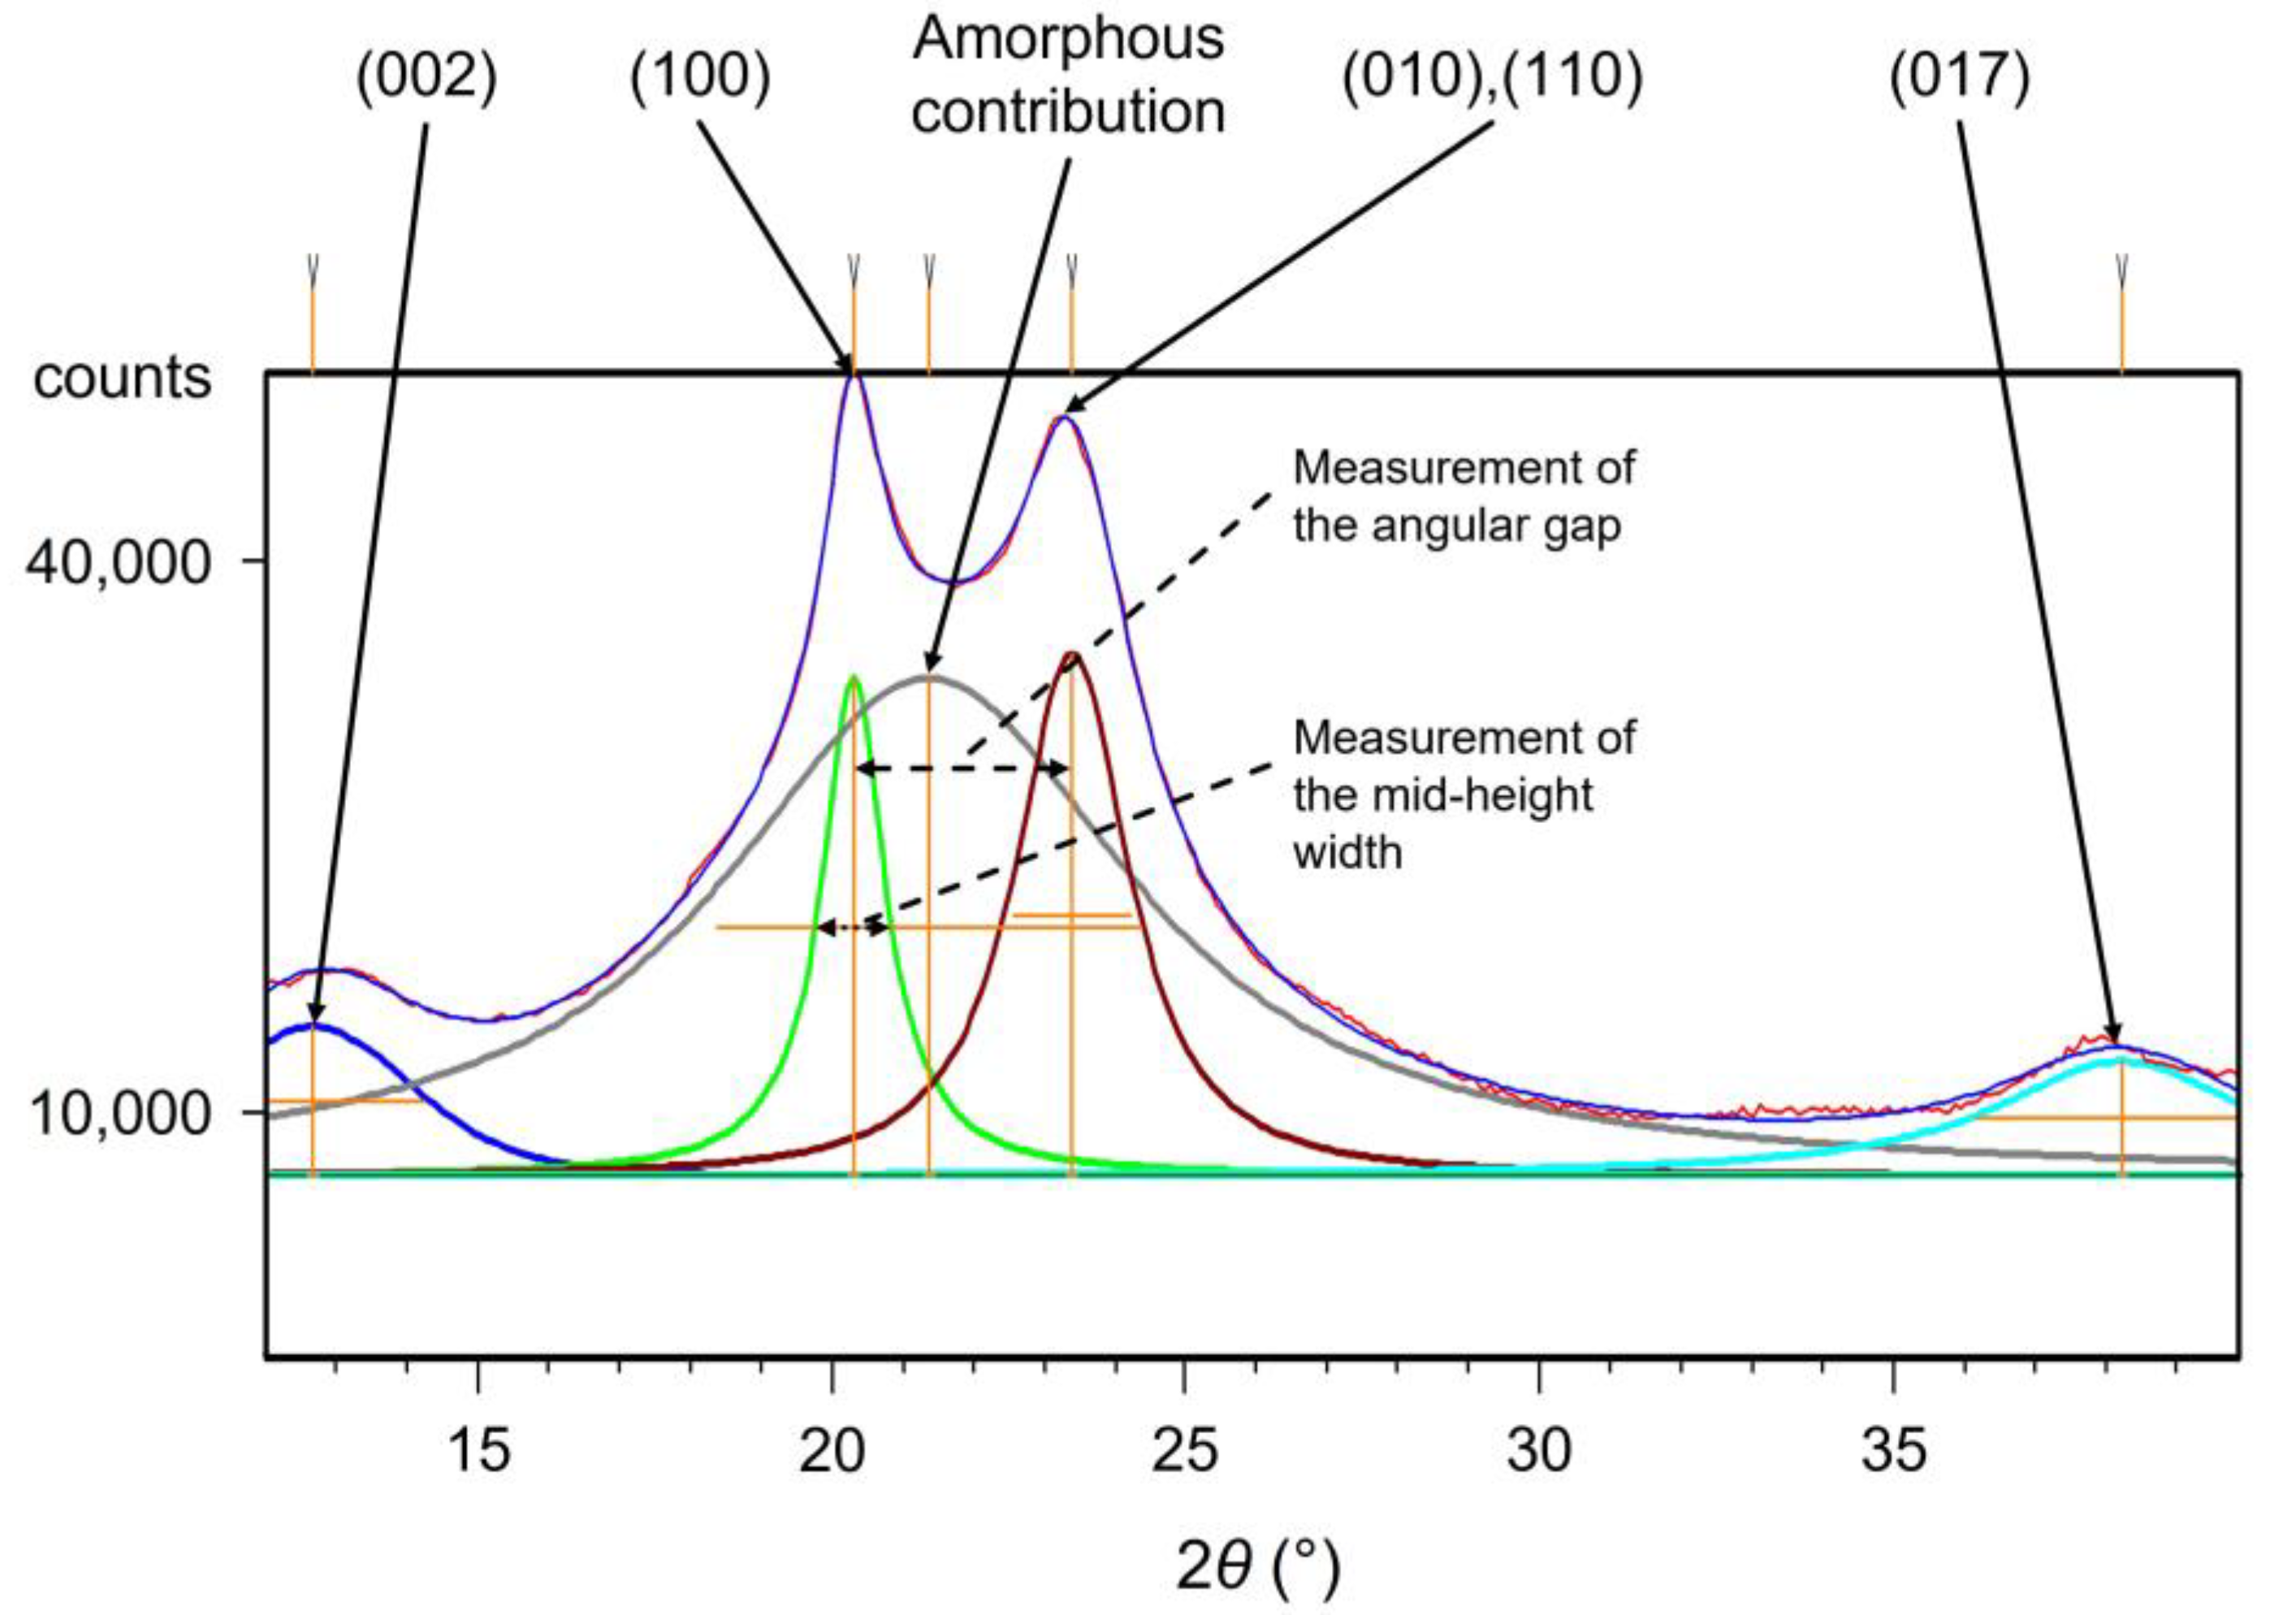
2.4. Wide Angle X-ray Scattering
2.5. Differential Scanning Calorimetry
2.6. Dynamic Mechanical Analysis
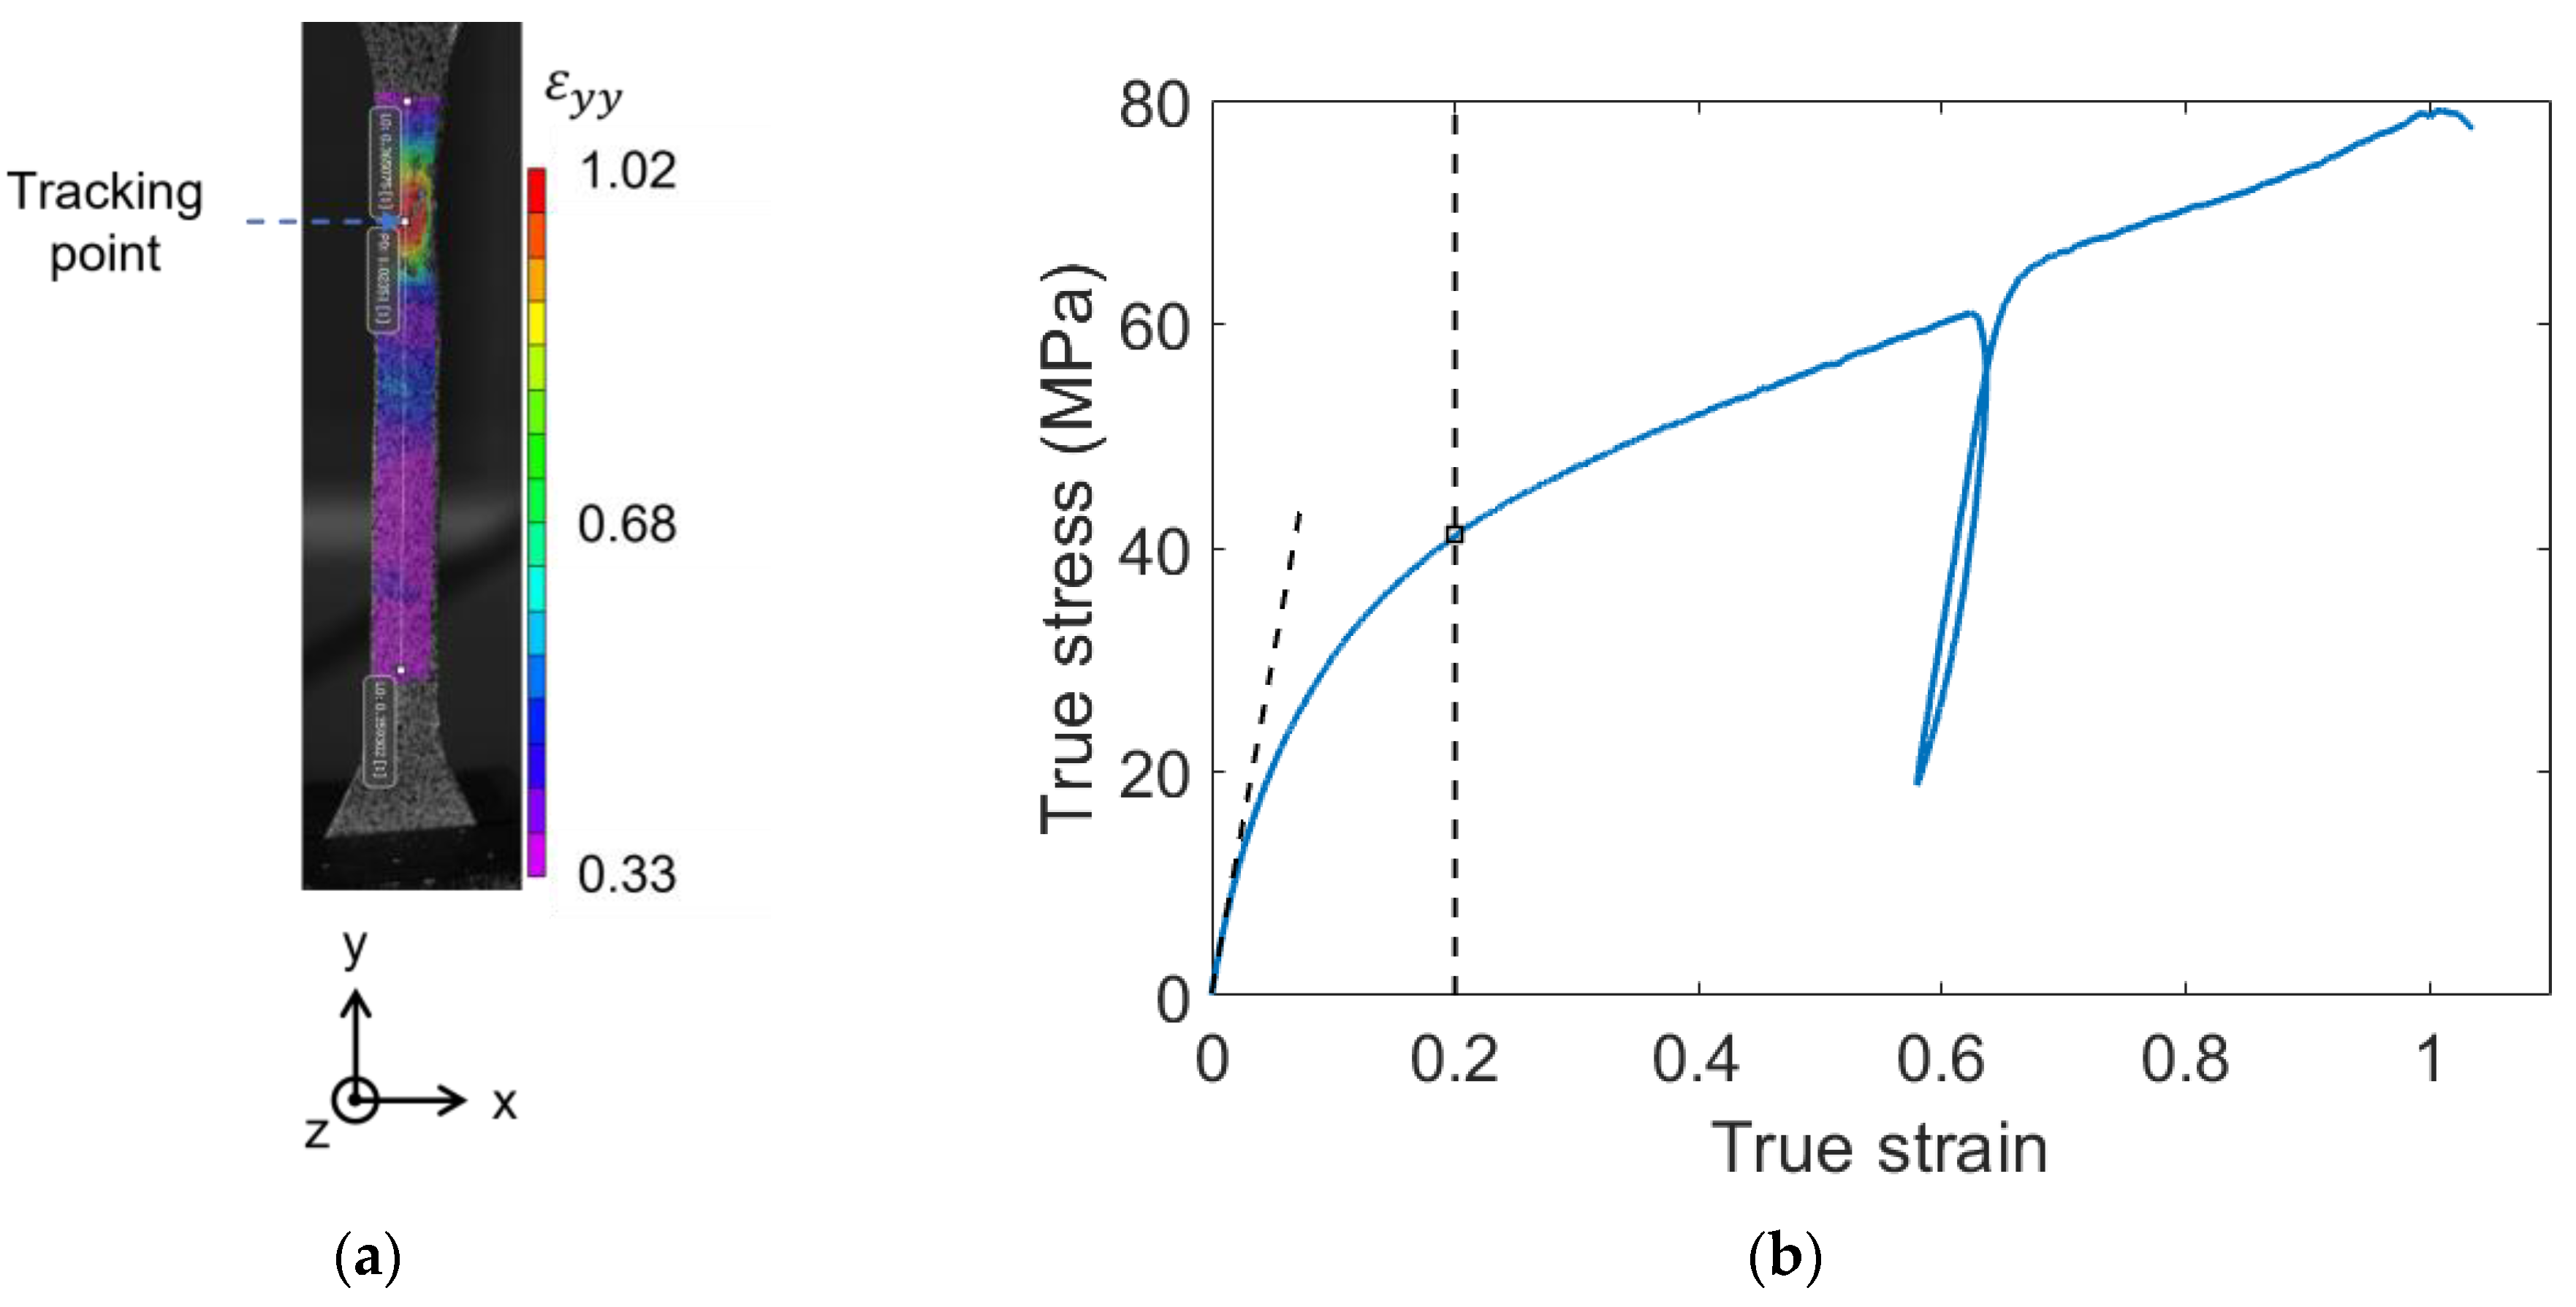
2.7. Tensile Testing
3. Results and Discussion
3.1. Microstructural Evolution
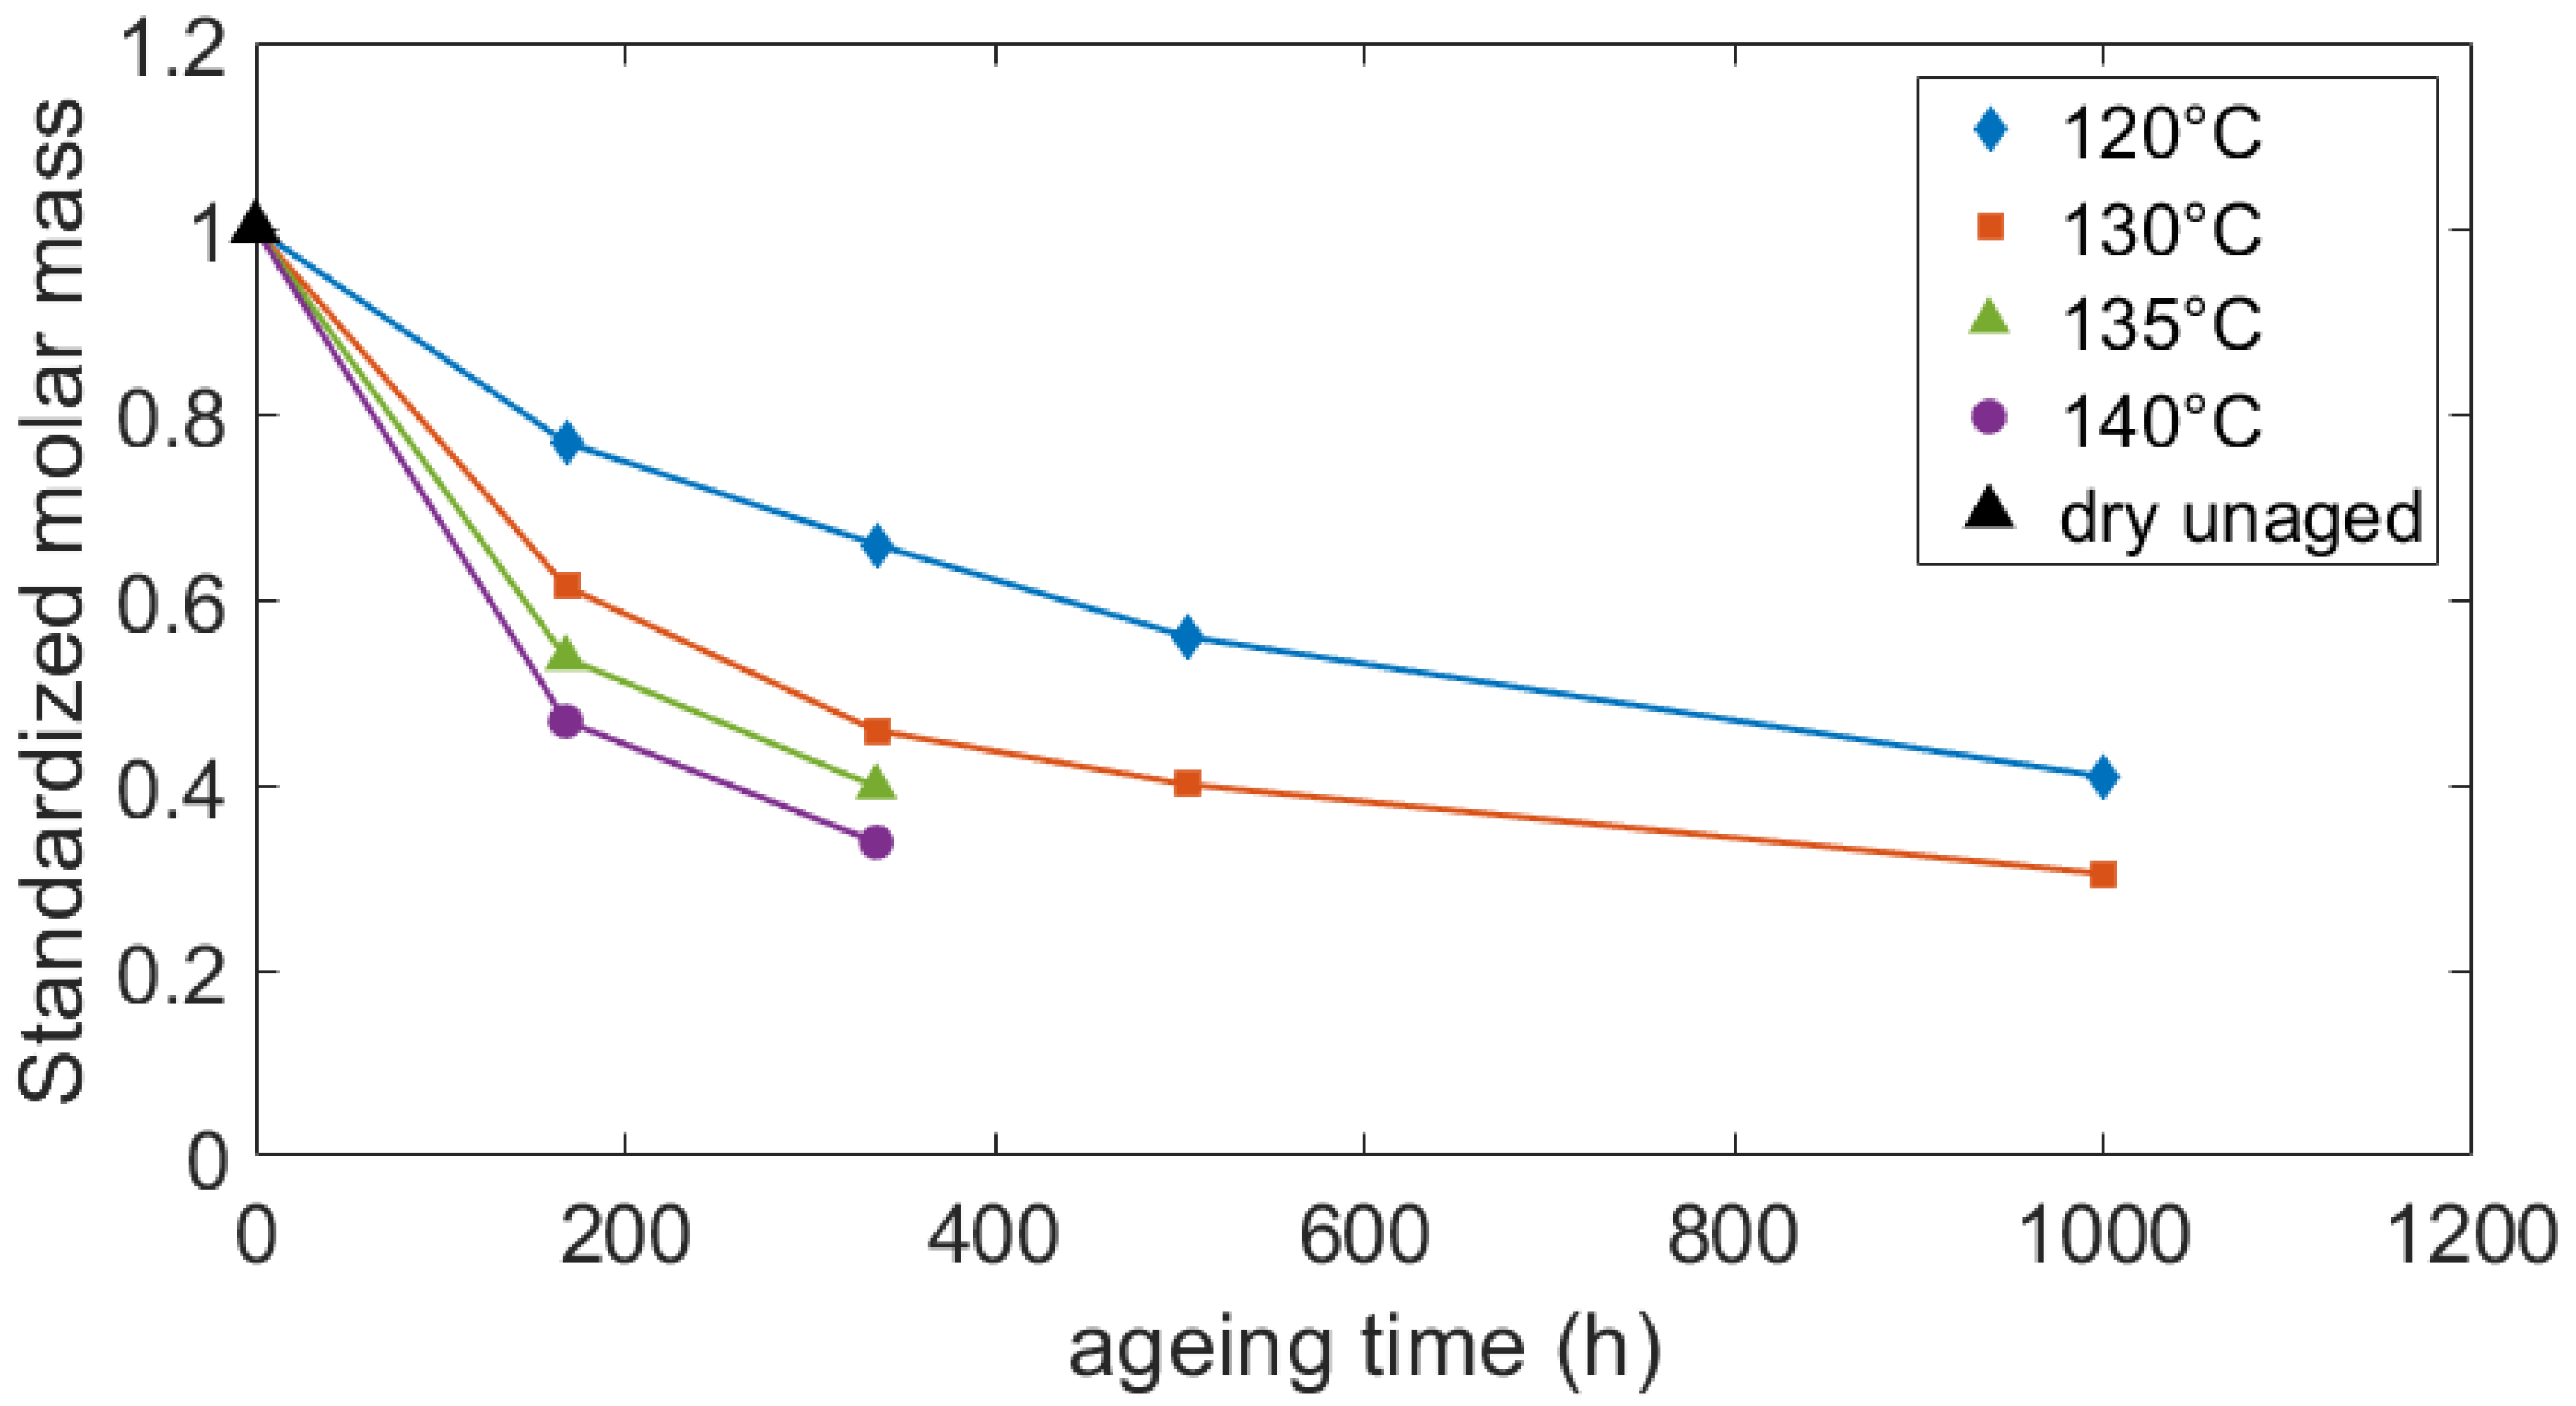
3.1.1. Average Molar Mass
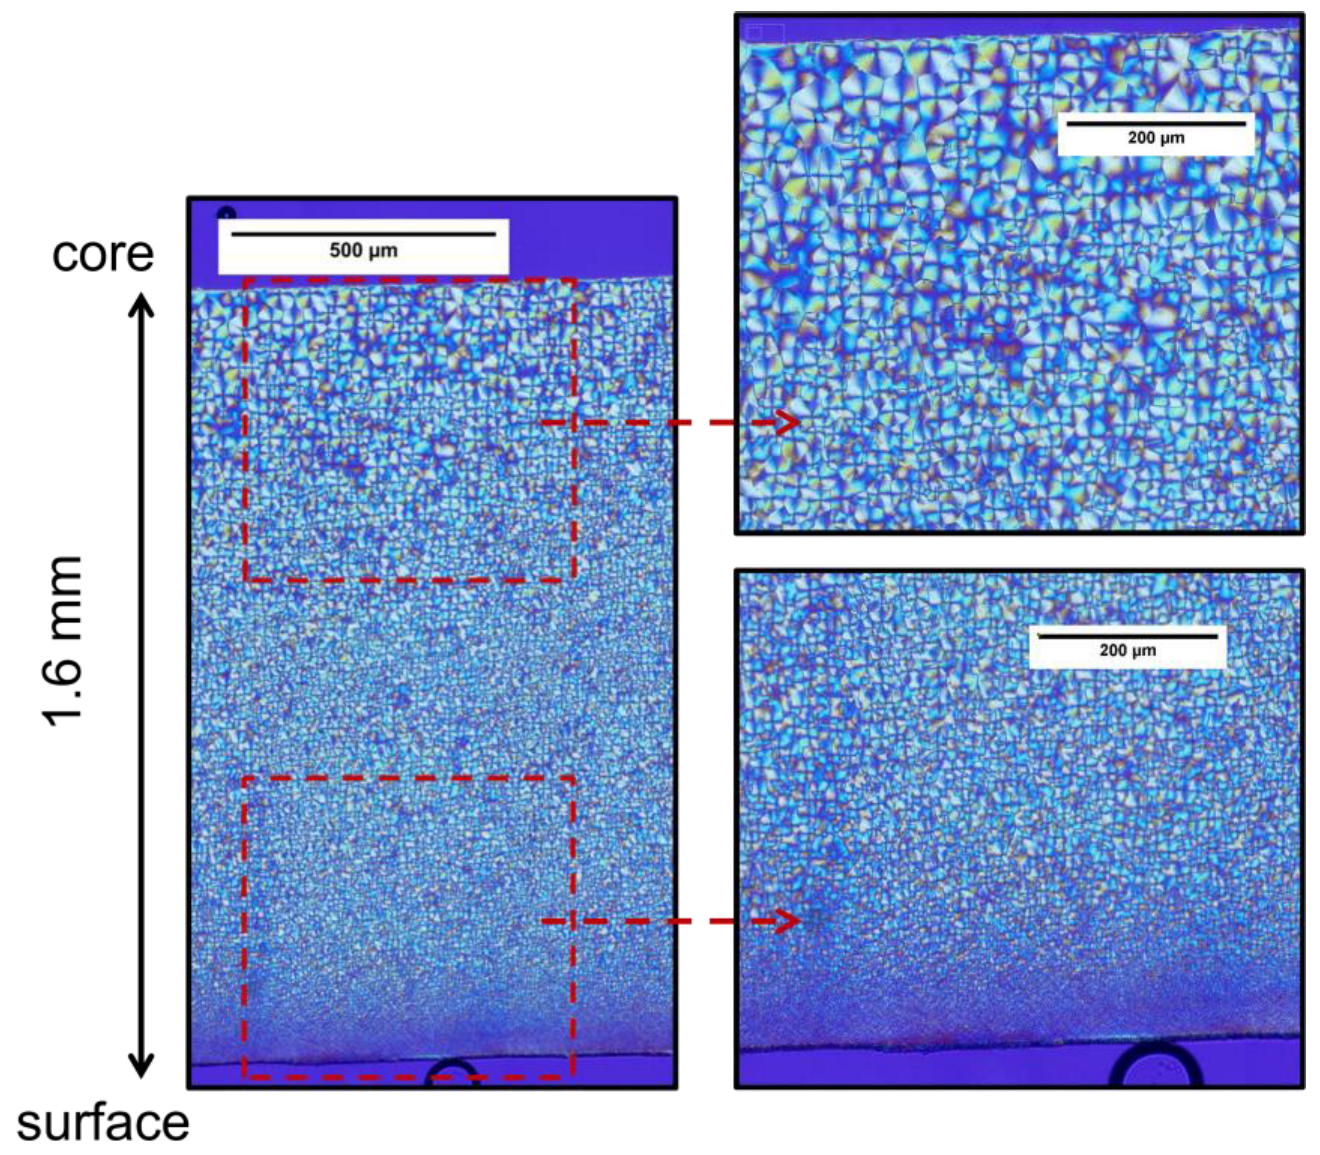
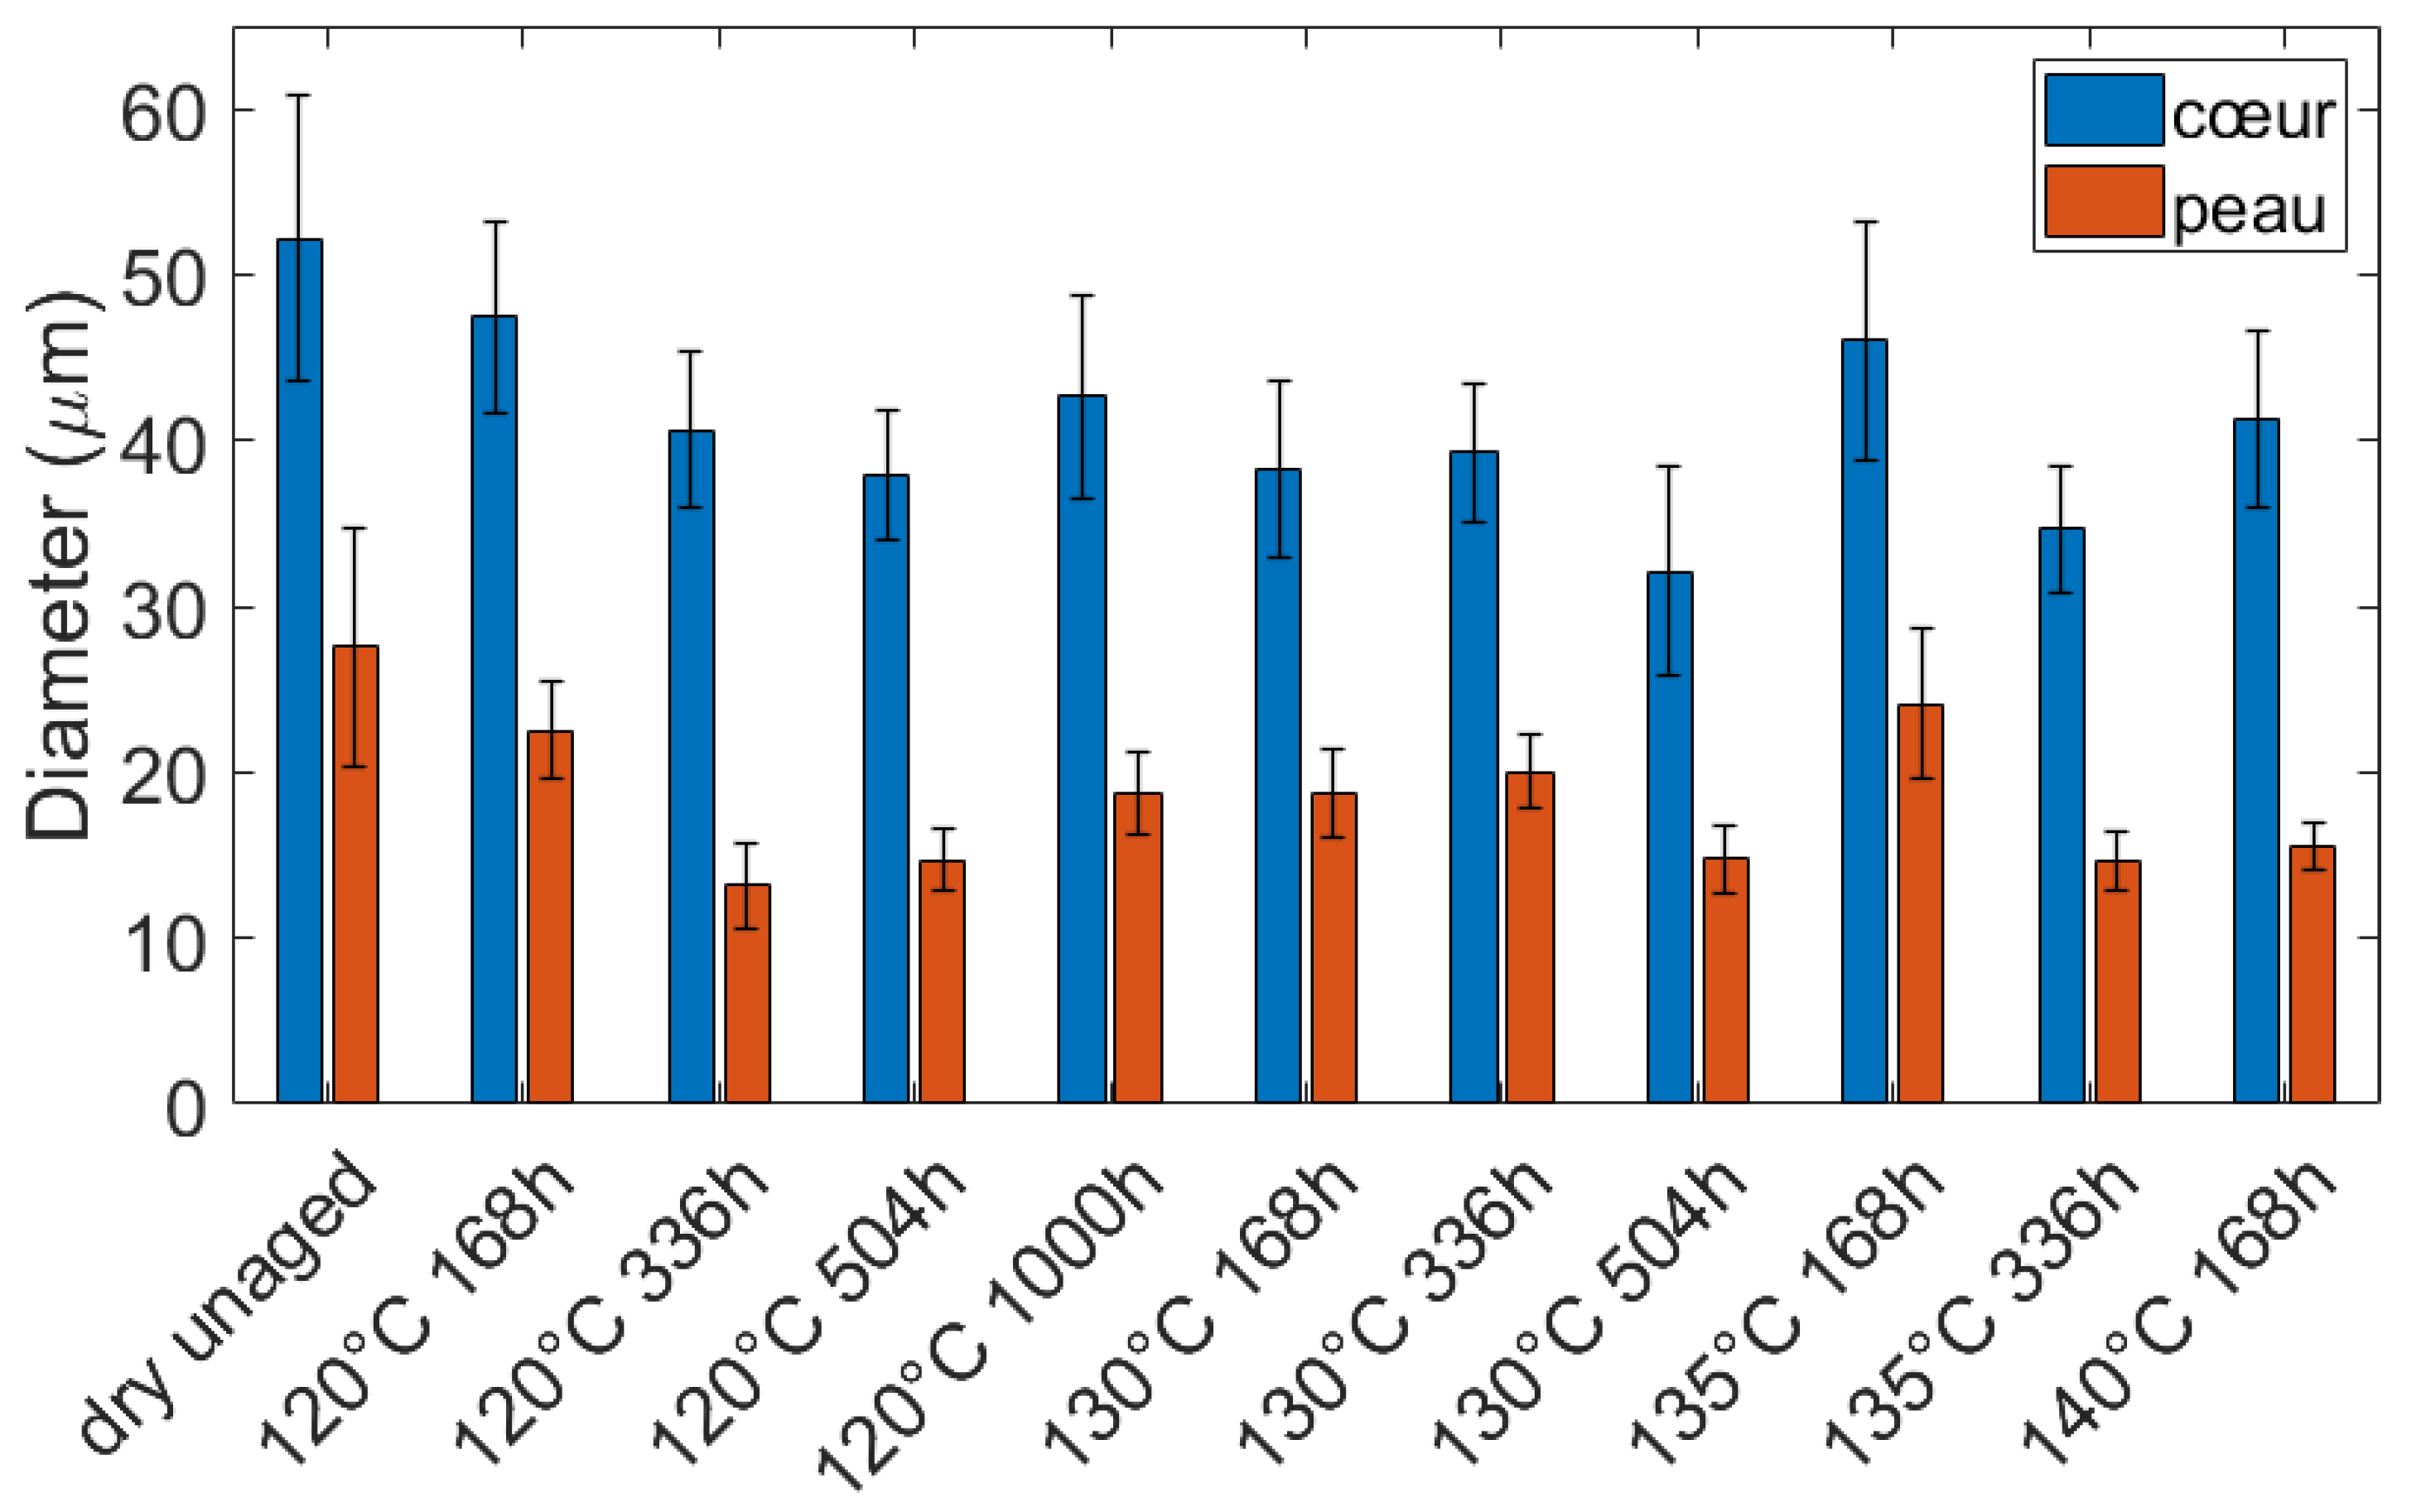
3.1.2. Microscopy Observations
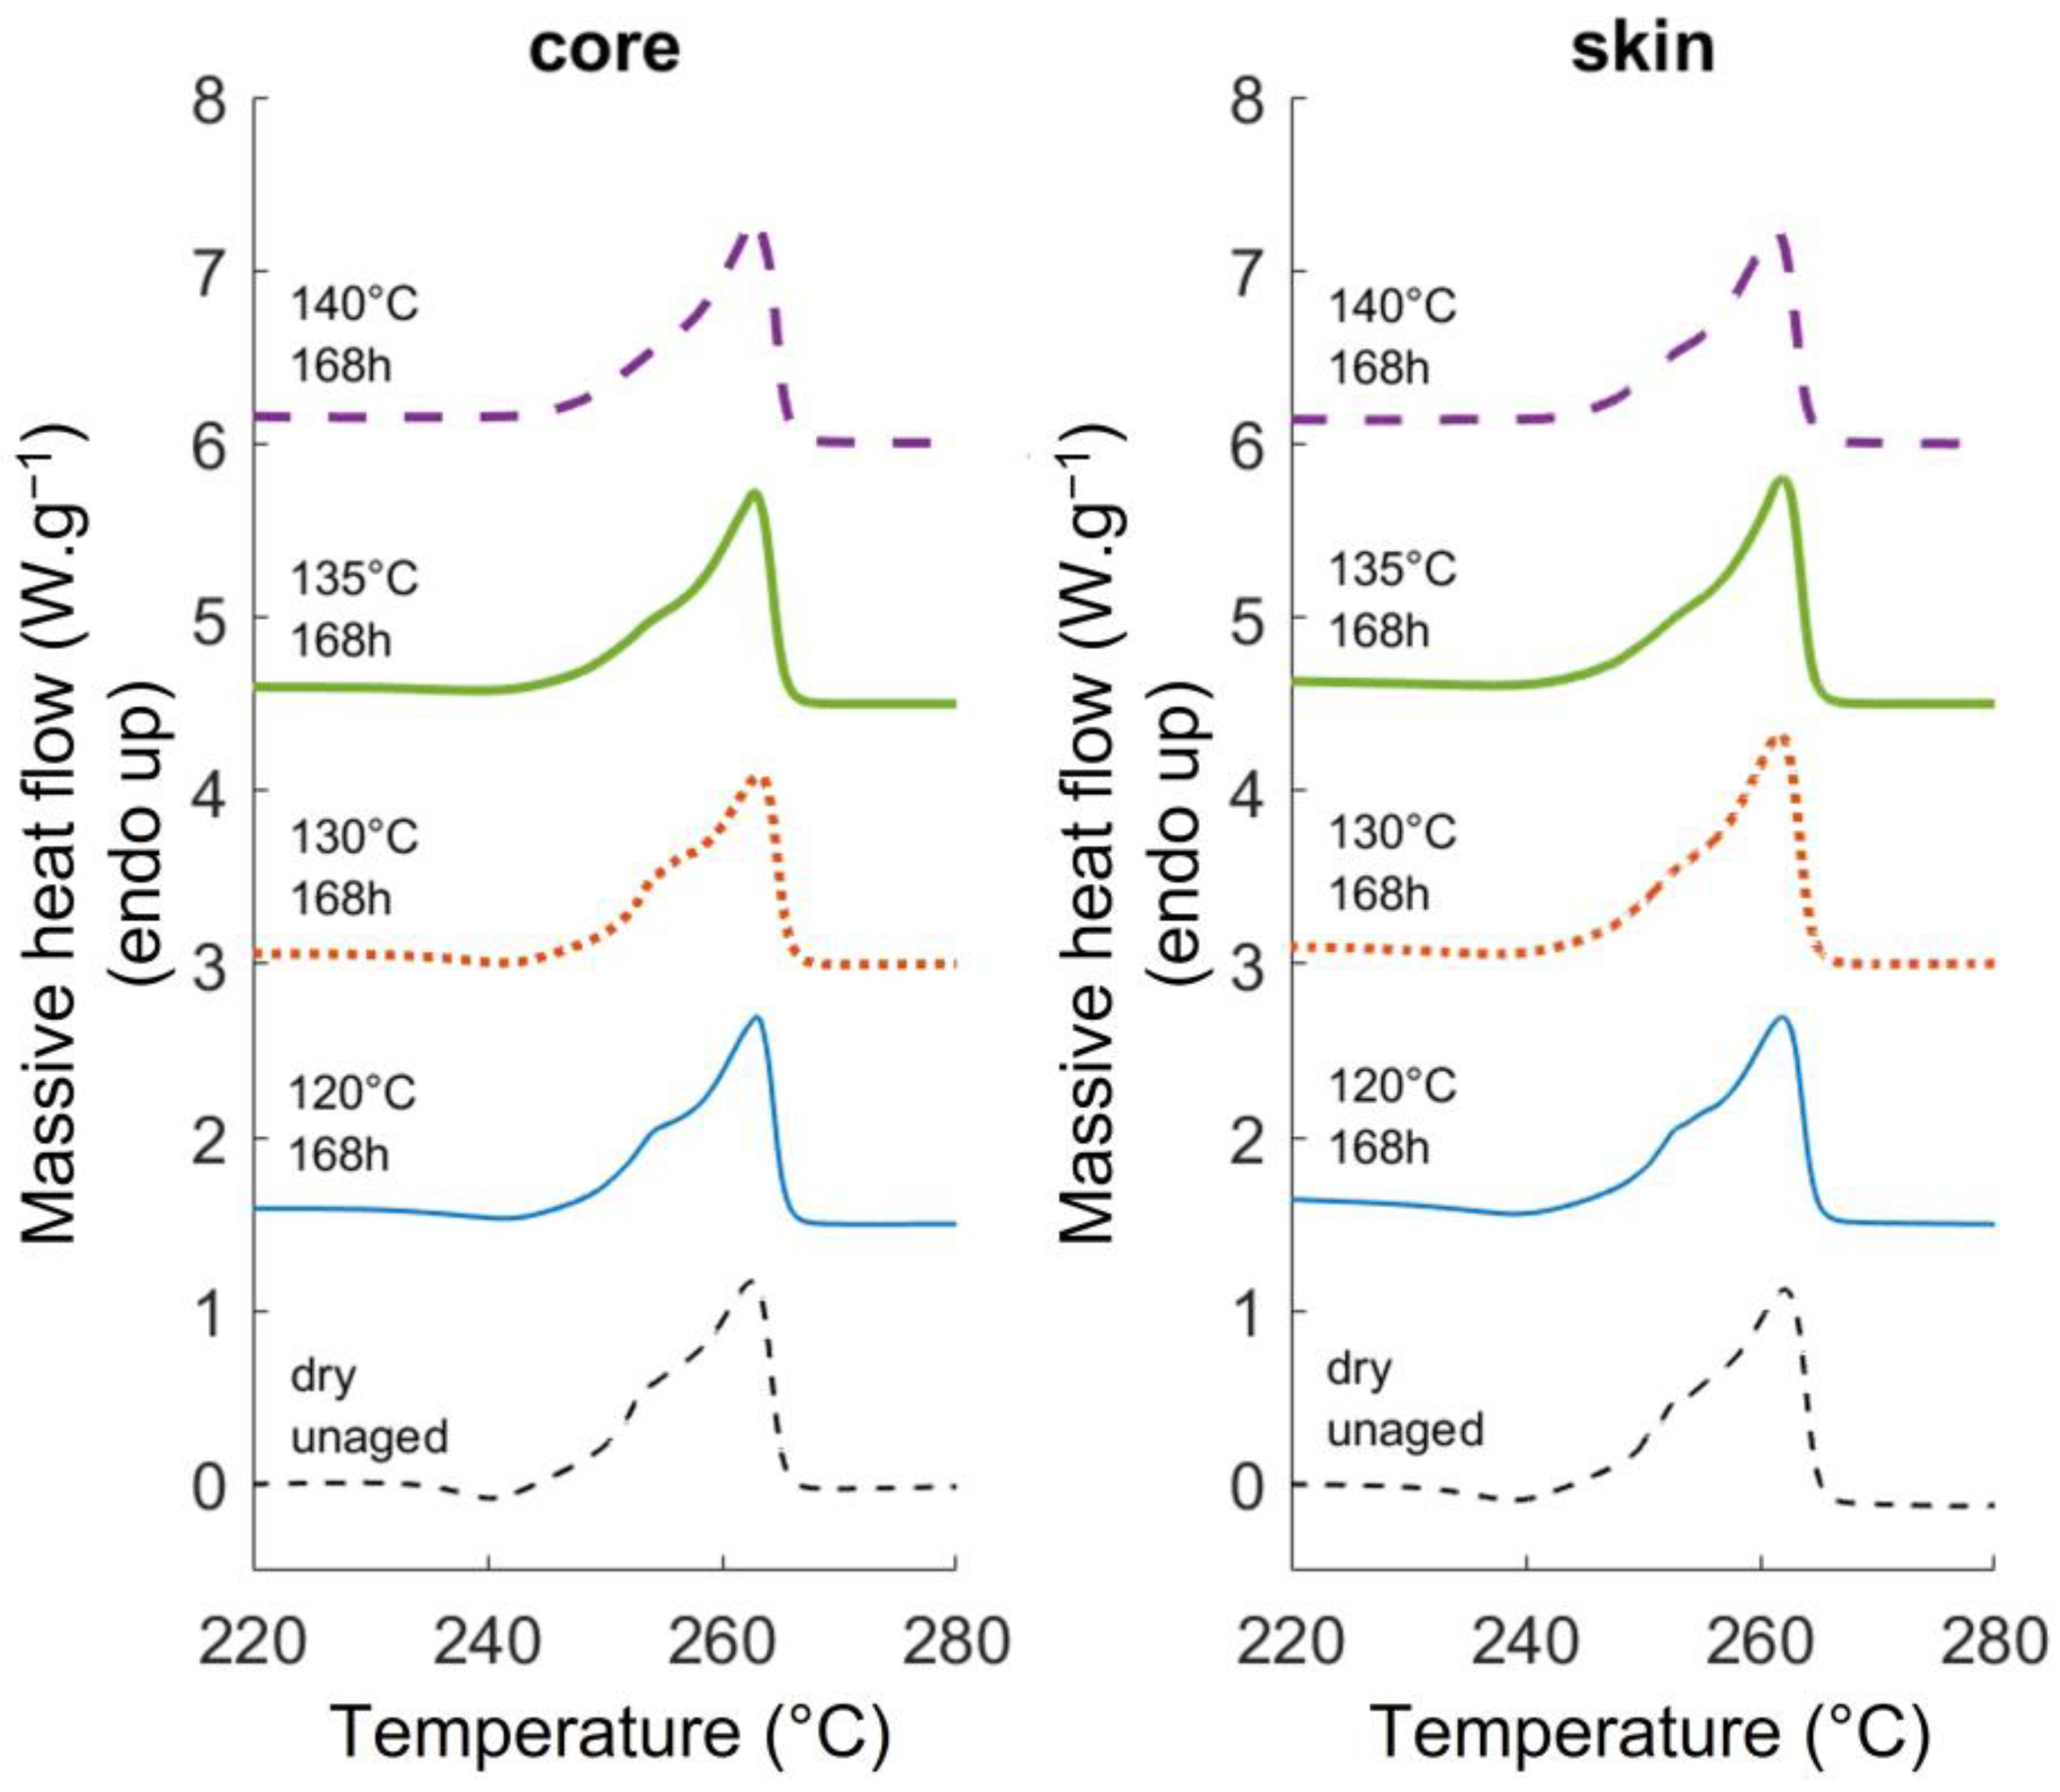
3.1.3. DSC Results
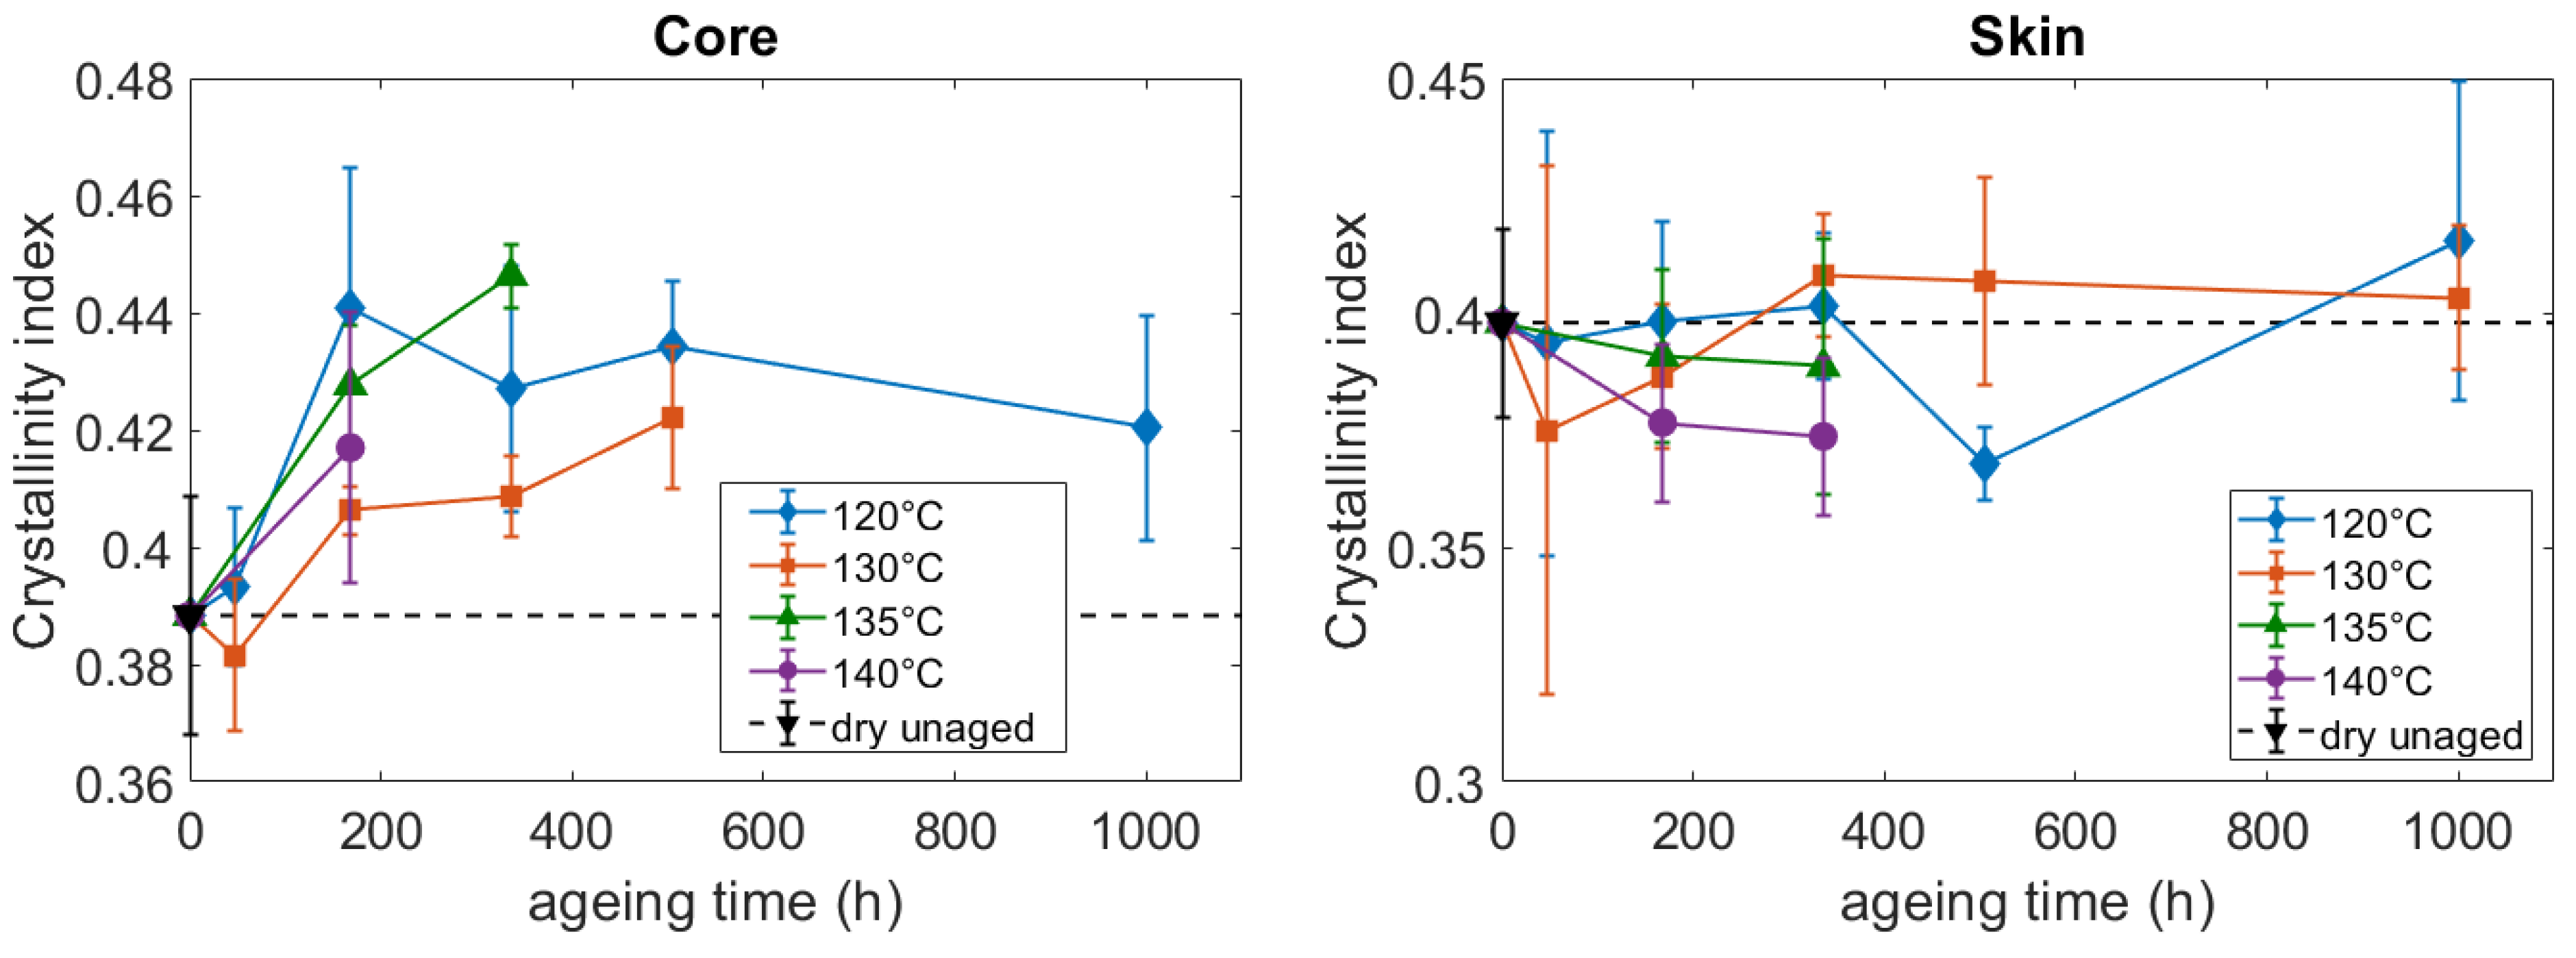
3.1.4. WAXS Results
3.1.5. Microstructural Summary
3.2. Mechanical Consequences
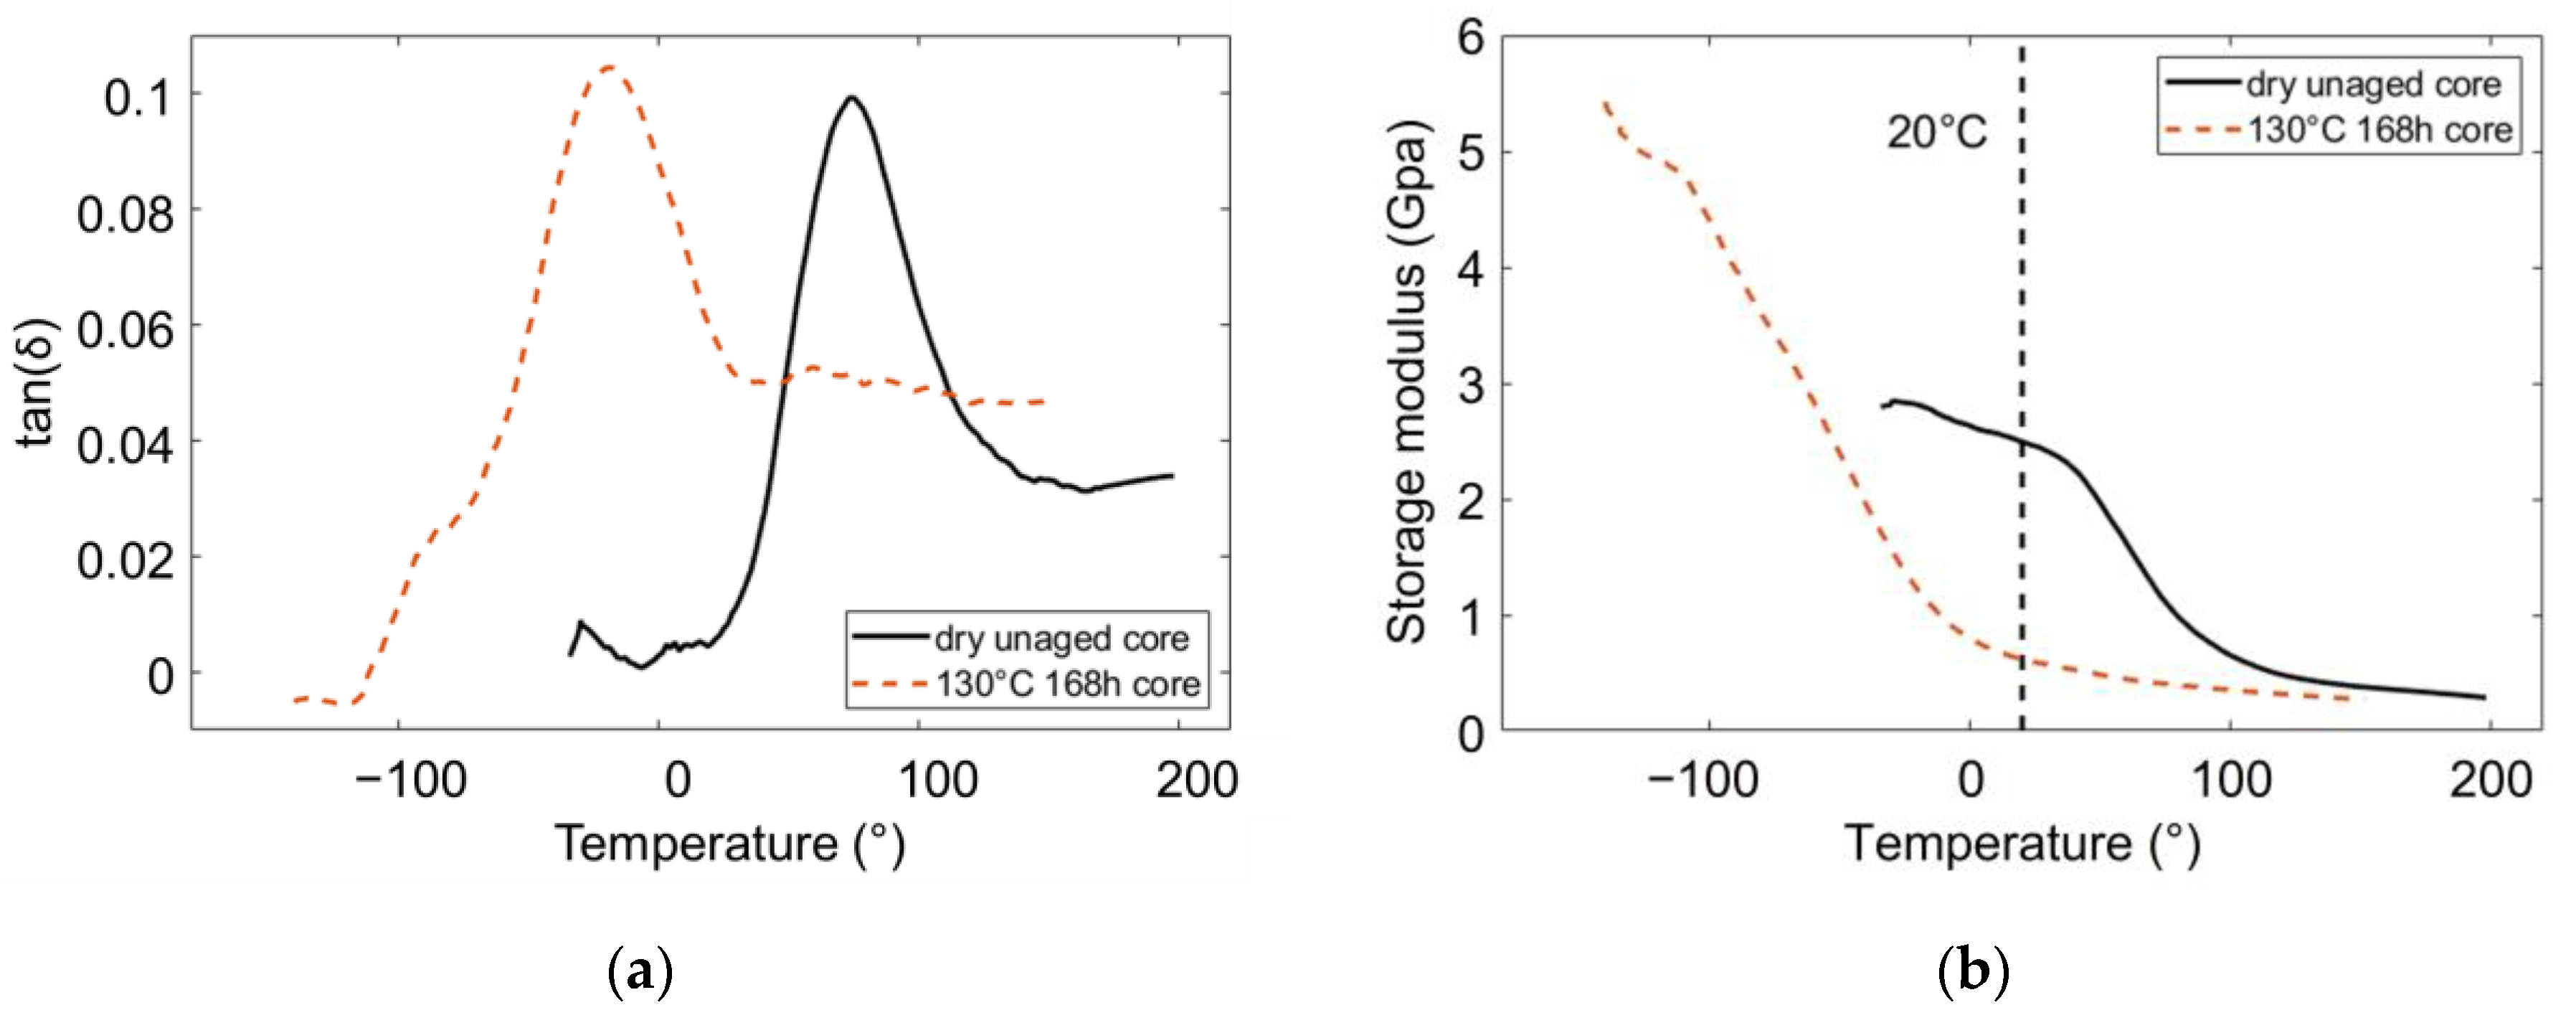
3.2.1. Plasticization
- The additional drying could again modify significatively the microstructure of the aged samples;
- It would avoid eventual mechanical consequences due to the presence of water and ethylene glycol other than plasticization.
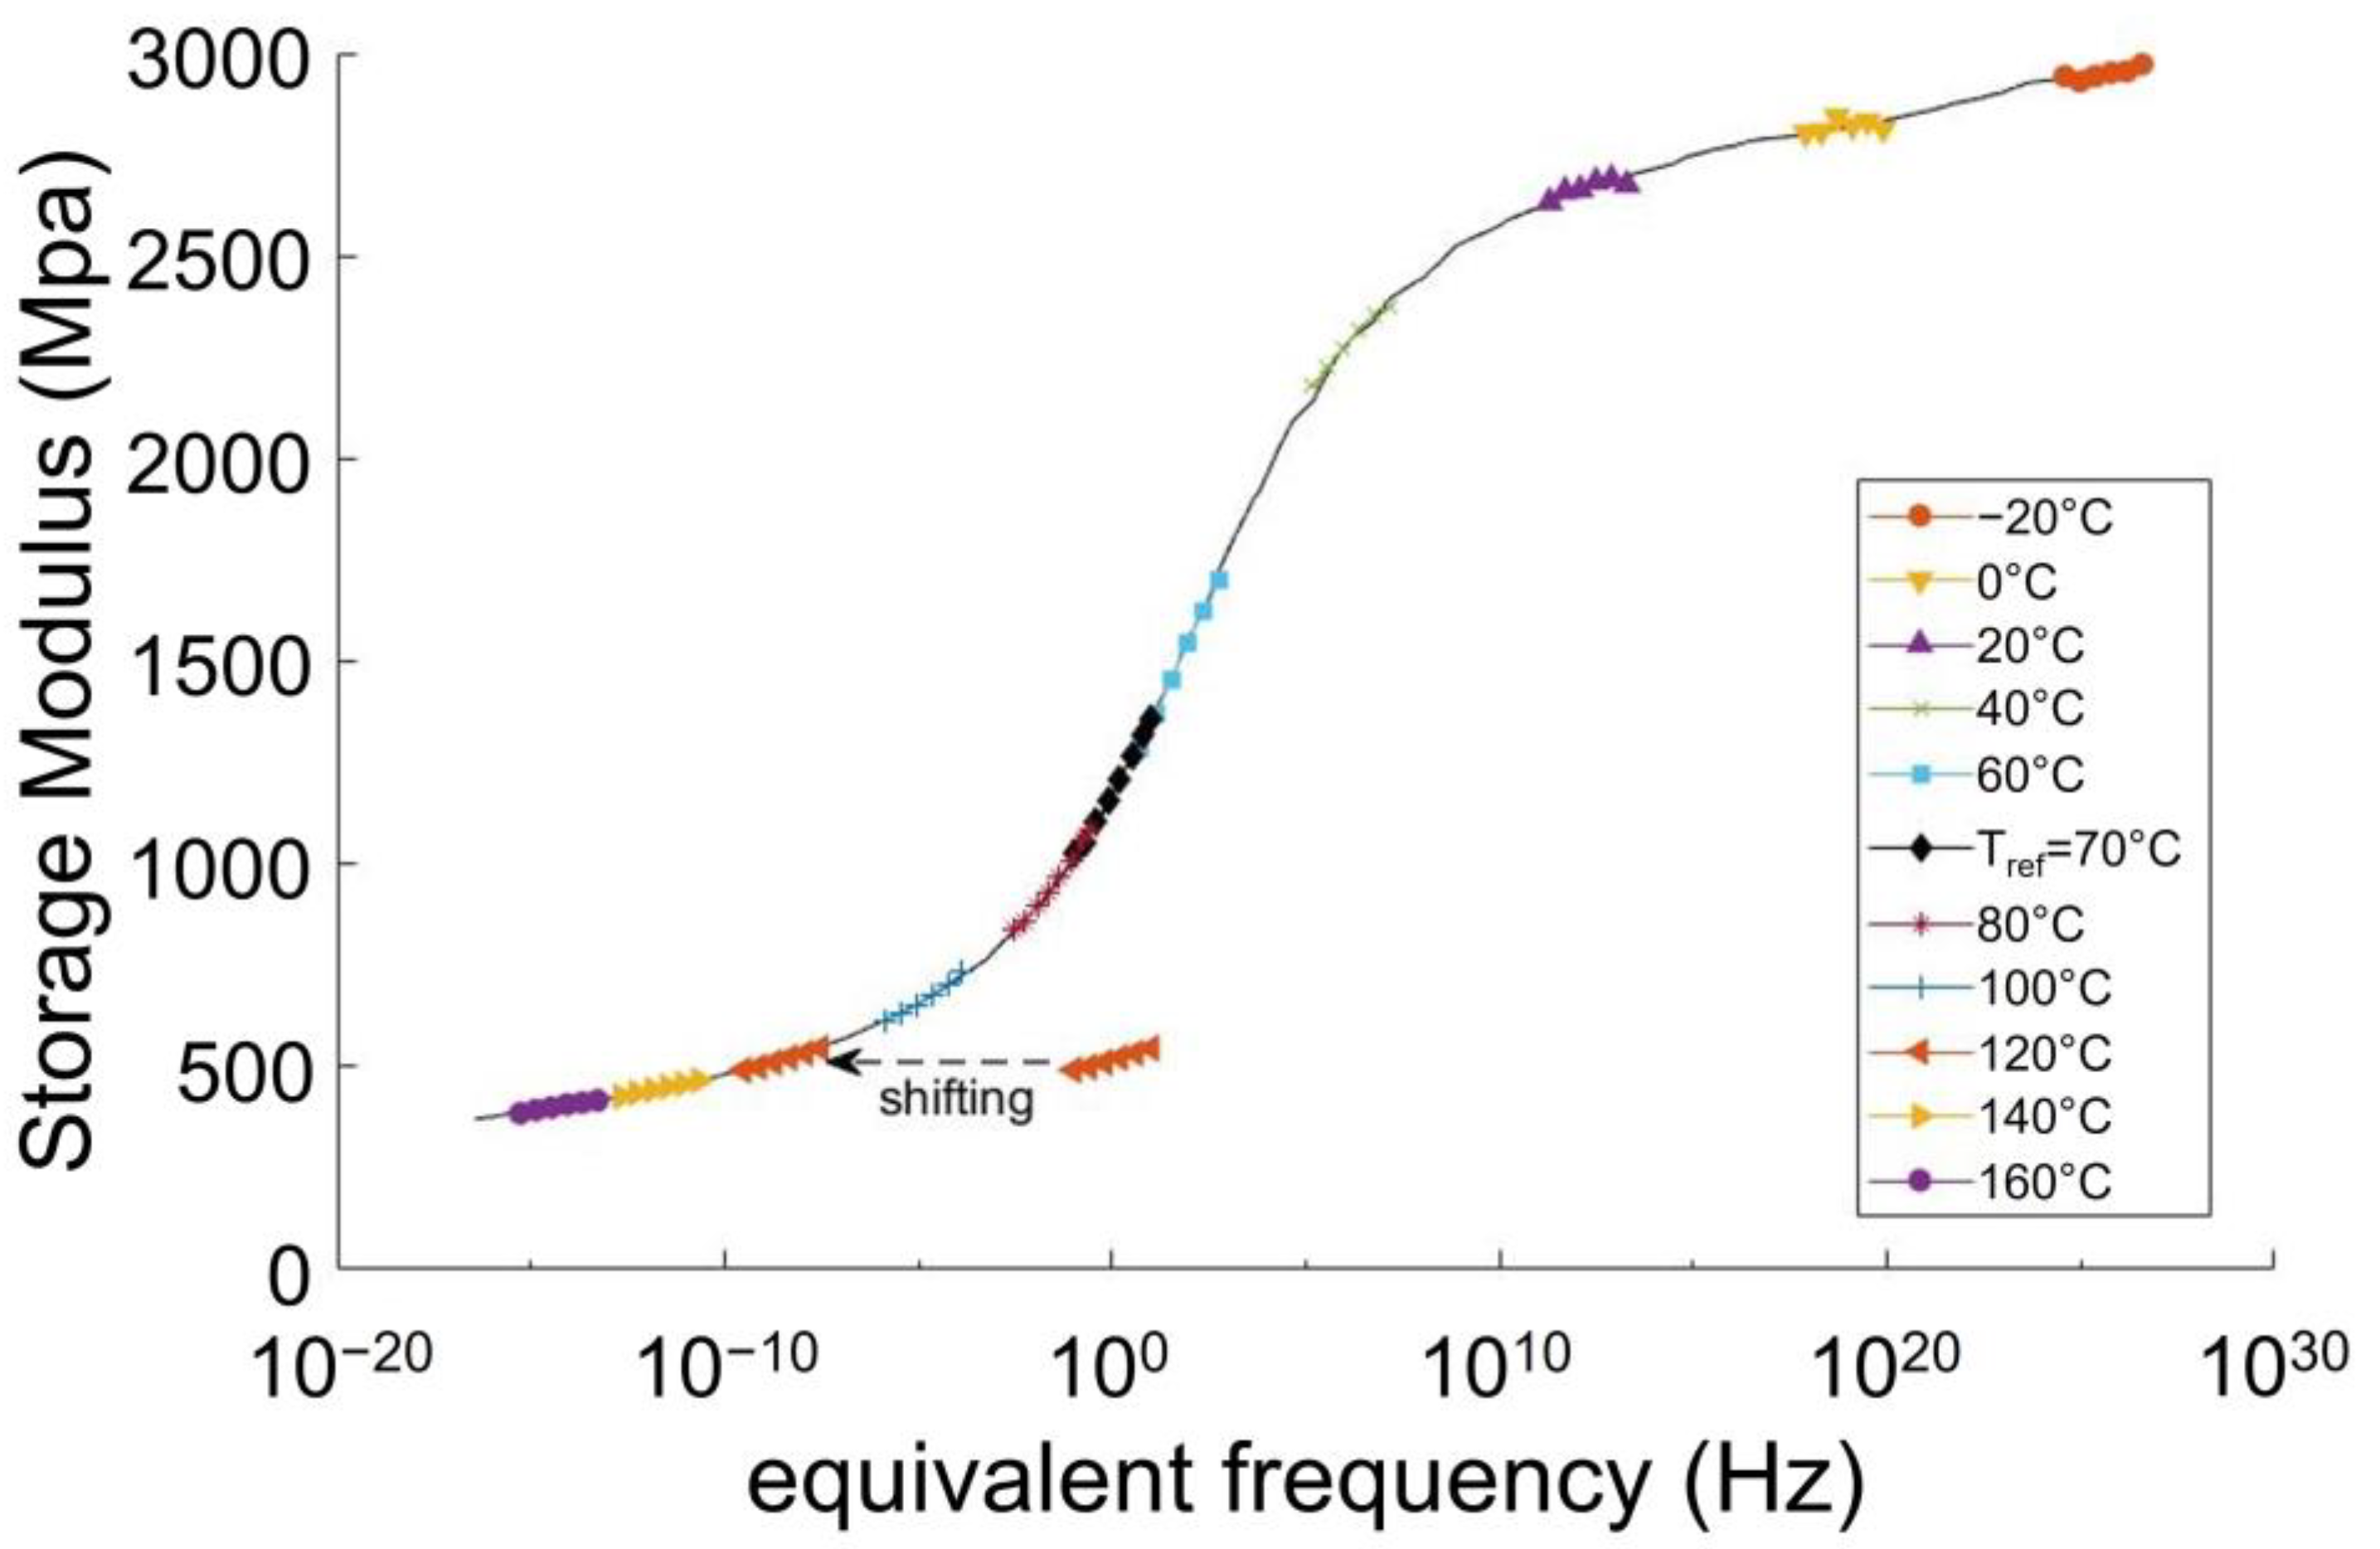
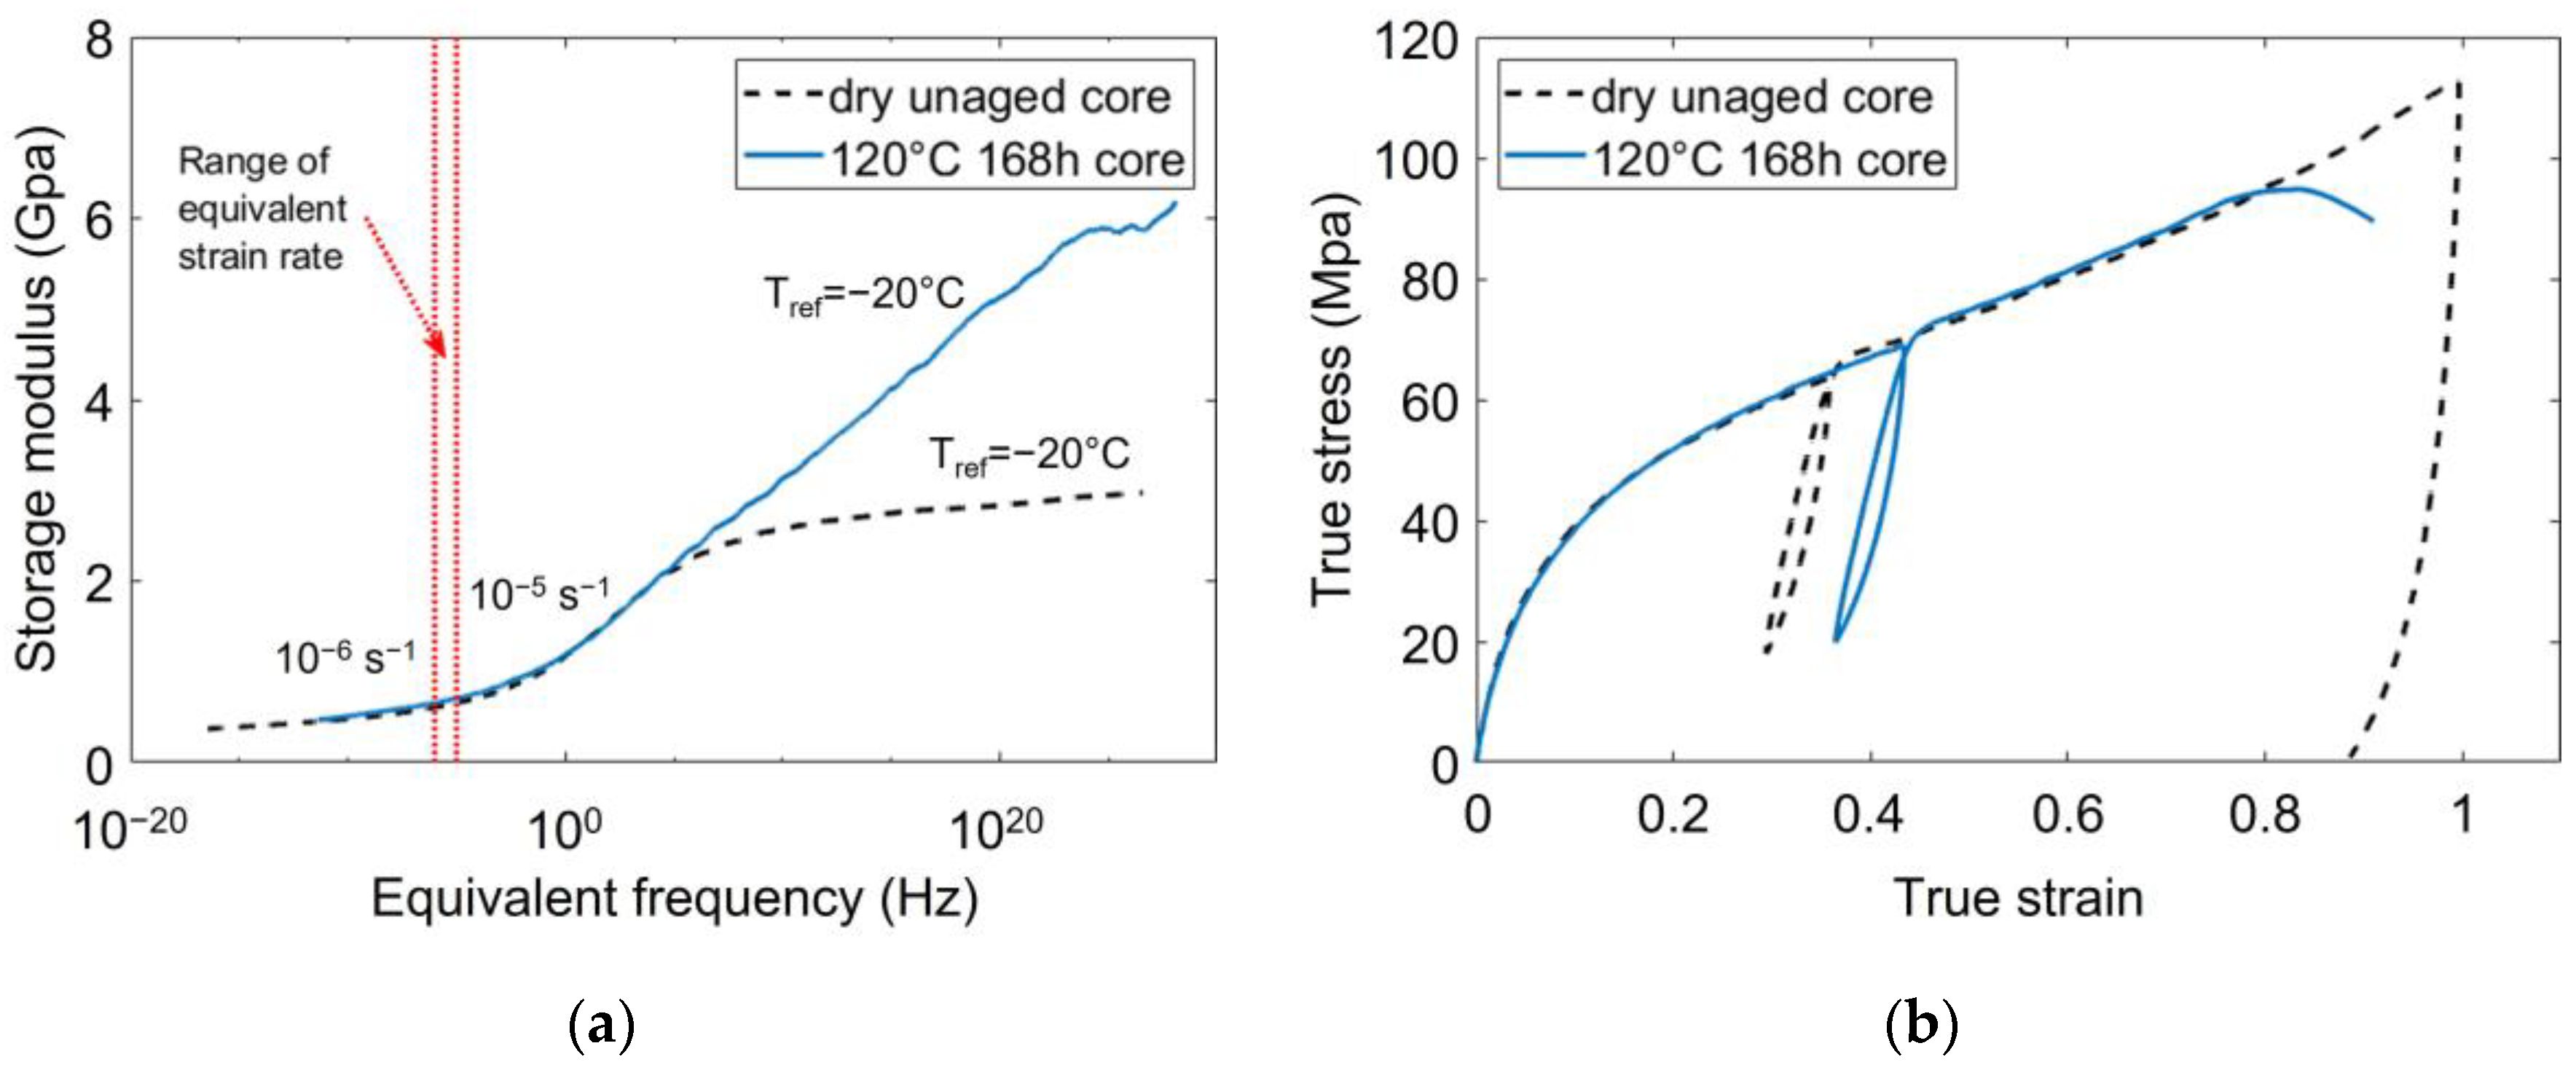
- Referring to the time-temperature superposition principle is a relevant approach to foresee the mechanical behavior of PA66 and to set the loading conditions;
- Thanks to this approach all the PA66 considered in this survey were loaded in a rubbery-like state without resorting to an additional drying of the aged specimens.
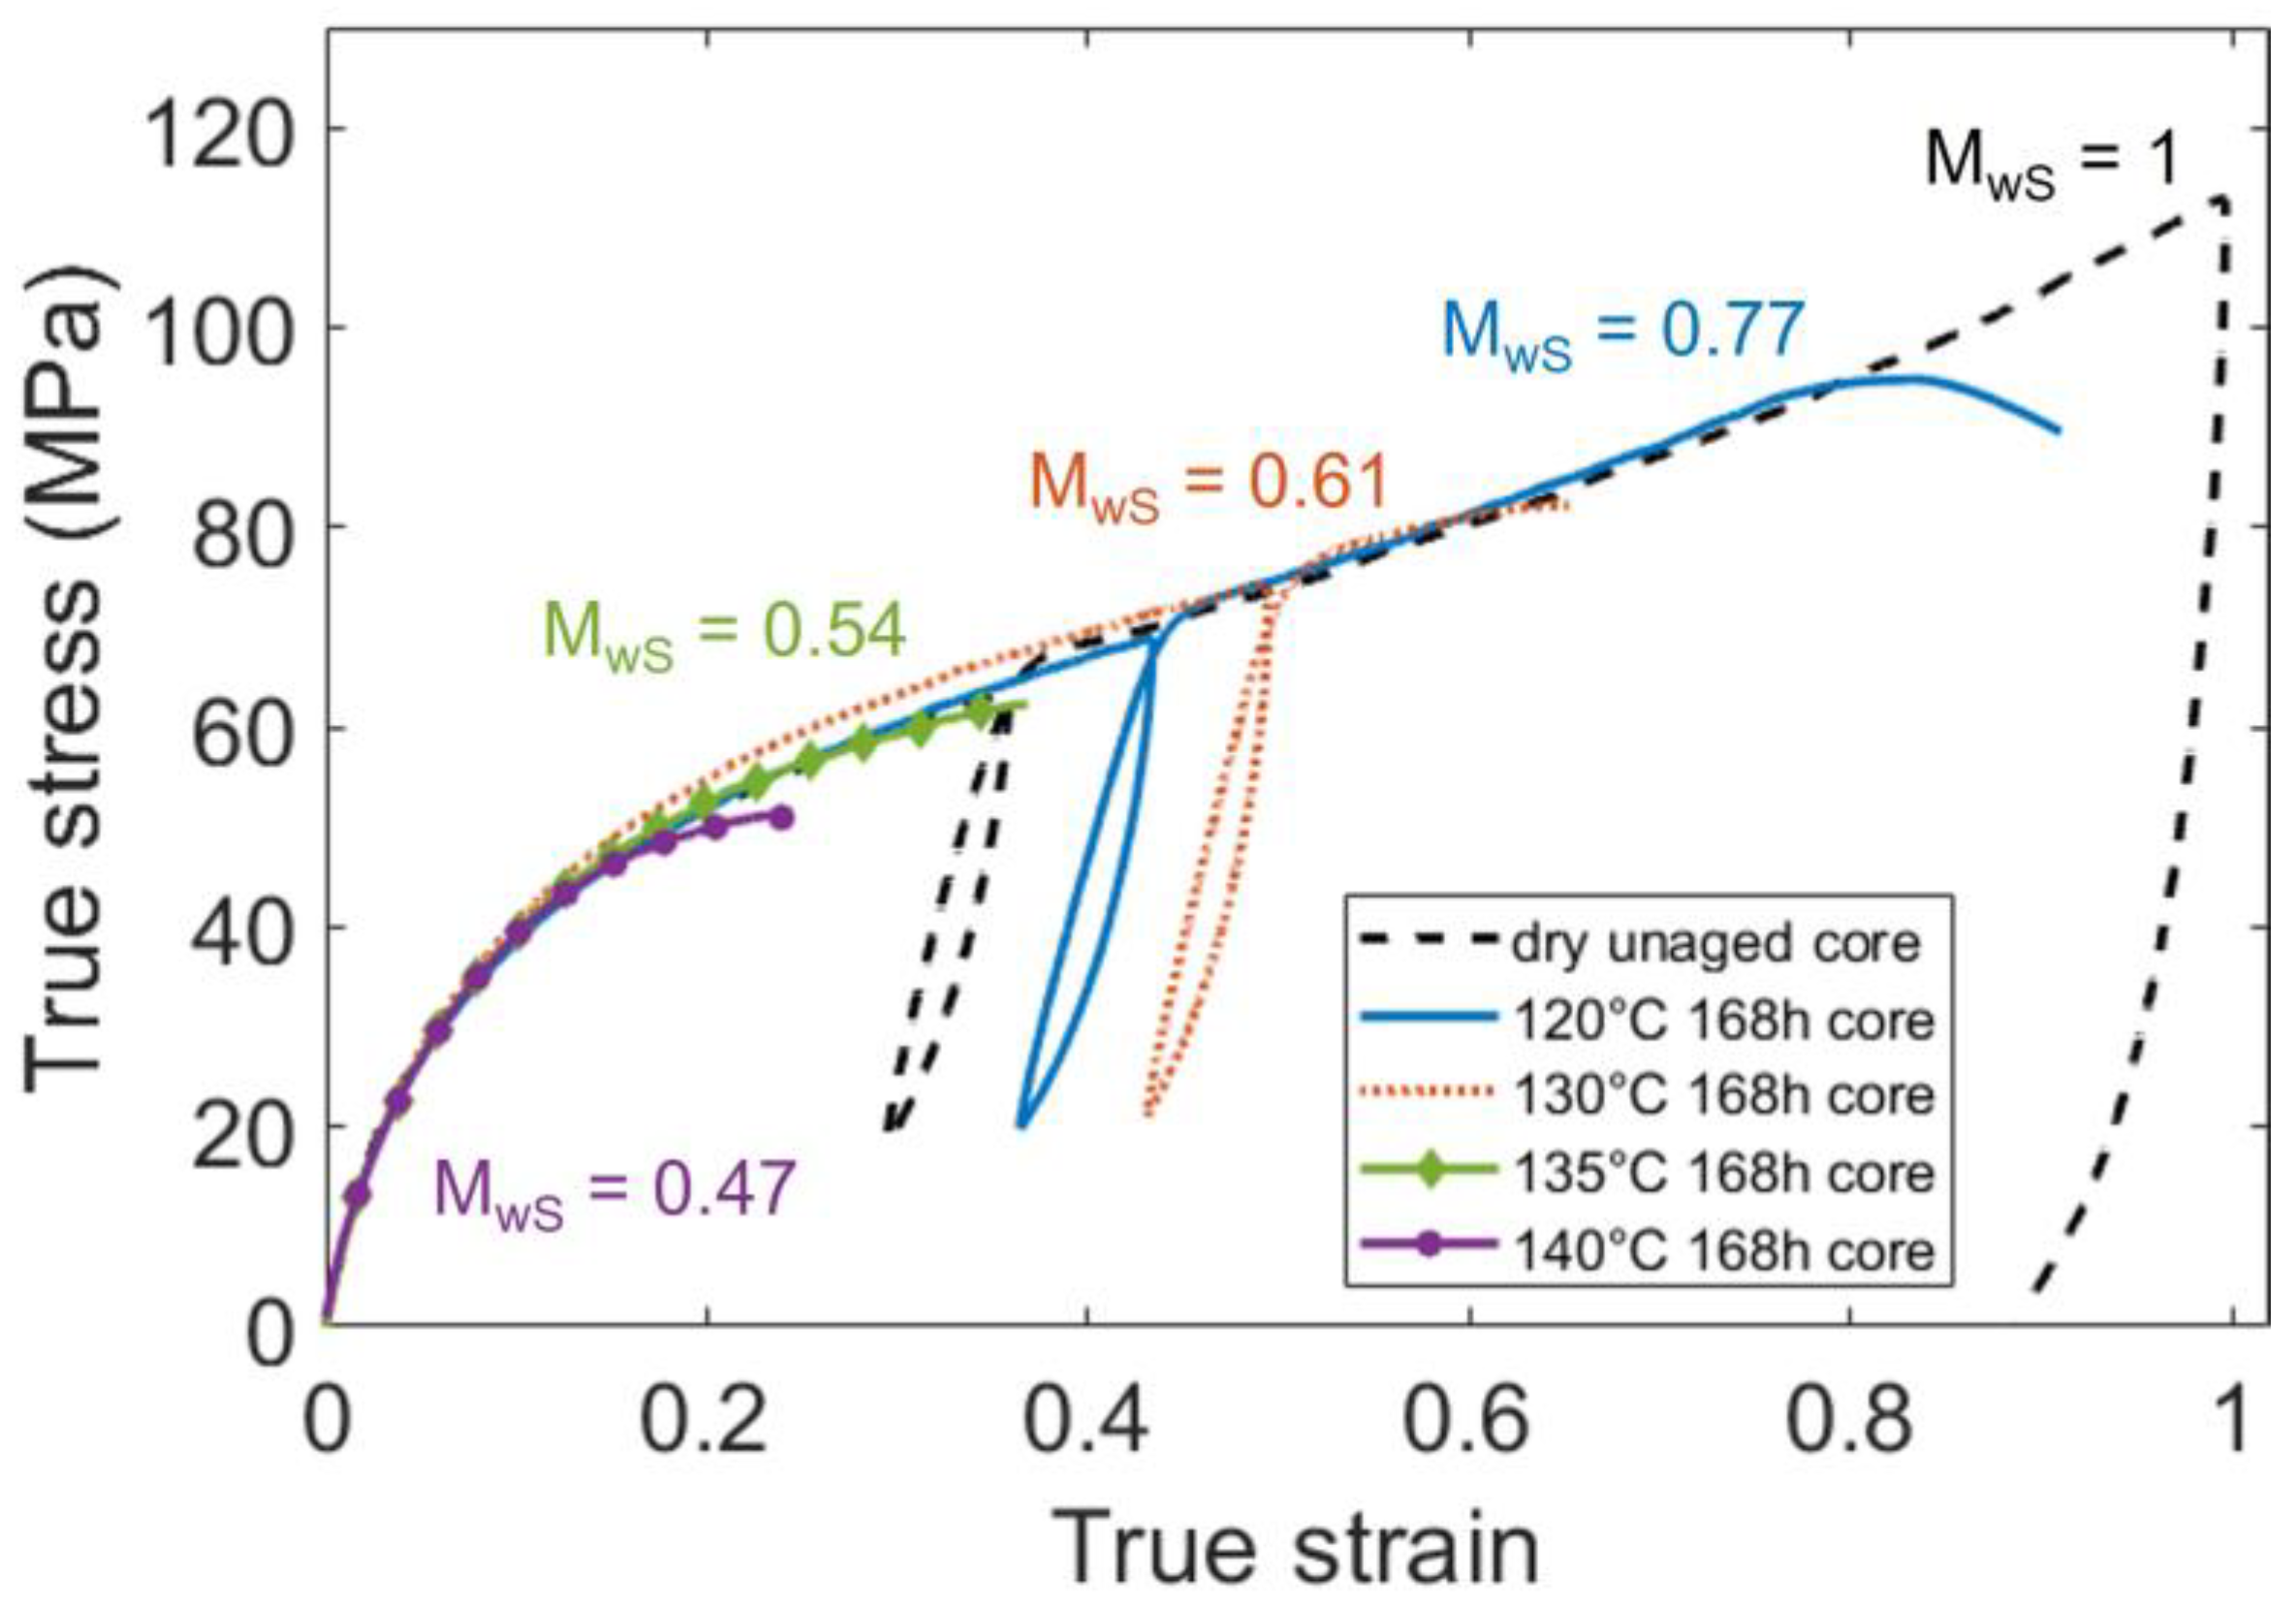
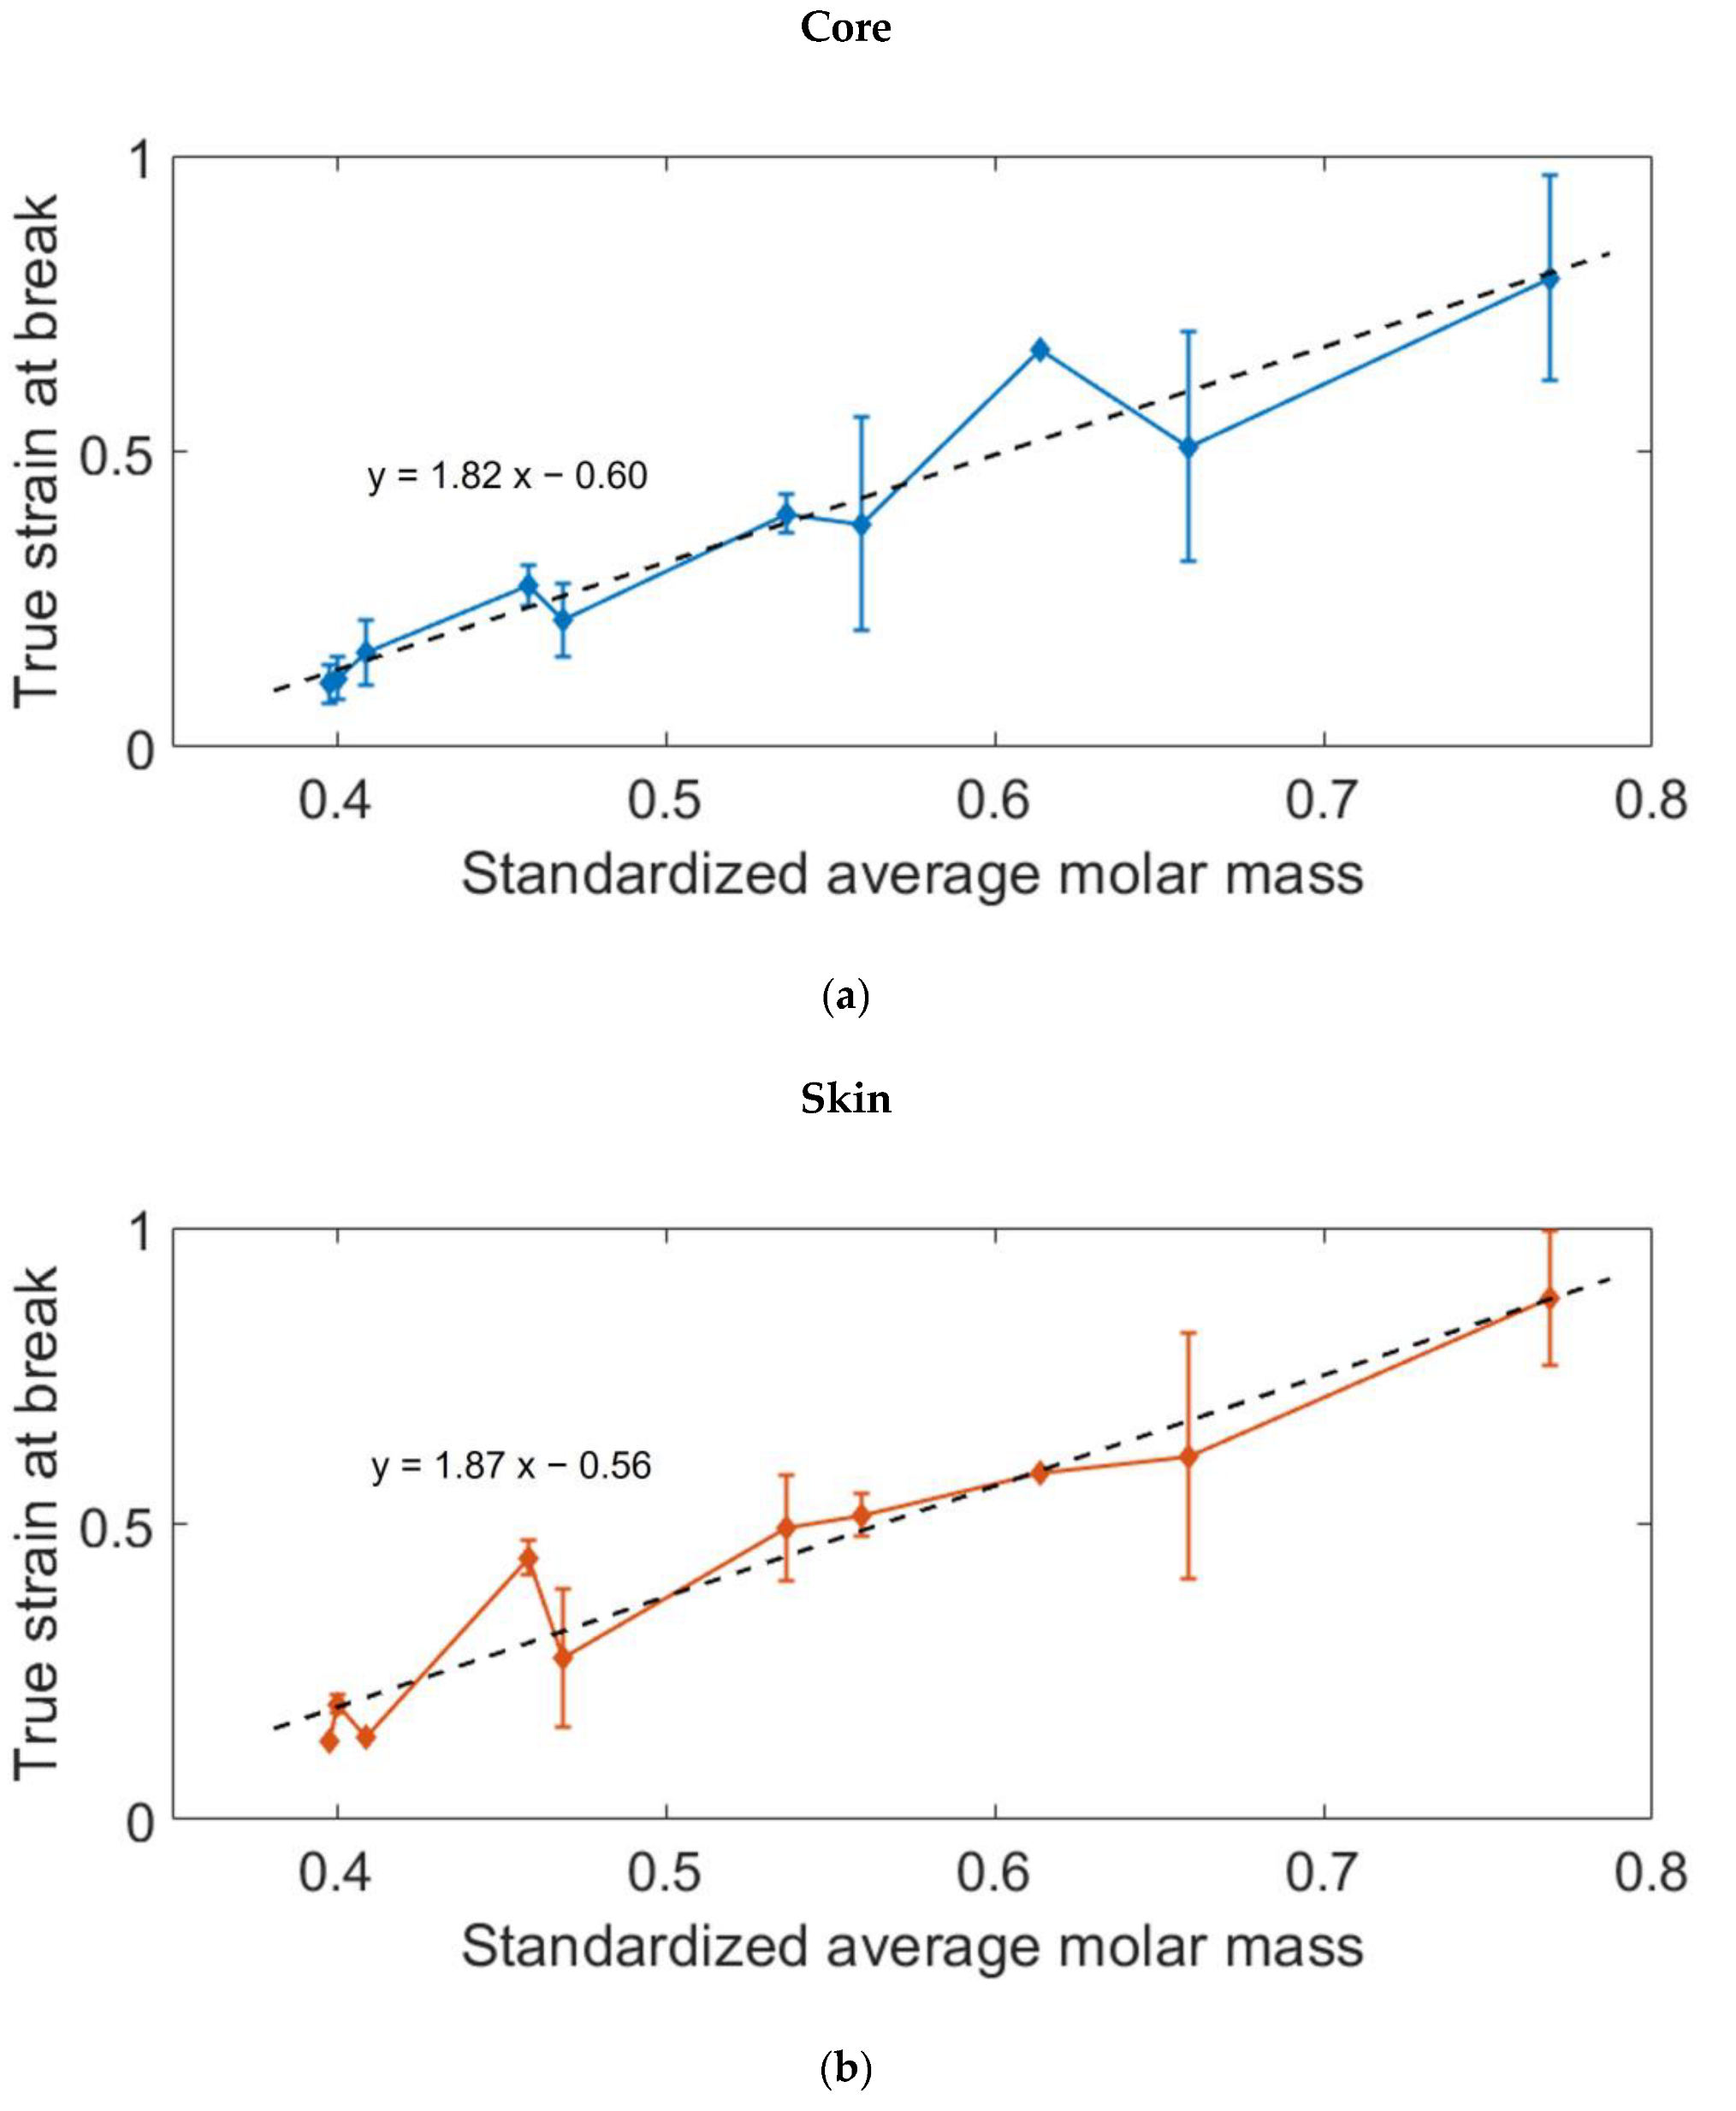
3.2.2. Impact of the Molar Mass Reduction
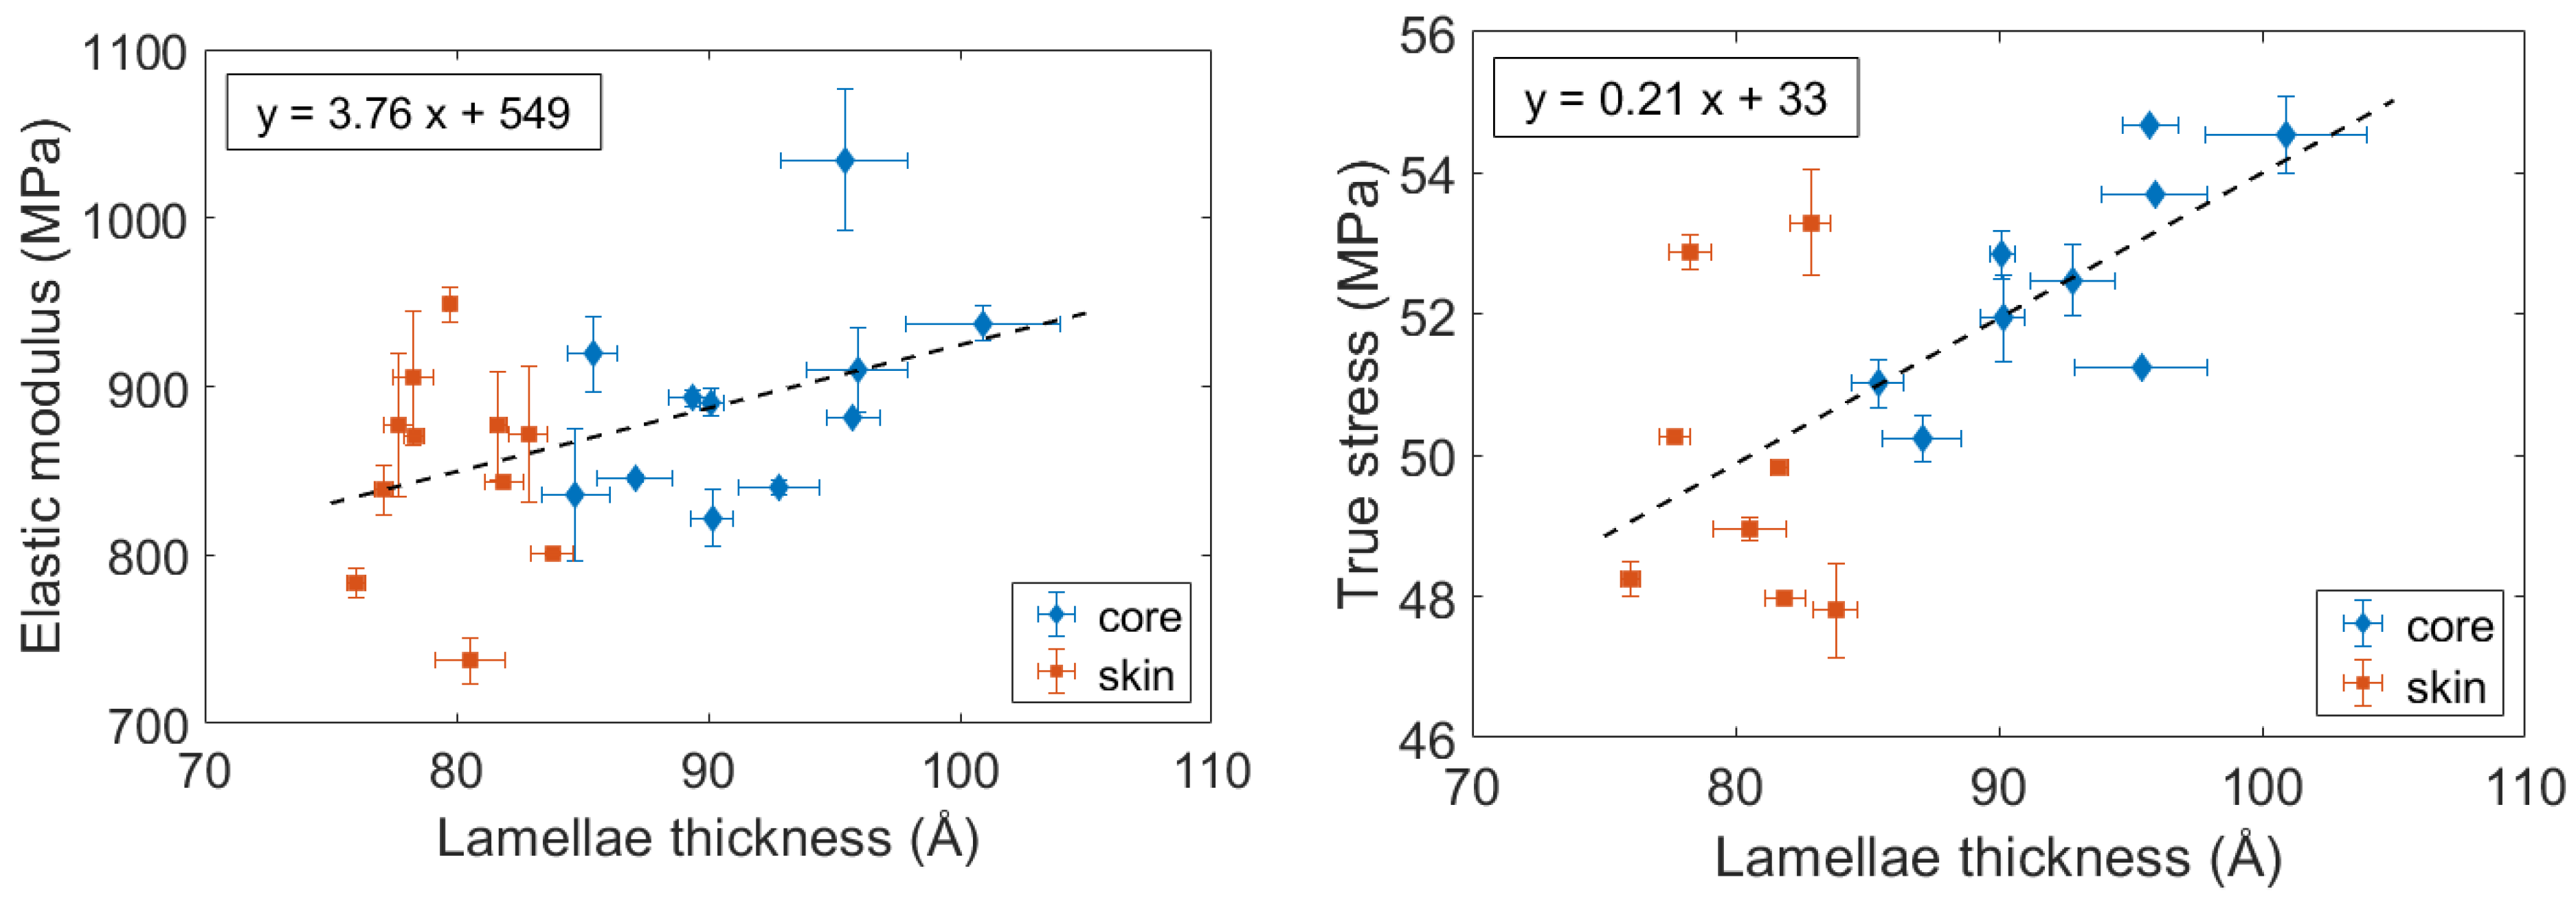
3.2.3. Impact of the Crystal on the Stiffness
3.2.4. Mechanical Summary
4. Conclusions
Author Contributions
Funding
Acknowledgments
Conflicts of Interest
References
- Puffr, R.; Šebenda, J. On the Structure and Properties of Polyamides. XXVII. The Mechanism of Water Sorption in Polyamides. J. Polym. Sci. Part C Polym. Symp. 1967, 16, 79–93. [Google Scholar] [CrossRef]
- Ledieu, B. Aging in Water/Glycol Medium of Polyamide 66 Reinforced in Short Glass Fibers for Water End Tank of Radiator Application. Ph.D. Thesis, Arts et Métiers ParisTech, Paris, France, 2010. [Google Scholar]
- Meng, Q.; Gu, Y.; Luo, L.; Wang, S.; Li, M.; Zhang, Z. Annealing effect on crystalline structure and mechanical properties in long glass fiber reinforced polyamide 66. J. Appl. Polym. Sci. 2017, 134. [Google Scholar] [CrossRef]
- Murthy, N.S.; Akkapeddi, M.K.; Orts, W.J. Analysis of Lamellar Structure in Semicrystalline Polymers by Studying the Absorption of Water and Ethylene Glycol in Nylons Using Small-Angle Neutron Scattering. Macromolecules 1998, 31, 142–152. [Google Scholar] [CrossRef]
- Broudin, M.; Le Gac, P.Y.; Le Saux, V.; Champy, C.; Robert, G.; Charrier, P.; Marco, Y. Water Diffusivity in PA66: Experimental Characterization and Modeling Based on Free Volume Theory. Eur. Polym. J. 2015, 67, 326–334. [Google Scholar] [CrossRef]
- Iwamoto, R.; Murase, H. Infrared spectroscopic study of the interactions of nylon-6 with water. J. Polym. Sci. Part B Polym. Phys. 2003, 41, 1722–1729. [Google Scholar] [CrossRef]
- Lim, L.-T.; Britt, I.J.; Tung, M.A. Sorption and transport of water vapor in nylon 6,6 film. J. Appl. Polym. Sci. 1999, 71, 197–206. [Google Scholar] [CrossRef]
- Hong, J.H.; Dhevi, D.M.; Lee, J.S.; Kim, K.J. Origin of deterioration in mechanical properties of glass fiber reinforced nylon 6,6 composites by aqueous ethylene glycol solution. Polym. Compos. 2007, 28, 778–784. [Google Scholar] [CrossRef]
- Thomason, J.L.; Porteus, G. Swelling of glass-fiber reinforced polyamide 66 during conditioning in water, ethylene glycol, and antifreeze mixture. Polym. Compos. 2011, 32, 639–647. [Google Scholar] [CrossRef]
- Thomason, J.L.; Porteus, G. An investigation of glass–fiber reinforced polyamide 66 during conditioning in various automotive fluids. Polym. Compos. 2011, 32, 1369–1379. [Google Scholar] [CrossRef]
- Thomason, J.L.; Ali, J.Z.; Anderson, J. Effects of hydrolysis ageing on the performance and dimensional stability of glass-fiber reinforced polyamide 66. In Proceedings of the 68th Annual Technical Conference and Exhibition, ANTEC 2010, Orlando, FL, USA, 16–20 May 2010; pp. 265–271. [Google Scholar]
- Thomason, J.L.; Ali, J.Z. The dimensional stability of glass–fibre reinforced polyamide 66 during hydrolysis conditioning. Compos. Part A Appl. Sci. Manuf. 2009, 40, 625–634. [Google Scholar] [CrossRef] [Green Version]
- Smith, L.S.A.; Schmitz, V. The effect of water on the glass transition temperature of poly(methyl methacrylate). Polymer 1988, 29, 1871–1878. [Google Scholar] [CrossRef]
- Kelley, F.N.; Bueche, F. Viscosity and glass temperature relations for polymer-diluent systems. J. Polym. Sci. 1961, 50, 549–556. [Google Scholar] [CrossRef]
- Fabre, V.; Quandalle, G.; Billon, N.; Cantournet, S. Time-Temperature-Water content equivalence on dynamic mechanical response of polyamide 6,6. Polymer 2018, 137, 22–29. [Google Scholar] [CrossRef]
- Jacques, B.; Werth, M.; Merdas, I.; Thominette, F.; Verdu, J. Hydrolytic ageing of polyamide 11. 1. Hydrolysis kinetics in water. Polymer 2002, 43, 6439–6447. [Google Scholar] [CrossRef]
- Lee, J.-Y.; Kim, K.-J. MEG Effects on Hydrolysis of Polyamide 66/Glass Fiber Composites and Mechanical Property Changes. Molecules 2019, 24, 755. [Google Scholar] [CrossRef]
- Deshoulles, Q.; Le Gall, M.; Dreanno, C.; Arhant, M.; Stoclet, G.; Priour, D.; Le Gac, P.Y. Origin of embrittlement in Polyamide 6 induced by chemical degradations: Mechanisms and governing factors. Polym. Degrad. Stab. 2021, 191, 109657. [Google Scholar] [CrossRef]
- Deshoulles, Q.; Le Gall, M.; Dreanno, C.; Arhant, M.; Priour, D.; Le Gac, P.-Y. Modelling pure polyamide 6 hydrolysis: Influence of water content in the amorphous phase. Polym. Degrad. Stab. 2021, 183, 109435. [Google Scholar] [CrossRef]
- Fayolle, B.; Colin, X.; Audouin, L.; Verdu, J. Mechanism of Degradation Induced Embrittlement in Polyethylene. Polym. Degrad. Stab. 2007, 92, 231–238. [Google Scholar] [CrossRef]
- Kim, K.J.; Dhevi, D.M.; Lee, J.S.; Cho, Y.D.; Choe, E.K. Mechanism of glycolysis of nylon 6,6 and its model compound by ethylene glycol. Polym. Degrad. Stab. 2006, 91, 1545–1555. [Google Scholar] [CrossRef]
- Datta, J.; Błażek, K.; Włoch, M.; Bukowski, R. A New Approach to Chemical Recycling of Polyamide 6.6 and Synthesis of Polyurethanes with Recovered Intermediates. J. Polym. Env. 2018, 26, 4415–4429. [Google Scholar] [CrossRef] [Green Version]
- Huczkowski, P.; Kapko, J.; Olesiak, R. Degradation of nylon-6 in ethylene glycol. Polymer 1978, 19, 77–80. [Google Scholar] [CrossRef]
- Deshoulles, Q.; Le Gall, M.; Dreanno, C.; Arhant, M.; Priour, D.; Le Gac, P.Y. Chemical coupling between oxidation and hydrolysis in polyamide 6—A key aspect in the understanding of microplastic formation. Polym. Degrad. Stab. 2022, 197, 109851. [Google Scholar] [CrossRef]
- Okamba-Diogo, O.; Richaud, E.; Verdu, J.; Fernagut, F.; Guilment, J.; Fayolle, B. Molecular and macromolecular structure changes in polyamide 11 during thermal oxidation. Polym. Degrad. Stab. 2014, 108, 123–132. [Google Scholar] [CrossRef]
- Bureau, M.N.; Denault, J.; Cole, K.C.; Enright, G.D. The role of crystallinity and reinforcement in the mechanical behavior of polyamide-6/clay nanocomposites. Polym. Eng. Sci. 2002, 42, 1897–1906. [Google Scholar] [CrossRef]
- Billon, N.; Giraudeau, J.; Bouvard, J.L.; Robert, G. Mechanical Behavior—Microstructure Relationships in Injection-Molded Polyamide 66. Polymers 2018, 10, 1047. [Google Scholar] [CrossRef]
- Yuan, M.; Turng, L.-S. Microstructure and mechanical properties of microcellular injection molded polyamide-6 nanocomposites. Polymer 2005, 46, 7273–7292. [Google Scholar] [CrossRef]
- Freire, L.; Combeaud, C.; Monge, G.; Billon, N.; Haudin, J.-M. Transcrystallinity versus Spherulitic Crystallization in Polyamide 66: An Experimental Study. Polym. Cryst. 2019, 2, e10028. [Google Scholar] [CrossRef]
- Russell, D.P.; Beaumont, P.W.R. Structure and Properties of Injection-Moulded Nylon-6. J. Mater. Sci. 1980, 15, 197–207. [Google Scholar] [CrossRef]
- Maurel-Pantel, A.; Baquet, E.; Bikard, J.; Bouvard, J.L.; Billon, N. A thermo-mechanical large deformation constitutive model for polymers based on material network description: Application to a semi-crystalline polyamide 66. Int. J. Plast. 2015, 67, 102–126. [Google Scholar] [CrossRef]
- Federico, C.E.; Bouvard, J.L.; Combeaud, C.; Billon, N. Large strain/time dependent mechanical behaviour of PMMAs of different chain architectures. Application of time-temperature superposition principle. Polymer 2018, 139, 177–187. [Google Scholar] [CrossRef]
- Forestier, E.; Combeaud, C.; Guigo, N.; Monge, G.; Haudin, J.-M.; Sbirrazzuoli, N.; Billon, N. Strain-induced crystallization of poly(ethylene 2,5-furandicarboxylate). Mechanical and crystallographic analysis. Polymer 2020, 187, 122126. [Google Scholar] [CrossRef]
- William, B.C.; Garner, E.V.; Lawrence, B.W. The crystal structures of two polyamides (‘nylons’). Proc. R. Soc. London. Ser. A. Math. Phys. Sci. 1947, 189, 39–68. [Google Scholar] [CrossRef]
- Starkweather, H.W.; Jones, G.A. Crystalline transitions in powders of nylon 66 crystallized from solution. J. Polym. Sci. Polym. Phys. Ed. 1981, 19, 467–477. [Google Scholar] [CrossRef]
- Starkweather, H.W.; Zoller, P.; Jones, G.A. The heat of fusion of 66 nylon. J. Polym. Sci. Polym. Phys. Ed. 1984, 22, 1615–1621. [Google Scholar] [CrossRef]
- Haberkorn, H.; Illers, K.H.; Simak, P. Calorimetric, X-ray and infra-red investigations on poly(hexamethylene adipamide). Polym. Bull. 1979, 1, 485–490. [Google Scholar] [CrossRef]
- Pliquet, M.; Rapeaux, M.; Delange, F.; Bourgogne, D.; Gardette, J.L.; Therias, S.; Bussiere, P.O. Multiscale analysis of thermal degradation of polyamide 6,6—Influence of temperature on oxygen diffusion-limited oxidation profiles. Polym. Degrad. Stab. 2021, 192, 109695. [Google Scholar] [CrossRef]
- Khoury, F. The formation of negatively birefringent spherulites in polyhexamethylene adipamide (nylon 66). J. Polym. Sci. 1958, 33, 389–403. [Google Scholar] [CrossRef]
- Haas, T.W.; Maxwell, B. Effects of shear stress on the crystallization of linear polyethylene and polybutene-1. Polym. Eng. Sci. 1969, 9, 225–241. [Google Scholar] [CrossRef]
- Penel-Pierron, L.; Depecker, C.; Séguéla, R.; Lefebvre, J.-M. Structural and mechanical behavior of nylon 6 films part I. Identification and stability of the crystalline phases. J. Polym. Sci. Part B Polym. Phys. 2001, 39, 484–495. [Google Scholar] [CrossRef]
- Furushima, Y.; Nakada, M.; Ishikiriyama, K.; Toda, A.; Androsch, R.; Zhuravlev, E.; Schick, C. Two crystal populations with different melting/reorganization kinetics of isothermally crystallized polyamide 6. J. Polym. Sci. Part B Polym. Phys. 2016, 54, 2126–2138. [Google Scholar] [CrossRef]
- Xie, S.; Zhang, S.; Liu, H.; Chen, G.; Feng, M.; Qin, H.; Wang, F.; Yang, M. Effects of processing history and annealing on polymorphic structure of nylon-6/montmorillonite nanocomposites. Polymer 2005, 46, 5417–5427. [Google Scholar] [CrossRef]
- Quintanilla, L.; Pastor, J.M. Structural analysis of polyamide-6,6 reinforced with glass fibre by the use of Fourier transform infra-red spectroscopy with photoacoustic detection and differential scanning calorimetry. Polymer 1994, 35, 5241–5246. [Google Scholar] [CrossRef]
- Fischer, E.W. Effect of annealing and temperature on the morphological structure of polymers. Pure Appl. Chem. 1972, 31, 113–132. [Google Scholar] [CrossRef]
- Yeh, G.S.Y.; Hosemann, R.; Loboda-Čačković, J.; Čačković, H. Annealing effects of polymers and their underlying molecular mechanisms. Polymer 1976, 17, 309–318. [Google Scholar] [CrossRef]
- Gordon, M.; Taylor, J.S. Ideal copolymers and the second-order transitions of synthetic rubbers. i. non-crystalline copolymers. J. Appl. Chem. 1952, 2, 493–500. [Google Scholar] [CrossRef]
- Lu, X.; Weiss, R.A. Relationship between the glass transition temperature and the interaction parameter of miscible binary polymer blends. Macromolecules 1992, 25, 3242–3246. [Google Scholar] [CrossRef]
- Brinke, G.; Karasz, F.E.; Ellis, T.S. Depression of glass transition temperatures of polymer networks by diluents. Macromolecules 1983, 16, 244–249. [Google Scholar] [CrossRef]
- Serpe, G.; Chaupart, N. Relaxation–structure relationship in bulk and plasticized polyamide 11. J. Polym. Sci. Part B Polym. Phys. 1996, 34, 2351–2365. [Google Scholar] [CrossRef]
- Reano, A.F.; Guinault, A.; Richaud, E.; Fayolle, B. Polyethylene Loss of Ductility during Oxidation: Effect of Initial Molar Mass Distribution. Polym. Degrad. Stab. 2018, 149, 78–84. [Google Scholar] [CrossRef]


| Measurement Scale | Main Results |
|---|---|
| Molar mass | Reduction of the average molar mass due to the hydrolysis reaction |
| No core/skin gradient. | |
| Spherulites diameter | Core/skin gradient. |
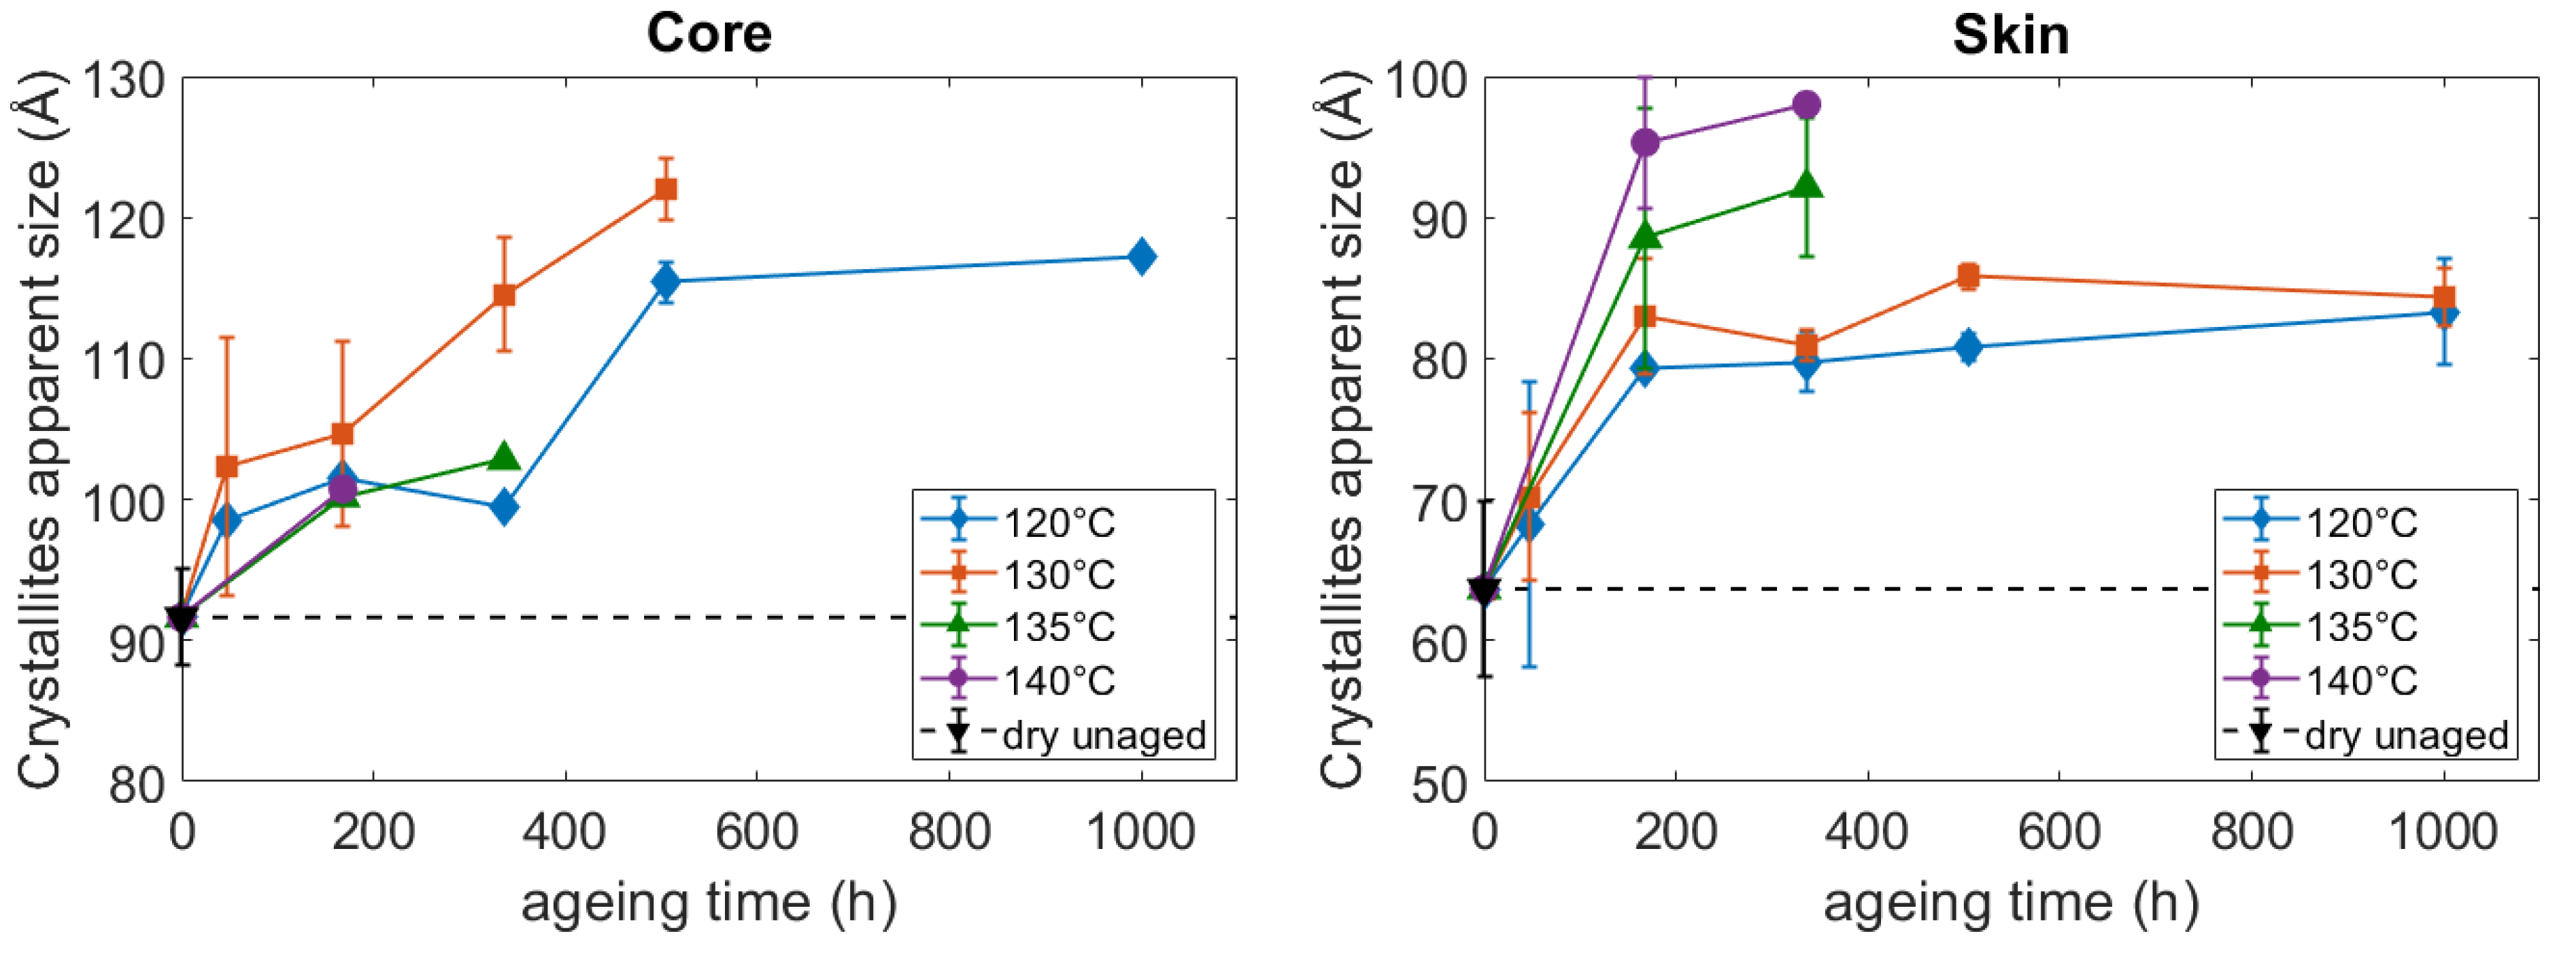
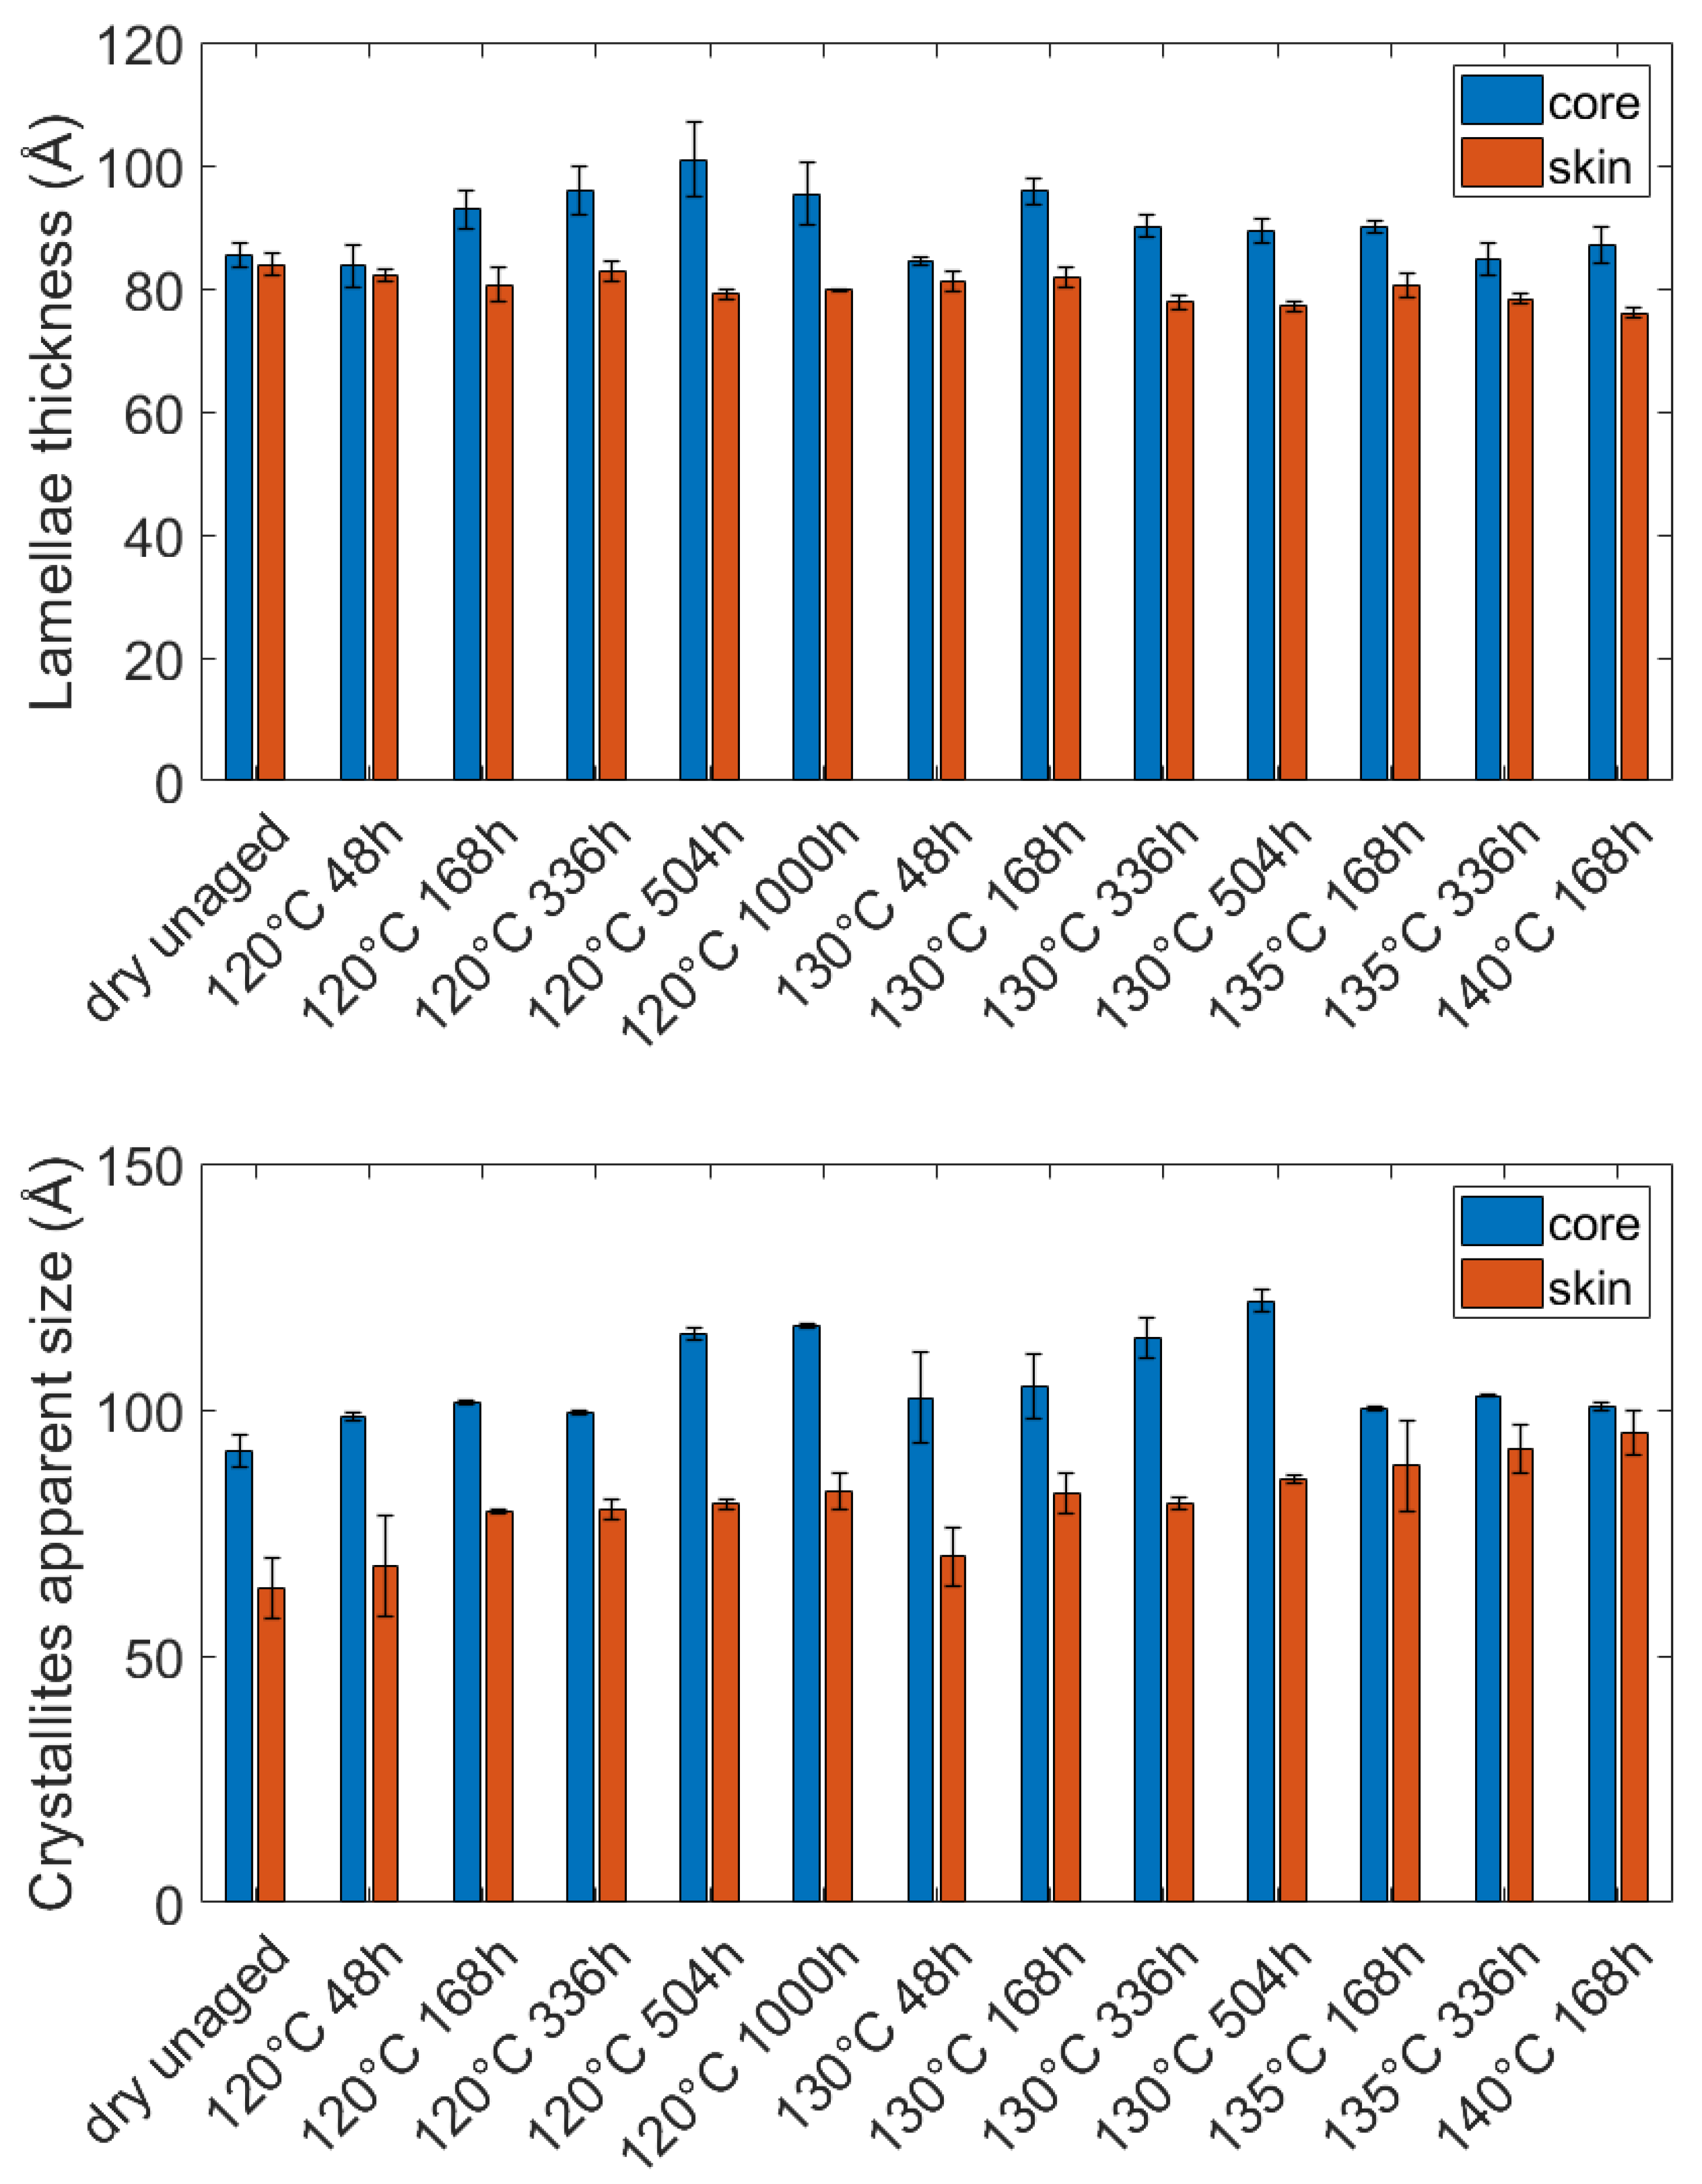
| Crystallites’ apparent size | Increase of the crystallites’ apparent size at the core and at the skin. |
| Core/skin gradient. | |
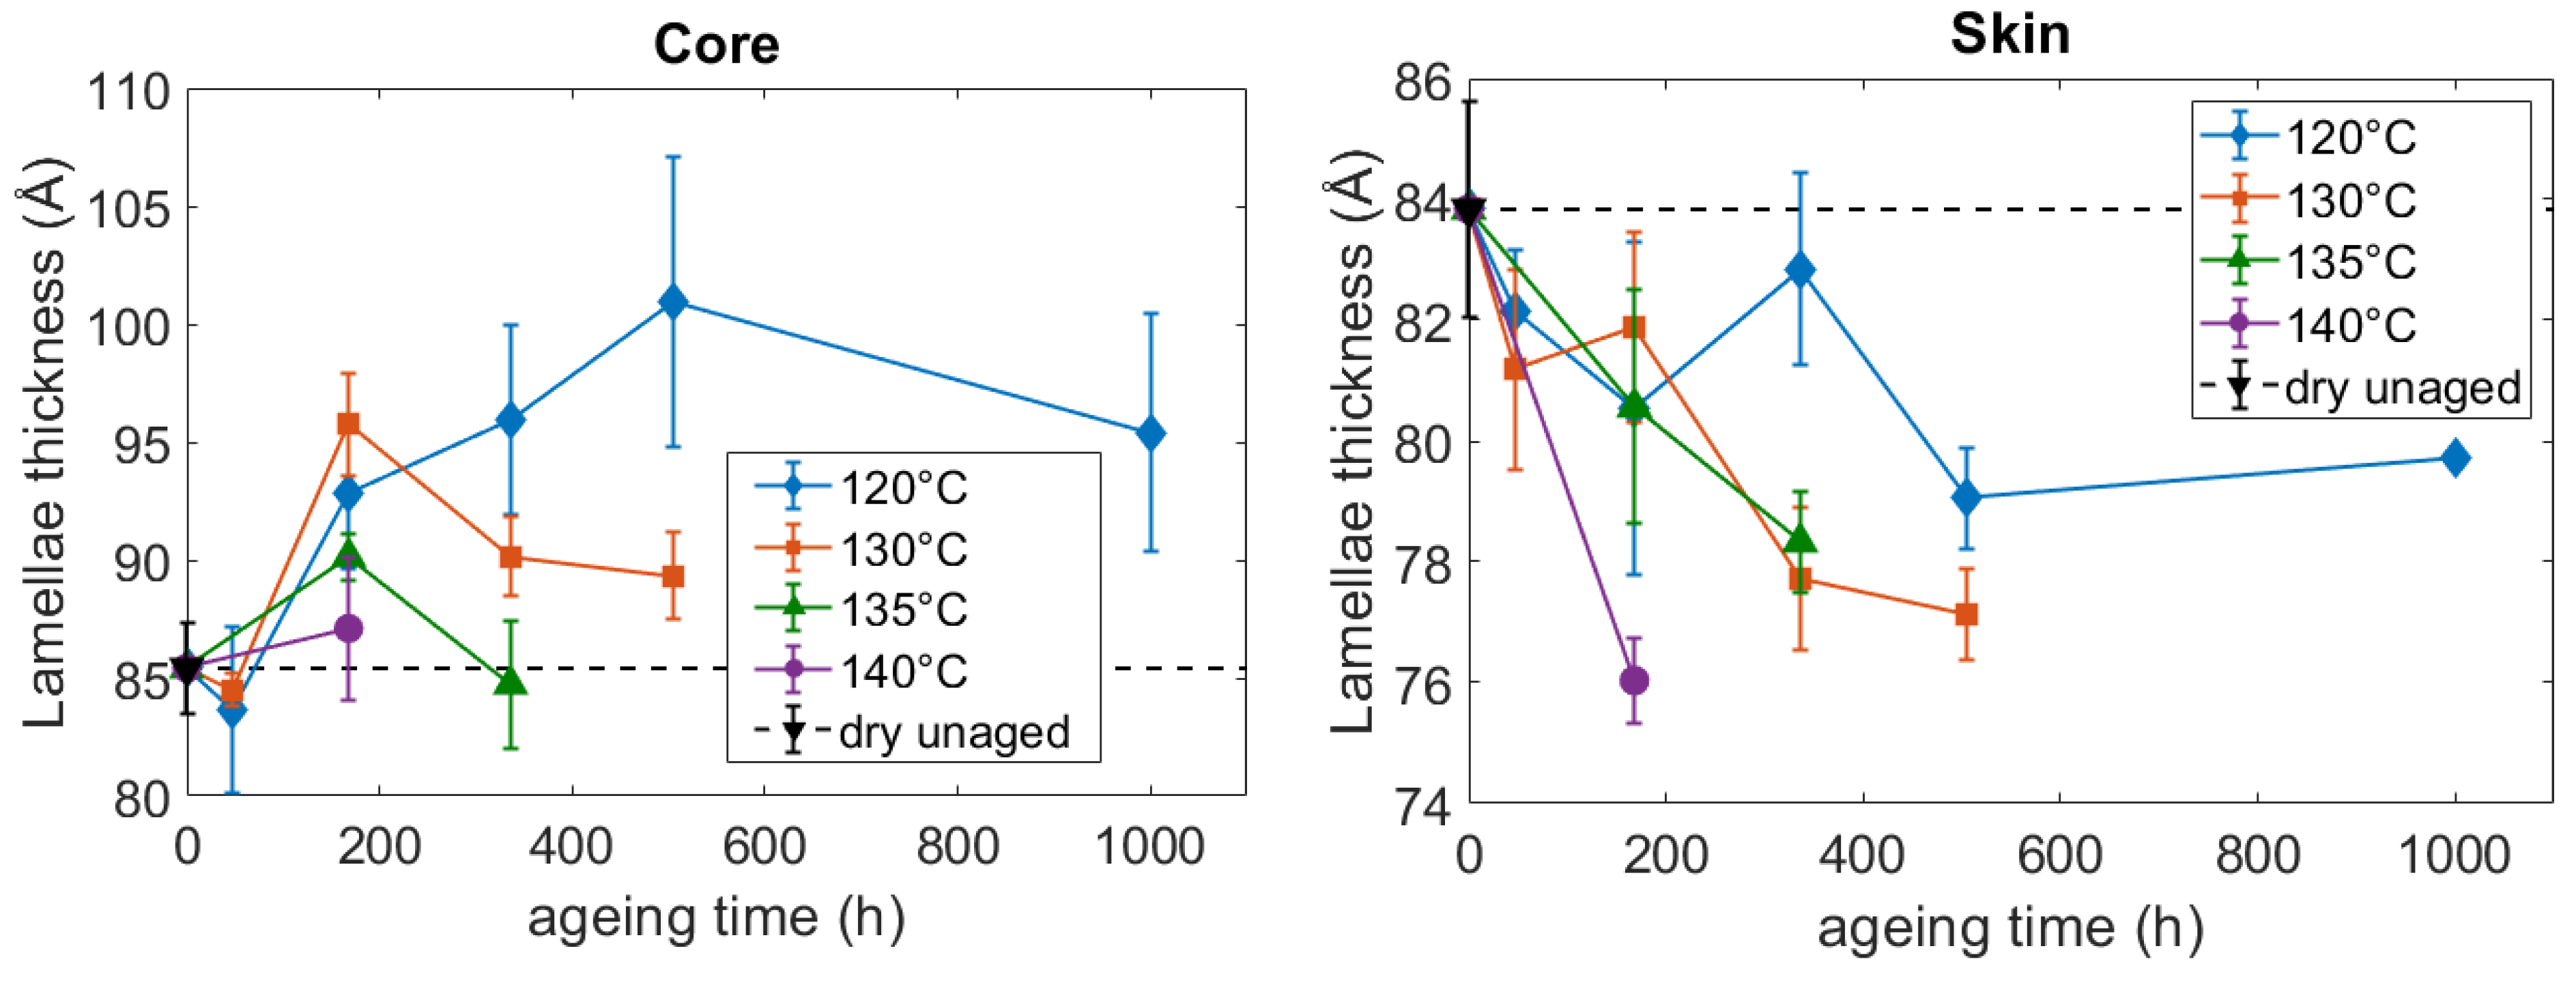
| Lamellae thickness | Thickening of the lamellae at the core of the plaques. |
| Reduction of the thickness of the skin. | |
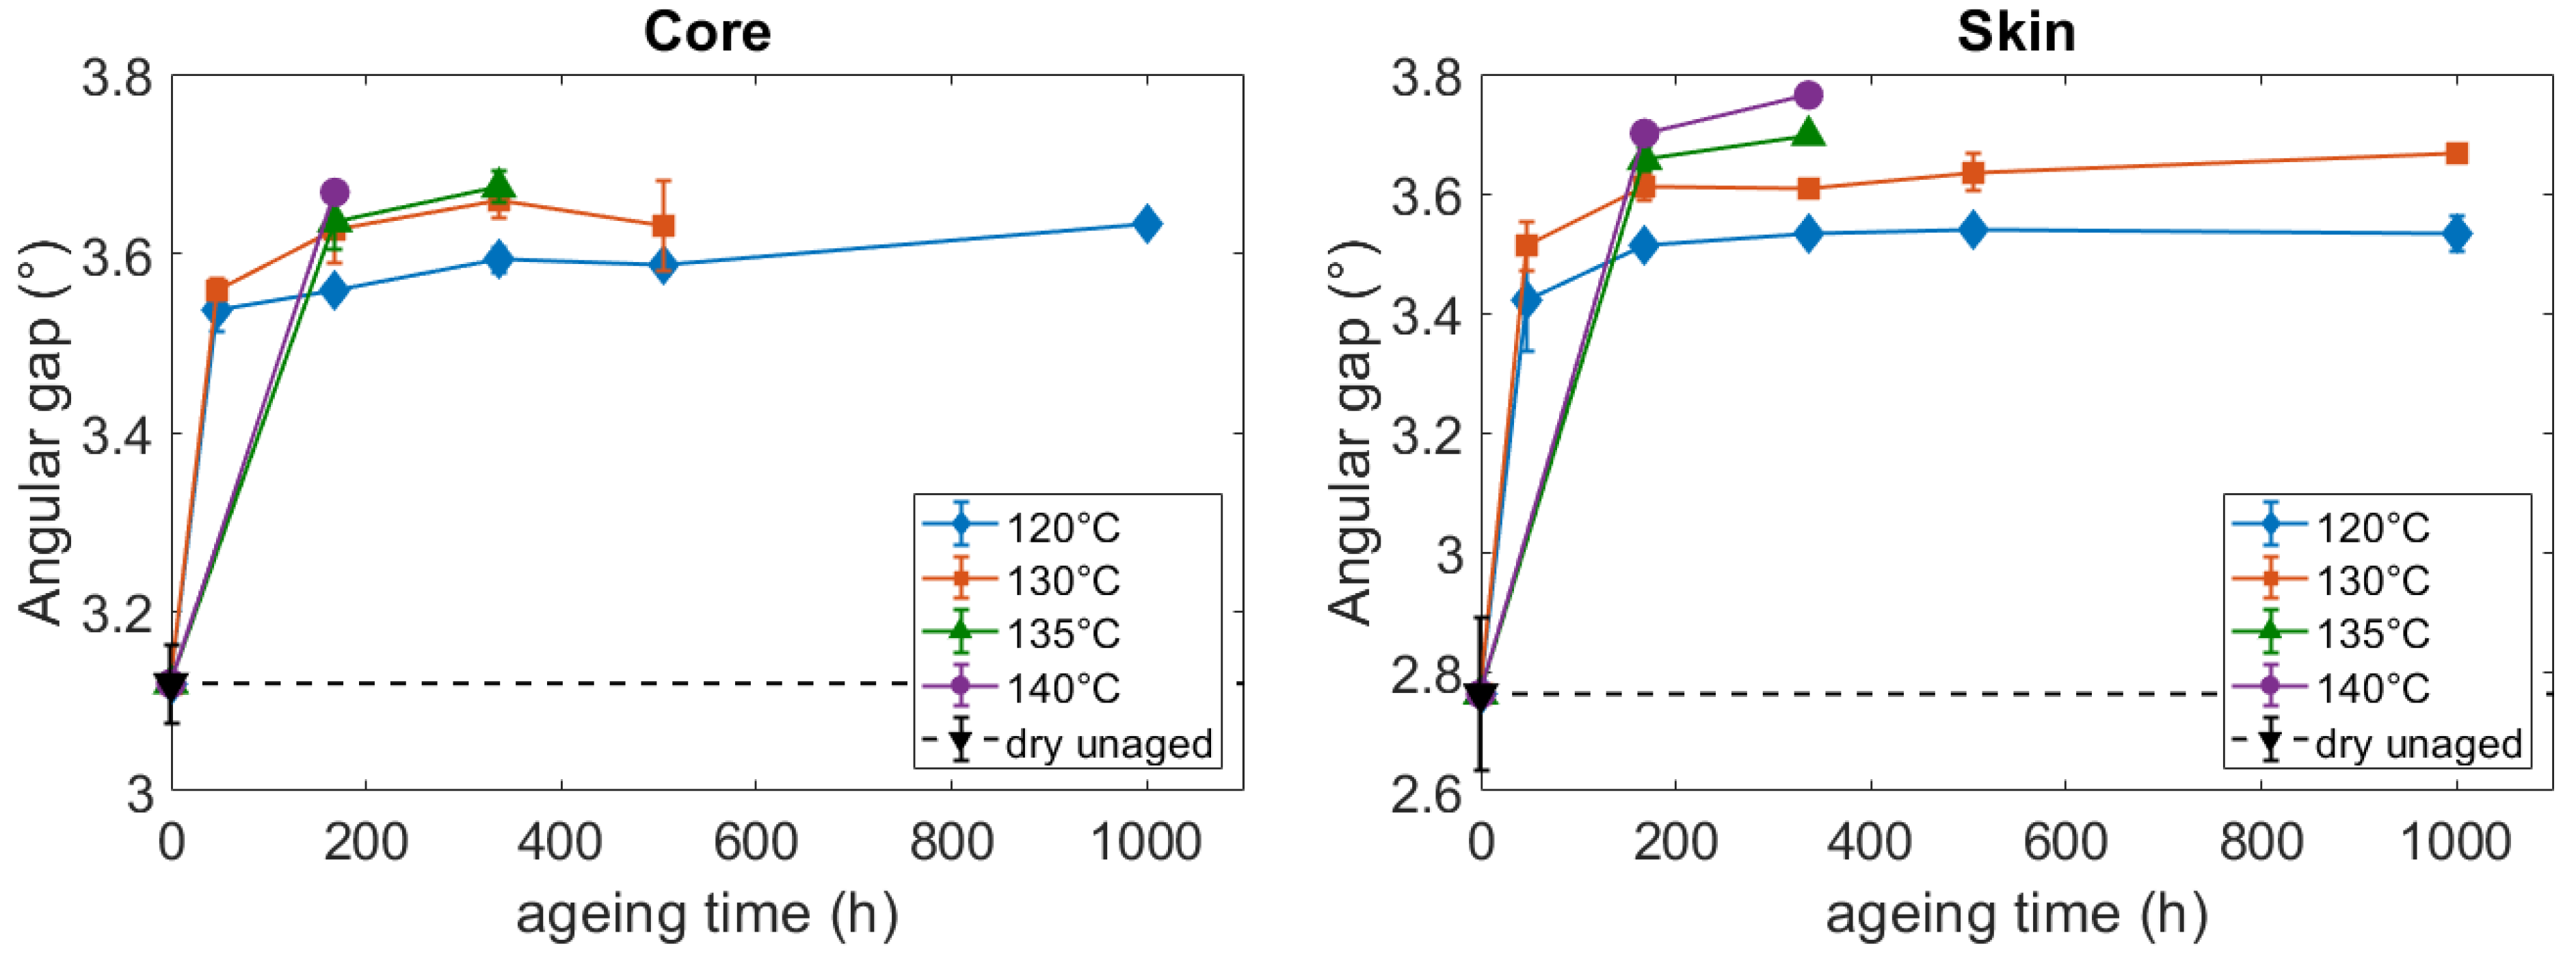
| Crystal perfection index | Increase of the perfection at the core and at the skin. |
| Core/skin gradient before aging. | |
| Crystallinity index | Few changes in the crystallinity index. |
| Small increase at the core of the plaques. |
| Aging Condition | ||
|---|---|---|
| Dry unaged | 70 °C | 70 °C |
| 120 °C 168 h | −19 °C | −18 °C |
| 120 °C 336 h | −19 °C | −19 °C |
| 120 °C 504 h | −20 °C | −19 °C |
| 120 °C 1000 h | −20 °C | −17 °C |
| 130 °C 168 h | −19 °C | −20 °C |
| 130 °C 336 h | −21 °C | −20 °C |
| 130 °C 504 h | −19 °C | |
| 135 °C 168 h | −22 °C | −20 °C |
| 135 °C 336 h | −19 °C | −20 °C |
| 140 °C 168 h | −20 °C | −18 °C |
| Aging Condition | Core | Skin |
|---|---|---|
| Dry unaged | 920 MPa | 800 MPa |
| 120 °C 168 h | 840 MPa | 740 MPa |
| 120 °C 336 h | 910 MPa | 870 MPa |
| 120 °C 504 h | 940 MPa | 910 MPa |
| 120 °C 1000 h | 1030 MPa | 950 MPa |
| 130 °C 168 h | 880 MPa | 840 MPa |
| 130 °C 336 h | 820 MPa | 880 MPa |
| 130 °C 504 h | 890 MPa | 840 MPa |
| 135 °C 168 h | 890 MPa | 880 MPa |
| 135 °C 336 h | 840 MPa | 870 MPa |
| 140 °C 168 h | 850 MPa | 780 MPa |
| Microstructural Observations | Mechanical Consequences |
|---|---|
| Water and ethylene glycol intake | |
| Decrease of the average molar mass | Embrittlement of the polymer |
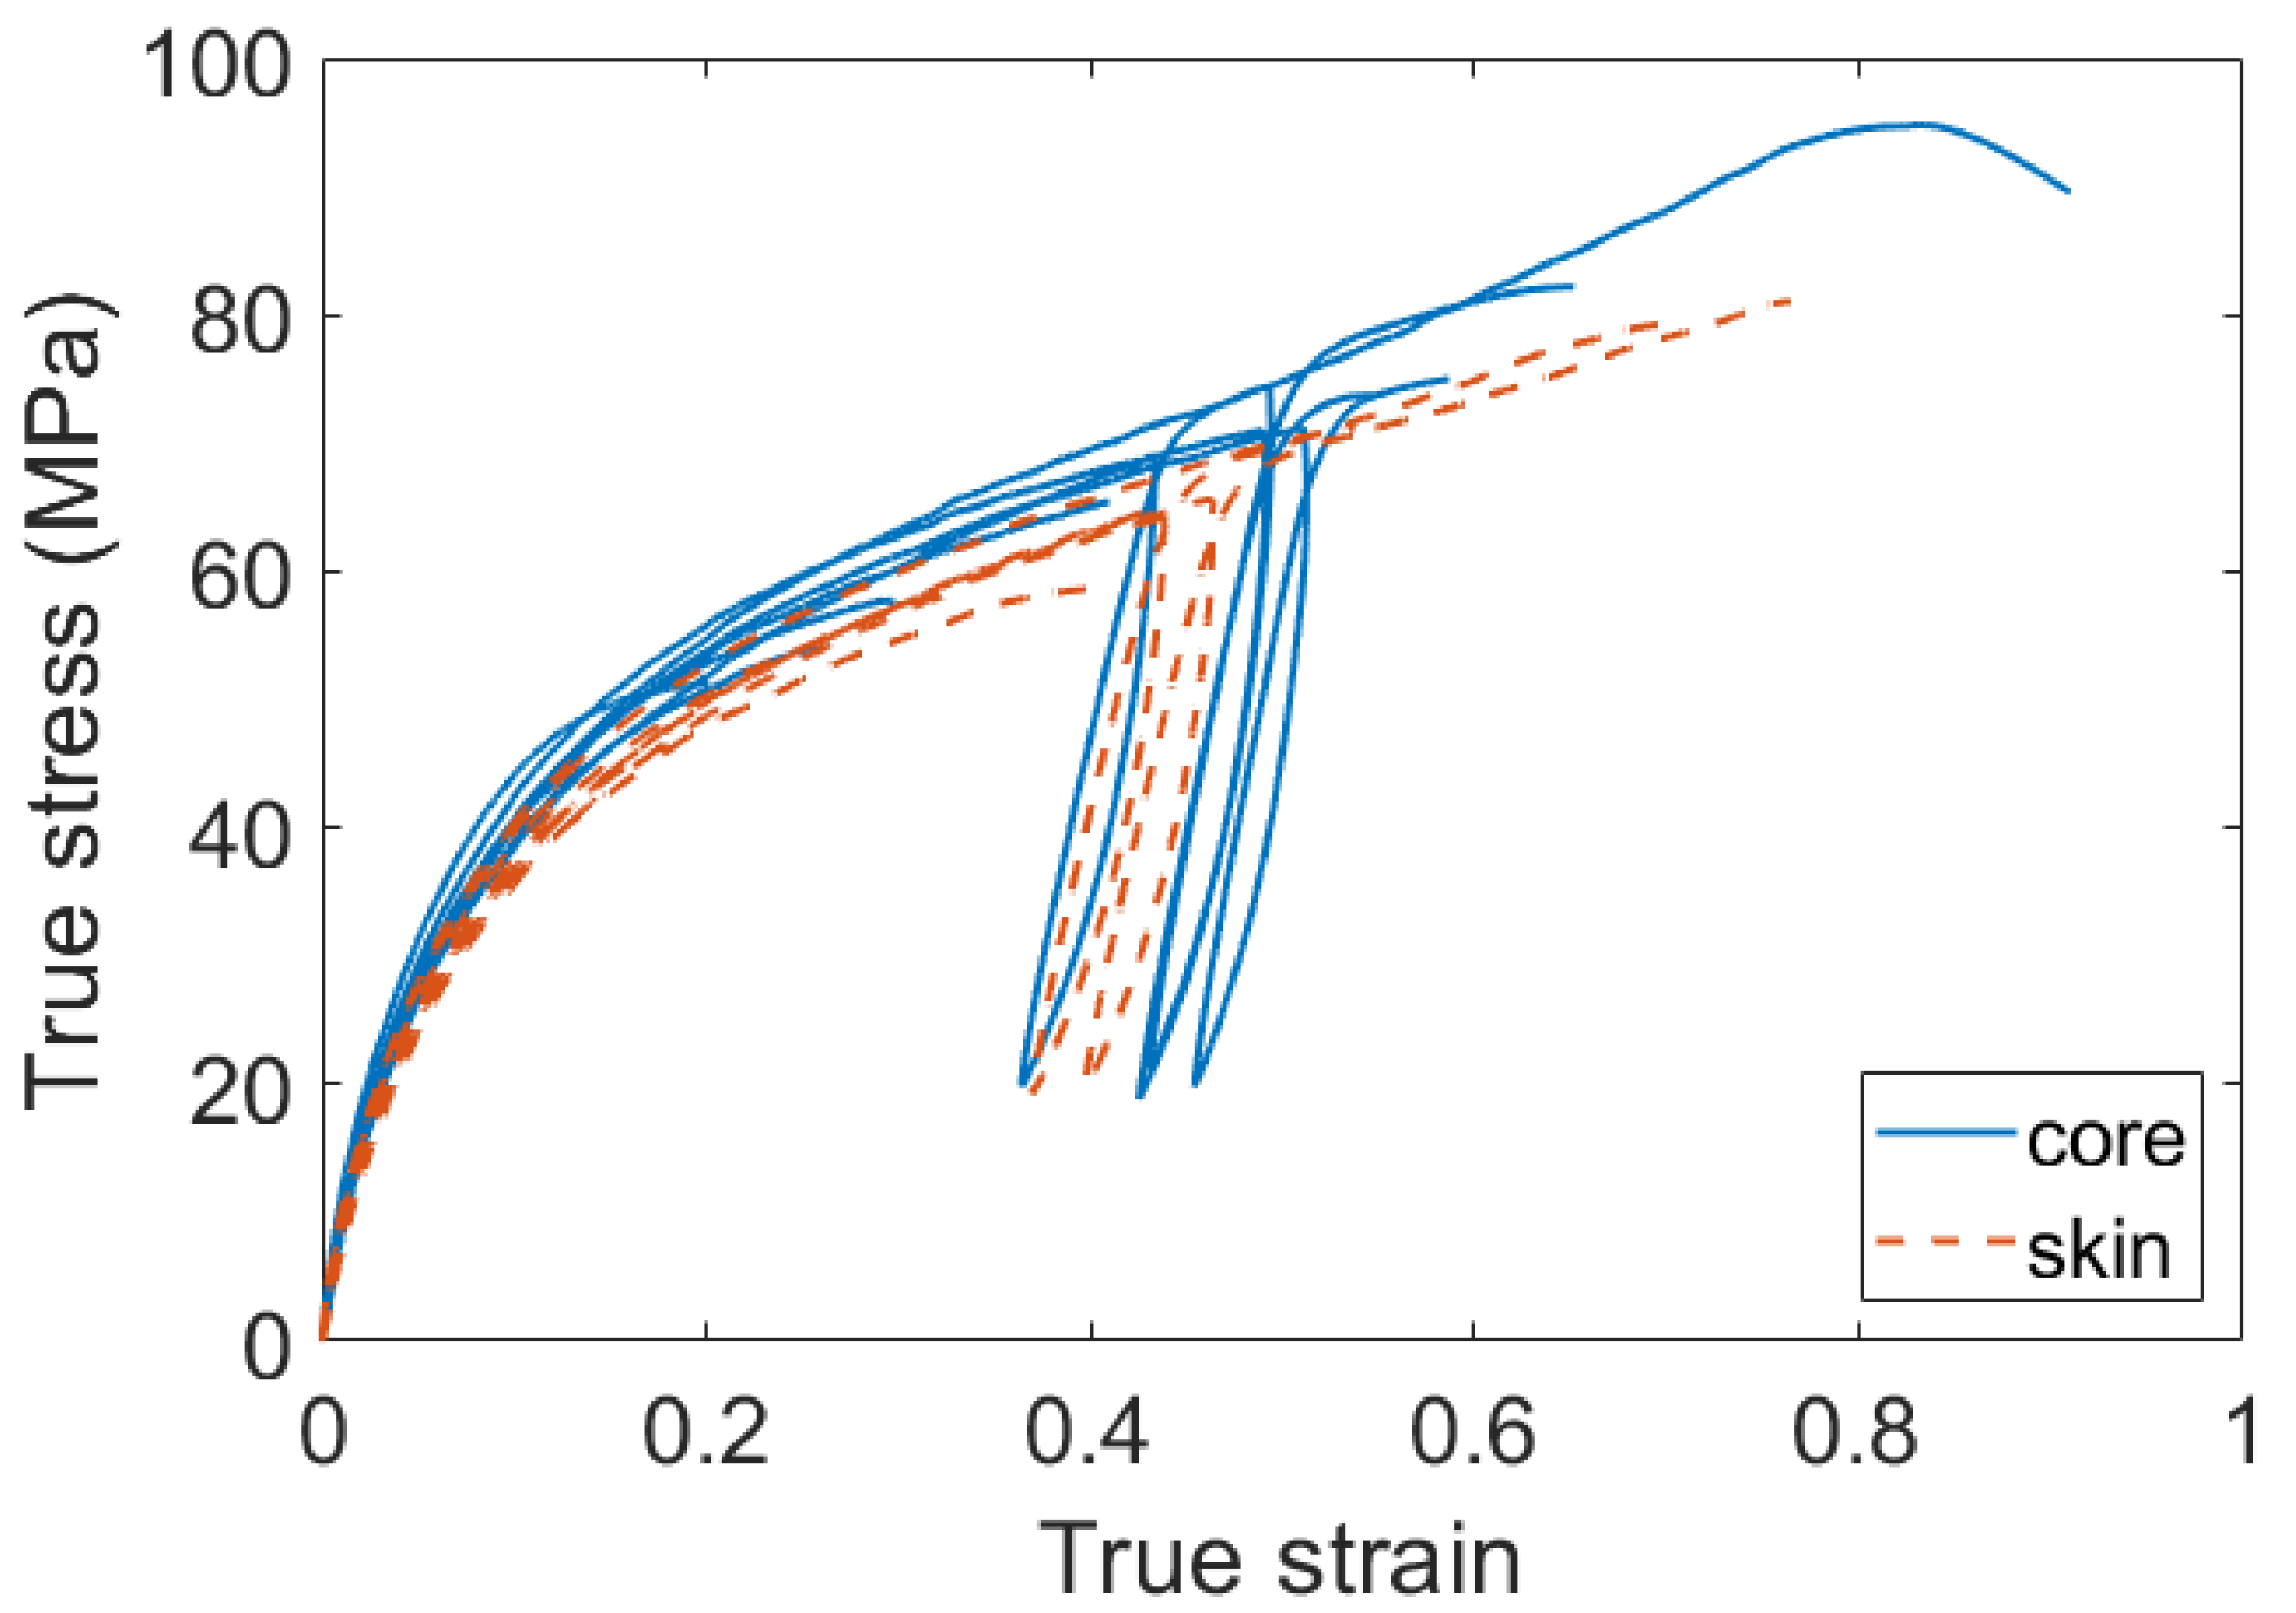
| Core-skin gradient: bigger crystal entities at the core | Core stiffer than the skin |
| Evolution of the lamellae thickness | Evolution of the stiffness: thicker lamellae result in a stiffer polymer. |
Publisher’s Note: MDPI stays neutral with regard to jurisdictional claims in published maps and institutional affiliations. |
© 2022 by the authors. Licensee MDPI, Basel, Switzerland. This article is an open access article distributed under the terms and conditions of the Creative Commons Attribution (CC BY) license (https://creativecommons.org/licenses/by/4.0/).
Share and Cite
Laügt, C.; Bouvard, J.-L.; Robert, G.; Billon, N. Thermo-Hydro-Glycol Ageing of Polyamide 6,6: Microstructure-Properties Relationships. Polymers 2022, 14, 4097. https://doi.org/10.3390/polym14194097
Laügt C, Bouvard J-L, Robert G, Billon N. Thermo-Hydro-Glycol Ageing of Polyamide 6,6: Microstructure-Properties Relationships. Polymers. 2022; 14(19):4097. https://doi.org/10.3390/polym14194097
Chicago/Turabian StyleLaügt, Clément, Jean-Luc Bouvard, Gilles Robert, and Noëlle Billon. 2022. "Thermo-Hydro-Glycol Ageing of Polyamide 6,6: Microstructure-Properties Relationships" Polymers 14, no. 19: 4097. https://doi.org/10.3390/polym14194097