Article

Ferrous-Oxalate-Modified Aramid Nanofibers Heterogeneous Fenton Catalyst for Methylene Blue Degradation

Key Laboratory for New Textile Materials and Applications of Hubei Province, College of Materials Science and Engineering, Wuhan Textile University, Wuhan 430200, China
*
Authors to whom correspondence should be addressed.
These authors contributed equally to this work.
Polymers 2022, 14(17), 3491; https://doi.org/10.3390/polym14173491
Submission received: 22 July 2022 / Revised: 8 August 2022 / Accepted: 16 August 2022 / Published: 26 August 2022
(This article belongs to the Special Issue Functional Nano/Microfiber Based Polymer Materials)

Abstract

:
The heterogeneous Fenton system has drawn great attention in recent years due to its effective degradation of polluted water capability without limitation of the pH range and avoiding excess ferric hydroxide sludge. Therefore, simple chemical precipitation and vacuum filtration method for manufacturing the heterogeneous Fenton aramid nanofibers (ANFs)/ferrous oxalate (FeC2O4) composite membrane catalysts with excellent degradation of methylene blue (MB) is reported in the study. The morphology and structure of materials synthesized were characterized by scanning electron microscope (SEM), X-ray energy spectrum analysis (EDS), infrared spectrometer (FTIR), and X-ray diffraction (XRD) equipment. The 10 ppm MB degradation efficiency of composite catalyst and ferrous oxalate (FeC2O4) within 15 min were 94.5% and 91.6%, respectively. The content of methylene blue was measured by a UV-Vis spectrophotometer. Moreover, the dye degradation efficiency still could achieve 92% after five cycles, indicating the composite catalyst with excellent chemical stability and reusability. Simultaneously, the composite catalyst membrane can degrade not only MB but also rhodamine B (RB), orange II (O II), and methyl orange (MO). This study represents a new avenue for the fabrication of heterogeneous Fenton catalysts and will contribute to dye wastewater purification, especially in the degradation of methylene blue.

1. Introduction

Dye wastewater stemming from textile industries and dyestuff manufacturing is harmful to creatures on earth [1,2,3,4]. Many traditional methods have been used to remove the dye from the water, such as adsorption [5], chemical decolorization [6], and physical coagulation [7]. However, these dyes still exist in another state, without any degradation of the dye molecules. Thus, the chemical catalyst or photocatalyst as an efficient method for the degradation of dye has received more and more attention [8,9]. However, most catalysts have high costs due to the complex preparation process or equipment requirements. Simultaneously, the use of photocatalyst was limited by the catalytic conditions. Previous studies show that advanced oxidation processes (AOPs) can excite hydroxyl radicals to degrade organic pollutants into nontoxic small molecules in wastewater [10,11]. Compared with other oxidants, Fenton catalyst can degrade dye in the dark with a simple operation process, easy reaction, low operating cost, low equipment investment, and environmental friendliness. The Fenton method is a deep oxidation technology that utilizes the chain reaction between Fe2+ and H2O2 to catalyze the generation of hydroxyl radicals (•OH) [12,13,14]. In the reaction of the Fenton process, Fe2+ ions are oxidized by H2O2 to Fe3+ and one equivalent hydroxyl radical (•OH) is generated, as shown in Equation (1) [15,16,17]. In an acidic medium, Fe3+ can be reduced by H2O2 to establish a cycle of iron catalysts for subsequent activation. The mechanism is shown below in Equations (2) and (3) [18,19,20].
Fe 2 + + H 2 O 2 Fe 3 + + OH + OH
Fe 3 + + H 2 O 2 Fe 2 + + HO 2 + H +
Fe 3 + + HO 2 Fe 2 + + O 2 + H +
However, the homogeneous Fenton process is difficult to execute efficiently due to the limitation of the working pH range and the difficulty of separating the dissolved Fe2+ [21,22,23,24,25]. Thus, the heterogeneous Fenton process replaces the homogeneous Fenton system owing to its high activity, recyclability, and durability [26]. In recent years, catalytic fibers have been a very popular heterogeneous Fenton process for efficient decontamination of organic wastewater [27,28,29,30,31]. The combination of catalytic fibers and iron ion Fenton catalysts can solve the issue of poor recyclability of the powdered catalysts, resulting in a simplified process without precipitation and filtering [32]. Various fibers such as cellulose fiber [33], polyphenylene sulfide fiber [34], collagen fiber [35], and carbon fiber [36] have been applied as a carrier for immobilizing iron ion to prepare the Fenton catalyst.
The aramid fiber has received more and more attention due to its thermal stability, good chemical resistance, and excellent mechanical properties [37,38]. Thus, aramid nanofibers (ANFs) can keep their properties under •OH-containing conditions due to their excellent chemical stability. Simultaneously, the ANFs with a porous nanofiber network lamina structure could provide a specific surface area for catalyst decoration [39,40,41]. The ferrous oxalate (FeC2O4) can be synthesized via an inexpensively chemical precipitation method in mild conditions. Thus, ANFs/FeC2O4 can improve the chemical stability and degradation efficiency, and be easily separated from the solution without precipitation and filtration, compared with the powdered ferrous oxalate. However, little research has been reported on the synthesis and methylene blue degradation of the heterogeneous Fenton catalyst with FeC2O4 decorated ANFs.
In this study, the composite fiber membrane catalyst aramid nanofibers/ferrous oxalate (ANFs/FeC2O4) was synthesized as a heterogeneous Fenton catalyst via simple chemical precipitation and vacuum filtration method. To determine the optimal values of experimental variables for the degradation rate of MB solutions, a multivariate experimental design was performed, such as aramid nanofiber content, H2O2 concentration, initial pH, initial methylene blue (MB) concentration, and various structural dyes. In addition, the degradation rate maintains about an average of 92% after the ANFs/FeC2O4 was measured for five cycles, indicating excellent chemical stability. For the first time, the ANFs/FeC2O4 had been used in heterogeneous Fenton catalysis and degraded MB in dye wastewater.

2. Materials and Methods

2.1. Preparation of Aramid Nanofibers (ANFs) Suspension

Aramid nanofibers (ANFs) were obtained by Xinlin Tuo et al.’s method. Methoxypolyethylene glycols (mPEG Mw = 2000, 2.5 g) and calcium chloride (CaCl2, 9 g) were added to 100 mL n-methyl-2-pyrrolidone (NMP) and magnetically stirred at 100 °C. The reactor was reduced to 0 °C in an ice bath after the mixed solution dissolve. Then, 4.32 g p-phenylenediamine (PPD, purity 99%) was added to the above solution. Subsequently, terephthaloyl chloride (TPC, purity 99%) with molar ration at 1:1.007 (PPD:TPC) was added to the above solution and stirred at 70 °C. The mixture solution was shifted to deionized water under stronger shear. Finally, the ANFs suspension formed.

2.2. Preparation of Aramid Nanofibers (ANFs)/Ferrous Oxalate (FeC2O4) Composite Fiber Membrane

Firstly, 0 g, 0.586 g, 1.005 g, 1.424 g, 2.261 g, and 4.774 g ferrous sulfate heptahydrate (FeSO4·7H2O) were dissolved in 100 mL ANFs suspension (0.13 g ANFs, 100 mL deionized water), respectively. The above mixture was stirred for 1 h at room temperature, respectively. Then, 0 g, 0.388 g, 0.666 g, 0.943 g, 1.498 g, and 3.163 g potassium oxalate (K2C2O4) were added to the above solution with stirring for 2 h, respectively. The composite catalyst membranes of ANFs/FeC2O4(0/100), ANFs/FeC2O4(30/70), ANFs/FeC2O4(20/80), ANFs/FeC2O4(15/85), ANFs/FeC2O4(10/90), and ANFs/FeC2O4(5/95) were obtained with 20 mL different proportions of aramid nanofibers and ferrous oxalate mixed solution via vacuum filtration method, respectively. Simultaneously, the FeC2O4 catalyst was obtained using 2.7801 g FeSO4·7H2O and 1.66 g K2C2O4 without ANFs by the same method as above. The schematic illustration is shown in Figure 1.

2.3. Experiment Procedure of Degradation of Methylene Blue

The methylene blue degradation process was simulated with 200 mL 10 ppm methylene blue solution with 150 ppm hydrogen peroxide and composite catalyst membrane in a Fenton reaction system at 20 °C. The pH was adjusted using 0.1 M H2SO4 and 0.1 M NaOH. A certain amount of sample solution was taken out of the reaction solution at specific time intervals. The absorbance of the sample solution was measured by UV-visible spectrophotometry (Shanghai Prism Technology Co., Ltd., Shanghai, China) at 664 nm wavelength. The methylene blue (MB) degradation efficiency can be calculated according to the following equation [42]:
Degradation efficiency (%) = 100% × (C0 − Ct)/C0
C0 and Ct denote the concentration of the MB solution at 0 and t min, respectively.

2.4. Characterization

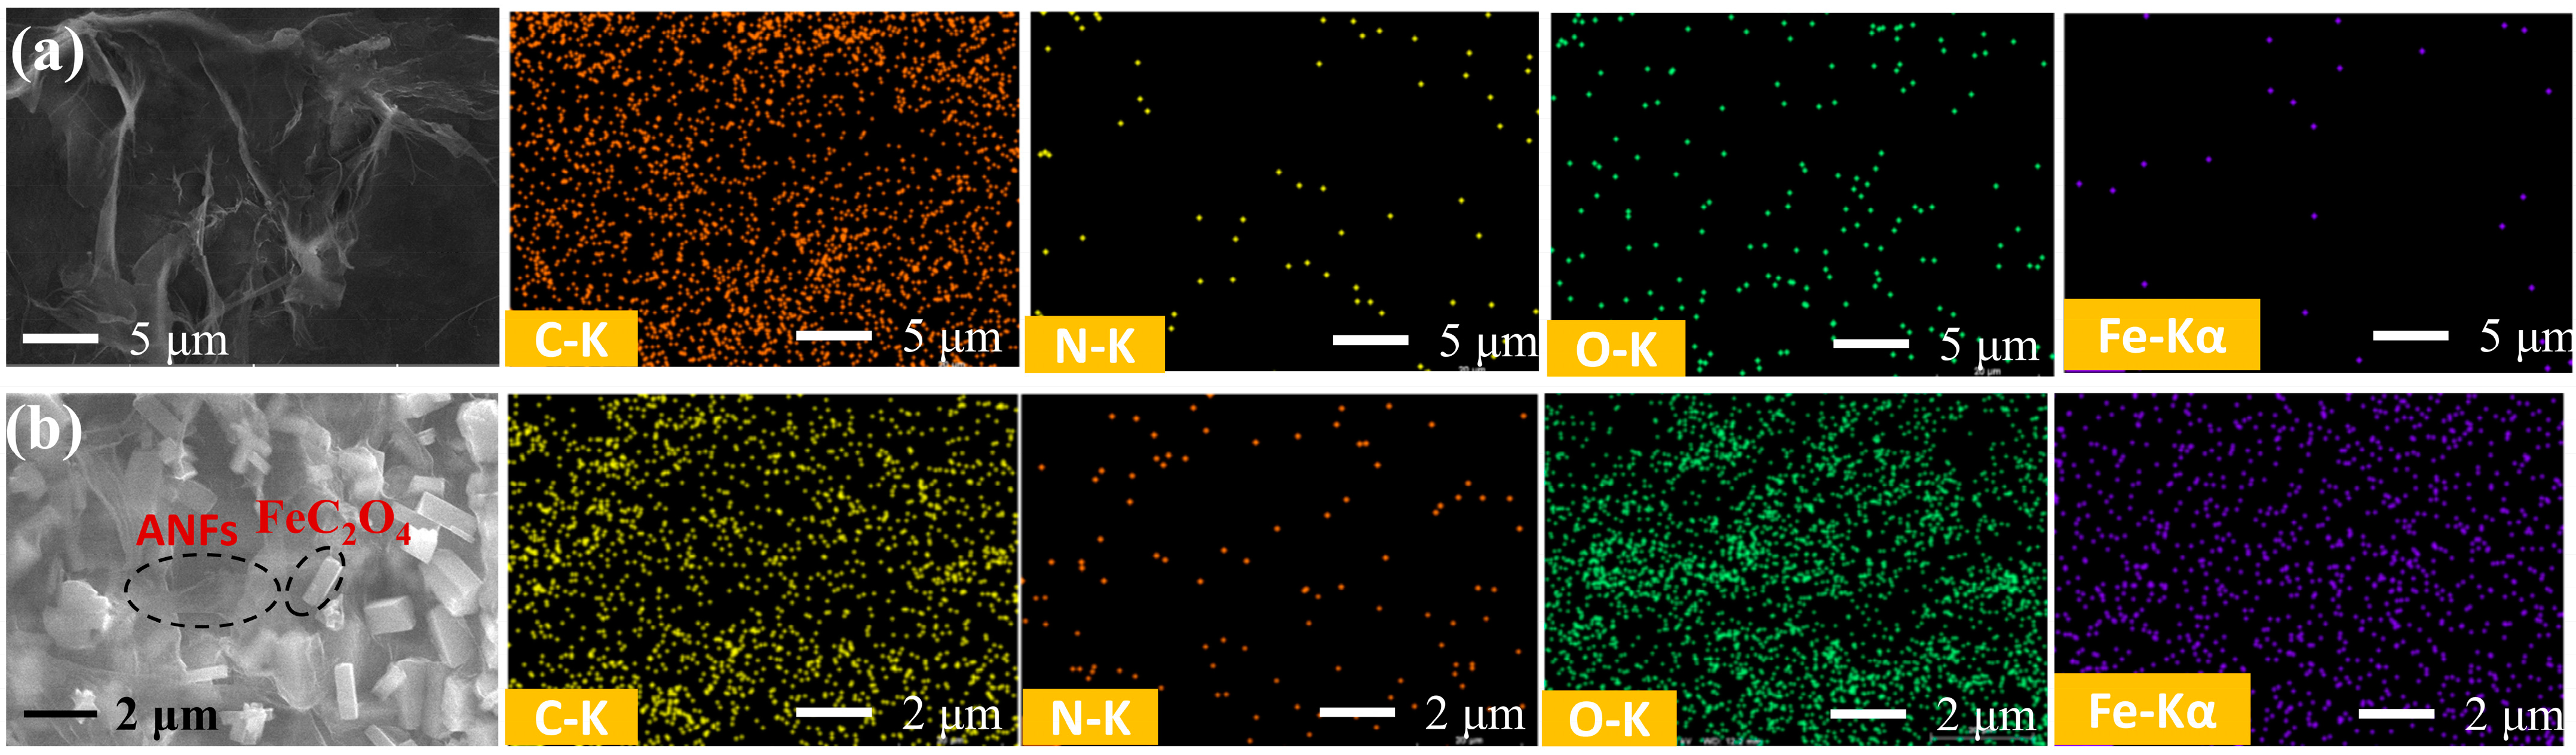
2.4.1. Scanning Electron Microscope (SEM)

The surface morphologies of pure ANFs of ANFs/FeC2O4(20/80) catalysts were recorded on a field emission scanning electron microscope (SEM JEOL JSM-IT300A) at 15 kV voltage. A conductive layer was coated on the samples which were tested.

2.4.2. BET Pore Size Analysis

The pore size distribution of pure ANFs and ANFs/FeC2O4(20/80) was analyzed at T = −195.8 °C by the BET (Micromeritics ASAP 2460), and the equilibration interval was 30 s.

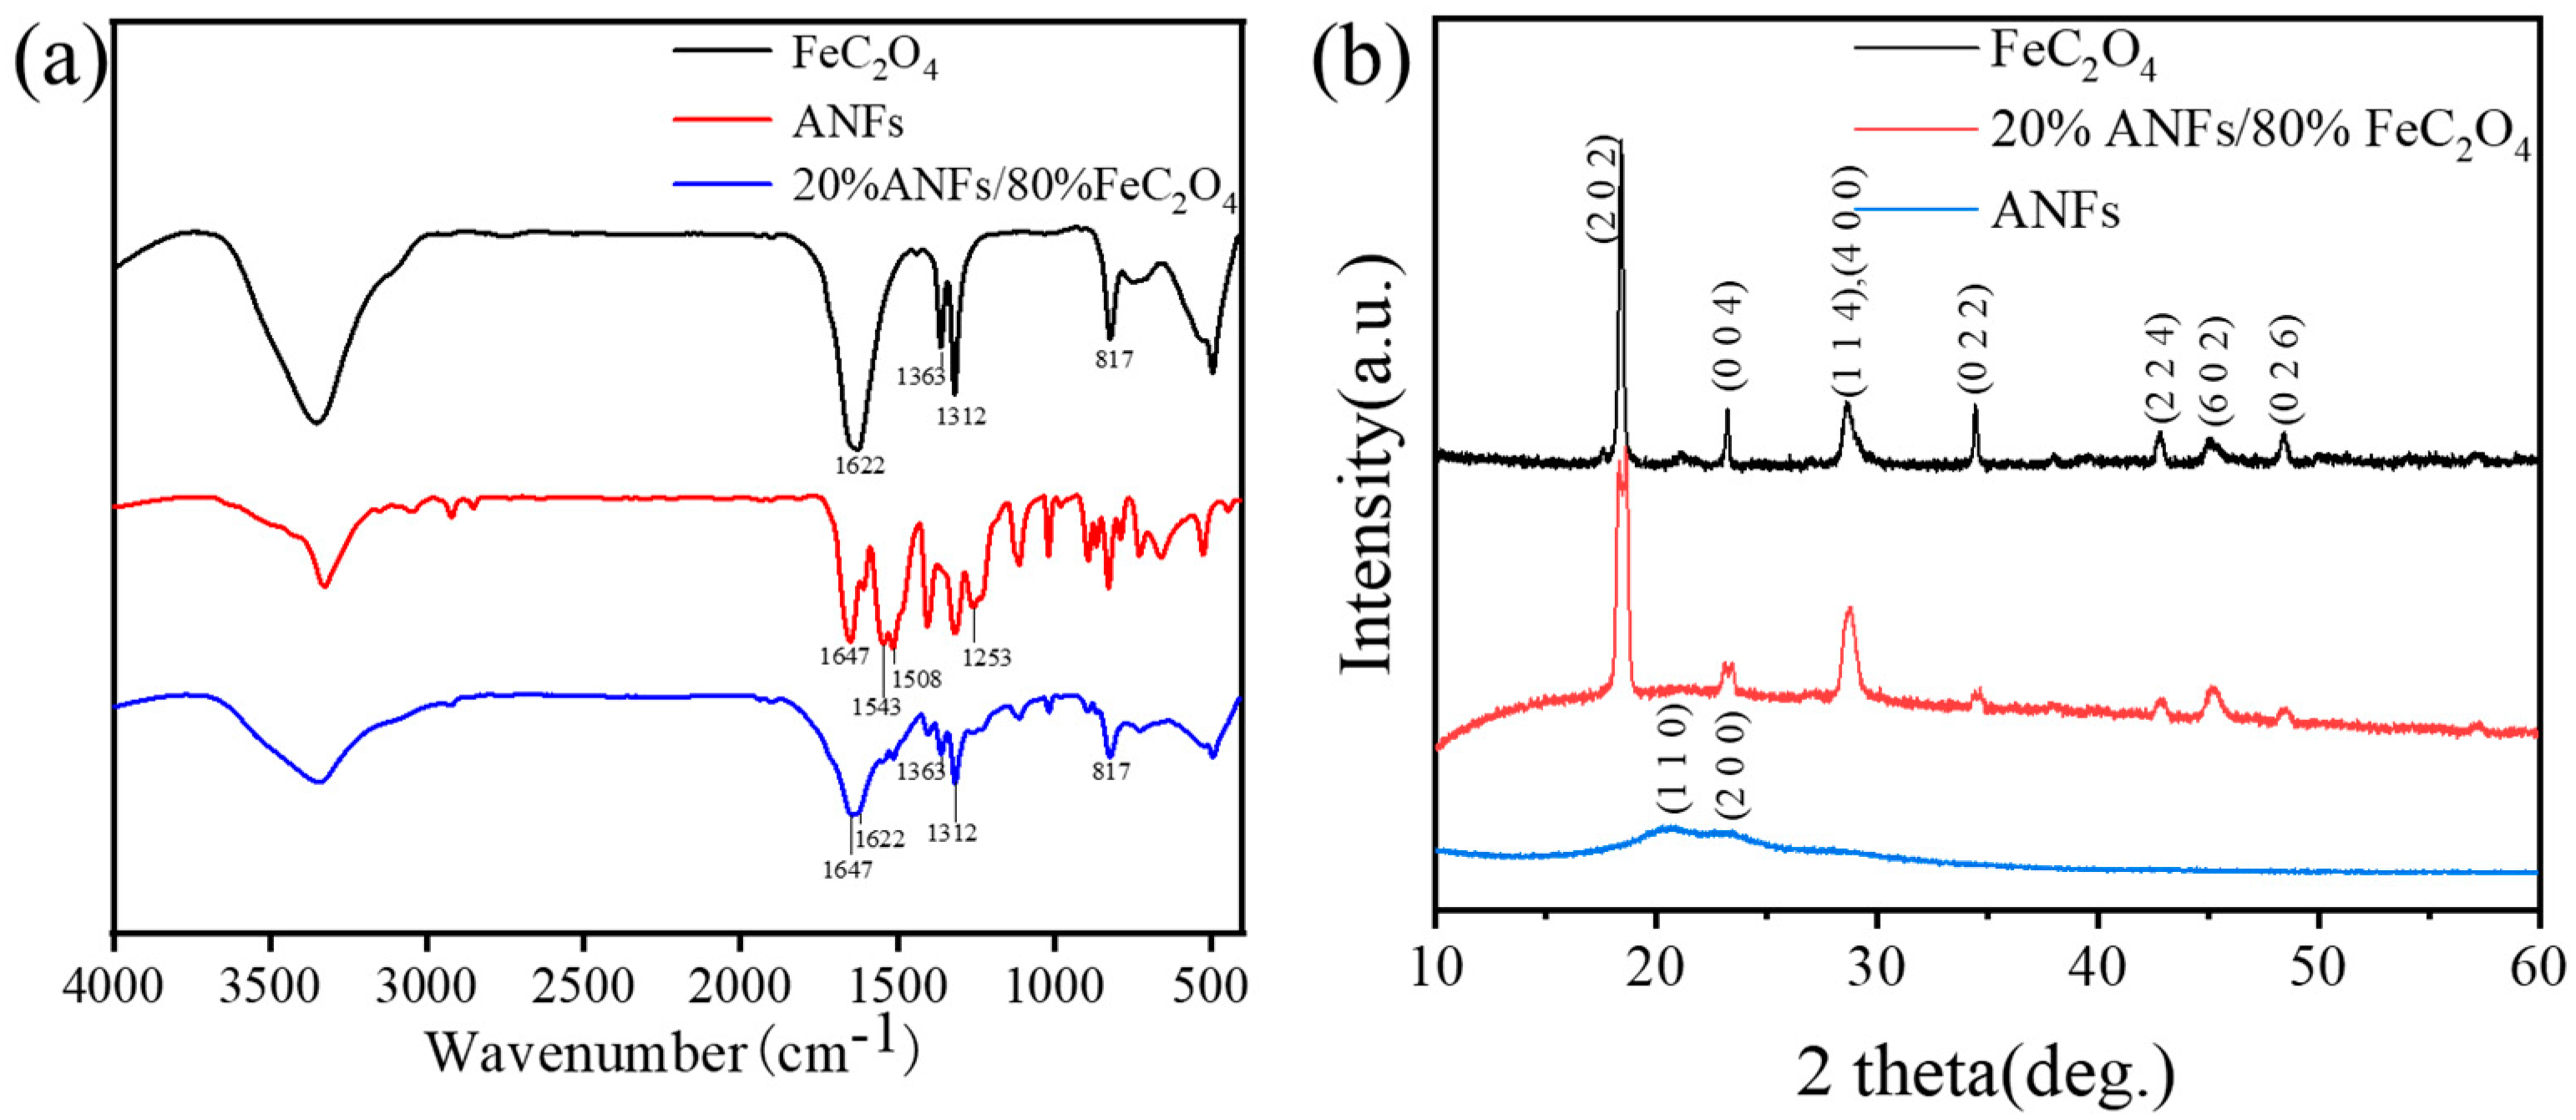
2.4.3. Fourier Transform Infrared Spectrometer

Infrared spectrogram of pure ANFs, pure FeC2O4, and ANFs/FeC2O4(20/80) was measured by FTIR (VERTEX70) attached ATR accessories to characterize a functional group of test samples with scanning varying from 500 cm−1 to 4000 cm−1. The six repeat scans were performed at 4.0 cm−1 intervals during the scanning range.

2.4.4. X-ray Diffraction (XRD) Analysis

X-ray powder diffraction (XRD) patterns were recorded on an X-ray diffraction system (Empyrean, Holland) using Cu-Kα radiation (1.54 Å) in the scanning range from 10–60° (2θ) with steps of 0.02° (2θ).

2.4.5. Measurement of Methylene Blue Concentration by UV-Vis Spectrophotometer

The methylene blue concentration was measured to characterize the degradation performance of the catalyst during the process of determining optimal degradation conditions. The concentration of methylene blue was measured using an ultraviolet spectrophotometer (A590 spectrophotometer, Shanghai, China) at 664 nm, which is the maximum absorbance of MB.

2.4.6. X-ray Photoelectron Spectroscopy (XPS) Analysis

The surface elemental content of the fresh and used-five-times composite catalyst was investigated by the X-ray photoelectron spectroscopy (XPS, Thermo Scientific K-Alpha, Waltham, MA, USA) using Al Kα radiation.

3. Results and Discussion

3.1. ANFs/FeC2O4 Membrane Characterization

The fiber morphology of obtained ANFs was observed by scanning electron microscopy (SEM) as shown in Figure 2, and the diameter of the fiber is about 40 nm. The surface morphology and structure of the ANFs membrane and ANFs/FeC2O4(20/80) membrane were investigated by SEM. Shown in Figure 3a is the ANFs membrane with a nanofiber network lamina structure. The pore distribution can be seen clearly in Figure 4, the pore size of the composite FeC2O4 membrane was lager than that of the pure ANFs membrane. However, the content of pores of pure ANFs and ANFs/FeC2O4 membrane is very low, indicating it has a compact structure. The surface topography of ANFs membrane without obvious fiber morphology from the SEM images may be due to the strong intermolecular interactions leading to the fusion of ANFs and forming a compact structure during the formation of ANFs membrane via vacuum filtration [43,44]. The element distributions of the ANFs and ANFs/FeC2O4(20/80) membranes were observed using EDS element mapping, as shown in Figure 3. Compared with the ANFs membrane, obvious Fe element deposition could be observed in ANFs/FeC2O4(20/80) membrane. This phenomenon suggested that the FeC2O4 crystalline grains were formed on the fiber layer of the aramid nanofiber surface after the chemical deposition process, which meant that the ferrous oxalate was decorated on the ANFs successfully.
ATR FT-IR spectra were characterized to determine the chemical structure of the FeC2O4, ANFs, and ANFs/FeC2O4(20/80), as shown in Figure 5a. The peak at 1622 cm−1 shows the O-C-O asymmetric stretching vibration of C2O42−, while the peak around 1363 cm−1 and 1312 cm−1 is the O-C-O symmetrical stretching vibration of C2O42− [34], and that at 817 cm−1 corresponds to the C2O42− O=C-O bending vibration [45]. The band at 1647 cm−1 can be attributed to the C=O stretching vibration [46,47]. The 1543 cm−1 and 1253 cm−1 can correspond to the N-H, C-N deformation coupling vibrations of ANFs. The band at 1509 cm−1 can be assigned to the C-C stretch of the aromatic nucleus [39,48]. These results show the FeC2O4 was decorated on the ANFs successfully.
XRD crystalline structure characterization of the ANFs, FeC2O4, and ANFs/FeC2O4(20/80) were shown in Figure 5b. The crystal structure of FeC2O4 is β-FeC2O4 (JCPDS No. 22-0635), and the peaks at 18.3°, 23.0°, 28.5°, 28.6°, 34.3°, 42.6°, 45.3°, and 48.2° are diffraction peaks of (2 0 2), (0 0 4), (1 1 4), (4 0 0), (0 2 2), (2 2 4), (6 0 2), and (0 2 6) lattice planes in β-FeC2O4. The peaks of ANFs at 20.5 and 23.3 are consistent with the (1 1 0) and (2 0 0) crystals in the poly-p-phenylene terephthamide crystal [49]. The diffraction pattern of the crystal anchored on the surface of the ANFs fiber is consistent with β-FeC2O4, and the peaks at 2θ values have no obvious deviation, indicating that the addition of ANFs would not change the structure of FeC2O4. Simultaneously, peaks of the ANFs/FeC2O4(20/80) catalyst were wider than that of FeC2O4, indicating that smaller FeC2O4 crystalline grains were decorated on the ANFs. The smaller size of FeC2O4 could improve the degradation performance of heterogeneous Fenton catalyst [50]. Thus, the ANFs/FeC2O4(20/80) catalyst was composed of ANFs and β-FeC2O4.

3.2. Influence of Experimental Conditions on Degradation Performance

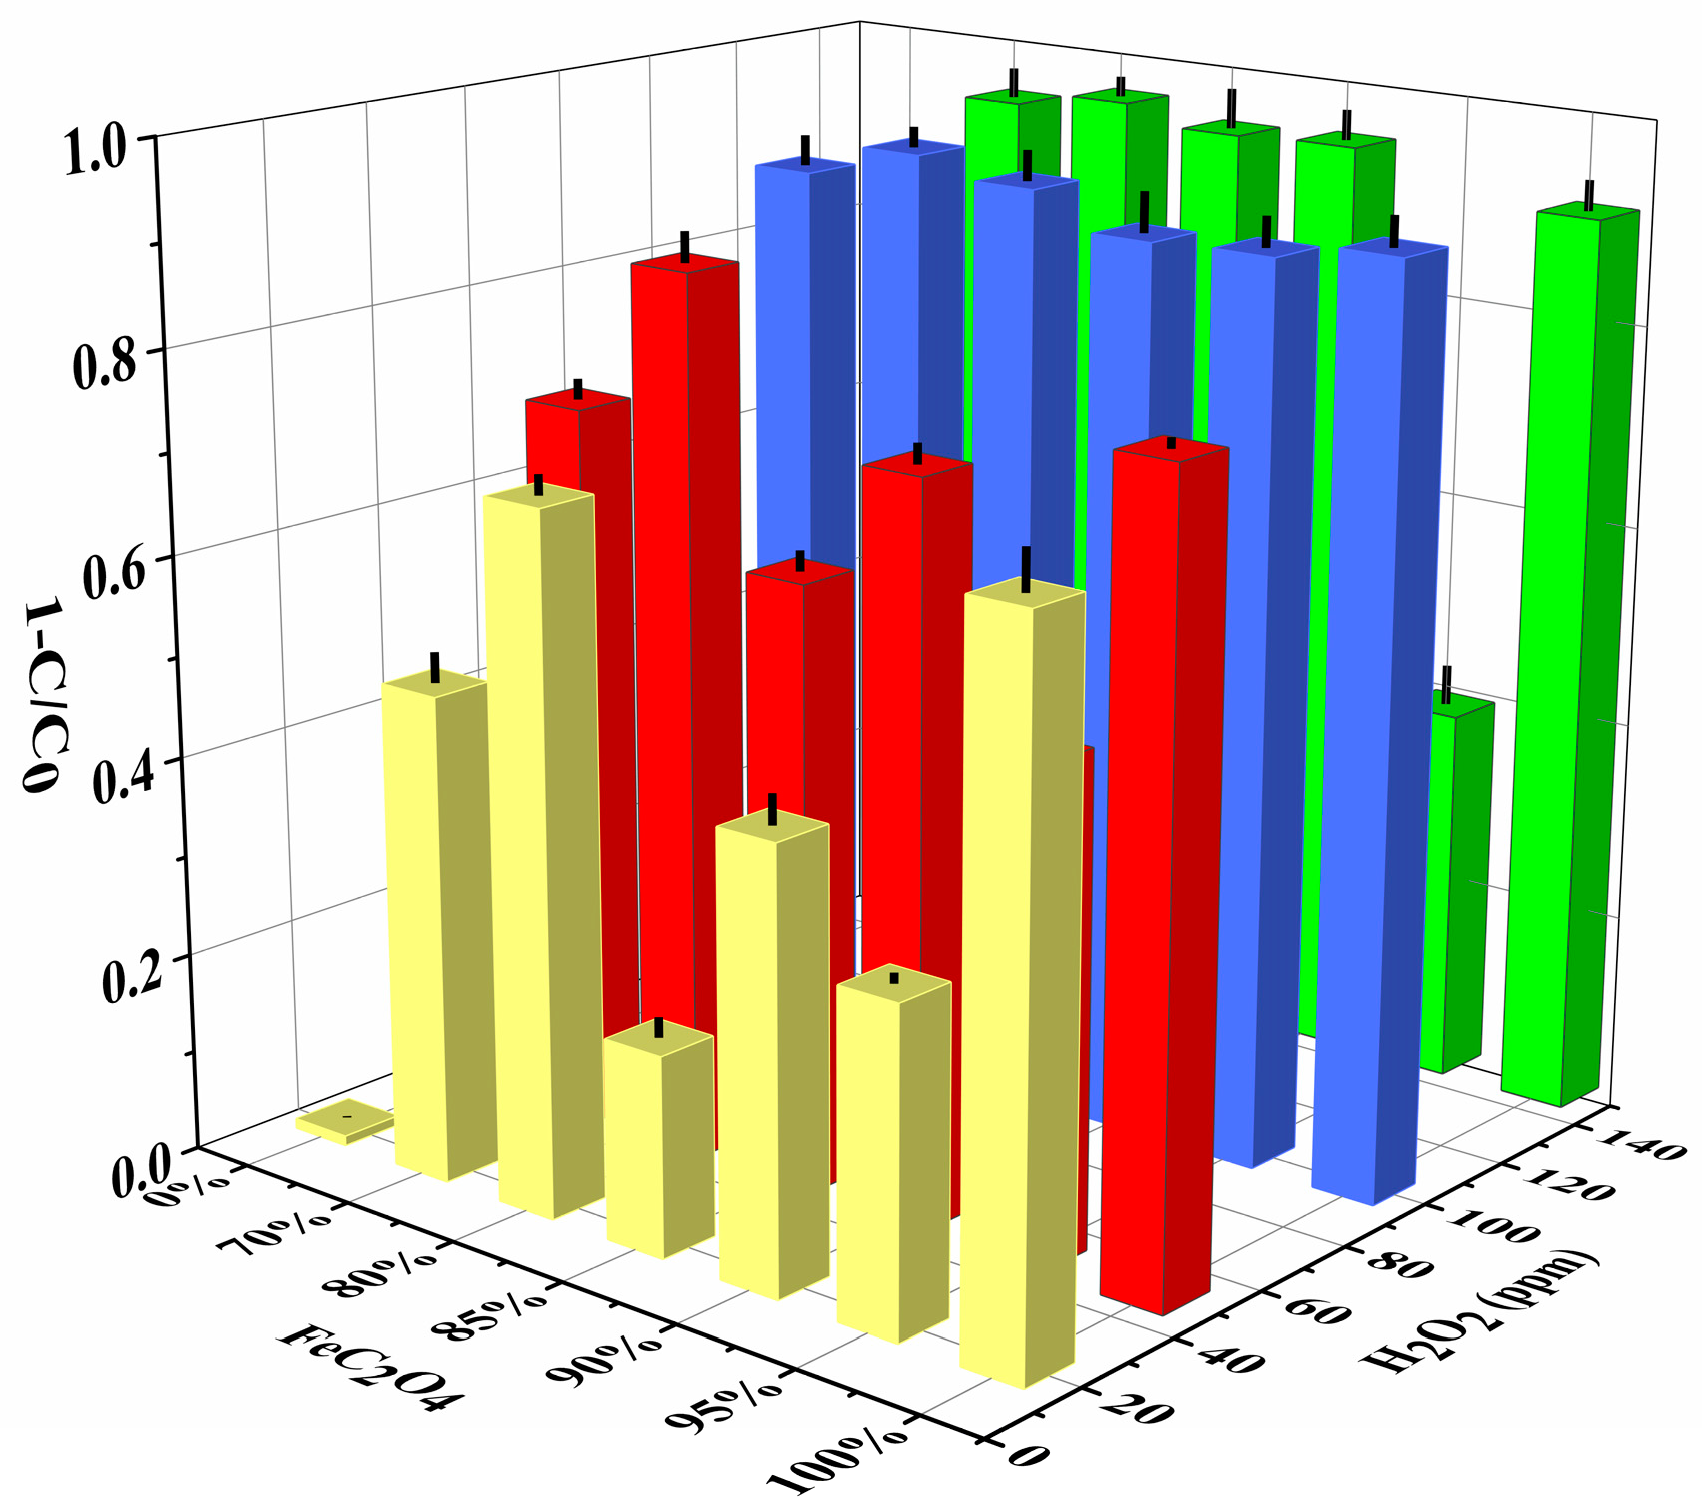
3.2.1. Influence of FeC2O4 Content and H2O2 Concentration in the Composite Film

The MB degradation performance of different ratio composite catalyst membranes was investigated, respectively. The pure ANFs had relatively poor degradation performance of MB, compared with the pure FeC2O4. However, when the FeC2O4 was decorated on the ANFs, they had better catalytic performance compared with the pure FeC2O4, as shown in Figure 6. The ANFs/FeC2O4(20/80) had the best degradation performance during ANFs/FeC2O4 composite catalyst with different proportions. The reason the degradation performance of MB decreased with the increase of ferrous oxalate may be that the ANFs did not have enough area to support the FeC2O4, resulting in the agglomeration of FeC2O4 affecting the degradation performance. Figure 5 shows the methylene blue degradation capacity improved with the accretion of H2O2 from 20 ppm to 100 ppm at an initial pH of 7. However, as the concentration of H2O2 increases, the degradation rate of MB is without significant change. The hydroxyl radicals (•OH) can be eliminated with the excessive addition of H2O2, resulting in the degradation rate without obvious increase, as shown in Equation (5) [51,52].
H 2 O 2 + OH H 2 O + HO 2

3.2.2. Influence of Initial pH (pH0)

The degradation efficiency of MB by heterogeneous Fenton’s process may be influenced by pH. In our study, the effect of pH from 1 to 9 on the degradation performance of MB was explored. The MB degradation efficiency did not show an obvious difference when pH = 1, 3, 5, and 7 within 15 min (Figure 7a), indicating the catalyst is not limited to acidic conditions. Compared with the homogeneous Fenton catalyst (pH range = 3–4), the heterogeneous Fenton catalyst improves pH working range [53]. The final MB degradation efficiency did not show reduction at pH 1. However, the MB degradation velocity decreased slightly at pH 1. The hydrogen peroxide solvates a proton to bring into being an oxonium ion (H3O2+), which may be the reason for the decrease of degradation performance at pH 1. The hydrogen peroxide with electrophilicity due to the presence of oxygen ions results in the stability improvement of hydrogen peroxide and reduced reactivity with ferrous ions [54]. As reported by other studies [34,55], Fenton’s catalyst loses its degradation performance at low pH due to the Fe3+ being attacked by the H2O2, and inactivated into Fe4+, according to Equation (6). However, the C2O42− of ANFs/FeC2O4 can chelate Fe3+ to a certain extent to prevent Fe3+ from peroxidation. Thus, the ANFs/FeC2O4 can degrade dyes at low pH and expand the pH working range. At pH = 9, the MB degradation is drastically reduced, which may be due to the low dissolution capability of iron species [56,57]. The pH0 of the heterogeneous degradation process with the ANFs/FeC2O4(20/80) catalyst was shown to have an optimum value of 7 for the degradation of MB.
Fe 3 + + H 2 O 2 + H + Fe 4 + + OH + H 2 O

3.2.3. Influence of Initial MB Concentration

The effect of initial methylene blue concentration on degradation performance was investigated by changing the concentration from 10 to 50 ppm, as shown in Figure 7b. The degradation velocity decreases with increasing initial methylene blue concentration. However, the ultimate degradation amount of MB improved as the initial MB concentration increased. As the MB concentration increases, the active site is surrounded by enough MB molecules, and the activated hydroxyl groups have more opportunities to attack the MB for degradation, whereas the increase in the degradation amount of MB lags the increase in the initial MB concentration, resulting in the decrease of the degradation efficiency. It can be seen that the degradation efficiency of MB gradually decreased with the increase of the initial concentration of MB. When the initial concentration is 10 ppm, the composite catalyst has higher degradation efficiency. Based on the maintenance of other conditions in the solution, the concentration of 10 ppm methylene blue was used as a fixed value in subsequent experiments.

3.2.4. Influence of Different Dyes

As shown in Figure 7c, the degradation rate of various dyes was assessed by using different models of dyes. According to the different types of charges carried on the surface of the dye’s particles, organic dyes can be mainly classified into two categories: cationic dyes (methylene blue, MB; rhodamine B, RB; methyl orange, MO; anionic dyes (orange II, OII). Both methyl orange and orange II are azo dyes, and the relatively low degradation rate may be due to the presence of azo and aryl groups. It can be seen that the cationic and non-azo dyes have a higher degradation rate than the anions and azo dyes. The reason for the ANFs/FeC2O4 composite catalyst membrane providing better degradation performance of cationic dyes may be due to the ANFs having negativity [58,59,60] which can faster adsorption of cationic dye molecules, corresponding to Mohammed’s previous report [61]. However, various structures and types of dyes can be efficiently degraded by the ANFs/FeC2O4 composite membrane catalyst. In this experiment, methylene blue is a typical cationic non-azo dye, it is selected as a representative degradable dye.

3.2.5. Influence of Cycle Performance

As shown in Figure 7d, the cycle stability of ANFs/FeC2O4 survived five periods of the cyclic degradation experiment. During the cycling experiment, the used catalyst was thoroughly rinsed with deionized water, and vacuum dried as the initial preparation process. The degradation performance is not significantly different from the first in the second cycle process. However, starting from the third cycle of the process, the degradation performance of the process was reduced slightly. As illustrated in Figure 8, compared with the fresh catalyst, the content of iron in the catalyst after being reused five times was decreased. The reason for the decrease in degradation rate may be due to the trace abscission of active sites in the ANFs/FeC2O4 during flushing. The Fe 2p narrowband XPS spectrum (Figure 8b) of the catalyst was scanned over the binding energy range of 740 eV to 700 eV. The simulated peaks at 727.43 eV and 724.02 eV can be confirmed as Fe2+ characteristic peaks in Fe 2p1/2, and the simulated partial peaks at 711.23 eV and 714.28 eV can be confirmed as Fe2+ characteristic peaks in Fe 2p3/2, respectively. The curve of the used catalyst is similar to a fresh catalyst, and there is no obvious Fe3+ characteristic peak. The decrease in peak intensity is due to the decrease in relative element content. So, the iron elements on the surface of the catalyst before and after the reaction are mainly Fe2+ particles. During the degradation process, Fe2+ on the catalyst surface is oxidized in the hydroxyl radical formation reaction. However, Fe3+ characteristic peaks were not observed in the Fe 2p narrow-band XPS spectrum. The formation of Fe3+ can be reduced to Fe2+ and reactivated as an active site. Eventually, the catalytic performance of the ANFs/FeC2O4 decreased slightly. In a word, the ANFs/FeC2O4 has high catalytic stability and good recycling performance in the cyclic degradation process.

3.2.6. The Kinetics of Degradation of MB

According to Section 3.2.1Section 3.2.4, Fenton catalyzed degradation results, based on the Langmuir–Hinshelwood model [62,63] of the photocatalytic kinetics of Fenton catalyst for MB degradation, were investigated. During photocatalytic degradation, when the molecular adsorption reaches equilibrium, the pseudo-first-order kinetic equation can be expressed as Equation (7). If the degradation of methylene blue by Fenton catalyst is a pseudo-first-order reaction, the above formula can be simplified to Equation (8). After integration, Equation (9) is obtained.
v = d C t d t = k r K ad C t / ( 1 + K ad C t )
v = d C t d t = k r K a d C t = K C t
ln ( C 0 C t ) = K t
k r is the reaction rate constant, K ad is the adsorption equilibrium constant, C t represents the concentration of MB at t, and C 0 represents the MB concentration after adsorption and desorption at equilibrium, K represents the pseudo-first-order rate equation constant.
The fitting curve of the pseudo-first-order kinetics of MB catalyzed by the composite catalyst is shown in Figure 8c. The fitted linear correlation coefficient of the composite Fenton catalyst was 0.98947, indicating that the catalytic degradation of MB by the catalyst conformed to a pseudo-first-order kinetic model.

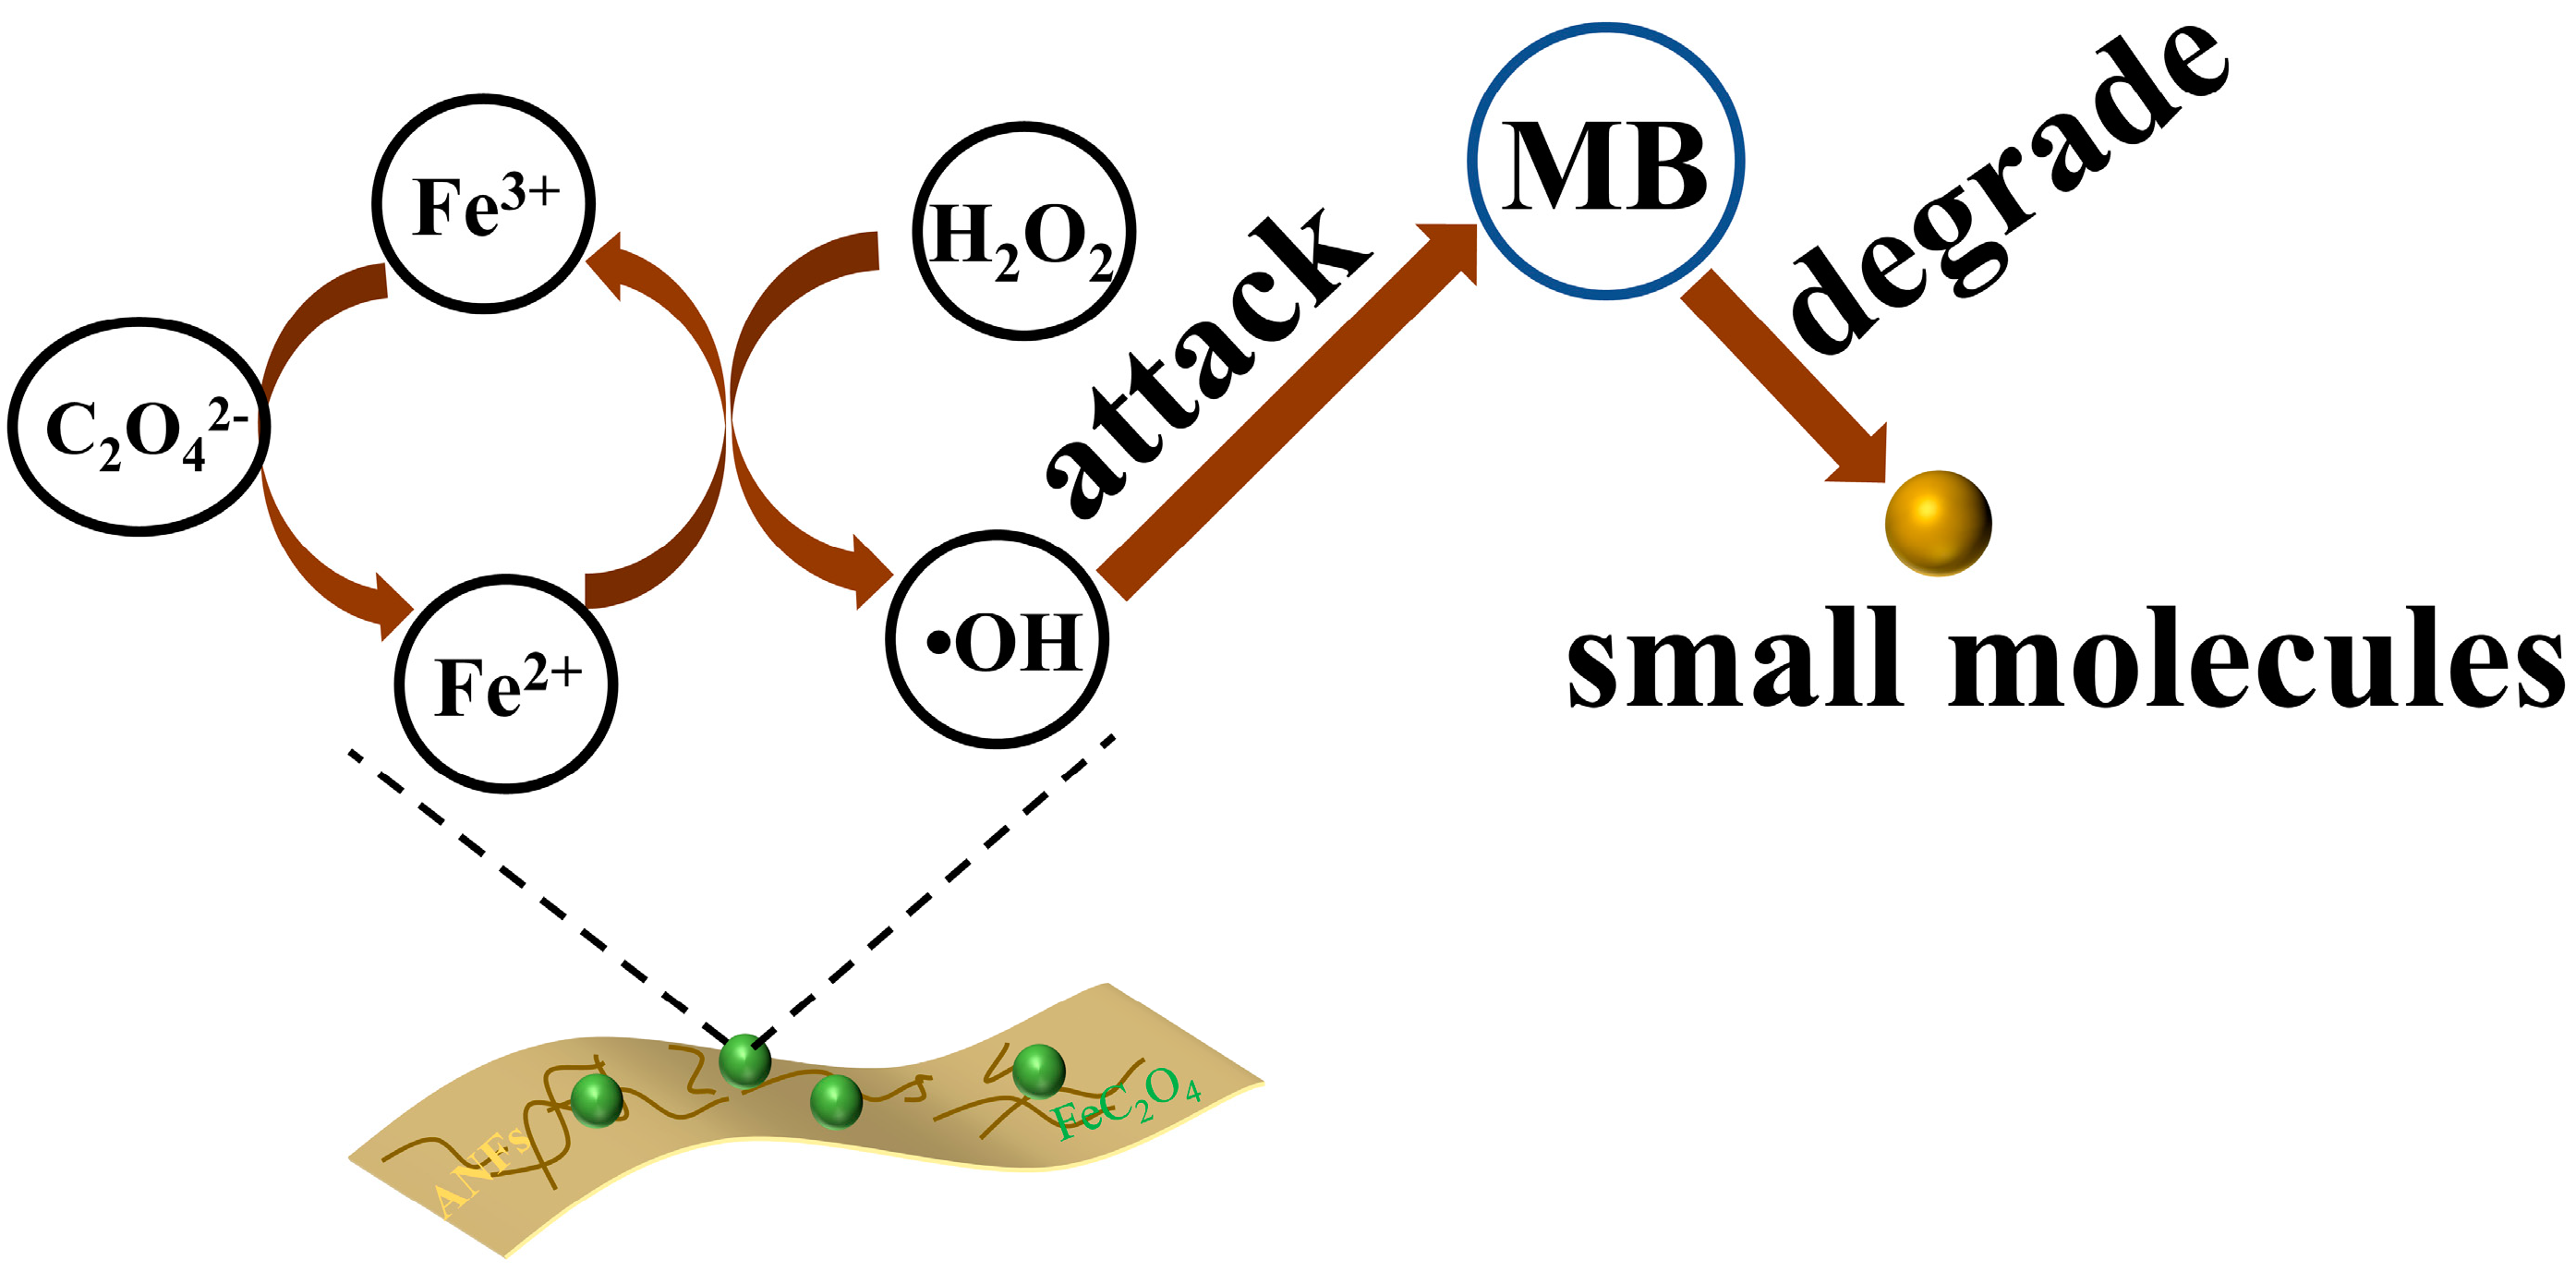
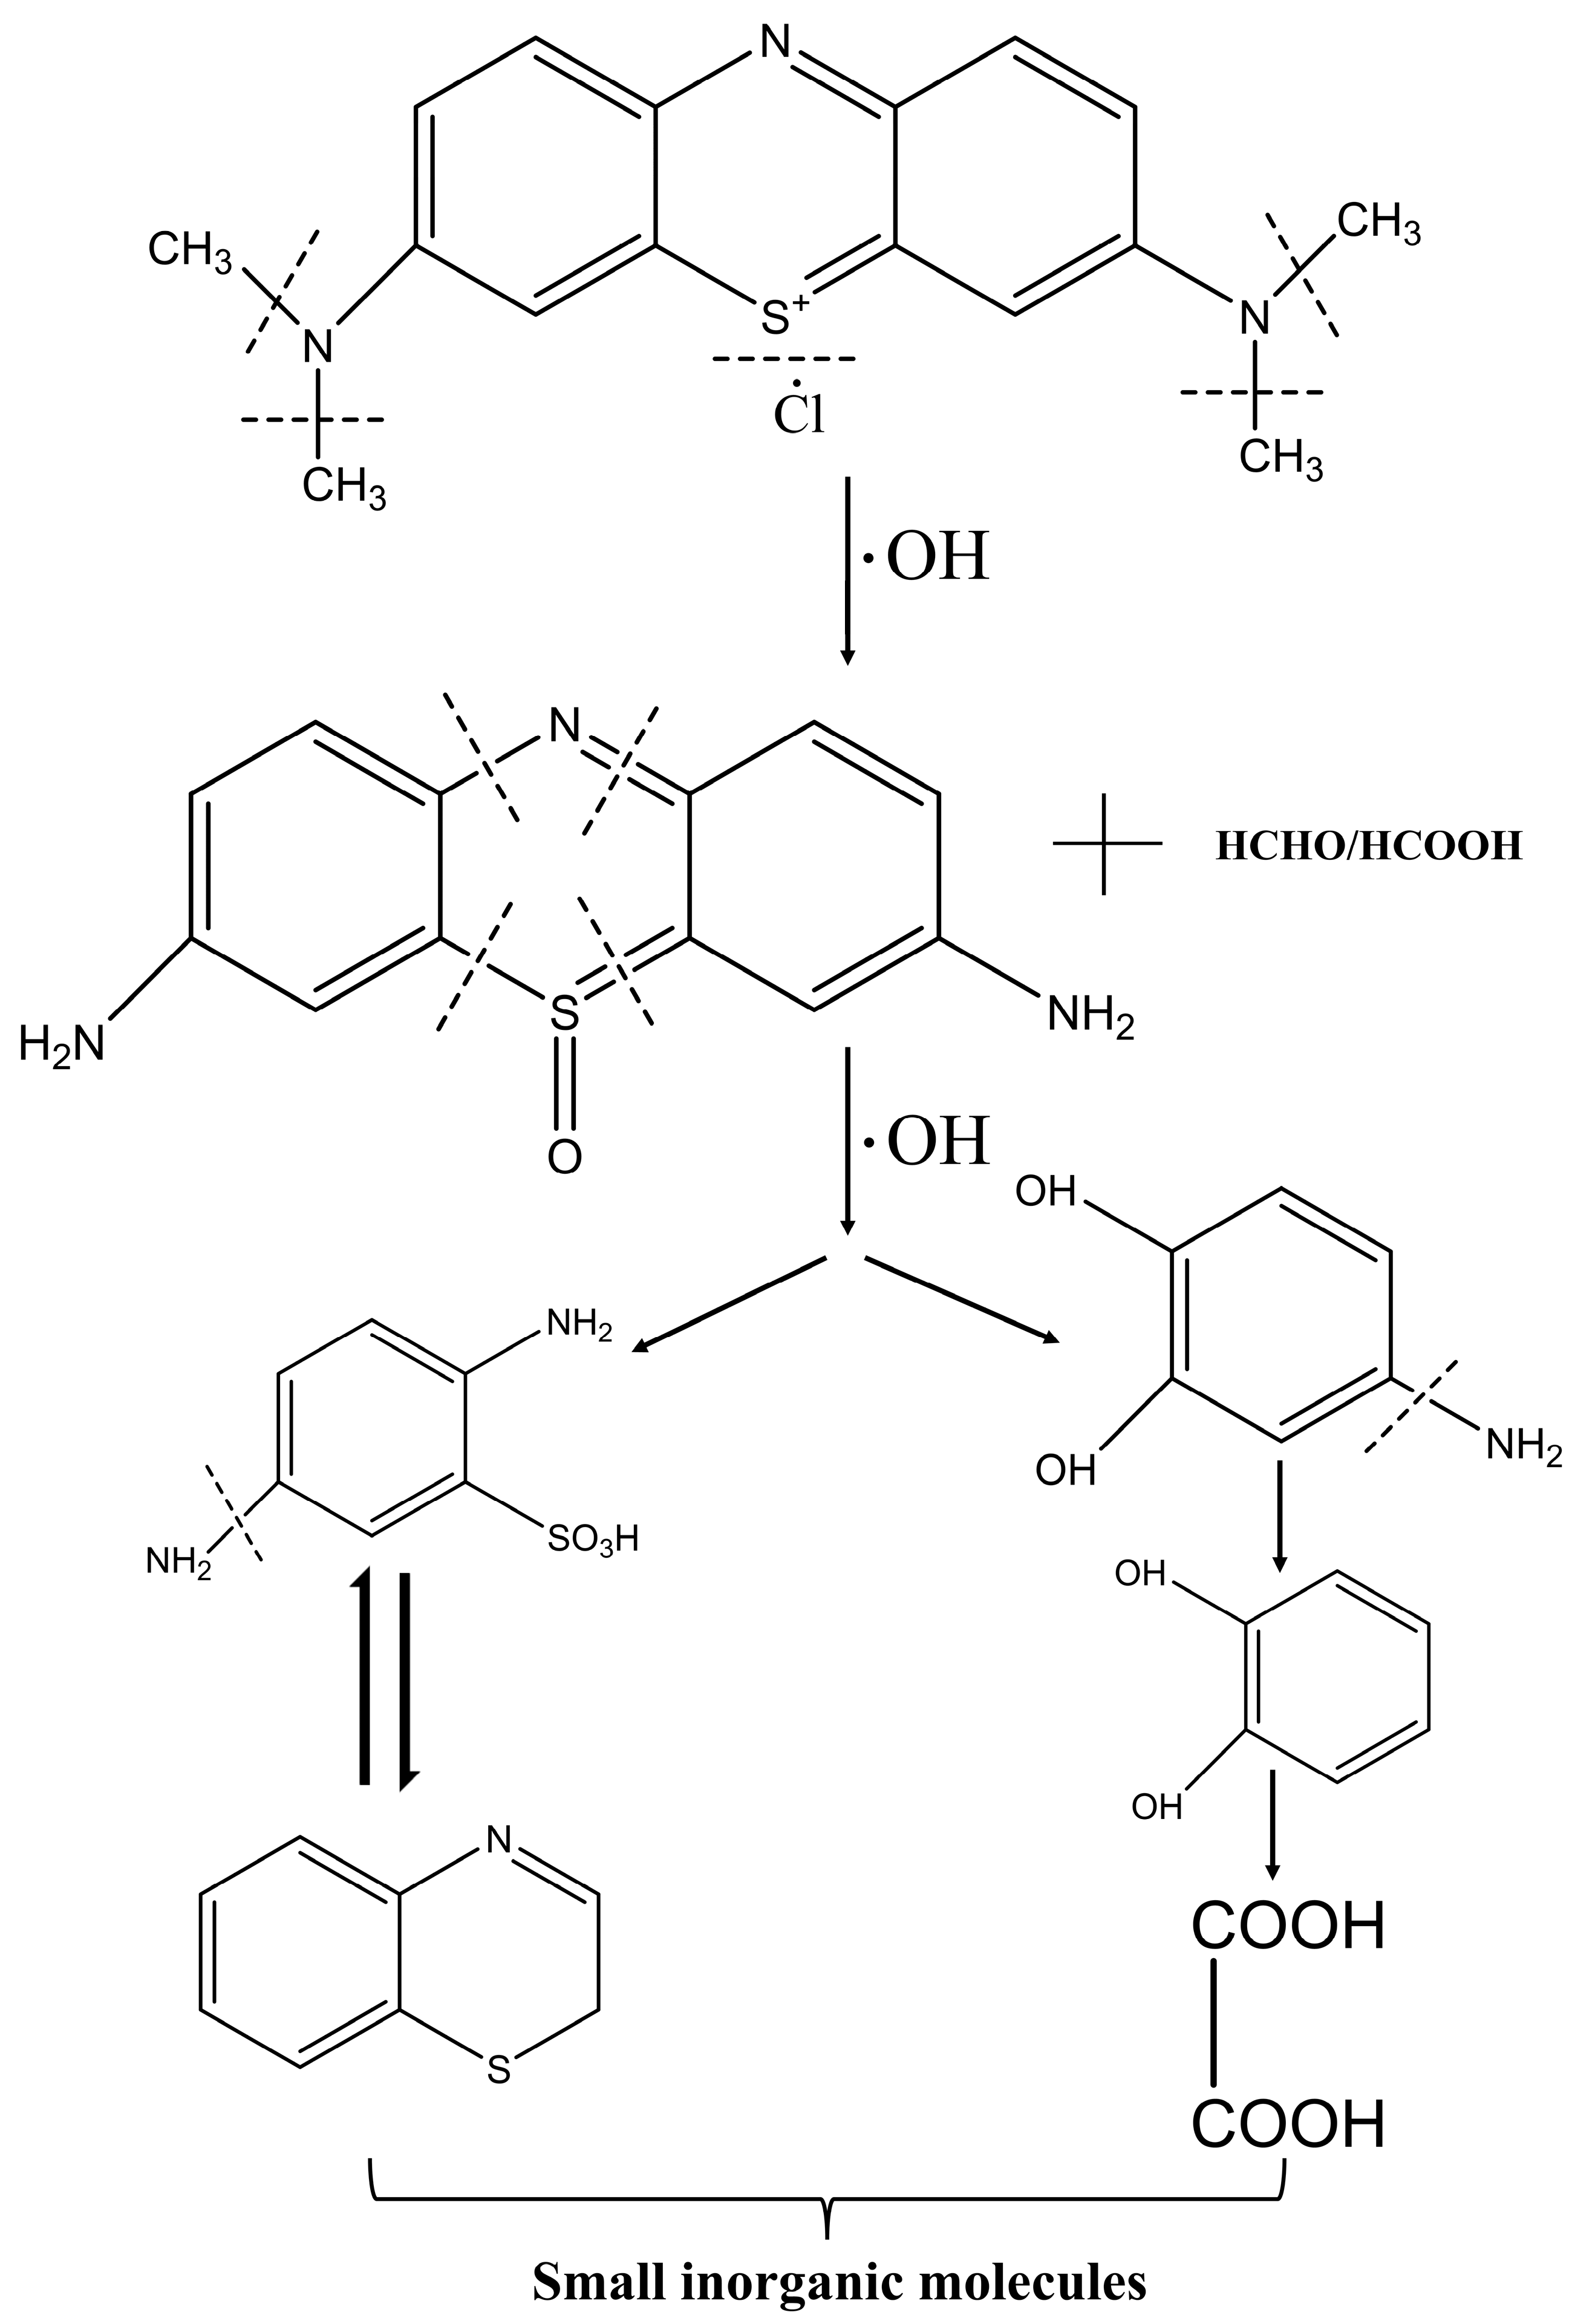
3.3. Degradation Mechanism

The ANFs/FeC2O4 and H2O2 is a heterogeneous Fenton system. During the degradation process, the active sites on the surface of ANFs/FeC2O4 can effectively excite hydroxyl radicals, as shown in Equation (1), and the hydroxyl radicals can effectively degrade methylene blue molecules. During the excitation of hydroxyl radicals by ferrous oxalate, Fe2+ is oxidized to form Fe3+, and, at the same time, C2O42− can reduce the formed Fe3+ again and reactivate the active sites on the catalyst surface that were deactivated due to the excitation of hydroxyl radicals. Thus, methylene blue molecules are degraded into small molecules by the attack of hydroxyl radicals (Figure 9). During the dissolution of methylene blue molecules, Cl is ionized and exists in a dissociated state. As shown in Figure 10, the N-CH3 bond in the methylene blue molecule is preferentially broken by the attack of •OH, then the methyl groups are oxidized to formaldehyde and formic acid. The hydroxyl groups continue to attack the C-S and C-N bonds to produce unstable organic matter, and the MB is eventually degraded into small molecules [64,65,66]. The above heterogeneous Fenton degradation process shows the ANFs/FeC2O4 composite membrane catalyst with excellent MB degradation performance, reusability, and catalytic stability. The above results (Figure 6) show that the ANFs/FeC2O4 have an excellent ability to degrade methylene blue compared with the pure ANFs and FeC2O4. The ANFs can effectively provide a loading area for ferrous oxalate to prevent the agglomeration of ferrous oxalate, resulting in more active sites being exposed. Thus, the MB degradation performance of heterogeneous Fenton ANFs/FeC2O4 was improved.

4. Conclusions

In summary, we demonstrated that the FeC2O4 could be decorated on the ANFs successfully due to the microfibers of ANFs, with excellent methylene blue degradation performance. The •OH can be effectively excited from H2O2 by the active site of ANFs/FeC2O4 composite membrane catalyst to degrade MB under suitable conditions. The ANFs/FeC2O4 composite membrane catalyst provides better MB degradation performance compared with the pure FeC2O4. More importantly, the ANFs/FeC2O4 composite membrane catalyst could be simply separated from methylene blue solution without precipitation and filtration, compared with the powder ferrous oxalate, reducing tedious and time-consuming separation processes. The ANFs/FeC2O4(20/80) composite catalyst membrane with 100 ppm H2O2 at pH = 3 degrade 10 ppm MB was the optimal degradation condition which was explored through a series of degradation experiments. The composite catalysts with excellent degradation methylene blue performance were proven, indicating the composite catalysts can be used in methylene blue wastewater treatment. The preparation of ANFs has achieved industrial production and the composite membrane was obtained by simple chemical precipitation and vacuum filtration method. Simultaneously, the main component of the catalyst is ferrous oxalate, which is synthesized from low-valent ferrous sulfate and potassium oxalate at room temperature without any special experimental equipment at a low cost. Thus, these results show the composite catalyst has significant potential in practical methylene blue wastewater treatment and industrial production is expected.

Author Contributions

Conceptualization, L.F. and Z.H.; Data curation, S.C.; Funding acquisition, H.W.; Investigation, L.D. and M.L.; Methodology, X.Z.; Project administration, S.Y.; Resources, S.C.; Software, L.F.; Supervision, S.Y.; Visualization, L.W.; Writing—original draft, L.F.; Writing—review & editing, Z.H. All authors have read and agreed to the published version of the manuscript.

Funding

This research was funded by the National Basic Research Program of China (2011CB606102).

Institutional Review Board Statement

Not applicable.

Informed Consent Statement

Not applicable.

Data Availability Statement

The data presented in this study are available in this study.

Conflicts of Interest

The authors declare no conflict of interest.

References

  1. Tsai, W.T.; Hsu, H.C.; Su, T.Y.; Lin, K.Y.; Lin, C.M. Removal of basic dye (methylene blue) from wastewaters utilizing beer brewery waste. J. Hazard Mater. 2008, 154, 73–78. [Google Scholar] [CrossRef] [PubMed]
  2. Garg, V. Basic dye (methylene blue) removal from simulated wastewater by adsorption using Indian Rosewood sawdust: A timber industry waste. Dye. Pigment. 2004, 63, 243–250. [Google Scholar] [CrossRef]
  3. Hosseinpour-mashkani, S.M.; Sobhani-Nasab, A. Simple synthesis and characterization of copper tungstate nanoparticles: Investigation of surfactant effect and its photocatalyst application. J. Mater. Sci. Mater. Electron. 2016, 27, 7548–7553. [Google Scholar] [CrossRef]
  4. Aghajani, Z.; Hosseinpour-Mashkani, S.M. Design novel Ce(MoO4)2@TiO2n–n heterostructures: Enhancement photodegradation of toxic dyes. J. Mater. Sci. Mater. Electron. 2020, 31, 6593–6606. [Google Scholar] [CrossRef]
  5. Meili, L.; Lins, P.V.S.; Costa, M.T.; Almeida, R.L.; Abud, A.K.S.; Soletti, J.I.; Dotto, G.L.; Tanabe, E.H.; Sellaoui, L.; Carvalho, S.H.V.; et al. Adsorption of methylene blue on agroindustrial wastes: Experimental investigation and phenomenological modelling. Prog. Biophys. Mol. Biol. 2019, 141, 60–71. [Google Scholar] [CrossRef] [PubMed]
  6. Ma, L.M.; Ding, Z.G.; Gao, T.Y.; Zhou, R.F.; Xu, W.Y.; Liu, J. Discoloration of methylene blue and wastewater from a plant by a Fe/Cu bimetallic system. Chemosphere 2004, 55, 1207–1212. [Google Scholar] [CrossRef]
  7. Rodrigues, C.S.; Madeira, L.M.; Boaventura, R.A. Treatment of textile dye wastewaters using ferrous sulphate in a chemical coagulation/flocculation process. Environ. Technol. 2013, 34, 719–729. [Google Scholar] [CrossRef]
  8. Bashir, M.S.; Jiang, X.; Kong, X.Z. Porous polyurea microspheres with Pd immobilized on surface and their catalytic activity in 4-nitrophenol reduction and organic dyes degradation. Eur. Polym. J. 2020, 129, 109652. [Google Scholar] [CrossRef]
  9. Tichapondwa, S.M.; Newman, J.P.; Kubheka, O. Effect of TiO2 phase on the photocatalytic degradation of methylene blue dye. Phys. Chem. Earth Parts A/B/C 2020, 118–119, 102900. [Google Scholar] [CrossRef]
  10. Aziz, K.H.H. Application of different advanced oxidation processes for the removal of chloroacetic acids using a planar falling film reactor. Chemosphere 2019, 228, 377–383. [Google Scholar] [CrossRef]
  11. Hien, N.T.; Lan, H.N.; Van, H.T.; Nguyen, T.D.; Aziz, K. Heterogeneous catalyst ozonation of Direct Black 22 from aqueous solution in the presence of metal slags originating from industrial solid wastes. Sep. Purif. Technol. 2019, 233, 115961. [Google Scholar] [CrossRef]
  12. Hu, X.; Liu, B.; Deng, Y.; Chen, H.; Luo, S.; Sun, C.; Yang, P.; Yang, S. Adsorption and heterogeneous Fenton degradation of 17α-methyltestosterone on nano Fe3O4/MWCNTs in aqueous solution. Appl. Catal. B Environ. 2011, 107, 274–283. [Google Scholar] [CrossRef]
  13. Ferroudj, N.; Nzimoto, J.; Davidson, A.; Talbot, D.; Briot, E.; Dupuis, V.; Bée, A.; Medjram, M.S.; Abramson, S. Maghemite nanoparticles and maghemite/silica nanocomposite microspheres as magnetic Fenton catalysts for the removal of water pollutants. Appl. Catal. B Environ. 2013, 136, 9–18. [Google Scholar] [CrossRef]
  14. Segura, Y.; Martínez, F.; Melero, J.A. Effective pharmaceutical wastewater degradation by Fenton oxidation with zero-valent iron. Appl. Catal. B Environ. 2013, 136, 64–69. [Google Scholar] [CrossRef]
  15. Alalm, M.G.; Tawfik, A.; Ookawara, S. Degradation of four pharmaceuticals by solar photo-Fenton process: Kinetics and costs estimation. J. Environ. Chem. Eng. 2015, 3, 46–51. [Google Scholar] [CrossRef]
  16. Liu, M.; Yu, Y.; Xiong, S.; Lin, P.; Hu, L.; Chen, S.; Wang, H.; Wang, L. A flexible and efficient electro-Fenton cathode film with aeration function based on polyphenylene sulfide ultra-fine fiber. React. Funct. Polym. 2019, 139, 42–49. [Google Scholar] [CrossRef]
  17. Huston, P.L.; Pignatello, J.J. Degradation of selected pesticide active ingredients and commercial formulations in water by the photo-assisted Fenton reaction. Water Res. 1999, 33, 1238–1246. [Google Scholar] [CrossRef]
  18. Ma, J.; Song, W.; Chen, C.; Ma, W.; Zhao, J.; Tang, Y. Fenton Degradation of Organic Compounds Promoted by Dyes under Visible Irradiation. Environ. Sci. Technol. 2005, 39, 5810. [Google Scholar] [CrossRef]
  19. Evgenidou, E.; Konstantinou, I.; Fytianos, K.; Poulios, I. Oxidation of two organophosphorous insecticides by the photo-assisted Fenton reaction. Water Res. 2007, 41, 2015–2027. [Google Scholar] [CrossRef]
  20. Monteagudo, J.M.; Durán, A.; López-Almodóvar, C. Homogeneus ferrioxalate-assisted solar photo-Fenton degradation of Orange II aqueous solutions. Appl. Catal. B Environ. 2008, 83, 46–55. [Google Scholar] [CrossRef]
  21. Liu, Y.; Jin, W.; Zhao, Y.; Zhang, G.; Zhang, W. Enhanced catalytic degradation of methylene blue by α-Fe2O3/graphene oxide via heterogeneous photo-Fenton reactions. Appl. Catal. B Environ. 2017, 206, 642–652. [Google Scholar] [CrossRef]
  22. Cao, Z.-F.; Wen, X.; Chen, P.; Yang, F.; Ou, X.-L.; Wang, S.; Zhong, H. Synthesis of a novel heterogeneous fenton catalyst and promote the degradation of methylene blue by fast regeneration of Fe2+. Colloids Surf. A Physicochem. Eng. Asp. 2018, 549, 94–104. [Google Scholar] [CrossRef]
  23. Ren, B.; Xu, Y.; Zhang, C.; Zhang, L.; Zhao, J.; Liu, Z. Degradation of methylene blue by a heterogeneous Fenton reaction using an octahedron-like, high-graphitization, carbon-doped Fe2O3 catalyst. J. Taiwan Inst. Chem. Eng. 2019, 97, 170–177. [Google Scholar] [CrossRef]
  24. Georgi, A.; Schierz, A.; Trommler, U.; Horwitz, C.P.; Collins, T.J.; Kopinke, F.D. Humic acid modified Fenton reagent for enhancement of the working pH range. Appl. Catal. B Environ. 2007, 72, 26–36. [Google Scholar] [CrossRef]
  25. Tartaj, P.; Morales, M.P.; Gonzalez-Carreno, T.; Veintemillas-Verdaguer, S.; Serna, C.J. The iron oxides strike back: From biomedical applications to energy storage devices and photoelectrochemical water splitting. Adv. Mater. 2011, 23, 5243–5249. [Google Scholar] [CrossRef]
  26. Yang, B.; Tian, Z.; Zhang, L.; Guo, Y.; Yan, S. Enhanced heterogeneous Fenton degradation of Methylene Blue by nanoscale zero valent iron (nZVI) assembled on magnetic Fe3O4/reduced graphene oxide. J. Water Process Eng. 2015, 5, 101–111. [Google Scholar] [CrossRef]
  27. Sierra, C.A.; Ramirez, H.R.Z. Heterogeneous Fenton oxidation of Orange II using iron nanoparticles supported on natural and functionalized fique fiber. J. Environ. Chem. Eng. 2018, 6, 4178–4188. [Google Scholar] [CrossRef]
  28. Su, C.; Cao, G.; Lou, S.; Wang, R.; Yuan, F.; Yang, L.; Wang, Q. Treatment of Cutting Fluid Waste using Activated Carbon Fiber Supported Nanometer Iron as a Heterogeneous Fenton Catalyst. Sci. Rep. 2018, 8, 10650. [Google Scholar] [CrossRef]
  29. Sun, M.; Zou, L.; Wang, P.; Fan, X.; Pan, Z.; Liu, Y.; Song, C. Nano valent zero iron (NZVI) immobilized CNTs hollow fiber membrane for flow-through heterogeneous Fenton process. J. Environ. Chem. Eng. 2022, 10, 107806. [Google Scholar] [CrossRef]
  30. Tang, R.; Liao, X.P.; Liu, X.; Shi, B. Collagen fiber immobilized Fe(III): A novel catalyst for photo-assisted degradation of dyes. Chem. Commun. 2005, 47, 5882–5884. [Google Scholar] [CrossRef]
  31. Wang, P.; Dong, Y.; Li, B.; Cui, G.; Li, F. Controlled photocatalytic activity of modified PTFE fiber-Fe complex through layer-by-layer self-assembly of poly diallyldimethyl ammonium choloride and poly styrene sulfonate. Colloids Surf. A Physicochem. Eng. Asp. 2017, 528, 41–47. [Google Scholar] [CrossRef]
  32. Wang, Q.; Liang, S.; Zhang, G.; Su, R.; Yang, C.; Xu, P.; Wang, P. Facile and rapid microwave-assisted preparation of Cu/Fe-AO-PAN fiber for PNP degradation in a photo-Fenton system under visible light irradiation. Sep. Purif. Technol. 2019, 209, 270–278. [Google Scholar] [CrossRef]
  33. Li, B.; Dong, Y.; Li, L. Preparation and catalytic performance of Fe(III)-citric acid-modified cotton fiber complex as a novel cellulose fiber-supported heterogeneous photo-Fenton catalyst. Cellulose 2015, 22, 1295–1309. [Google Scholar] [CrossRef]
  34. Hu, L.; Liu, Z.; He, C.; Wang, P.; Chen, S.; Xu, J.; Wu, J.; Wang, L.; Wang, H. Ferrous-oxalate-decorated polyphenylene sulfide fenton catalytic microfiber for methylene blue degradation. Compos. Part B Eng. 2019, 176, 107220. [Google Scholar] [CrossRef]
  35. Liu, X.; Tang, R.; He, Q.; Liao, X.; Shi, B. Fe(III)-loaded collagen fiber as a heterogeneous catalyst for the photo-assisted decomposition of Malachite Green. J. Hazard Mater. 2010, 174, 687–693. [Google Scholar] [CrossRef] [PubMed]
  36. Wang, L.; Yao, Y.; Zhang, Z.; Sun, L.; Lu, W.; Chen, W.; Chen, H. Activated carbon fibers as an excellent partner of Fenton catalyst for dyes decolorization by combination of adsorption and oxidation. Chem. Eng. J. 2014, 251, 348–354. [Google Scholar] [CrossRef]
  37. Yang, B.; Wang, L.; Zhang, M.; Luo, J.; Lu, Z.; Ding, X. Fabrication, Applications, and Prospects of Aramid Nanofiber. Adv. Funct. Mater. 2020, 30, 2000186. [Google Scholar] [CrossRef]
  38. Hu, P.; Lyu, J.; Fu, C.; Gong, W.B.; Liao, J.; Lu, W.; Chen, Y.; Zhang, X. Multifunctional Aramid Nanofiber/Carbon Nanotube Hybrid Aerogel Films. ACS Nano 2020, 14, 688–697. [Google Scholar] [CrossRef]
  39. Xie, C.; He, L.; Shi, Y.; Guo, Z.X.; Qiu, T.; Tuo, X. From Monomers to a Lasagna-like Aerogel Monolith: An Assembling Strategy for Aramid Nanofibers. ACS Nano 2019, 13, 7811–7824. [Google Scholar] [CrossRef]
  40. Xie, C.; Liu, S.; Zhang, Q.; Ma, H.; Yang, S.; Guo, Z.X.; Qiu, T.; Tuo, X. Macroscopic-Scale Preparation of Aramid Nanofiber Aerogel by Modified Freezing-Drying Method. ACS Nano 2021, 15, 10000–10009. [Google Scholar] [CrossRef]
  41. Yan, H.; Li, J.; Tian, W.; He, L.; Tuo, X.; Qiu, T. A new approach to the preparation of poly(p-phenylene terephthalamide) nanofibers. RSC Adv. 2016, 6, 26599–26605. [Google Scholar] [CrossRef]
  42. Bashir, M.S.; Jiang, X.; Li, S.; Kong, X.Z. Highly Uniform and Porous Polyurea Microspheres: Clean and Easy Preparation by Interface Polymerization, Palladium Incorporation, and High Catalytic Performance for Dye Degradation. Front. Chem. 2019, 7, 314. [Google Scholar] [CrossRef] [PubMed]
  43. Xie, C.; Guo, Z.X.; Qiu, T.; Tuo, X. Construction of Aramid Engineering Materials via Polymerization-Induced para-Aramid Nanofiber Hydrogel. Adv. Mater. 2021, 33, 2101280. [Google Scholar] [CrossRef] [PubMed]
  44. Xu, K.; Ou, Y.; Li, Y.; Su, L.; Lin, M.; Li, Y.; Cui, J.; Liu, D. Preparation of robust aramid composite papers exhibiting water resistance by partial dissolution/regeneration welding. Mater. Des. 2020, 187, 108404. [Google Scholar] [CrossRef]
  45. Moye, V.; Rane, K.S.; Dalal, V. Optimization of synthesis of nickel-zinc-ferrite from oxalates and oxalato hydrazinate precursors. J. Mater. Sci. Mater. Electron. 1990, 1, 212–218. [Google Scholar] [CrossRef]
  46. Zhang, L.; Hao, X.; Jian, Q.; Jin, Z. Ferrous oxalate dehydrate over CdS as Z-scheme photocatalytic hydrogen evolution. J. Solid State Chem. 2019, 274, 286–294. [Google Scholar] [CrossRef]
  47. Zhou, W.; Tang, K.; Zeng, S.; Qi, Y. Room temperature synthesis of rod-like FeC2O4·2H2O and its transition to maghemite, magnetite and hematite nanorods through controlled thermal decomposition. Nanotechnology 2008, 19, 065602. [Google Scholar] [CrossRef]
  48. Songfeng, E.; Ma, Q.; Ning, D.; Huang, J.; Jin, Z.; Lu, Z. Bio-inspired covalent crosslink of aramid nanofibers film for improved mechanical performances. Compos. Sci. Technol. 2021, 201, 108514. [Google Scholar] [CrossRef]
  49. Rao, Y.; Waddon, A.J.; Farris, R.J. The evolution of structure and properties in poly(p-phenylene terephthalamide) fibers. Polymer 2001, 42, 5925–5935. [Google Scholar] [CrossRef]
  50. Yao, J.; Wang, C. Decolorization of Methylene Blue withTiO2Sol via UV Irradiation Photocatalytic Degradation. Int. J. Photoenergy 2010, 2010, 643182. [Google Scholar] [CrossRef] [Green Version]
  51. Li, M.; Qiang, Z.; Pulgarin, C.; Kiwi, J. Accelerated methylene blue (MB) degradation by Fenton reagent exposed to UV or VUV/UV light in an innovative micro photo-reactor. Appl. Catal. B Environ. 2016, 187, 83–89. [Google Scholar] [CrossRef]
  52. Kavitha, V.; Palanivelu, K. The role of ferrous ion in Fenton and photo-Fenton processes for the degradation of phenol. Chemosphere 2004, 55, 1235–1243. [Google Scholar] [CrossRef]
  53. Jain, B.; Singh, A.K.; Kim, H.; Lichtfouse, E.; Sharma, V.K. Treatment of organic pollutants by homogeneous and heterogeneous Fenton reaction processes. Environ. Chem. Lett. 2018, 16, 947–967. [Google Scholar] [CrossRef]
  54. Verma, M.; Haritash, A.K. Degradation of amoxicillin by Fenton and Fenton-integrated hybrid oxidation processes. J. Environ. Chem. Eng. 2019, 7, 102886. [Google Scholar] [CrossRef]
  55. Keenan, C.R.; Sedlak, D.L. Factors affecting the yield of oxidants from the reaction of nanoparticulate zero-valent iron and oxygen. Environ. Sci. Technol. 2008, 42, 5377–5378. [Google Scholar] [CrossRef]
  56. Kim, S.M.; Geissen, S.U.; Vogelpohl, A. Landfill leachate treatment by a photoassisted fenton reaction. Water Sci. Technol. 1997, 35, 239–248. [Google Scholar] [CrossRef]
  57. Kwon, B.G.; Dong, S.L.; Kang, N.; Yoon, J. Characteristics of p-Chlorophenol Oxidation by Fenton’s Reagent. Water Res. 1999, 33, 2110–2118. [Google Scholar] [CrossRef]
  58. Nasser, J.; Steinke, K.; Zhang, L.; Sodano, H. Enhanced interfacial strength of hierarchical fiberglass composites through an aramid nanofiber interphase. Compos. Sci. Technol. 2020, 192, 1022886. [Google Scholar] [CrossRef]
  59. Park, B.; Lee, W.; Lee, E.; Min, S.H.; Kim, B.S. Highly tunable interfacial adhesion of glass fiber by hybrid multilayers of graphene oxide and aramid nanofiber. ACS Appl. Mater. Interfaces 2015, 7, 3329–3334. [Google Scholar] [CrossRef]
  60. Yang, M.; Cao, K.; Sui, L.; Qi, Y.; Zhu, J.; Waas, A.; Arruda, E.M.; Kieffer, J.; Thouless, M.; Kotov, N.A. Dispersions of Aramid Nanofibers: A New Nanoscale Building Block. Acs Nano 2011, 5, 6945–6954. [Google Scholar] [CrossRef] [Green Version]
  61. Saleh, M.; Bilici, Z.; Kaya, M.; Yalvac, M.; Arslan, H.; Yatmaz, H.C.; Dizge, N. The use of basalt powder as a natural heterogeneous catalyst in the Fenton and Photo-Fenton oxidation of cationic dyes. Adv. Powder Technol. 2021, 32, 1264–1275. [Google Scholar] [CrossRef]
  62. Mohapatra, L.; Parida, K.M. Zn–Cr layered double hydroxide: Visible light responsive photocatalyst for photocatalytic degradation of organic pollutants. Sep. Purif. Technol. 2012, 91, 73–80. [Google Scholar] [CrossRef]
  63. Fu, H.; Pan, C.; Yao, W.; Zhu, Y. Visible-light-induced degradation of rhodamine B by nanosized Bi2WO. J. Phys. Chem. B 2005, 109, 22432–22439. [Google Scholar] [CrossRef] [PubMed]
  64. Mondal, S.; Reyes, M.E.d.; Pal, U. Plasmon induced enhanced photocatalytic activity of gold loaded hydroxyapatite nanoparticles for methylene blue degradation under visible light. RSC Adv. 2017, 7, 8633–8645. [Google Scholar] [CrossRef]
  65. Chithambararaj, A.; Sanjini, N.S.; Bose, A.C.; Velmathi, S. Flower-like hierarchical h-MoO3: New findings of efficient visible light driven nano photocatalyst for methylene blue degradation. Catal. Sci. Technol. 2013, 3, 1405–1414. [Google Scholar] [CrossRef]
  66. Huang, F.; Chen, L.; Wang, H.; Yan, Z. Analysis of the degradation mechanism of methylene blue by atmospheric pressure dielectric barrier discharge plasma. Chem. Eng. J. 2010, 162, 250–256. [Google Scholar] [CrossRef]
Figure 1. A schematic illustration of the preparation of ANFs/FeC2O4 composite fiber catalyst membrane.
Polymers 14 03491 g001
Figure 2. (a) SEM images of pure ANFs; (b) the magnified SEM image of pure ANFs.
Polymers 14 03491 g002
Figure 3. (a) SEM images of ANFs membrane, EDS element mapping images of ANFs; (b) SEM images of ANFs/FeC2O4 membrane, EDS element mapping images of ANFs/FeC2O4 membrane.
Polymers 14 03491 g003
Figure 4. Pure ANFs and ANFs/FeC2O4 pore size distribution.
Polymers 14 03491 g004
Figure 5. (a) FTIR spectra of FeC2O4, ANFs, and ANFs/FeC2O4. (b) XRD spectra of FeC2O4, ANFs, and ANFs-FeC2O4.
Polymers 14 03491 g005
Figure 6. Effects of FeC2O4 content and H2O2 concentration on degradation performance.
Polymers 14 03491 g006
Figure 7. Influence of experimental conditions on degradation performance (FeC2O4 content = 80%, pH0 = 7, (MB) = 10 ppm, (H2O2) = 100 ppm, T = 20 °C): (a) initial pH; (b) MB concentration; (c) various dyes; (d) five periods of ANFs/FeC2O4 recycling.
Polymers 14 03491 g007
Figure 8. (a) The XPS survey spectral of the fresh and used-five-times composite catalyst; (b) spectra of Fe 2p; (c) pseudo-first-order kinetics of degradation of MB (FeC2O4 content was 80%, pH0 = 7, MB content was 10 ppm, H2O2 content was 100 ppm, T = 2 °C).
Polymers 14 03491 g008
Figure 9. The MB degradation process of composite Fenton catalyst film.
Polymers 14 03491 g009
Figure 10. Schematic diagram of the degradation mechanism of methylene blue.
Polymers 14 03491 g010
Publisher’s Note: MDPI stays neutral with regard to jurisdictional claims in published maps and institutional affiliations.

