
Research on Silicone Rubber Sheds of Decay-Like Fractured Composite Insulators Based on Hardness, Hydrophobicity, NMR, and FTIR

Abstract
:1. Introduction
2. Materials and Methods
2.1. Experimental Samples
2.2. Experiment Method
- Appearance inspection mainly checks whether the composite insulator has apparent defects, such as color differences, cracks, chalking, and other features. Appearance inspection is mainly to make a basic judgment on the deterioration of insulators;
- Contamination Degree: According to IEC 60507 [17] and IEC/TS 60815−1 [18], the equivalent salt deposit density (ESDD) and non-soluble deposit density (NSDD) of samples were measured through several steps, such as stirring and standing, pollution liquid conductivity test, filtration, drying, and weighing after pollution sampling;
- Hardness: LX−A shore hardness tester (Beijing Time−Top Technology Co., Ltd., Beijing, China) was employed to measure the sample hardness according to ISO 48−4 [19]. The pressure foot is perpendicular to the sample surface, and the pressing speed is not more than 3.2 mm/s. The spring test force should be maintained for 3 s before reading. For the same sample, measure 6 points from the high voltage end to the low voltage end in turn, and take the average value as the hardness value of the sample;
- Hydrophobicity: The spray method was employed according to IEC/TS 62073 and STRI Guide [20,21]. The test process is as follows: firstly, the kettle is used to spray water on the insulator surface, and then the hydrophobic classification (HC) level is determined by observing the surface water droplet state through visual observation;
- The static contact angle method can objectively and accurately measure the hydrophobic state of the material surface. Contact angle refers to the angle between the tangent at the junction of water droplets and sample surface. The static contact angle was measured using the SDC−100 Surface Energy Meter (Ningbo Pres Instrument Technology Co., Ltd., Zhejiang, China). The sessile drop method was employed to measure the static contact angles. The sample should be in a horizontal state when measuring, and then the 10 µL deionized water was dropped on the sample surface. The circular fitting method was used to take the average value of the static contact angles of the left and right ends of the water bead. The same sample was randomly selected 6 to 9 points, and the average arithmetic value was taken;
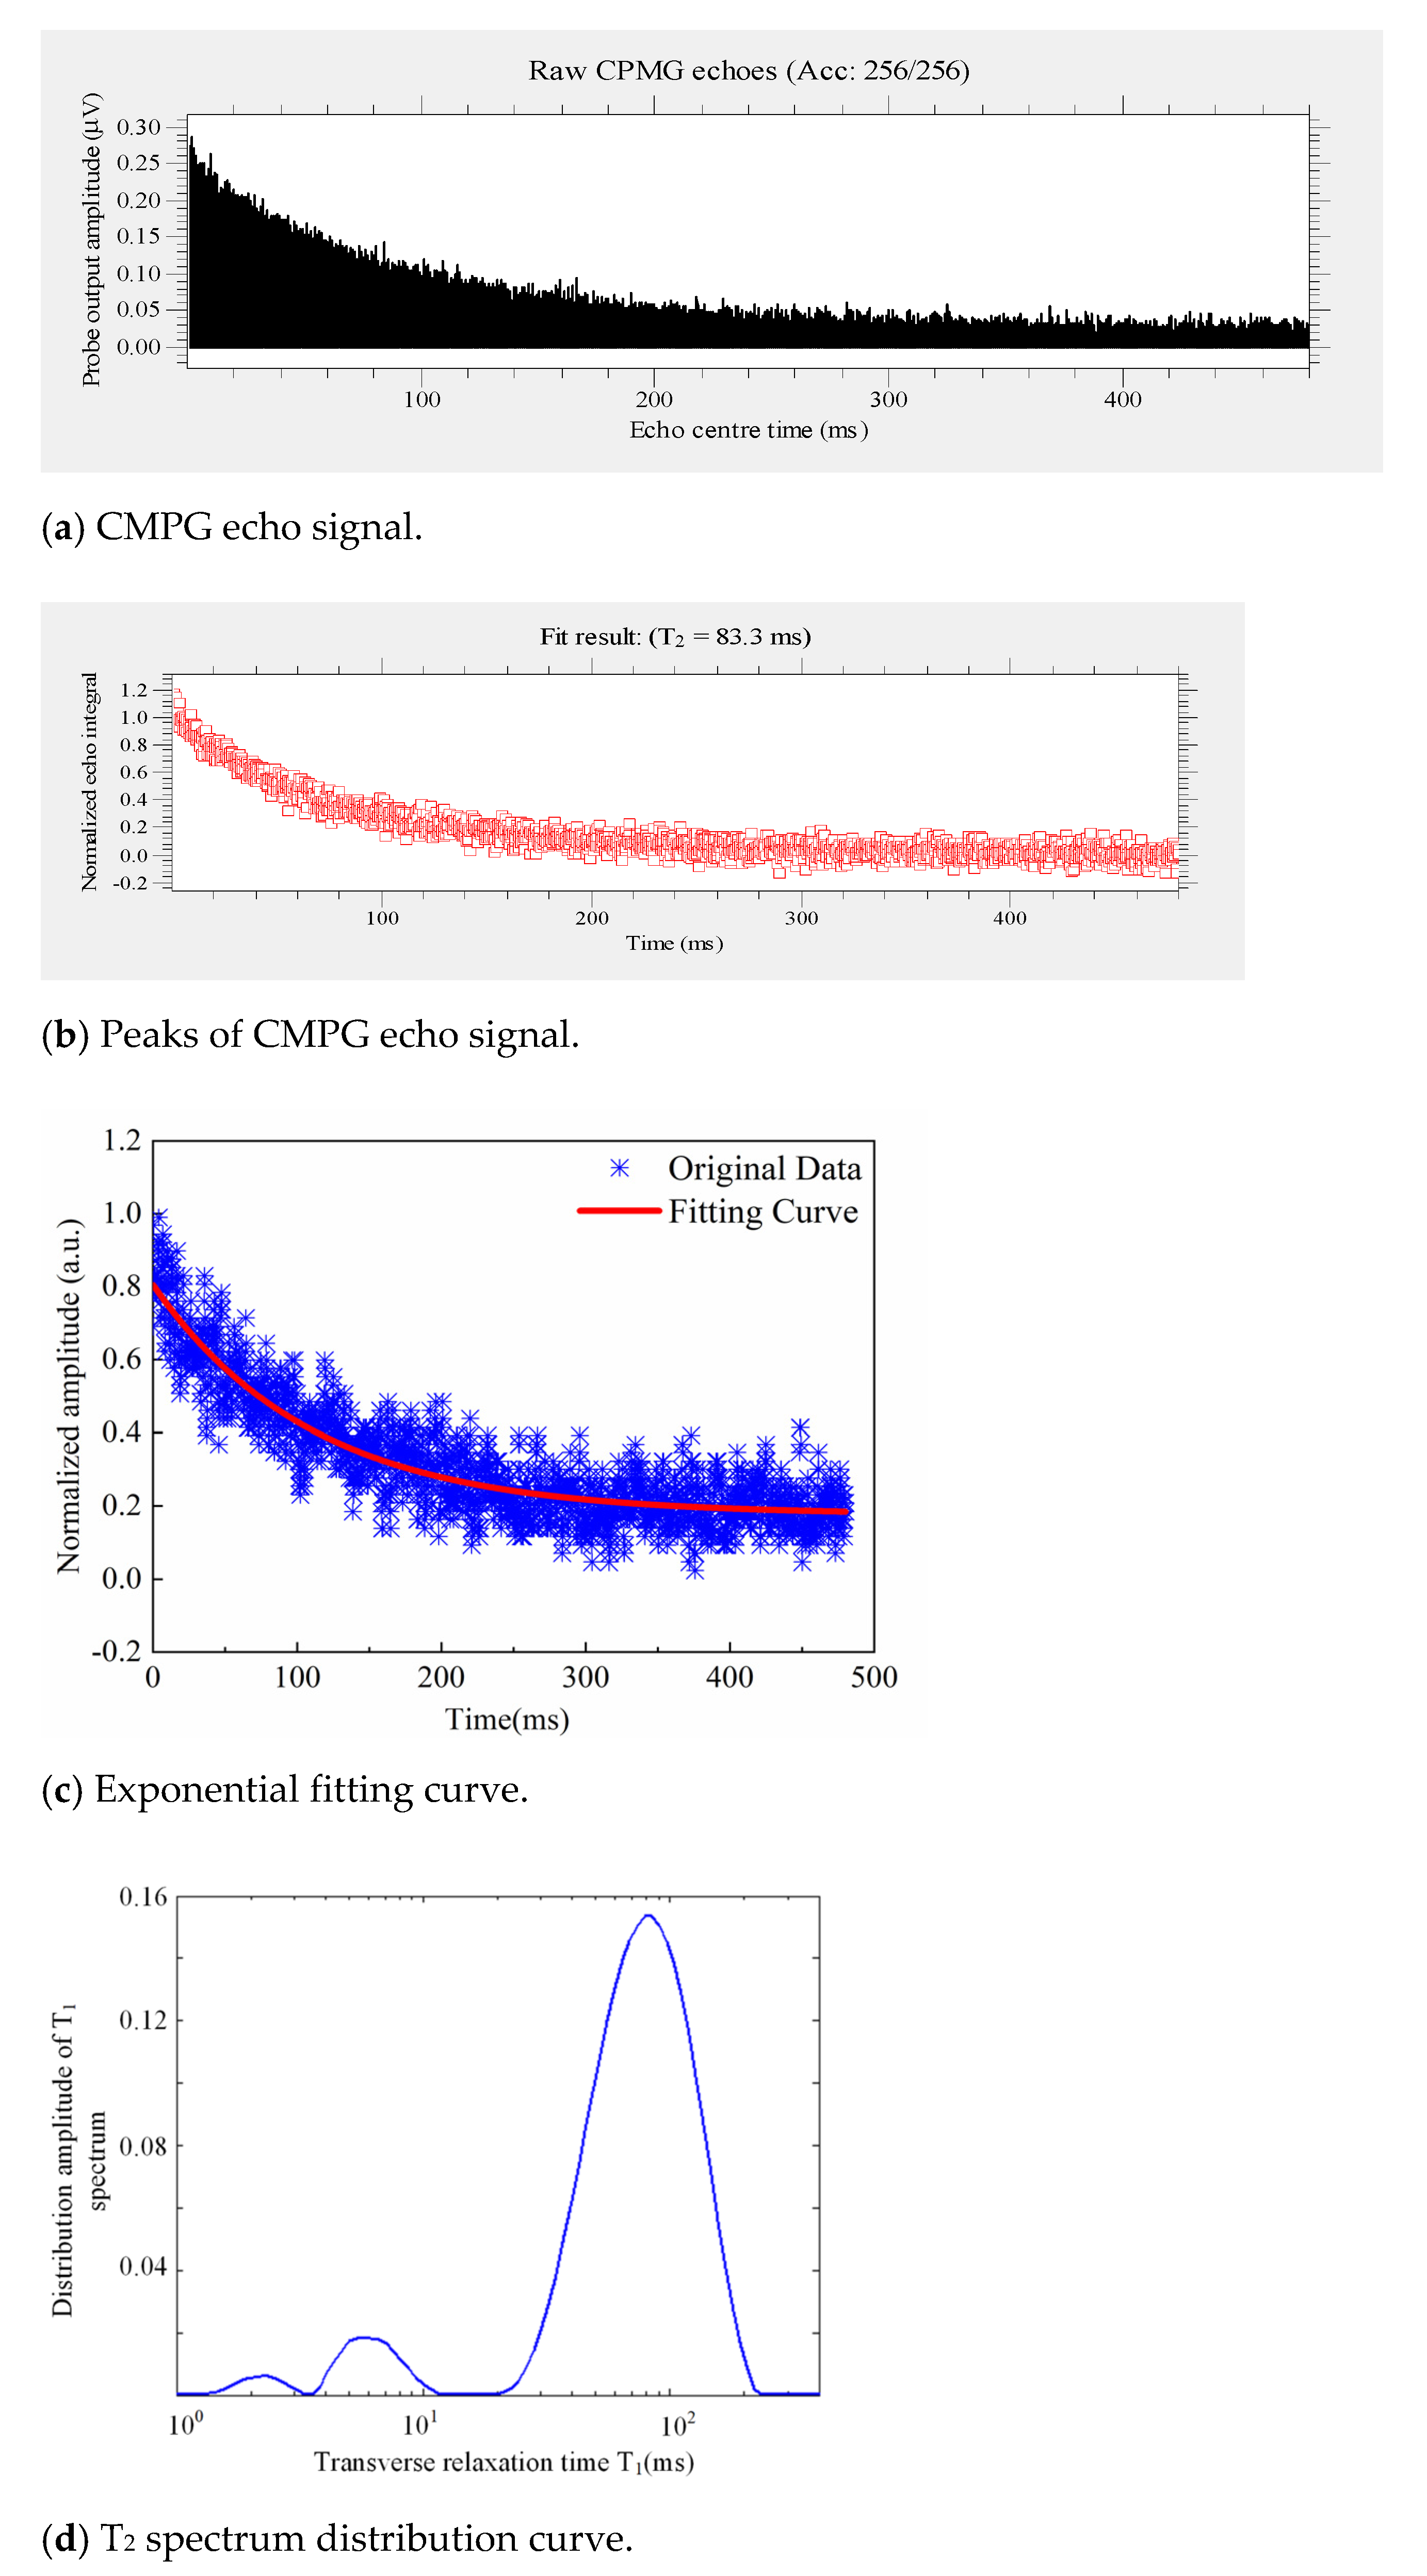
- Nuclear Magnetic Resonance (NMR): NMR means that under the external magnetic field, the nuclear magnetic moment of matter atom undergoes energy level splitting, and the absorbed energy undergoes energy level transition. NMR detects the physical and chemical properties of the material by applying a pulsed magnetic field to the material and measuring the pulse reflected wave signal [22]. The low field nuclear magnetic resonance measurement platform [23] was employed for the nuclear magnetic detection of samples. Experimental equipment mainly includes a Kea2 nuclear magnetic resonance spectrometer (Magritek, Wellington, New Zealand), a Radio Frequency power amplifier (BT00500 ALPHA-SA, Tomco, Stepney, Australia), a duplexer module, a computer, and a unilateral nuclear magnetic resonance sensor. The system parameters of the magnetic resonance analyzer were set up. For each sample, the CPMG pulse was continuously measured three times, and the transverse relaxation time T and peak area of each peak were retrieved [24,25];
- FTIR (Fourier transform infrared spectroscopy): Attenuated total reflection Fourier transform infrared spectroscopy (ATR FTIR) is a common surface structure analysis technology. To find the corresponding relationship between interferogram and spectrum, a Nicolet iS50 Fourier transform infrared spectrometer (Thermo Fisher Scientific Co., Ltd., Waltham, MA, USA) was used to measure the infrared spectrum of samples, and the wavenumber range was 400−4000 cm⁻1.
3. Results and Discussion
3.1. Physical Characteristics
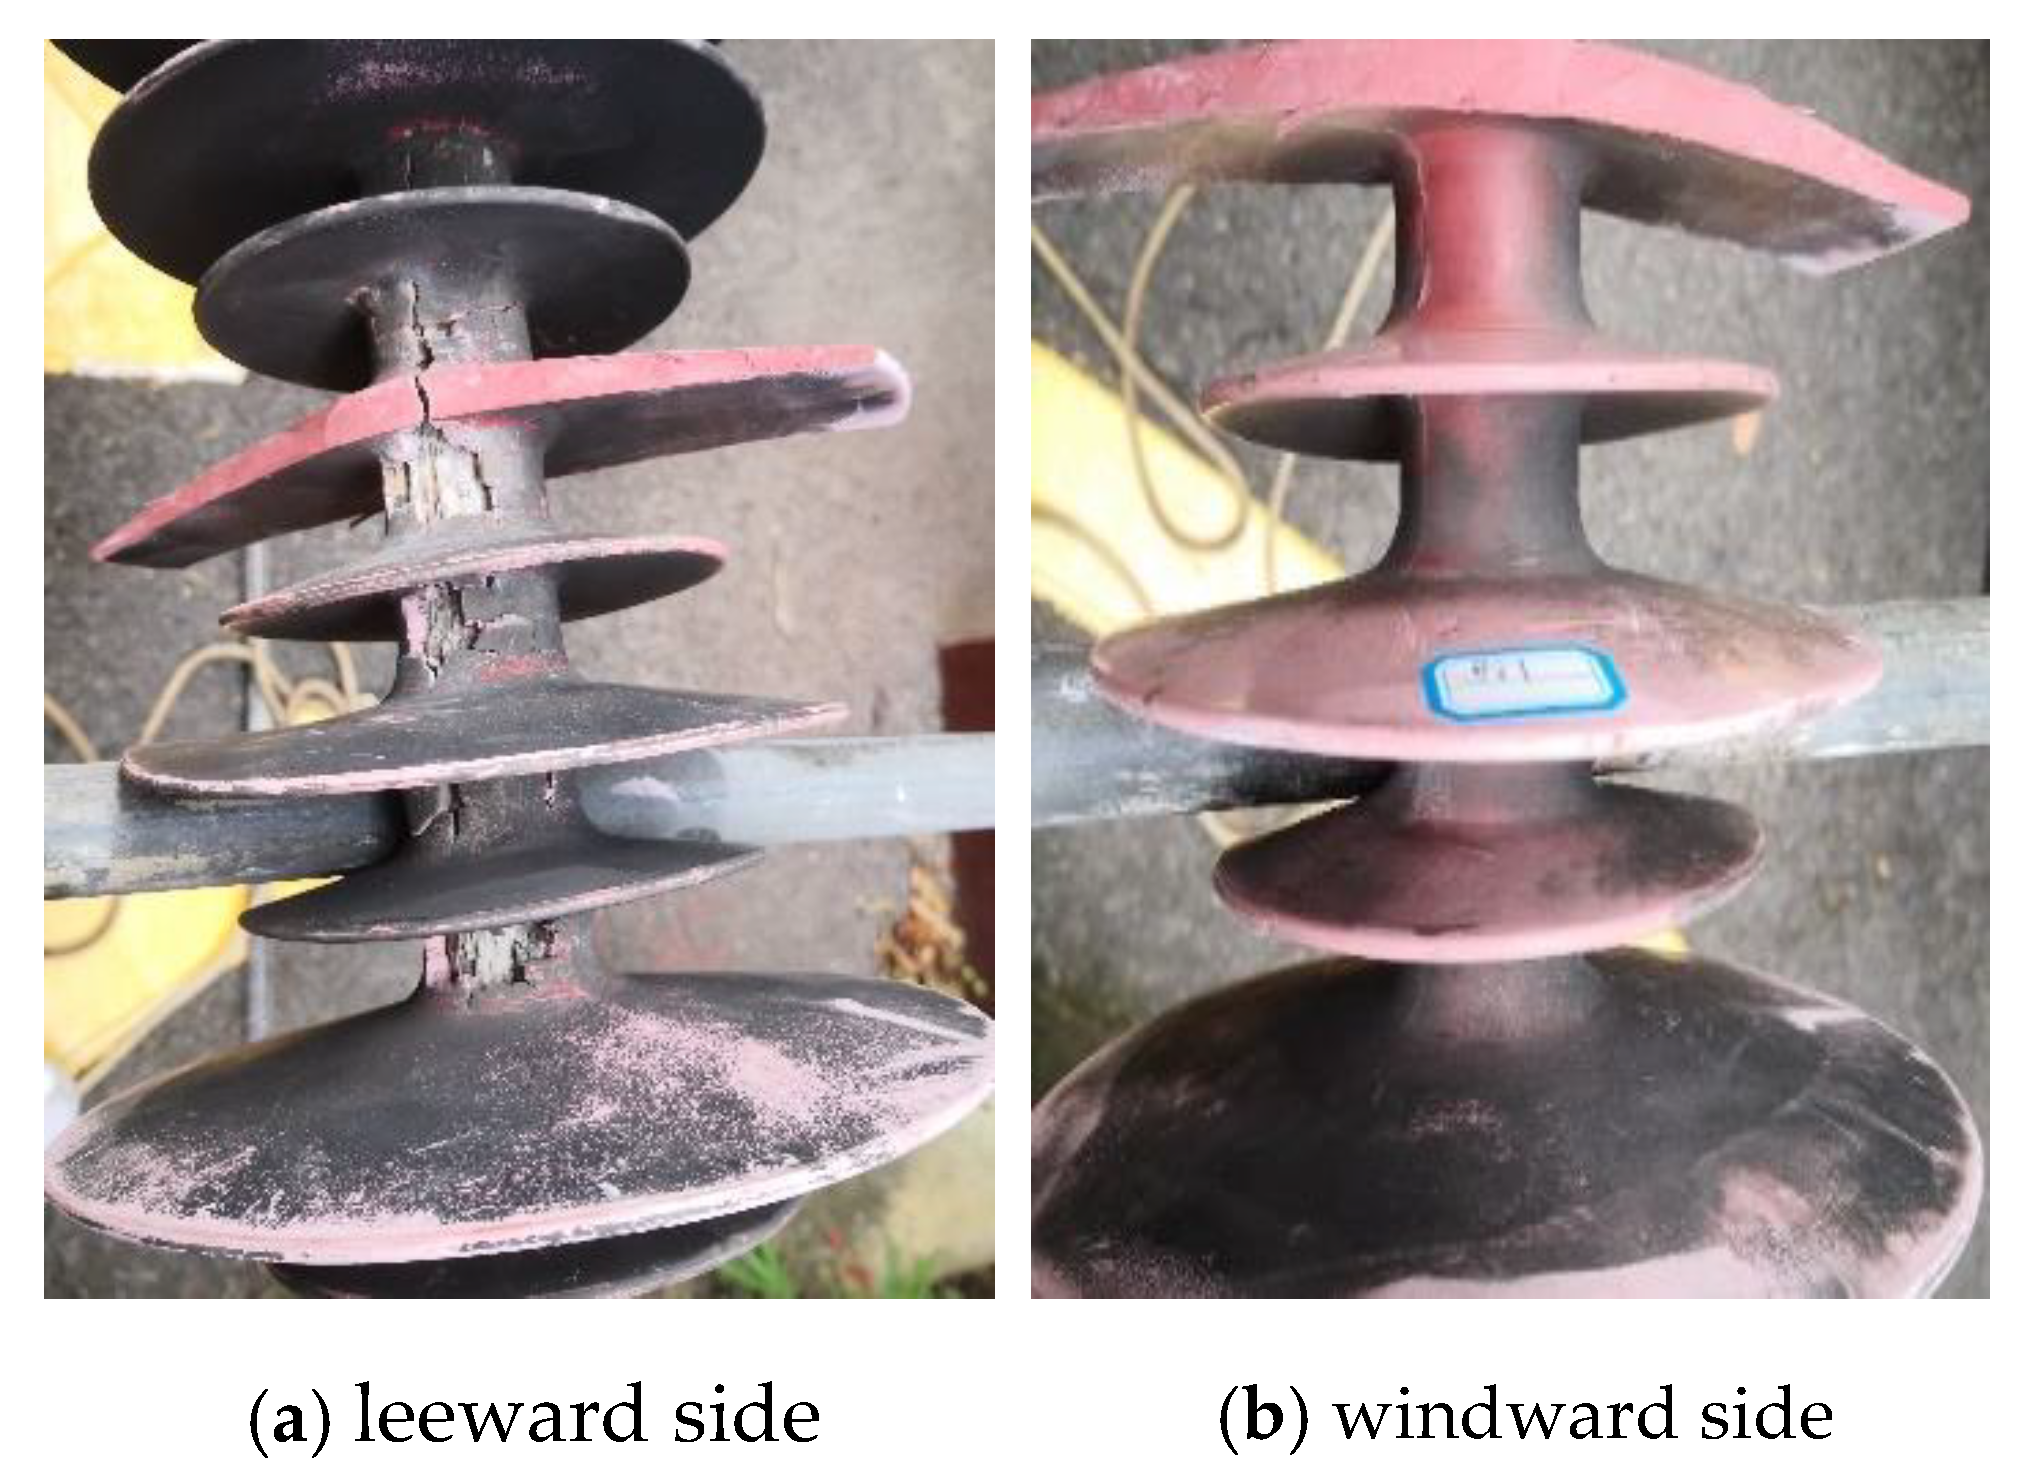
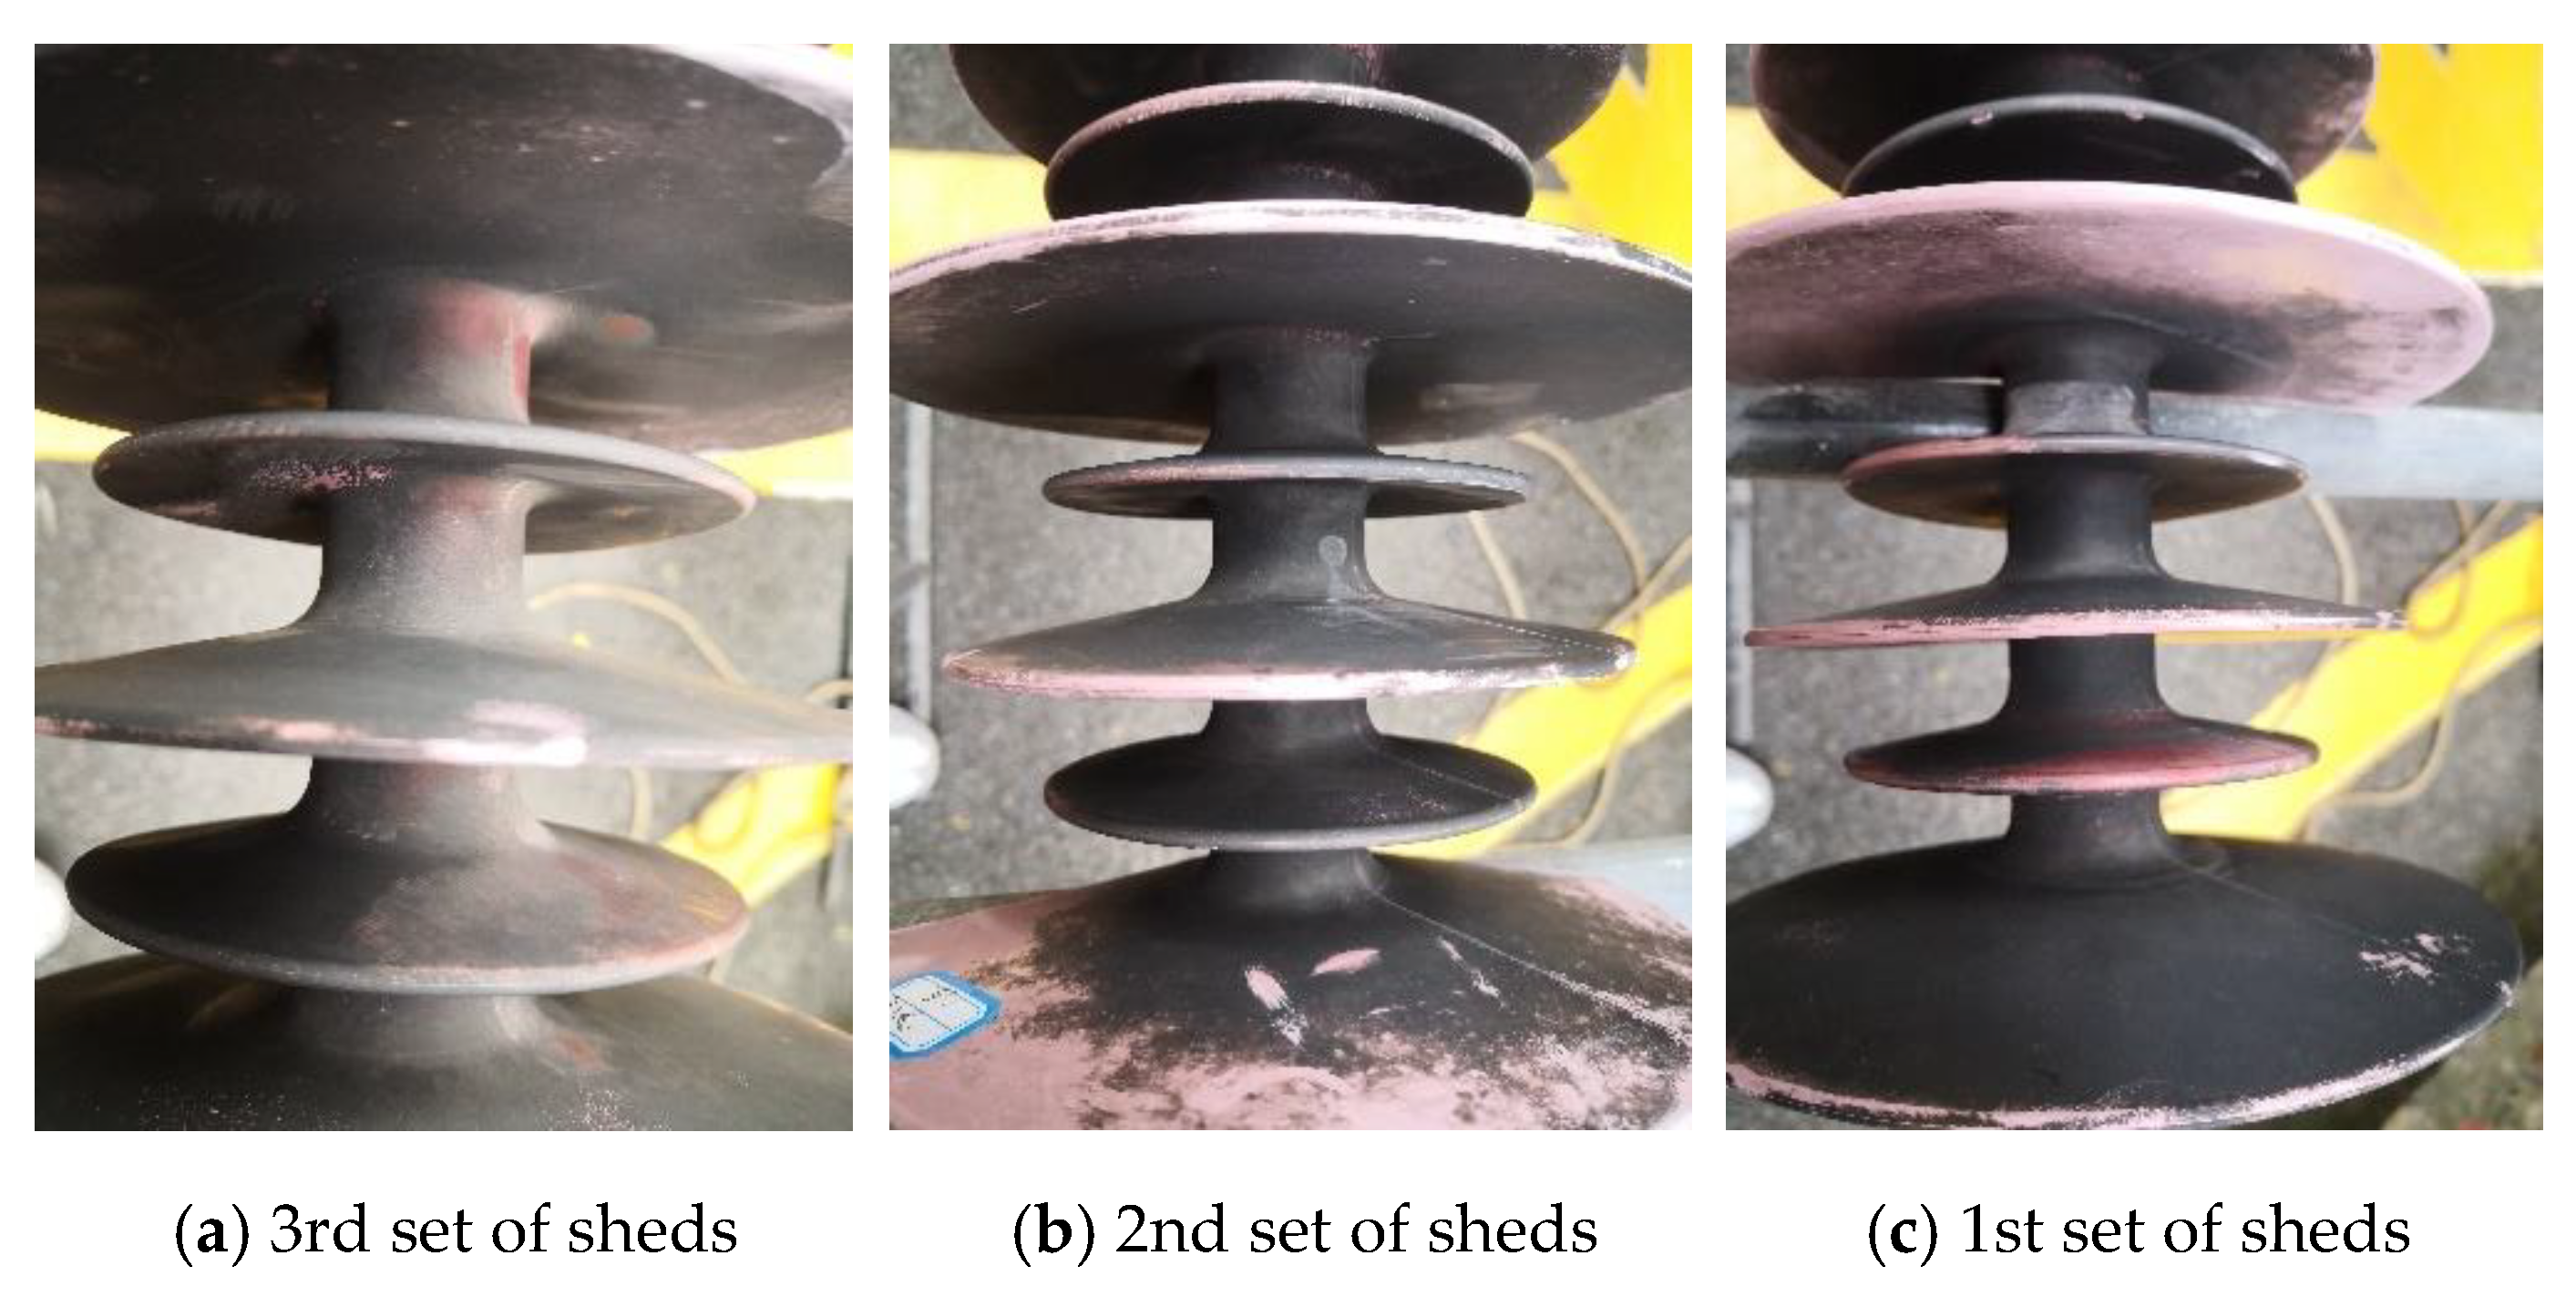
3.1.1. Appearances
3.1.2. Pollution
3.1.3. Hardness
3.1.4. Hydrophobicity
3.2. Chemical Characteristics
3.2.1. NMR Analysis
3.2.2. FTIR Analysis
- (1)
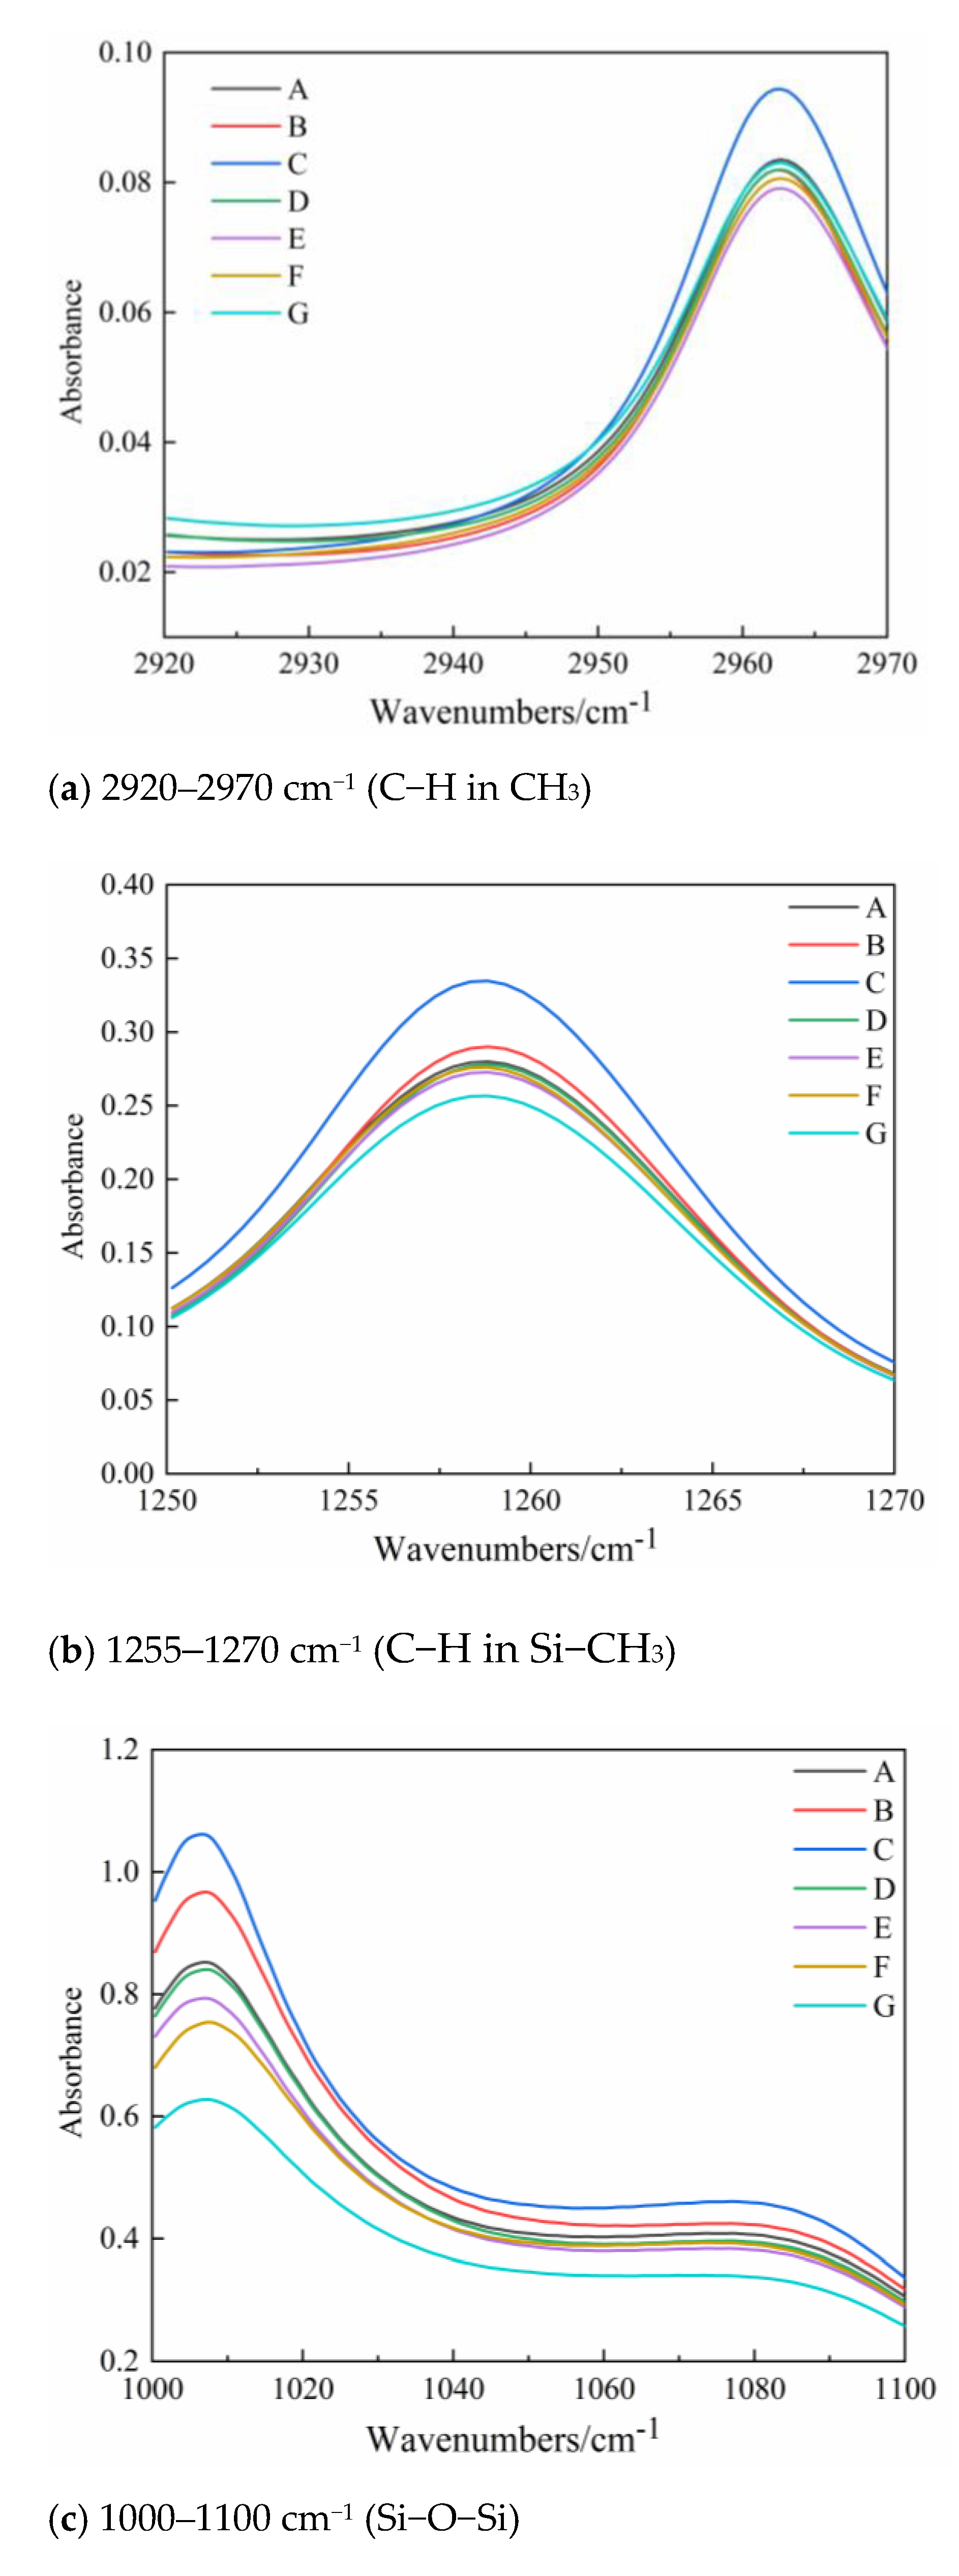
- The wavenumber of 2920–2970 cm−1 indicates the existence of methyl (−CH3). As indicated in Figure 10a, the order of absorption peaks is C > A ≈ G > D ≈ B > F > E. The level of absorption peak represents the amount of methyl content.1# insulator has the highest absorption peak at the high voltage end. The absorption peak at three positions of 1# insulator is higher than that of 2# insulator. 2# insulator among the seven samples has the lowest absorption peak (in the middle). The decrease in C−H bond content was mainly due to the fracture of −CH3 functional groups in silicone rubber;
- (2)
- The corresponding functional group at the wavenumber of 1255–1270 cm−1 is C−H in Si−CH3. As shown in Figure 10b, the order of absorption peaks is C > B > A > D > F > E > G. The absorption peak of the high voltage end of 1# insulator is the highest, indicating that the C−H bond in Si−CH3 in the high voltage end is the most. The absorption peak at three positions of 1# insulator is higher than that of 2# insulator. The peak value of the low voltage side of the two operating insulators is close, indicating that the aging degree is similar. Furthermore, 3# insulator’s absorption peak is lowest on the high voltage side.The decrease in −CH3 indicates that the macromolecular chain is broken, further weakening hydrophobicity, according to the findings shown in Table 3. In addition, the degree of damage caused by −CH3 can, to a certain extent, reflect the degree of aging. The Si−O−Si bond is broken, and small silicone molecules are lost, which reduces the absorption peak value;
- (3)
- Figure 10c indicates that at the wavenumber of 1000–1100 cm−1, the corresponding functional group is Si−O−Si, and the change in the absorption peak is identical to that of methyl (−CH3);
- (4)
3.3. Preventive Measures
4. Conclusions
- (1)
- The sheds’ degradation is concentrated on the side with heavy pollution, with no notable occurrence on the other side. Along the direction of the grounding end, the degree of degradation diminishes. After a long-term operation, due to the hydrophobic migration characteristics of silicone rubber, the two insulators still maintain good hydrophobicity. From the morphology, pollution characteristics, and hydrophobicity, the aging degree of the high voltage side is higher than that of other parts in the same insulator. There is no direct connection between the physical properties of sheds and decay-like fracture of the core rod;
- (2)
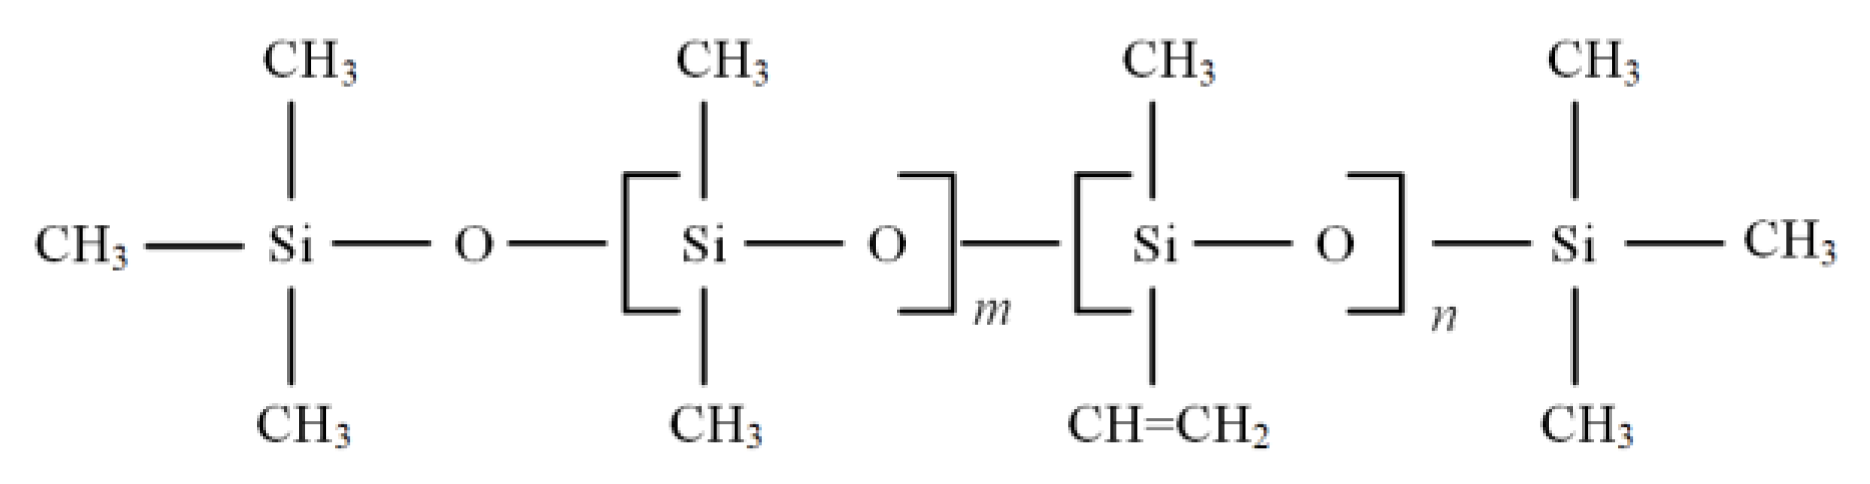
- The severity of aging increases with a decrease in the equivalent transverse relaxation time T2. The main chain of PDMS is severely damaged at the insulator fracture. NMR and FTIR can well judge the aging degree of silicone rubber of composite insulators. However, the aging degree of silicone rubber cannot be used to judge whether the composite insulator is decay-like or level;
- (3)
- By comparing the two insulators on the same V string, the physical and chemical properties of the fractured insulator sheds are poor, and the aging is serious, but no significant characteristics can characterize the difference between decay-like fractures. The operating instulators can also obtain the physical and chemical characteristics of the decay-like fractured insulator sheds after enough time, so it is difficult to judge the decay-like fracture only by the aging degree of the silicone rubber sheds.
Author Contributions
Funding
Institutional Review Board Statement
Informed Consent Statement
Data Availability Statement
Conflicts of Interest
Abbreviations
| FRP | Fiber Reinforced Plastics |
| FTIR | Fourier transform infrared spectroscopy |
| NMR | Nuclear Magnetic Resonance |
| HTV | High Temperature Vulcanization |
| SiR | Silicone Rubber |
| ESDD | Equivalent Salt Deposit Density |
| NSDD | No Soluble Deposit Density |
| PDMS | Polydimethylsiloxane |
| ATH | Alumina Tri-hydrate |
| CPMG | Carr−Purcell−Meiboom−Gill |
References
- Cherney, E. 50 years in the development of polymer suspension-type insulators. IEEE Electr. Insul. Mag. 2013, 29, 18–26. [Google Scholar] [CrossRef]
- Liang, X.; Gao, Y.; Wang, J.; Li, S. The rapid development of silicone rubber composite insulators in China. High Volt. Eng. 2016, 42, 2888–2896. [Google Scholar]
- Hackam, R. Outdoor HV composite polymeric insulators. IEEE Trans. Dielectr. Electr. Insul. 1999, 6, 557–585. [Google Scholar] [CrossRef]
- Akbar, M.; Ullah, R.; Alam, S. Aging of silicone rubber-based composite insulators under multi-stressed conditions: An overview. Mater. Res. Express 2019, 6, 102–105. [Google Scholar] [CrossRef]
- Xie, S.; Zhou, M.; Chen, L.; Huang, H.; Song, S.; Wang, J. Mechanical properties and damage characteristics of composite in-sulator sheds operated on islands. High Volt. Eng. 2021, 47, 1824–1830. [Google Scholar]
- Liang, X.; Bao, W.; Gao, Y. Decay-like fracture mechanism of silicone rubber composite insulator. IEEE Trans. Dielectr. Electr. Insul. 2018, 25, 110–119. [Google Scholar] [CrossRef]
- Lutz, B.; Cheng, L.; Guan, Z.; Wang, L.; Zhang, F. Analysis of a fractured 500 kV composite insulator—Identification of aging mechanisms and their causes. IEEE Trans. Dielectr. Electr. Insul. 2012, 19, 1723–1731. [Google Scholar] [CrossRef]
- Wang, J.; Liang, X.; Gao, Y. Failure analysis of decay-like fracture of composite insulator. IEEE Trans. Dielectr. Electr. Insul. 2014, 21, 2503–2511. [Google Scholar] [CrossRef]
- Yuan, Z.; Tu, Y.; Zhao, Y.; Jiang, H.; Wang, C. Degradation behavior and aging mechanism of decay-like fractured GRP rod in composite insulator. IEEE Trans. Dielectr. Electr. Insul. 2019, 26, 1027–1034. [Google Scholar] [CrossRef]
- Bi, M.; Deng, R.; Jiang, T.; Chen, X.; Pan, A.; Zhu, L. Study on corona aging characteristics of silicone rubber material under different environmental conditions. IEEE Trans. Dielectr. Electr. Insul. 2022, 29, 534–542. [Google Scholar] [CrossRef]
- Rowland, S.M.; Robertson, J.; Xiong, Y.; Day, R.J. Electrical and material characterization of field-aged 400 kV silicone rubber composite insulators. IEEE Trans. Dielectr. Electr. Insul. 2010, 17, 375–383. [Google Scholar] [CrossRef]
- Liang, T.; Zhang, Z.; Ma, X.; Xiang, Y.; Huang, H.; Jiang, X. Characteristics of powdered layer on silicone rubber surface. J. Mater. Res. Technol. 2021, 14, 36–46. [Google Scholar] [CrossRef]
- Liu, J.; Jia, B.; Geng, J. Hydrophobicity test of silicone rubber based on thermogravimetric analysis. J. Electr. Eng. Technol. 2019, 14, 2065–2072. [Google Scholar] [CrossRef]
- Mohamed, G.S.; Vijayarekha, K. Investigation of surface degradation of aged High Temperature Vulcanized (HTV) silicone rubber insulators. Energies 2019, 12, 3769. [Google Scholar]
- Qiao, X.; Zhang, Z.; Jiang, X.; Liang, T. Influence of DC electric fields on pollution of HVDC composite insulator short samples with different environmental parameters. Energies 2019, 12, 2304. [Google Scholar] [CrossRef] [Green Version]
- Xiao, X.; Wang, J.; Tong, Y.; Chen, L.; Fan, Y. Residual mechanical strength evaluation of crimping assembled composite insulators with service time of 10–14 years. Iet. Gener. Transm. Dis. 2019, 13, 4324–4330. [Google Scholar] [CrossRef]
- IEC 60507: 2013; Artificial Pollution Tests on High-Voltage Ceramic and Glass Insulators to be Used on A.C. Systems. IEC: Geneva, Switzerland, 2013.
- IEC/TS 60815-1: 2008; Guide for the Selection and Dimensioning of High Voltage Insulators for Polluted Conditions. IEC: Geneva, Switzerland, 2008.
- ISO 48-4: 2018; Rubber, Vulcanized or Thermoplastic—Determination of Hardness—Part 4: Indentation Hardness by Durometer Method (Shore Hardness). ISO: Geneva, Switzerland, 2018.
- Guide 1, 92/1; Hydrophobicity Classification Guide. Swedish Transmission Research Institute-STRI: Ludvika, Sweden, 1992.
- IEC/TS 62073: 2016; Guidance on the Measurement of Hydrophobicity of Insulator Surfaces. IEC: Geneva, Switzerland, 2016.
- Bluimich, B.; Perlo, J.; Casanova, F. Mobile Single-sided NMR. Prog. Nucl. Magn. Reson. Spectrosc. 2008, 52, 197–269. [Google Scholar] [CrossRef]
- Xu, Z.; Zhao, S.; Guo, P. A portable NMR sensor used for assessing the aging status of silicone rubber insulator. Appl. Magn. Reson. 2013, 44, 1405–1417. [Google Scholar] [CrossRef]
- Xu, Z.; Guo, P.; He, X.; Yi, S. Aging detection of composite insulator with nuclear magnetic resonance theory. High Voltage App. 2012, 48, 21–25. [Google Scholar]
- Xu, Z.; Cheng, J.; Wu, J.; He, W. Non-destructive aging detection method for silicone rubber insulator shed based on unilateral NMR principle. Proc. CSEE 2014, 34, 6545–6553. [Google Scholar]
- Zhang, D.; Zhang, Z.; Jiang, X.; Yang, Z.; Liu, Y. Study on the flashover performance of various types of insulators polluted by nitrates. IEEE Trans. Dielectr. Electr. Insul. 2017, 24, 167–174. [Google Scholar] [CrossRef]
- Seifert, J.M.; Petrusch, W.; Janssen, H. A comparison of the pollution performance of long rod and disc type HVDC insulators. IEEE Trans. Dielectr. Electr. Insul. 2007, 14, 125–129. [Google Scholar] [CrossRef]
- Wang, H.; Liu, G. Study on insulator natural contamination trend under different physiognomies of local area. In Proceedings of the Conference Record of the 2008 IEEE International Symposium on Electrical Insulation, Vancouver, BC, Canada, 9–12 June 2008; pp. 89–93. [Google Scholar]
- Liang, Y.; Guo, X. Aging Condition Assessment of Silicone Rubber for Composite Insulators Based on FTIR. High Volt. Appar. 2015, 51, 62–67. [Google Scholar]
- Zeng, L.; Zhang, Y.; Zeng, X. Aging state evaluation methods for silicone rubber sheds of composite insulators. Insul. Surge Arresters 2022, 2, 139–152. [Google Scholar]
- Jia, Z.; Guan, Z. A Study on the hydrophobicity migration of the room temperature vulcanized silicone rubber coating. High Volt. Eng. 1999, 25, 7–9. [Google Scholar]
- Deng, T.; Yang, D.; Tao, W.; Zhou, K.; Zhang, X. The relationship between microstructure and hydrophobicity of pulverized composite insulator sheds. Power Syst. Technol. 2016, 40, 328–333. [Google Scholar]
- Li, Z.; Liang, X.; Zhou, Y. Influences of DC corona on hydrophobicity of silicone rubber. Proc. CSEE 2007, 27, 30–34. [Google Scholar]
- Gao, Y.; Wang, J.; Liang, X.; Yan, Z.; Liu, Y. Influence of AC and DC corona on high temperature vulcanized silicone rubber. Proc. CSEE 2016, 36, 274–284. [Google Scholar]
- Gustavsson, T.G.; Gubanski, S.M.; Hillborg, H.; Karlsson, S.; Gedde, U.W. Aging of silicone rubber under ac or dc voltages in a coastal environment. IEEE Trans. Dielectr. Electr. Insul. 2001, 8, 1029–1039. [Google Scholar] [CrossRef]
- Jia, Z.; Yang, Z.; Wang, X.; Wang, Z.; Guan, Z.; Yu, X. Aging characteristics of composite insulators based on hydrophobicity transfer test. High Volt. Eng. 2015, 41, 1907–1914. [Google Scholar]
- Gao, Y.; Liang, X. Study on Decay-Like Fracture of Composite Insulator, Part II: Experimental simulation and preventive method discussion of decay-like fracture. Proc. CSEE 2016, 36, 5070–5077. [Google Scholar]
- Lewis, T.J. Interfaces are the dominant feature of dielectrics at the nanometric level. IEEE Trans. Dielectr. Electr. Insul. 2004, 11, 739–753. [Google Scholar] [CrossRef]
- Tanaka, T.; Kozako, M.; Fuse, N. Proposal of a multi-core model for polymer nanocomposite dielectrics. IEEE Trans. Dielectr. Electr. Insul. 2005, 12, 669–681. [Google Scholar] [CrossRef]
- Beisele, C.; Kultzow, B. Experiences with new hydrophobic cycloaliphatic epoxy outdoor insulation systems. IEEE Electr. Insul. Mag. 2001, 17, 33–39. [Google Scholar] [CrossRef]
- Liu, Y.; Liu, X.; Wang, L.; Fan, H. Internal curing reaction and numerical analysis of temperature field of cycloaliphatic epoxy resin insulators. High Volt. Eng. 2020, 46, 1986–1993. [Google Scholar]
- Wang, Y.; Liu, Y.; Fan, H.; Wang, L. Boiled aging characteristics of silicone rubber and cycloaliphatic epoxy resin composite insulators interface. High Volt. Eng. 2022, 48, 2028–2035. [Google Scholar]


| Type | Sample | ESDDtop/ESDDbottom 1 (mg/cm2) | ESDD (mg/cm2) | NSDDtop/NSDDbottom 2 (mg/cm2) | NSDD (mg/cm2) |
|---|---|---|---|---|---|
| 1# | A | 0.042/0.025 | 0.022 | 1.926/0.114 | 0.497 |
| B | 0.026/0.012 | 0.015 | 1.525/1.053 | 1.154 | |
| C | 0.047/0.015 | 0.029 | 1.690/1.440 | 1.493 | |
| 2# | D | 0.031/0.026 | 0.027 | 2.014/0.990 | 1.207 |
| E | 0.032/0.011 | 0.015 | 2.430/1.039 | 1.335 | |
| F | 0.043/0.013 | 0.019 | 2.319/1.124 | 2.065 |
| Type | Sample | K1 | K2 | K1−K2 | (K1−K2)/K1 |
|---|---|---|---|---|---|
| 1# | A | 68.4 | 66.2 | 2.2 | 3.22% |
| B | 69.2 | 65.0 | 4.2 | 6.07% | |
| C | 75.4 | 73.2 | 2.2 | 2.92% | |
| 2# | D | 69.4 | 66.4 | 3.0 | 4.32% |
| E | 71.0 | 70.8 | 0.2 | 0.28% | |
| F | 75.4 | 73.4 | 2.0 | 2.65% | |
| 3# | G | 66.2 | 64.8 | 1.4 | 2.11% |
| Type | Sample | θAVG (°) 1 | θMIN (°) 2 |
|---|---|---|---|
| 1# | A | 143.720 | 139.680 |
| A * | 123.735 | 120.180 | |
| B | 146.317 | 142.752 | |
| B * | 131.653 | 124.148 | |
| C | 146.347 | 141.923 | |
| C * | 104.986 | 102.728 | |
| 2# | D | 143.488 | 140.619 |
| D * | 130.259 | 129.067 | |
| E | 148.592 | 147.275 | |
| E * | 134.458 | 134.054 | |
| F | 126.329 | 126.048 | |
| F * | 116.941 | 114.109 | |
| 3# | G | 101.751 | 100.742 |
| Type | Sample | Average (ms) |
|---|---|---|
| 1# | A | 59.5717 |
| A * | 57.0346 | |
| B | 60.0761 | |
| B * | 56.3128 | |
| C | 52.7898 | |
| C * | 64.0521 | |
| 2# | D | 59.6568 |
| D * | 56.5934 | |
| E | 63.5008 | |
| E * | 58.0489 | |
| F | 56.1363 | |
| F * | 62.4736 | |
| 3# | G | 68.1456 |
| Wavenumbers/cm−1 | Functional Groups |
|---|---|
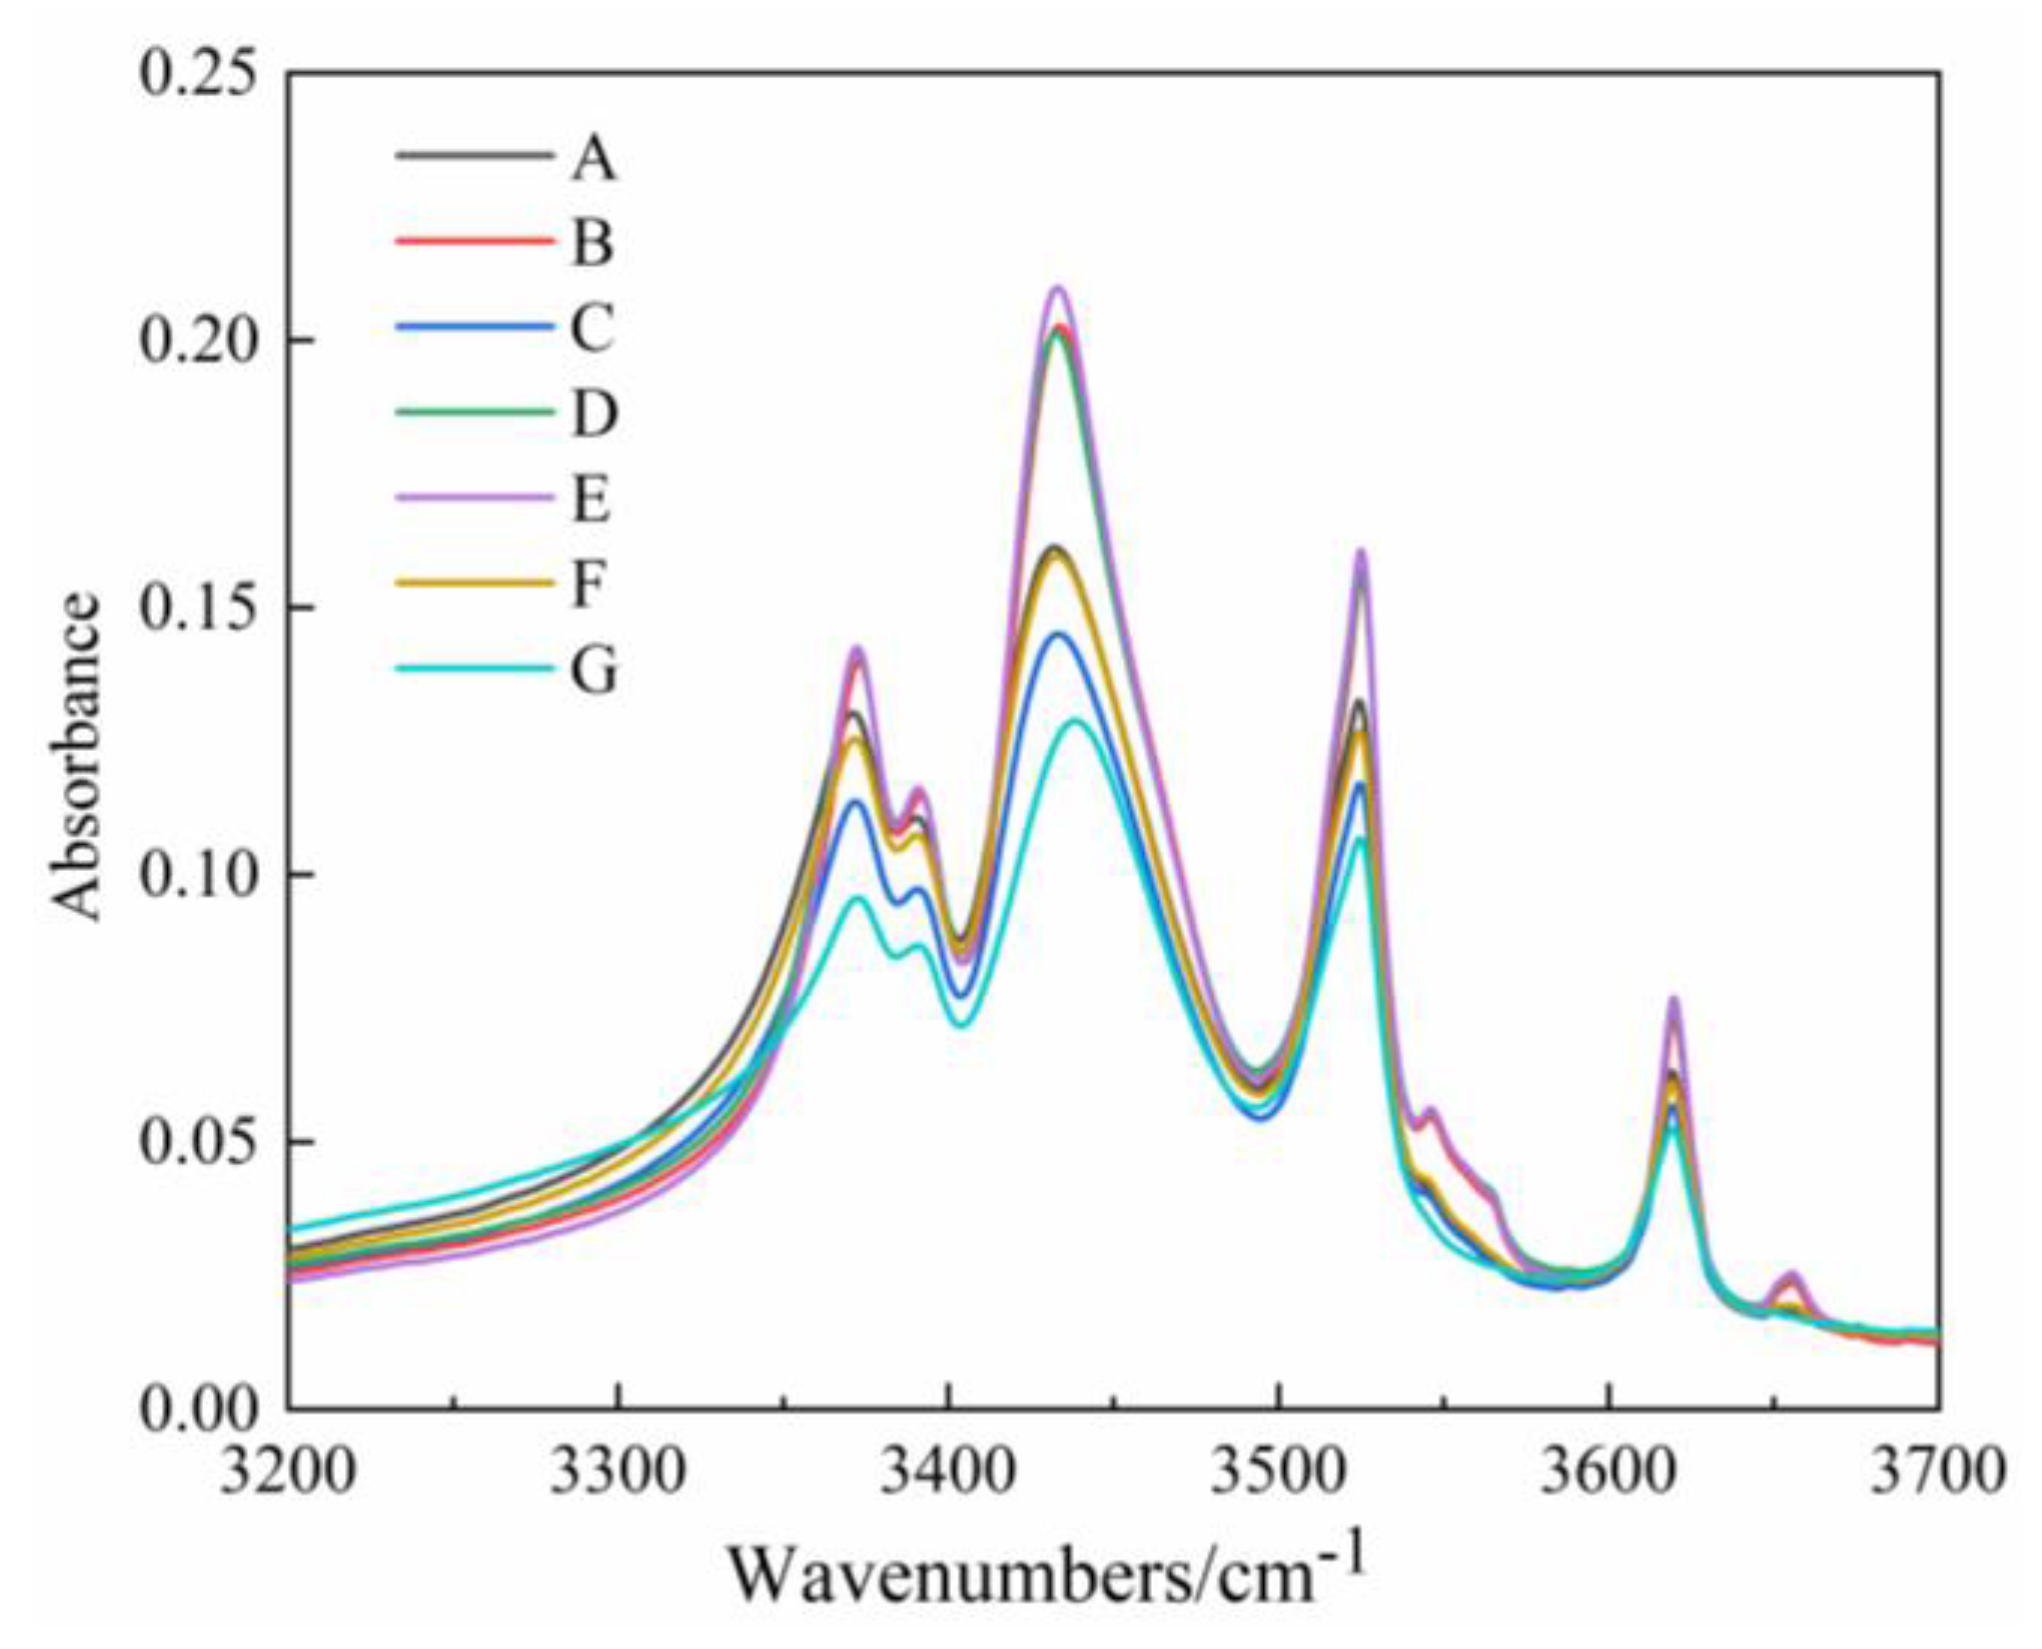
| 3200–3700 | −OH |
| 2920–2970 | C−H in CH3 |
| 1255–1270 | C−H in Si−CH3 |
| 1000–1100 | Si−O−Si |
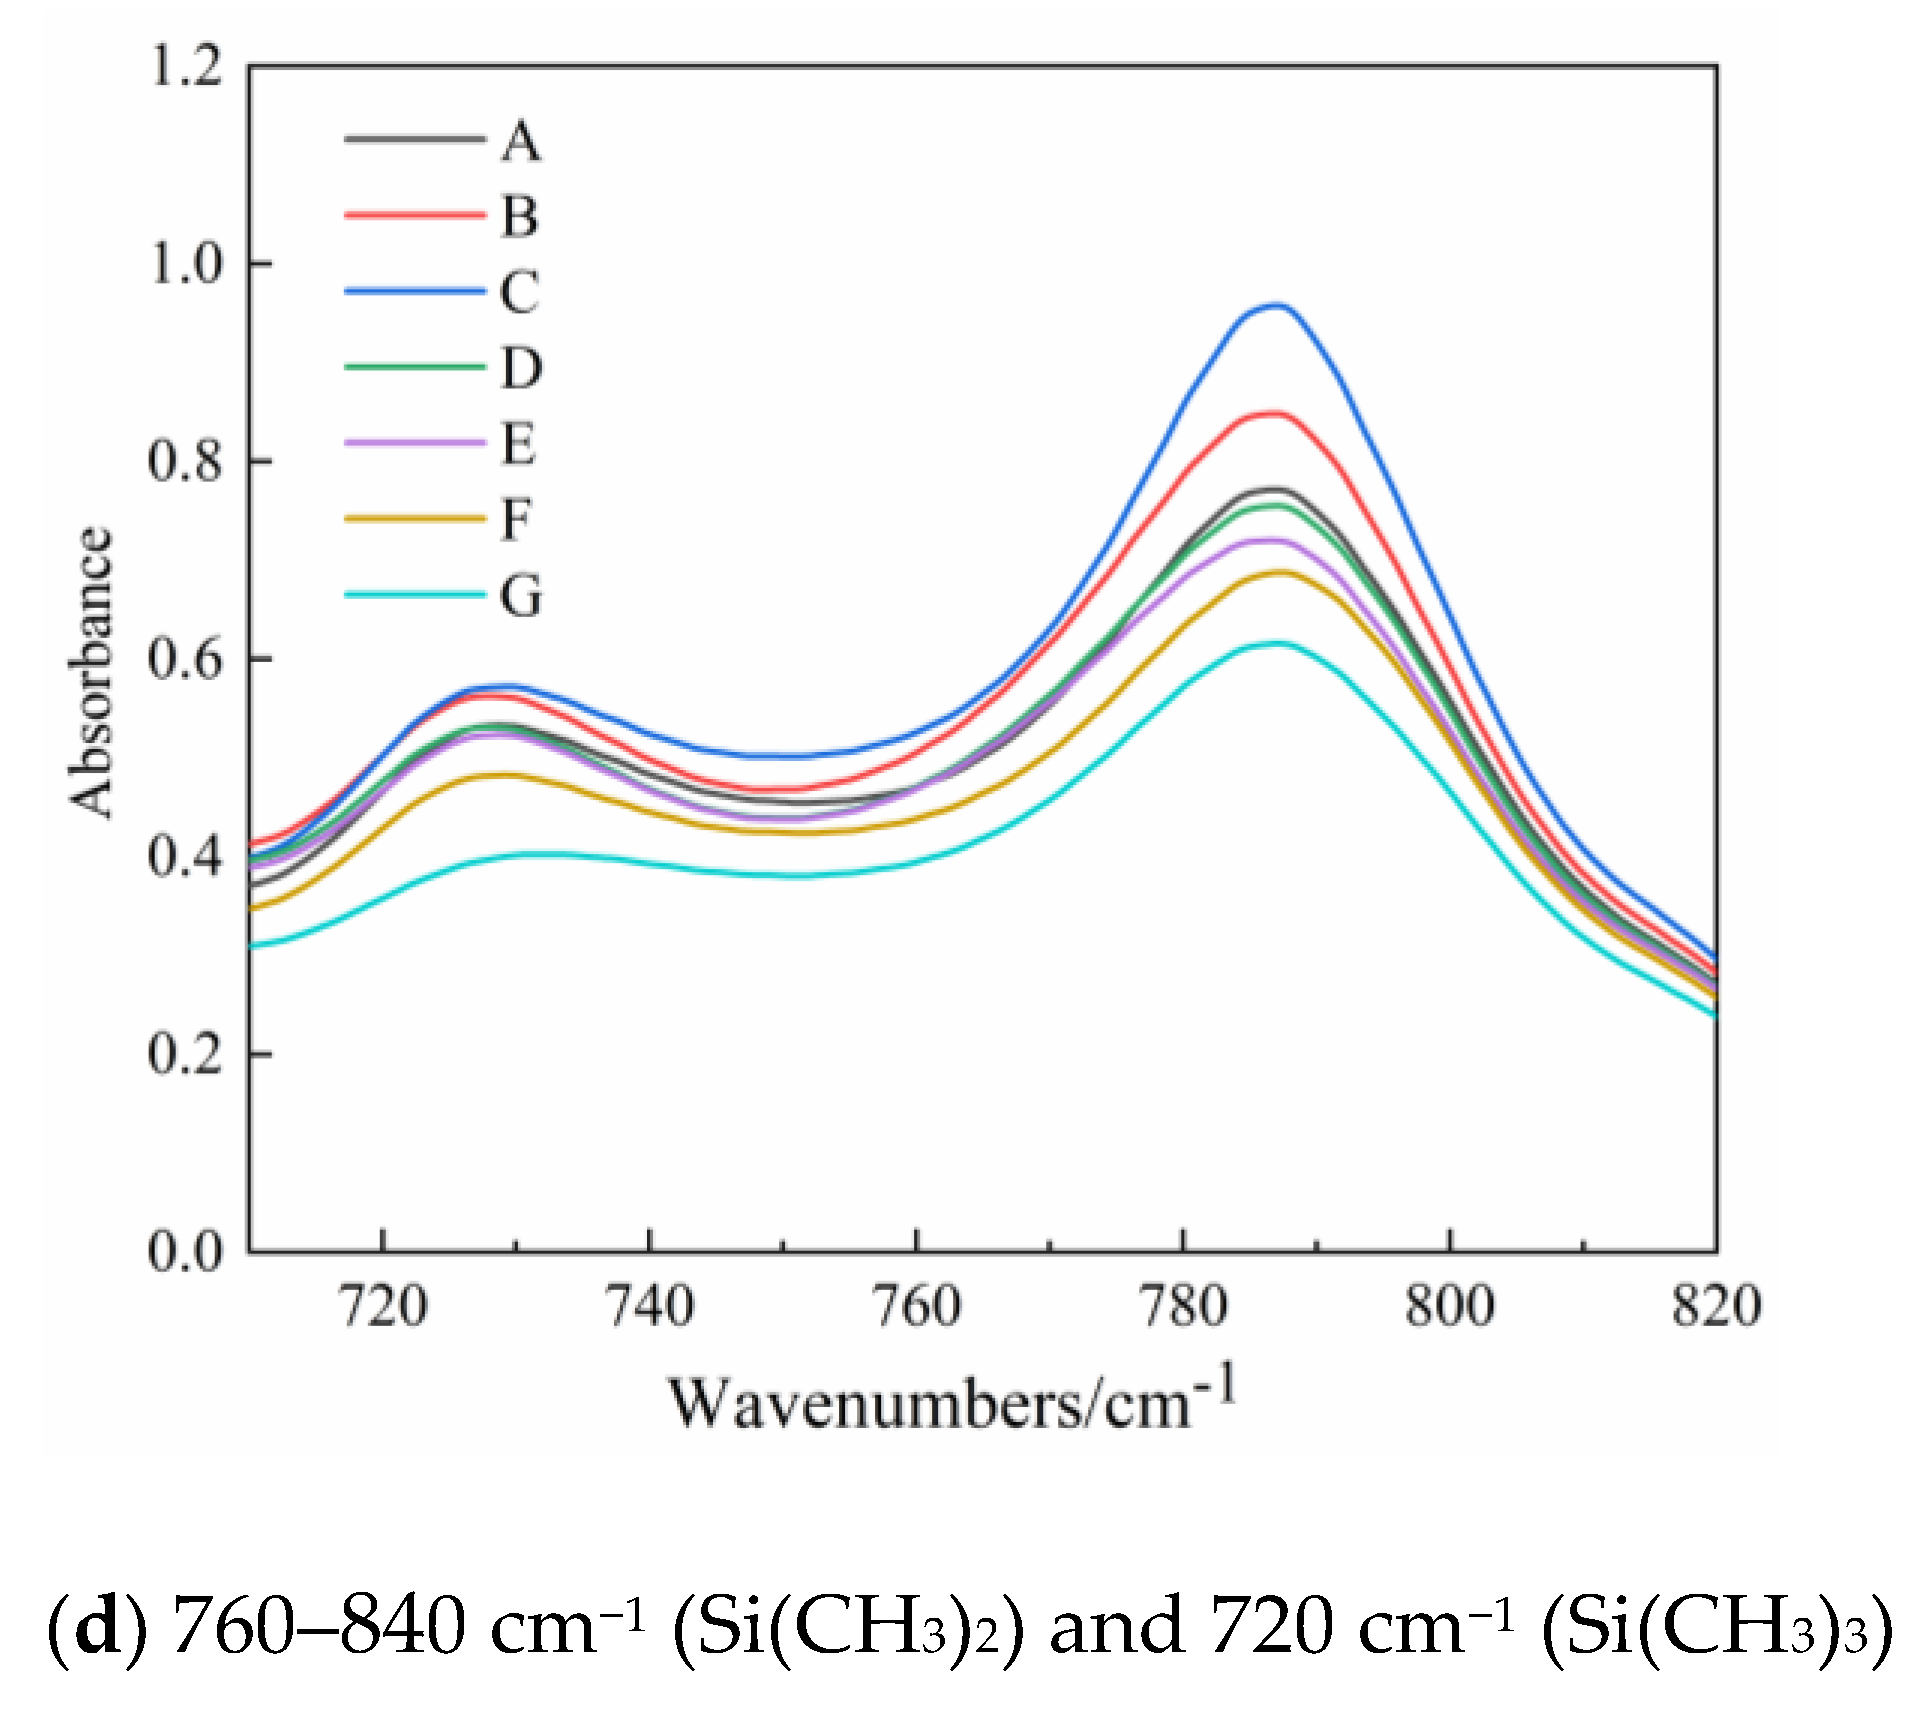
| 760–840 | Si(CH3)2 |
| 720 | Si(CH3)3 |
Publisher’s Note: MDPI stays neutral with regard to jurisdictional claims in published maps and institutional affiliations. |
© 2022 by the authors. Licensee MDPI, Basel, Switzerland. This article is an open access article distributed under the terms and conditions of the Creative Commons Attribution (CC BY) license (https://creativecommons.org/licenses/by/4.0/).
Share and Cite
Zhang, Z.; Pang, G.; Lu, M.; Gao, C.; Jiang, X. Research on Silicone Rubber Sheds of Decay-Like Fractured Composite Insulators Based on Hardness, Hydrophobicity, NMR, and FTIR. Polymers 2022, 14, 3424. https://doi.org/10.3390/polym14163424
Zhang Z, Pang G, Lu M, Gao C, Jiang X. Research on Silicone Rubber Sheds of Decay-Like Fractured Composite Insulators Based on Hardness, Hydrophobicity, NMR, and FTIR. Polymers. 2022; 14(16):3424. https://doi.org/10.3390/polym14163424
Chicago/Turabian StyleZhang, Zhijin, Guohui Pang, Ming Lu, Chao Gao, and Xingliang Jiang. 2022. "Research on Silicone Rubber Sheds of Decay-Like Fractured Composite Insulators Based on Hardness, Hydrophobicity, NMR, and FTIR" Polymers 14, no. 16: 3424. https://doi.org/10.3390/polym14163424