
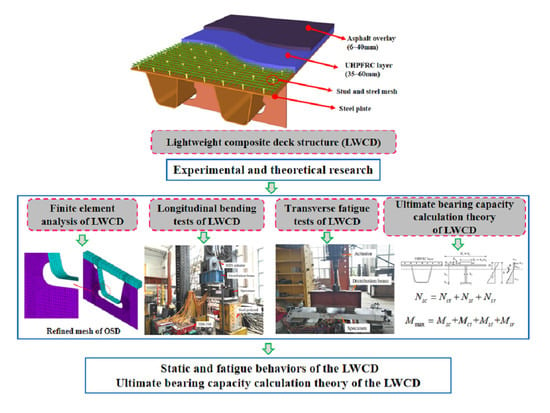
Study on Static and Fatigue Behaviors of Steel-UHPFRC Composite Deck Structure


Abstract
:
1. Introduction
2. Finite Element Analysis (FEA) of the LWCD
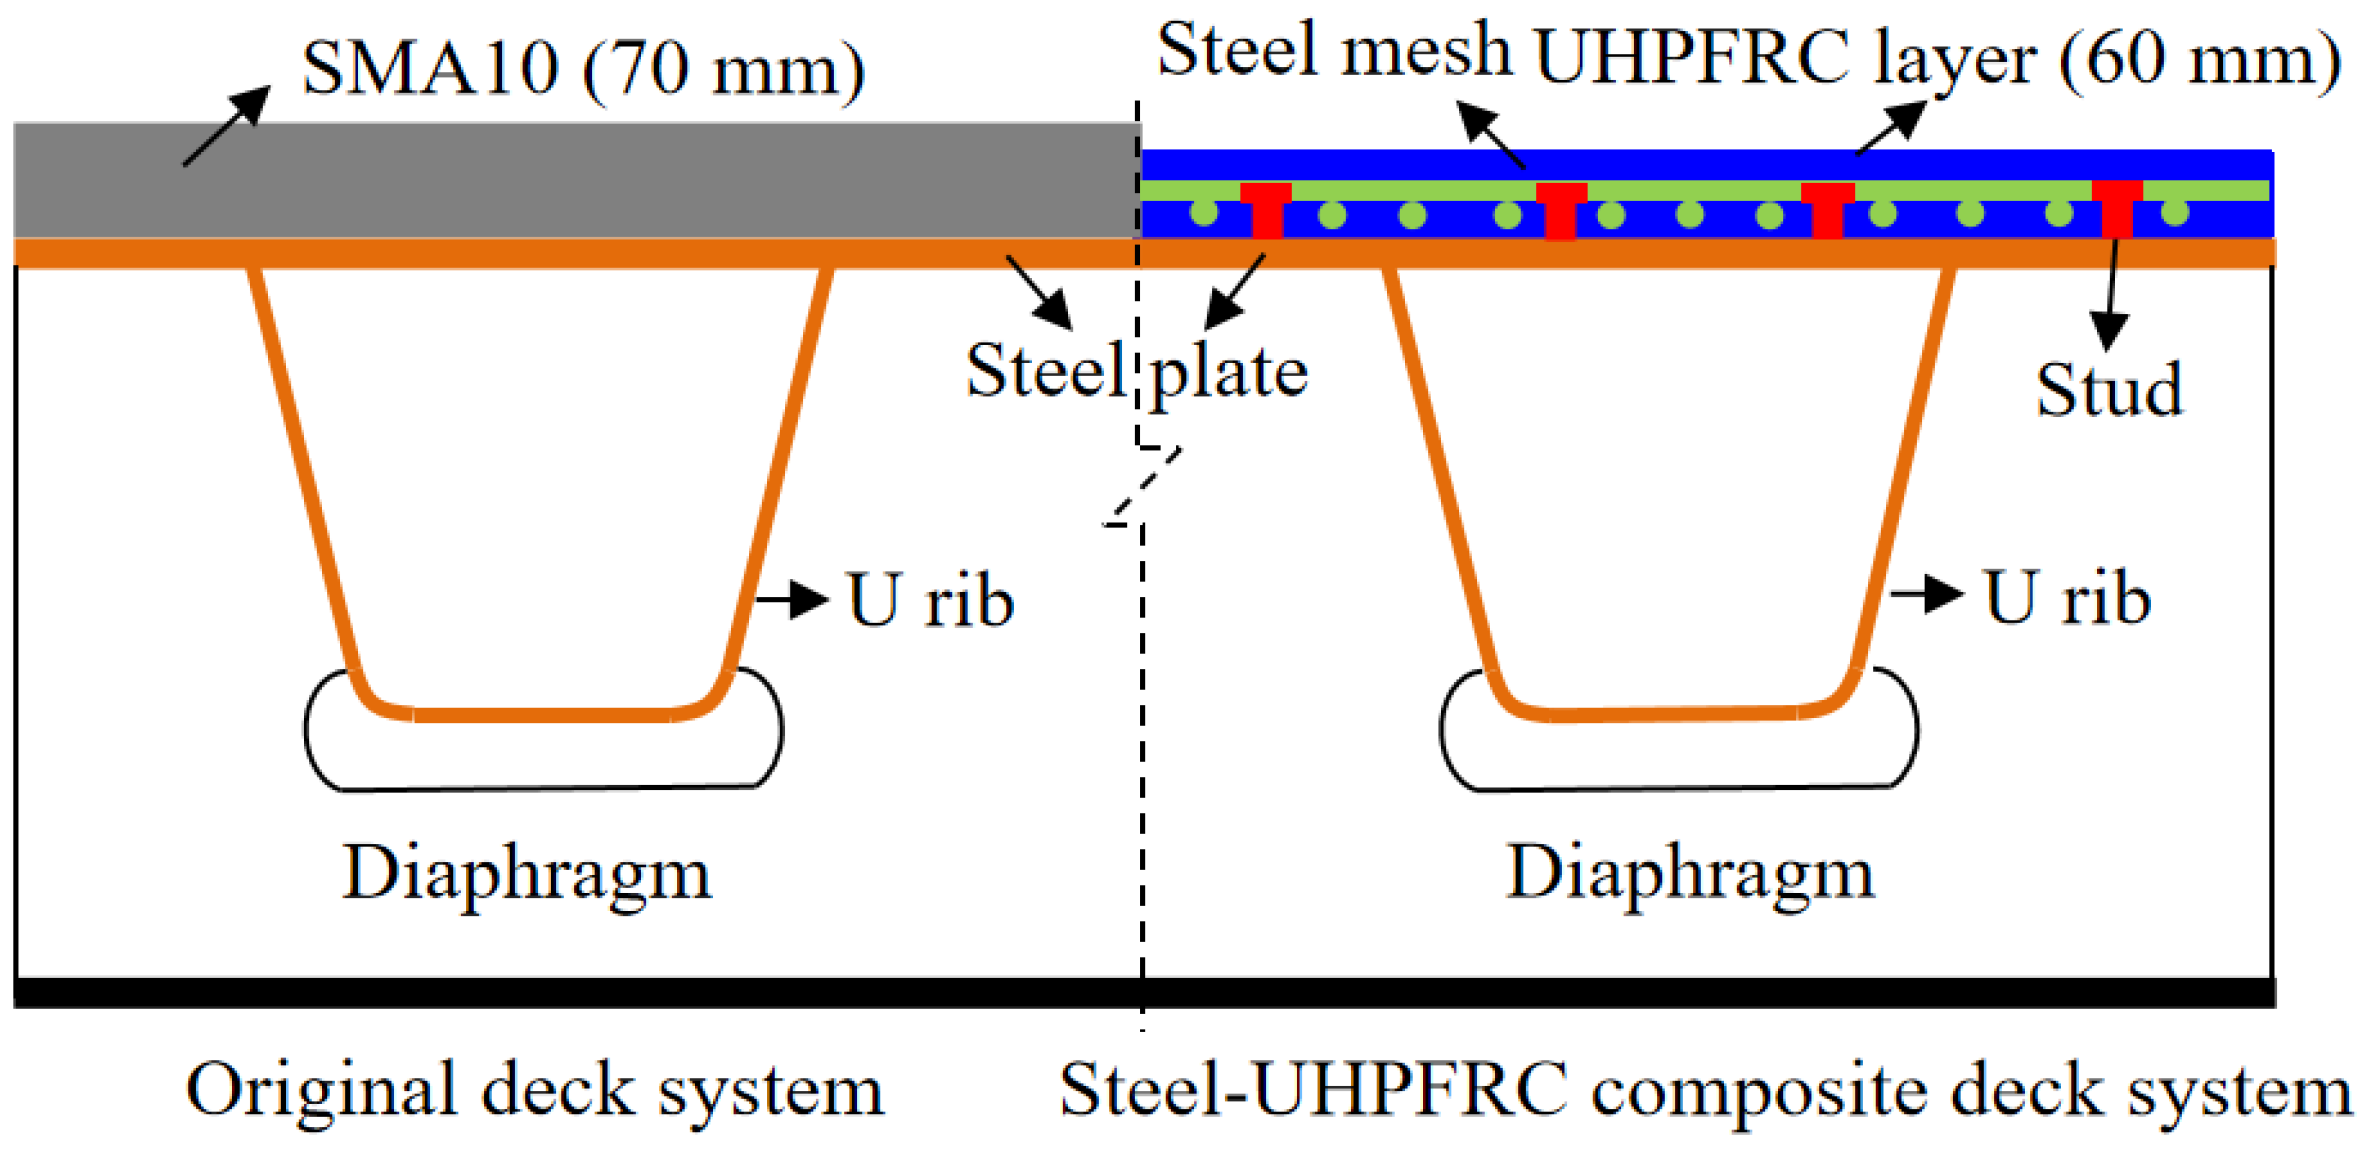
2.1. Basic Information of Humen Bridge
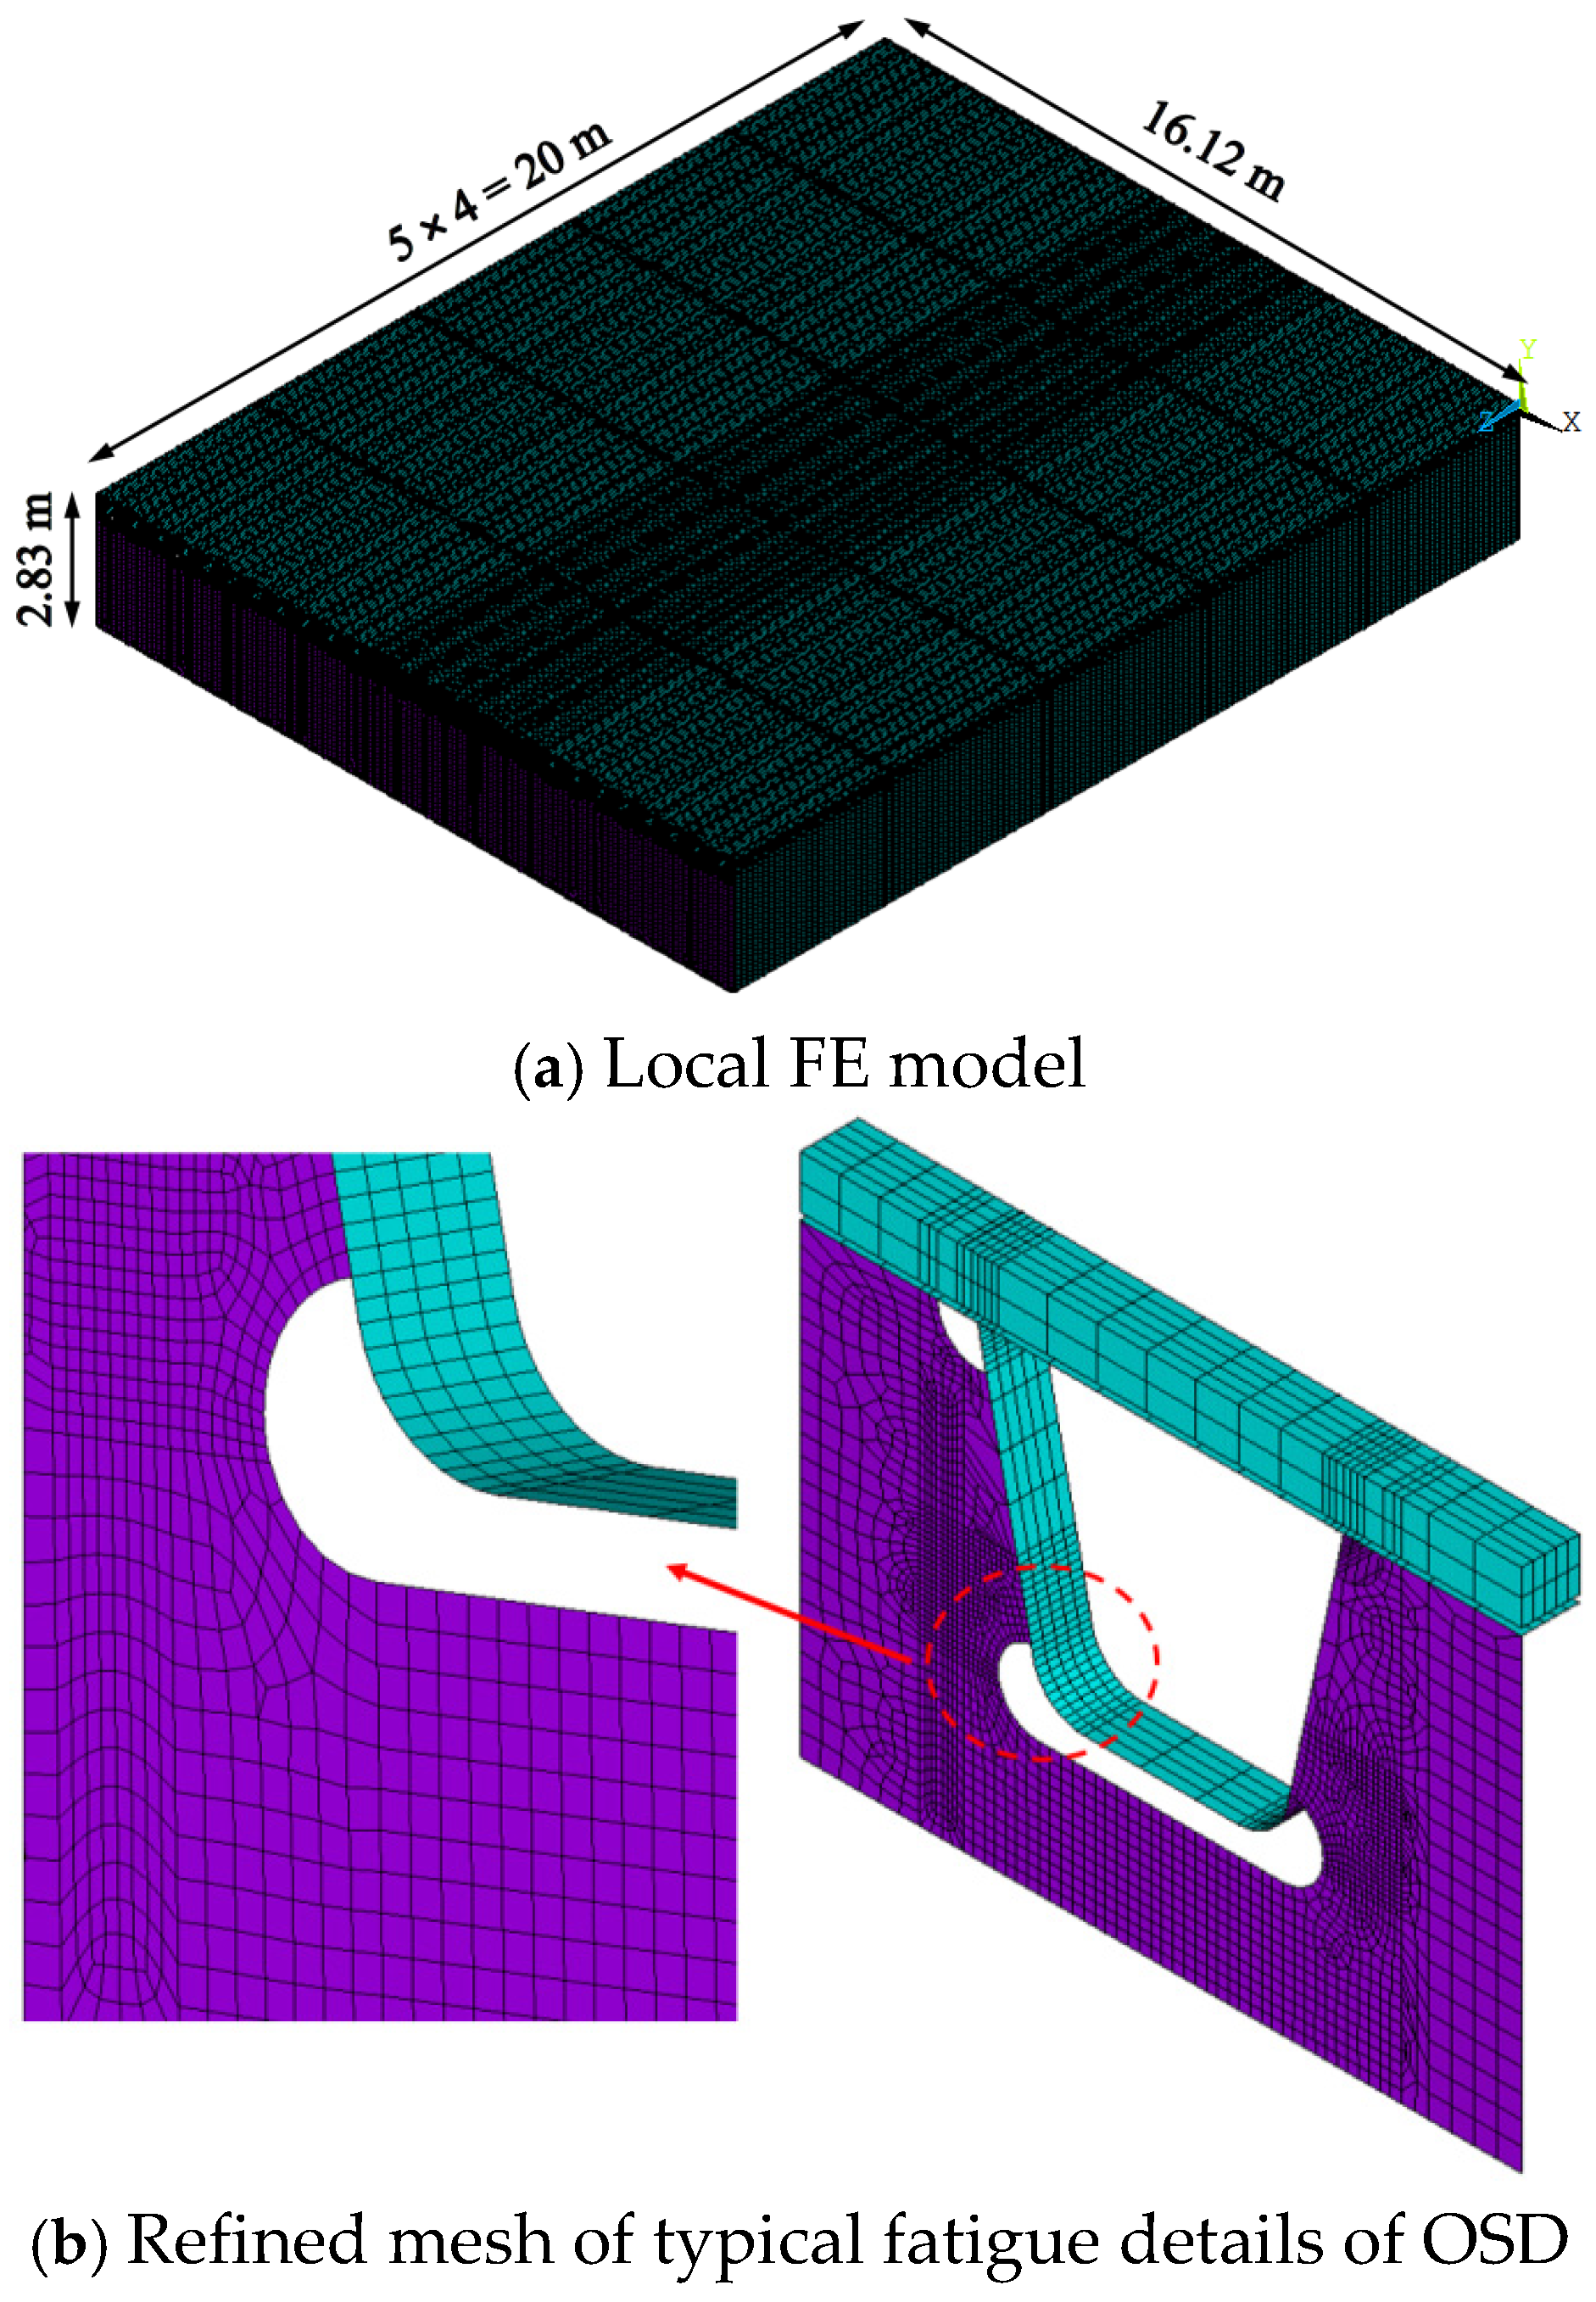
2.2. Local FE Model
2.3. Main Analysis Results
3. Experimental Methodology
3.1. Test Program
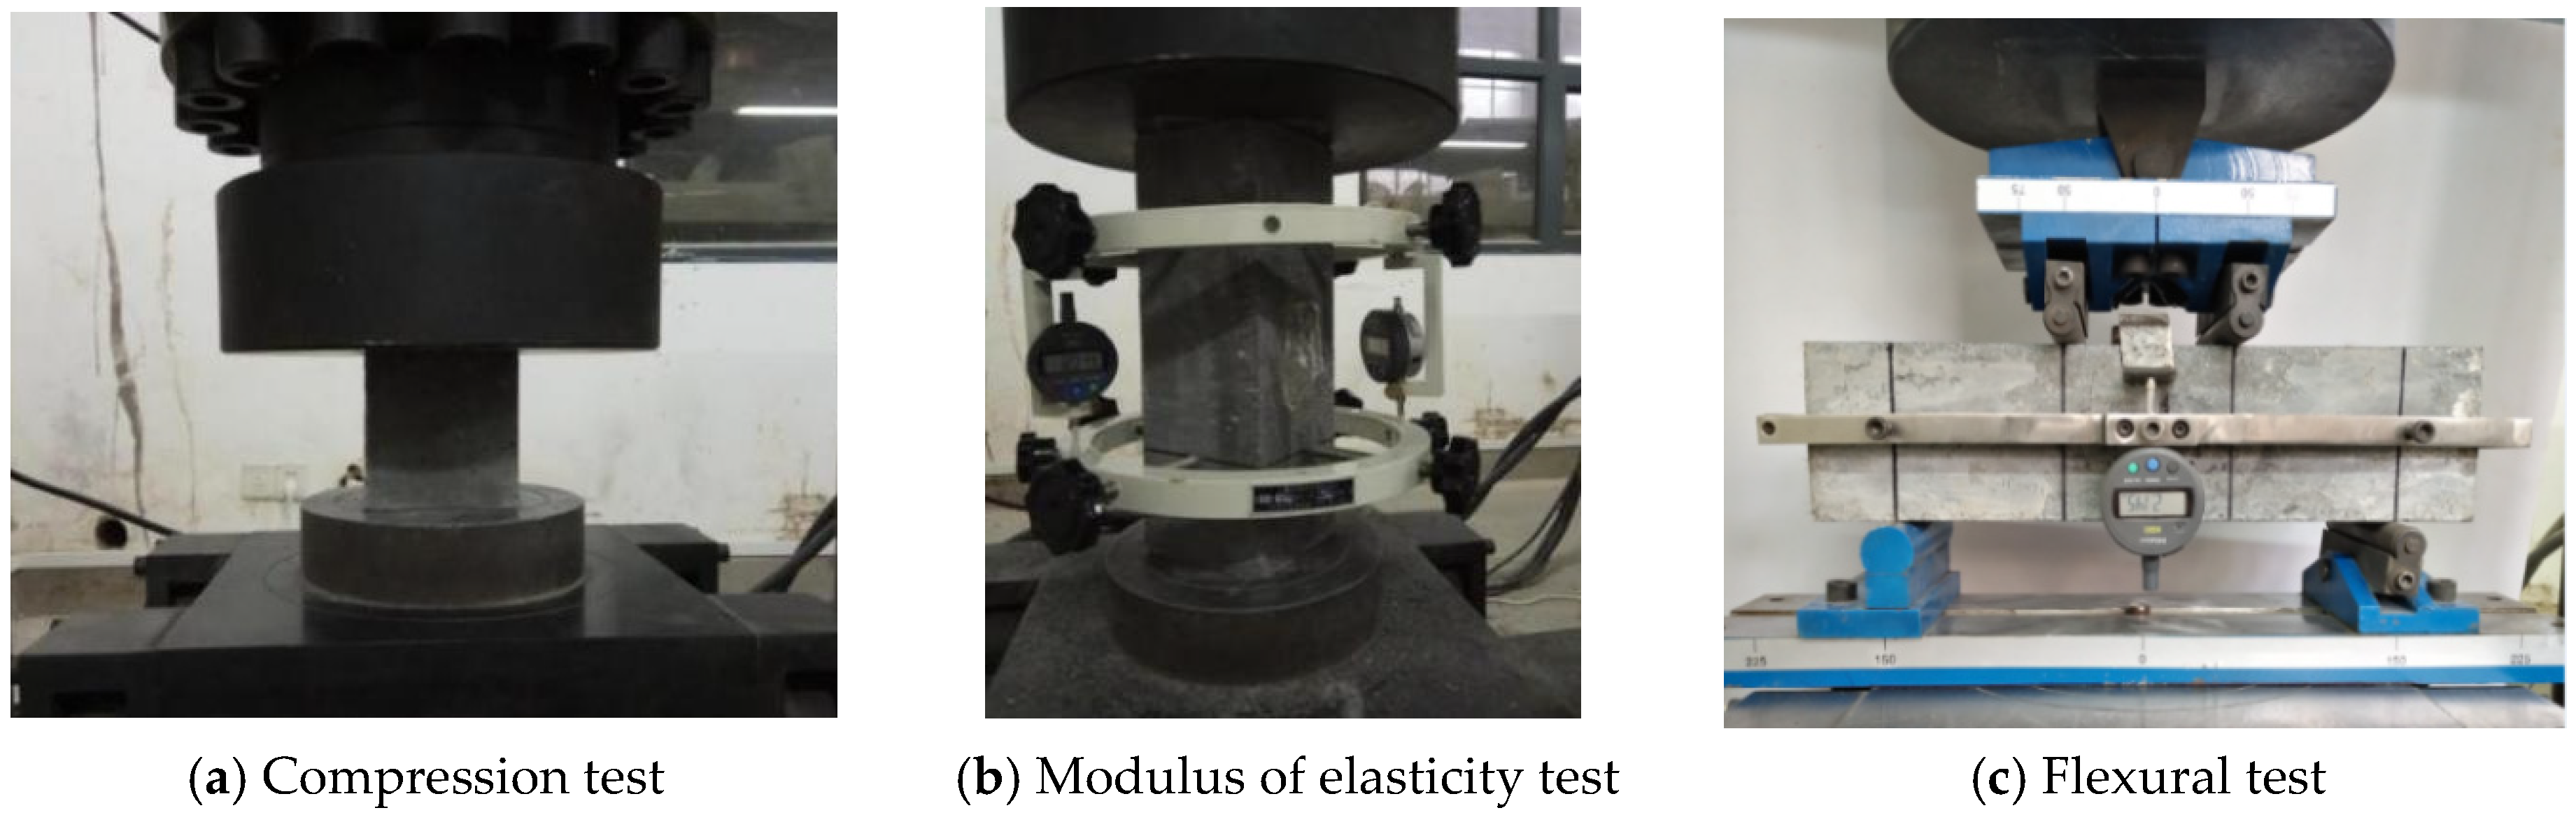
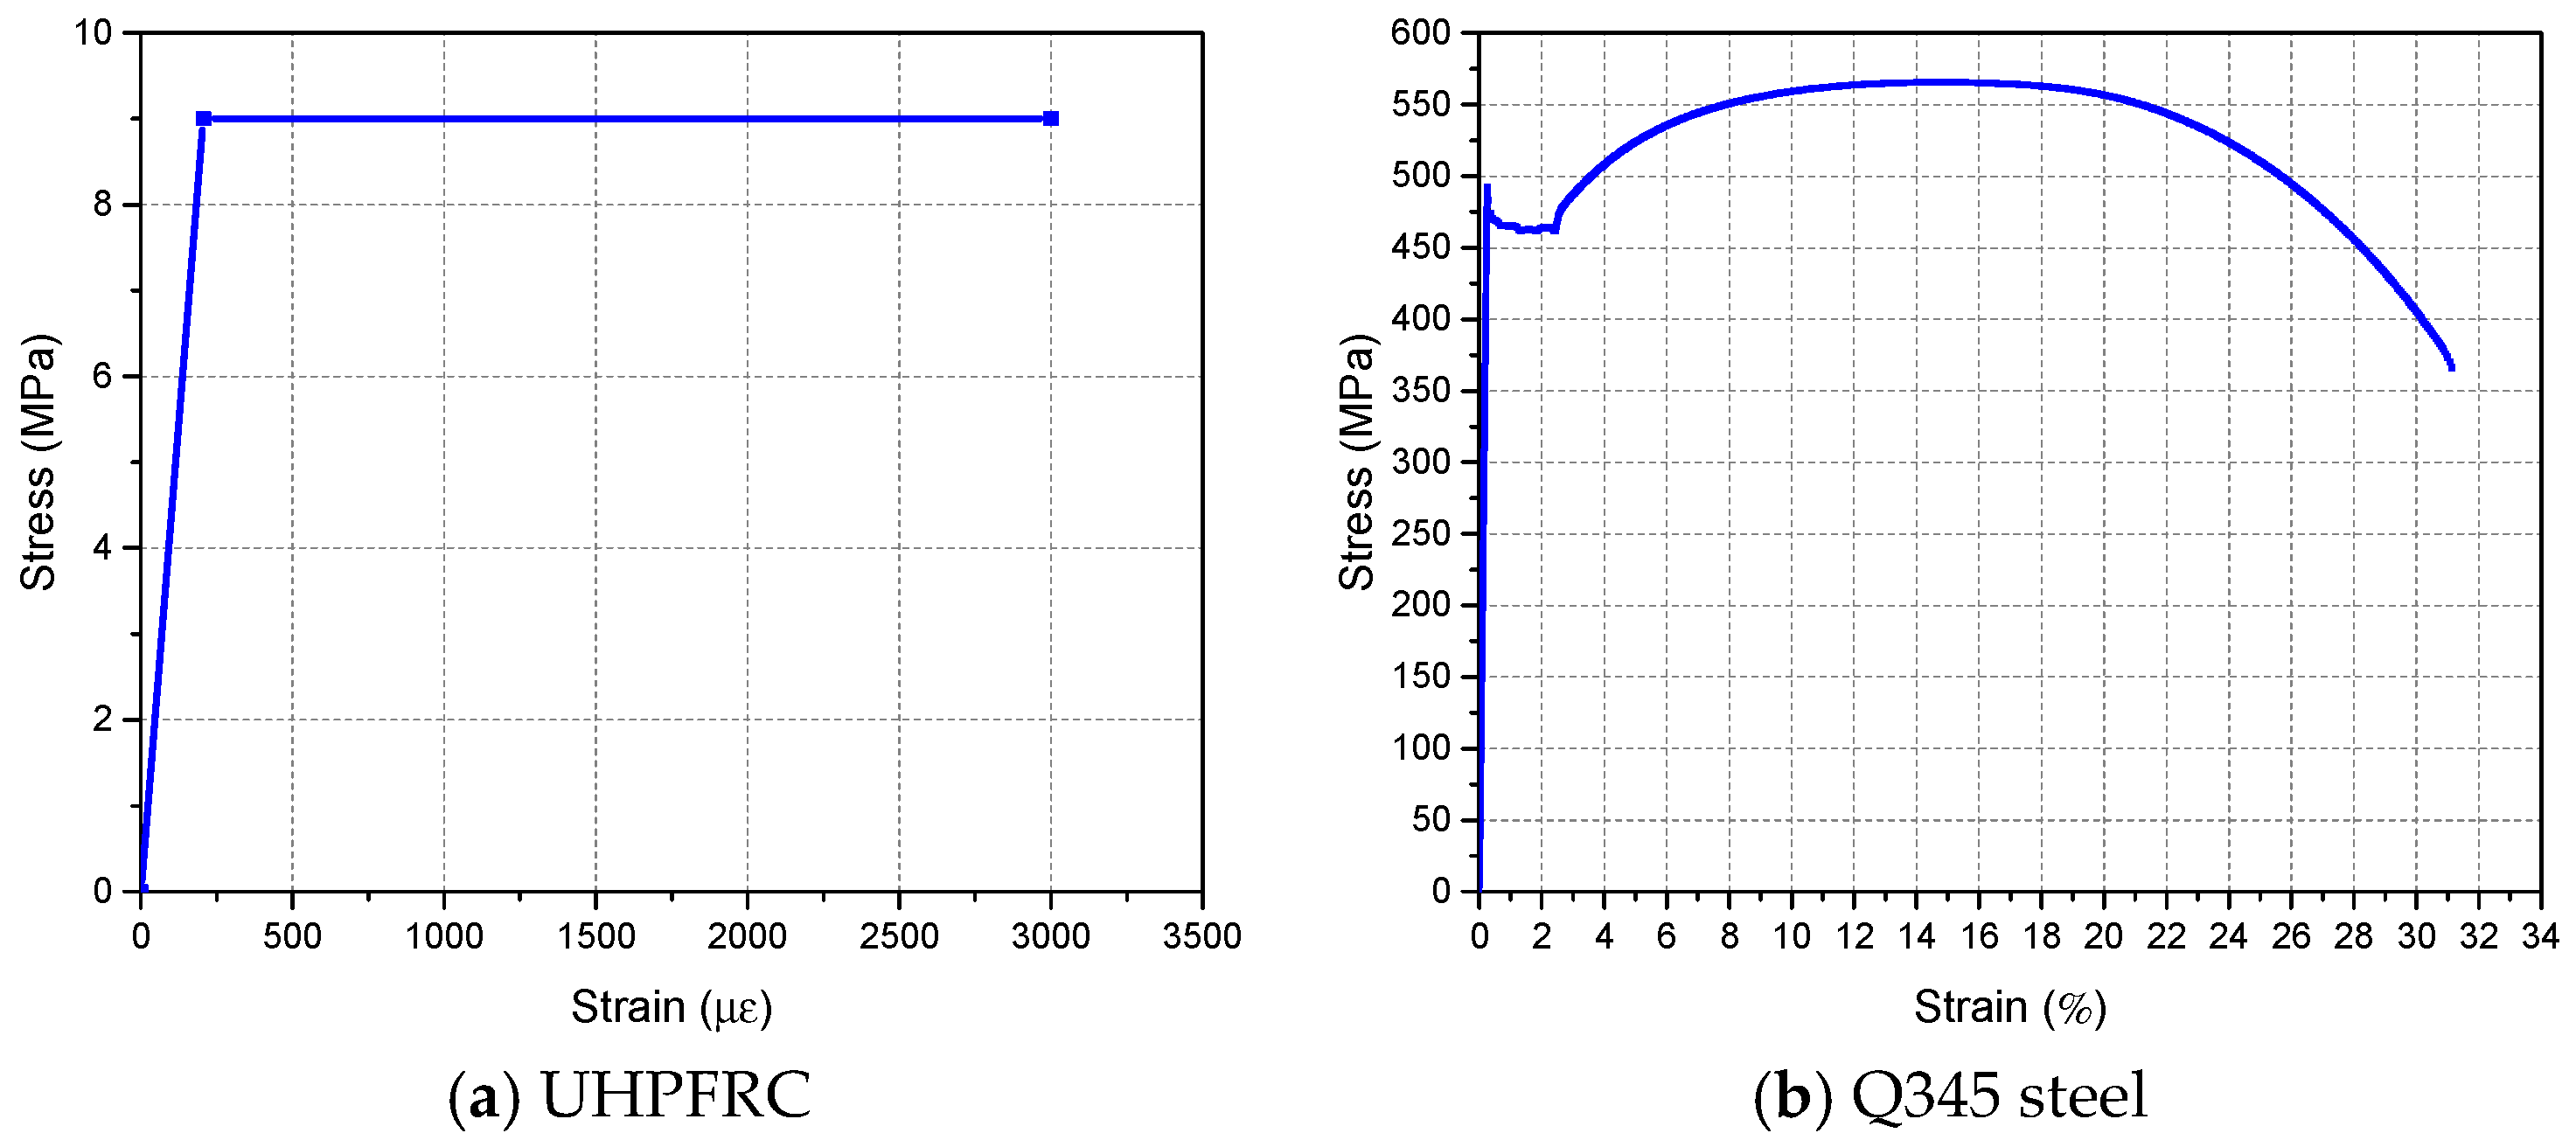
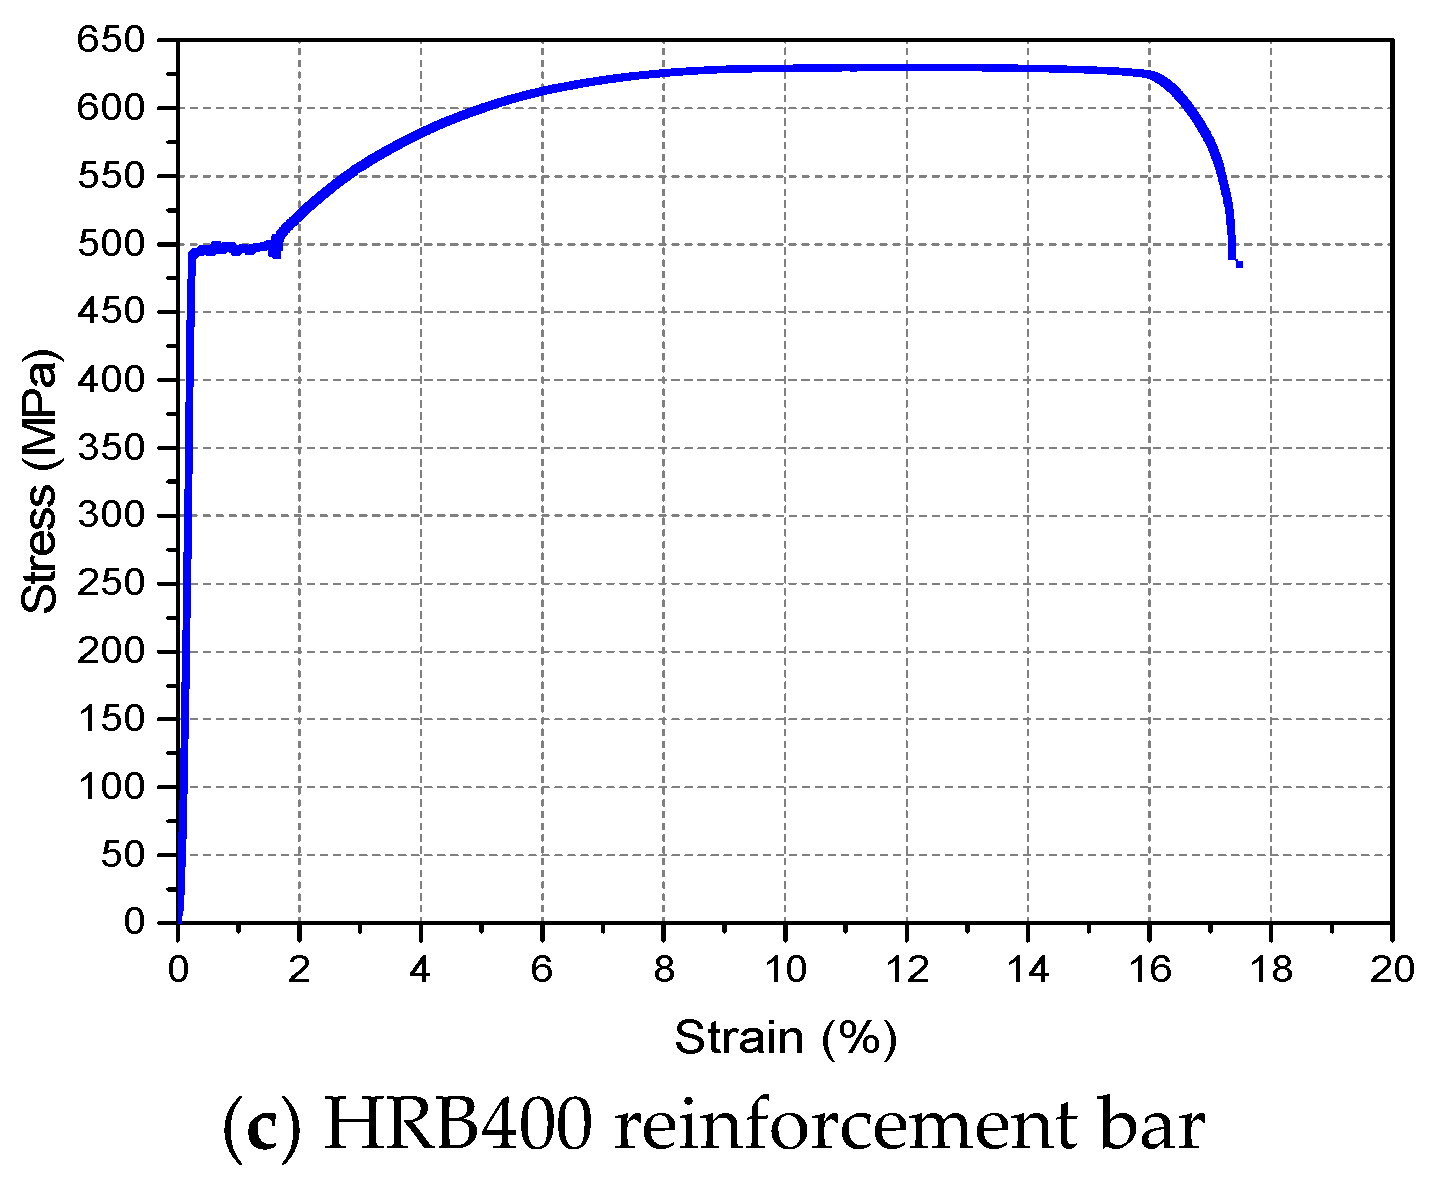
3.2. Materials
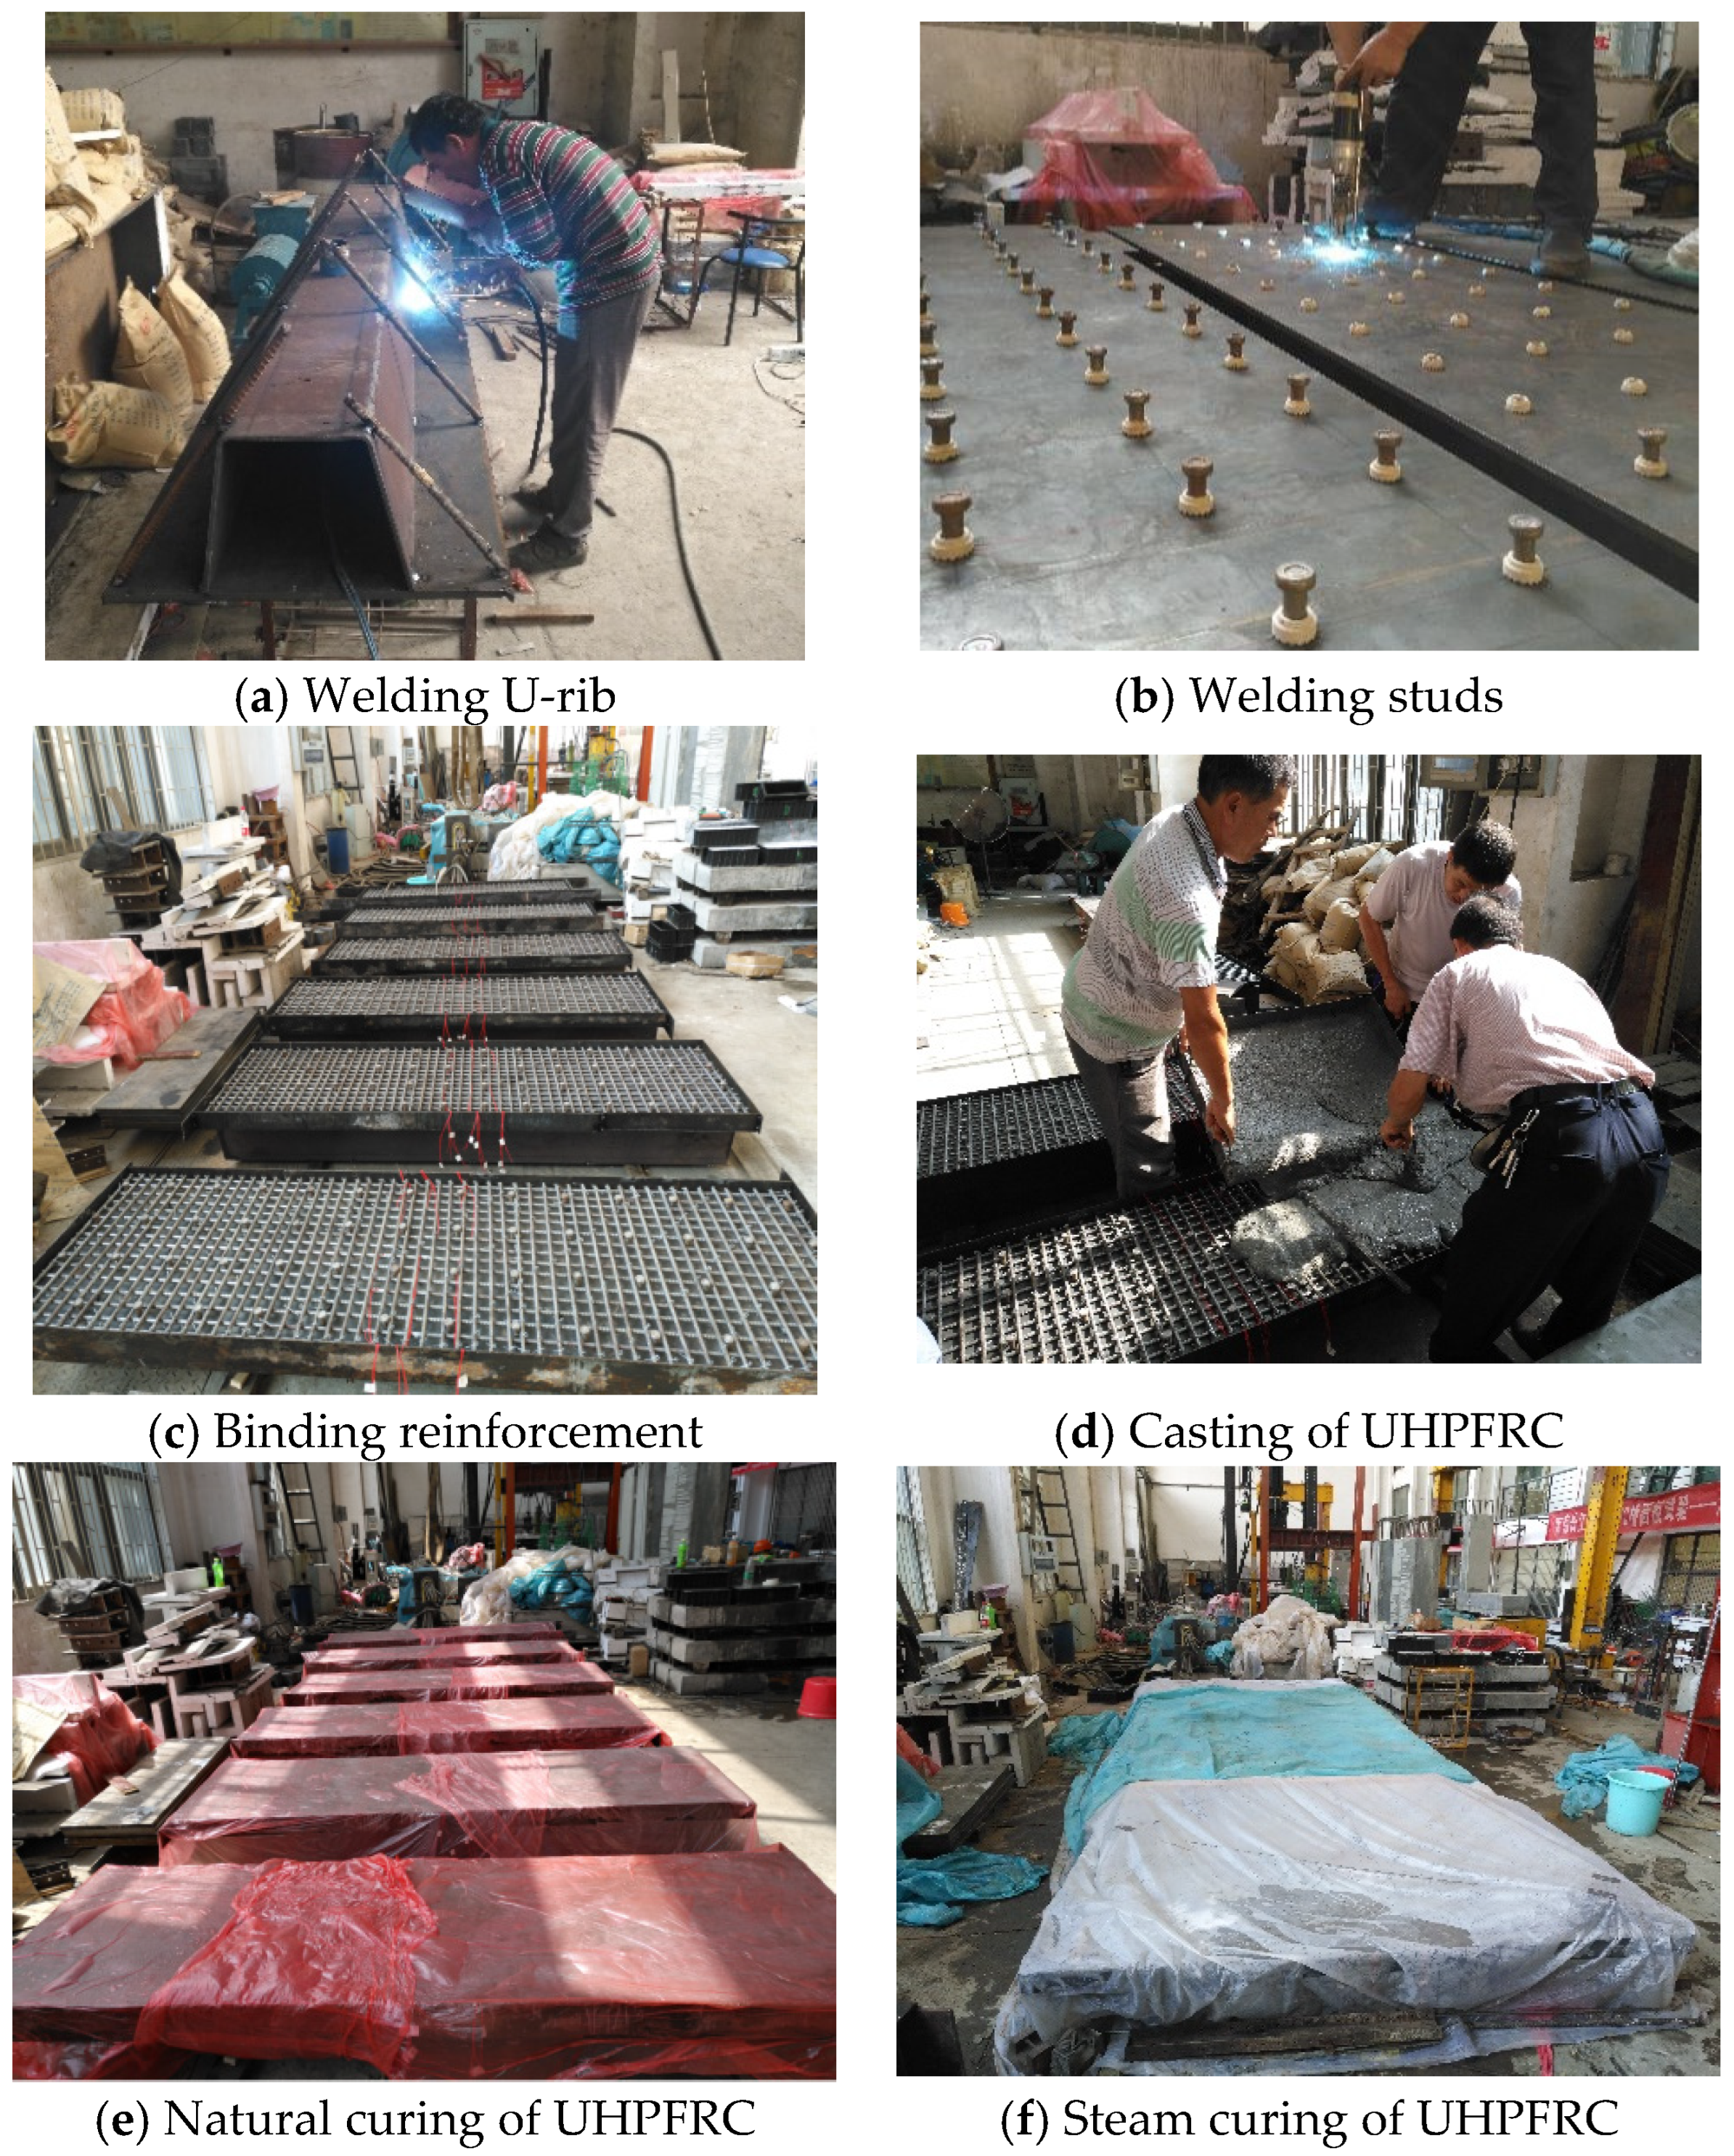
3.3. Main Fabrication Process of Steel-UHPFRC Composite Specimens
4. Longitudinal Bending Tests of the LWCD
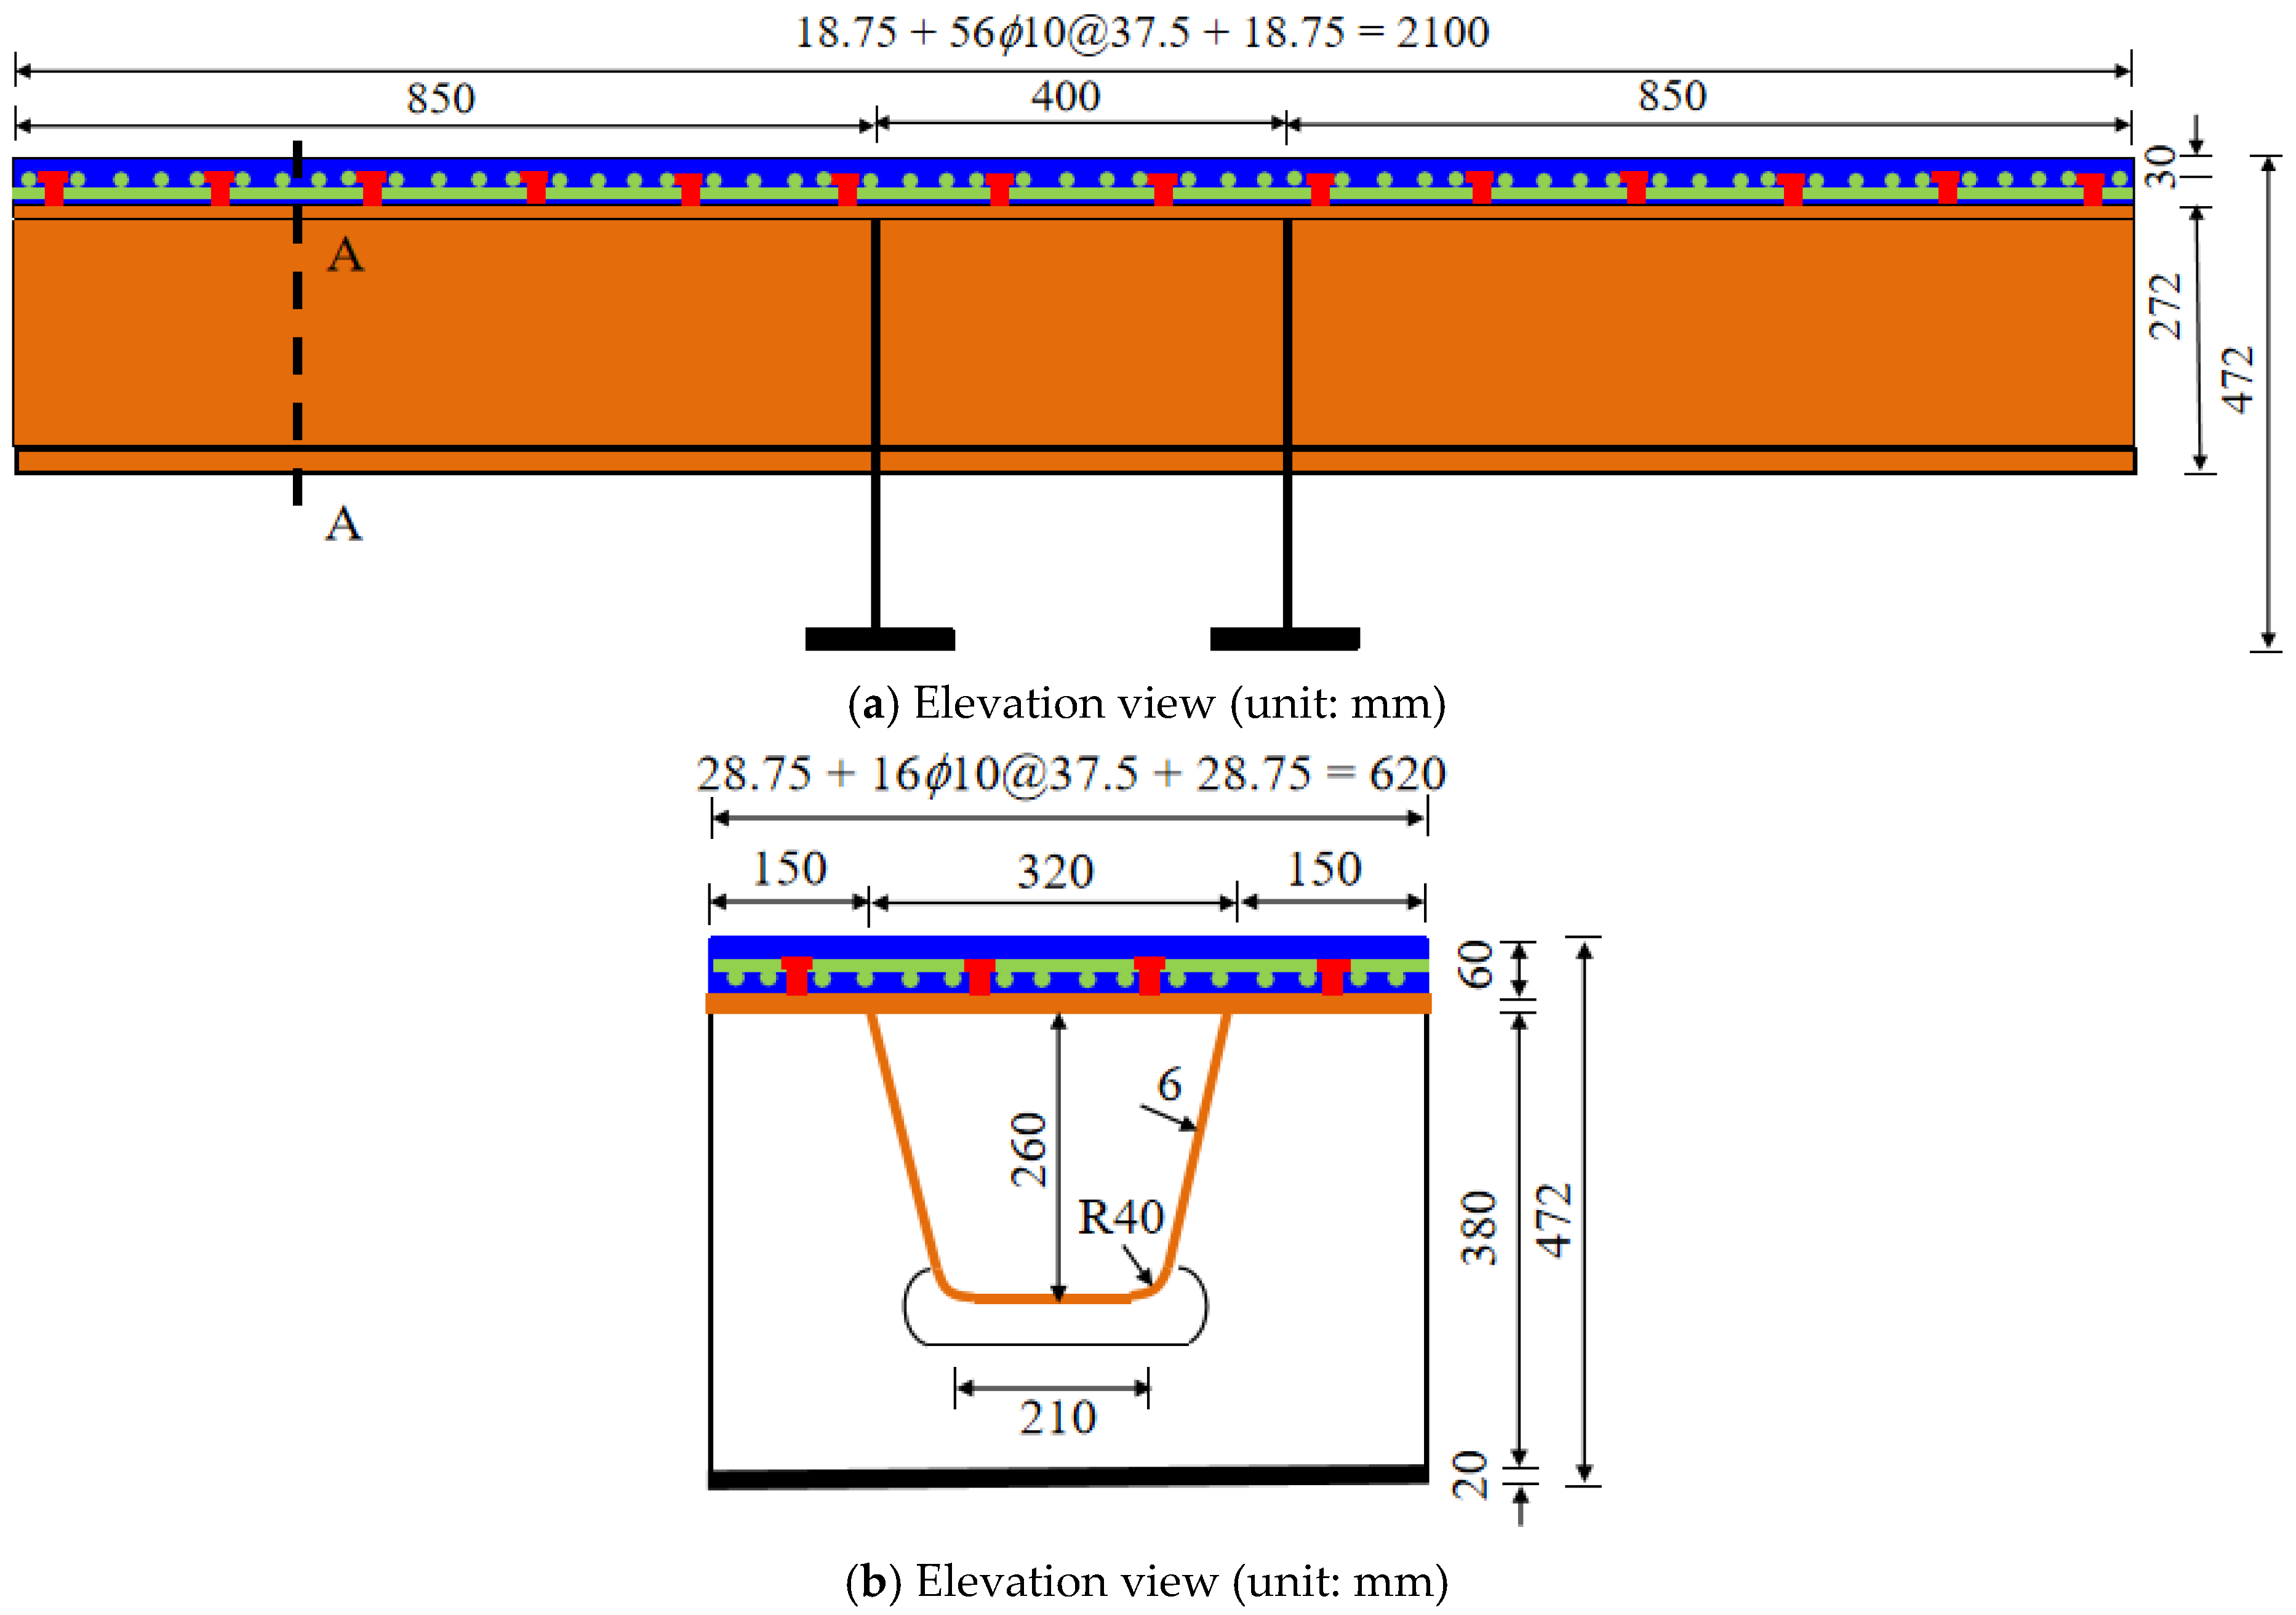
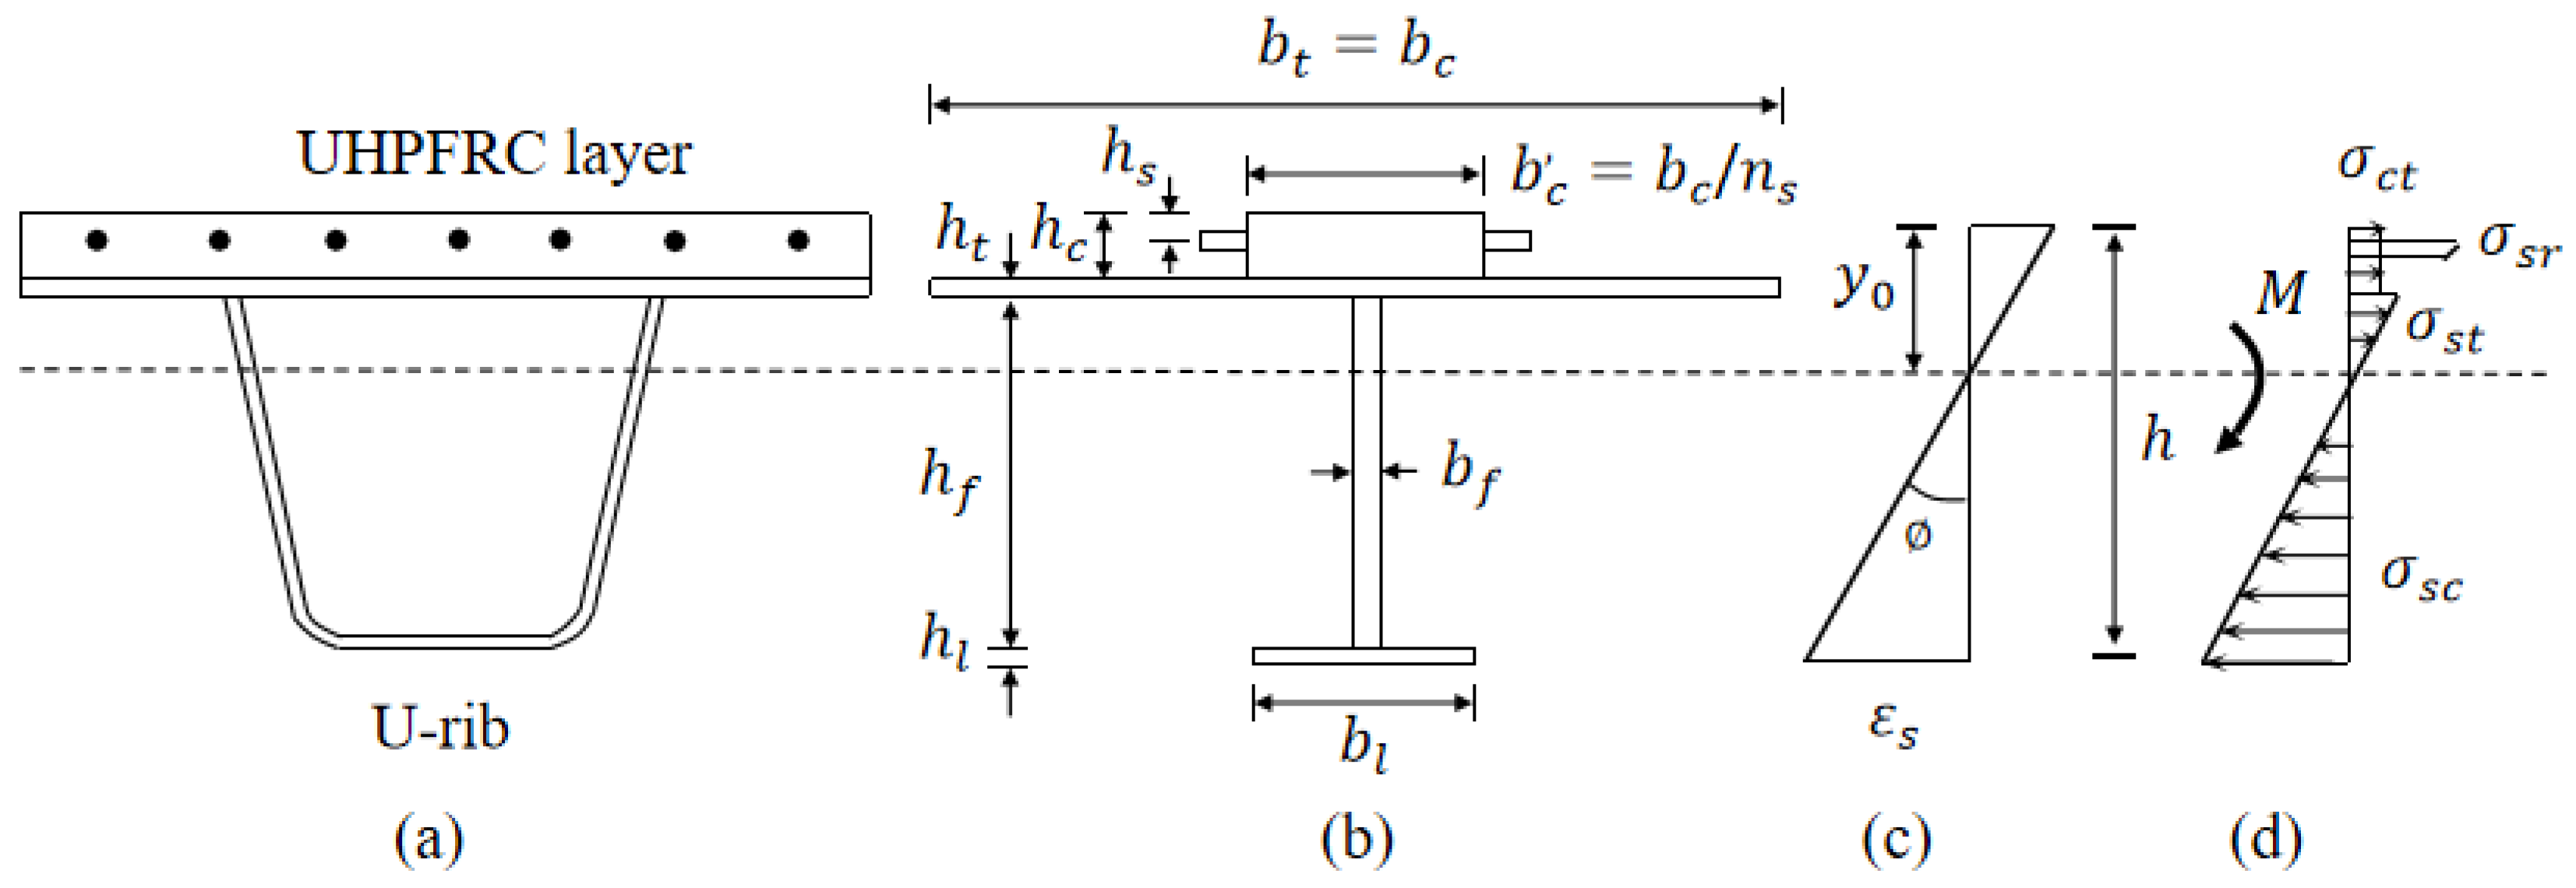
4.1. Design of Full-Scale Steel-UHPFRC Composite Beams
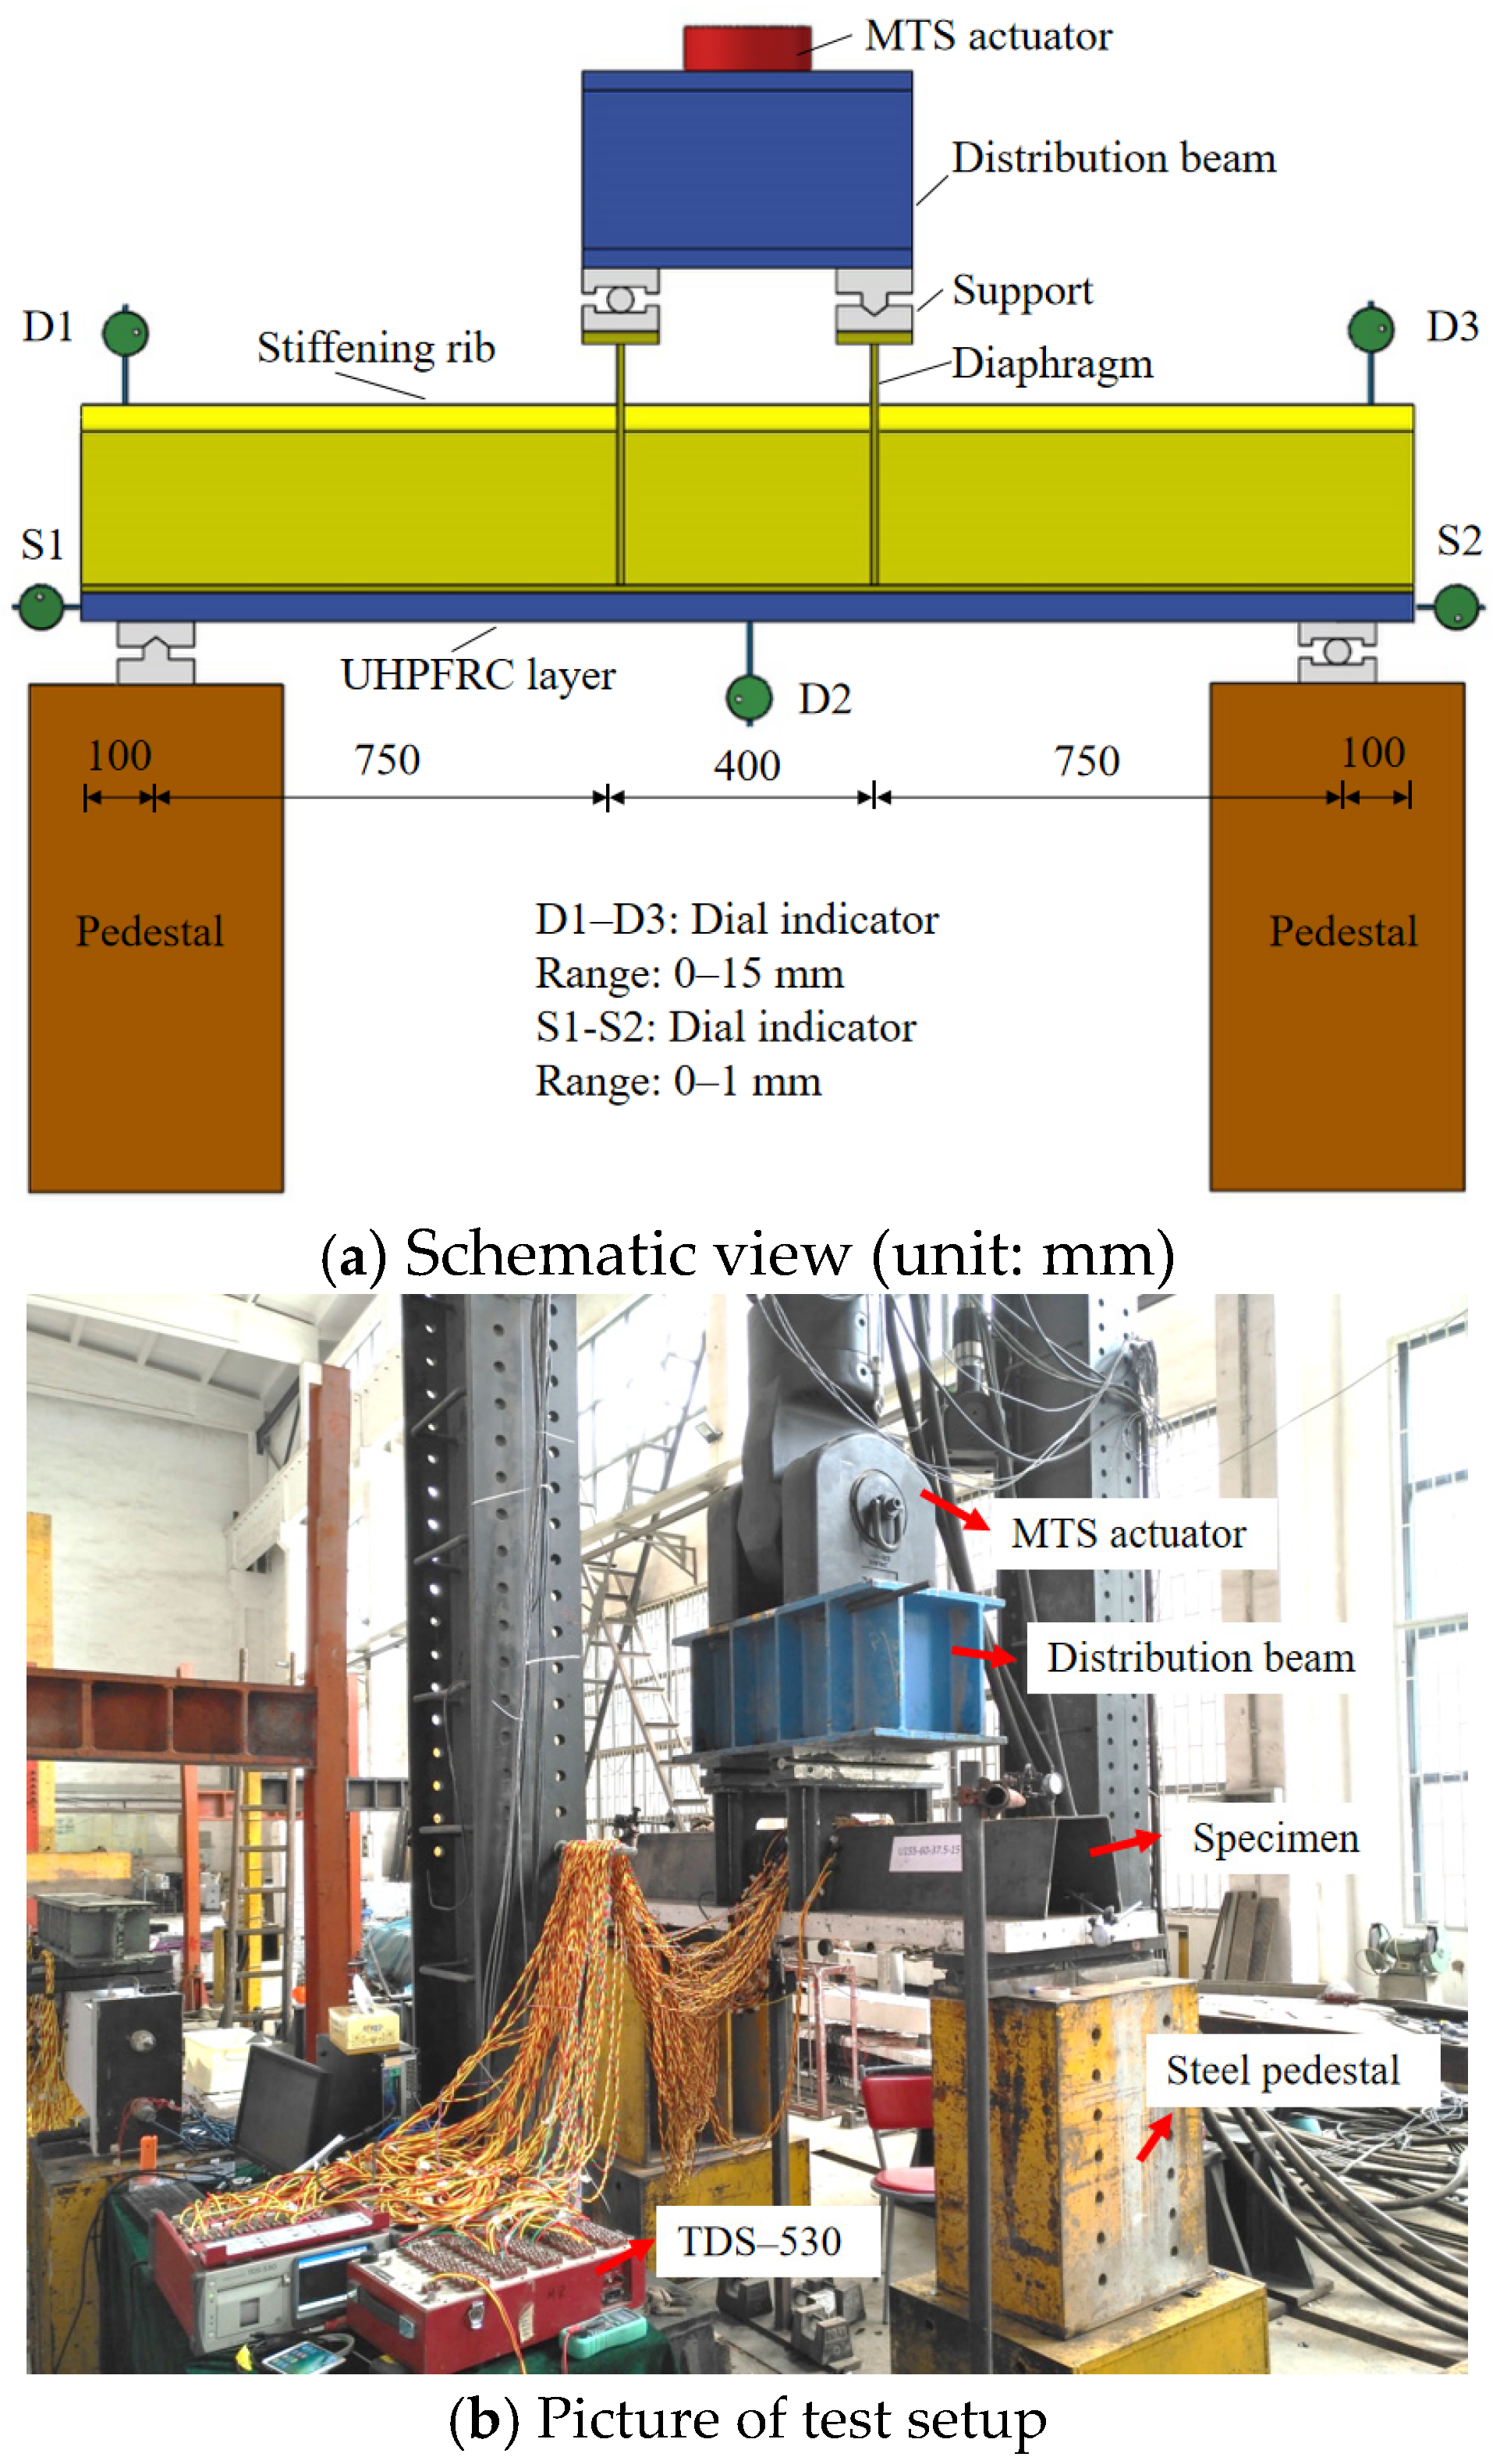
4.2. Loading Scheme and Test Contents
4.3. Experimental Results and Discussion
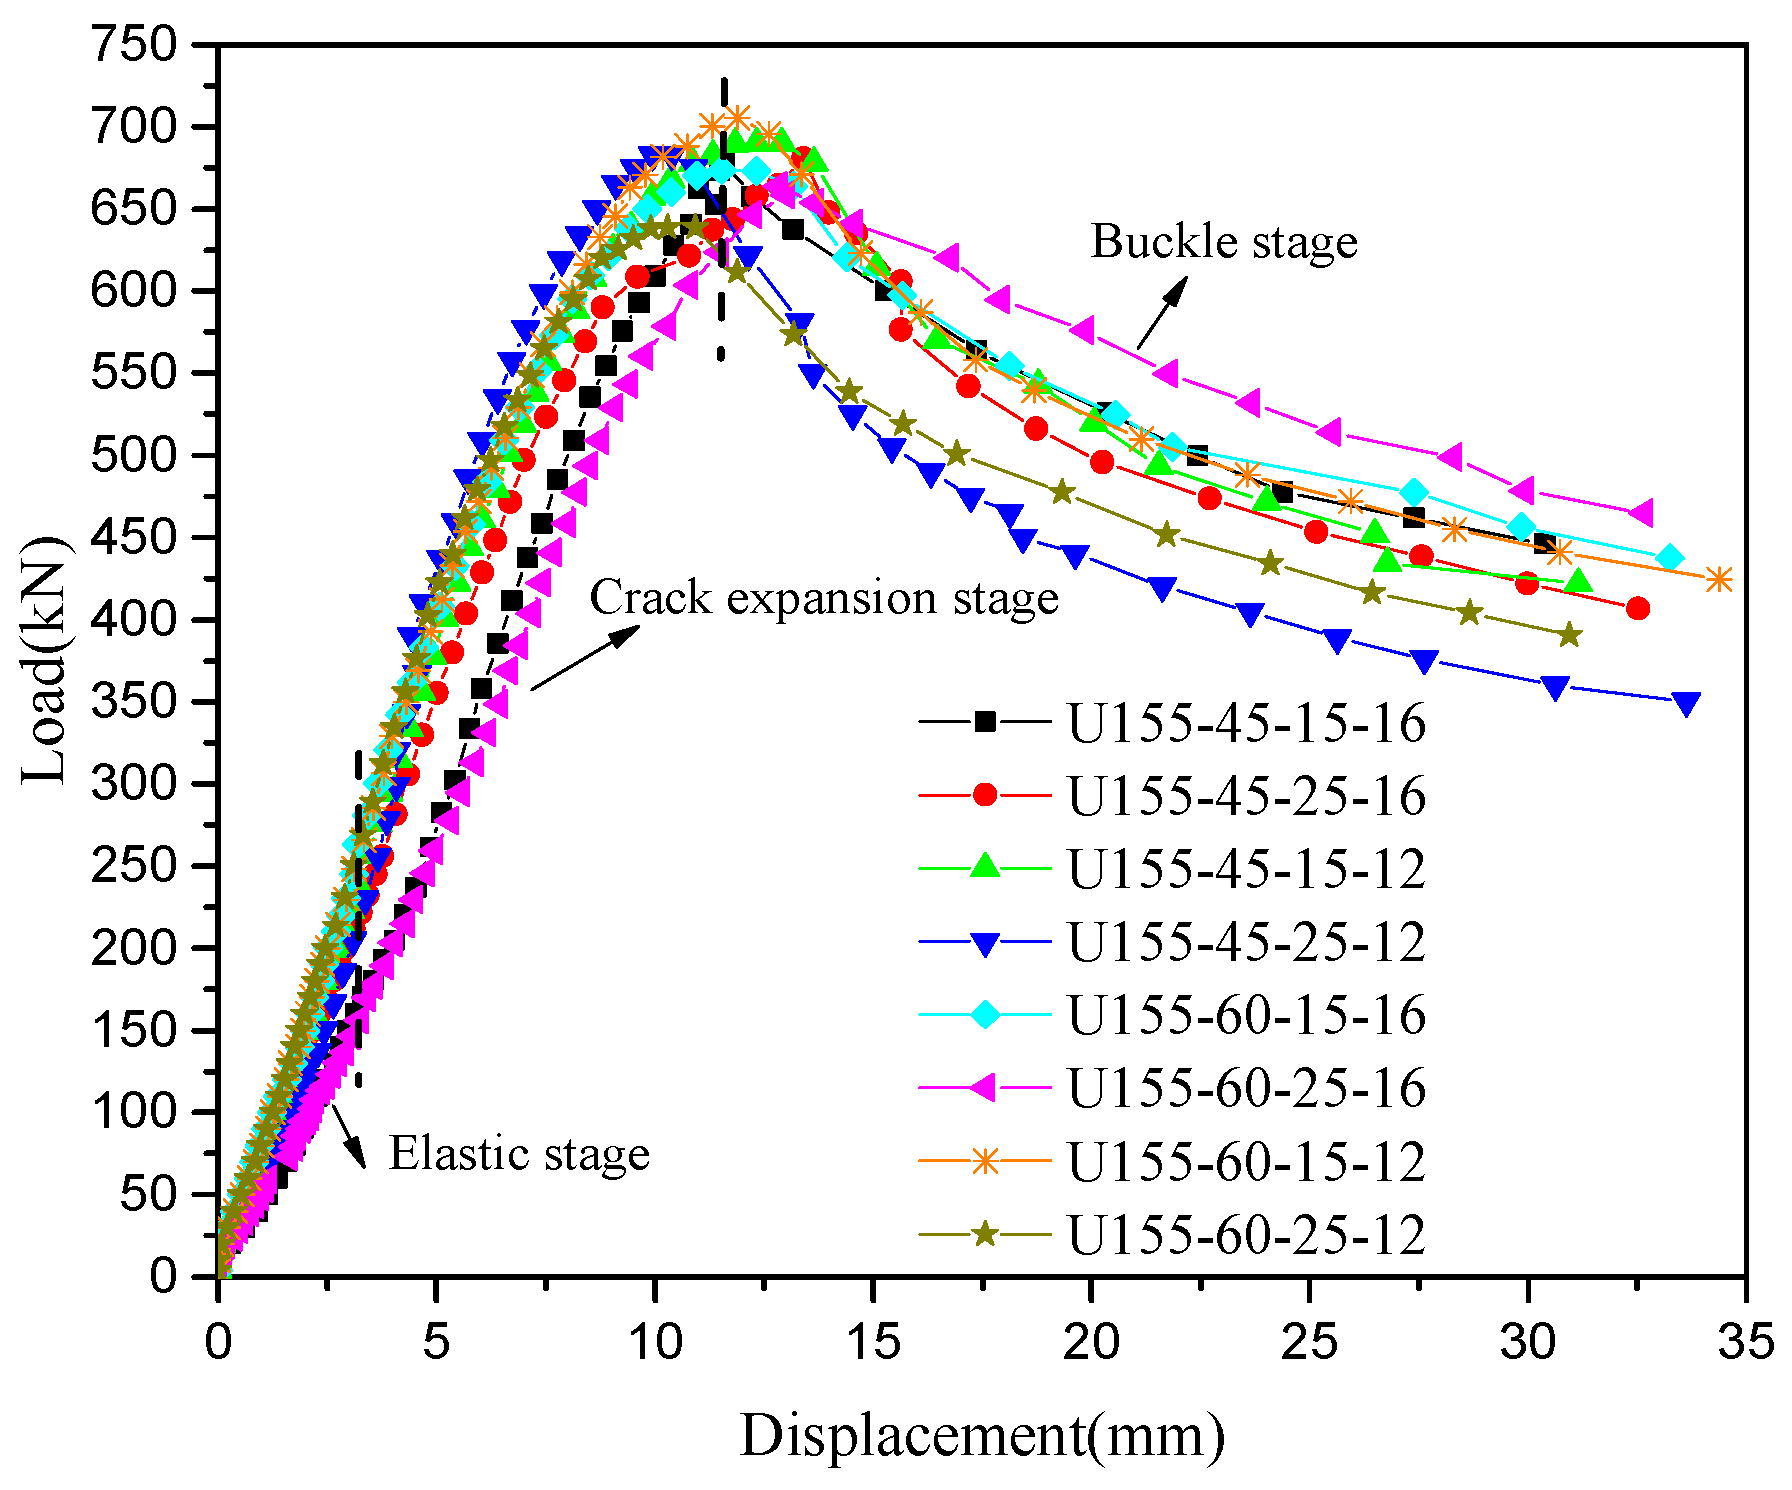
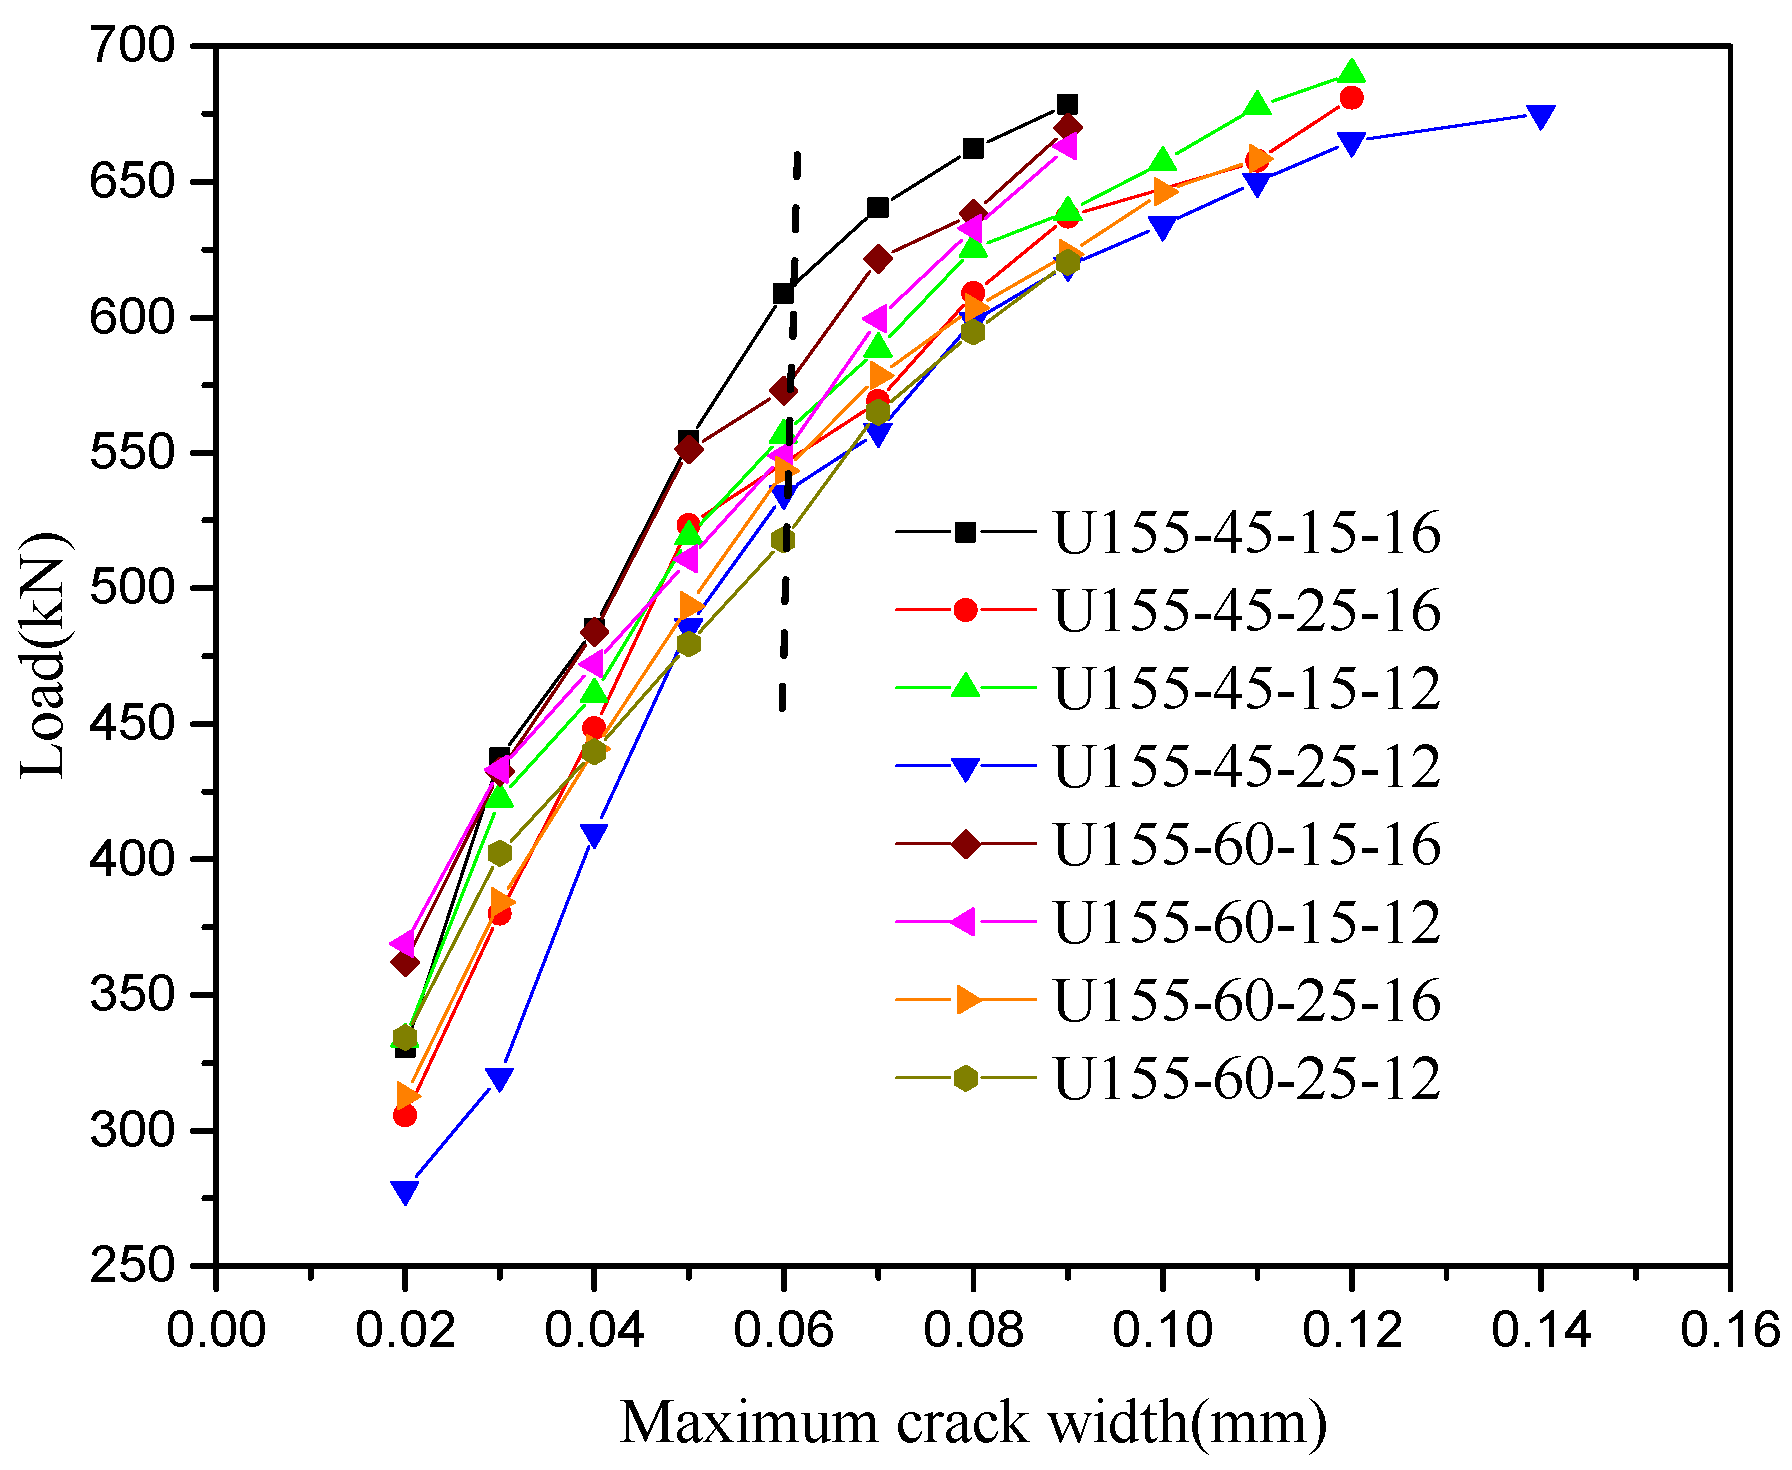
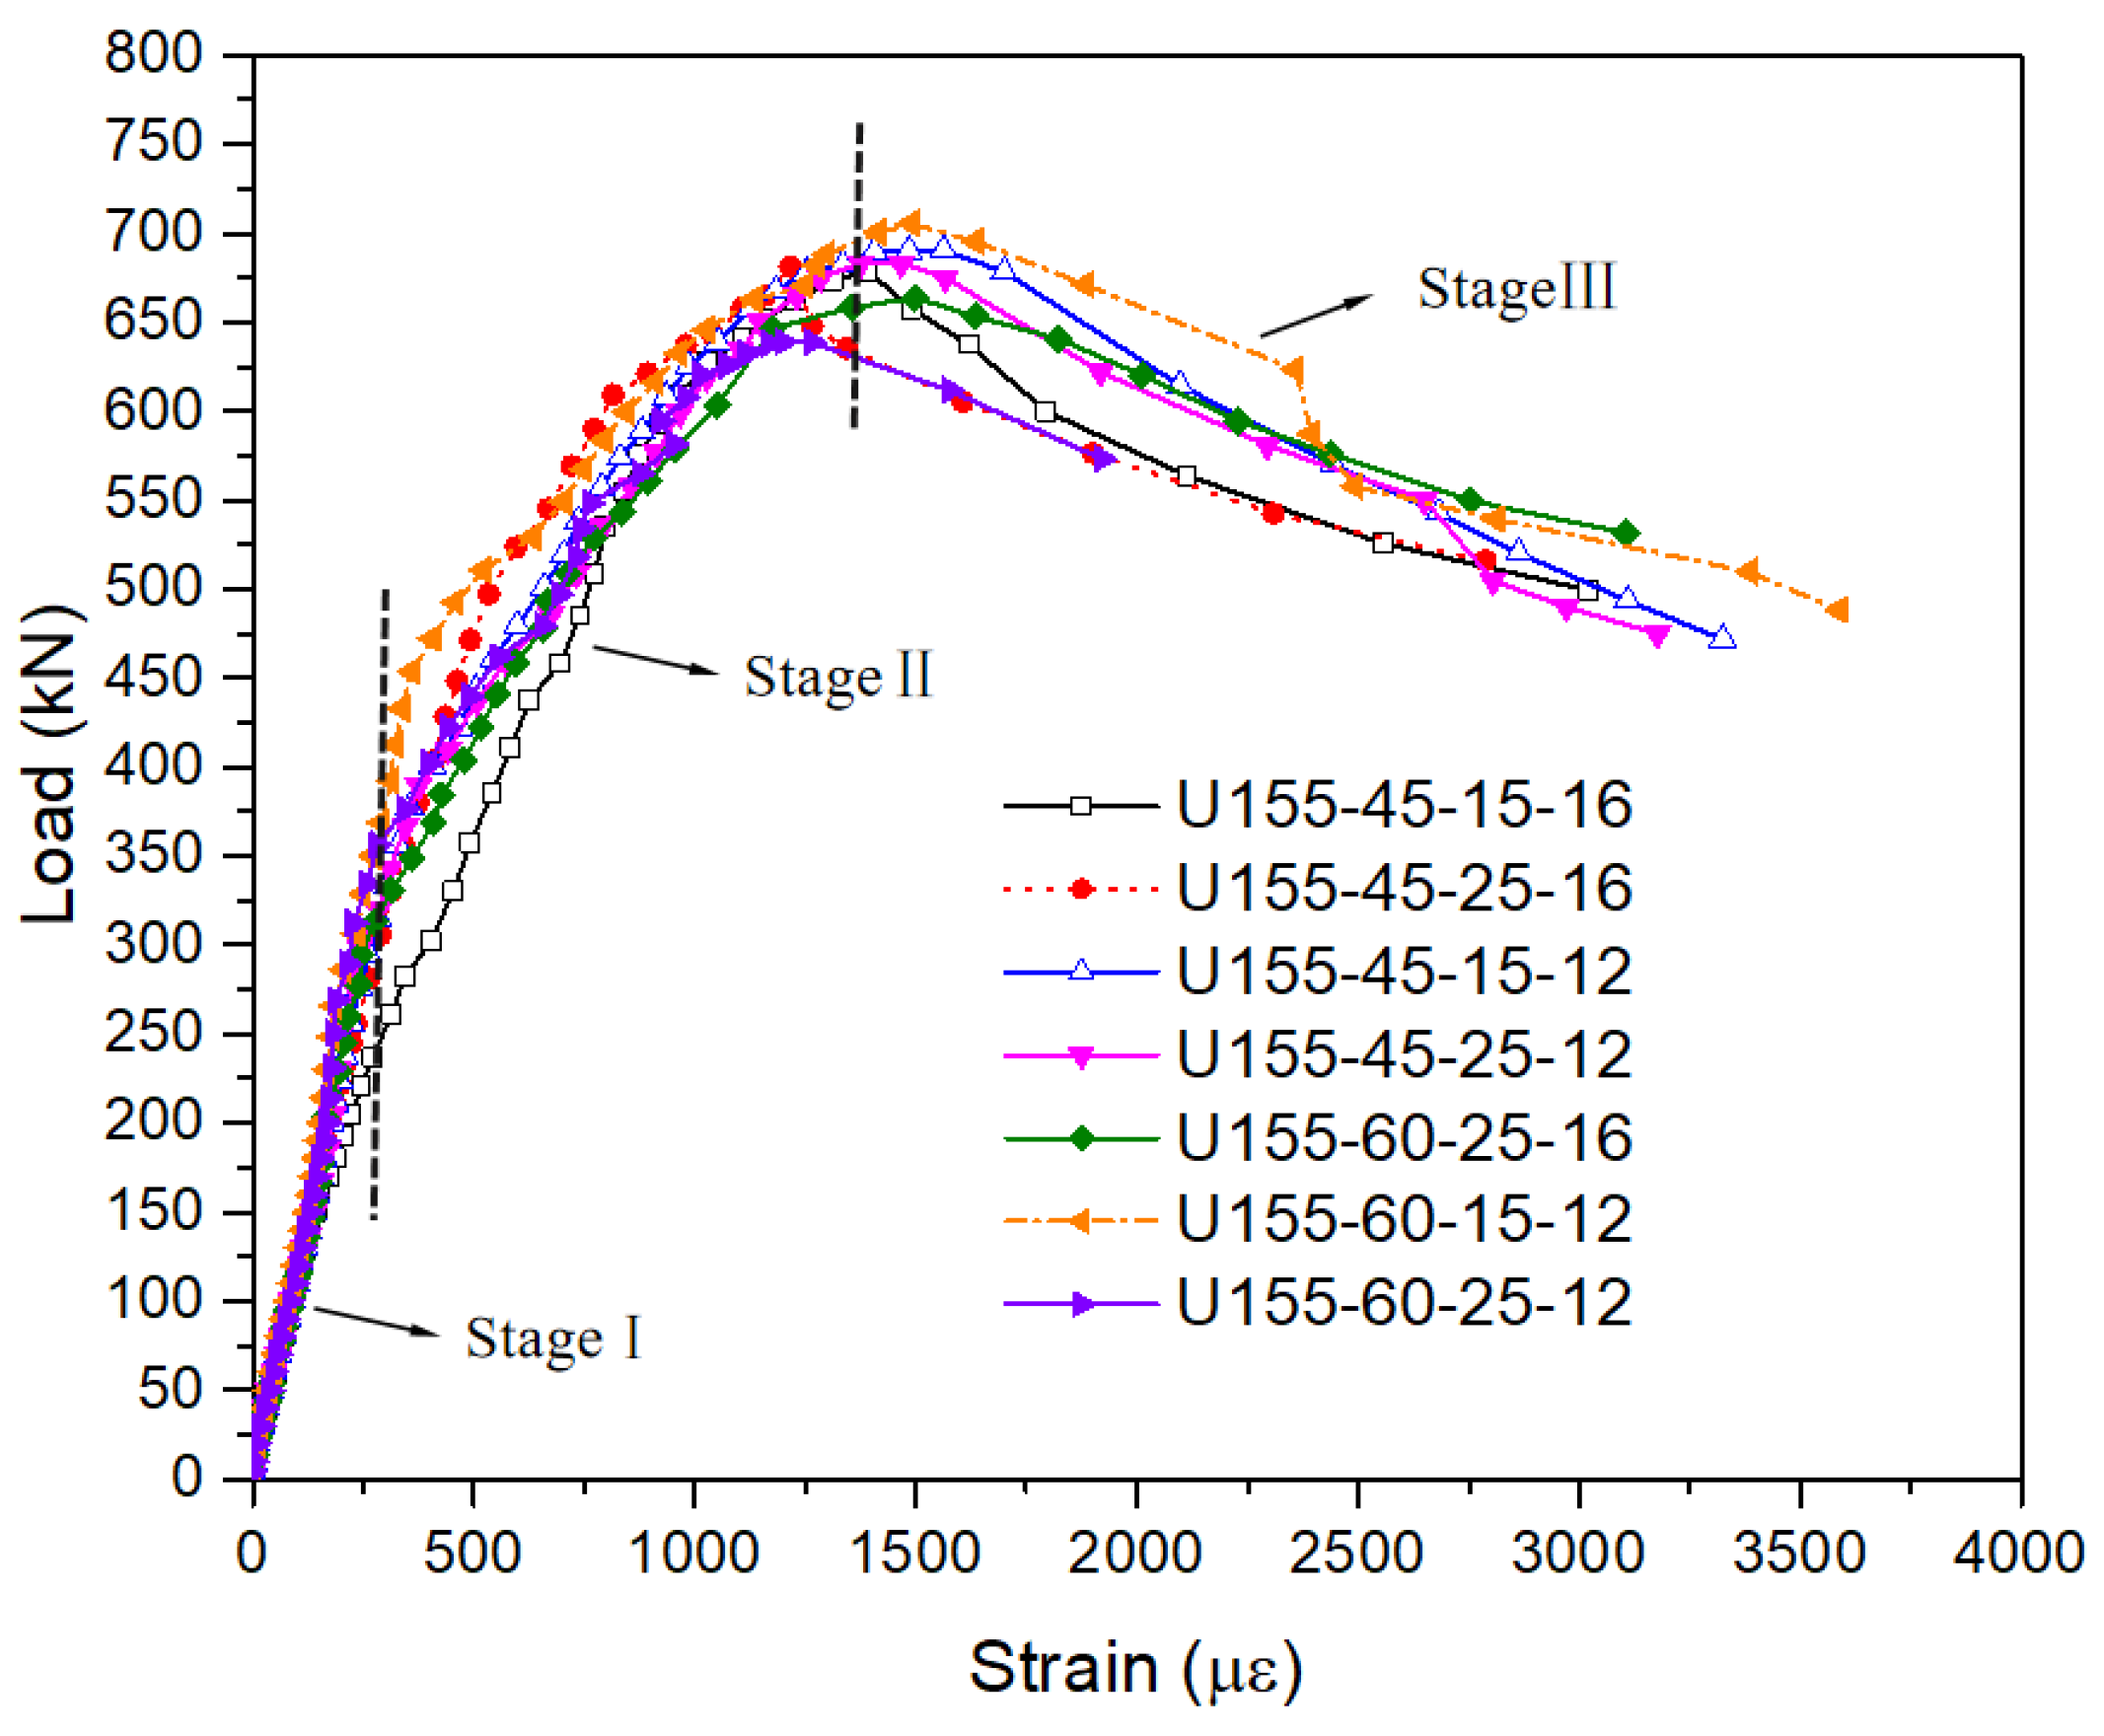
4.3.1. Force-Midspan Deflection Response
4.3.2. Influence of Main Design Parameters on Cracking Load
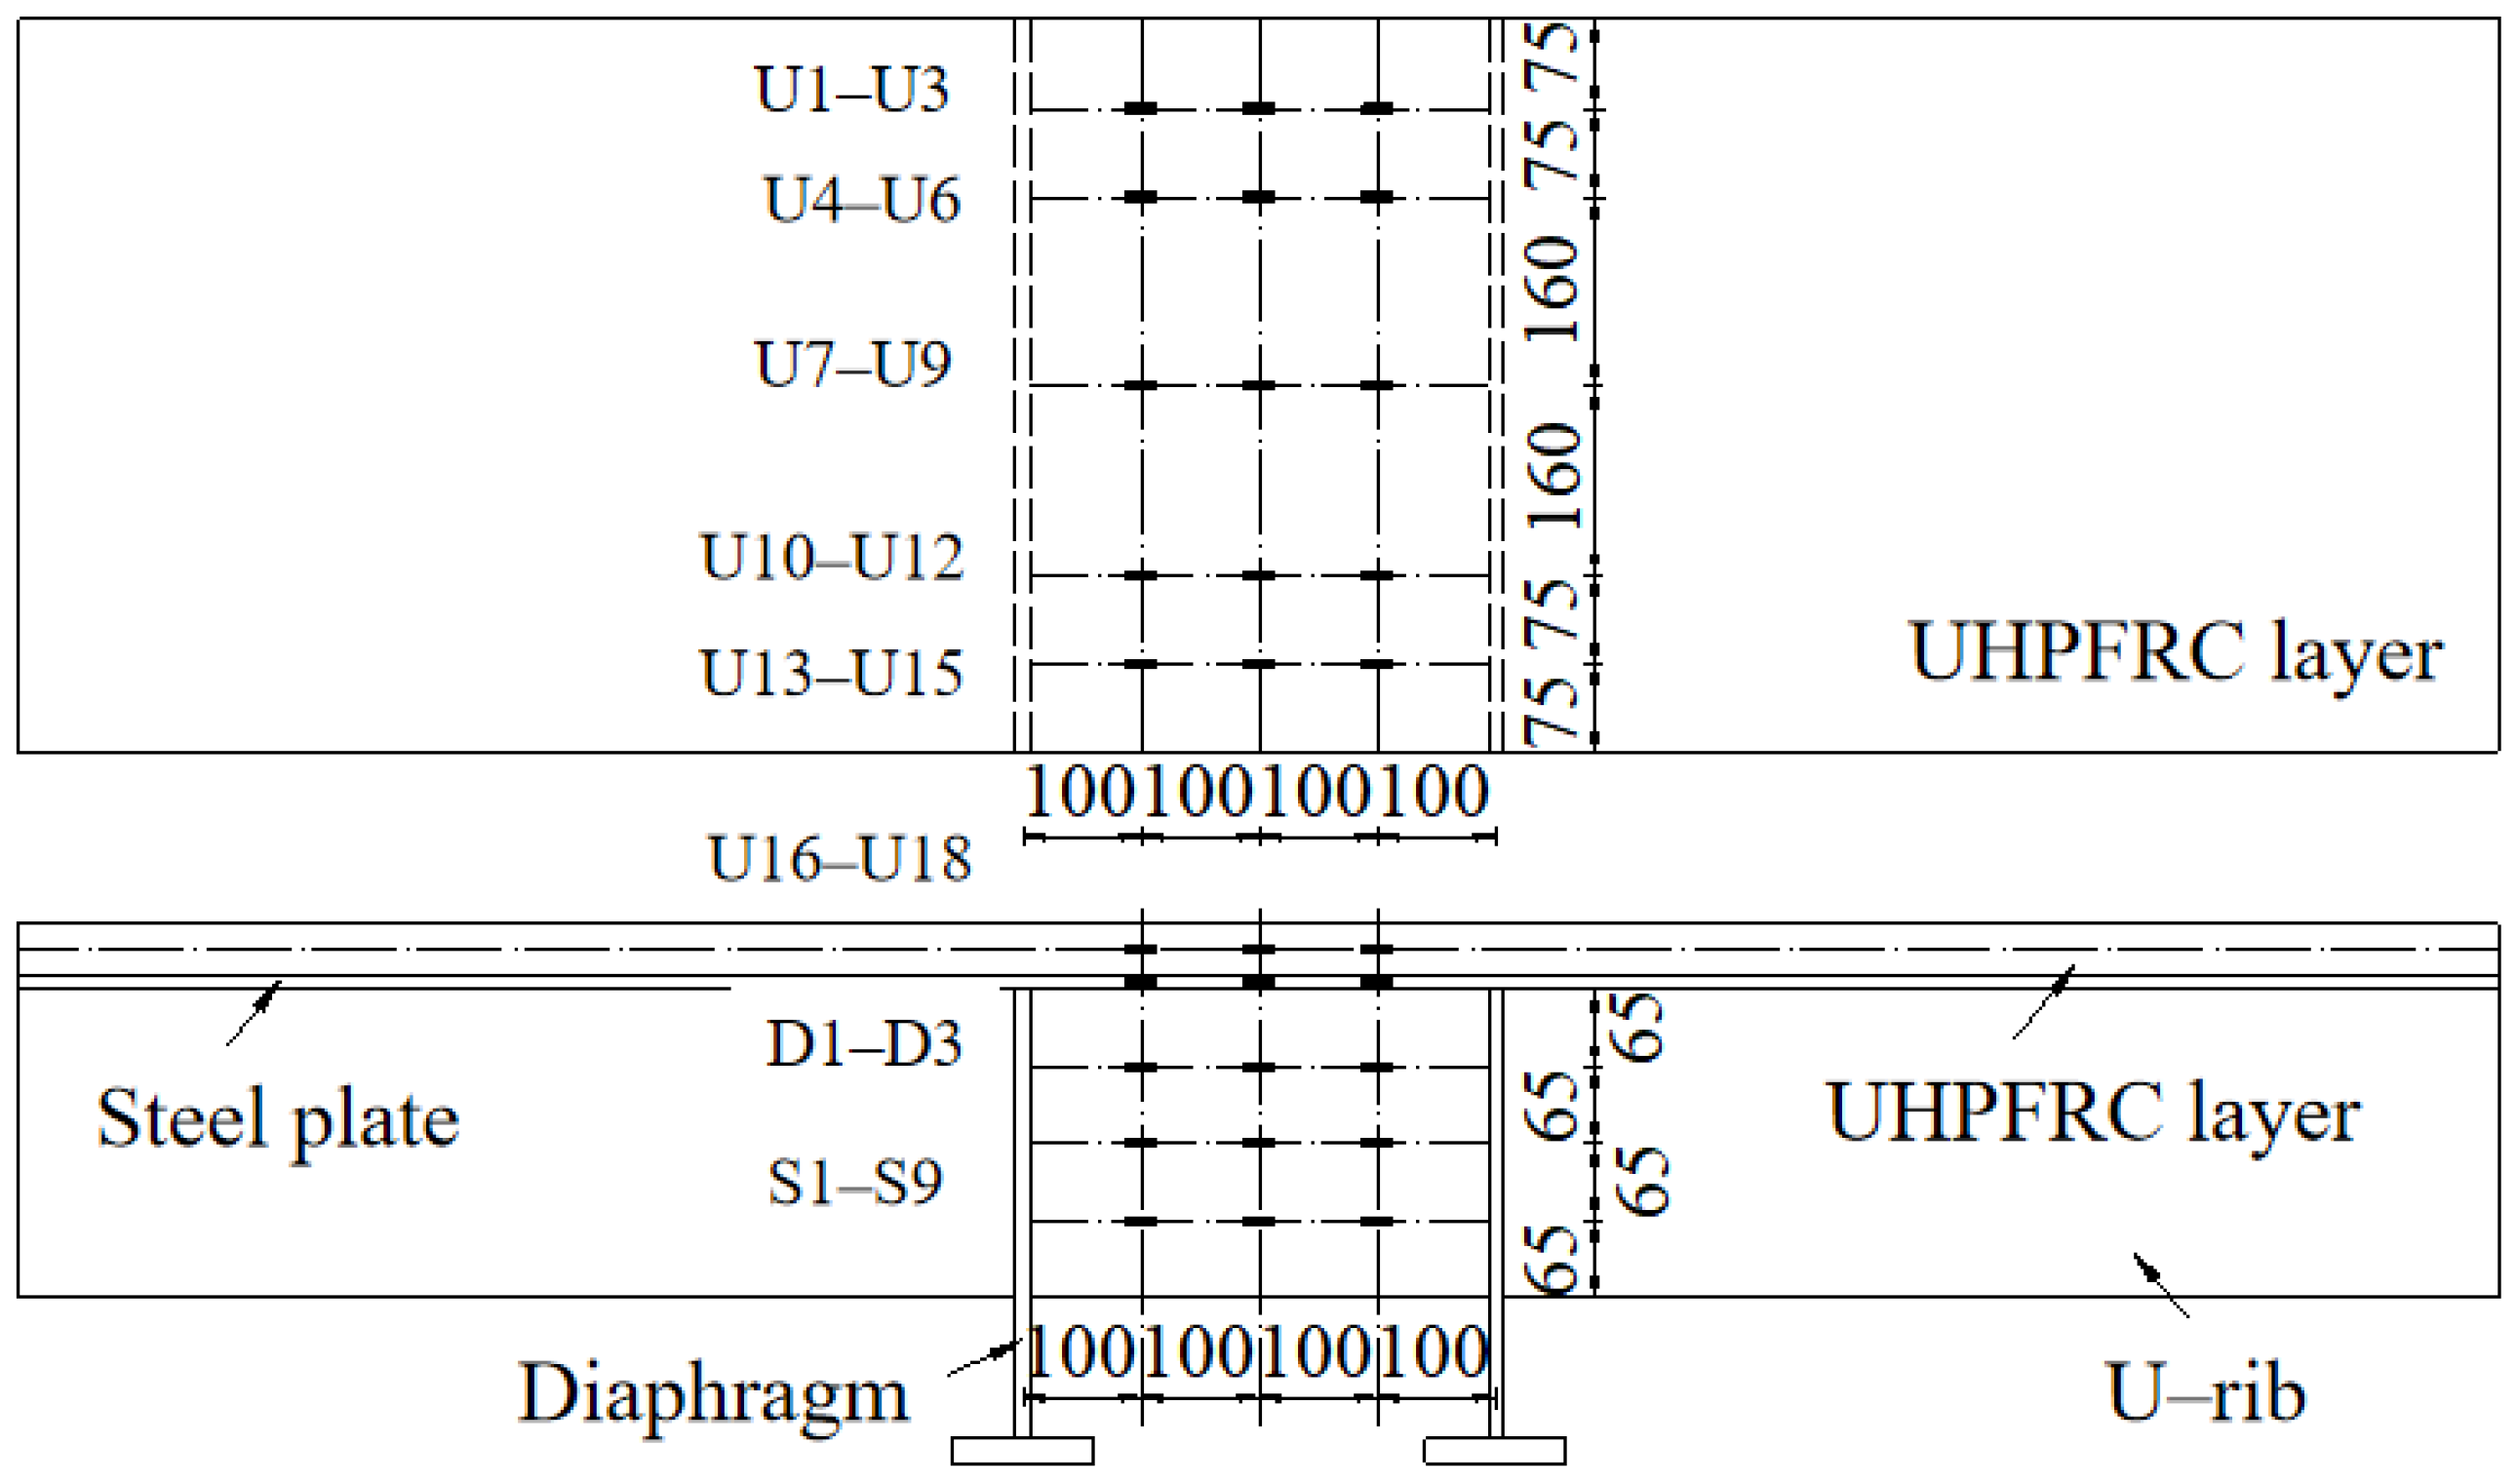
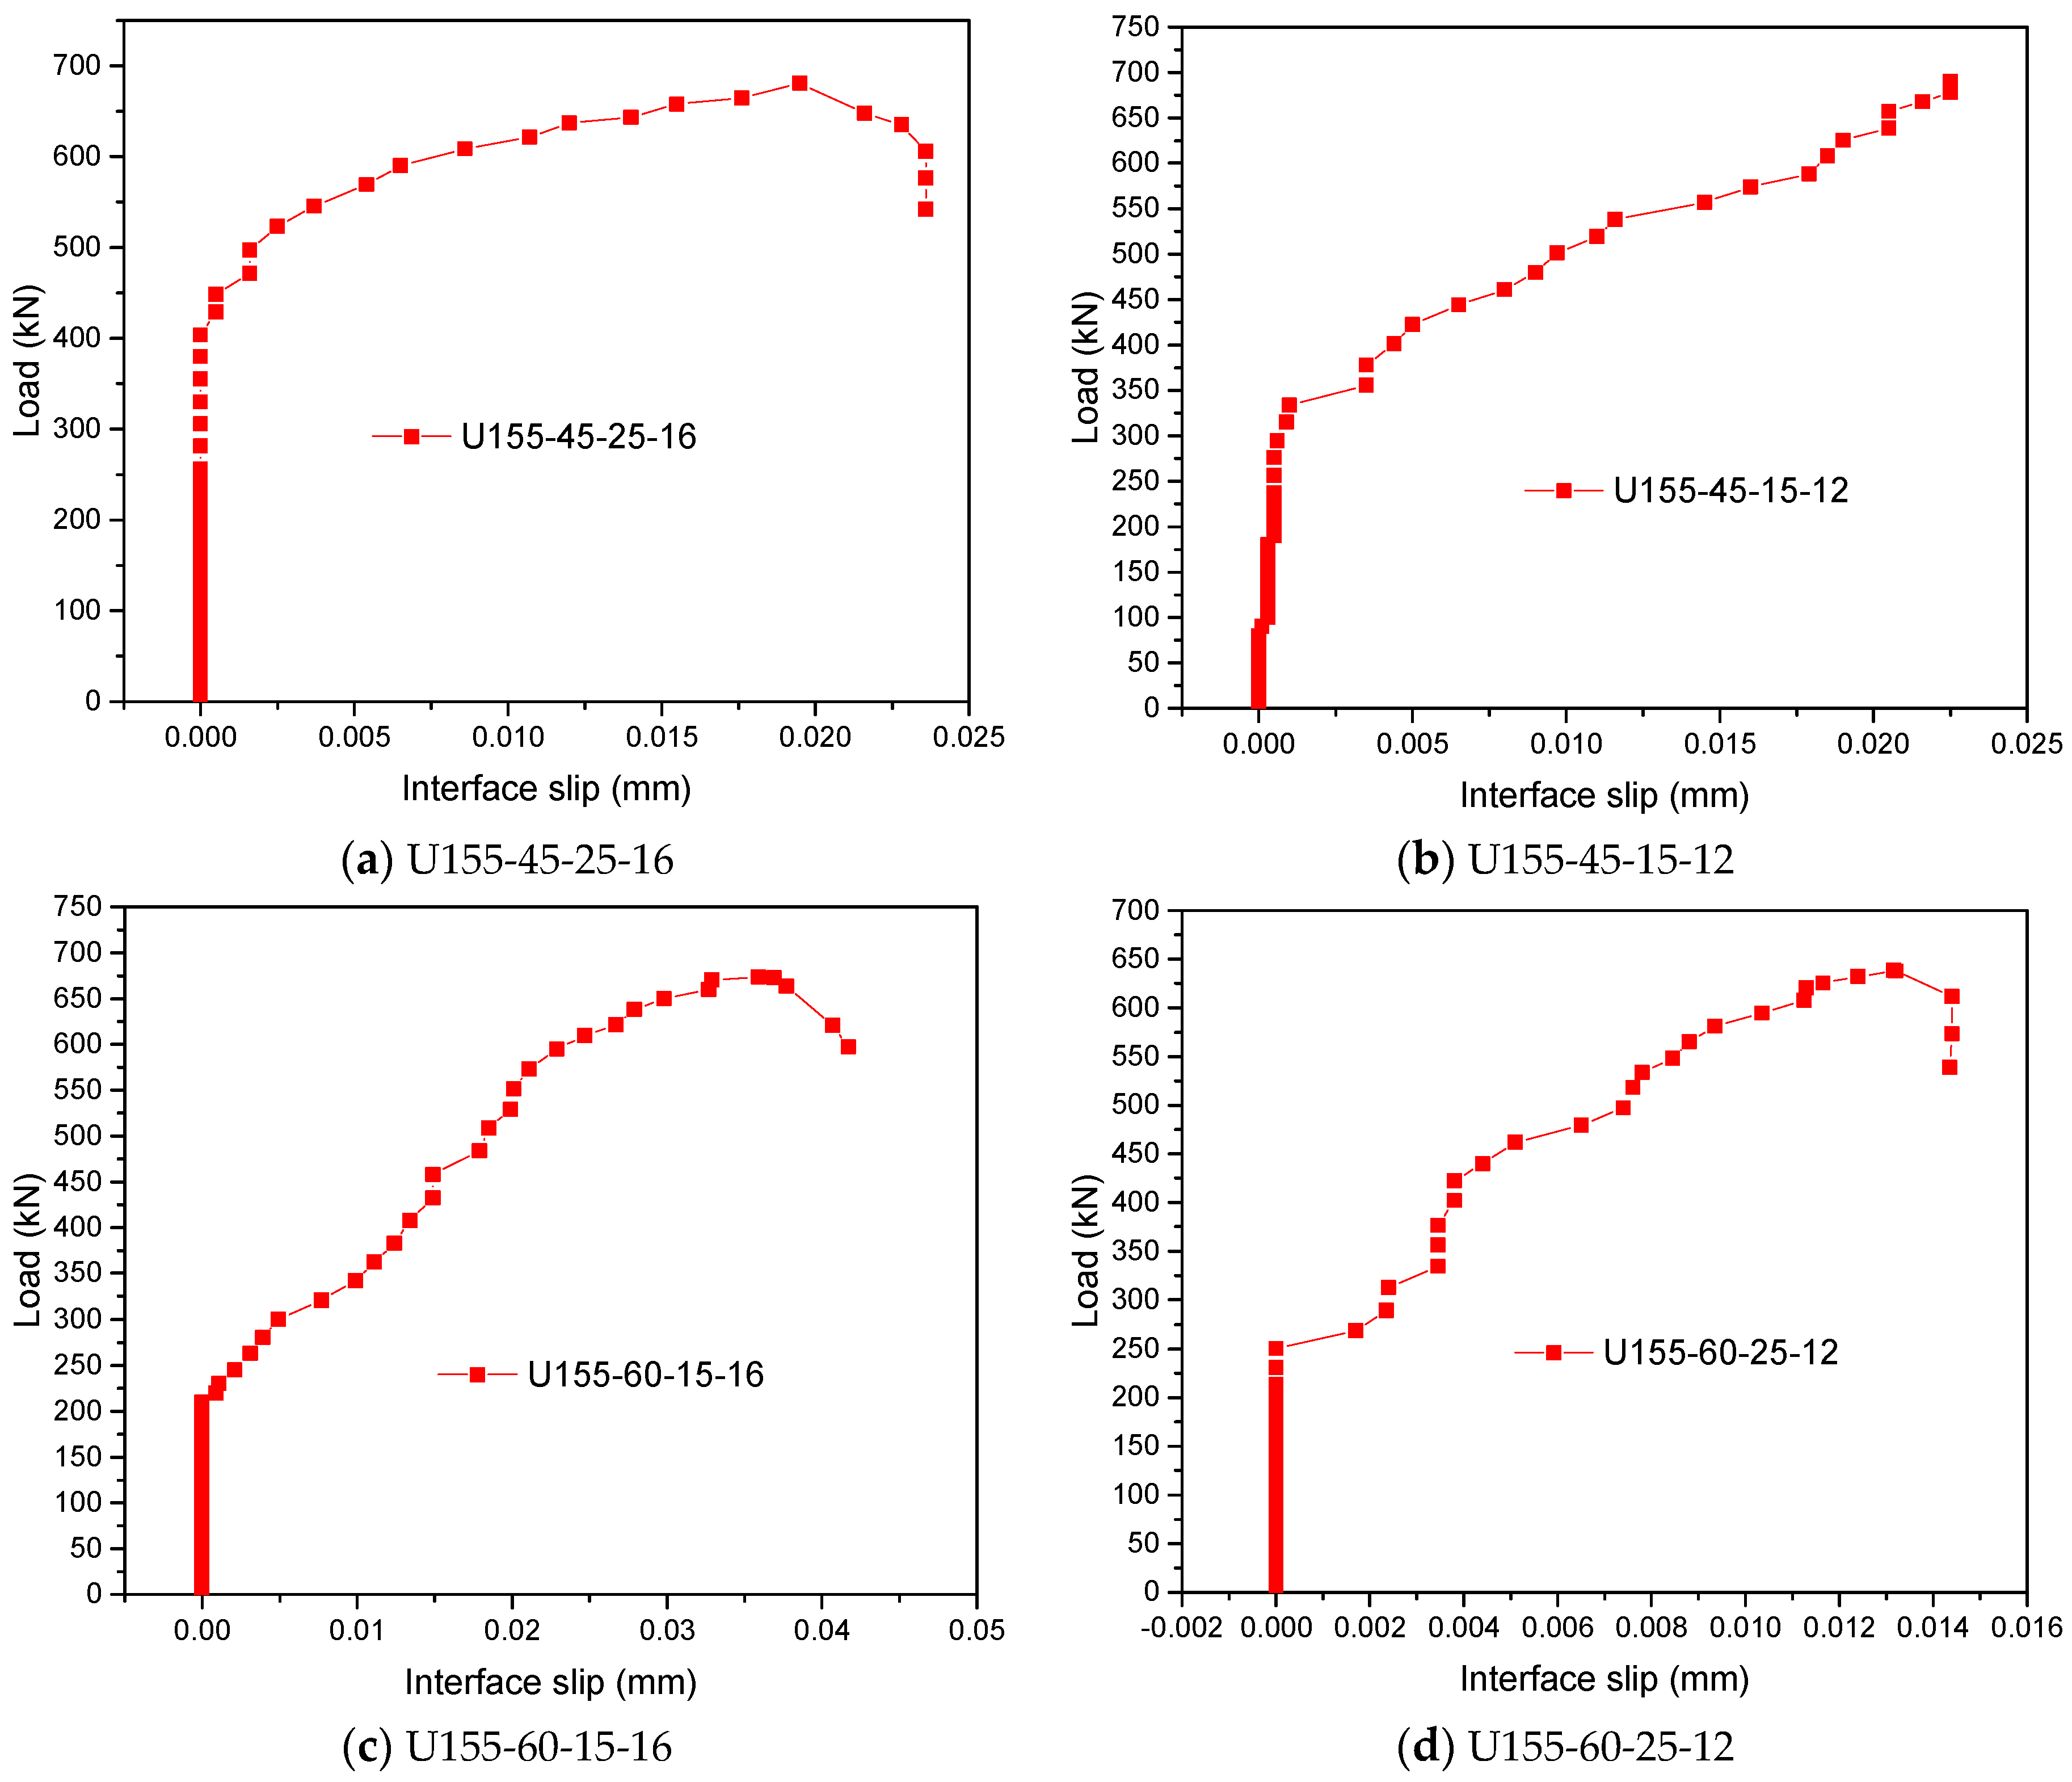
4.3.3. Analysis of Interface Slip Characteristics
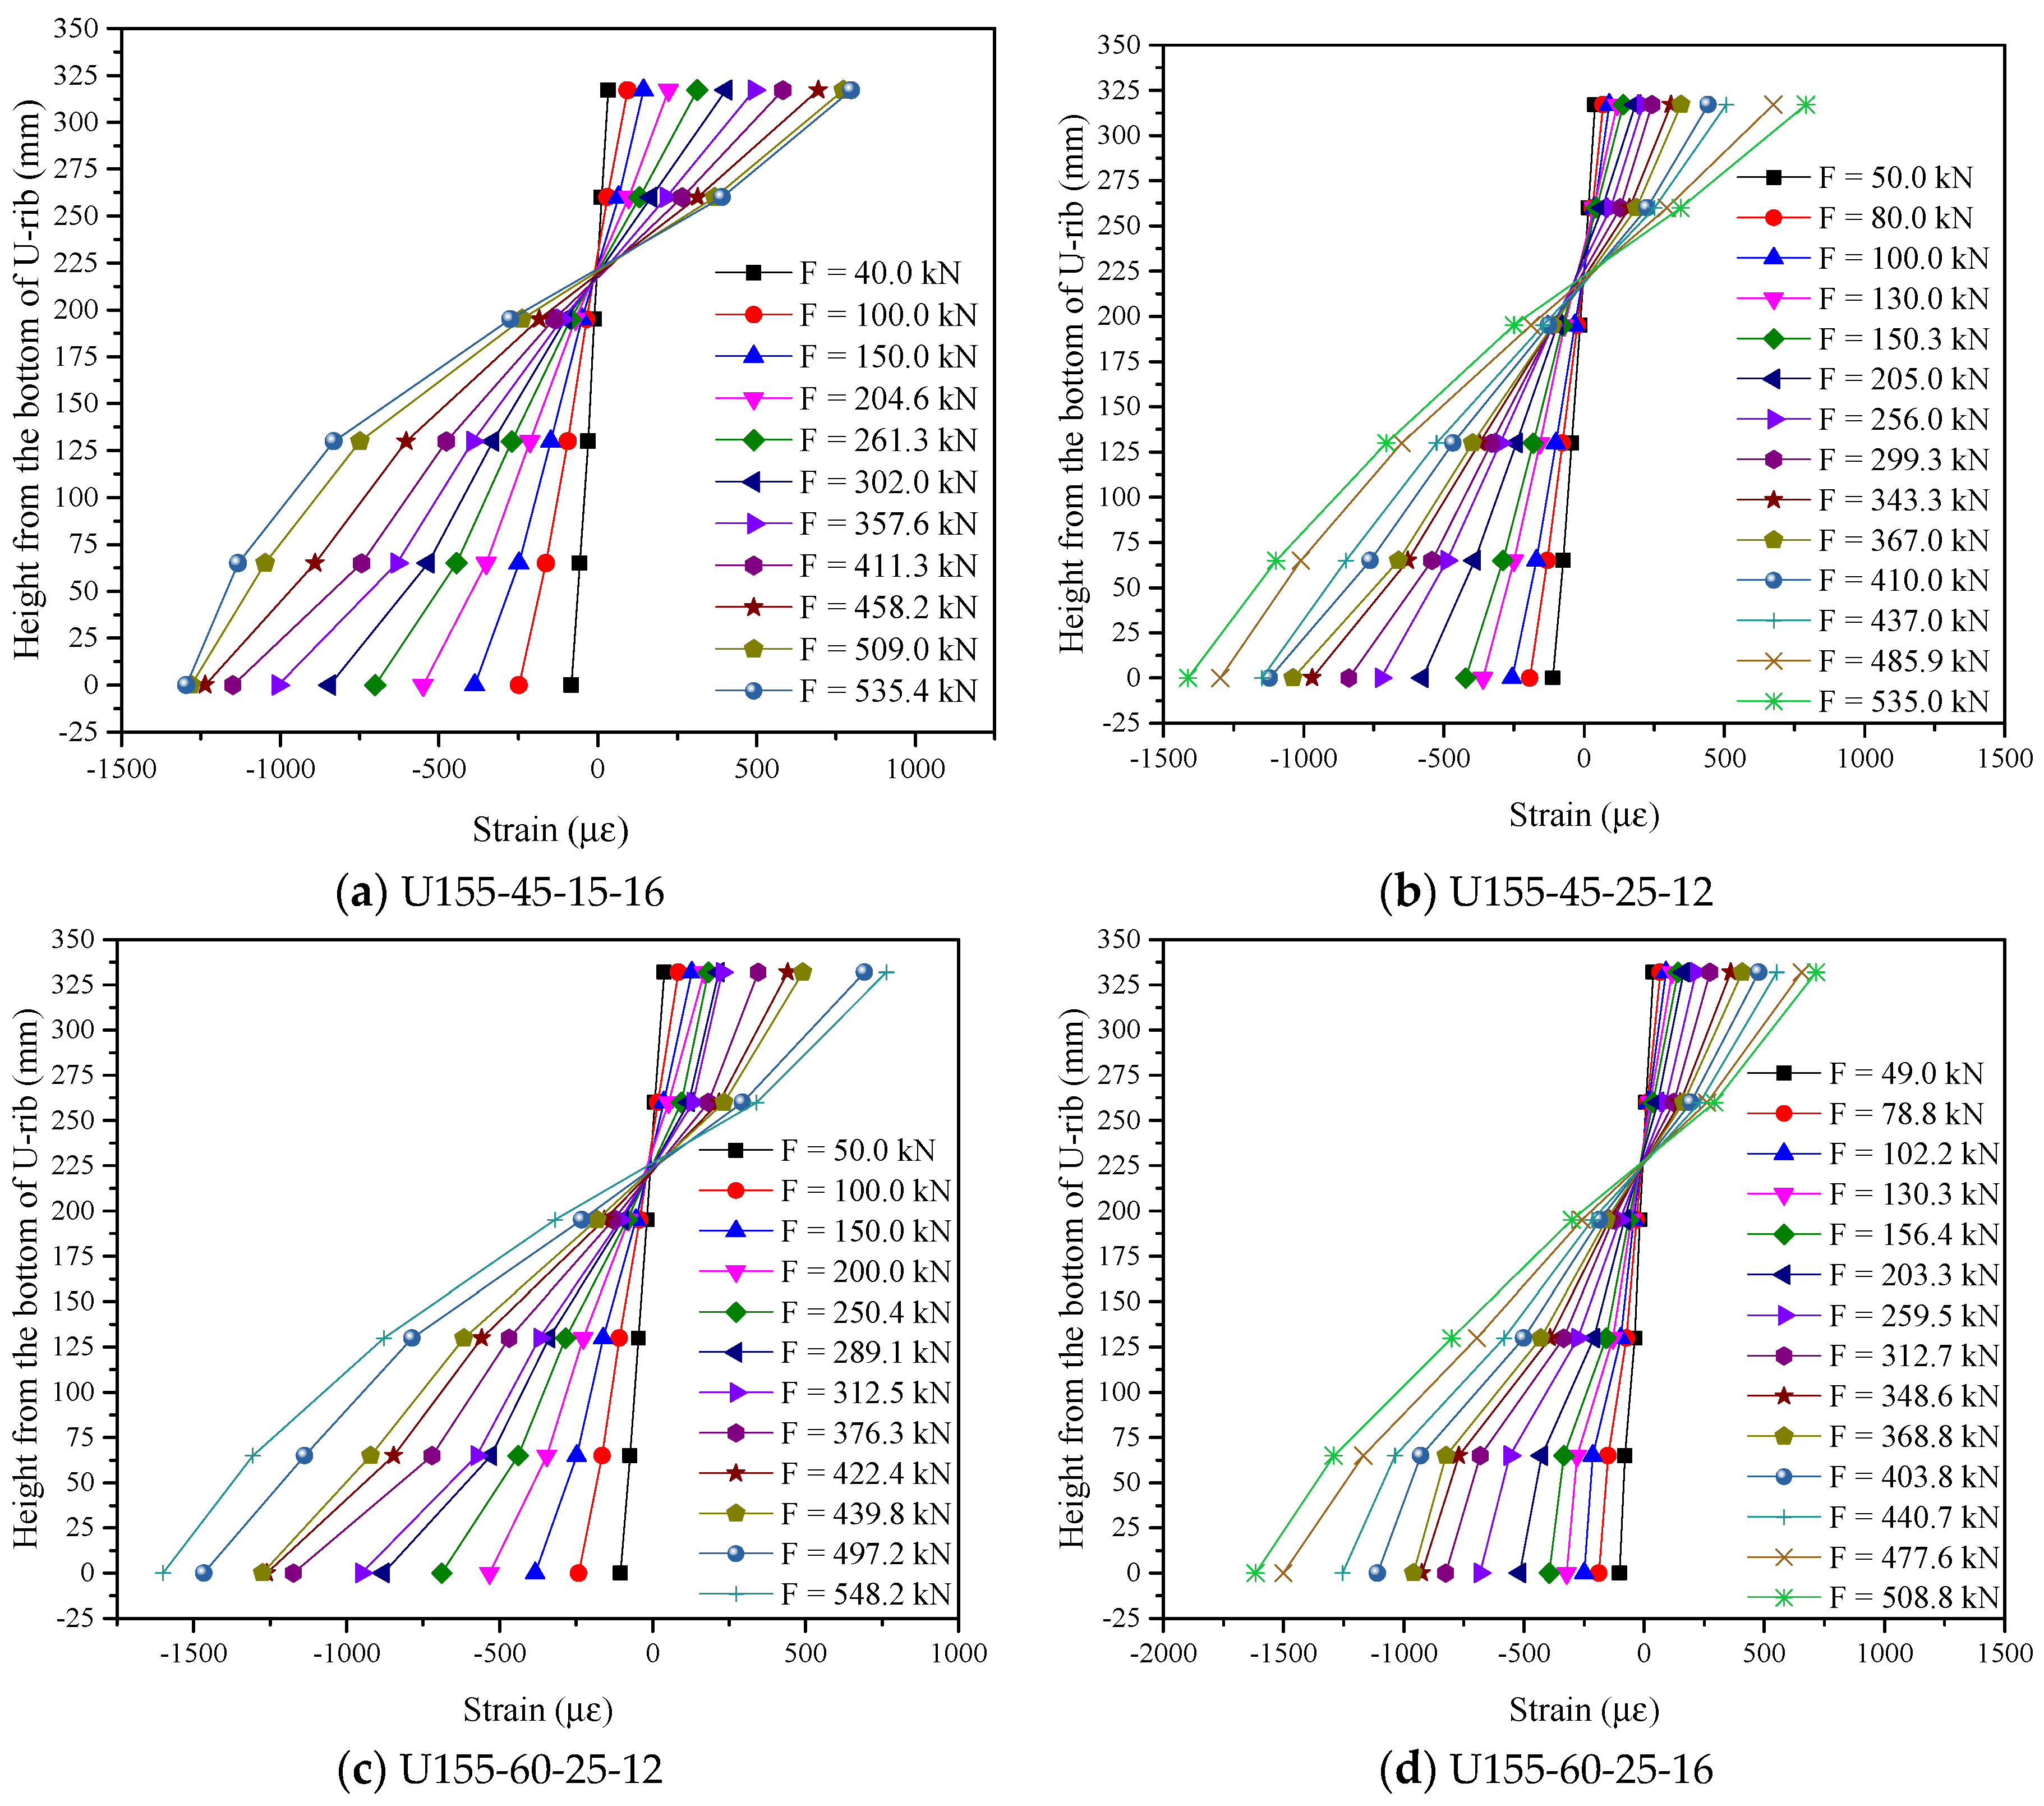
4.3.4. Strain Characteristics Analysis of UHPFRC Surface
5. Ultimate Bearing Capacity Calculation Theory of Composite Beam
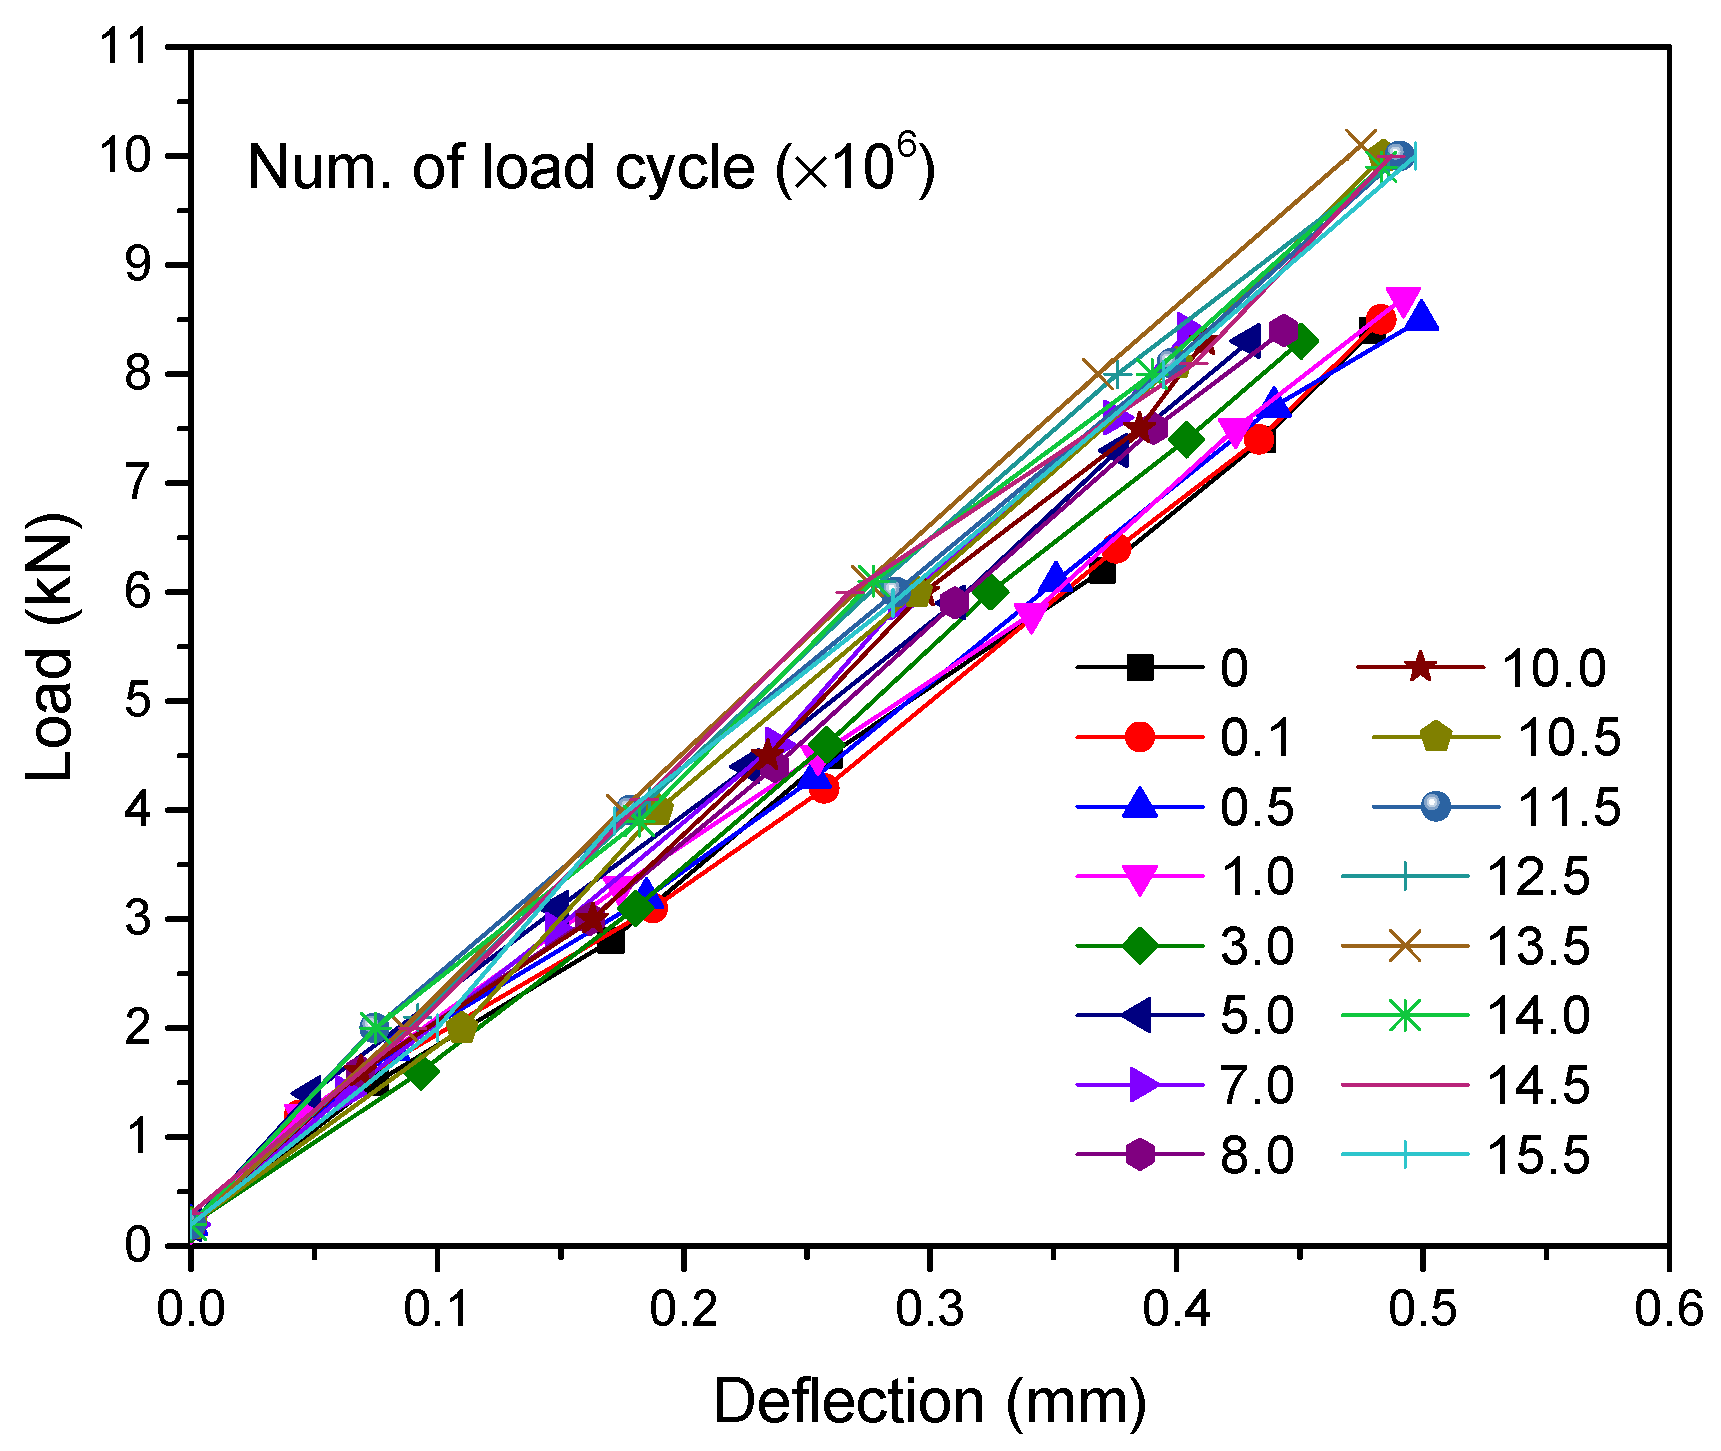
6. Fatigue Testing of the Steel-UHPFRC Composite Plate
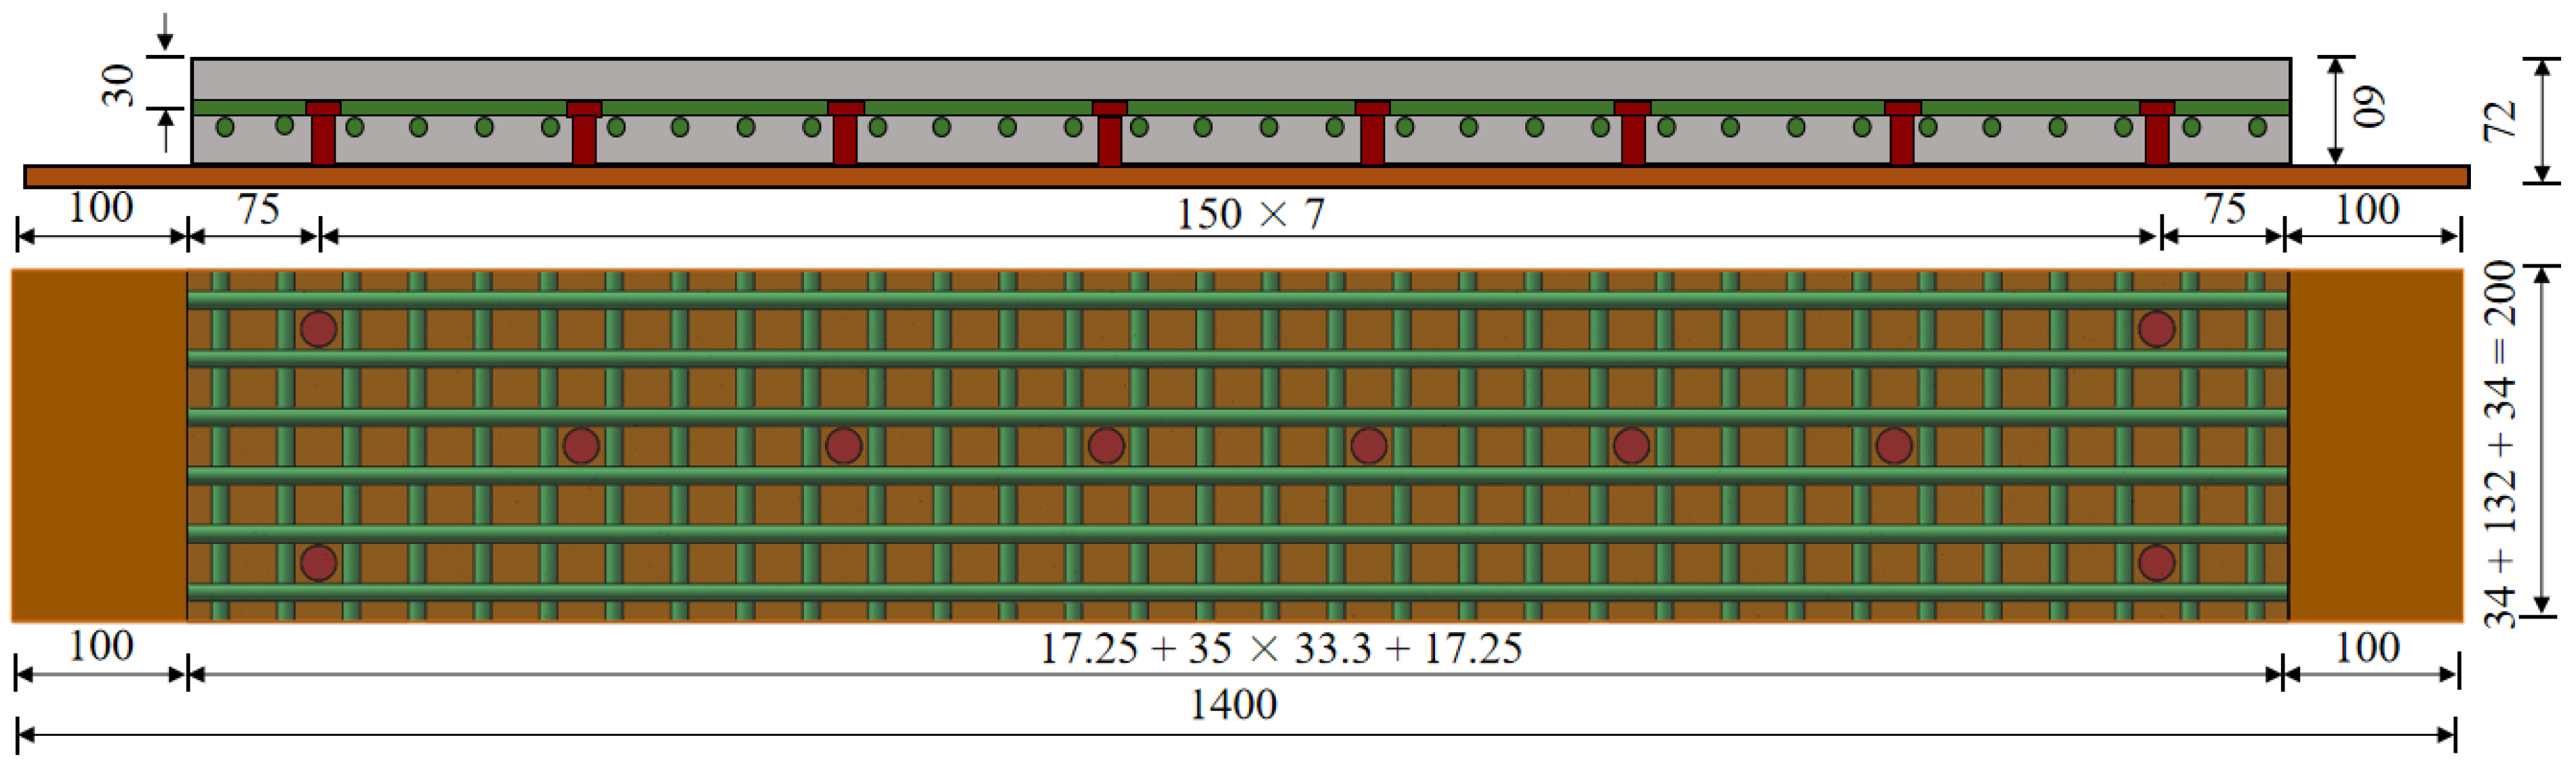
6.1. Design of the Steel-UHPFRC Composite Plate
6.2. Loading Scheme and Test Contents
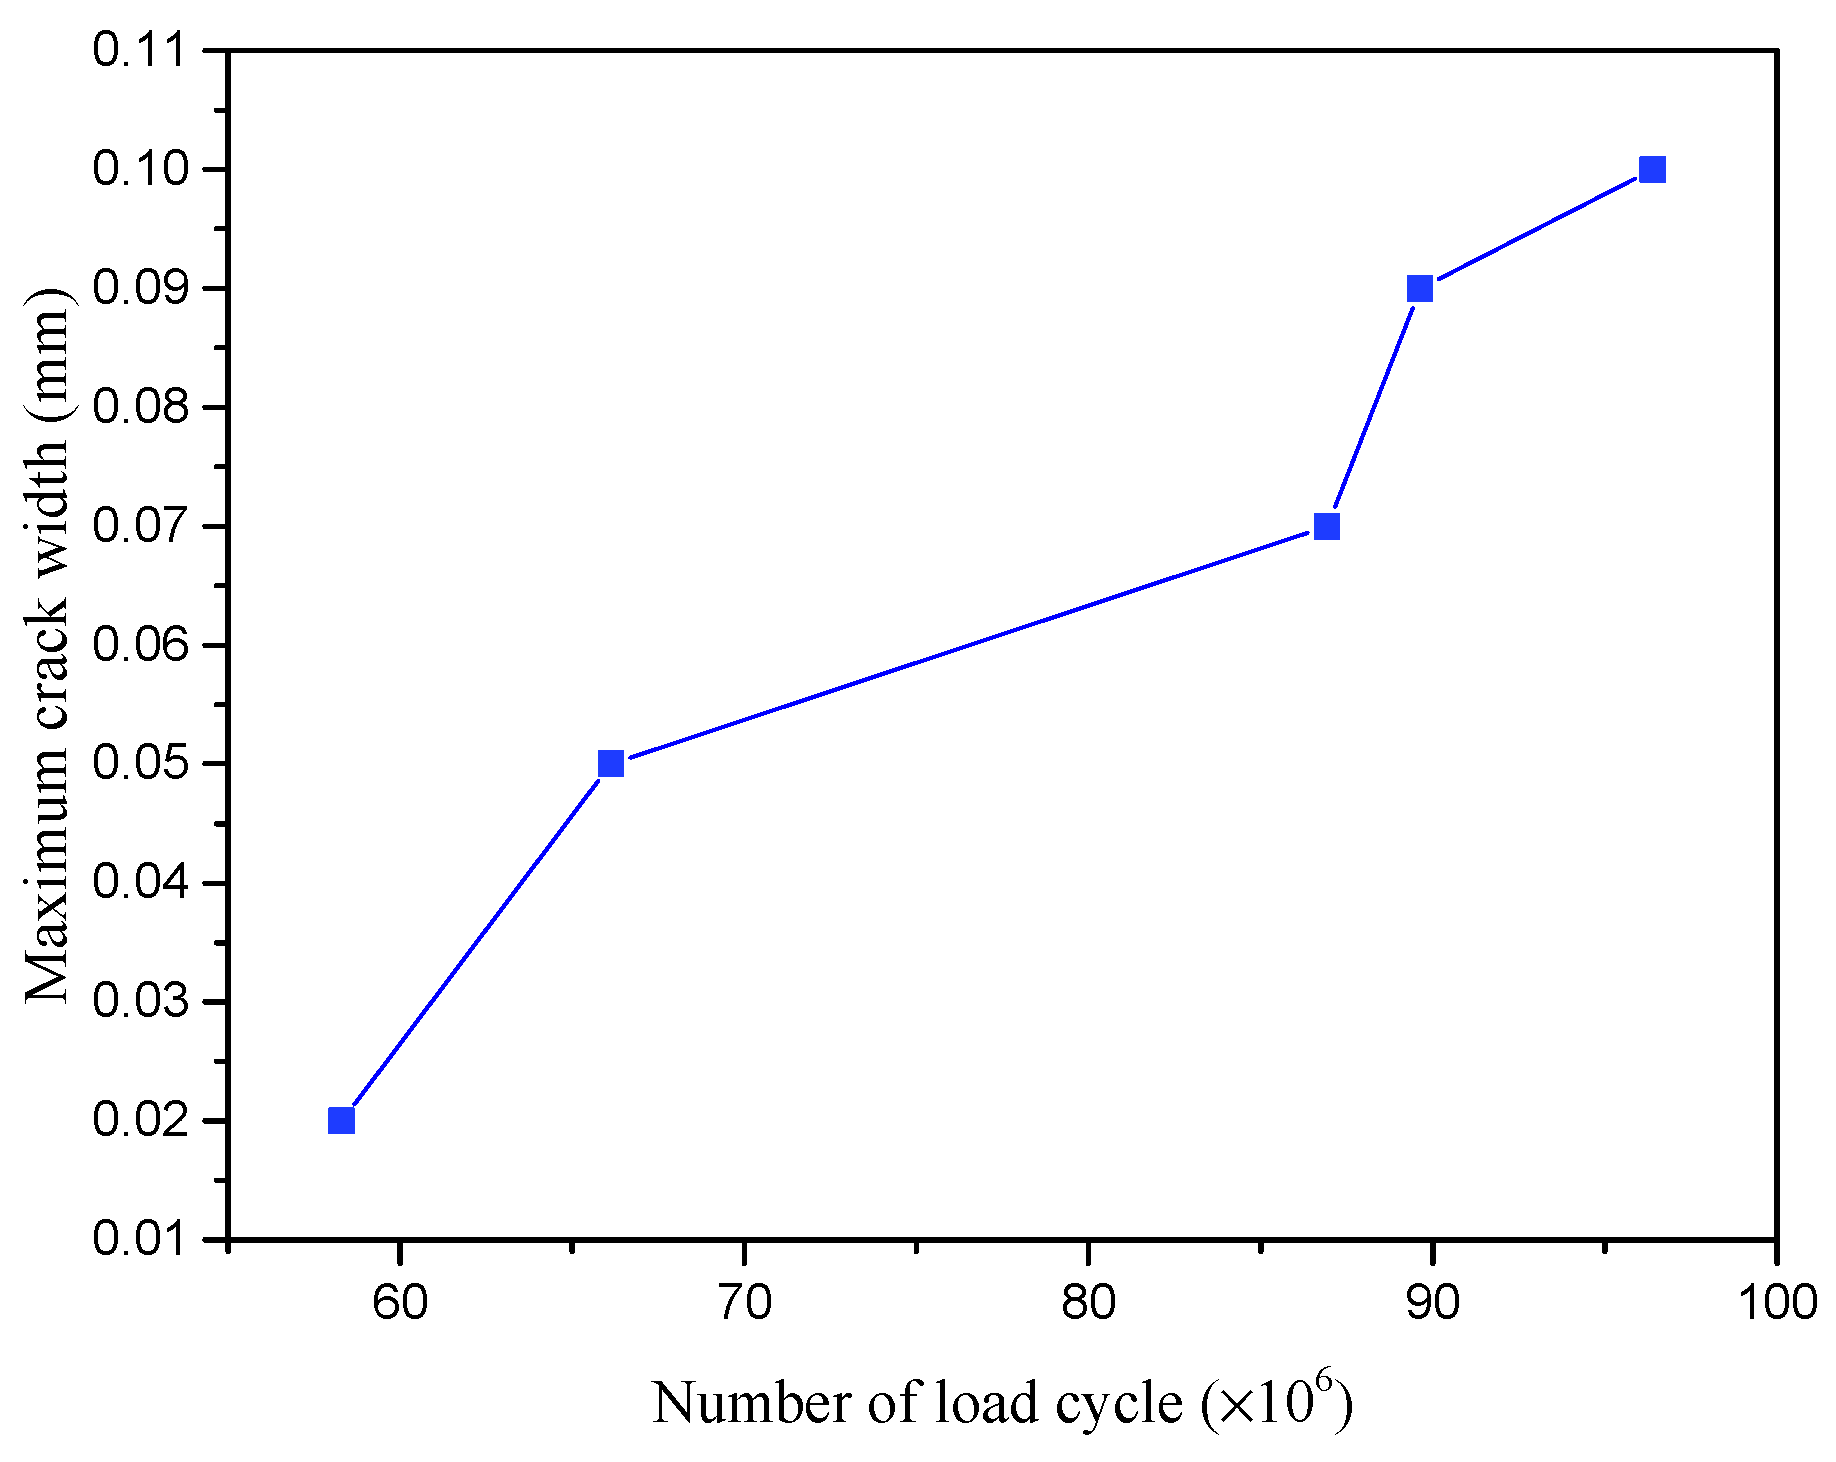
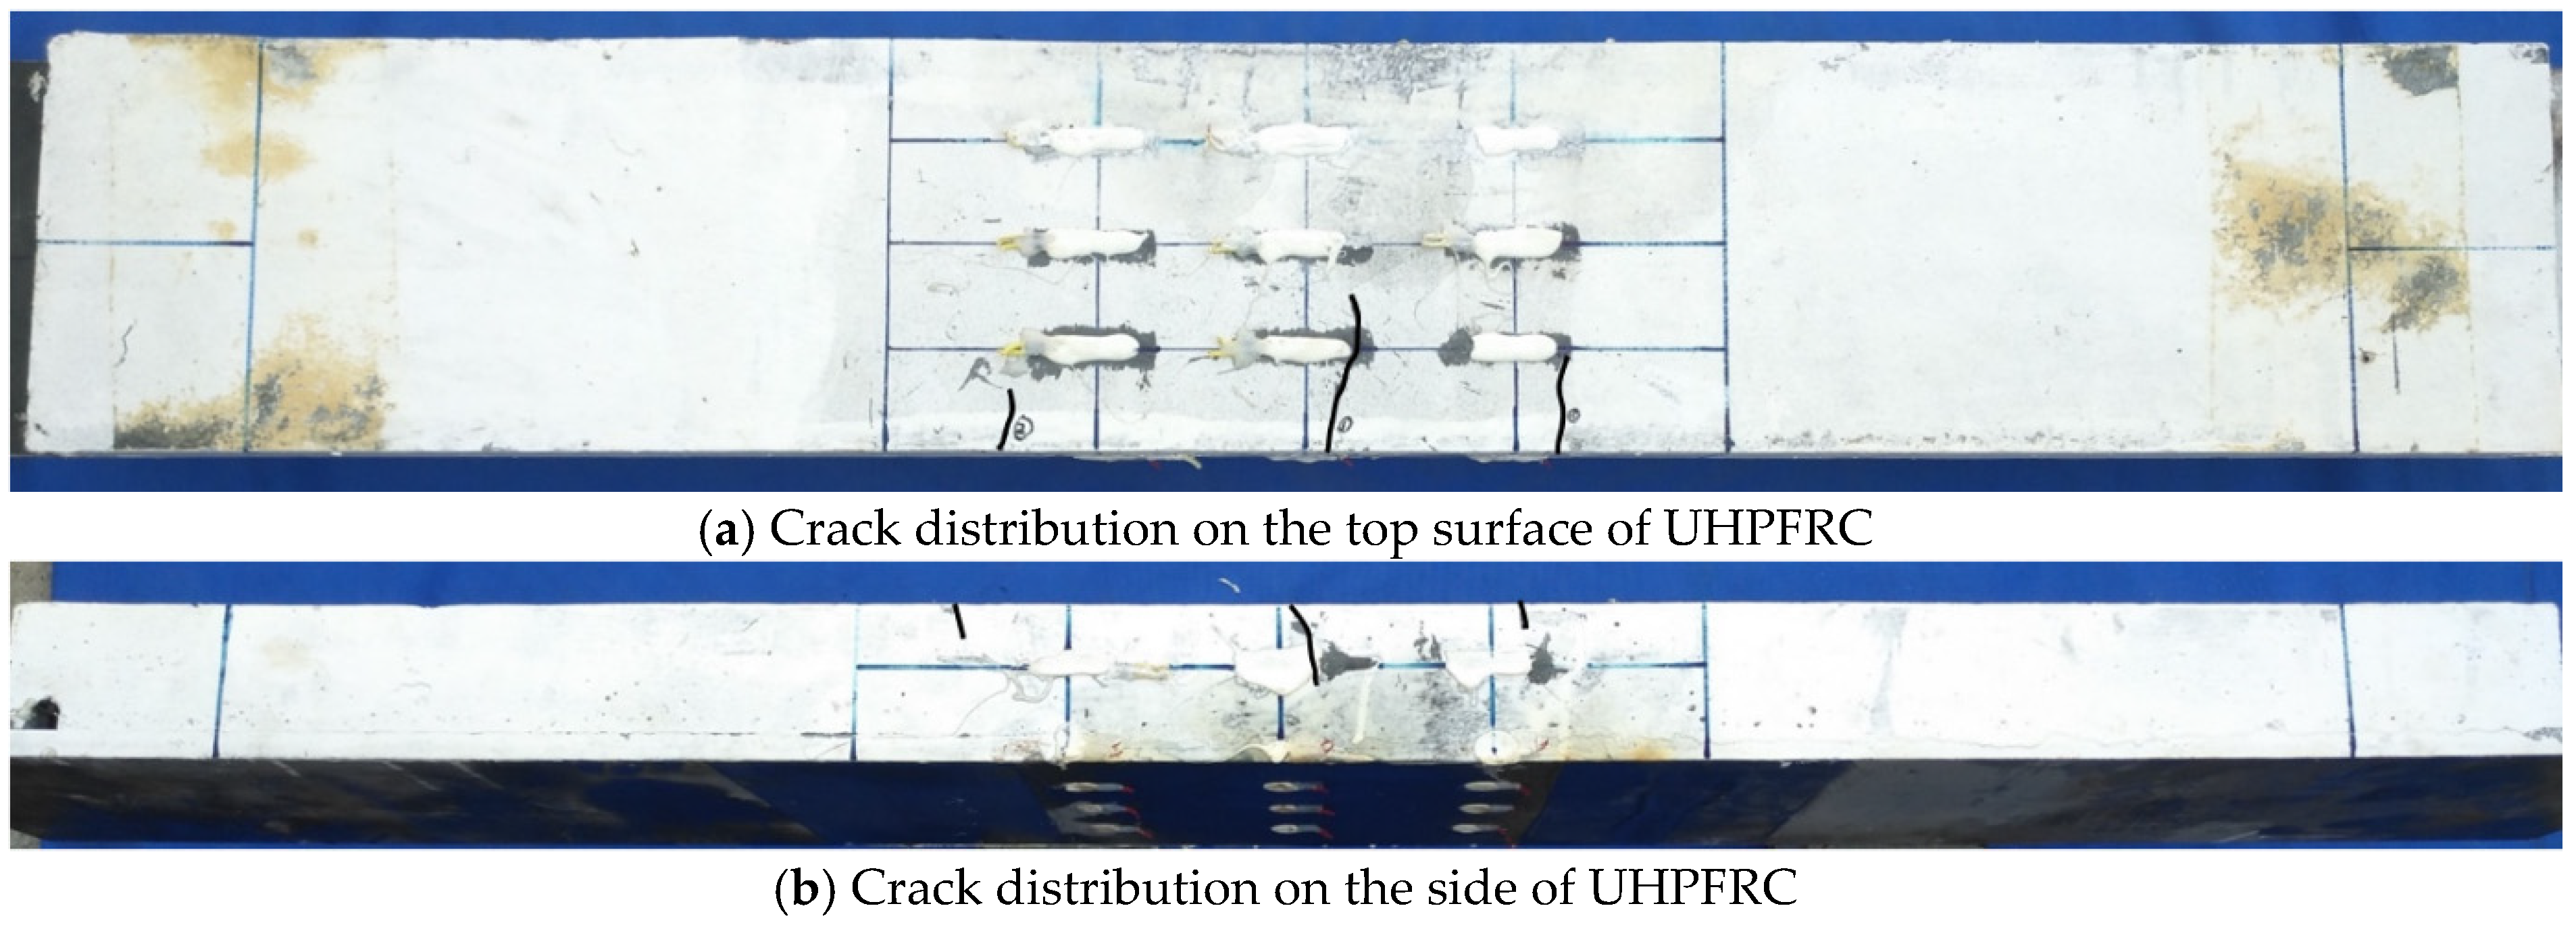
6.3. Experimental Results Analysis of Fatigue Test
7. Conclusions
- (1)
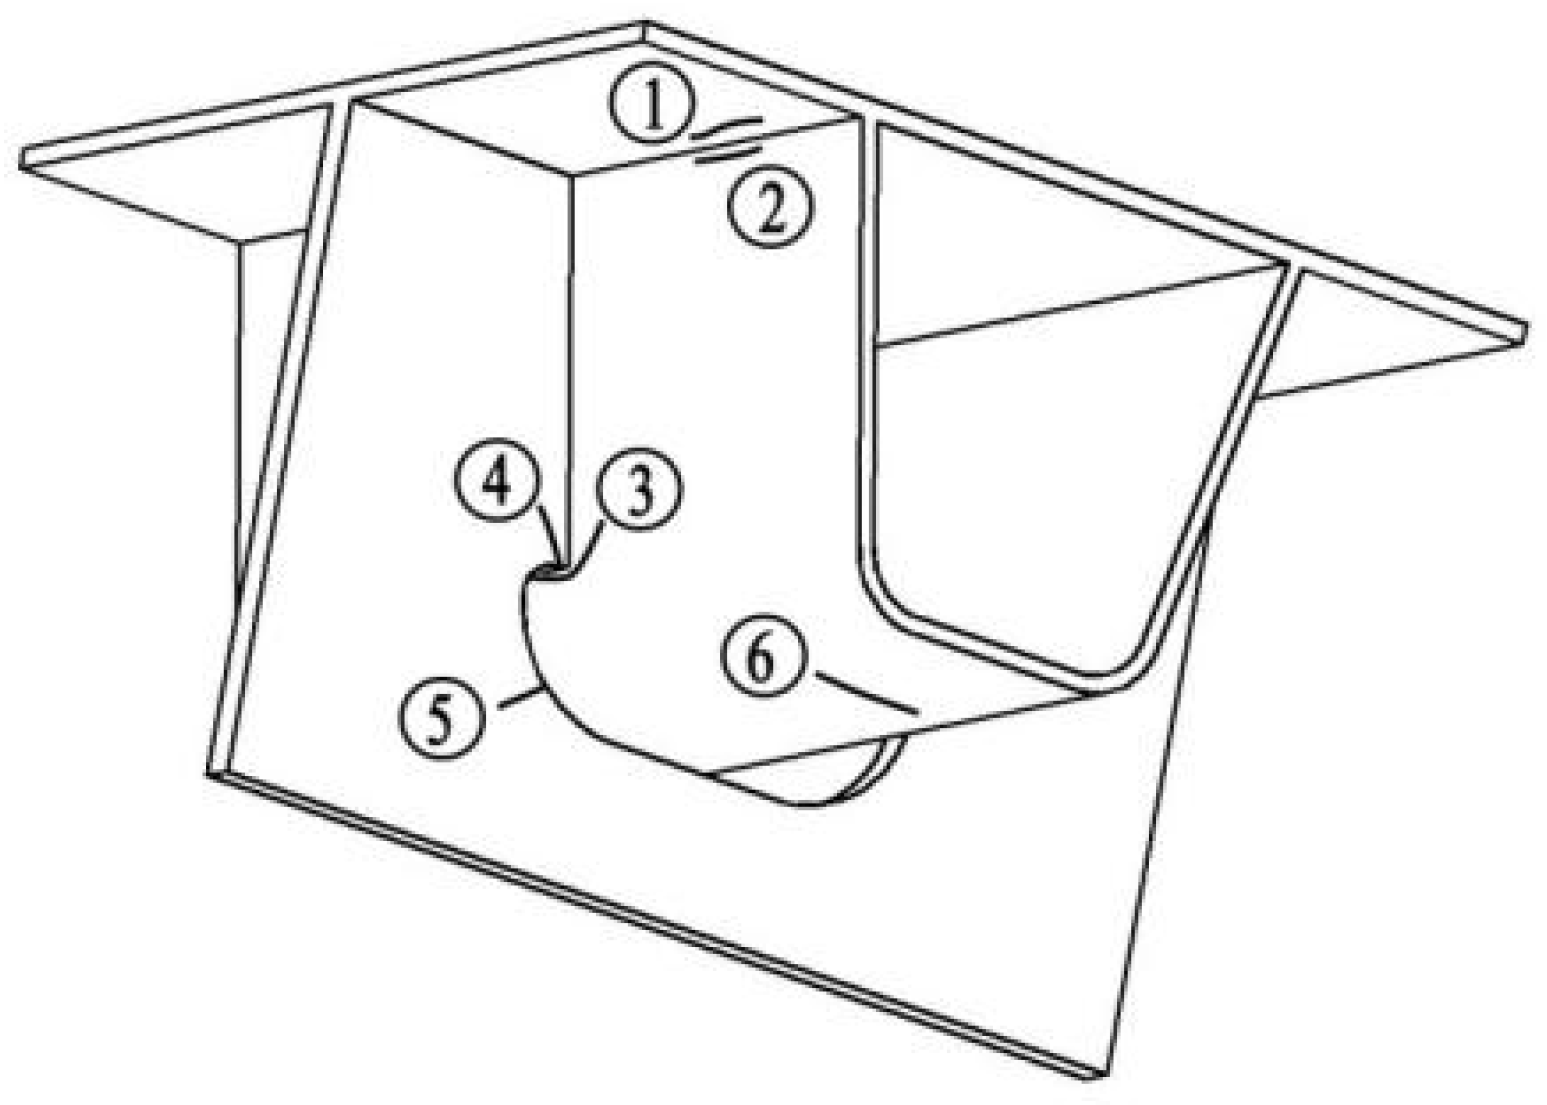
- FEA revealed that the maximum tensile stress of UHPFRC in the transverse bridge direction is 3.8 MPa. Adding a 60-mm UHPFRC layer can significantly reduce the stress amplitude of six typical fatigue details and the reduction degree is 44.8% to 90%. Accordingly, the risk of fatigue cracking can be greatly reduced.
- (2)
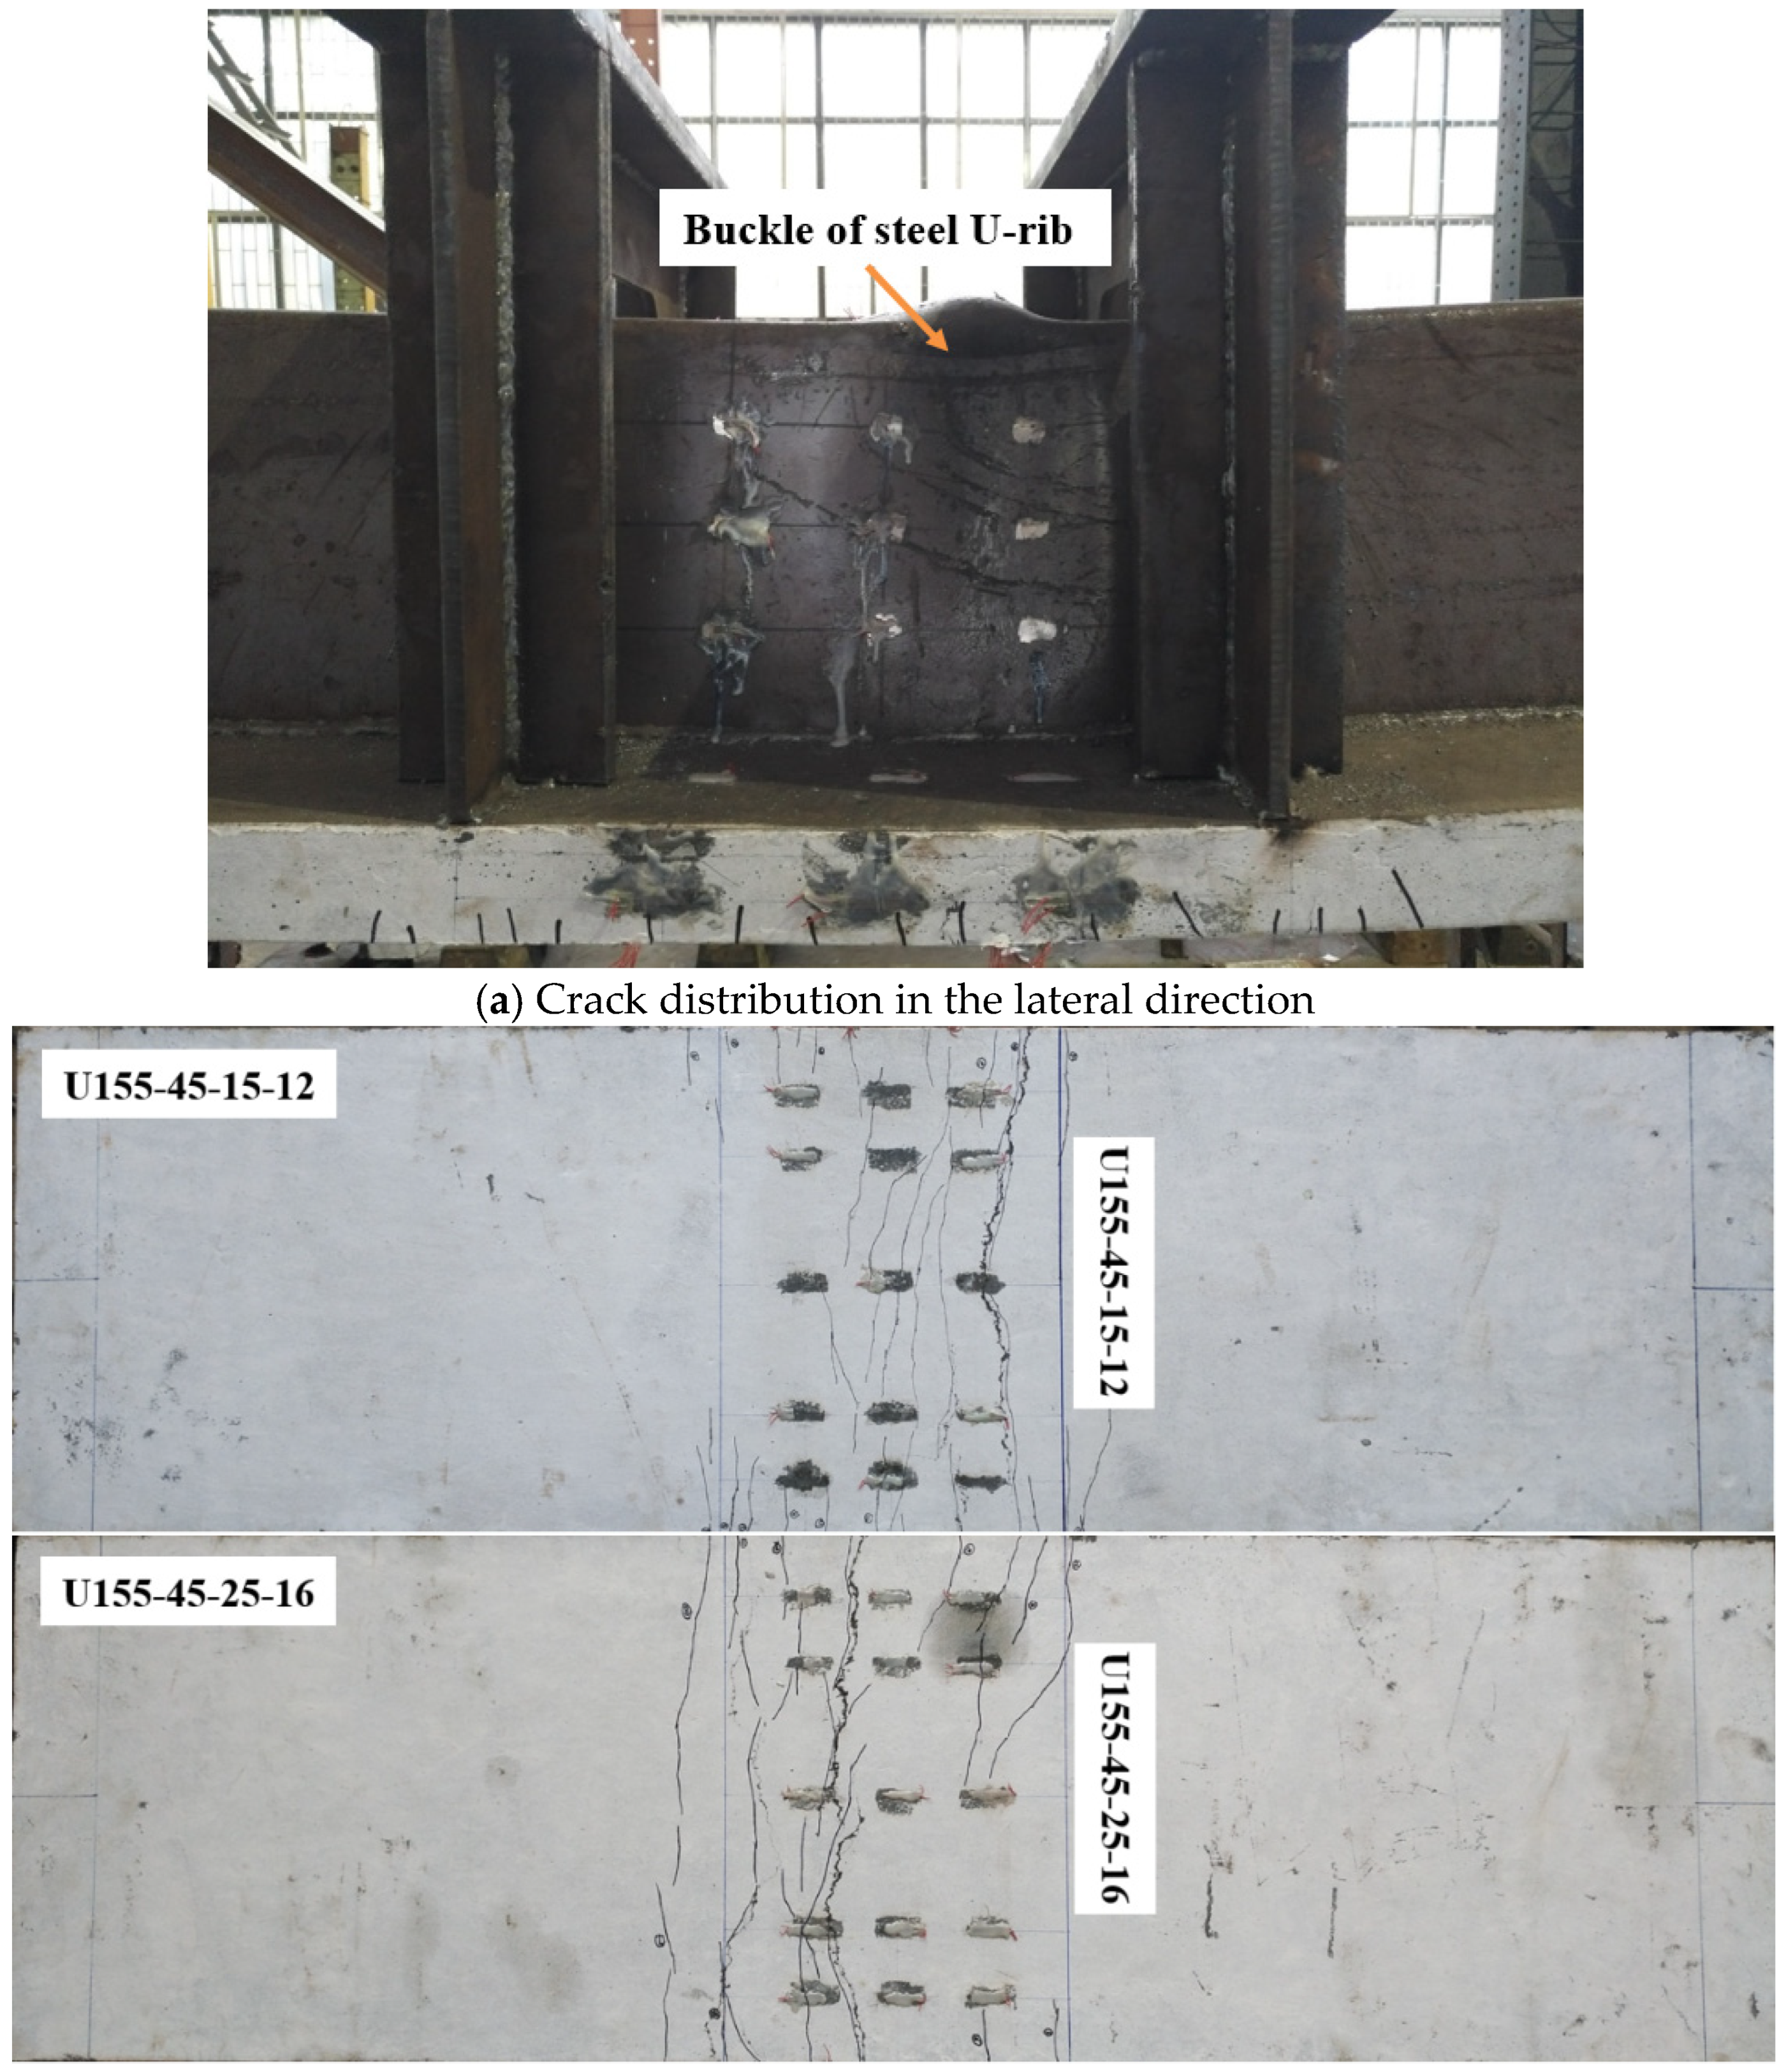
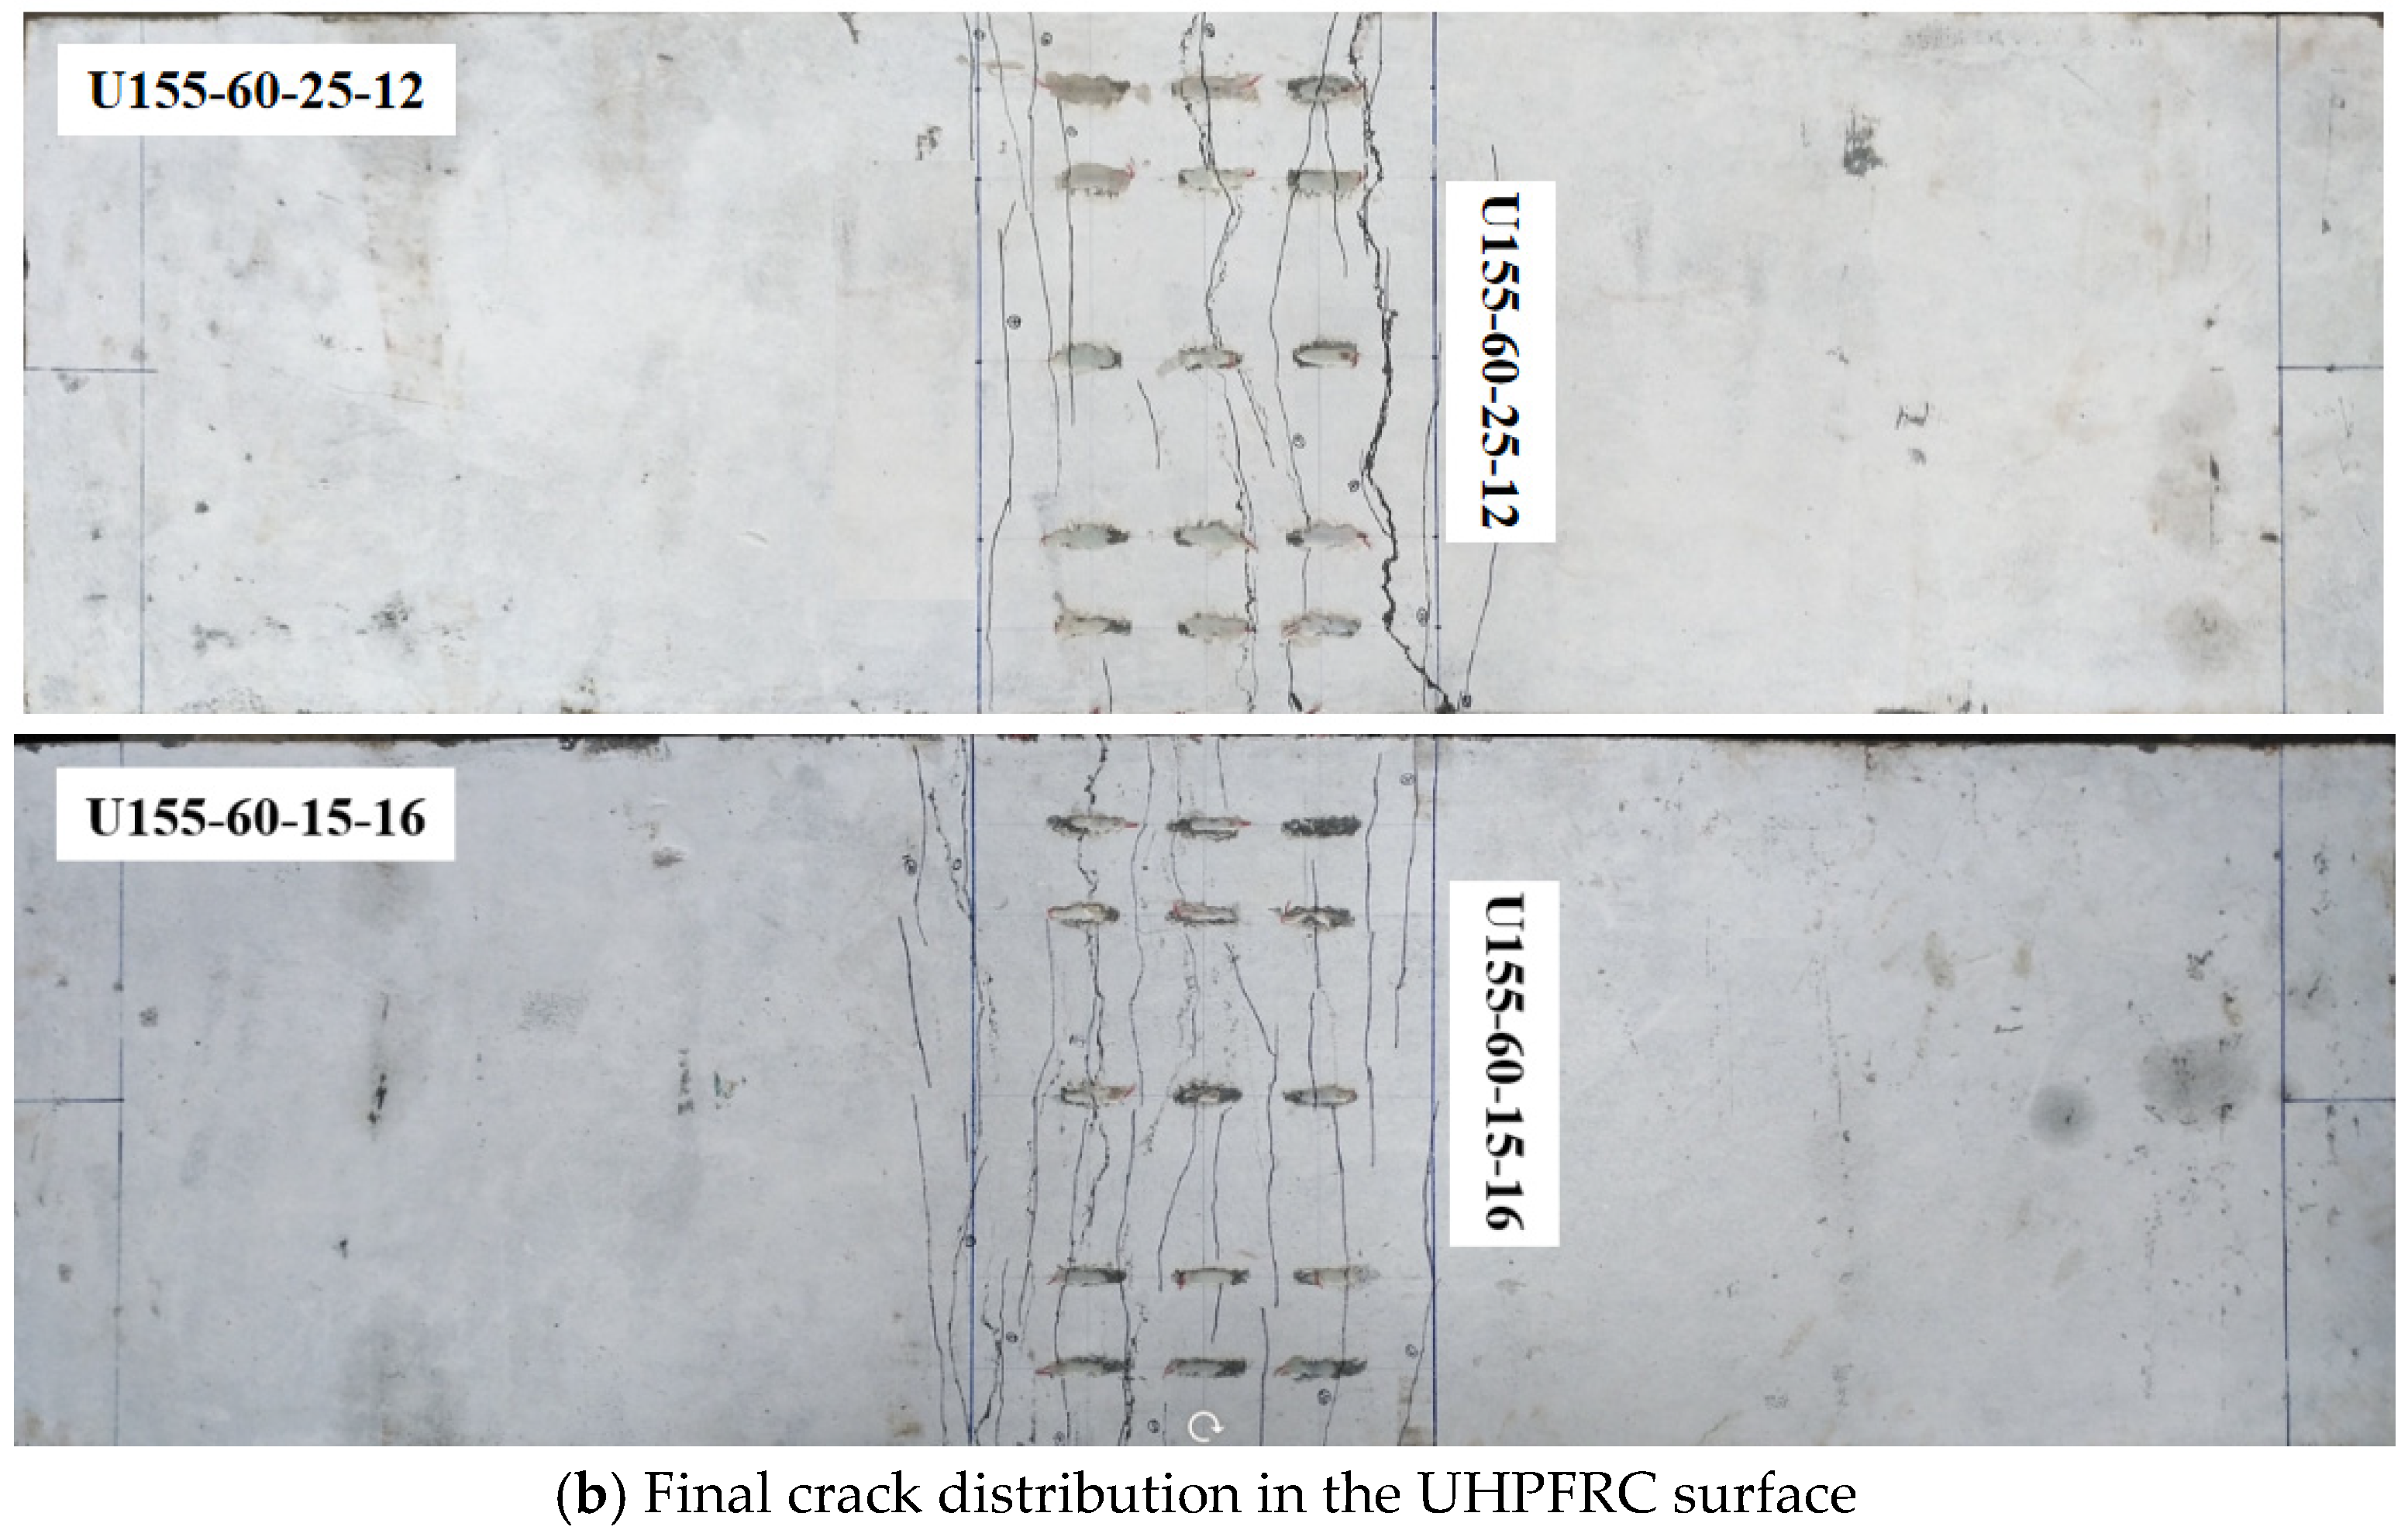
- For the longitudinal bending performance of the LWCD, the steel-UHPFRC composite beams would fail due to the buckle of the steel U-rib. The cracking stresses of the specimens are between 20.0 MPa to 27.3 MPa. Reducing the cover thickness and increasing the reinforcement ratio can effectively improve the cracking stress of specimens. However, increasing the thickness of the UHPFRC layer cannot increase the cracking stress. The ultimate bearing capacity of specimens with different parameters has little difference.
- (3)
- The load-deflection curves of steel-UHPFRC composite beams include three different stages, namely, the elastic stage, crack expansion stage, and buckle stage. All specimens exhibit multiple cracking behaviors when components failed. The maximum slip value between the steel and UHPFRC layer is about 0.013 mm–0.035 mm and no damage is observed. In addition, the strain distribution along the height direction basically conforms to the plane section assumption.
- (4)
- According to the test results, considering the force of cracking UHPFRC in the tensile zone, the calculation method of the ultimate bearing capacity of the steel-UHPFRC composite structure is proposed. When the strain at the bottom of the u-rib is taken as 1.2 times the design yield strain, the calculated results are in good agreement with the experimental results.
- (5)
- The transverse fatigue test results revealed that the specimen can experience 66.12 million loading cycles under the design fatigue stress amplitude. In addition, only a little loss of stiffness was observed, and the value of slip between steel plate and UHPFRC layer was small. This indicates that the LWCD has good fatigue resistance in the transverse direction.
Author Contributions
Funding
Conflicts of Interest
References
- Pfeil, M.S.; Battista, R.C.; Mergulhão, A.J. Stress concentration in steel bridge orthotropic decks. J. Constr. Steel Res. 2005, 61, 1172–1184. [Google Scholar] [CrossRef]
- Wolchuk, R. Empirical Design Rules for Effective Utilization of Orthotropic Decks. J. Bridg. Eng. 2014, 19, 152–158. [Google Scholar] [CrossRef]
- Shao, X.; Yi, D.; Huang, Z.; Zhao, H.; Chen, B.; Liu, M. Basic Performance of the Composite Deck System Composed of Orthotropic Steel Deck and Ultrathin RPC Layer. J. Bridg. Eng. 2013, 18, 417–428. [Google Scholar] [CrossRef]
- Shen, X.J.; Brühwiler, E.; Peng, W.H. Biaxial flflexural response of Strain-Hardening UHPFRC circular slab elements. Int. J. Fatigue 2020, 138, 105727. [Google Scholar] [CrossRef]
- Shen, X.J.; Brühwiler, E. Biaxial flexural fatigue behavior of strain-hardening UHPFRC thin slab elements. Constr. Build. Mater. 2020, 255, 119344. [Google Scholar] [CrossRef]
- Noshiravani, T.; Brühwiler, E. Experimental investigation on reinforced ultra-high-performance fiber-reinforced concrete composite beams subjected to combined bending and shear. Aci Struct. J. 2013, 110, 251. [Google Scholar]
- Prem, P.R.; Murthy, A.R. Acoustic emission and flexural behaviour of RC beams strengthened with UHPC overlay. Constr. Build. Mater. 2016, 123, 481–492. [Google Scholar] [CrossRef]
- Tanarslan, H.M.; Alver, N.; Jahangiri, R.; Yalçınkaya, Ç.; Yazıcı, H. Flexural strengthening of RC beams using UHPFRC laminates: Bonding techniques and rebar addition. Constr. Build. Mater. 2017, 155, 45–55. [Google Scholar] [CrossRef]
- Lorenc, W.; Kubica, E. Behavior of composite beams prestressed with external tendons: Experimental study. J. Constr. Steel Res. 2006, 62, 1353–1366. [Google Scholar] [CrossRef]
- Buitelaar, P.; Braam, R.; Kaptijn, N. Reinforced high performance concrete overlay system for rehabilitation and strengthening of orthotropic steel bridge decks. In Proceedings of the ASCE/SEI Orthotropic Bridge Conference, Sacramento, CA, USA, 25–27 August 2004; pp. 384–401. [Google Scholar]
- Dieng, L.; Marchand, P.; Gomes, F.; Tessier, C.; Toutlemonde, F. Use of UHPFRC overlay to reduce stresses in orthotropic steel decks. J. Constr. Steel Res. 2013, 89, 30–41. [Google Scholar] [CrossRef]
- Choi, W.; Choi, Y.-C.; Yoo, S.-W. Flexural Design and Analysis of Composite Beams with Inverted-T Steel Girder with Ultrahigh Performance Concrete Slab. Adv. Civ. Eng. 2018, 2018, 1356027. [Google Scholar] [CrossRef] [Green Version]
- Li, W.G. Experimental Research on Static and Fatigue Flexural Performance of UHPC Layer in Light-Weighted Composite bridge Deck. Master’s Thesis, Hunan University, Changsha, China, 2015. (In Chinese). [Google Scholar]
- Shao, X.D.; Qu, W.T.; Cao, J.H.; Yao, Y.L. Static and fatigue properties of the steel-UHPC lightweight compositebridge deck with large U-ribs. J. Constr. Steel. Res. 2018, 148, 491–507. [Google Scholar] [CrossRef]
- Luo, J.; Shao, X.D.; Cao, J.H.; Xiong, M.H.; Fan, W. Transverse bending behavior of the steel-UHPC lightweight composite deck: Orthogonal test and analysis. J. Constr. Steel Res. 2019, 162, 105708. [Google Scholar] [CrossRef]
- Zhang, S.; Shao, X.; Cao, J.; Cui, J.; Hu, J.; Deng, L. Fatigue Performance of a Lightweight Composite Bridge Deck with Open Ribs. J. Bridg. Eng. 2016, 21, 4016039. [Google Scholar] [CrossRef]
- Ding, N.; Shao, X.D. Study on fatigue performance of light-weighted composite bridge deck. China Civ. Eng. J. 2015, 48, 74–81. (In Chinese) [Google Scholar]
- Shao, X.; Cao, J. Fatigue Assessment of Steel-UHPC Lightweight Composite Deck Based on Multiscale FE Analysis: Case Study. J. Bridg. Eng. 2018, 23, 4017142. [Google Scholar] [CrossRef]
- Pei, B.; Li, L.; Shao, X.; Wang, L.; Zeng, Y. Field measurement and practical design of a lightweight composite bridge deck. J. Constr. Steel Res. 2018, 147, 564–574. [Google Scholar] [CrossRef]
- Kożuch, M.; Lorenc, W. Stress concentration factors of shear connection by composite dowels with MCL shape. Arch. Civ. Mech. Eng. 2018, 19, 32–46. [Google Scholar] [CrossRef]
- Lorenc, W. The design concept for the steel part of a composite dowel shear connection. Steel Constr. 2016, 9, 89–97. [Google Scholar] [CrossRef]
- Lorenc, W. The model for a general composite section resulting from the introduction of composite dowels. Steel Constr. 2017, 10, 154–167. [Google Scholar] [CrossRef]
- Shao, X.D.; Hu, J.H. The Steel-UHPC Lightweight Composite Bridge Structures; CCPress: Beijing, China, 2015. (In Chinese) [Google Scholar]
- Zhan, J.; Shao, X.D.; Qu, W.T.; Cao, J.H. Multi-parametric Analysis on steel-STC lightweight composite bridge deck. J. Highw. Transp. Res. Dev. 2018, 35, 73–81, 90. (In Chinese) [Google Scholar]
- Ministry of Communications of China. Specifications for Design of Highway Steel Bridge (JTG D64-2015); China Communications Press: Beijing, China, 2015. [Google Scholar]
- Sim, H.B.; Uang, C.M.; Sikorsky, C. Effects of Fabrication Procedures on Fatigue Resistance of Welded Joints in Steel Orthotropic Decks. J. Bridge Eng. 2009, 14, 366–373. [Google Scholar] [CrossRef]
- Wolchuk, R. Design Manual for Orthotropic Steel Plate Deck Bridges; American Institute of Steel Construction: Chicago, IL, USA, 1963. [Google Scholar]
- GT 31387; Reactive Powder Concrete. Ministry of Housing and Urban-Rural Development of People’s Republic of China: Beijing, China, 2015. (In Chinese)
- AFGC/SETRA. Ultra High Performance Fibre-Reinforced Concretes; Recommendations; Association Francaise de Genie Civil: Paris, France, 2016. [Google Scholar]
- Rafiee, A. Computer Modeling and Investgation on the Steel Corrosion in Cracked Ultra High Performance Concrete; Kassel University: Kassel, Germany, 2012; pp. 182–184. [Google Scholar]
- Makita, T.; Brühwiler, E. Tensile fatigue behaviour of ultra-high performance fibre reinforced concrete (UHPFRC). Mater. Struct. 2013, 47, 475–491. [Google Scholar] [CrossRef]
- AASHTO. AASHTO LRFD Bridge Design Specification, 6th ed.; American Association of State Highway and Transportation Officials: Washington, DC, USA, 2012; pp. 601–651, 921–928. [Google Scholar]


| Details | Detail ① | Detail ② | Detail ③ | Detail ④ | Detail ⑤ | Detail ⑥ | |
|---|---|---|---|---|---|---|---|
| Maximum stress amplitude (MPa) | 0-mm UHPFRC | 84.79 | 61.02 | 90.37 | 120.56 | 79.61 | 67.15 |
| 60-mm UHPFRC | 8.28 | 23.99 | 38.9 | 58.45 | 43.91 | 35.21 | |
| Reduction degree in stress amplitude | 90% | 60.7% | 57% | 51.5% | 44.8% | 47.6% | |
| Serial No. | Specimen Name | Stud Spacing (mm) | UHPFRC Thickness (mm) | Cover Thickness (mm) | Number of Steel Bars | Reinforcement Ratio | Test Type |
|---|---|---|---|---|---|---|---|
| 1 | U155-45-15-12 | 155 | 45 | 15 | 12 | 3.4% | Longitudinal bending test |
| 2 | U155-45-15-16 | 155 | 45 | 15 | 16 | 4.5% | |
| 3 | U155-45-25-12 | 155 | 45 | 25 | 12 | 3.4% | |
| 4 | U155-45-25-16 | 155 | 45 | 25 | 16 | 4.5% | |
| 5 | U155-60-15-12 | 155 | 60 | 15 | 12 | 2.5% | |
| 6 | U155-60-15-16 | 155 | 60 | 15 | 16 | 3.4% | |
| 7 | U155-60-25-12 | 155 | 60 | 25 | 12 | 2.5% | |
| 8 | U155-60-25-16 | 155 | 60 | 25 | 16 | 3.4% | |
| 9 | S150-60-25-6 | 150 | 60 | 25 | 6 | 3.9% | Fatigue test |
| Serial No. | Test Type | Dimensions of Specimen (mm) | Number of Specimen | Fiber Parameter | Mechanical Property | Test Result |
|---|---|---|---|---|---|---|
| 1 | compression test | 100 × 100 × 100 | 3 | 1.5% straight fiber (Φ 0.12 × 8 mm) + 2% end-hook fiber (Φ 0.2 × 13 mm) | compressive strength | 165.0 MPa |
| 2 | elastic modulus test | 100 × 100 × 300 | 6 | modulus of elasticity | 45.8 GPa | |
| 3 | flexural test | 100 × 100 × 400 | 3 | flexural strength | 30.1 MPa |
| Specimen | Reinforcement Ratio | Cover Thickness | Cracking Load (kN) | Cracking Stress (MPa) |
|---|---|---|---|---|
| U155-45-15-16 | 4.5% | 15 | 593 | 27.3 |
| U155-45-25-16 | 4.5% | 25 | 523.3 | 24.8 |
| U155-45-15-12 | 3.4% | 15 | 538.4 | 25.7 |
| U155-45-25-12 | 3.4% | 25 | 437 | 20.6 |
| U155-60-15-16 | 3.4% | 15 | 551.2 | 25.2 |
| U155-60-25-16 | 3.4% | 25 | 508.8 | 23.5 |
| U155-60-15-12 | 2.5% | 15 | 492.5 | 22.7 |
| U155-60-25-12 | 2.5% | 25 | 439.8 | 20.0 |
| Specimen | Calculated Value A/kN | Calculated Value B/kN | Test Value C/kN | (C-A)/C | (C-B)/C |
|---|---|---|---|---|---|
| U155-45-15-16 | 545.9 | 645.6 | 678.6 | 19.6% | 4.9% |
| U155-45-25-16 | 541.4 | 640.1 | 680.9 | 20.5% | 6.0% |
| U155-45-15-12 | 543.3 | 642.2 | 690.3 | 21.3% | 7.0% |
| U155-45-25-12 | 539.7 | 637.8 | 683.0 | 21.0% | 6.6% |
| U155-60-15-16 | 569.3 | 670.3 | 673.5 | 15.5% | 0.5% |
| U155-60-25-16 | 563.9 | 663.7 | 663.7 | 15.0% | 0.0% |
| U155-60-15-12 | 565.1 | 664.9 | 705.4 | 19.9% | 5.7% |
| U155-60-25-12 | 560.8 | 659.6 | 639.0 | 12.2% | −3.2% |
| Stress Amplitude (MPa) | ||||
|---|---|---|---|---|
| 8.4 | 0.8 | 4.5 | 10.0 | 10.0 |
| 15.1 | 1.5 | 8.1 | 3.5 | 30.4 |
| 18.4 | 1.8 | 9.9 | 2.0 | 51.7 |
| 21.7 | 2.2 | 11.7 | 1.3 | 74.1 |
| 25.0 | 2.5 | 13.5 | 0.8 | 96.4 |
Publisher’s Note: MDPI stays neutral with regard to jurisdictional claims in published maps and institutional affiliations. |
© 2022 by the authors. Licensee MDPI, Basel, Switzerland. This article is an open access article distributed under the terms and conditions of the Creative Commons Attribution (CC BY) license (https://creativecommons.org/licenses/by/4.0/).
Share and Cite
Luo, J.; Huai, C.; Shao, X.; Zhao, J.; Wang, L. Study on Static and Fatigue Behaviors of Steel-UHPFRC Composite Deck Structure. Polymers 2022, 14, 2796. https://doi.org/10.3390/polym14142796
Luo J, Huai C, Shao X, Zhao J, Wang L. Study on Static and Fatigue Behaviors of Steel-UHPFRC Composite Deck Structure. Polymers. 2022; 14(14):2796. https://doi.org/10.3390/polym14142796
Chicago/Turabian StyleLuo, Jun, Chenzi Huai, Xudong Shao, Jun Zhao, and Ling Wang. 2022. "Study on Static and Fatigue Behaviors of Steel-UHPFRC Composite Deck Structure" Polymers 14, no. 14: 2796. https://doi.org/10.3390/polym14142796