Article

An Efficient Technique for Ammonia Capture in the Haber–Bosch Process Loop—Membrane-Assisted Gas Absorption

by
Anton N. Petukhov
1,2,3,
Artem A. Atlaskin
1,2,*,
Kirill A. Smorodin
3,
Sergey S. Kryuchkov
2,
Dmitriy M. Zarubin
3,
Maria E. Atlaskina
2,3,
Anastasia N. Petukhova
2,3,
Anna N. Stepakova
2,
Anna A. Golovacheva
3,
Artem N. Markov
3,
Ekaterina A. Stepanova
3,
Andrey V. Vorotyntsev
3 and
Ilya V. Vorotyntsev
2
1
Nanotechnology and Biotechnology Department, Nizhny Novgorod State Technical University n.a. R.E. Alekseev, Minin St. 24, 603950 Nizhny Novgorod, Russia
2
Laboratory of Smart Materials and Technologies, Mendeleev University of Chemical Technology of Russia, Miusskaya Sq. 9, 125047 Moscow, Russia
3
Chemical Engineering Laboratory, N.I. Lobachevsky State University of Nizhny Novgorod, 603022 Nizhny Novgorod, Russia
*
Author to whom correspondence should be addressed.
Polymers 2022, 14(11), 2214; https://doi.org/10.3390/polym14112214
Submission received: 20 April 2022 / Revised: 11 May 2022 / Accepted: 19 May 2022 / Published: 30 May 2022
(This article belongs to the Special Issue Advances in Polymer Membranes)

Abstract

:
The present study continues the development and enhancement of a highly efficient unique hybrid technique—membrane-assisted gas absorption in designing the separation unit, which provides the improvement in mass-transfer of a target component during the ammonia capture process from a process loop of the Haber–Bosch technological route. In order to minimize the absorbent volume to membrane area ratio, the special separation cell was designed based on a combination of two types of hollow fiber membranes, dense gas separation membrane and porous pervaporation membrane. The separation performance tests were implemented under two sets of conditions, sweeping the bore (permeate) side of a cell with helium and hydrogen-nitrogen mix. For both cases, the membrane-assisted gas absorption cell demonstrated high separation efficiency, and the ammonia concentration in the permeate was never lower than 81 mol%; meanwhile, under the hydrogen-nitrogen bore sweep conditions, the ammonia concentration in the permeate reached 97.5 mol% in a single-step process. Nevertheless, there is a product purity–recovery rate trade-off, which is a typical issue for separation processes.

1. Introduction

At present, global ammonia and nitrogen fertilizers production has a leading position among the global chemical industry. The annual capacity of ammonia produced worldwide in 2021 was equal to 236.4 million metric tons, and projected growth by 2030 is about 290 million metric tons [1]. Most of the produced ammonia was synthesized using the Haber–Bosch process invented in 1909 [2], which became conventional over the 20th century and allowed the expansion of ammonia synthesis worldwide from about 3–4 million metric tons per year (1945) to present capacity.
Despite the simplicity of the straightforward reaction, sustainable process, and stable product, the key technological steps in the route have a number of drawbacks [3,4]. For instance, the ammonia recovery unit based on condensation is incapable of capturing all produced ammonia. Therefore, a significant amount of uncaptured ammonia is recycled to the reactor, where the chemical equilibrium shifts towards reagents and decreases the unit performance.
Another critical issue in the Haber–Bosch process is the source of hydrogen conventionally produced by hydrocarbons reforming, which does not fit the present zero-emission strategy due to the generation of considerable carbon monoxide and dioxide exhaust. The so-called “green” ammonia process [5,6] seems to be a prospective solution, where the hydrogen is produced via pure water dialysis and the nitrogen is produced from air using membranes. Both unit gears are powered by electricity generated with renewable sources such as windmills and/or solar cells.
In this way, it is evident that process optimization should be performed, taking into account factors listed above to enhance both the performance of the plant and the product recovery. As the ammonia capture stage does not provide sufficient product capture, a significant amount of ammonia is recycled to the reactor, where the chemical equilibrium shifts towards the reagents and decreases the product yield. Capturing ammonia from the recycling loop will enhance the product recovery and the chemical equilibrium in the reactor will shift towards the product, resulting in a productivity increase. Meanwhile, the same amount of inlet hydrogen and nitrogen being converted into a surplus amount of ammonia or less source gas will maintain production power.
Membrane-assisted gas absorption unit with built-in technological scheme provides selective mass transfer between recycled and feed streams that allows capture of the residual ammonia and sends it back to the refrigeration unit. Previously, the invented membrane-assisted gas absorption unit was studied comprehensively in the context of ammonia capture from binary and ternary gas mixtures and in the acid gases removal applications [7,8,9,10,11]. Moreover, recently, the lab-scale unit based on the flat membrane was tested concerning the most efficient adsorbent in a so-called “closed-mode operation” with a zero retentate [7]. The obtained separation results proved the efficiency of the proposed technique. Thus, studying the separation efficiency during the separation of a ternary gas mixture consisting of NH3/H2/N2 in a volume ratio of 15.5/62.8/21.7 vol%, it was observed that it is possible to produce an ammonia stream on the permeate side with purity of 98.7 vol.%.
The membrane-assisted gas absorption technique is a hybrid pressure-driven process, where the separation occurs in continuous mode through the absorption of gases by liquid absorbent covering the membrane with further permeation through it. In this way, the separation is running in the absence of phase transitions, at ambient temperature, and in a single stage. The appliance of a liquid absorbent provides enhanced selectivity compared to the conventional membrane gas separation process. The key feature of that technique is the spontaneous absorbent regeneration, which also occurs in the continuous mode as gas desorbs and passes through the membrane beneath. As a consequence, despite all the engineering features, the absorbent and membrane materials are the key. Because of that, the absorbent and membrane should be chosen wisely, taking into account mass transfer rates.
At present, special attention is given to the deep eutectic solvents (DESs) [12,13,14], which seem to be a prospective alternative to recently widely studied room temperature ionic liquids (RTILs) [15,16,17], which have proven to be materials with high absorption capacity with regard to ammonia. Deep eutectic solvents possess both similar loading as RTILs and the merits of low cost. In addition, RTILs’ deep eutectic solvents are characterized by renewability and low toxicity. Unlike the RTILs, DESs are more beneficial for chemical industry as their production is simple and performed through mixing in the suitable molar ratio of hydrogen-bond donors and acceptors.
A number of ammonium thiocyanate-based DESs were studied on the example of ammonia capture using the membrane-assisted gas absorption as well [12]. Among the three promising candidates (ammonium thiocyanate: glycerol 2:3, ammonium thiocyanate: ethylene glycol 1:3, and ammonium thiocyanate: urea 2:3) studied comprehensively by Deng et al., ammonium thiocyanate: glycerol provides the highest ammonia loading (176.4 g of NH3 per kg of DES); meanwhile, it is the most viscous DES in the list. Ammonium thiocyanate: ethylene glycol provides comparable ammonia loading of 168.4 g of NH3 per kg of DES and six-times lower viscosity, which is more preferable for mass transfer applications due to the higher diffusion rate of the gases. Nevertheless, the complex material screening is of great importance to enhance the membrane-assisted gas absorption performance by wise and accurate combination of membrane and absorbent.
This research study deals with a highly efficient unique hybrid technique—membrane-assisted gas absorption in designing the separation unit. In order to enhance the separation efficiency and to lower the absorbent volume to membrane area ratio, the special cell was designed based on a combination of two different types of hollow fiber membranes with a dense and porous selective layer. The designed cell separation performance was tested under two different conditions, namely sweeping the permeate side with helium (ideal conditions) and with hydrogen-nitrogen mix (quasi real conditions), and the ammonia capture efficiency was evaluated, taking into account its concentration in the permeate and retentate flows.

2. Materials and Methods

2.1. Materials

According to the purpose of the current study—to evaluate the efficiency of a novel membrane-assisted gas separation unit in the ammonia recovery step of the synthesis technological route—the specific gas mixtures were prepared and sealed in the stainless-steel cylinders. The first one, which contains ammonia to be captured, is identical to the stream leaving the refrigeration block and is recycled to the reactor. It mainly consists of hydrogen and nitrogen, with a small portion of methane, ammonia, and argon, and the proportion is as follows: H2/N2/CH4/NH3/Ar = 62.53/23.1/7.49/2.38/4.5 mol%. The second mixture contains 75 mol% of hydrogen and 25 mol% of nitrogen. That gas mixture is almost equal in composition to the gas stream moving toward the refrigeration block except for the low content of methane and argon (1.03 and 0.27 mol%, respectively). The preparation of gas mixtures was performed using single gases of high purity: NH3 (≥99.9999 vol.%) was purchased from Firm HORST Ltd. (Dzerzhinsk, Russia); H2 (≥99.9999 vol.%), N2 (≥99.99 vol.%), CH4 (≥99.995 vol.%), and Ar (≥99.9999 vol.%) were purchased from NIIKM Ltd. (Moscow, Russia).
The deep eutectic solvent was used as liquid absorbent in the ammonia capturing process using a membrane-assisted gas absorption unit. All reagents needed for the preparations of DES were purchased from Sigma Aldrich Group (Taufkirchen, Germany). In the preparation of specific deep eutectic solvent, the following hydrogen-bond acceptor and donor were used: ammonium thiocyanate (≥99.99%) and urea (≥99.5%). No additional purification of reagents was used and the standard gravimetric method was used. No additional measurements devoted to the moisture content in the prepared DES were performed, as it was prepared under the dry nitrogen environment, further it was sealed in the flask and then was placed in the membrane-assisted gas separation cell connecting the flask to one container and the vacuum pump connected to another container. In this way, there was no contact of prepared DES with the room atmosphere. Taking into account the mixed gas preparation method, there is no source of moisture in the experimental setup, so the influence of water on separation efficiency was not conducted

2.2. Absorbents Screening

The data, obtained during the comprehensive screening of a wide range of absorbent materials is given in Table 1.
In ref. [18], the authors determined the solubility of ammonia in deep eutectic solvents consisting of choline chloride (ChCl) and urea taken in three different molar ratios (2:3, 1:2, and 2:5). The experiment was carried out in the temperature range 298.2–353.2 K and pressure from 0 to 300 kPa. The results showed that the solubility of NH3 in ChCl+urea (1:2) was somewhat higher than in the other two DESs tested. This is explained by the lowest melting point among the liquids studied in the work. According to the authors, this indicates a less dense aggregation of molecules, providing more free volume for gas dissolution.
A class of highly effective deep eutectic solvents for the isolation of NH3 was developed, synthesized, and studied in [19]. Synthesized DESs are composed of choline chloride (ChCl), phenol (PhOH), and ethylene glycol (EG). By exploiting the weak acidity of PhOH, a highly efficient and reversible absorption of NH3 was realized in PhOH-based triple DESs. The solubility of NH3 in prepared DESs can reach 9.619 mol/kg (0.164 g/g) at 298.2 K and 101.3 kPa, which is one of the best values to date.
A study of deep eutectic solvents based on choline chloride using glycerol, ethylene glycol, N-methyl urea, and trifluoroacetamide as HBDs with a fixed molar ratio of 1:2 [20] showed that DES containing glycerol (0.051 g/g) has the highest NH3 solubility.
In ref. [21], a study was made of deep eutectic solvents based on choline chloride (ChCl) with the addition of dihydric alcohols: 1,4-butanediol (1,4-BD), 2,3-butanediol (2,3-BD), and 1, 3-propanediol (1,3-PD) in various molar ratios in the temperature range of 303.15–333.15 K and pressures from 25 to 420 kPa. The highest solubility of NH3 (0.06788 g/g) at 132.8 kPa and 303.15 K was shown by DES ChCl + 1,3-PD (1:4).
Choline chloride DESs using weakly acid azoles, in particular, imidazole (ImZ), triazole (TrZ), and tetrazole (TetrZ) in combination with ethylene glycol (EG) were considered in [22]. DES ChCl + TetrZ + EG showed the highest sorption capacity for ammonia. At a pressure of 104 kPa and a temperature of 313.2 K, the solubility of ammonia was 0.16948 g/g.
In ref. [23], the sorption capacity of ammonia was studied in a number of DESs: choline chloride resorcinol (ChCl + Res), choline chloride phenol (ChCl + Phe), choline chloride glycerol (ChCl + Gly), choline chloride phenol ethylene glycol (ChCl + Phe + EG), choline chloride resorcinol glycerin (ChCl + Res + Gly), choline chloride fructose glycerin (ChCl + D-fructose + Gly), choline chloride malic acid glycerin (ChCl + DL-malic Acid + Gly), choline chloride levulinic acid glycerin (ChCl + Levulinic Acid + Gly), choline chloride oxalic acid glycerin (ChCl + Oxalic Acid + Gly), choline chloride malonic acid glycerin (ChCl + Malonic Acid + Gly), and choline chloride phenylacetic acid glycerol (ChCl + Phenylacetic Acid + Gly). Among the considered liquids, DES ChCl + Res + Gly had the highest ammonia solubility. At a temperature of 313.15 K and a pressure of 101.3 kPa, the sorption capacity was 0.13 g/g.
Deep eutectic solvents based on ethylamine hydrochloride (EaCl) and urea (Urea) were tested in 3 different ratios: 1:2; 1:1; 2:1 in [24]. The most effective was the DES with a molar ratio of EaCl to Urea 1:1 at a temperature of 313.2 K and a pressure close to atmospheric. The ammonia capacity of the absorbent was 0.07788 g/g.
The values of NH3 absorption in prepared mixtures of EaCl+Gly were experimentally measured [25] at various temperatures and pressures. The NH3 capacities of EaCl+Gly mixtures were found to be quite impressive, with a maximum value of 9.631 mol/kg at 298.2 K and 106.7 kPa.
DES, composed of protic ethanolamine hydrochloride (EaCl), weakly acidic resorcinol (Res), and neutral glycerol (Gly), is capable of absorbing 0.240 g NH3/g DES for EaCl/Res/Gly (1:4:5) at 293 K and 0. 1 MPa, which is much higher than most registered DESs. In addition, as reported by the authors in [26], DES EaCl/Res/Gly (1:4:5) has good reversibility, excellent NH3/CO2 selectivity, and is a potential NH3 absorption and storage material for industrial applications.
The ref. [27] describes the sorption capacity of DESs of ethylamine hydrochlorides in combination with phenol in various ratios. The results of the study showed that the solution with the highest proportion of phenol-EaCl+PhOH (1:7), −0.167 g/g at a temperature of 298.2 K and atmospheric pressure, has the highest ammonia solubility.
Ammonium thiocyanate (NH4SCN) was used in [12] as an acceptor of hydrogen bonds in DES for ammonia sorption. Glycerol (Gly), ethylene glycol (EG), urea (Urea), acetamide (AT), and caprolactam (CL) were taken as hydrogen bond donors. The results of the experiment showed a high sorption capacity of sorbents with glycerol, ethylene glycol, and urea. The highest ammonia capacity was observed in DES NH4SCN + Gly and amounted to 0.17642 g/g. Such indicators of sorption capacity turned out to be one of the highest in comparison with the other sorbents considered in the report, which indicates a good prospect for the use of DESs based on ammonium thiocyanate in the tasks of ammonia recovery.
In the ref. [28], NH4SCN was paired with imidazole (Im) DESs to form low-viscous DESs with dual active sites for highly efficient NH3 absorption. The effects of absorption temperature, gas flow rate, water content, and molar ratio on NH3 absorption performance as well as physical properties of NH4SCN/Im DESs were systematically investigated. The absorption capacity of NH4SCN/Im (1:2) DES reached 9.65 mol NH3/kg DES for atmospheric NH3.
In a ref. [29], the authors found that N-methylacetamide (MAA) can form DES with heterocyclic weak acids (HWA) such as imidazole, 1,2,4-triazole, and tetrazole (TetrZ). DES MAA + tetrazole are among the best solvents for NH3 absorption with NH3 solubility of 0.13624 g/g at 313.2 K and 102.9 kPa.
Glycerol (Gly) as a hydrogen bond donor and 1,2,4-triazole (Tri), imidazole (Im), and tetrazole (Tz) as hydrogen bond acceptors were taken for the synthesis of DESs to study the sorption capacity of ammonia [30]. DES containing tetrazole showed the best result, with an ammonia sorption capacity of 0.179 g/g.
Akhmetshina et al. [31] studied the sorption capacity of DES, in which the ionic liquid 1-butyl-3-methylimidazolium methanesulfonate was the hydrogen bond acceptor, and urea was the hydrogen bond donor. The sorption capacity of the obtained DES turned out to be below the average level and amounted to 0.01787 g/g at 172.6 kPa and 313.2 K.
An effective strategy was proposed by combining the protic ILs (PILs) with acidic H and low viscous ethyleneglycol (EG) to form IL-based deep eutectic solvents (DESs) for NH3 absorption [32]. The highest mass capacity of 211 mg NH3/g DES was achieved by [Im][NO3]/EG with molar ratio of 1:3.
In ref. [33], imidazole/resorcinol DESs were studied in different ratios of components (1:1, 1.5:1, 2:1, 2.5:1). The results displayed that binary DES imidazole/resorcinol (1:1) can absorb up to 0.238 g NH3 per g DES at 293.15 K and 0.1 MPa.
Two deep eutectic solvents consisting of urea (U) and choline salts such as dimethyl-di(2-hydroxyethyl)-ammonium chloride [Me2COH2N]Cl and methyl-tri(2-hydroxyethyl)-ammonium chloride [MeCOH3N]Cl prepared in a ratio of 1:1 have been extensively researched for ammonia absorption applications. Kazarina O.V. and co-authors [13] carefully studied their densities, viscosities, refractive indices, and properties associated with the absorption of ammonia; it was found that the resulting DESs have an absorption capacity of 2.078 and 2.632 mol NH3 kg−1 DES for [Me2COH2N]Cl/U and [MeCOH3N]Cl/U, respectively, at 313.2 K and 101.3 kPa, which is about two times higher than for choline chloride/urea (2:3) DES under the same conditions.
A study of the sorption capacity of NH3 in protic ionic liquids showed that the length of the cation chain has little effect on the solubility of NH3 [34]. For this, three ionic liquids were taken: 1-methylimidazolium bis(trifluoromethylsulfonyl)imide ([mim][Tf2N]), 1-ethylimidazolium bis(trifluoromethylsulfonyl)imide ([eim][Tf2N]), 1,2-dimethylimidazolium bis(trifluoromethylsulfonyl)imide ([mmim][Tf2N]), the sorption capacity of ammonia in which practically does not change. The solubility of NH3 in ionic liquids was also evaluated in the work: 1-butylimidazolium bis(trifluoromethylsulfonyl)imide ([bim][Tf2N]), 1-butylimidazolium thiocyanide ([Bim][SCN]), 1-butylimidazolium nitrate ([Bim ][NO3]), 1-butyl-3-methylimidazolium thiocyanide ([Bmim][SCN]), 1-butyl-3-methylimidazolium dicyandiamide ([Bmim][DCA]), 1-butyl-2,3-dimethylimidazolium bis (trifluoromethylsulfonyl)imide ([Bmmim][Tf2N]), 1-butyl-2,3-dimethylimidazolium thiocyanide ([Bmmim][SCN]), 1-butyl-2,3-dimethylimidazolium dicyandiamide ([Bmmim][DCA]), 1-butyl-3-methylimidazolium bis(trifluoromethylsulfonyl)imide ([Bmim][Tf2N]). Taking into account the effect of anions with the same [Bim]+ cation, the order of solubility of NH3 in proton ILs was [Bim][Tf2N]> [Bim][SCN]> [Bim][NO3].
A. Yokozeki and M.B. Schiflert conducted a study in which they experimentally evaluated the solubility of ammonia in a number of ionic liquids: 1-butyl-3-methylimidazolium hexafluorophosphate ([bmim][PF6]), 1-hexyl-3-methylimidazolium chloride ([hmim][Cl]), 1-ethyl-3-methylimidazolium bis(trifluoromethylsulfonyl)imide ([emim][Tf2N]), 1-butyl-3-methylimidazolium bis(trifluoromethylsulfonyl)imide ([bmim][Tf2N]), and 1-butyl-3- methylimidazolium tetrafluoroborate ([bmim][BF4]) [35]. The IL [bmim][PF6] had the highest sorption capacity for ammonia (0.02101 g/g) at 298.2 K and 101.3 kPa.
Li, Zhou and other authors of the study [36] found an increase in the sorption capacity for ammonia in ionic liquids with an increase in the length of the alkyl cations. The work was carried out using ionic liquids with one anion—tetrafluoroborate ([BF4]) and four different cations: 1-ethyl-3-methylimidazolium ([emim]+), 1-butyl-3-methylimidazolium ([bmim]+), 1-hexyl-3-methylimidazolium ([hmim]+), and 1-octyl-3-methylimidazolium ([omim]+). It was found that the solubility of ammonia increases in the series [omim][BF4] > [hmim][BF4] > [bmim][BF4] > [emim][BF4]. Thus, the IL [omim][BF4] had the highest ammonia sorption capacity (0.2333 g/g) at 120 kPa and 298.15 K.
A class of ionic liquids based on 1,1,3,3-tetramethylguanidinium (TMG) with anions: tetrafluoroborate ([BF4]), bis(trifluoromethylsulfonyl)imide ([Tf2N]-) was synthesized and studied in [37]. It was found that the absorbent [TMGH][BF4] had the highest ammonia solubility (0.09006 g/g) at 101.3 kPa and 293.2 K.
In ref. [38], the following was studied: a series of hydroxyl-functionalized 1-2(-hydrohexyl)-3-methylimidazolium ILs ([EtOHmim]) with anions of thiocyanide (SCN), nitrate (NO3), hexafluorophosphate (PF6), tetrafluoroborate (BF4), bis(trifluoromethylsulfonyl)imide (Tf2N), and dicyandiamide (DCA). Among the considered ILs, the [EtOHmim][BF4] IL had the highest ammonia solubility, being able to absorb 0.045 g of NH3 per gram of IL at 101.3 kPa and 313.15 K.
The following was studied: the solubilities of ammonia in room temperature ionic liquids 1-ethyl-3-methylimidazolium acetate [emim][Ac], 1-ethyl-3-methylimidazolium thiocyanate [emim][SCN], 1-ethyl-3-methylimidazolium ethylsulfate [emim][EtOSO3], and N,N-dimethylethanolammonium acetate [DMEA][Ac]. Among the considered ILs, [DMEA][Ac] had the highest solubility, the capacity of which is 0.10006 g/g at 298.1 K and 101.3 kPa [39].
In ref. [40], the experimental values of densities, viscosities, and refractive indices at 298.15 K and atmospheric pressure are reported for ternary and coupled binary mixtures of tris(2-hydroxyethyl)methylammonium methylsulfate [MTEOA][MeOSO3]. The solubility of ammonia in the studied IL was 0.082 g/g.
Kazarina O.V. and other authors of the study [17] studied ammonia sorption in novel room temperature ionic liquids (RTILs) such as dimethyl (IL-4) and methyl mono-(di-)(2-hydroxyethyl) (2-hydroxyethoxy)ethyl chloride (IL- 5), all of which were characterized by FT-IR, 1H, and 13C NMR.
The paper [41] explores a number of multidimensional covalent organic frameworks (COFs) that are densely functionalized with various active groups such as –N–H, –C=O, and a carboxyl group. Due to the synergistic multidimensional and exposed metal site, COF materials show excellent adsorption capacity (0.15915 g/g for [HOOC]17-COFs at 100 kPa and 298 K).
A study of the solubility of NH3 in the ionic liquid 1-n-butyrate-3-methylimidazolium bis(trifluoromethylsulfonyl)imide ([HOOC(CH2)3mim][NTf2]) showed the following result: 0.058 g of ammonia dissolves in 1 g of IL [42]. At a temperature of 293.15 K, the sorbent is characterized by high viscosity—more than 1500 mPa s, which sharply decreases upon heating, and at a temperature of 313.15 K, it is about 350 mPa s.

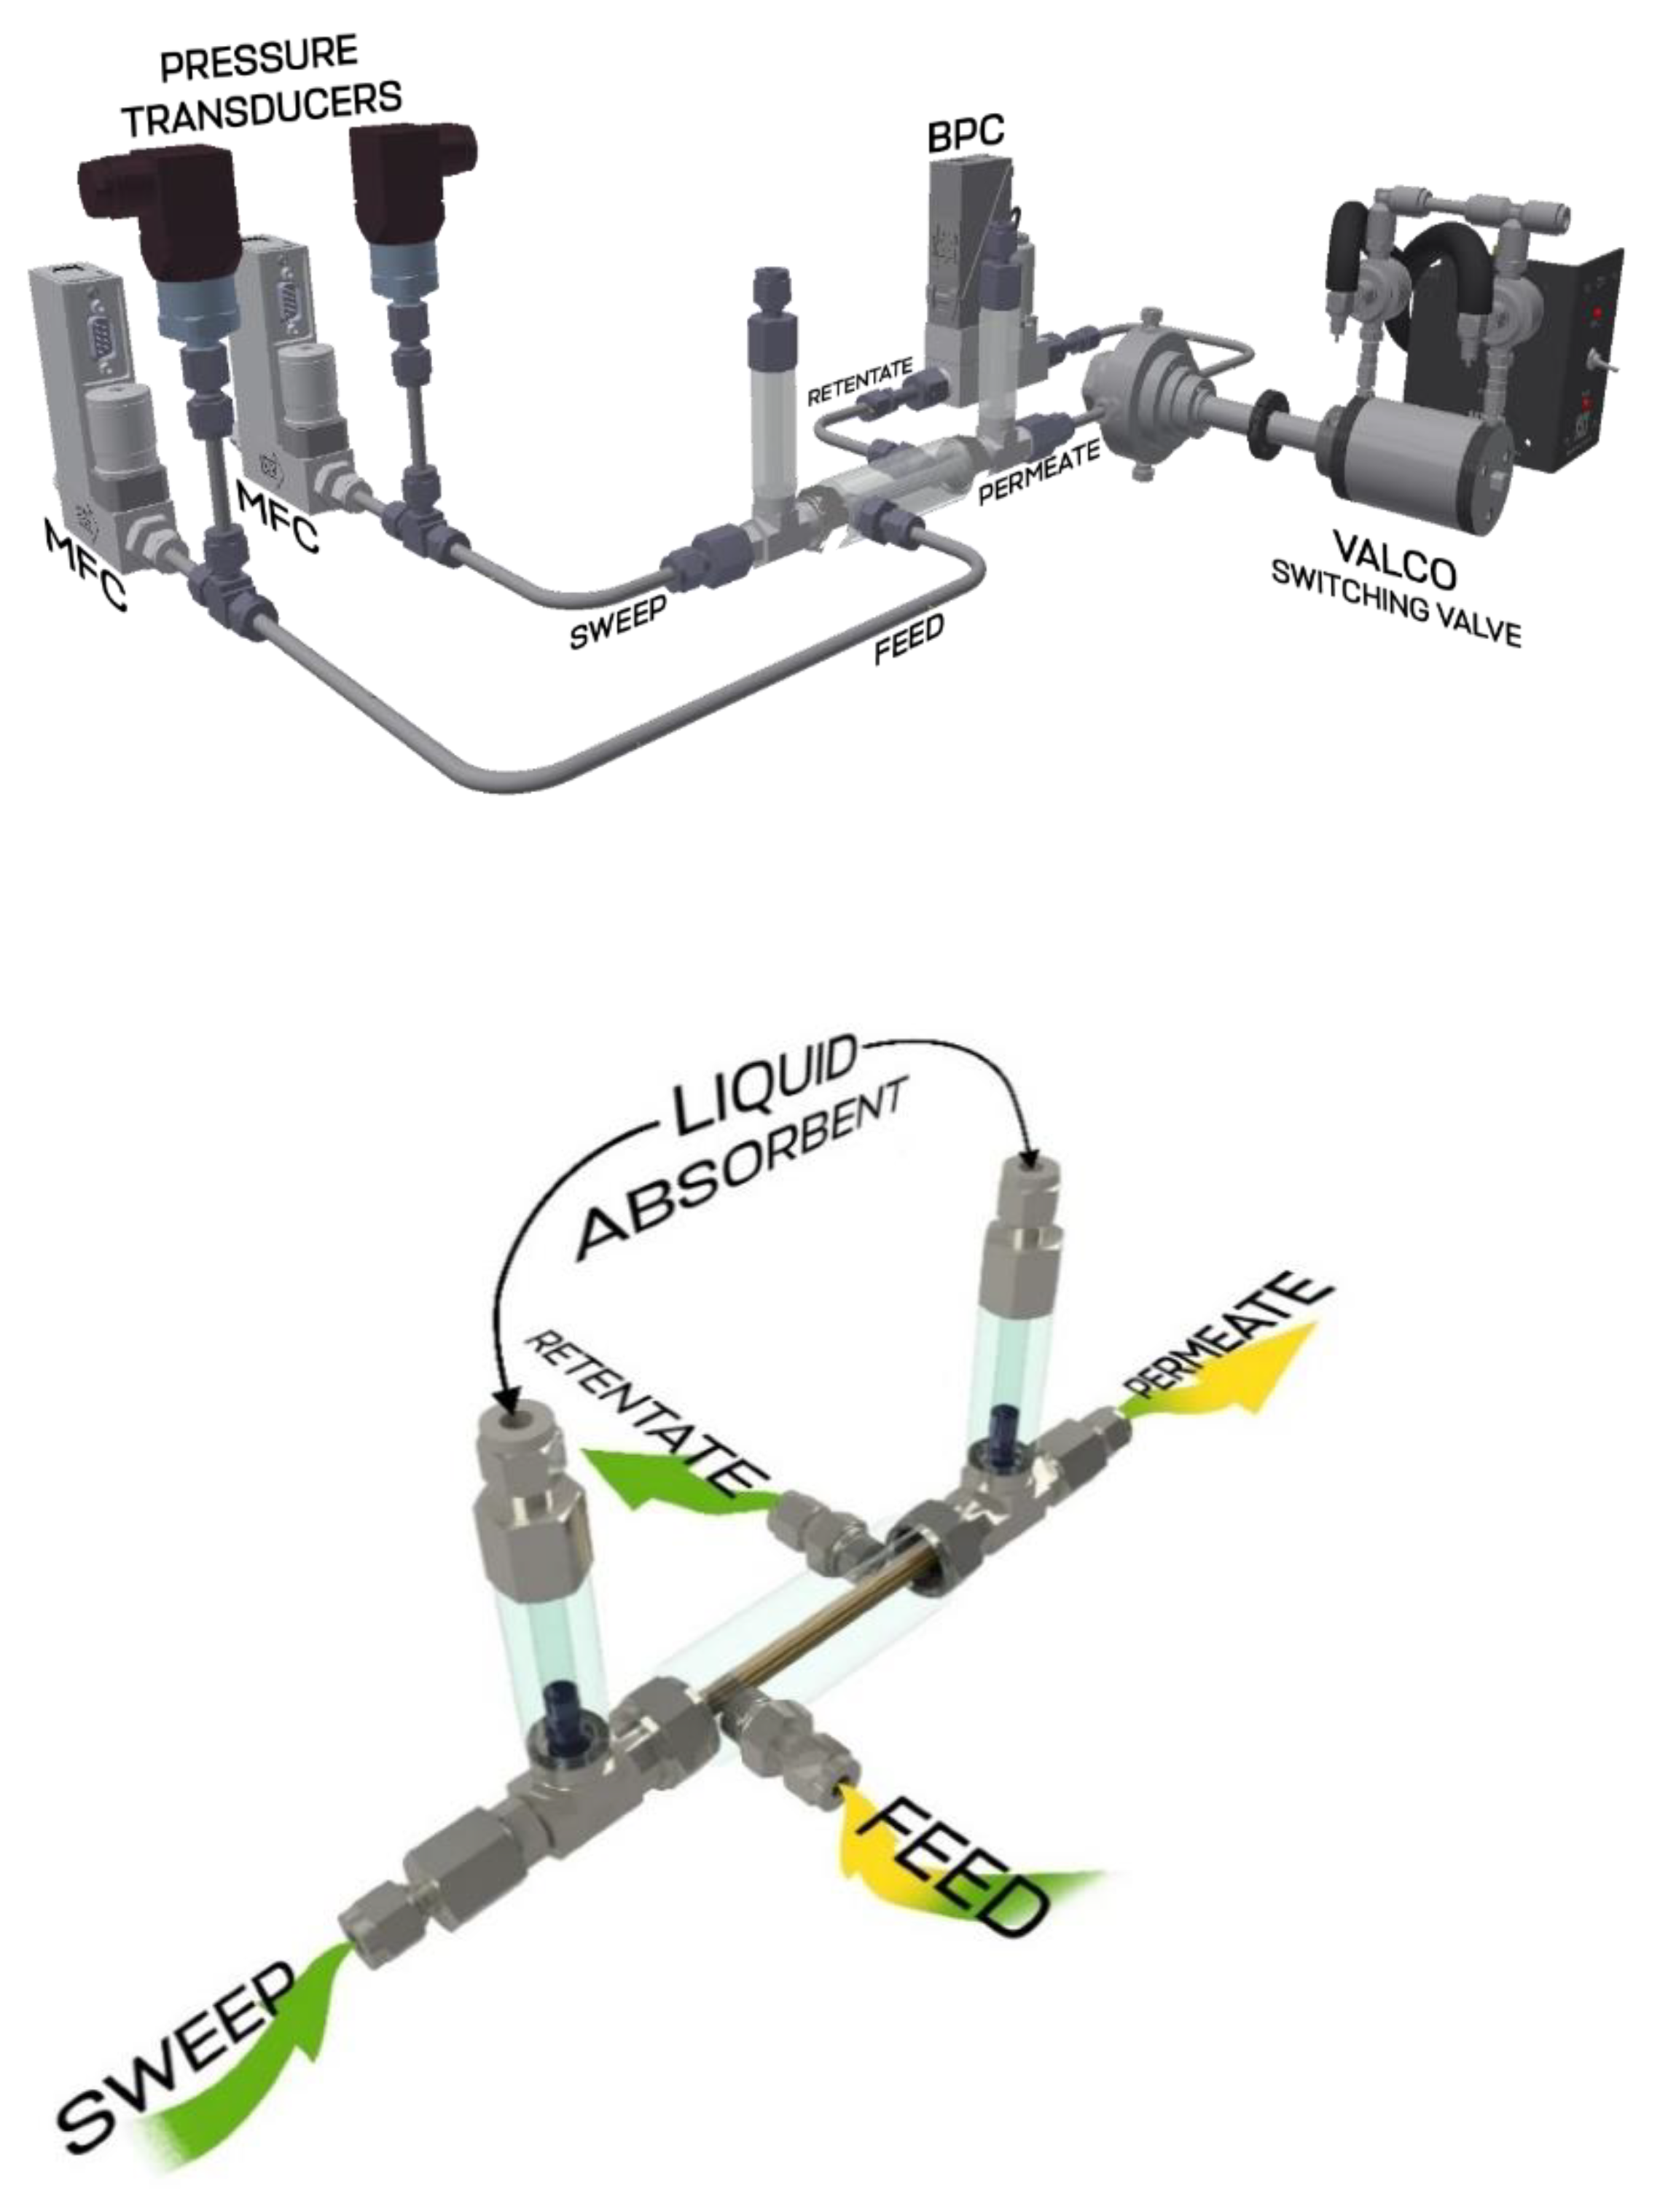
2.3. Experimental Setup

The principal scheme of the experimental setup on the top part, the 3D image of the membrane-assisted gas separation cell in the middle, and its scheme on the bottom are shown in Figure 1. In that unit, the separation occurs under the counter-current flow mode. In this way, the feed and permeate streams are connected to one side of the separation cell; meanwhile, the retentate and permeate sweep are on the opposite of the cell. Both the feed and the permeate sweep stream are equipped with high-precision mass flow controller provided by Bronkhorst (El-Flow Prestige FG-201CV, Veenendaal, Netherlands) and pressure transmitters by Wika (S-20), Klingenberg, Germany. In order to maintain constant pressure during the separation process, the retentate line is equipped with a back pressure controller (EL-Press P-702CM) by Bronkhorst, Veenendaal, Netherlands. The permeate line pressure is a process-controlled value and is formed by the pneumatic resistance in the fibers and permeated gas stream; in other words, it is not maintained manually by the operator. The process outlet streams, retentate and permeate, are connected to the pneumatic actuated selector valve by VICI Valco (A4VL4MWE2, Schenkon, Switzerland), equipped with a high-speed switching accessory (HSSA), which allows performing quick switching, requiring only 8 ms. It is used to perform alternate switching of the streams to be analyzed with the gas chromatography system and this device does not create pneumatic resistance in the line, which is typical for the common valves, where the switching time is more than 180 ms. After the stream of interest is determined, it flows toward the analytical system presented gas chromatograph by Chromos, where the sample is separated in column under isothermal conditions and is detected by the thermal conductivity detector (TCD). The detailed GC-analysis conditions are presented in Table 2.
The experimental procedure includes the supply of gas mixture to the feed inlet of the experimental setup through the pressure regulator DRASTAR, maintaining the constant pressure before the mass flow controller which provides the accurate flow rate of a mixture to be separated. Feed enters the membrane-assisted gas separation cell, where ammonia is captured using a combined membrane-absorbent system and moved to the permeate stream. Further, the permeated ammonia stream is picked up with a sweep supplied through the pressure and mass flow controllers and moves out of the cell as well as the retentate stream, which is now depleted of ammonia. The back pressure controller mounted on the retentate line maintains the constant value along the whole line from feed to itself and guarantees constant pressure difference across the combined system. Both the permeate and retentate stream samples are alternately analyzed using the GC system [7] to obtain the dynamics of reaching the steady-state and separation performance. Experimental conditions in detail are given in Table 3.

2.4. Membrane-Assisted Gas Absorption Cell Design

Here, the special separation cell design was proposed to implement capture of the NH3 from the recycle loop of the Haber–Bosch process (Figure 2). Here, two different types of hollow fiber membranes are used: pervaporation hollow fiber membrane PS-50, provided by the Laboratory of Membrane Processes of the Institute of Physical Organic Chemistry of the National Academy of Sciences of Belarus and gas separation asymmetric hollow fiber membrane made of polysulfone provided by Hangzhou Kelin Aier Qiyuan Equipment Co., Ltd. (Hangzhou, China) Plexiglas made of polymethyl methacrylate was used as a shell of the membrane module in order to be able to visually monitor the process.
The key feature of the membrane-assisted gas separation cell is the implementation of a combined system of two types of hollow fiber polymer membranes. In the end parts of the module housing, a special sealing compound is used to fix the pervaporation polymer fiber used to provide the contact between two phases (the gas mixture to be separated and absorbing liquid). The gas separation hollow fiber membrane is placed inside of the pervaporation fiber and is used to remove the continuously desorbed gas phase from the liquid. The fixation and sealing of the gas separation hollow fibers are made not in the end parts of the module shell, as in the case of pervaporation fiber, but along the edges of the pipe fittings—tees, fixed on the ends of the module shell. This configuration allows the formation of a gap between the two types of fibers and eliminates the possibility of liquid entering the gas separation hollow fibers. The liquid absorbent is loaded into special cylindrical containers placed on a tee connecting the shell of the separation cell with the gas distribution system. The containers with the absorbent are mounted between the ends of the hollow fibers so the liquid is in the gap formed by the two fibers. Thus, the liquid absorbent is located in a closed volume between two hollow polymer fibers, through one of which the feed gas mixture contacts the liquid absorbent, and through the other the absorbed component is removed. On the outer surface of the cylindrical shell of the separation cell, two nipples are fixed: one is the feed mixture inlet and the other is the retentate outlet.
The separation process occurs as follows. One of the nipples fixed on the outer surface of the separation cell shell is supplied with a feed mixture flow, which fills the internal volume of the cell and contacts the liquid absorbent, located in the gap between two fibers, through the pervaporation fibers. Further, the components, which are dissolved in the absorbent, are removed from it under the pressure gradient and move to the permeate side of the cell through the gas separation hollow fiber and form a stream enriched with a high-soluble component. Components that are characterized by low solubility in the used absorbent form a retentate stream and are removed from the membrane-assisted separation cell through a nipple mounted on the opposite side of the shell. The permeate side of the designed module is a flow-through volume and allows mass transfer between two recirculation circuits of gas mixtures in the process of ammonia synthesis.

2.5. Membrane Permeance Test

The ideal gas transport characteristics of hollow fibers were determined using a well-known time-lag experimental setup (Dynes–Barrer method) [43,44]. The setup principal scheme is given in Figure 3. The gas distribution system includes a membrane test cell (1), a vacuum station (2), (Pfeiffer Hi-Cube 80 ECO) manual pressure regulator (3), RPA1 (A-Flow), diaphragm manual valves (4), SS-DSS4 (Swagelok) diaphragm valves with pneumatic actuators (5), 6LVV-DPFR4-P1-C (Swagelok) pressure transducers (6): 0–16 bar (Wika S-10) on the feed side and 0–100 Torr on the permeate side (MKS Instruments 750B), pressure gauges (7): −0.1–1.5 MPa on the feed side and −0.1–0.3 MPa on the permeate side.
Once the membrane sample was placed in the test cell, the entire system was evacuated to a residual pressure of <0.13 kPa. After that, the system was disconnected from the vacuum pump and pure gases (N2, H2, CH4, Ar, and NH3) were sequentially supplied to it under a pressure of 101.325 kPa. Between each test, the system was purged with helium and evacuated using a vacuum station during the 2 h.
Permeance Q was calculated according to:
Q = V p 2 V m p 0 1 S τ p 1 p 2
where V—permeate side volume (mL); Vm—molar volume (mL/mol); p0—atmospheric pressure (Pa); p1—pressure on the feed side (Pa); S—effective membrane area (m2); τ—duration of the experiment (s); p2—pressure on the permeate side (Pa). Next, the permeance was converted into GPU units, using the following equation:
1   GPU = 3.346 × 10 10 mol   m 2   s   Pa
Ideal selectivity of the sample is calculated from:
α = Q A / Q B
where QA and QB are the permeance of gases A and B.

3. Results and Discussion

3.1. Membrane Permeance

After the appropriate liquid absorbent was chosen based on comprehensive material screening (Section 2.2), the critical issue is the suitable membrane material, taking into account its mass transfer properties (permeance, selectivity) and stability in the presence of plasticizing components, such as ammonia. Recently, Petukhov A.N. et al. presented their study, containing their conclusions on the most suitable absorbents and membranes for membrane-assisted gas separation using the radial configurated cell with a flat membrane. The key requirement put forward for the membrane is high permeance; meanwhile, high selectivity is provided by the liquid absorbent. As was shown previously, the NH3/H2 selectivity gained up to 376 using the combined PVTMS-NH4SCN:EG system (the ideal membrane selectivity is 4.5), wherein the PVTMS permeance for pure ammonia is 3300 GPU.
The current study deals with a novel membrane-assisted gas separation cell designed for the hollow fibers. Unfortunately, there is no PVTMS hollow fibers production in the world, so it is of great importance to find the membrane with the mass transfer characteristics close to the mentioned ones. Moreover, there are very few papers providing data on ammonia permeance, especially for hollow fibers. Because of that, and in order to accurately determine the suitable membrane, the experimental study of PSF and PEI+PI membrane mass transfer properties was performed and the results are given in Table 4.
As is seen from Table 4, the PSF membrane provides quite high NH3 permeance, up to 1691 GPU; meanwhile, the PEI+PI membrane provides more than four times lower permeance. With respect to selectivity, both the PSF and PEI+PI membranes provide low selectivity for gas pair NH3/H2 of 3, wherein regarding NH3/N2, NH3/Ar, and NH3/CH4, the PEI+PI membrane is characterized by higher selectivity of 250.6, 148.5, and 143.2, respectively, comparing to PSF (77.9, 54, 73.5 for the same gas pairs). Despite the high selectivity for those gas pairs, both membrane materials could not provide sufficient separation for the NH3/H2 pair due to very low selectivity. Taking into account the composition of gas mixture to be separated (hydrogen is the matrix −62.53 mol% and ammonia is impurity −4.5 mol%), there is no sufficient ammonia partial pressure difference in the common membrane gas separation process to achieve the goal of the process—preferential capture of ammonia using the single stage. Because of that, and as the liquid absorbent provides the process’s selectivity, it is preferential to choose the more permeable membrane, so the polysulfone hollow fiber is the best choice for the membrane-assisted gas separation cell.

3.2. Membrane-Assisted Gas Separation Cell Performance: Helium Sweep Mode

At first, the ammonia capture performance was tested under the sweep of the cell permeate side with a constant helium flow in order to evaluate the efficiency in ideal conditions. The results obtained during these ideal conditions performance test is given in Figure 4 and Figure 5, where the NH3 concentration values in permeate and retentate flows are shown as a function of feed flow rate (Lfeed, cm3 min−1) and the other components of the mix (H2, N2, Ar, and CH4) are plotted against the same value. As is seen from the graphs given in Figure 4, the NH3 content in the permeate stream rises over the whole range of considered feed flow rate, wherein the quite modest change in concentration is observed in the range of 30.5–36.5 cm3 min−1; meanwhile, the dramatic increase in NH3 content occurs in the range of feed flow rate of 38.5–42.5 cm3 min−1. The lowest ammonia content (81.3 mol%) in the permeate is obtained for the feed flow rate of 30.5 cm3 min−1 and the ultimate capture efficiency is achieved at 42.5 cm3 min−1 of feed flow −96.1 mol% of ammonia on the permeate side.
Considering the change in the ammonia content in the retentate flow, it is seen that the character of the graph tends to the linear dependency of feed flow rate in the whole range. It is seen that the increase in feed flow rate increases the ammonia concentration in the retentate flow and it reaches its maximum at the 42.5 cm3 min−1 of 2.12 mol%; meanwhile, the lowest value of 0.12 mol% is achieved at the lowest feed flow rate of 30.5 cm3 min−1. So, it is seen that the highest NH3 content in the permeate corresponds to the highest NH3 content in the retentate and opposite. In other words, there is a trade-off between the purity of ammonia to be captured and its recovery rate, which is typical for separation processes.
The obtained dependencies are well-explained by the features of the present separation process—membrane-assisted gas absorption. The liquid absorbent layer between two fibers is a virtually impermeable barrier for gases, which is characterized with low solubility in NH4SCN:Urea DES, and the mass transfer may only be provided by the diffusion of gas molecules through three barriers, namely two membranes and the liquid layer. The hydrogen molecule has the smallest kinetic diameter (except the ammonia) among other components of the mix [45,46], so the combined membrane-absorbent system allows the hydrogen to permeate in a very small amount, considering that the hydrogen partial pressure is the highest. At a low feed flow rate, the amount of ammonia is not sufficient to saturate all available absorbent volume, so other gases permeate too (Figure 5). Increasing the feed flow rate, the amount of ammonia, which is in contact with the combined membrane-absorbent system at the unit of time, is increased, so the continuous process of absorption–desorption on the opposite sides of the combined system generates growth in the ammonia content available for transfer across that system. At high feed fluxes, the combined system predominantly provides the NH3 ammonia mass transfer, so the other mix components remain at the upper side of the system and are removed with retentate. This enrichment of permeate with NH3 is accompanied by losses; as the greater amount of ammonia is supplied with increase in feed flow, the greater amount of it is not absorbed during contact, so the flow at the shell is being depleted of ammonia inefficiently and the retentate contains quite a lot of ammonia.

3.3. Membrane-Assisted Gas Separation Cell Performance: H2/N2 Mix Sweep Mode

Following the ideal conditions performance test, the membrane-assisted gas absorption cell was tested under the sweep of the permeate side with a constant H2/N2 mix in which a constant flow equals the previous one (30 cm3 min−1). The results obtained for these runs are represented as the graphs given in Figure 6 and Figure 7; the first shows the ammonia content in permeate and retentate plotted versus the feed flow rate, and the second shows the change in H2, N2, Ar, and CH4 concentrations over the observed feed flow rate range. In order to be able to compare the performance of the cell under these two experimental modes, in that case, the permeate flow content was determined taking into account the composition of sweep; in other words, the composition of the sum flow was determined and then, knowing the flow rate and its composition, the neat permeate flow composition was found.
As is seen from the graphs given in Figure 6, the characters of the obtained dependencies are similar to the previous one, and the NH3 concentration increases with an increase of feed flow rate over the whole observed range (30.5–42.5 cm3 min−1). Nevertheless, the NH3 concentration in permeate is slightly higher, especially in the range of feed flow rate from 30.5 to 36.5 cm3 min−1 (the growth of about 3.5–3.7 mol%). Increasing the feed, the growth in NH3 concentration slows down and the difference becomes lower than 3 mol%, and at the feed flow rate of 42.5 cm3 min−1, it is equal to 1.3 mol%. At this point, the ammonia concentration is 97.5 mol%, and at the feed flow rate of 30.5 cm3 min−1, it is equal to 85 mol%. Wherein, the NH3 content in retentate becomes lower when comparing the helium sweep mode and at the lowest observed feed flow rate, it is lower, 1 mol%, and the maximum observed NH3 concentration in the retentate is 1.5 mol%, which is lower by 0.6 mol%. As the character and the reason of these dependencies were discussed earlier, it is of great importance to explain the rise in the separation performance under the H2/N2 mix sweep mode. Here, the sweep contains the 75 mol% of hydrogen and 25 mol% of nitrogen; meanwhile, the feed contains the 62.5 mol% of hydrogen and 23.1 mol% of nitrogen and is supplied under the pressure of 0.4 MPa, so the partial pressure gradient is about 0.15 MPa in the case of H2 and 0.06 MPa in the case of N2, which is obviously lower than in the case of helium sweep mode; meanwhile, the ammonia partial pressure difference across the combined system remains unchanged. Because of that, the permeate is preferentially enriched with NH3 and is less enriched with H2 and N2, comparing the helium sweep mode.
Comparing the results obtained on the H2, N2, Ar, and CH4 content in the permeate (Figure 7) with the same values of helium sweep mode, it is seen that not only the H2 and N2 content decreased (affected by partial pressure difference drop), but Ar and CH4 concentration values became lower. Nevertheless, among these components, the H2 and N2 occupy the main place, and those concentrations change from 10.5 to 1.63 mol% and from 3.51 to 0.62 mol% for H2 and N2, respectively, increasing the feed flow rate from 30.5 cm3 min−1 to 42.5 cm3 min−1. These values are lowered by 0.84–1.83 and 0.25–0.82 mol% in the case of H2 and N2, respectively. Considering the Ar and CH4 content in the permeate flow, these values are lower, 0.8 mol% over the whole range of observed feed flow rate; meanwhile, under the helium sweep mode, they were up to 1.9 mol%.

3.4. The Steady-State Establishing Dynamic

The data obtained for the dynamics for establishing the steady-state mode of the separation process using the hollow-fiber-based membrane-assisted gas absorption cell are given in Figure 8 and represent the NH3 content in the permeate stream versus process duration under the H2/N2 mix sweep mode for four different feed flow rates (30.5, 34.5, 38.5, and 42.5 cm3 min−1). The reason to choose mix sweep mode is that this regime is close to the industry one, where authors propose to apply the present technique. Here, the steady-state was considered as having been achieved after the ammonia concentration value remained constant or the graph, which represents its concentrations, changed over the process duration time to form a plateau. The time required to establish the steady-state is determined as the first point of the graph, after which there is no change in NH3 content in the permeate. The time difference between each point is the GC analysis duration and it equals fifteen minutes.
As is seen from the graphs given in Figure 8, the time required to establish the steady-state is in the range of 4–5.25 h and it is a strong function of feed flow rate. Moreover, the time required to establish the steady-state decreases with an increase in feed flow rate; namely, in the case of feed flow rate of 30.5 cm3 min−1, the steady-state established 5 h and 15 min after the process was launched, increasing the feed flow rate up to 34.5 cm3 min−1 decreases the time to reach steady-state by 45 min, and the following growth in feed flow rate up to 38.5 and 42.5 cm3 min−1 reduces the required time by 15 min between each case.
As was mentioned previously, the increase in feed flow rate increases the amount of ammonia, which is in contact with the absorbent liquid layer at the unit of time. As the steady-state is established when the absorbent is completely saturated with ammonia, the higher feed flow rate provides faster reaching of the steady-state mode of the process. The DES used in this research was characterized with quite high ammonia absorption capacity of 146.3 g (NH3) per kg (DES) [12], so it required a few hours to establish the steady-state. In a recent study [7], it was found that for the same absorbent using the radial flat-sheet cell configuration, where the membrane area/absorbent volume ratio is much higher than the present case, the time required to establish the steady-state was equal to 3 h and 45 min. Despite the lowering of the amount of the absorbent, which means there is a shorter path for gas molecules to pass and lower volume of absorbent to saturate, the increase in the time to reach the steady-state compared to previous study is explained by the lower ammonia content in the feed; meanwhile, the recent study deals with a mix containing 15.5% of ammonia, the present one deals with 4.5 mol% of NH3 in the feed in the presence of four other components, the diffusion of which through the absorbent apparently affects the saturation of the DES.

4. Conclusions

Being a continuation of a membrane-assisted gas absorption technique study, the present study improves the efficiency of a separation cell in mass transfer through the optimization of unit configuration, decreasing the absorbent volume to membrane area ratio and implementing a combined system, which includes two types of hollow fibers. The examples covered in the present study include two different process modes: sweeping the permeate (bore) side of the cell with helium and with hydrogen-nitrogen mix, it was shown that the designed unit demonstrates high efficiency in the ammonia capture application in a single step.
As a result of the experimental study of the novel membrane-assisted gas absorption cell in ammonia capture application, it was shown that the ultimate achievable NH3 concentration in the permeate is 97.5 mol% (in the case of H2/N2 mix sweep mode); meanwhile, sweeping the bore side with helium provides the 96.12 mol% of ammonia in the permeate. Nevertheless, there is a trade-off between the product concentration and recovery rate, so the ultimate NH3 content in permeate is coupled with its losses in the retentate (up to 1.5 and 2.12 mol% residual NH3 under the H2/N2 and helium sweep mode, respectively).

Author Contributions

Conceptualization, A.N.P. (Anton N. Petukhov), A.A.A. and I.V.V.; methodology, A.V.V.; software, S.S.K. and D.M.Z.; validation, M.E.A. and E.A.S.; formal analysis, A.A.G.; investigation, K.A.S.; resources, A.N.M.; data curation, A.N.P. (Anton N. Petukhov); writing—original draft preparation, A.A.A.; writing—review and editing, A.A.A.; visualization, A.N.S.; supervision, I.V.V.; project administration, I.V.V.; funding acquisition, A.N.P. (Anastasia N. Petukhova). All authors have read and agreed to the published version of the manuscript.

Funding

The main part of reported study was funded by the Russian Science Foundation according to research project No. 17-79-20286. The additional study devoted to the GC analysis of gas mixture was financially supported by the Academic Leadership Program «Priority 2030» UNN, project H-474-99-2021-2023.

Institutional Review Board Statement

Not applicable.

Informed Consent Statement

Not applicable.

Data Availability Statement

Not applicable.

Conflicts of Interest

The authors declare no conflict of interest.

References

  1. Global Ammonia Annual Production Capacity | Statista. Available online: https://www.statista.com/statistics/1065865/ammonia-production-capacity-globally/ (accessed on 14 April 2022).
  2. US990191A—Process of Producing Ammonia—Google Patents. Available online: https://patents.google.com/patent/US990191 (accessed on 22 January 2020).
  3. Humphreys, J.; Lan, R.; Tao, S. Development and Recent Progress on Ammonia Synthesis Catalysts for Haber–Bosch Process. Adv. Energy Sustain. Res. 2021, 2, 2000043. [Google Scholar] [CrossRef]
  4. Wang, Q.; Guo, J.; Chen, P. Recent Progress towards Mild-Condition Ammonia Synthesis. J. Energy Chem. 2019, 36, 25–36. [Google Scholar] [CrossRef] [Green Version]
  5. Smart, K. Review of Recent Progress in Green Ammonia Synthesis. Johns. Matthey Technol. Rev. 2021, 66, 230. [Google Scholar] [CrossRef]
  6. Ghavam, S.; Vahdati, M.; Wilson, I.A.G.; Styring, P. Sustainable Ammonia Production Processes. Front. Energy Res. 2021, 9, 34. [Google Scholar] [CrossRef]
  7. Petukhov, A.N.; Atlaskin, A.A.; Kryuchkov, S.S.; Smorodin, K.A.; Zarubin, D.M.; Petukhova, A.N.; Atlaskina, M.E.; Nyuchev, A.V.; Vorotyntsev, A.V.; Trubyanov, M.M.; et al. A Highly-Efficient Hybrid Technique—Membrane-Assisted Gas Absorption for Ammonia Recovery after the Haber–Bosch Process. Chem. Eng. J. 2021, 421, 127726. [Google Scholar] [CrossRef]
  8. Atlaskin, A.A.; Kryuchkov, S.S.; Smorodin, K.A.; Markov, A.N.; Kazarina, O.V.; Zarubin, D.M.; Atlaskina, M.E.; Vorotyntsev, A.V.; Nyuchev, A.V.; Petukhov, A.N.; et al. Towards the Potential of Trihexyltetradecylphosphonium Indazolide with Aprotic Heterocyclic Ionic Liquid as an Efficient Absorbent for Membrane-Assisted Gas Absorption Technique for Acid Gas Removal Applications. Sep. Purif. Technol. 2021, 257, 117835. [Google Scholar] [CrossRef]
  9. Atlaskin, A.A.; Kryuchkov, S.S.; Yanbikov, N.R.; Smorodin, K.A.; Petukhov, A.N.; Trubyanov, M.M.; Vorotyntsev, V.M.; Vorotyntsev, I.V. Comprehensive Experimental Study of Acid Gases Removal Process by Membrane-Assisted Gas Absorption Using Imidazolium Ionic Liquids Solutions Absorbent. Sep. Purif. Technol. 2020, 239, 11578. [Google Scholar] [CrossRef]
  10. Vorotyntsev, I.V.; Atlaskin, A.A.; Trubyanov, M.M.; Petukhov, A.N.; Gumerova, O.R.; Akhmetshina, A.I.; Vorotyntsev, V.M. Towards the Potential of Absorbing Pervaporation Based on Ionic Liquids for Gas Mixture Separation. Desalin. Water Treat. 2017, 75, 305–313. [Google Scholar] [CrossRef]
  11. Atlaskin, A.A.; Petukhov, A.N.; Yanbikov, N.R.; Salnikova, M.E.; Sergeeva, M.S.; Vorotyntsev, V.M.; Vorotyntsev, I.V. Evaluation of the Absorbing Pervaporation Technique for Ammonia Recovery after the Haber Process. Chem. Process. Eng.—Inz. Chem. I Proces. 2018, 39, 323–333. [Google Scholar] [CrossRef]
  12. Deng, D.; Gao, B.; Zhang, C.; Duan, X.; Cui, Y.; Ning, J. Investigation of Protic NH4SCN-Based Deep Eutectic Solvents as Highly Efficient and Reversible NH3 Absorbents. Chem. Eng. J. 2019, 358, 936–943. [Google Scholar] [CrossRef]
  13. Kazarina, O.V.; Agieienko, V.N.; Petukhov, A.N.; Vorotyntsev, A.V.; Atlaskina, M.E.; Atlaskin, A.A.; Kryuchkov, S.S.; Markov, A.N.; Nyuchev, A.V.; Vorotyntsev, I.V. Deep Eutectic Solvents Composed of Urea and New Salts of a Choline Family for Efficient Ammonia Absorption. J. Chem. Eng. Data 2022, 67, 138–150. [Google Scholar] [CrossRef]
  14. Atlaskina, M.E.; Atlaskin, A.A.; Kazarina, O.V.; Petukhov, A.N.; Zarubin, D.M.; Nyuchev, A.V.; Vorotyntsev, A.V.; Vorotyntsev, I.V. Synthesis and Comprehensive Study of Quaternary-Ammonium-Based Sorbents for Natural Gas Sweetening. Environments 2021, 8, 134. [Google Scholar] [CrossRef]
  15. Vekariya, R.L. A Review of Ionic Liquids: Applications towards Catalytic Organic Transformations. J. Mol. Liq. 2017, 227, 44–60. [Google Scholar] [CrossRef]
  16. Lei, Z.; Chen, B.; Koo, Y.M.; Macfarlane, D.R. Introduction: Ionic Liquids. Chem. Rev. 2017, 117, 6633–6635. [Google Scholar] [CrossRef] [Green Version]
  17. Kazarina, O.V.; Agieienko, V.N.; Nagrimanov, R.N.; Atlaskina, M.E.; Petukhov, A.N.; Moskvichev, A.A.; Nyuchev, A.V.; Barykin, A.V.; Vorotyntsev, I.V. A Rational Synthetic Approach for Producing Quaternary Ammonium Halides and Physical Properties of the Room Temperature Ionic Liquids Obtained by This Way. J. Mol. Liq. 2021, 344, 117925. [Google Scholar] [CrossRef]
  18. Zhong, F.Y.; Huang, K.; Peng, H.L. Solubilities of Ammonia in Choline Chloride plus Urea at (298.2–353.2) K and (0–300) KPa. J. Chem. Thermodyn. 2019, 129, 5–11. [Google Scholar] [CrossRef]
  19. Zhong, F.Y.; Peng, H.L.; Tao, D.J.; Wu, P.K.; Fan, J.P.; Huang, K. Phenol-Based Ternary Deep Eutectic Solvents for Highly Efficient and Reversible Absorption of NH3. ACS Sustain. Chem. Eng. 2019, 7, 3258–3266. [Google Scholar] [CrossRef]
  20. Duan, X.; Gao, B.; Zhang, C.; Deng, D. Solubility and Thermodynamic Properties of NH3 in Choline Chloride-Based Deep Eutectic Solvents. J. Chem. Thermodyn. 2019, 133, 79–84. [Google Scholar] [CrossRef]
  21. Deng, X.; Duan, X.; Gong, L.; Deng, D. Ammonia Solubility, Density, and Viscosity of Choline Chloride-Dihydric Alcohol Deep Eutectic Solvents. J. Chem. Eng. Data 2020, 65, 4845–4854. [Google Scholar] [CrossRef]
  22. Zhong, F.Y.; Zhou, L.; Shen, J.; Liu, Y.; Fan, J.P.; Huang, K. Rational Design of Azole-Based Deep Eutectic Solvents for Highly Efficient and Reversible Capture of Ammonia. ACS Sustain. Chem. Eng. 2019, 7, 14170–14179. [Google Scholar] [CrossRef]
  23. Li, Y.; Ali, M.C.; Yang, Q.; Zhang, Z.; Bao, Z.; Su, B.; Xing, H.; Ren, Q. Hybrid Deep Eutectic Solvents with Flexible Hydrogen-Bonded Supramolecular Networks for Highly Efficient Uptake of NH3. ChemSusChem 2017, 10, 3368–3377. [Google Scholar] [CrossRef] [PubMed]
  24. Zhang, J.Y.; Kong, L.Y.; Huang, K. NH3 Solubilities and Physical Properties of Ethylamine Hydrochloride plus Urea Deep Eutectic Solvents. J. Chem. Eng. Data 2019, 64, 3821–3830. [Google Scholar] [CrossRef]
  25. Jiang, W.J.; Zhong, F.Y.; Liu, Y.; Huang, K. Effective and Reversible Capture of NH3 by Ethylamine Hydrochloride Plus Glycerol Deep Eutectic Solvents. ACS Sustain. Chem. Eng. 2019, 7, 10552–10560. [Google Scholar] [CrossRef]
  26. Luo, Q.; Hao, J.; Wei, L.; Zhai, S.; Xiao, Z.; An, Q. Protic Ethanolamine Hydrochloride-Based Deep Eutectic Solvents for Highly Efficient and Reversible Absorption of NH3. Sep. Purif. Technol. 2021, 260, 118240. [Google Scholar] [CrossRef]
  27. Jiang, W.J.; Zhong, F.Y.; Zhou, L.S.; Peng, H.L.; Fan, J.P.; Huang, K. Chemical Dual-Site Capture of NH3 by Unprecedentedly Low-Viscosity Deep Eutectic Solvents. Chem. Commun. 2020, 56, 2399–2402. [Google Scholar] [CrossRef]
  28. Li, K.; Fang, H.; Duan, X.; Deng, D. Efficient Uptake of NH3 by Dual Active Sites NH4SCN-Imidazole Deep Eutectic Solvents with Low Viscosity. J. Mol. Liq. 2021, 339, 116724. [Google Scholar] [CrossRef]
  29. Li, Z.L.; Zhong, F.Y.; Zhou, L.S.; Tian, Z.Q.; Huang, K. Deep Eutectic Solvents Formed by N-Methylacetamide and Heterocyclic Weak Acids for Highly Efficient and Reversible Chemical Absorption of Ammonia. Ind. Eng. Chem. Res. 2020, 59, 2060–2067. [Google Scholar] [CrossRef]
  30. Deng, D.; Duan, X.; Gao, B.; Zhang, C.; Deng, X.; Gong, L. Efficient and Reversible Absorption of NH3 by Functional Azole-Glycerol Deep Eutectic Solvents. New J. Chem. 2019, 43, 11636–11642. [Google Scholar] [CrossRef]
  31. Akhmetshina, A.I.; Petukhov, A.N.; Mechergui, A.; Vorotyntsev, A.V.; Nyuchev, A.V.; Moskvichev, A.A.; Vorotyntsev, I.V. Evaluation of Methanesulfonate-Based Deep Eutectic Solvent for Ammonia Sorption. J. Chem. Eng. Data 2018, 63, 1896–1904. [Google Scholar] [CrossRef]
  32. Cao, Y.; Zhang, X.; Zeng, S.; Liu, Y.; Dong, H.; Deng, C. Protic Ionic Liquid-Based Deep Eutectic Solvents with Multiple Hydrogen Bonding Sites for Efficient Absorption of NH3. AIChE J. 2020, 66, e16253. [Google Scholar] [CrossRef]
  33. Luo, Q.; Wang, Q.; Sun, X.; Wu, H.; Hao, J.; Wei, L.; Zhai, S.; Xiao, Z.; An, Q. Dual-Active-Sites Deep Eutectic Solvents Based on Imidazole and Resorcinol for Efficient Capture of NH3. Chem. Eng. J. 2021, 416, 129114. [Google Scholar] [CrossRef]
  34. Shang, D.; Bai, L.; Zeng, S.; Dong, H.; Gao, H.; Zhang, X.; Zhang, S. Enhanced NH3 Capture by Imidazolium-Based Protic Ionic Liquids with Different Anions and Cation Substituents. J. Chem. Technol. Biotechnol. 2018, 93, 1228–1236. [Google Scholar] [CrossRef]
  35. Yokozeki, A.; Shiflett, M.B. Ammonia Solubilities in Room-Temperature Ionic Liquids. Ind. Eng. Chem. Res. 2007, 46, 1605–1610. [Google Scholar] [CrossRef]
  36. Li, G.; Zhou, Q.; Zhang, X.; Lei, W.; Zhang, S.; Li, J. Solubilities of Ammonia in Basic Imidazolium Ionic Liquids. Fluid Phase Equilibria 2010, 297, 34–39. [Google Scholar] [CrossRef]
  37. Huang, J.; Riisager, A.; Berg, R.W.; Fehrmann, R. Tuning Ionic Liquids for High Gas Solubility and Reversible Gas Sorption. J. Mol. Catal. A Chem. 2008, 279, 170–176. [Google Scholar] [CrossRef]
  38. Li, Z.; Zhang, X.; Dong, H.; Zhang, X.; Gao, H.; Zhang, S.; Li, J.; Wang, C. Efficient Absorption of Ammonia with Hydroxyl-Functionalized Ionic Liquids. RSC Adv. 2015, 5, 81362–81370. [Google Scholar] [CrossRef]
  39. Yokozeki, A.; Shiflett, M.B. Vapor-Liquid Equilibria of Ammonia + Ionic Liquid Mixtures. Appl. Energy 2007, 84, 1258–1273. [Google Scholar] [CrossRef]
  40. Arce, A.; Soto, A.; Ortega, J.; Sabater, G. Viscosities and Volumetric Properties of Binary and Ternary Mixtures of Tris(2-Hydroxyethyl) Methylammonium Methylsulfate + Water + Ethanol at 298.15 K. J. Chem. Eng. Data 2008, 53, 770–775. [Google Scholar] [CrossRef]
  41. Yang, Y.; Faheem, M.; Wang, L.; Meng, Q.; Sha, H.; Yang, N.; Yuan, Y.; Zhu, G. Surface Pore Engineering of Covalent Organic Frameworks for Ammonia Capture through Synergistic Multivariate and Open Metal Site Approaches. ACS Cent. Sci. 2018, 4, 748–754. [Google Scholar] [CrossRef]
  42. Shang, D.; Zhang, X.; Zeng, S.; Jiang, K.; Gao, H.; Dong, H.; Yang, Q.; Zhang, S. Protic Ionic Liquid [Bim][NTf2] with Strong Hydrogen Bond Donating Ability for Highly Efficient Ammonia Absorption. Green Chem. 2017, 19, 937–945. [Google Scholar] [CrossRef]
  43. Barrer, R.M. Barrer (1939) XII. Gas Flow in Solids. Lond. Edinb. Dublin Philos. Mag. J. Sci. 2009, 28, 148–162. [Google Scholar] [CrossRef]
  44. Barrer, R.M.; F. R. S. Diffusion et Solution Dans Quelques Polymères. J. Chim. Phys. 1958, 55, 139–148. [Google Scholar] [CrossRef]
  45. Ismail, A.F.; Khulbe, K.C.; Matsuura, T. Gas Separation Membranes: Polymeric and Inorganic; Springer International Publishing: New York, NY, USA, 2015; ISBN 9783319010953. [Google Scholar]
  46. Breck, D.W. Zeolite Molecular Sieves: Structure, Chemistry, and Use; Wiley: New York, NY, USA, 1973; p. 771. [Google Scholar]
Figure 1. The 3D scheme of experimental setup for membrane-assisted gas absorption cell separation performance test (on the top), 3D image of the membrane-assisted gas separation cell (in the middle), and its principal scheme (bottom).
Polymers 14 02214 g001aPolymers 14 02214 g001b
Figure 2. The principal scheme of the Haber–Bosch process with built-in membrane-assisted gas absorption unit.
Polymers 14 02214 g002
Figure 3. The principal scheme of time-lag setup. 1—membrane test cell; 2—vacuum station; 3—manual pressure regulator; 4—diaphragm manual valves; 5—diaphragm valves with pneumatic actuators; 6—pressure gauges; 7—pressure transducers; 8—additional volume; 9—personal computer.
Polymers 14 02214 g003
Figure 4. The NH3 concentration (mol%) in permeate and retentate flows under a helium sweep of cell’s bore as a function of feed flow rate (cm3 min−1) during a steady-state ammonia capture process.
Polymers 14 02214 g004
Figure 5. The H2, N2, Ar, and CH4 concentration (mol%) in permeate flow under a helium sweep of cell’s bore as a function of feed flow rate (cm3 min−1) during a steady-state ammonia capture process.
Polymers 14 02214 g005
Figure 6. The NH3 concentration (mol%) in permeate and retentate flows under H2/N2 mix sweep of cell’s bore as a function of feed flow rate (cm3 min−1) during a steady-state ammonia capture process.
Polymers 14 02214 g006
Figure 7. The H2, N2, Ar, and CH4 concentration (mol%) in permeate flow under H2/N2 mix sweep of cell’s bore as a function of feed flow rate (cm3 min−1) during a steady-state ammonia capture process.
Polymers 14 02214 g007
Figure 8. The NH3 concentration (mol%) in a permeate flow as a function of process operational time (h) during the establishment of the steady-state at 4 different feed flow rates (cm3 min−1): (A)—30.5 cm3 min−1; (B)—34.5 cm3 min−1; (C)—38.5 cm3 min−1; (D)—42.5 cm3 min−1.
Polymers 14 02214 g008
Table 1. Comparison of different NH3 absorbents.
SolventsMol W
g mol−1
Density
g sm−3
Viscosity,
mPa s
Pressure
kPa
T, KSolubility NH3
g g−1
Refs
Choline-Chloride-based DESs
ChCl + Urea (2:3)91.89 10.8313.20.002623[18]
104.80.024455
297.90.065991
ChCl + Urea (1:2)86.59 17.2298.20.007561
950.037687
296.60.117149
11.3313.20.003372
108.20.027231
302.10.073927
ChCl + Urea (2:5)82.8 19.8313.20.004785
98.10.023076
299.10.068597
ChCl + PhOH + EG (1:5:4)142.921.0929101.3298.20.16391[19]
1.08512.5313.20.11908
ChCl + PhOH + EG (1:7:4)153.81.0812101.3313.20.13039
ChCl + EG (1:2)87.9 100.5313.150.046[20]
ChCl + Gly (1:2)107.96 132.30.051
ChCl + MU (1:2)95.93 147.20.032
ChCl + TA (1:2)121.9 137.40.045
ChCl + 1,4-BD (1:4)100.021.040354.7523.2303.150.01276[21]
115.80.03408
396.90.15225
1.034836.6633.3313.150.0118
121.80.02498
389.20.11117
ChCl + 1,4-BD (1:3)102.51.047160.6431.2303.150.0163
113.70.04961
396.90.15075
1.041640.5547.2313.150.01557
131.70.04
416.60.10763
ChCl + 2,3-BD (1:4)100.021.030771.7937.6303.150.01335
120.90.04382
395.80.13483
1.023940.7237313.150.00908
124.10.03241
3840.09424
ChCl + 2,3-BD (1:3)102.51.03984.8832.4303.150.01337
1210.04596
384.80.12796
1.032548.7349313.150.01402
130.40.0353
390.40.0978
ChCl + 1,3-PD (1:4)88.81.070534.4532.7303.150.02166
132.80.06788
391.50.16814
1.064824.2131.6313.150.01197
121.80.04286
390.70.11846
ChCl + 1,3-PD (1:3)91.981.075340.0534303.150.01448
131.70.05489
396.20.14728
1.069727.8431.4313.150.01083
128.50.0428
401.40.11376
ChCl + ImZ + EG (3:7:14)73.521.1051511313.20.00848[22]
101.60.0836
ChCl + TrZ + EG (3:7:14)73.791.126159.10.02176
104.30.11061
ChCl + TetrZ + EG (3:7:14)74.11.158127.70.07313
104.90.16948
ChCl + Res (1:3)117.48 101.3313.20.053[23]
ChCl + Phe (1:3)105.49 0.081
ChCl + EG (1:2)87.9 0.041
ChCl + PhA (1:2)137.31 0.043
ChCl + Gly (1:2)107.96 0.053
ChCl + Phe + EG (1:3:5)81.367 0.091
ChCl + Phe + Gly (1:3:5)98.046 0.095
ChCl + Res + Gly (1:3:5)103.375 101.3293.150.18
298.150.17009
1.21 313.150.1303
ChCl + D-fructose + Gly (1:3:5)126.73 101.3313.150.11027
ChCl + DL-malic Acid + Gly (1:3:5)111.37 0.045
ChCl + Levulinic Acid + Gly (1:3:5)105.38 0.055
ChCl + Oxalic Acid + Gly (1:3:5)96.69 0.074
ChCl + Malonic Acid + Gly (1:3:5)101.36 0.081
ChCl + Phenylacetic Acid + Gly (1:3:5)112.06 0.097
Ethylamine-hydrochloride-based DESs
EaCl + Urea (2:1)74.381.10397.88.5313.20.00882[24]
98.50.07486
301.70.1877
EaCl + Urea (1:1)70.811.142197.79.50.01102
99.10.07788
300.60.179
EaCl + Urea (1:2)67.231.179105.58.40.00897
96.30.07117
296.20.17134
EaCh + Gly (1:2)88.6 101.3313.150.114[25]
EaCl + Gly (1:5)90.3 101.3313.20.129[26]
EaCl + Res + Gly (1:1:5)93.15 0.149
EaCl + Res + Gly (1:2:5)95.3 0.163
EaCl + Res + Gly (1:3:5)96.9 0.174
EaCl + Res + Gly (1:4:5)98.21.244 0.181
EaCh + PhOH (1:2)166.0 101.3313.150.119[27]
EaCl + PhOH (1:5)187.1 313.20.138
EaCl + PhOh (1:7)192.4 298.20.167
Ammonium-thiocyanate-based DESs
NH4SCN + Gly (2:3)85.71.23971.18101.3313.20.17642[12]
NH4SCN + EG (1:3)65.581.13811.460.1684
NH4SCN + Urea (2:3)91.31.25641.040.1463
NH4SCN + AT (2:3)65.89 0.0918
NH4SCN + CL (2:3)98.34 0.0295
NH4SCN + Im (1:2)70.761.11517.47100303.150.164[28]
1.10613100313.150.117
NH4SCN + Im (1:3)70.091.12518.22100303.150.122
Other DESs
MAA + TetrZ (2:1)72.081.05339313.20.07834[29]
102.90.13624
Tri + Gly (1:3)86.321.249163101.3303.150.147[30]
Im + Gly (1:3)86.09 0.126
Tz + Gly (1:3)86.58 0.179
[bmim][MeSO3] + Urea (1:1)147.191.189295.72172.6313.20.01787[31]
[Im][NO3] + EG (1:3) 1.2139.8101.3313.150.172[32]
[Mim][NO3] + EG (1:3) 1.1868.70.152
[Mmim][NO3] + EG (1:3) 1.17590.141
Im + Res (1:1)89.091.2017 101.3313.150.154[33]
Im + Res (1.5:1)84.89 101.3313.150.128
Im + Res (2:1)82.08 101.3313.150.107
Im + Res (2.5:1)80.08 101.3313.150.101
[Me2COH2N]Cl + U (1:1)114.861.211723.38101.3313.20.035[13]
[MeCOH3N]Cl + U (1:1)129.961.2501026.30.045
Ionic Liquids
[mim][Tf2N]362.24 6.4963130.04983[34]
102.710.12599
610.140.27785
[eim][Tf2N]376.271.55971133.1658.1790.04979
105.120.12356
622.990.28106
[mmim][Tf2N]376.271.56972452.9614.4880.043
98.6310.10862
610.920.25934
[bim][SCN]182.261.084584152.2851.7183030.16445
98.8170.20369
546.090.51297
1.07865684.30246.8173130.14483
96.5880.18314
563.180.42981
[bim][NO3]186.181.172231248100.093030.13721
553.890.43814
1.165499136.9586.013130.10611
141.530.15733
515.830.34301
[bmim][SCN]197.31.06814945.26372.4413030.01381
144.510.02762
559.470.13897
1.06225830.46182.9183130.01295
203.460.03107
556.940.09667
[bmim][DCA]223.31.05830325.09361.1623030.0122
114.280.02288
567.880.15329
1.0519618.13362.3763130.00763
128.320.01678
565.560.1022
[bmmim][Tf2N]433.391.41418877.73150.3223030.00393
119.430.00982
536.80.06287
1.40492749.703100.493130.00786
216.340.01729
607.720.06012
[bmmim][SCN]211.331.068578192.2695.6683030.01451
184.620.0282
5440.10395
1.062887108.540.7063130.00484
149.890.01692
560.580.07656
[bmmim][DCA]237.331.05308247.66115.383030.01794
199.860.03157
560.580.11553
1.0470231.616103.423130.00861
174.970.02081
569.340.08252
[bmim][BF4]226.021.203123.41101.3298.20.01701[35]
1300.01543
2003230.01027
220298.150.03505[36]
6300.14856
80313.150.00827
6100.09648
5002930.07535[37]
[bmim][PF6]284.18 101.3298.20.02101[35]
1700.03227
2703230.02448
[bmim][Tf2N]419.36 60.7101.3299.40.0053
[emim][Tf2N]391.31 1403230.0065
1700.0043
[hmim][Cl]202.72 1003230.00536
1300.02509
[emim][BF4] 101.3333.150.0095[38]
[emim][Tf2N]419.36 0.0065
[emim][NO3] 0.0097
[EtOHmim][SCN] 1.255313.150.031
[EtOHmim][NO3] 1.32900.02
[EtOHmim][PF6] 1.54920.038
[EtOHmim][BF4]213.971.3554.090.04502
[EtOHmim][Tf2N] 1.57400.036
[EtOHmim][DCA]193.211.1838.830.018
[emim][Ac]170.11 101.3298.30.03202[39]
5902980.14406
5403230.11752
[emim][SCN]169.24 101.3298.10.04502
4402980.07906
4203230.07287
[emim][EtOSO3]236.29 5202980.07808
4803230.06653
4703230.10123
[DMEA][AC]149.19 101.3298.10.10006
4700.10123
[emim][BF4]197.97 110298.150.01487[36]
5500.13893
140313.150.01235
6200.09535
[hmim][BF4]254.08 220298.150.03891
6000.15447
230313.150.02507
6000.09139
[omim][BF4]282.17 120298.150.02333
6100.17877
180313.150.02385
6000.10908
[TMGH][BF4]201.98 101.3293.20.09006[37]
5202930.09134
[TMGH][NTf2]395.32 5402930.05057
[TMGHPO2][BF4]264.95 101.3293.20.038
4202930.04654
[MTEOA][MeOSO3]275.32-440.01 3130.082[40]
IL-4 1.1845389.8101.3313.150.012[17]
IL-5 1.2183366.50.028
[HOOC]17-COFs 1002980.15915[41]
[HOOC]33-COFs 1002980.1399
[HOOC]0-COFs 1002830.15728
[HOOC]0-COFs 1002980.11672
[HOOC(CH2)3mim][Tf2N]449.23 1592 3130.058[42]
Table 2. GC analysis details used for membrane-assisted gas absorption cell separation performance test.
9Characteristics
DetectorsTCD №1, 393.15K
TCD №2, 463.15 K
TCD №3, 463.15 K
Columns15% PEG-600 on PTFE, 333.15 K 60/80 mesh 3 m × 2 mm i.d. stainless steel tube (TCD №1) 333.15 K
CaA 5A, 333.15 K 60/80 mesh 2 m × 2 mm i.d. stainless steel tube (TCD №1) 333.15 K
Hayesep B, 333.15 K 60/80 mesh 3 m × 2 mm i.d. stainless steel tube (TCD №2) 333.15 K
Hayesep Q, 333.15 K 60/80 mesh 2 m × 2 mm i.d. stainless steel tube (TCD №3) 333.15 K
Sample loop0.25 cm3, 383.15 K (TCD №1)
1 cm3, 453.15 K (TCD №2, 3)
Carrier gasHe ≥ 99.995 vol.% (TCD №1, 2, 3) 20 cm3 min−1
Table 3. Membrane-assisted gas absorption process experimental conditions.
ParameterValue
Feed pressure0.4 MPa
Permeate pressure0.132–0.135 MPa
Temperature298.15 K
Feed flow rate30.5–42.5 cm3 min−1
Retentate flow rate30 cm3 min−1
Helium sweep flow rate30 cm3 min−1
H2/N2 mix sweep flow rate30 cm3 min−1
Table 4. PSF and PEI+PI hollow fiber membrane permeance for pure gases.
Permeance, GPU aα(NH3/x)
PSFPEI + PIPSFPEI + PI
NH31691400.9--
H2563135.633
N221.7 1.677.9250.6
Ar31.32.754148.5
CH4232.873.5143.2
@ 101.325 kPa transmembrane pressure and 298.15 K. a 1 GPU = 1 × 10⁻⁶ cm3 cm−2 s−1 cmHg−1.
Publisher’s Note: MDPI stays neutral with regard to jurisdictional claims in published maps and institutional affiliations.

