In this section, we analyze the interface induced gradient of the segmental dynamics, and the overall dynamical properties of the confined melts. Furthermore, the segmental relaxation curves are shown in the frequency domain and some insights related to dielectric spectroscopy experiments are provided.
4.1. Mobility Gradient
The backbone torsional motions of PMMA chains are closely related to their segmental
-relaxation [
46,
47,
48]. Therefore, we study segmental dynamics through the calculation of torsional autocorrelation function (TACF) for backbone dihedral angles of PMMA stereoisomers. TACF is defined as [
47]:
where
and
are backbone dihedral angles at times
t and 0, and
shows averaging over all appropriate dihedral angles and time origins. TACF is calculated both for the layers at different distances from the nanosheets (layer resolved approach) and for the entire confined systems (averaged over all backbone dihedral angles in the system).
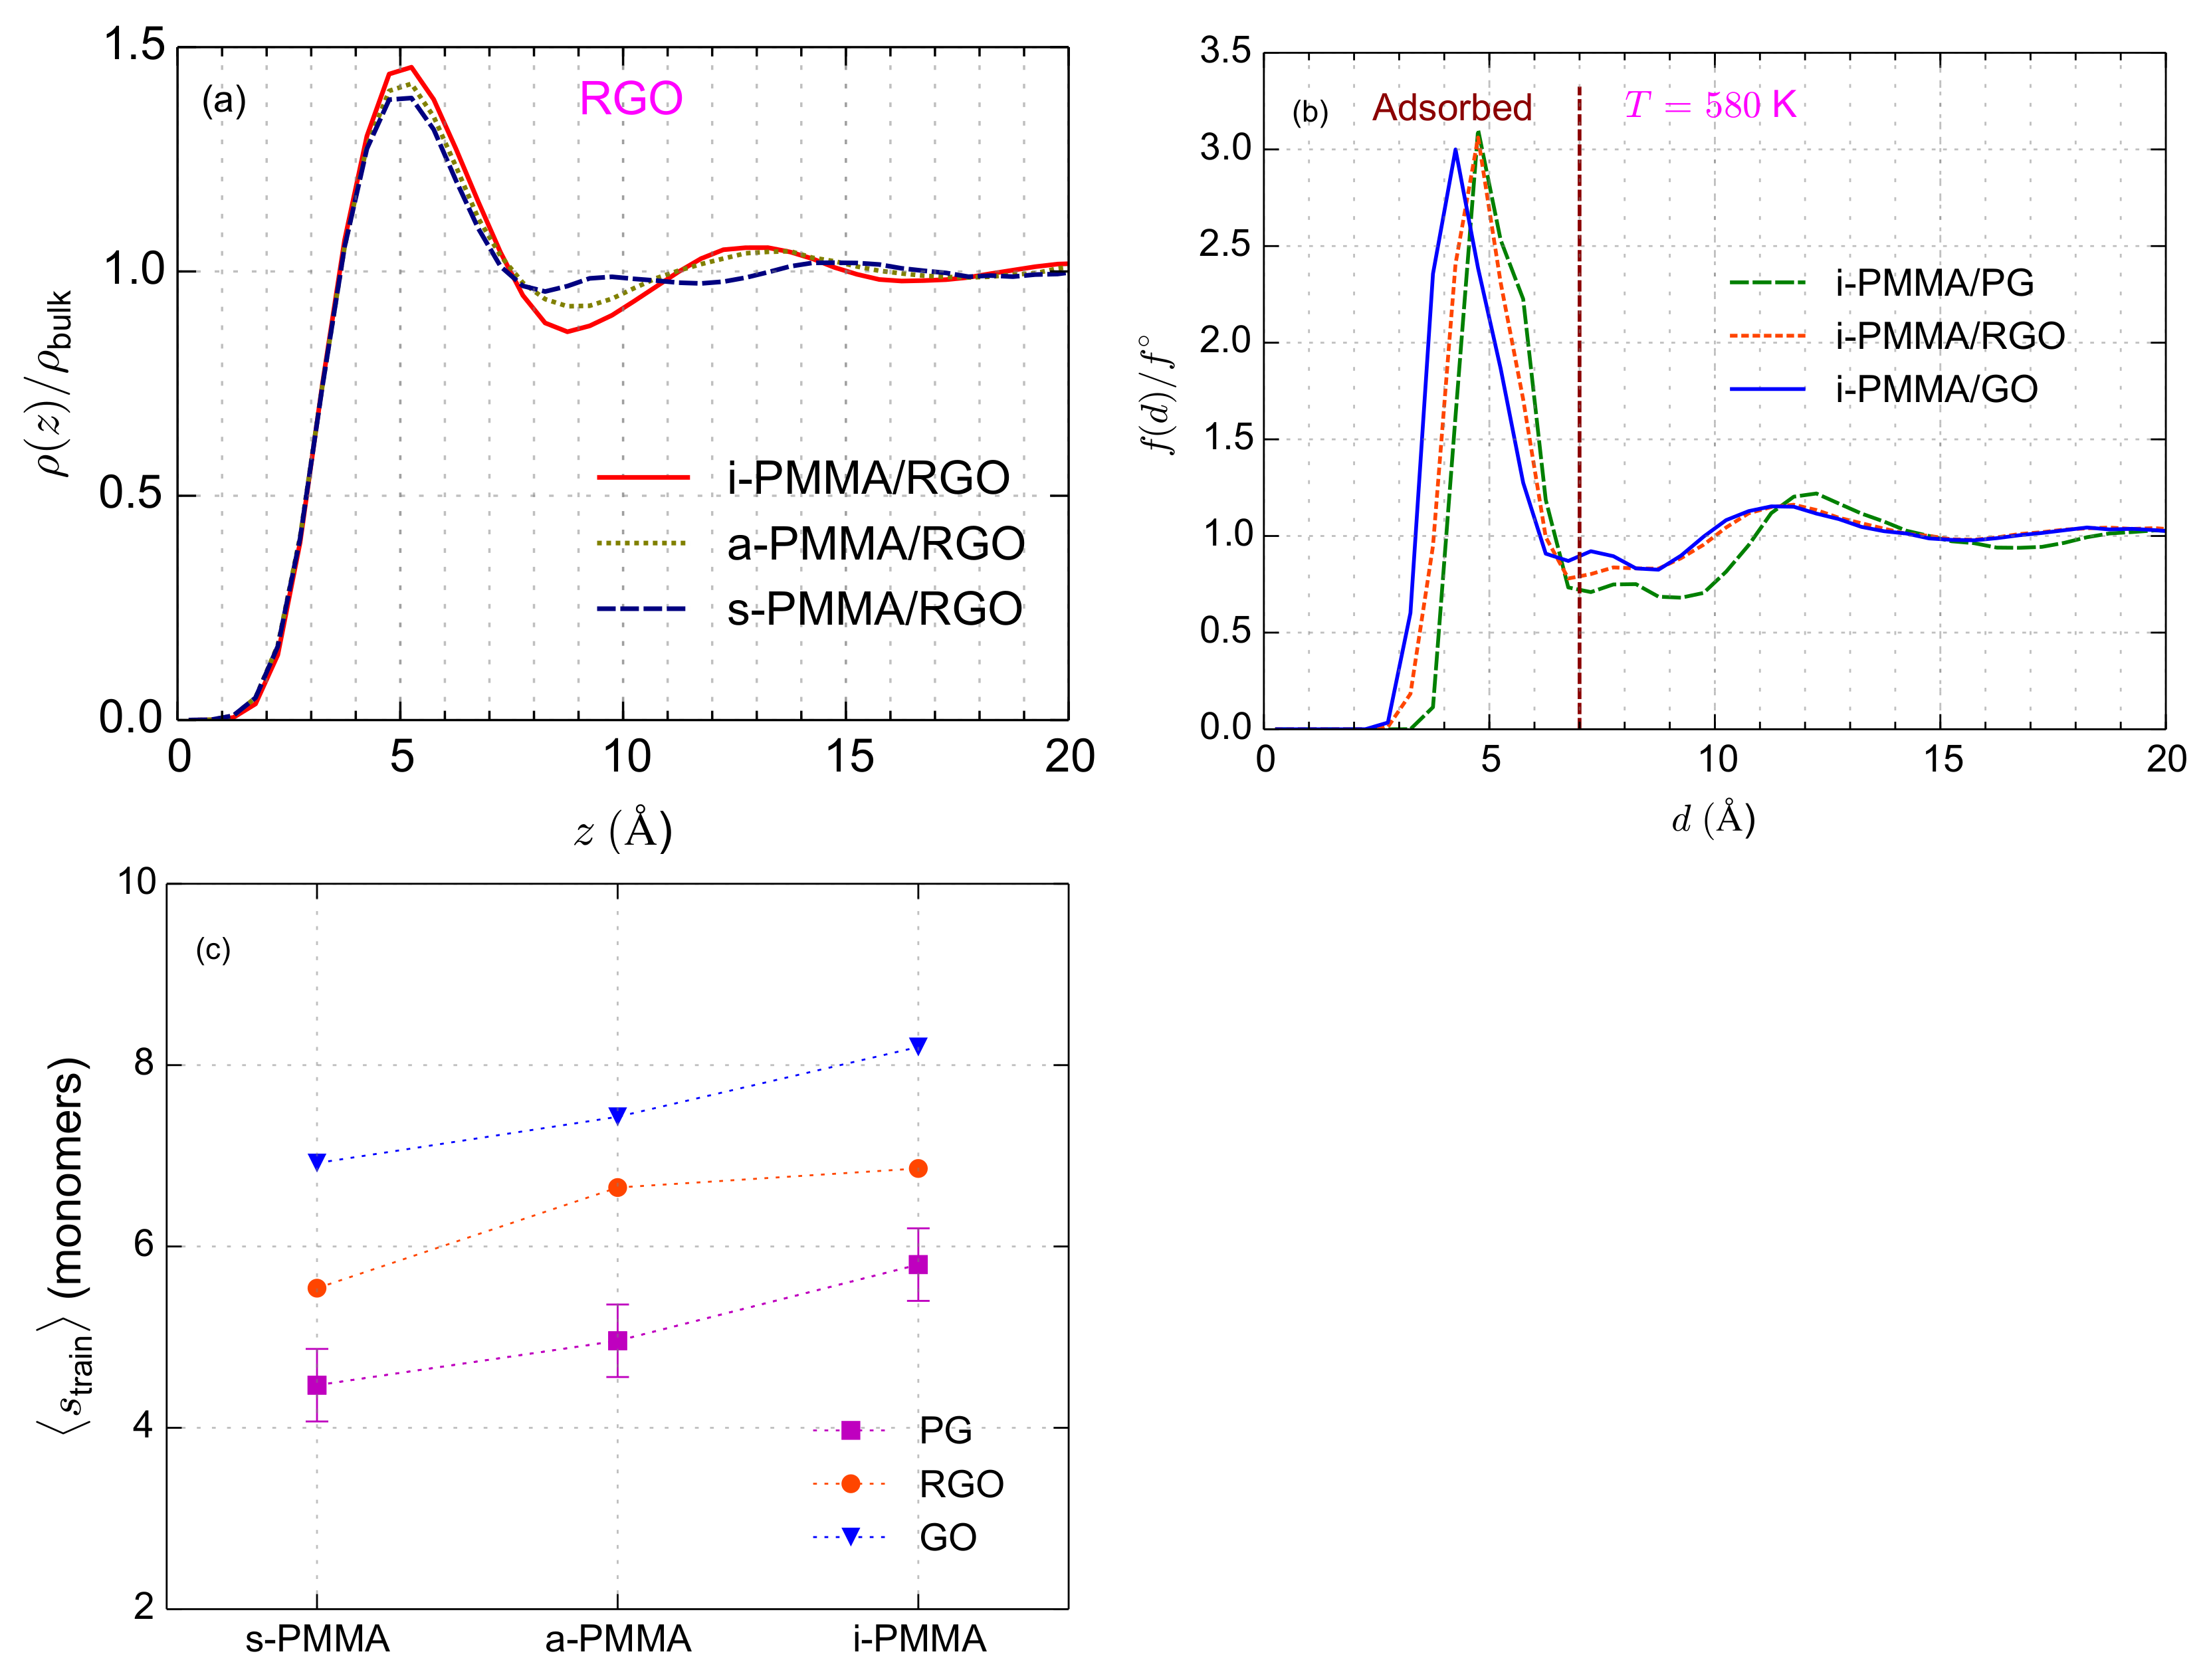
For the layer resolved calculation of TACF, confined films are divided into five layers: the closet layer to the surface (
–
Å) corresponds to the adsorption layer that was observed in
curves (
Figure 2b). At the second layer (
–
Å), PMMA chains show slight perturbations of local density (particularly i-PMMA chains) and the other three layers (
–
Å,
–
Å, and
–
Å) concern regions where the interfacial layering effects are almost negligible (
Figure 2b). Each dihedral angle contributes to the TACF of a layer based on the its position (minimum distance from the middle point between the central atoms of the dihedral angle to the surface atoms) at the time origin. One can think of an alternative approach in which a dihedral angle contributes to the TACF of a layer for times less than its residence time in that layer (this scheme was used in our previous calculation of TACF for PMMA/PG systems [
49]). Here, we have chosen the former scheme because, by following it: (i) the results are totally independent of the saving frequency of the coordinates, (ii) the residence times of segments in each layer is implicitly taken into account, and above all (iii) one can write the autocorrelation function of the entire system as a simple linear combination of the autocorrelation functions of the layers (see
Section 4.3 and Equation (
4)).
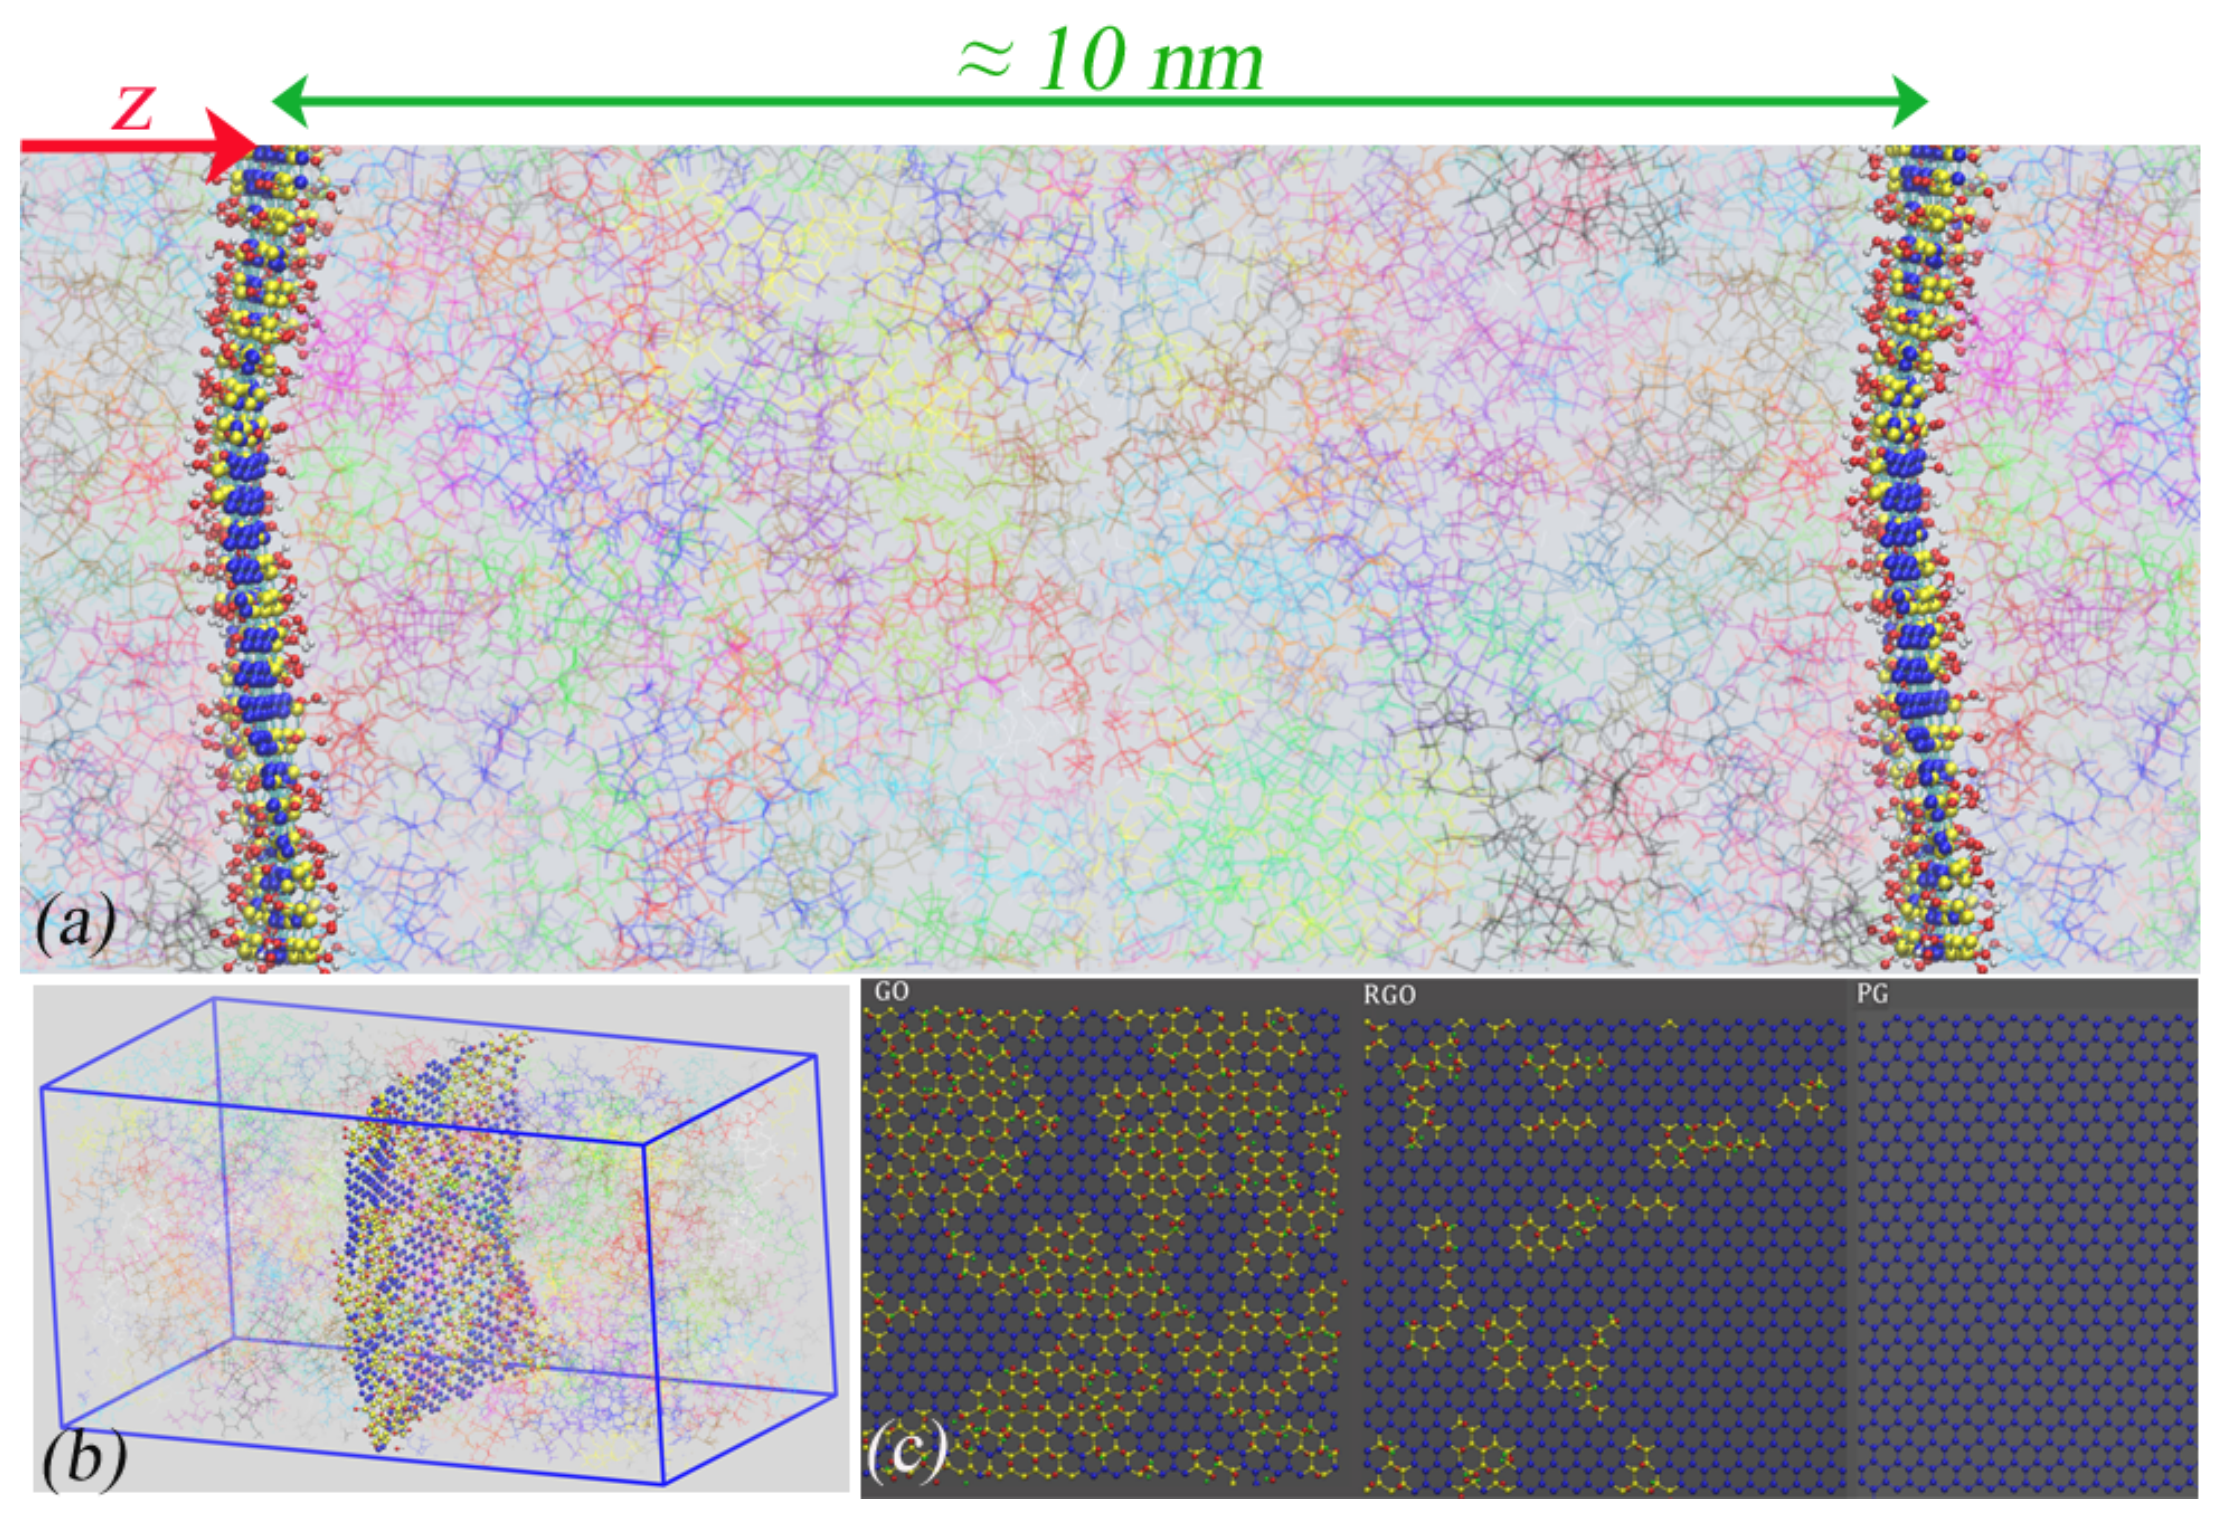
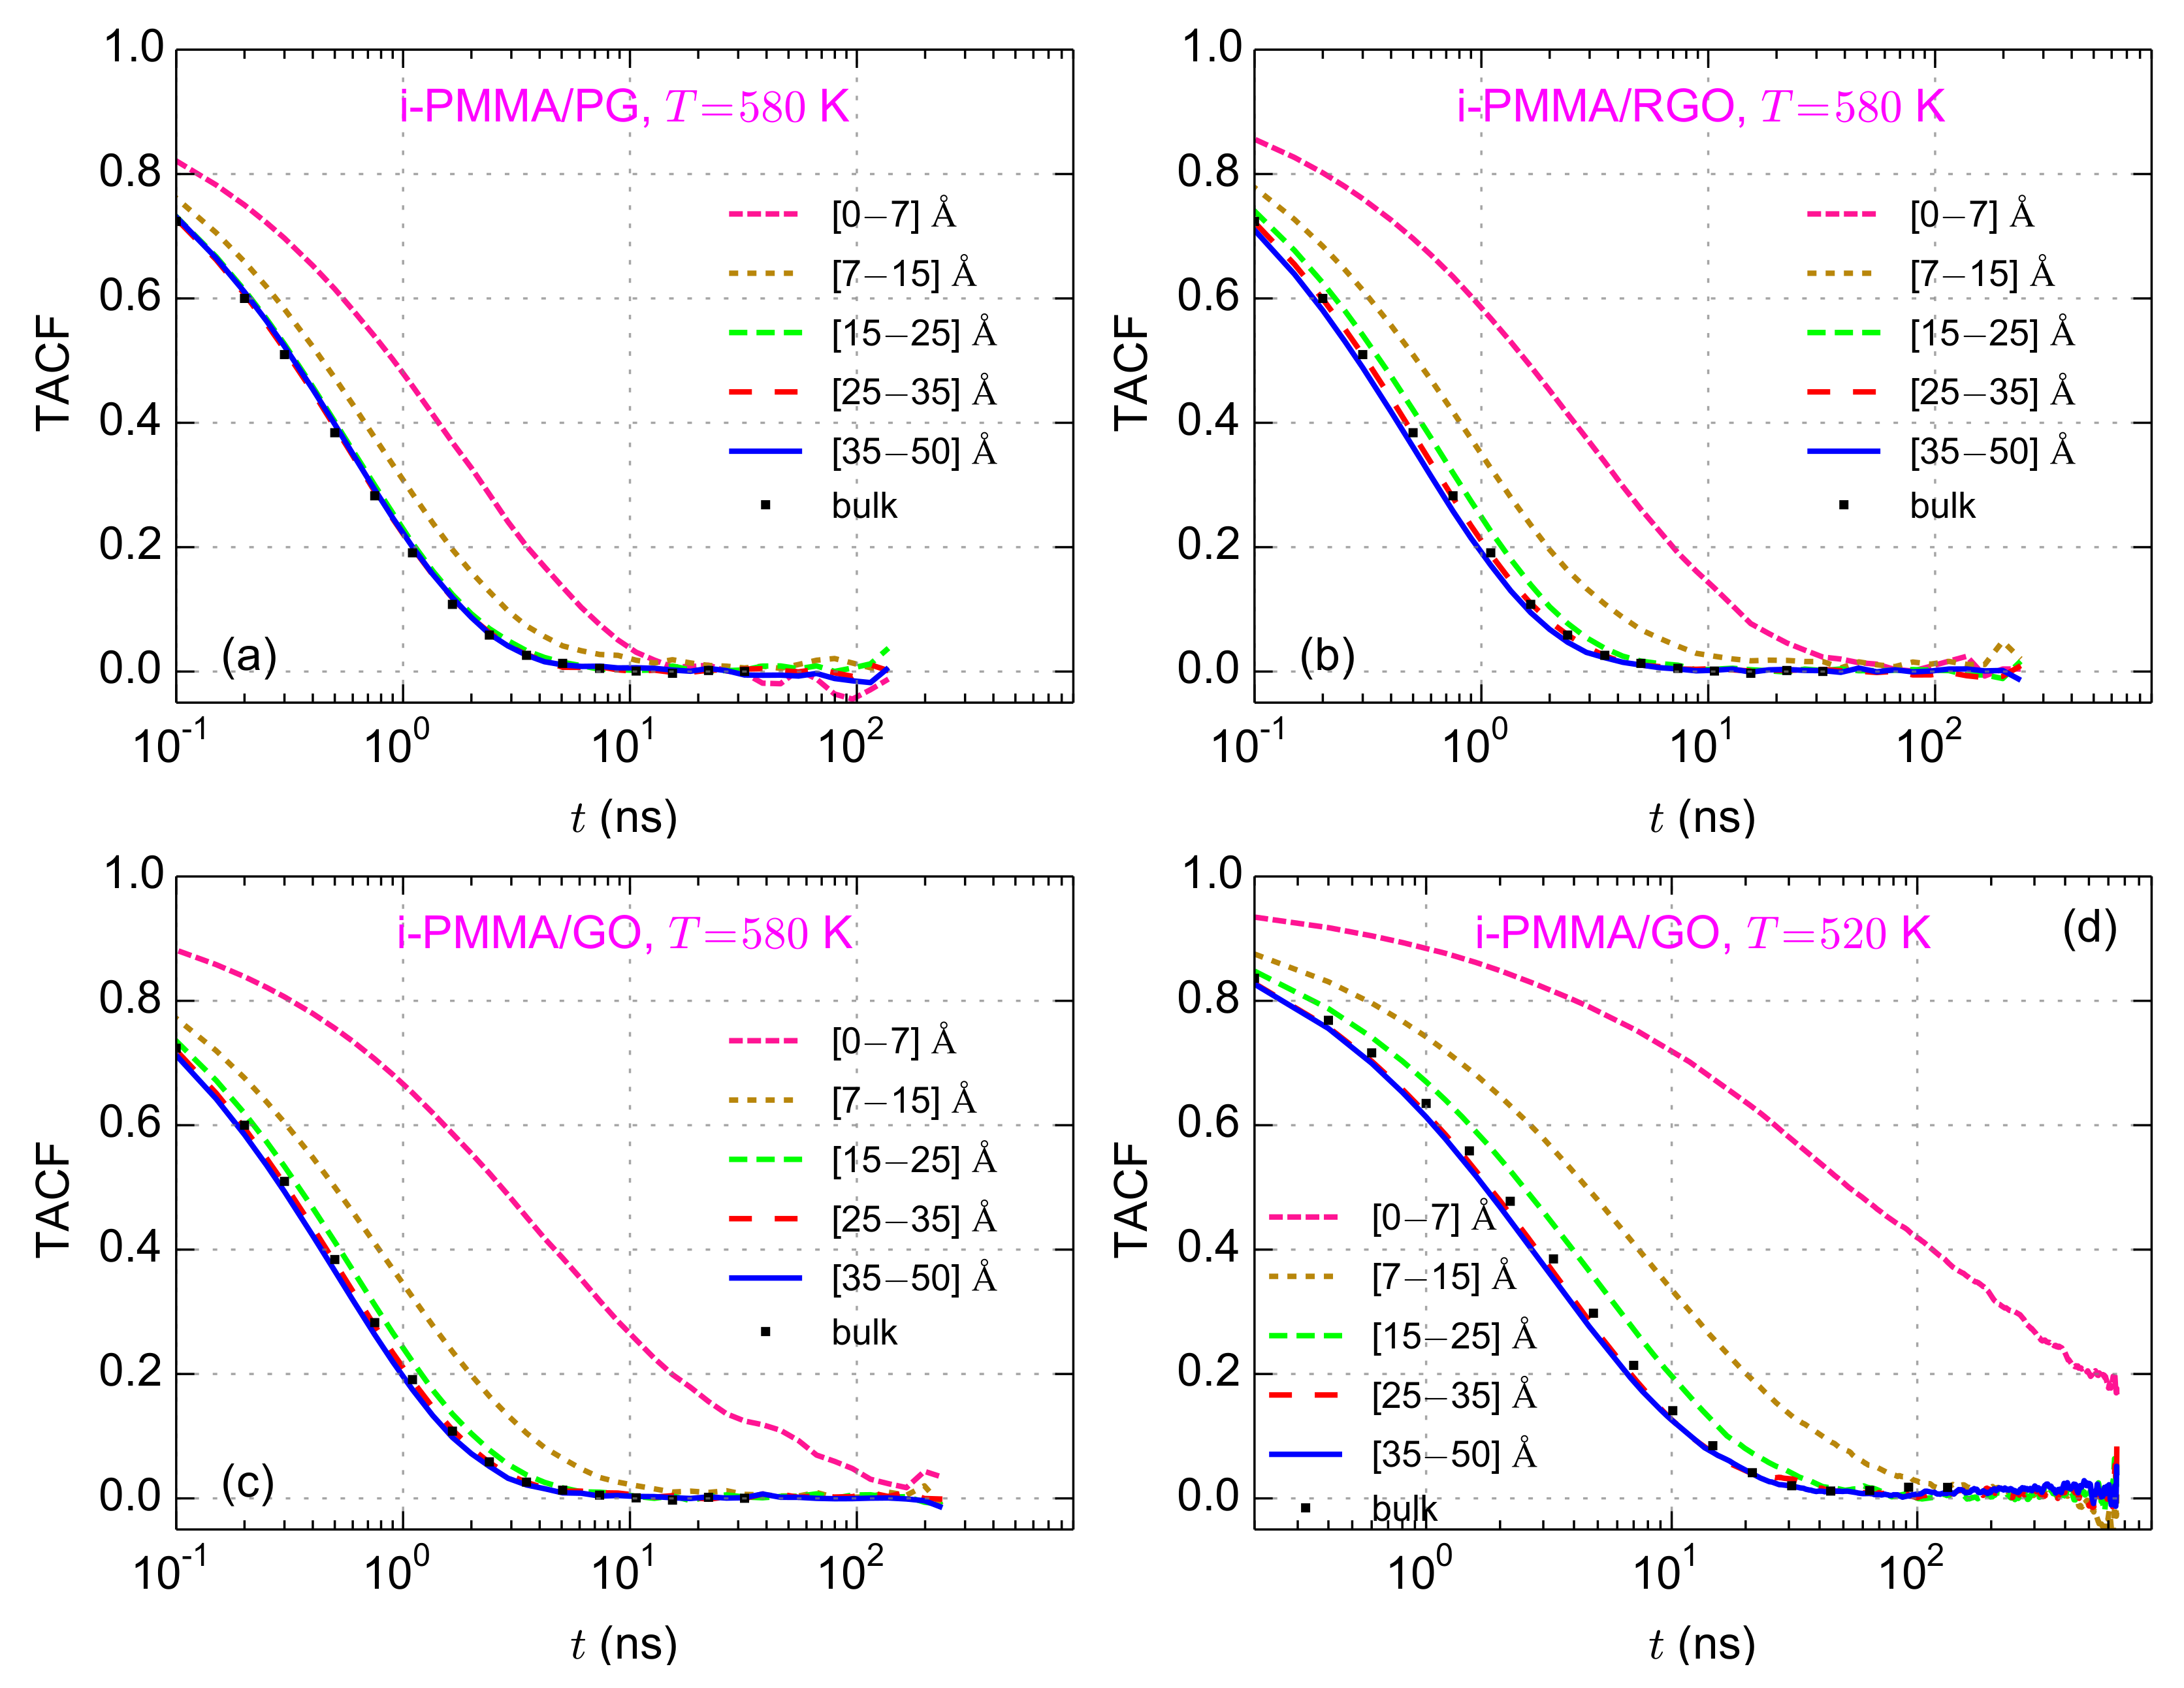
The layer resolved TACF curves for i-PMMA melts confined between PG, RGO, and GO, at
K, are plotted in
Figure 3a–c; the TACF curves for i-PMMA/GO system at
K are depicted in
Figure 3d (the layer resolved TACF curves for the confined i-PMMA melts at
K and some of the model s-PMMA containing confined systems are provided in
Figures S1 and S2 of the Supplementary Materials). For all model systems, a
gradient of segmental mobility is observed. TACF curves for PMMA segments being closer to the model surfaces decay slower than those that are far away. The decelerations of the backbone torsional motions for the first and the second studied layers, i.e., up to
nm from the surfaces, are significant. In addition, for the PMMA chains near GO and RGO, even at the third layer (distances between
nm to
nm) the segmental dynamics is slightly slower than that of the bulk melt. At the center of the films, the torsional mobility is rather close to that of the respective bulk melts. To quantify the mobility gradient at the interface, the TACF curve of each layer has been fitted with a stretched exponential, Kohlrausch–Williams–Watts (KWW), function and the relaxation (or correlation) time of the backbone torsional motions,
, has been calculated as the integral of the KWW function. The KWW function is defined as [
47]:
where
is a prefactor that takes into account the fast vibrational and librational motions,
is the characteristic time of the KWW function, and
is the stretch exponent.
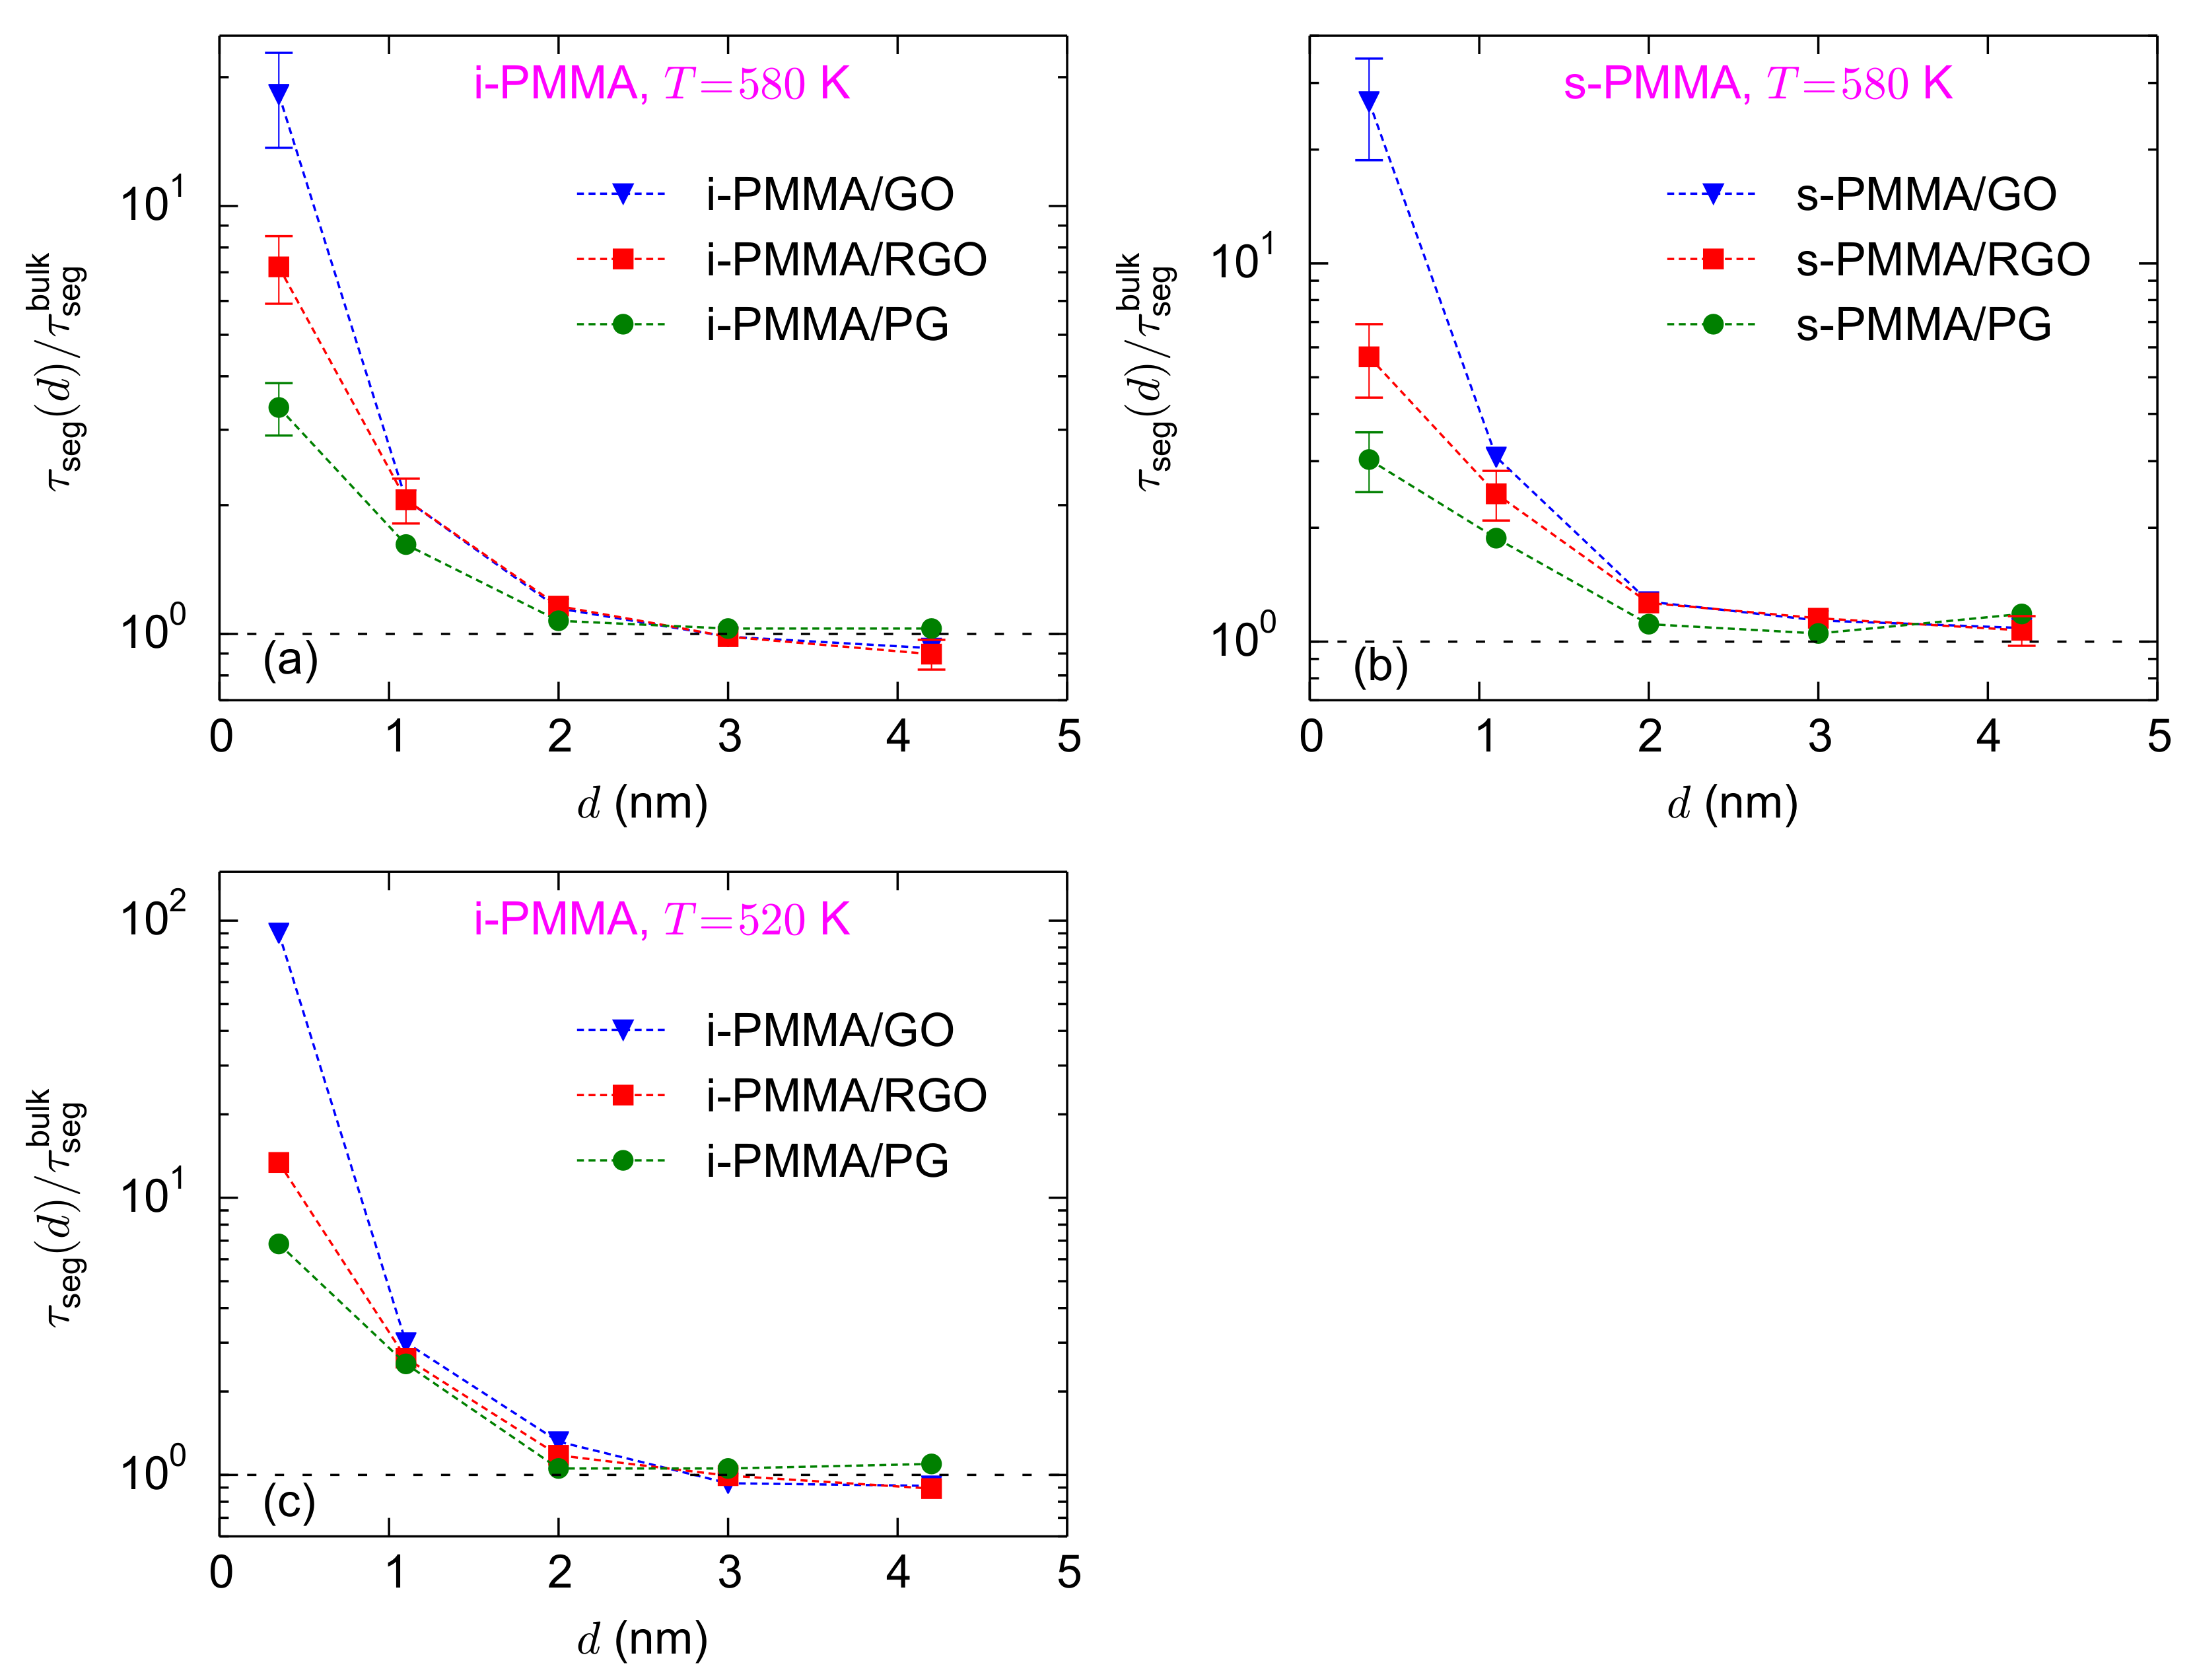
Figure 4a–c shows the surface–chemistry dependence of the interfacial segmental relaxation times, normalized with the respective bulk values, for confined i-PMMA at
K, confined s-PMMA at
K, and confined i-PMMA at 520 K. In the vicinity of the three model surfaces, backbone torsional mobilities of PMMA chains slow down. However, the larger the concentration of functional groups, the slower the interfacial dynamics. For the adsorption (closest) layer, at
K, the values of
are
,
, and
for i-PMMA/PG, i-PMMA/RGO, and i-PMMA/GO, respectively (
Figure 4a). Qualitatively similar surface–chemistry dependence of the segmental dynamics was observed for all PMMA stereoisomers at all temperatures; in all cases, in the interfacial region:
. Mainly due to the favorable electrostatic interactions of carbonyl oxygen atoms of PMMA with the hydroxyl functional groups of RGO and GO, the interfacial torsional dynamics is slower close to the RGO and GO surfaces, as compared to the PG surface.
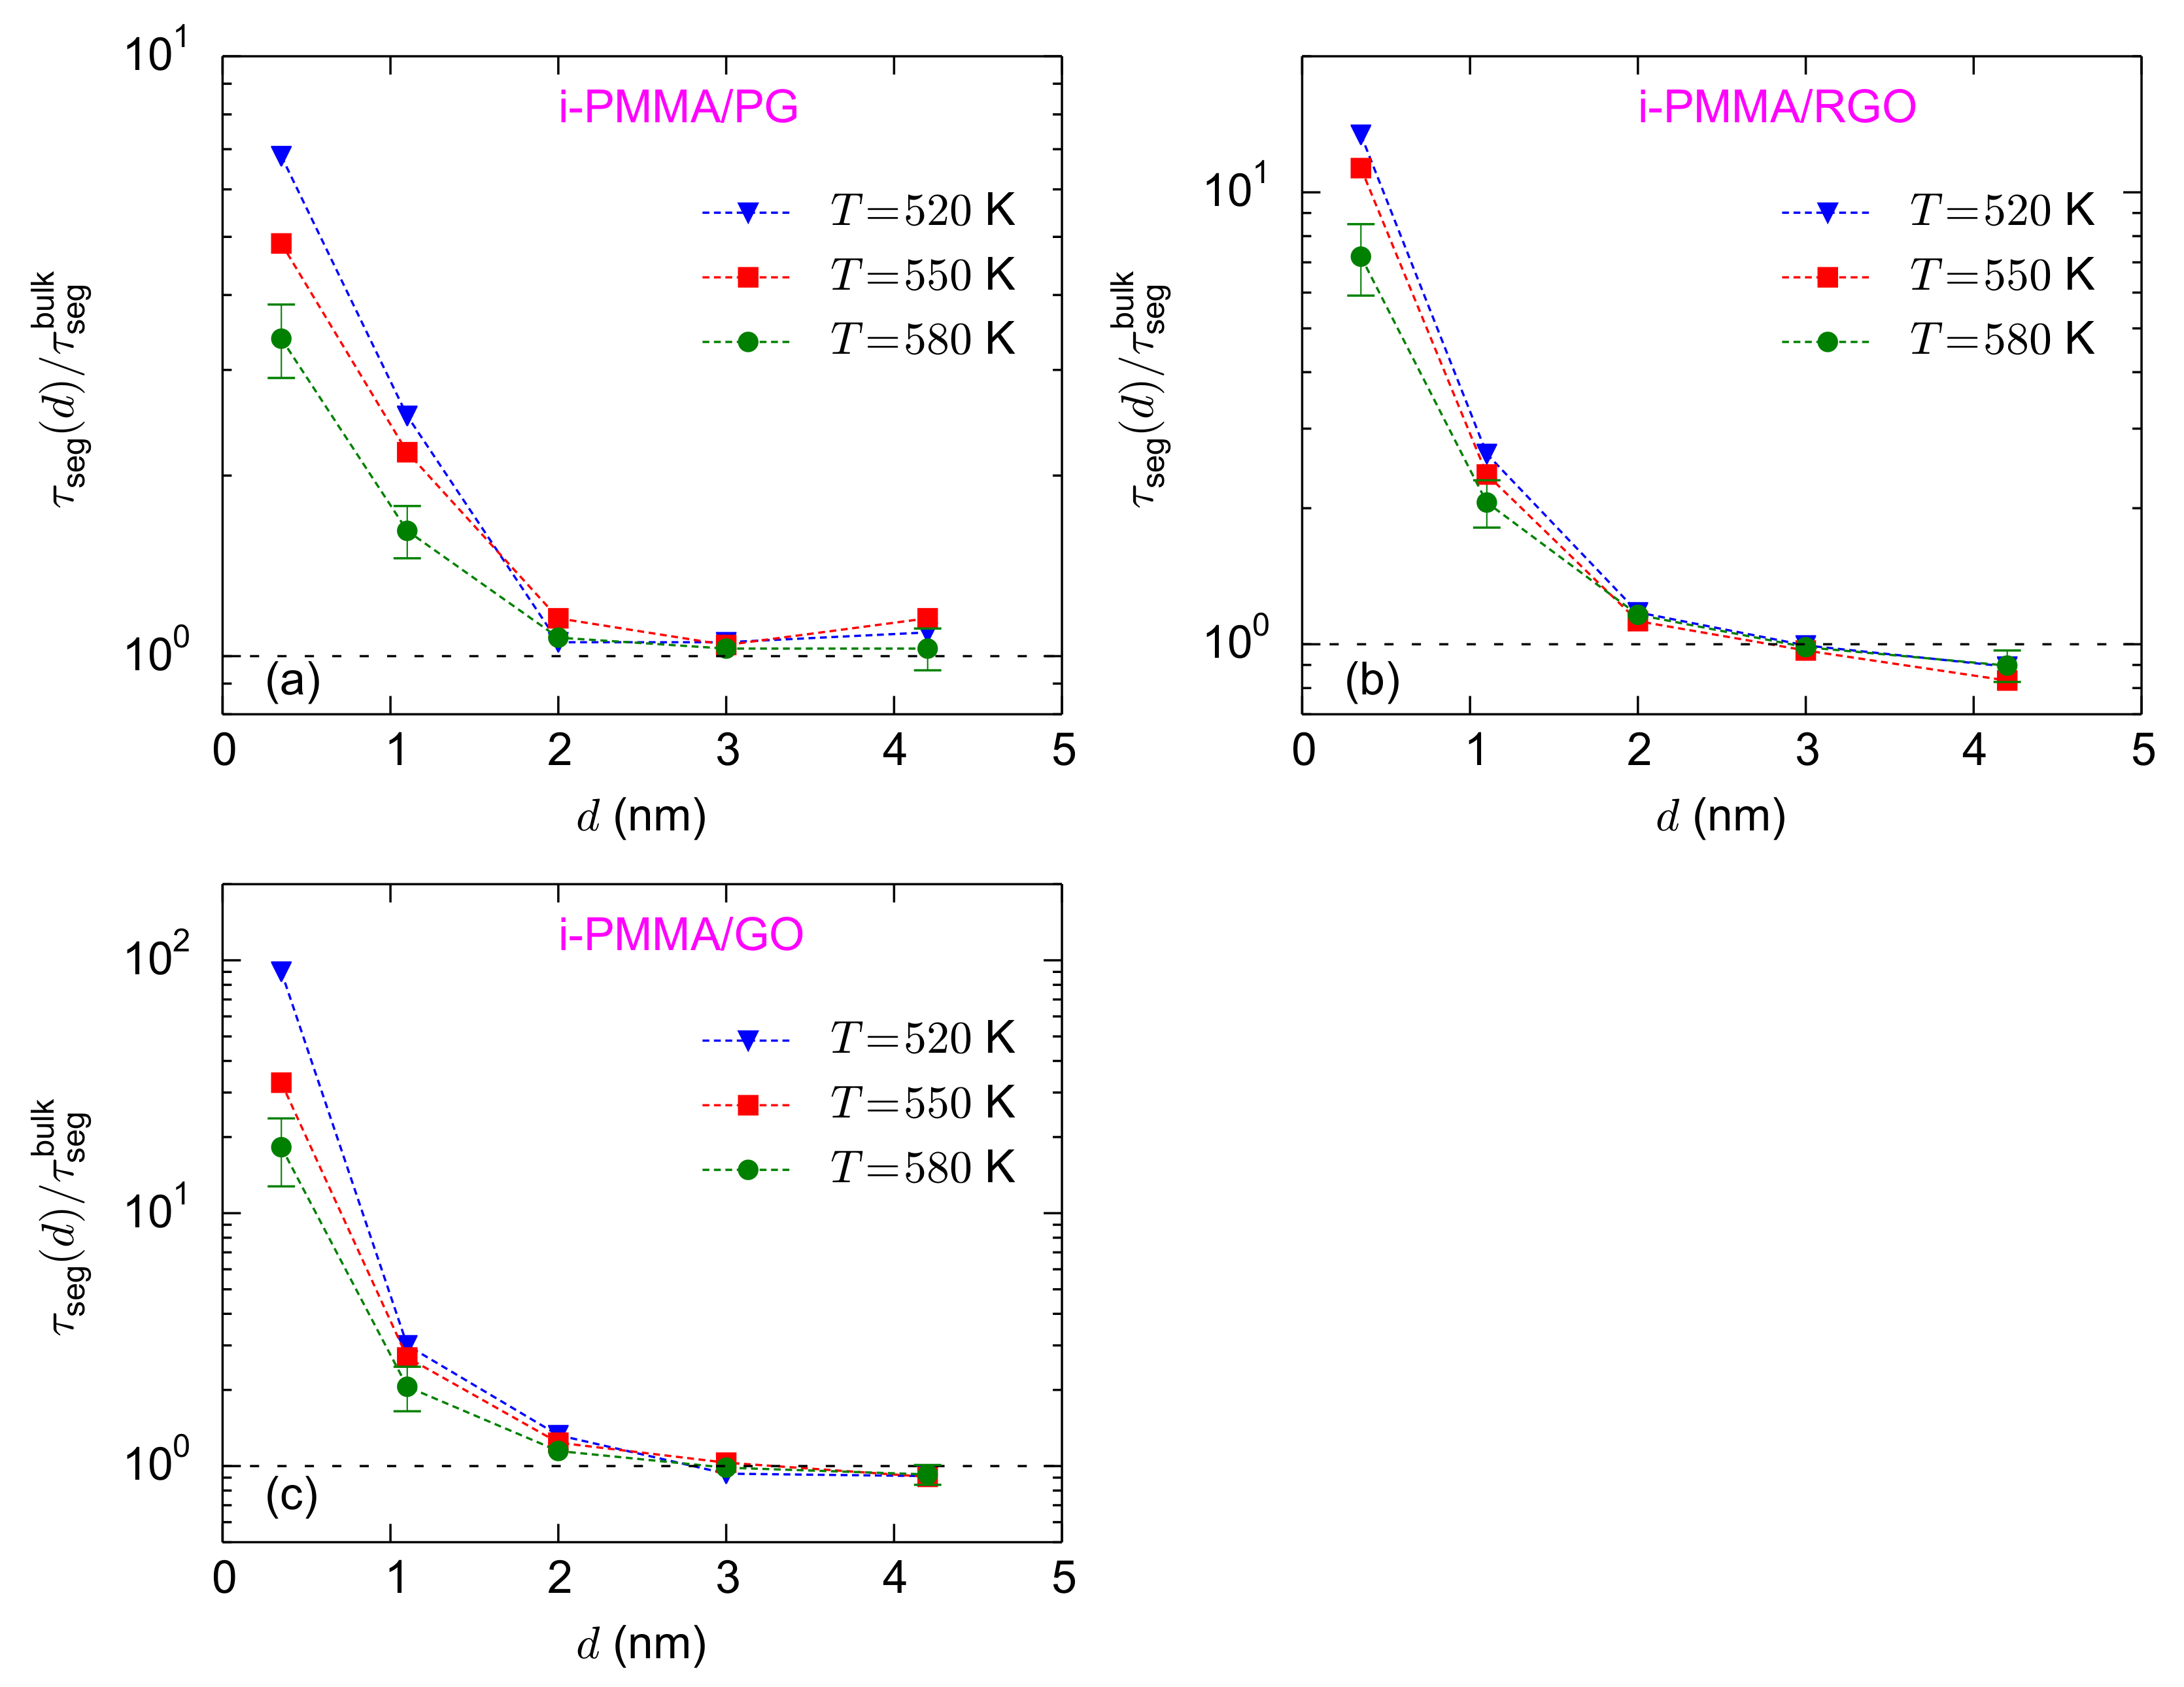
Figure 5a–c shows the temperature dependence of the normalized interfacial segmental relaxation times for the i-PMMA/PG, i-PMMA/RGO, and i-PMMA/GO systems. At the interfacial region (distances less than 2 nm), the values of
increase with decreasing temperature. For the adsorption layer of the i-PMMA/GO system, the values of
are
,
, and
at 580 K, 550 K, and 520 K, respectively (
Figure 5c). The increase of
, for small values of
d, with decreasing temperature shows the stronger temperature dependence of the interfacial segmental dynamics as compared to dynamics of the respective bulk melts, for the temperature range studied here, well above the bulk
Tg. The temperature dependence of the interfacial dynamics for the s-PMMA/PG, s-PMMA/RGO, and s-PMMA/GO systems are provided in
Figure S3 (of the Supplementary Materials); it seems that the temperature dependence of s-PMMA containing interfacial systems is qualitatively similar to that of i-PMMA containing ones; however, the results for the former cases are rather scattered and their temperature dependency is not as clear as the results of i-PMMA systems.
4.2. Mobility Gradient in Terms of a Temperature Shift
In the above analysis, we have described the surface induced gradient of the segmental dynamics in terms of
. In the following, we express the gradient of the segmental dynamics in terms of a
temperature shift, which is defined as below:
shows the shift (reduction) of temperature that should be considered for the bulk melt to make its (average) segmental relaxation time equal to the (average) segmental relaxation time of the confined melt at distance
d from the confining surface.
, as compared to
, offers an intuitive measure for the expression of the surface induced gradient of the segmental dynamics, and for the comparison between the interfacial segmental dynamics of two different polymers with different bulk
Tgs. Furthermore, as will be discussed below,
has a much weaker temperature dependence than
. Note that, in some experimental works [
3,
10], the alterations of segmental dynamics have been expressed in terms of a shift in a characteristic temperature of the segmental dynamics (e.g., a shift in
Tg).
is not precisely a shift of a characteristic temperature because it is not defined based on a specific relaxation time (for example, usually
Tg is measured as the temperature at which the relaxation time of the segmental process equals 100 s). However, at the studied temperature range,
can be considered as an estimate of the shift of a characteristic temperature which is defined based on a relaxation time of around 1 ns to
s (near the relaxation times of the model systems at the studied temperatures).
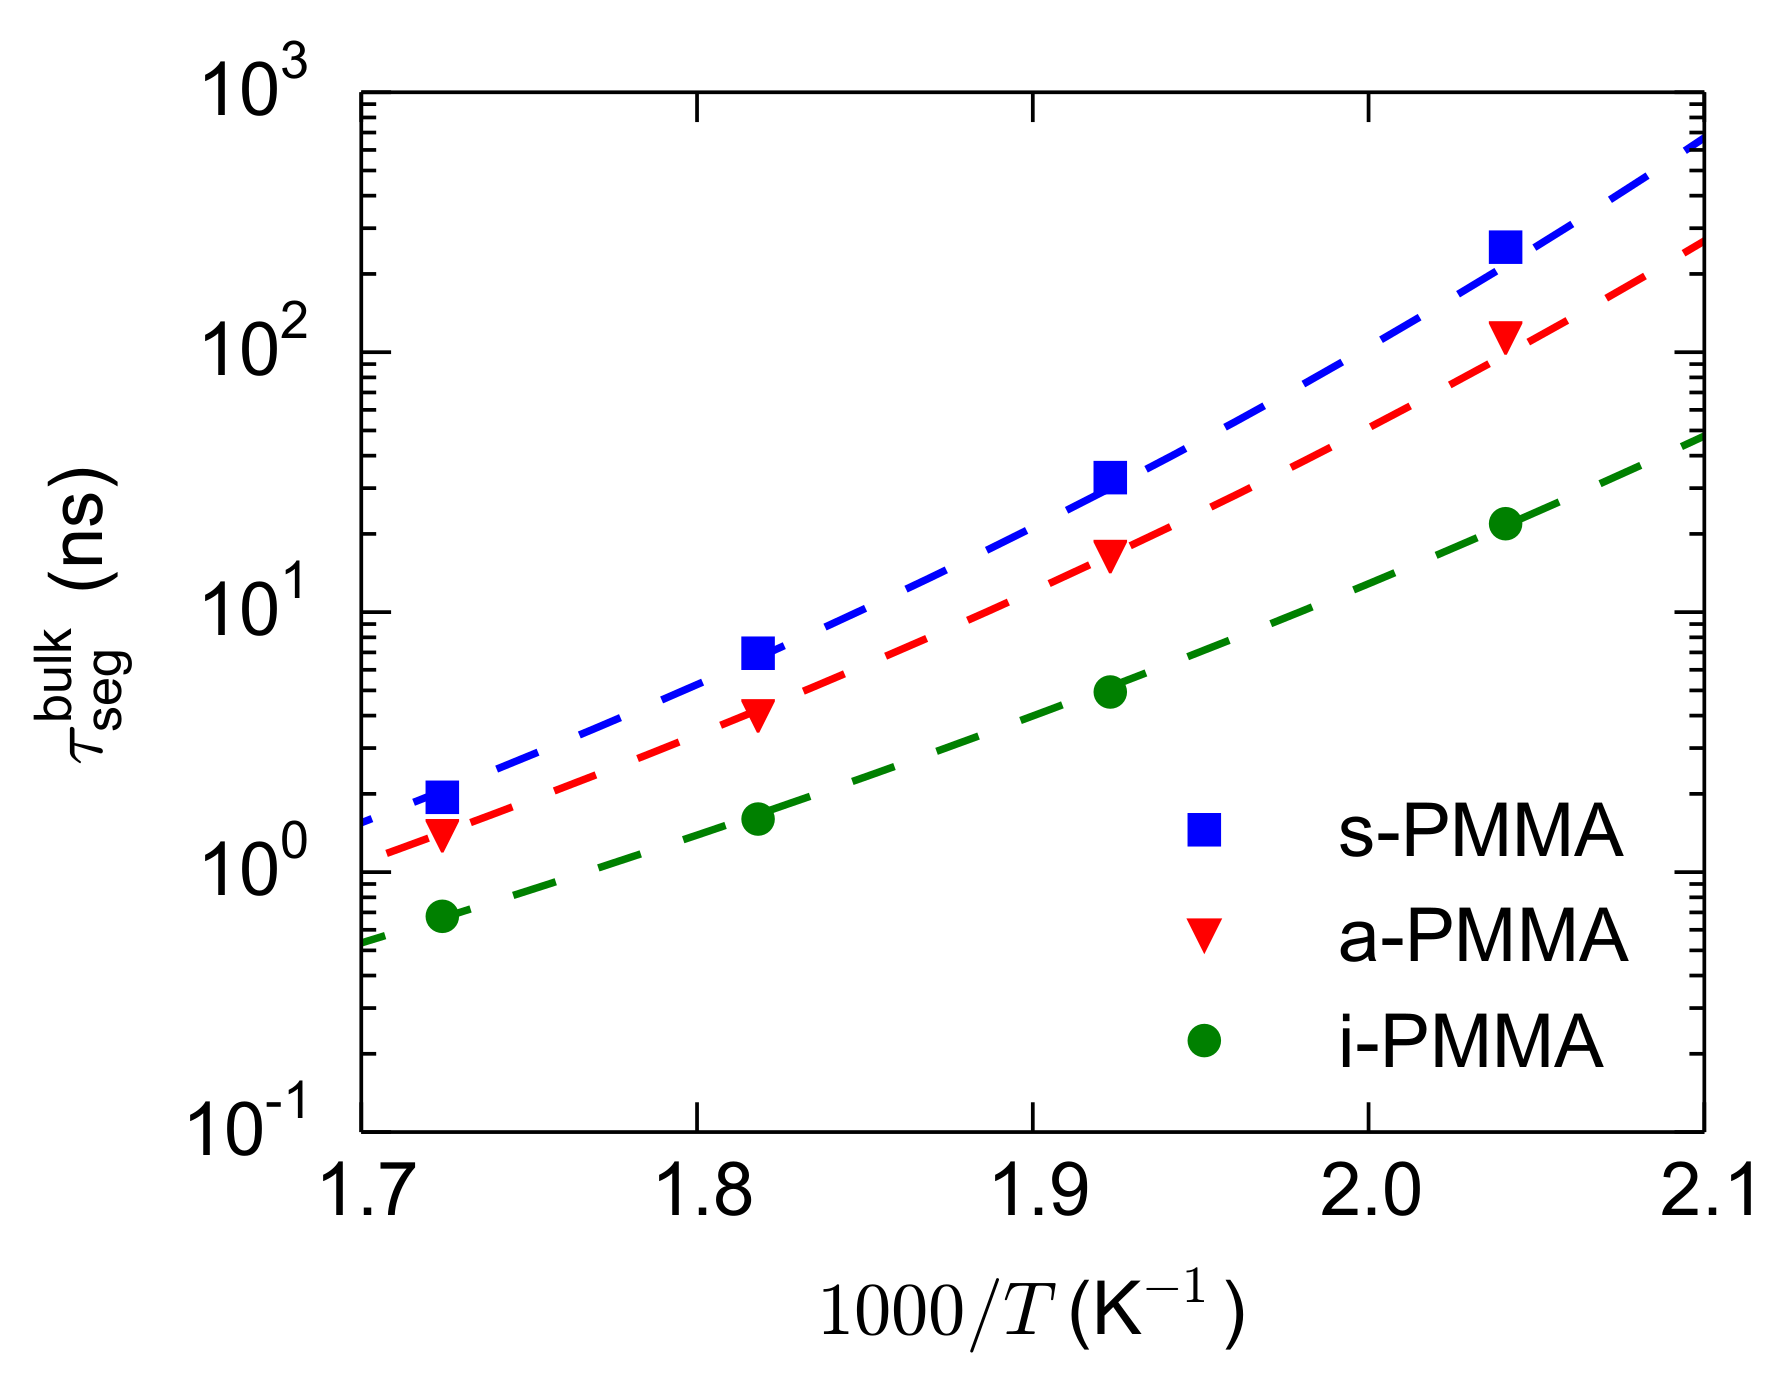
For the calculation of
, the bulk melts of i-, a-, and s-PMMA were simulated at 580 K, 550 K, 520 K, and 490 K and the
values were calculated. Then, the
values of each stereoisomer were fitted with a Vogel–Fulcher–Tammann (VFT) relation (
). The parameters of the fitted VFT curves are:
sec and
K for the three model PMMA stereoisomers and
K, 287 K, and 298 K for i-, a-, and s-PMMA, respectively (because of the extensions of the runs and recalculations of the relaxation times, the
values are very slightly different from our previous results [
44,
49]). The bulk segmental relaxation times and the fitted VFT curves are shown in
Figure 6. The obtained VFT relations are used for the estimation (through interpolation or extrapolation over short temperature intervals) of the temperature (
in Equation (
3)) corresponding to a given relaxation time (
in Equation (
3)).
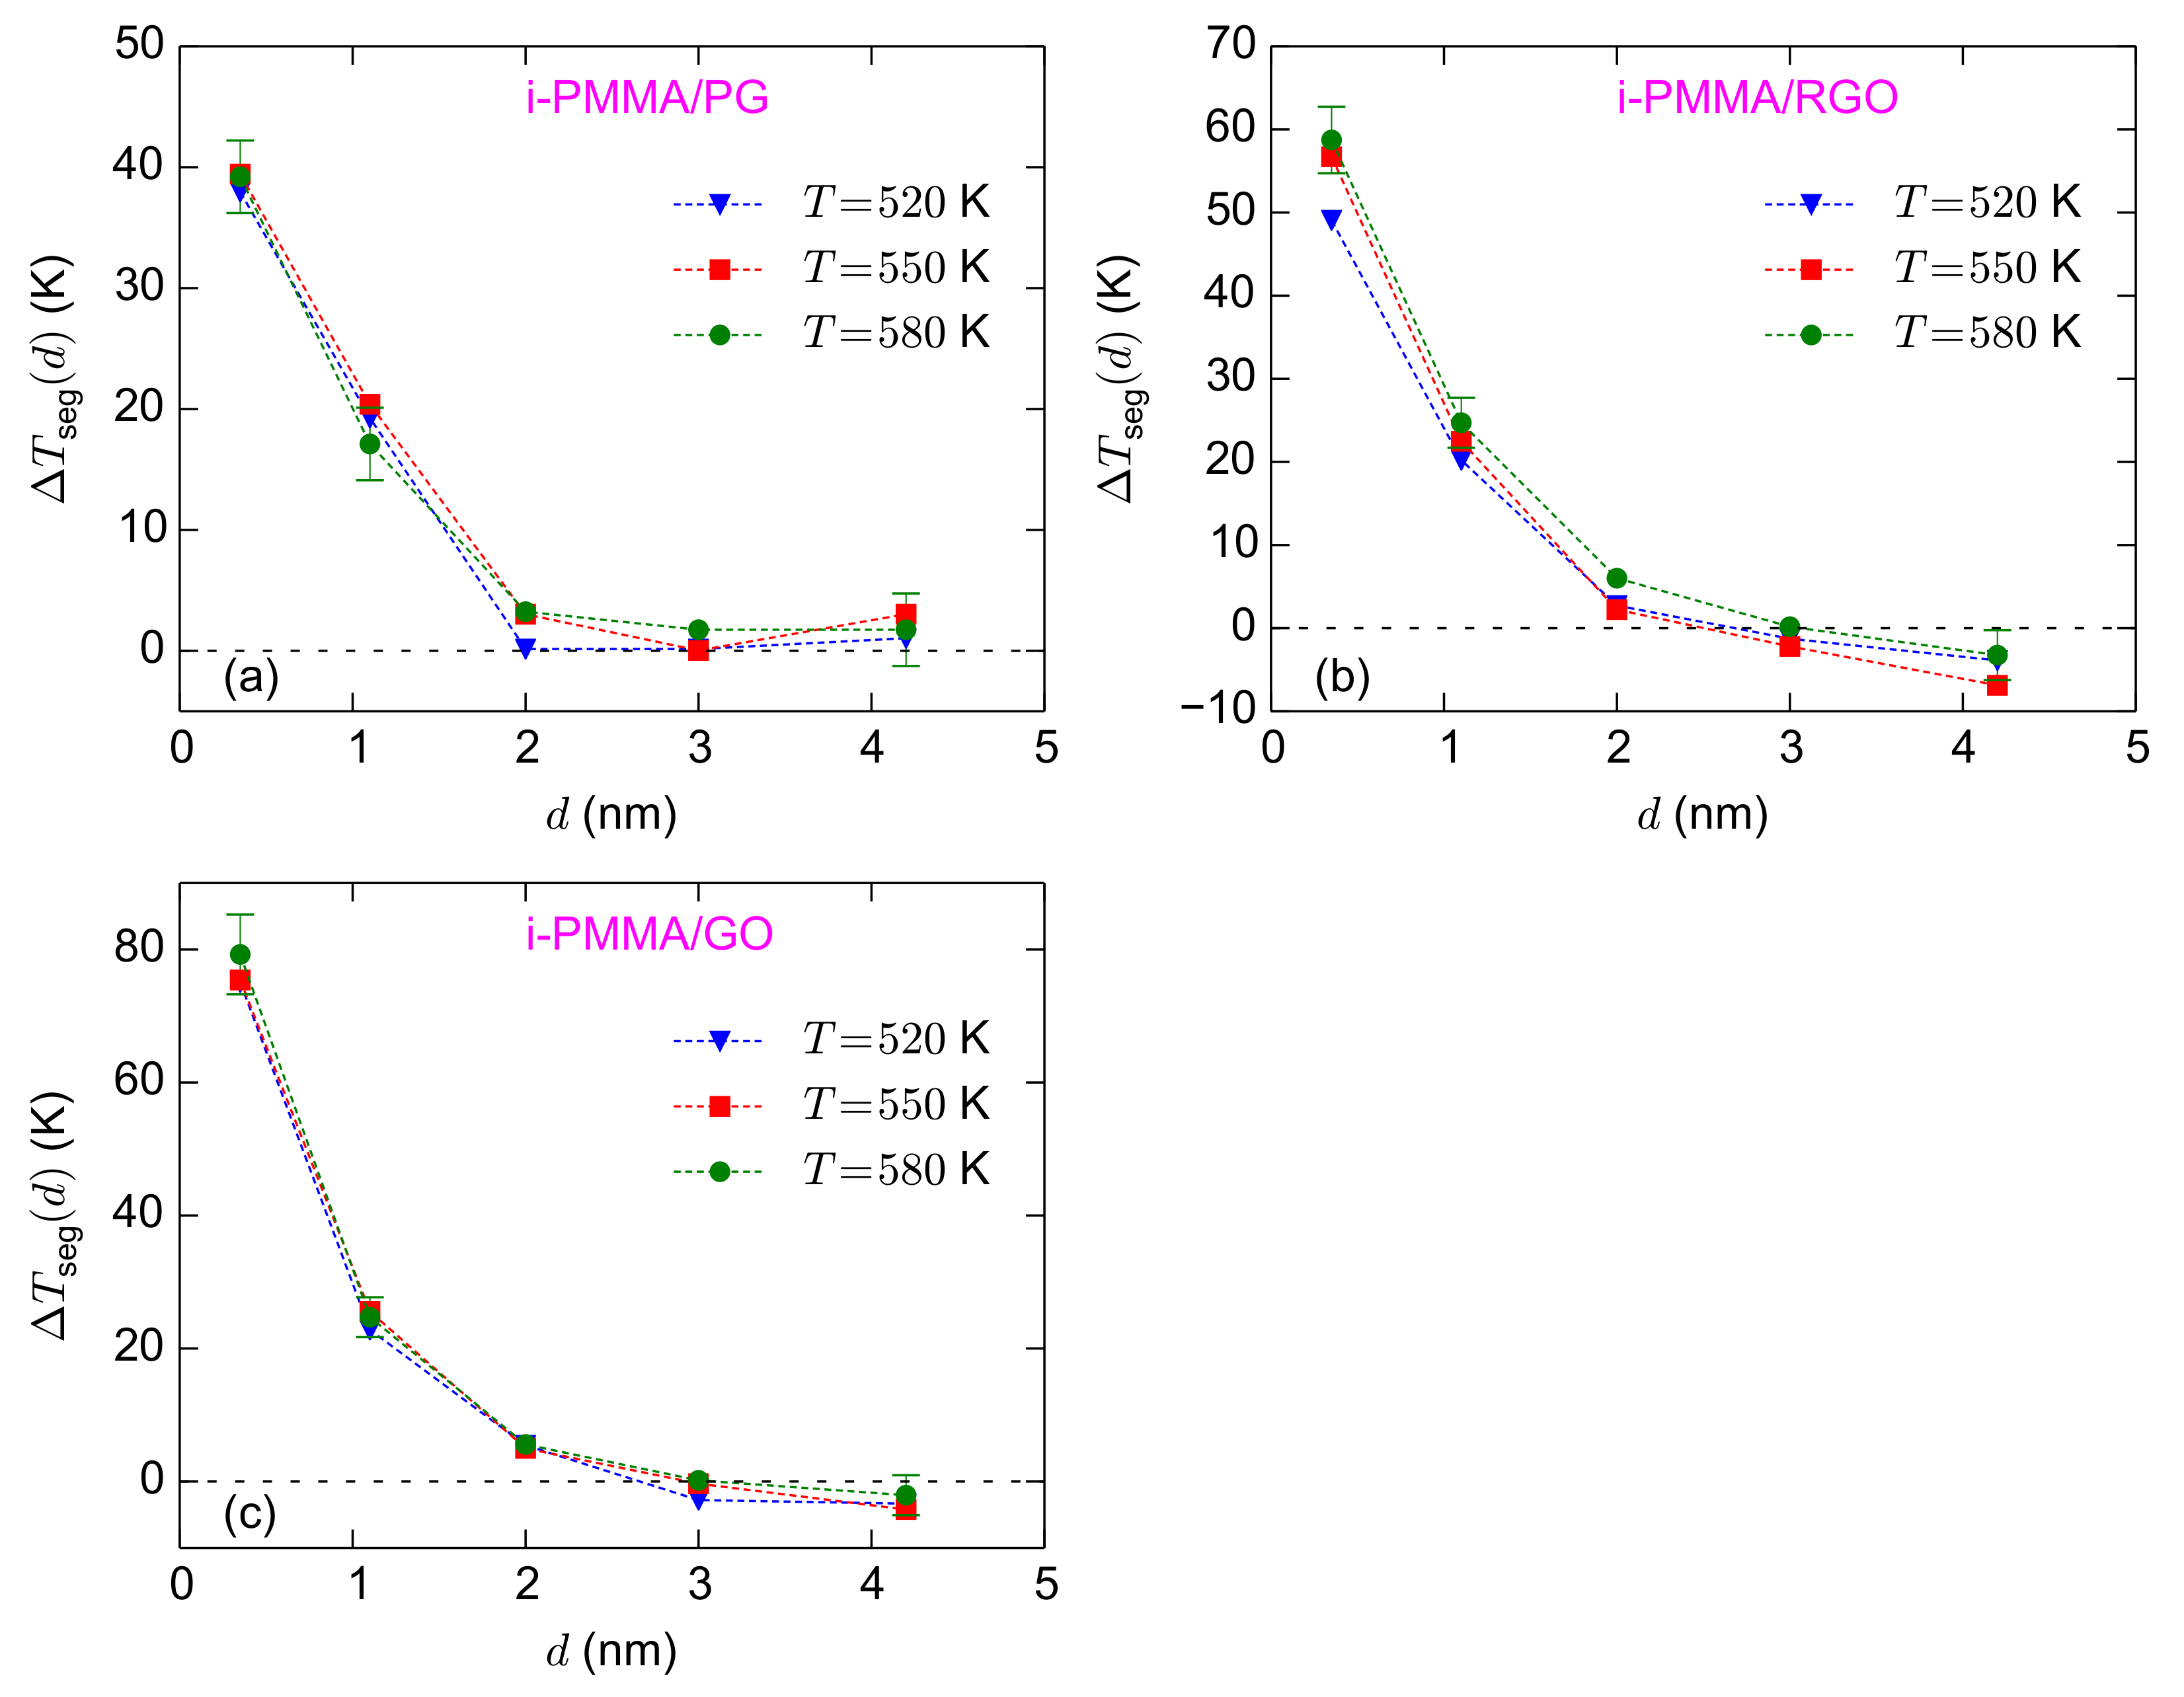
Figure 7a–c shows the calculated values of
for the i-PMMA/PG, i-PMMA/RGO, and i-PMMA/GO systems, at all temperatures studied here. Note that
Figure 7 is the representation of
Figure 5 in terms of
.
Figure 7 clearly shows that unlike
,
has a weak temperature dependence, well above
Tg, and stays almost constant upon the variation of temperature. The observed trends for the temperature-dependences of
and
deserve a comment. If we assume that the temperature dependence of the relaxation times at each interfacial layer (layers defined for the layer resolved analysis) can be described by a VFT relation, then the temperature-dependences can be rationalized:
is the ratio of two exponential (VFT) functions and is expected to have an exponential temperature-dependence too. On the other hand
is expected to have a weaker temperature dependence: if the VFT relations of the bulk melt and the interfacial layers have similar values of
(which seems reasonable), then
of a layer becomes a linear function of temperature with a slope of
(
B is the generalized activation energy of VFT function) (see Equation (
3)); in the case of similar generalized activation energies
,
becomes temperature independent.
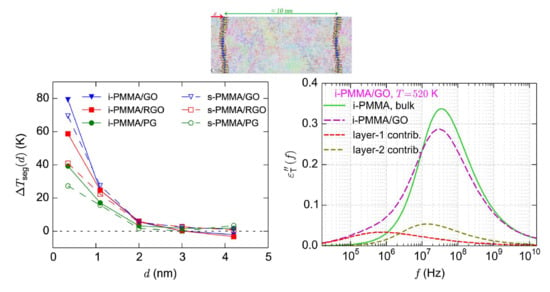
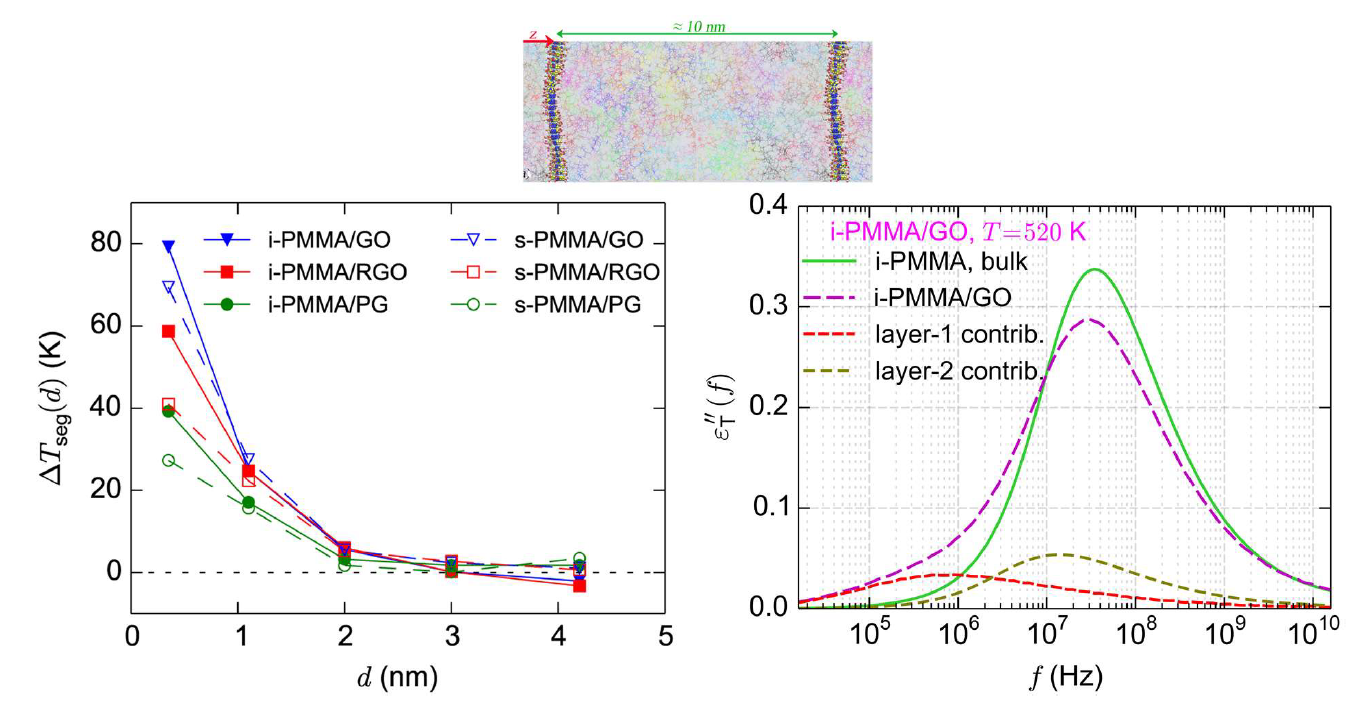
Figure 7a–c also shows the surface–chemistry dependence of
(by comparing (a), (b), and (c) subplots). For the adsorption layer,
approximately equals 39 K, 58 K, and 78 K for i-PMMA/PG, i-PMMA/RGO, and i-PMMA/GO, respectively; these differences reflect the slower dynamics of i-PMMA close to the oxidized surfaces. For the second studied layer (
–
nm), the
values fall in the interval of 17–25 K. The effect of surface–chemistry is less pronounced at the second layer relative to the first layer and
of the second layer is almost similar for the RGO and GO containing systems (see also
Table 1). The
values at the center of the i-PMMA/RGO and i-PMMA/GO confined systems are also worth attention; it seems that they are systematically negative (the behavior is seen at all temperatures) revealing slightly faster segmental dynamics relative to the bulk melt (see also
Figure 5 and
Table 1). This behavior is also seen for a-PMMA/RGO and a-PMMA/GO systems (
Table 1); however, s-PMMA or PG containing systems do not exhibit it.
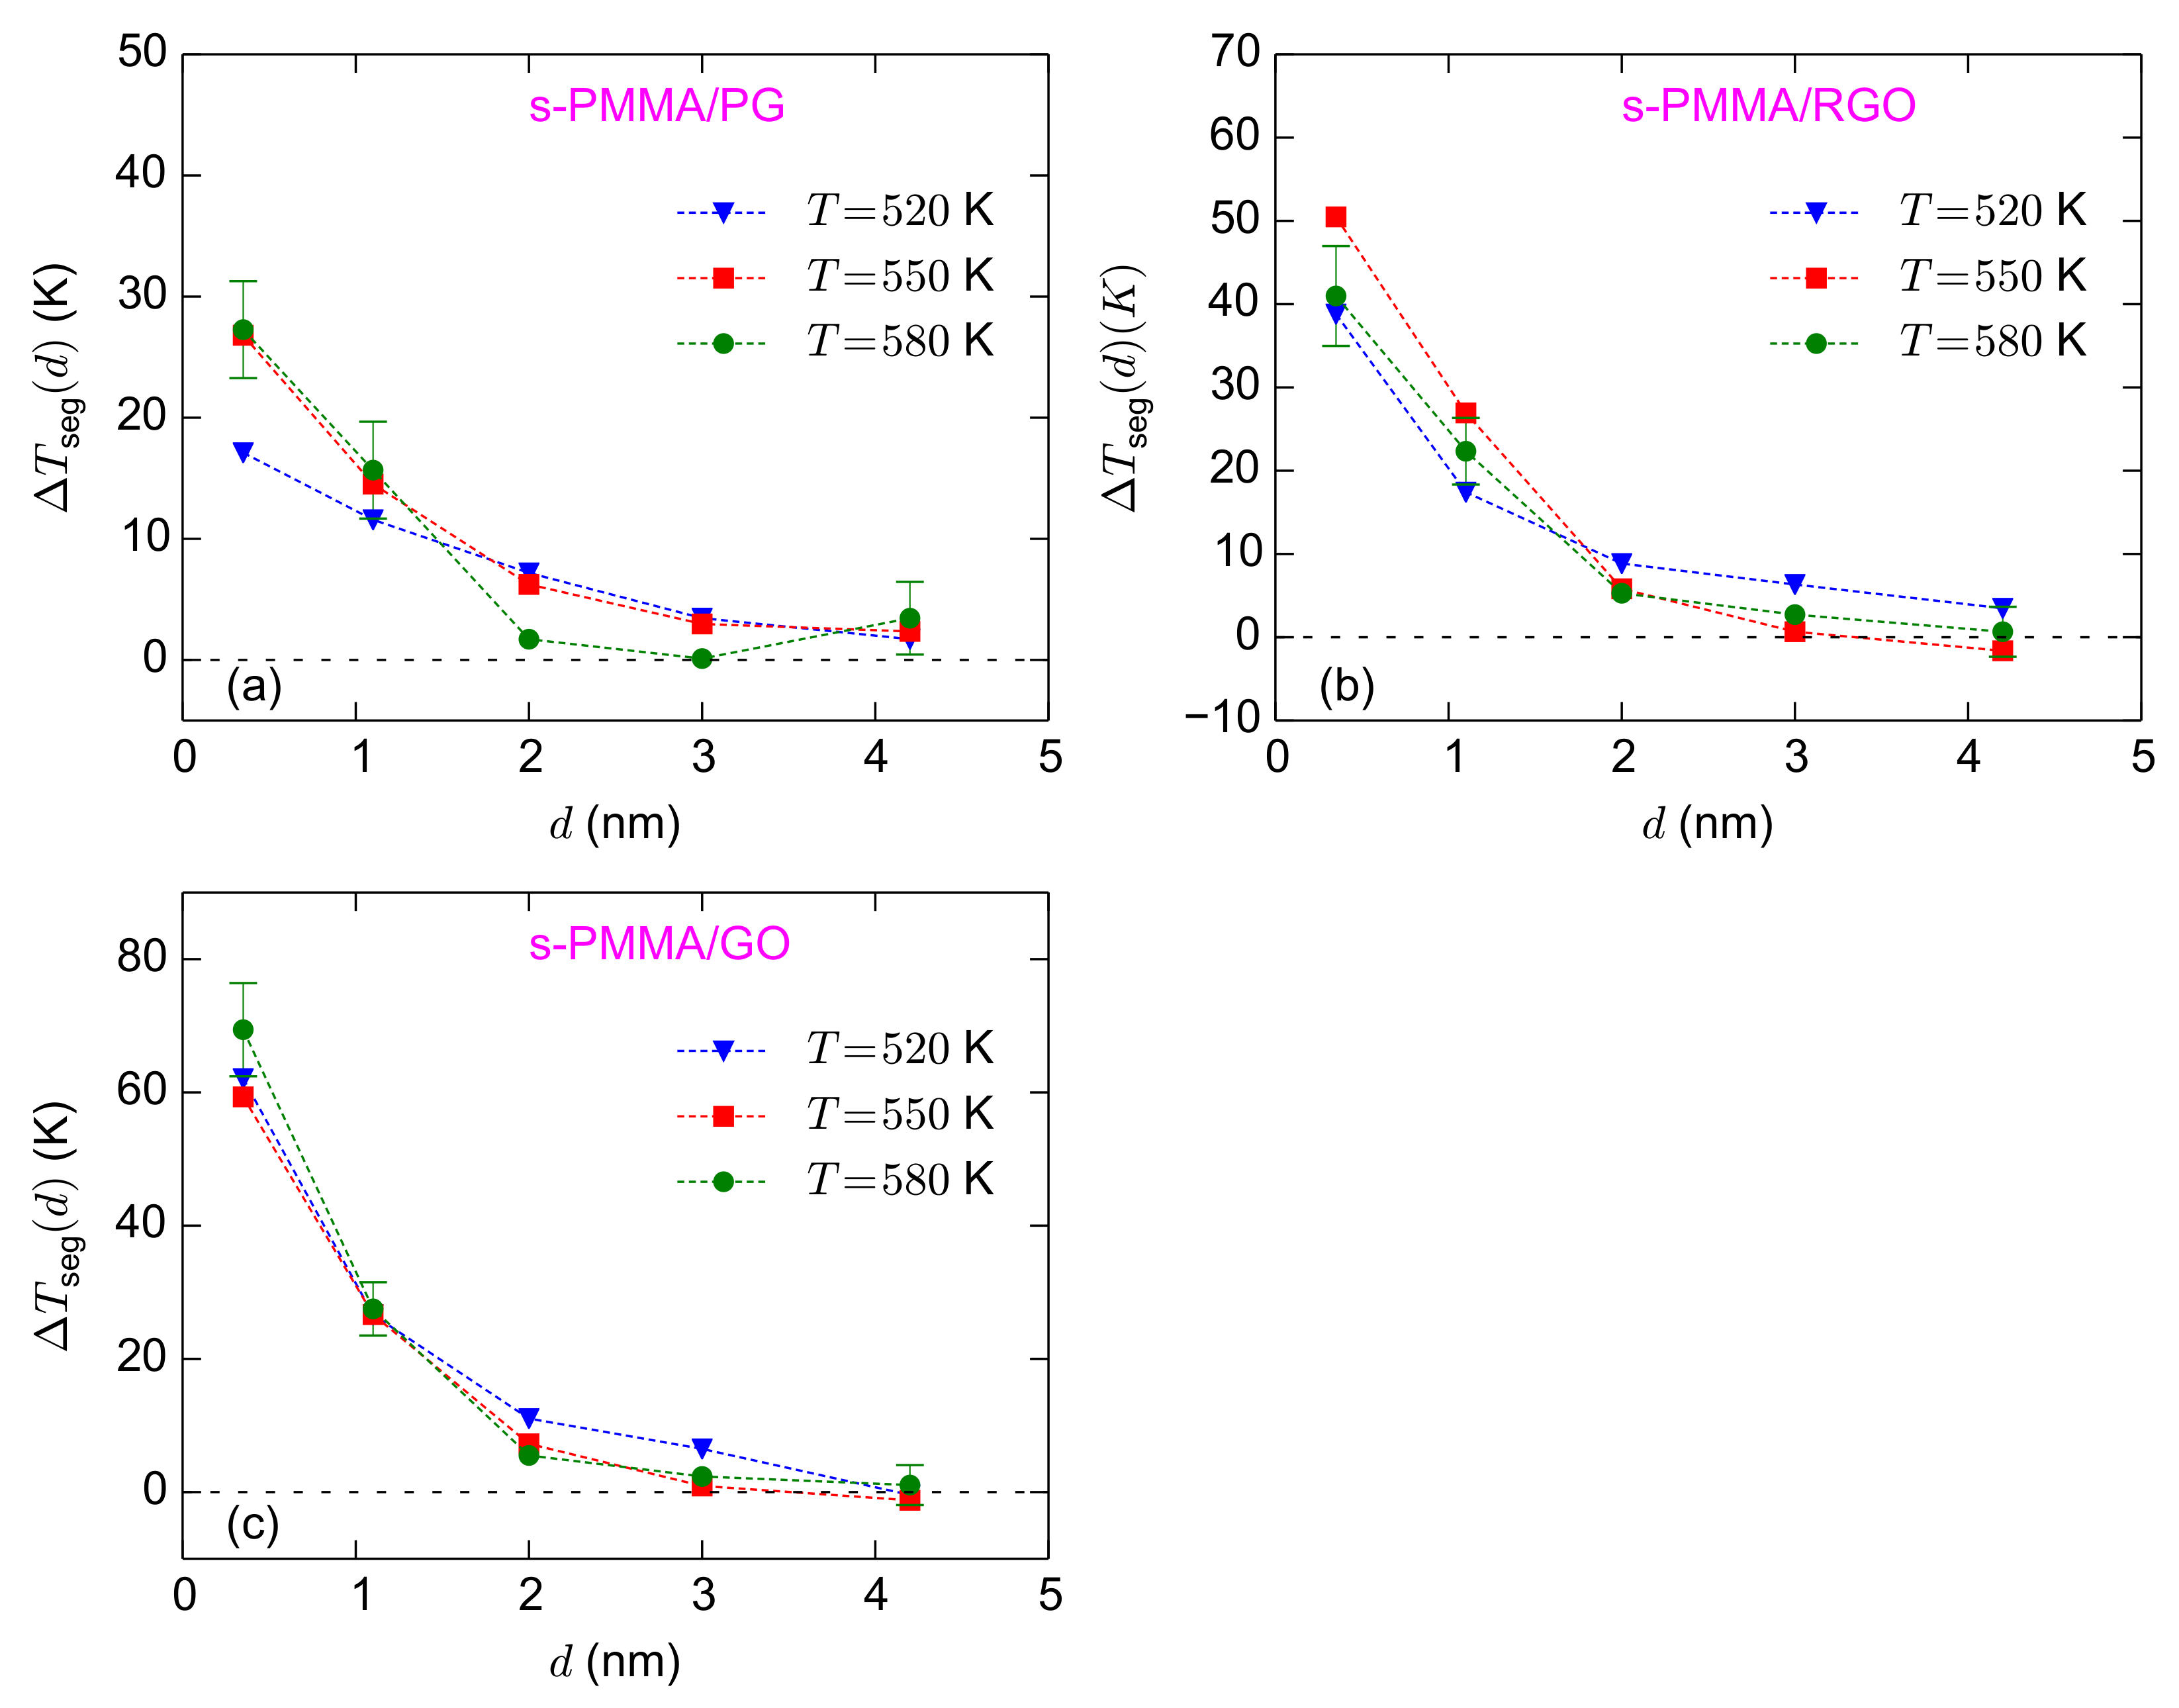
The calculated values of
for the s-PMMA confined systems are provided in
Figure 8. Comparing different temperatures, the
values of s-PMMA systems are more scattered than those of i-PMMA ones. However, the general trend seems similar to the results of i-PMMA systems and, in the studied temperature range,
seems to have a weak temperature dependence. For the adsorption layer,
approximately equals 27 K, 41 K, and 69 K for s-PMMA/PG, s-PMMA/RGO, and s-PMMA/GO, respectively (based on
K data). For all cases, at the adsorption layer, interfacial s-PMMA systems have lower values of
relative to the corresponding i-PMMA systems. This trend of the interfacial segmental dynamics correlates with the better interfacial packing of, and the formation of longer trains as well, by i-PMMA chains, as compared to s-PMMA ones (see
Figure 2).
To summarize the surface–chemistry and tacticity effects, we present in
Table 1 the layer resolved values of
for i-, a-, and s-PMMA melts confined between PG, RGO, GO nanosheets; the data of
Table 1 are calculated based on the simulations at 580 K. With increasing the concentration of the surface functional groups,
increases at distances less than
nm (the first three layers). Particularly, at the adsorption layer (
–
nm):
; at the second and third layers:
. The effect of PMMA stereochemistry is also mainly seen at the adsorption layer; close to the three model surfaces, i-PMMA has a higher
than s-PMMA and a-PMMA. As mentioned above, this behavior is consistent with the formation of tacticity dependent interfacial structures. It seems that a-PMMA and s-PMMA have comparable values of
at the interfacial region (the differences are within the error bars).
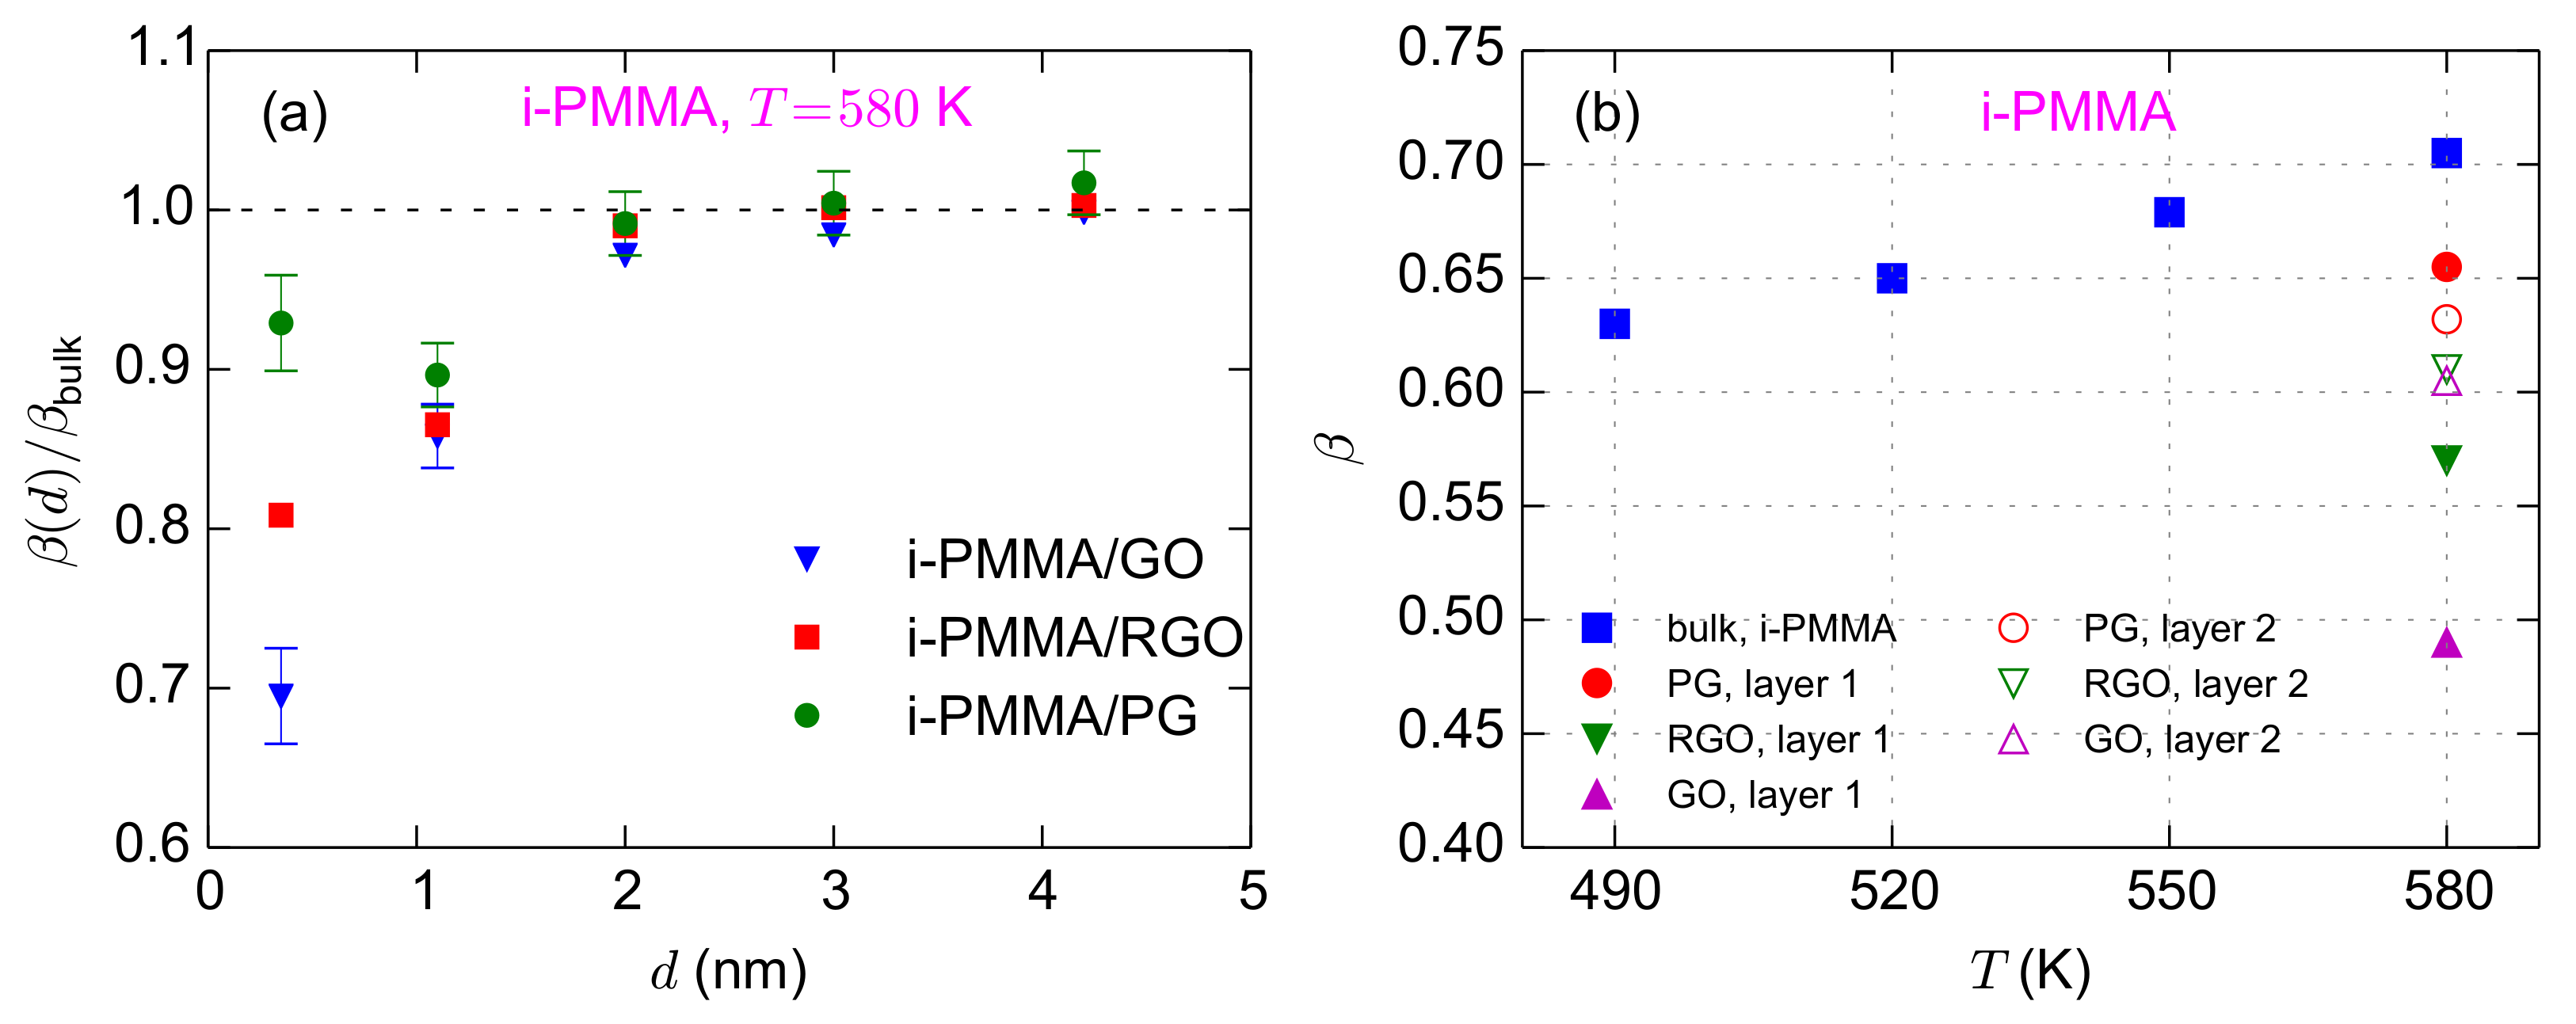
In the last part of this section, we discuss the values of the KWW exponents (
in Equation (
2)) for the confined systems. In general, a lower value of
corresponds to a broader distribution of relaxation times in the system. The layer resolved values of
for i-PMMA/PG, i-PMMA/RGO, and i-PMMA/GO systems at
K are provided in
Figure 9a. The interfacial layers, particularly the first and second layers, have lower values of
relative to the bulk melts; furthermore, increasing the concentration of functional groups leads to the decrease of
at the interfacial region. Above, we have described the deceleration of the segmental dynamics at the interfacial region through a temperature shift (
). Thus, it is reasonable to compare the
of an interfacial layer (at distance
d) with the
of the bulk melt at a lower temperature, where the interfacial layer and the bulk melt have a similar average segmental relaxation time.
Figure 9b shows the values of
for the the first and second interfacial layers for i-PMMA confined systems at
K, together with the values of
for the bulk melts of i-PMMA at different temperatures. From
Table 1, one can find the temperature shifts that make the correlation times of the bulk melt similar to the correlation times of the interfacial layers. As shown in
Figure 9b, with decreasing temperature,
of the bulk system decreases (this is to be expected since as a system approaches
Tg its dynamics becomes more heterogeneous); however, in all i-PMMA/PG, i-PMMA/RGO, and i-PMMA/GO cases, segments in both the first and second interfacial layers exhibit lower
values than the corresponding bulk segments with the same (average) segmental relaxation time. Therefore, it is clear that the distribution of the segmental relaxation times is broader in the interfacial layers, even when the average relaxation times of the bulk melt and the interfacial layers are similar.
4.3. Overall Dynamics of the Confined Melts
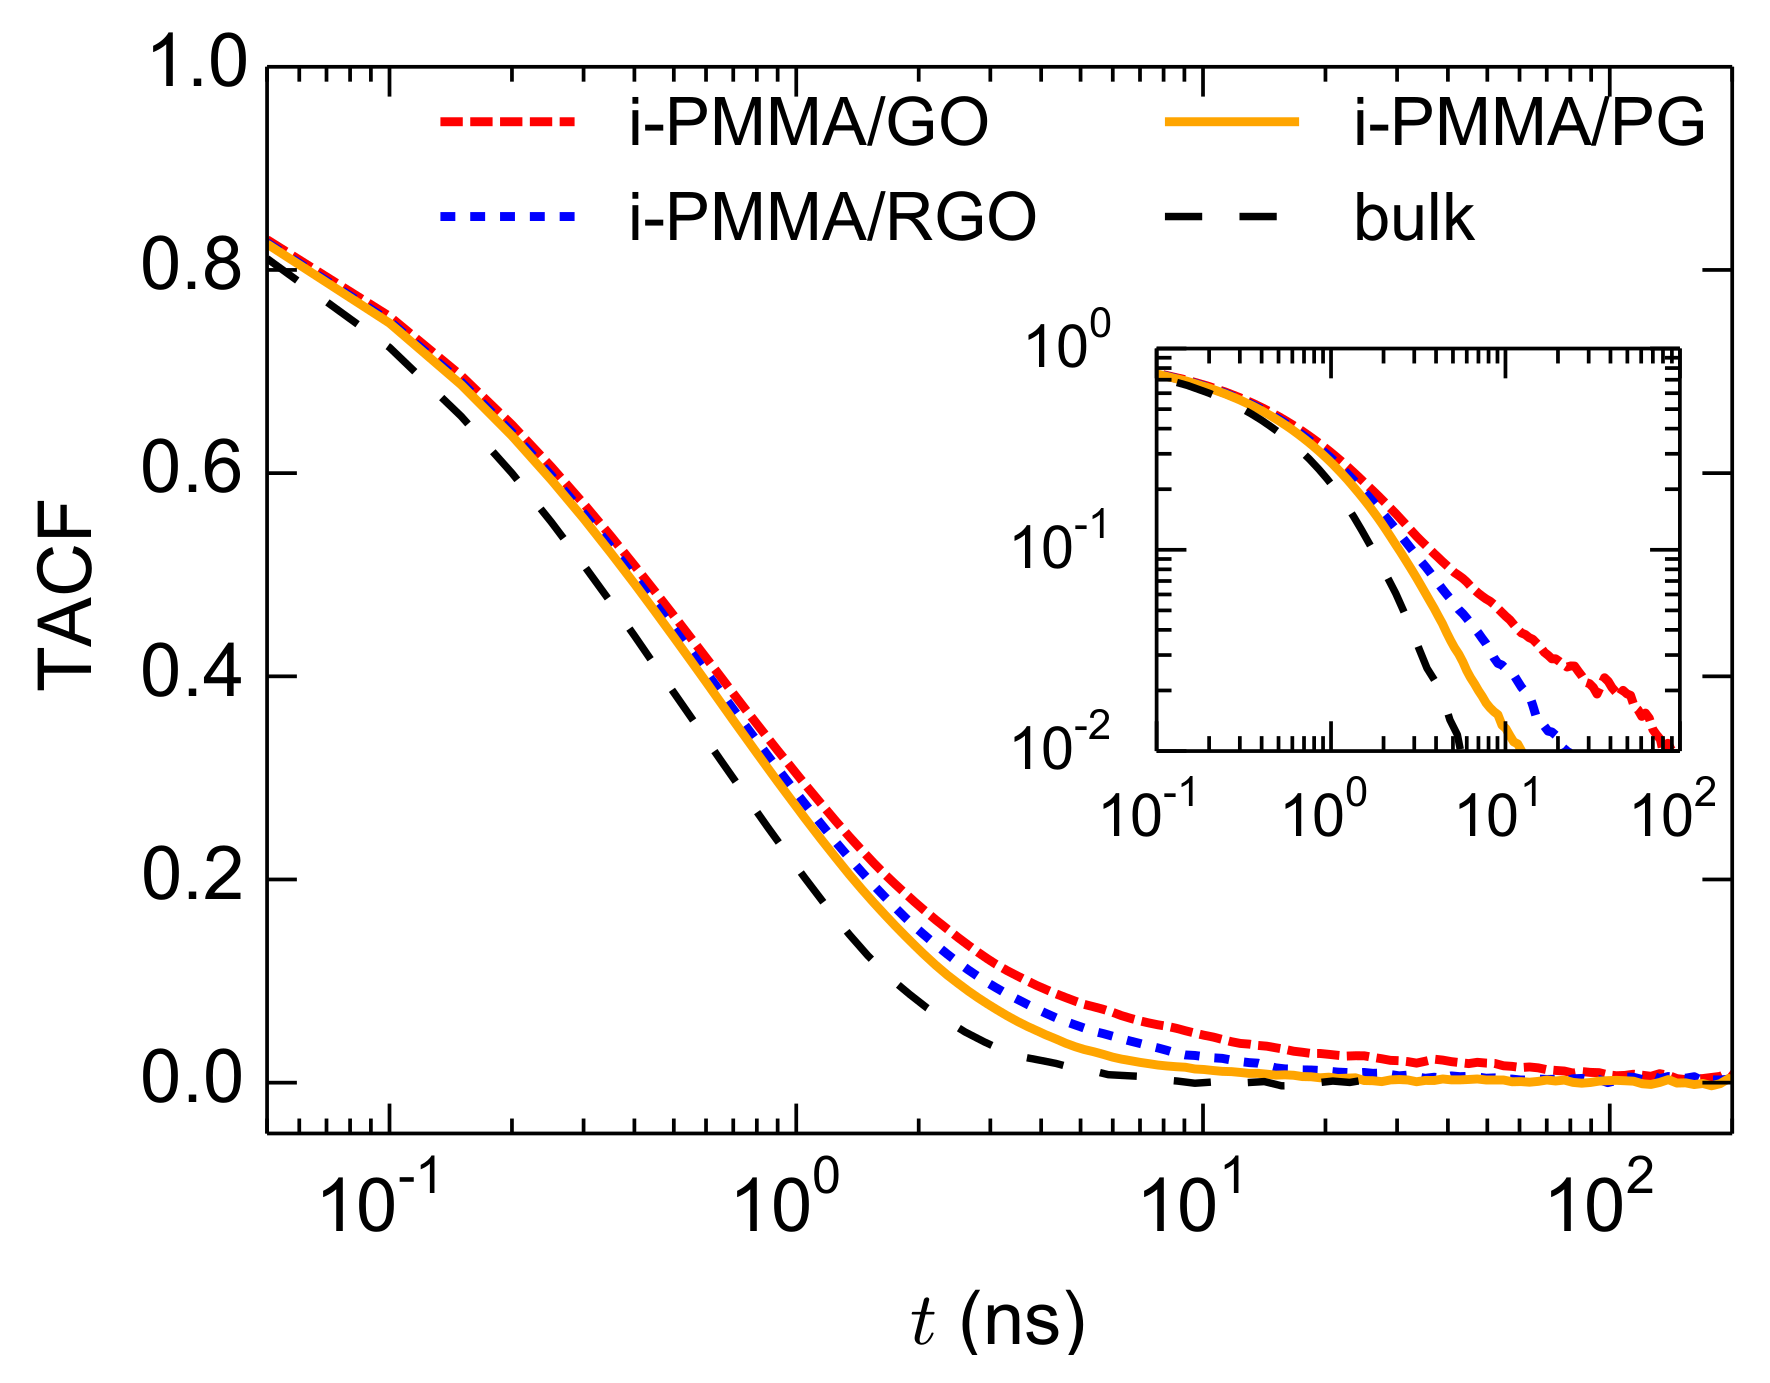
Having presented the layer resolved gradients of the segmental dynamics, here, we discuss the overall (average over the entire system) segmental dynamics of the confined PMMA melts. This is particularly important since in experiments a layer-resolved analysis is not straightforward, and usually the average segmental dynamics of nanocomposites and thin films is detected. The TACF curves, calculated over the entire confined melts, for i-PMMA chains confined between the PG, RGO, and GO nanosheets, at
K, are provided in
Figure 10; the corresponding bulk curve is also shown. As expected, the TACF curves of the confined melts decay slower than that of the respective bulk curve due to the contributions of the slower segments in the vicinity of the model nanosheets. In addition, with increasing the concentration of the surface functional groups, the decay of TACF becomes slower. The TACF curves of the confined melts have long time tails and they can not be fitted with a single KWW function; even the TACF of the PMMA/PG systems can not be perfectly fitted with a single KWW function. The issue is discussed below.
As mentioned before, for the layer resolved calculation of TACF, each dihedral angle counted in the TACF of a layer based on the its position at the time origin. Due to the use of this scheme for the calculation of layer resolved TACF, and because the denominator of Equation (
1) is almost similar for different layers, the overall TACF of the confined melts can be separated into TACF of different layers:
where
N is the number of layers,
is the TACF
of the
layer, and
is the fraction of backbone dihedral angles that belong to the
layer. This relation clearly shows the contributions of different layers in the overall TACF of the confined melts. The segmental relaxations of the first two interfacial layers (particularly of the first layer, or the adsorption layer) are well separated from the middle layers (see
Table 1); this explains the inadequacy of a single KWW function for fitting the overall TACF curves.
Considering Equation (
4), it is informative to briefly discuss the fraction of backbone dihedral angles belonging to the adsorption (first) layer,
. For the systems studied here,
falls in the interval of
to
; however, it has surface–chemistry and tacticity dependence and increases with the concentration of surface functional groups and population of isotactic sequences of PMMA (it does not have significant temperature dependence in the studied temperature range). The values of
for i-PMMA/PG, i-PMMA/RGO, i-PMMA/GO are
,
, and
, respectively. The values of
for i-PMMA/RGO, a-PMMA/RGO, and s-PMMA/RGO are
,
, and
, respectively. It is worth mentioning that the values of
are close to the fractions of train monomers (or monomers belonging to the adsorption layer). The dependence of
on surface–chemistry is consistent with the stronger interactions of RGO and GO, compared to PG, with PMMA and also their higher roughness which might increase the effective surface area (or available volume around surfaces) for the adsorption of monomers. The dependence of
on PMMA tacticity is consistent the formation of longer trains by i-PMMA compared to a-, and s-PMMA (see
Figure 2c). To provide a rough estimate for
, one can calculate
where
D is the confined film thickness,
is the length scale of adsorption of monomers, and the coefficient 2 takes into account two sides of the model surfaces; here, in all cases
nm, so
(as mentioned above, actual values vary between 0.11 and 0.15).
4.4. Relaxation Spectra in the Frequency Domain
It is informative to look at the TACF curves at the frequency domain to be able to qualitatively compare them to experimental results, for example the results of dielectric relaxation spectroscopy. Qualitative agreement between the TACF frequency spectra and
-relaxation spectra is expected since backbone torsional motions underlie the
-relaxation of PMMA. Analogous to the calculation of dielectric loss from dipole moment autocorrelation function [
19,
50,
51], here we calculate the loss component of backbone torsional motions,
, from the Fourier transform of TACF
(
, where
f is frequency) [
19]. Note that, for PMMA, both
-relaxation and
-relaxation processes (which are related to backbone and side-chain motions, respectively [
46,
47,
48]) contribute to the decay of the dipole moment autocorrelation function; however, using the torsional autocorrelation function, we directly analyze the backbone motions.
curves of the bulk melts and different layers (layers that were defined in the layer resolved analysis of TACF) were obtained by applying Fourier transform to the KWW fits of the corresponding TACF
curves. To calculate
for the entire confined melts, we constructed a smooth curve for the TACF
using KWW fits of all layers and Equation (
4); then, we applied Fourier transform to that smooth curve. The Fourier transforms were calculated using a Filon-Trapezoidal rule [
52] on equally spaced data in the time domain. Some of the calculated
curves (loss components of TACF
for backbone dihedral angles) are shown in
Figure 11 and
Figure 12.
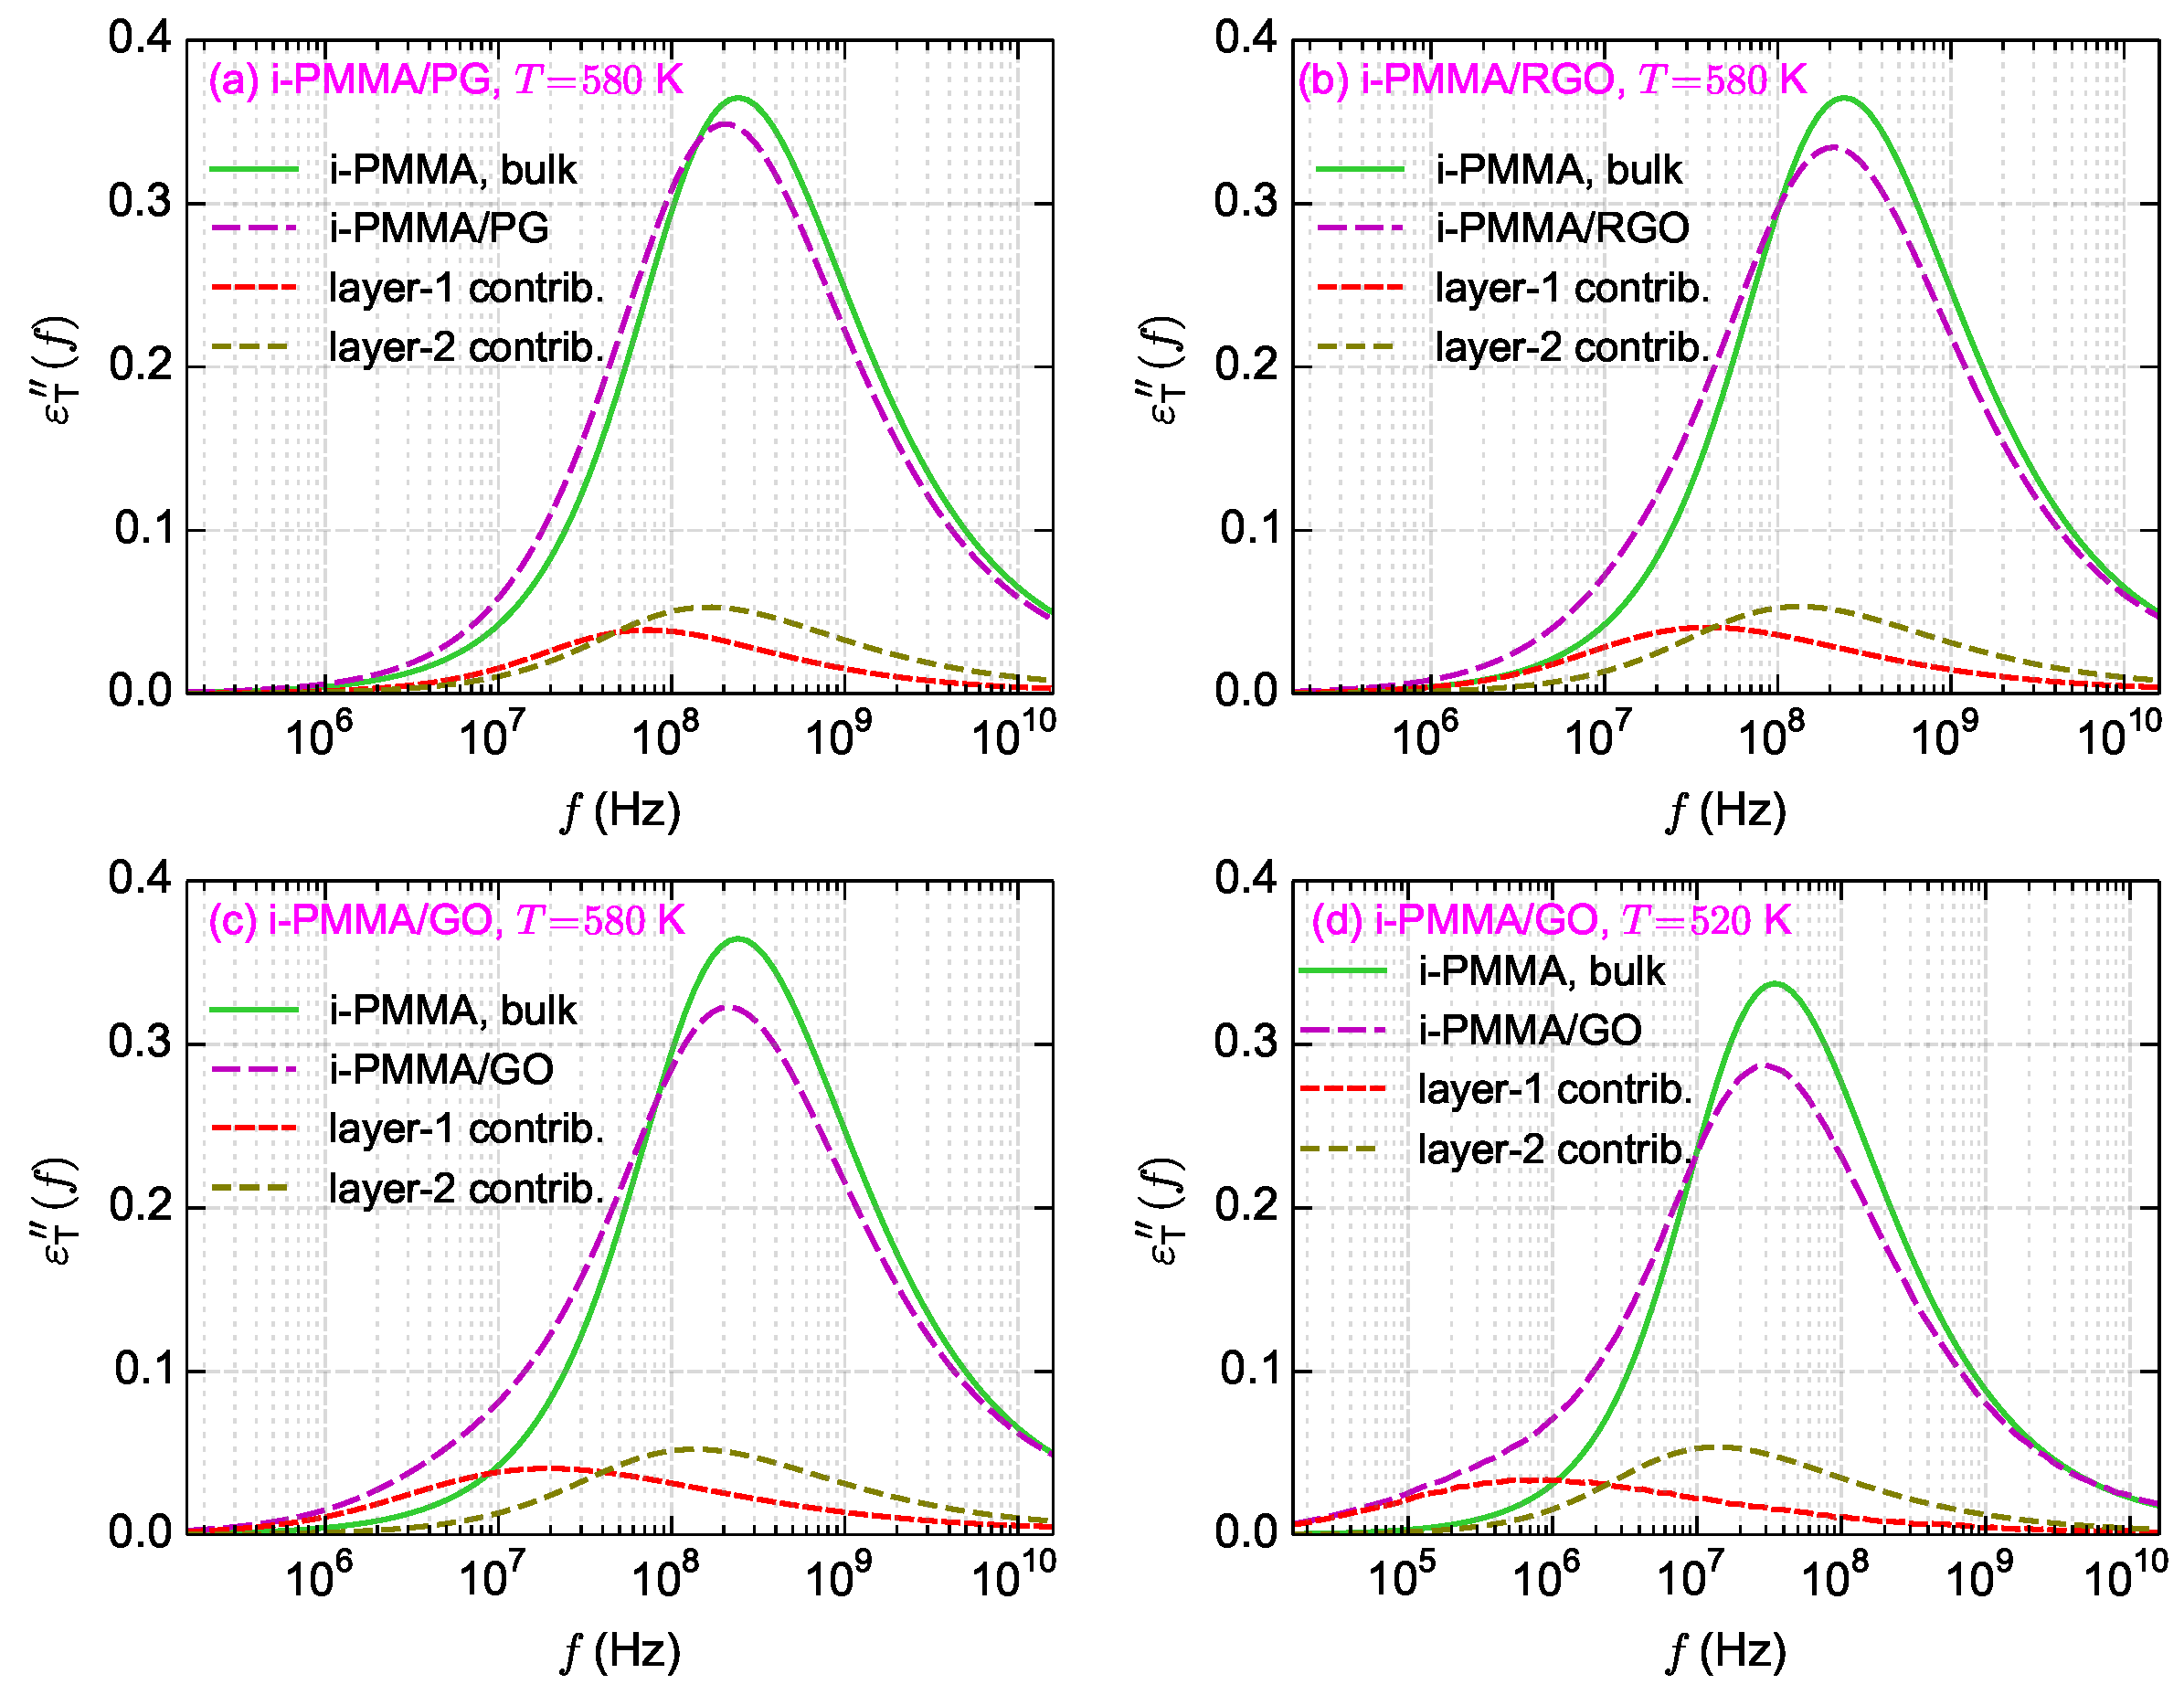
Figure 11a–c shows the calculated
curves for i-PMMA/PG, i-PMMA/RGO, and i-PMMA/GO systems at
K, whereas
Figure 11d presents
curves for i-PMMA/GO at
K. In each panel of
Figure 11, the
curves of the bulk melt, the (entire) confined melt, and the contributions of the first and second interfacial layers (0–7 Å and 7–15 Å) in the
of the confined melt are presented. In addition,
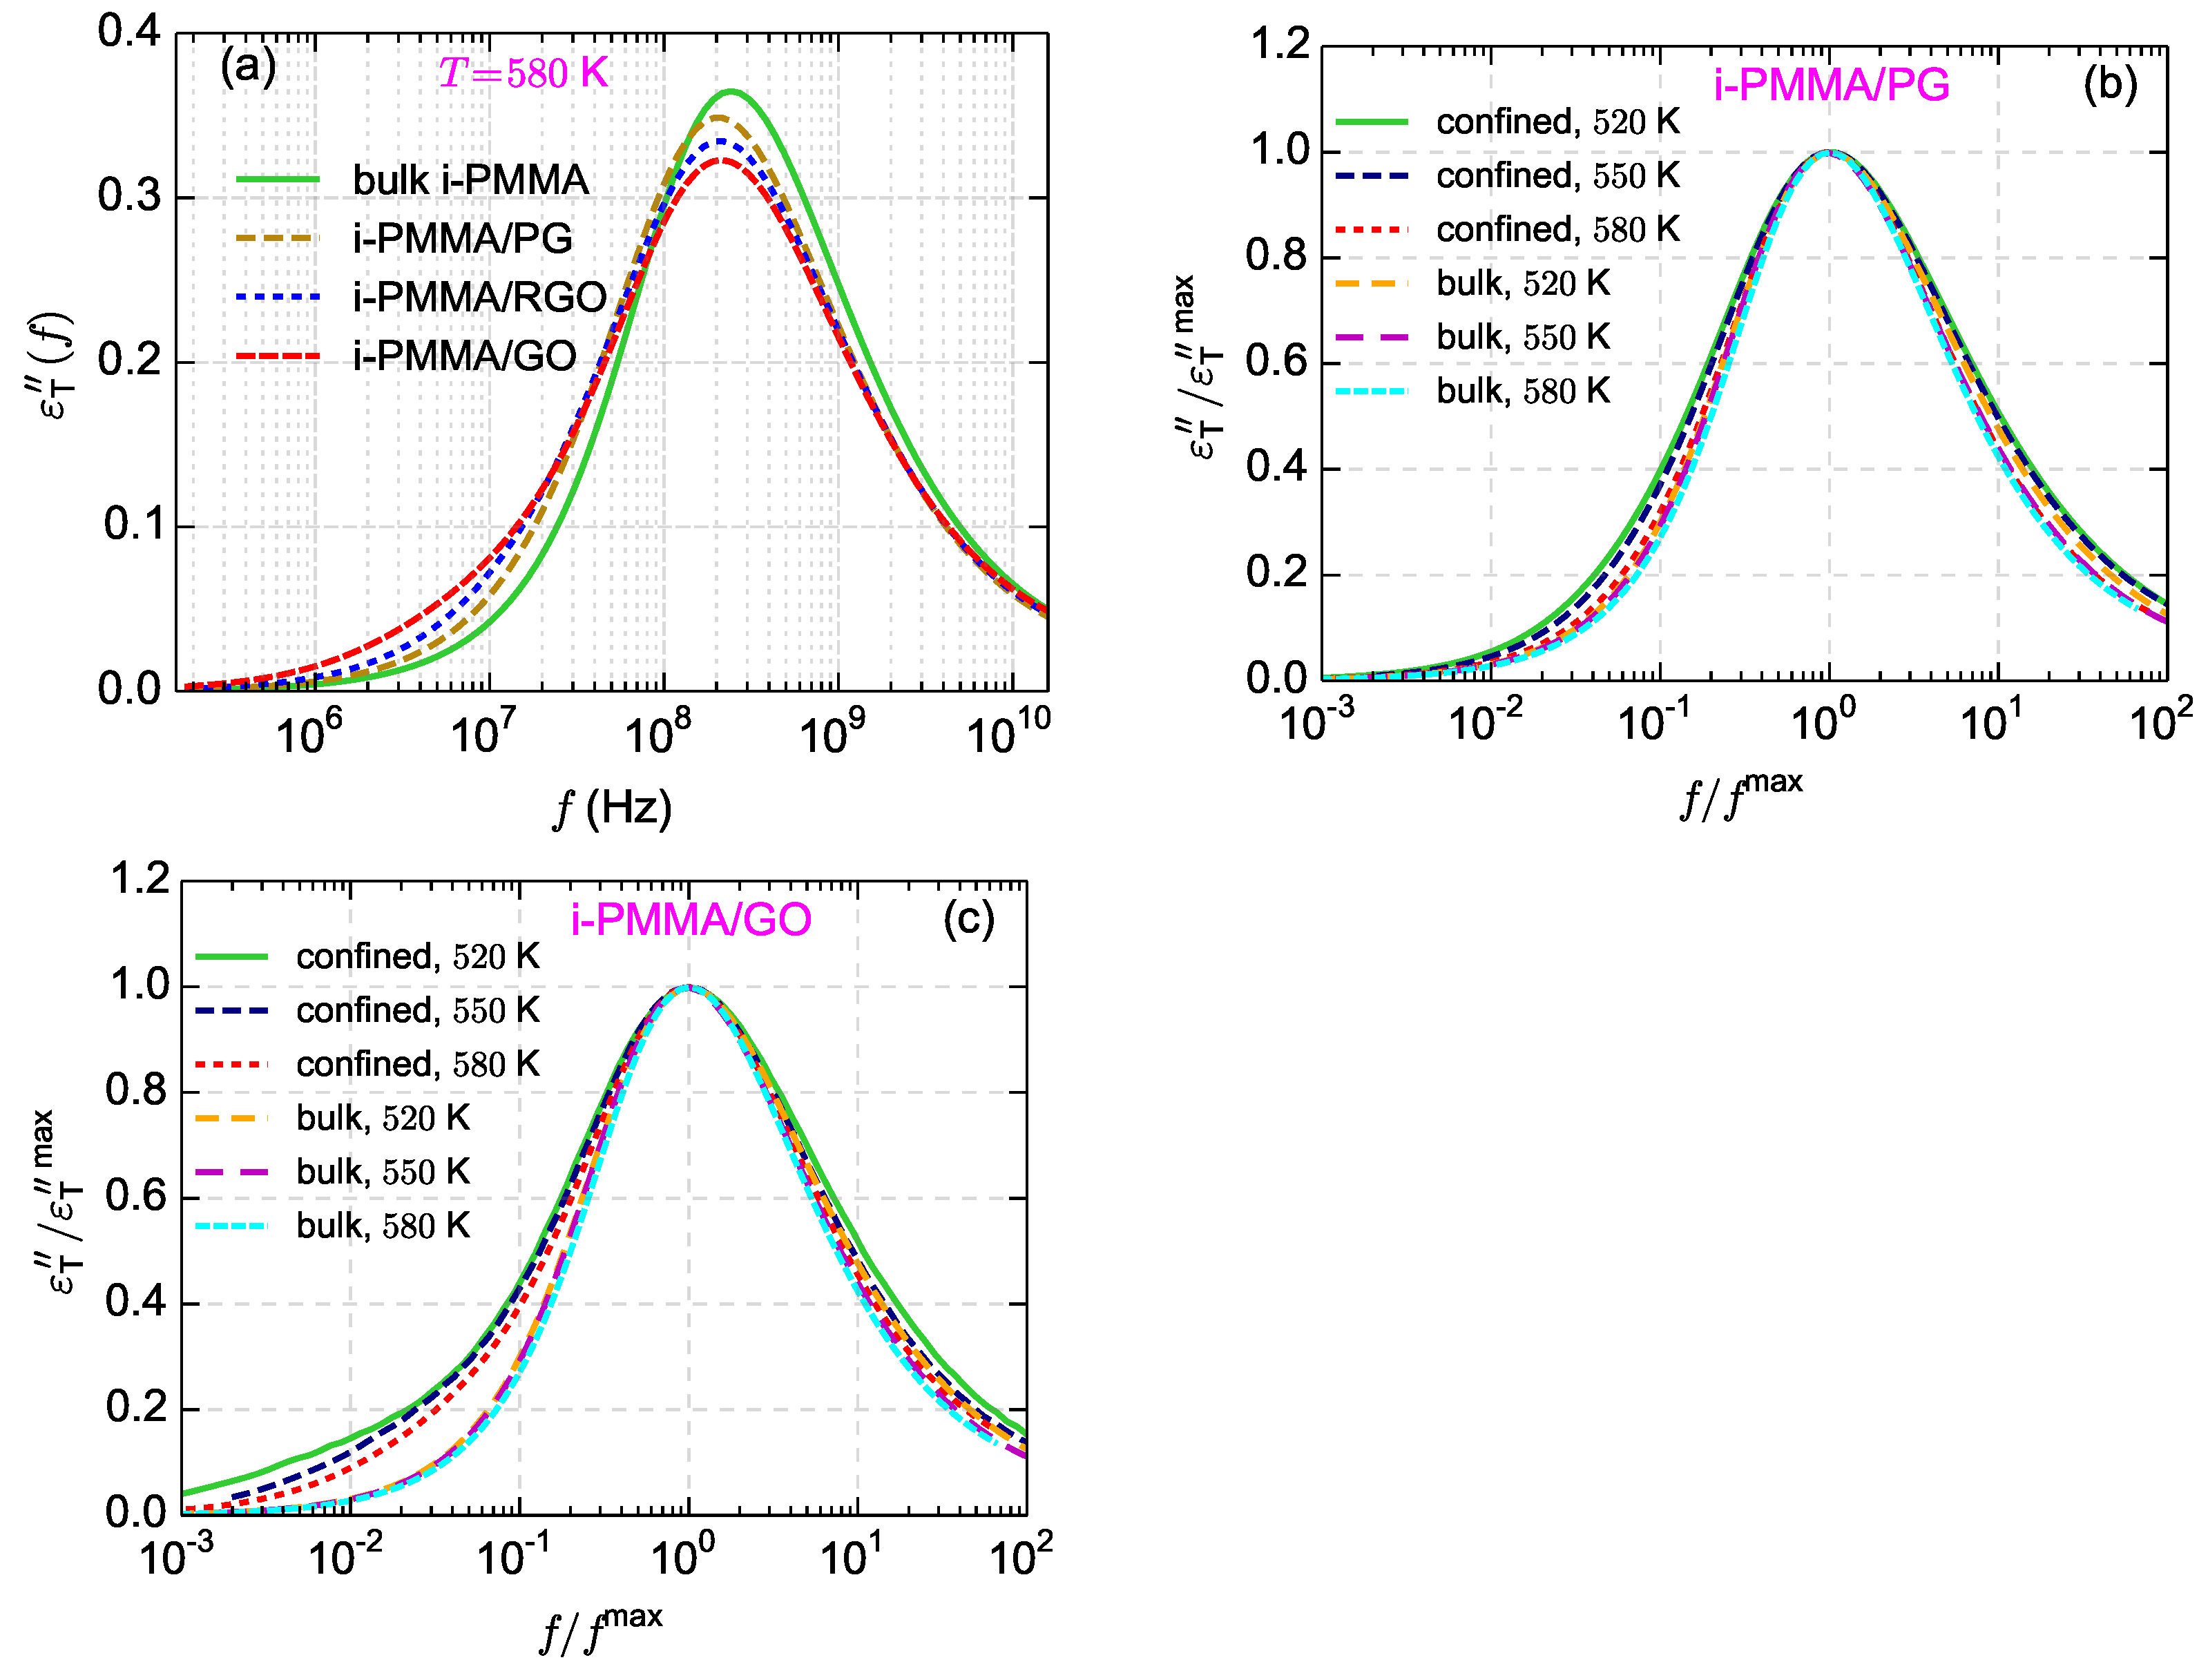
Figure 12a explicitly shows the surface–chemistry dependence of
for the confined melts of i-PMMA at
K. Some important observations can be made out of these data. Due to the deceleration of the segmental dynamics at the interfacial region, the
curves of the confined melts are broader (toward lower frequencies) and have lower amplitudes relative to the corresponding bulk curves. These effects become more pronounced with increasing the concentration of surface functional groups and decreasing temperature. The position of the peak maximum is also worth attention: in all cases, a slight shift of the maximum of the
(of the confined melts) to lower frequencies is observed, whereas the shift is more pronounced in the case of PG containing systems.
Figure 11c,d show the loss spectra of i-PMMA/GO system at
K and
K, respectively. With reducing temperature, the separation between the bulk and the interfacial segmental processes increases on the frequency axis (see also the data of
Figure 5); hence, at 520 K, as compared to 580 K, a rather distinct shoulder is seen in the
curve of the i-PMMA/GO system.
Figure 12b,c shows the temperature dependence of normalized
spectra (normalized with the frequency and height of their maxima) for the bulk i-PMMA melts and the confined i-PMMA melts between PG and GO sheets; normalization has been done following the procedure used for checking the applicability of time-temperature superposition principle [
51]. Upon normalization, the bulk spectra become almost identical (except slight differences in high frequency region). However, the shape of the normalized confined-melt spectrum is temperature dependent (particularly for i-PMMA/GO,
Figure 12c) which shows the shortcoming of the time-temperature superposition for describing the segmental dynamics of the model confined melts [
51]. The reason is the stronger temperature dependence of the segmental dynamics at the interfacial layer than the segmental dynamics at (rather bulk-like) middle layer (see also
Figure 5).
It is worth comparing, qualitatively, the simulation results about the
spectra to the experimental
-relaxation dielectric loss spectra of polymer nanostructured materials. The broadening of the dielectric loss spectrum toward low frequencies and reducing the strength of its peak have been observed for the
-relaxation spectra of nanocomposites containing attractive nanoparticles [
8,
9,
10,
11,
14,
53]. Furthermore, in some cases, a slight shift of the peak position has been observed [
8,
10,
11,
14]. In some experimental works, the loss spectra of nanocomposites were fitted with two Havriliak-Negami (HN) functions (corresponding to 2 KWW functions in the time domain), one function for the interfacial relaxation and another for the relaxation in the bulk-like region; [
6,
9,
10] or they were fitted with an interfacial layer model assuming the presence of an interfacial phase in the system [
10,
11,
14]. Using such procedures, the average relaxation time in the interfacial layer, the thickness of the interfacial layer, and the shift of
Tg at the interfacial layer have been estimated [
6,
9,
10,
11]. For example, for the interfacial layers of poly(styrene-
co-butadiene)/silica, poly(2-vinyl pyridine)/silica, poly(vinyl acetate)/silica nanocomposites, 65 K [
6], 8 K [
9], and 6–8 K [
10] increase of
Tg relative to the bulk value have been reported (
Tg has been measured as the temperature at which the relaxation time of the segmental motion equals 100 s [
6,
9]). Broader and lower dielectric loss spectra of nanocomposites, relative to the bulk melts, and inadequacy of a single HN function for fitting the spectra are consistent with our observations about the
of the confined melts (see
Figure 11). However, considering the simulation results about the mobility gradient close to the confining surfaces (see
Figure 11 for the contributions of the first and second layers in the
spectra and
Table 1 for the calculated
for different layers), the description of the segmental dynamics in terms of only two relaxation processes (bulk and interfacial processes) seems a rather simplified picture.
Usually, in dielectric experiments, the fraction of interfacial segments is calculated from the ratio of the dielectric amplitude of the segmental relaxation in the nanocomposite to the amplitude in the corresponding bulk melt [
6,
8,
9,
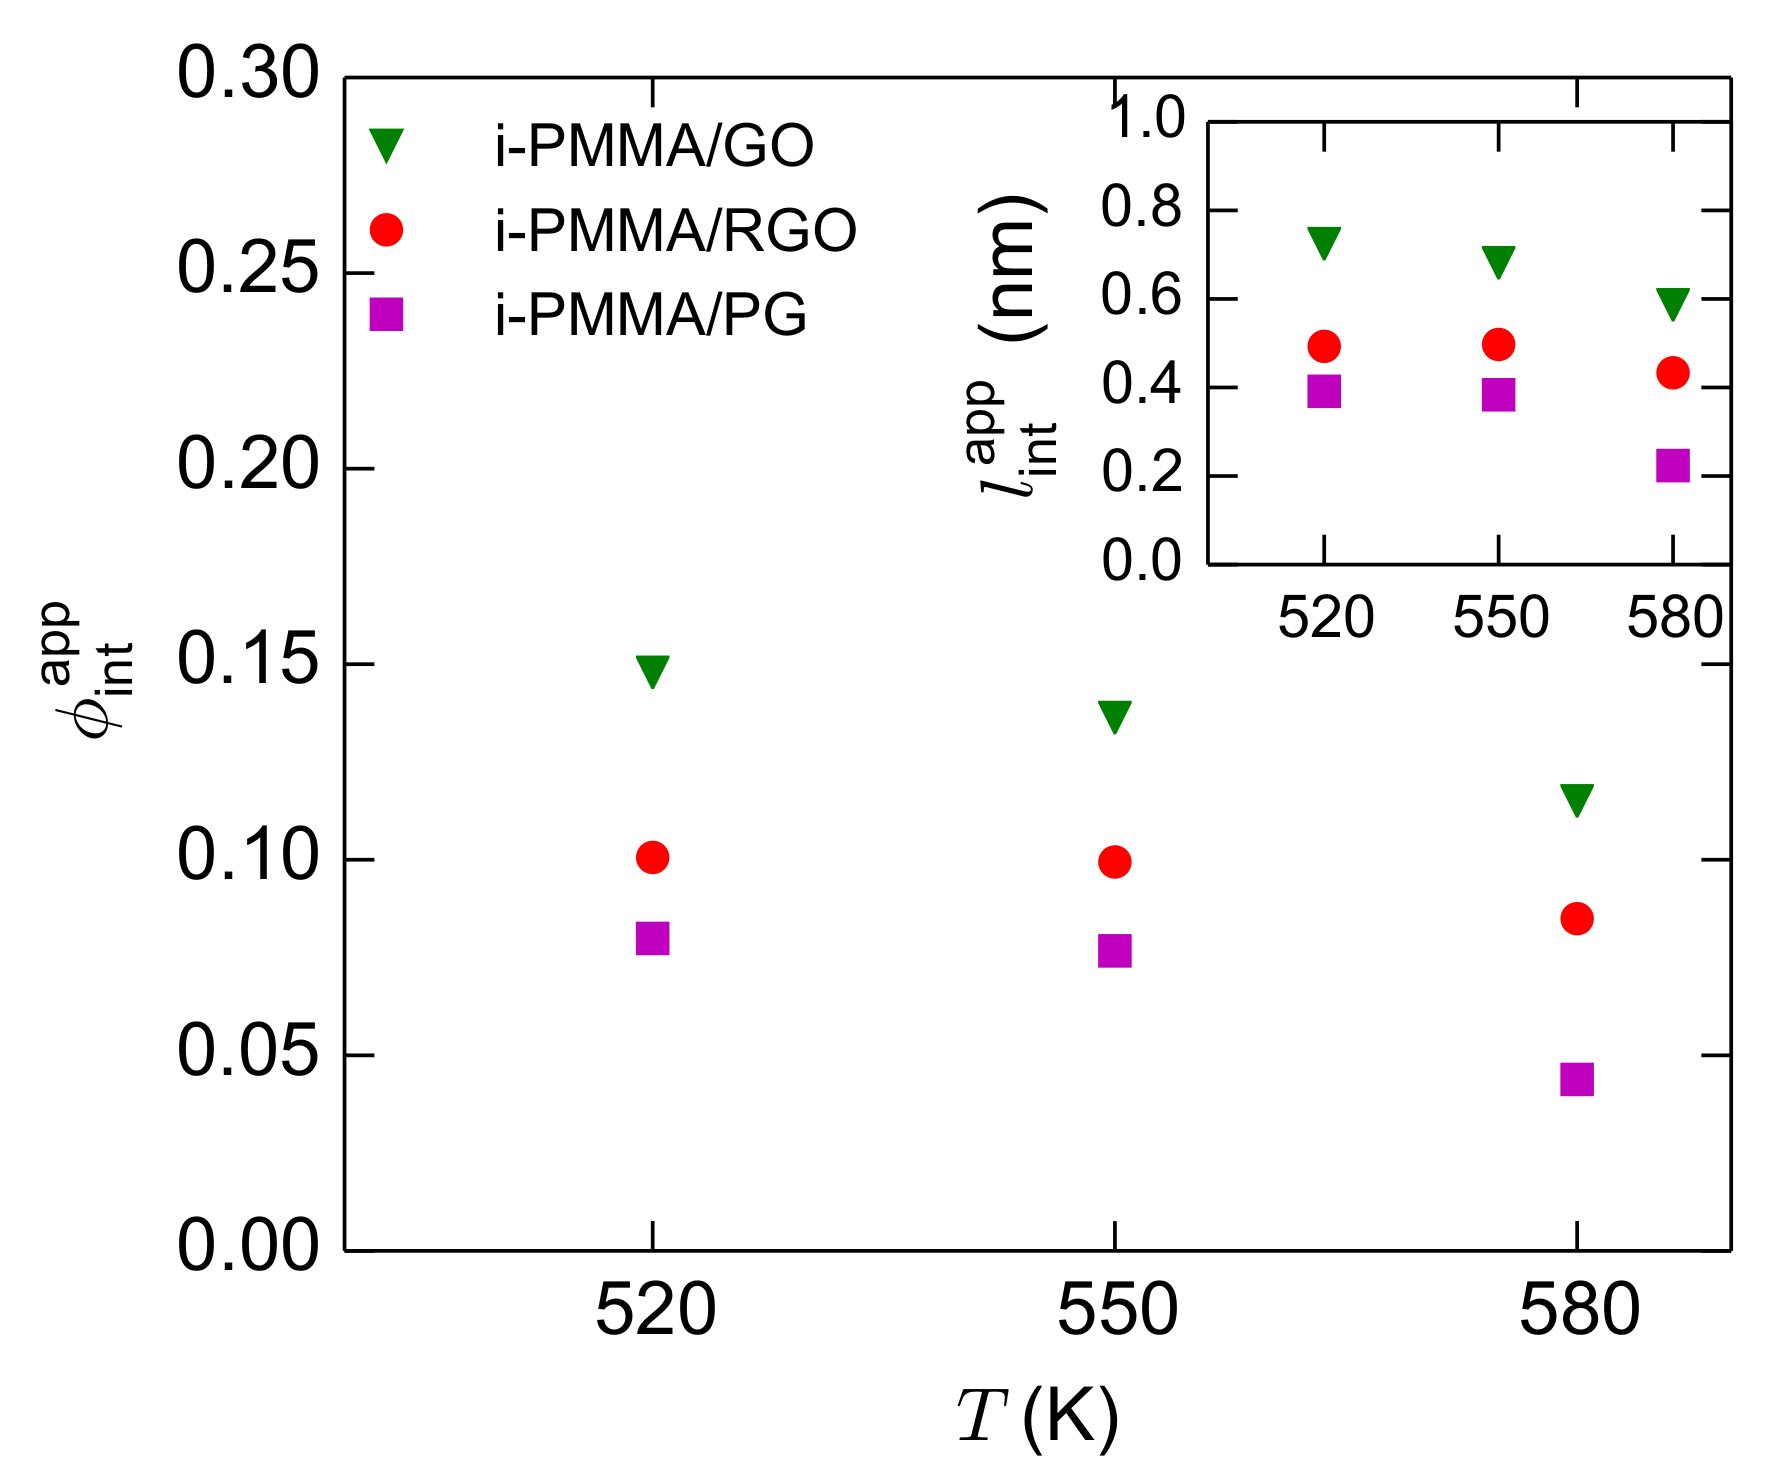
10]. Here, we perform an analogous analysis and calculate the
apparent fraction of interfacial segments,
, from the amplitudes of
curves:
In addition, from
, the apparent interface thickness can be estimated through
, where
D is the thickness of the confined film. The calculated values of
and
for the confined i-PMMA melts at different temperatures are shown in
Figure 13. With decreasing temperature and increasing the concentration of the surface functional groups (increasing polymer/surface attraction),
(and
) increases. The increase of
with decreasing temperature has also been observed through dielectric spectroscopy experiments for polymer nanocomposites and thin films [
10,
14]. It is informative to look at the
and
data in the light of the microscopic layer resolved picture of the interfacial segmental dynamics that was provided before. Based on the layer resolved picture (
Figure 3 and
Figure 5), the spatial ranges of the gradients of the segmental dynamics close to the model surfaces stay almost constant upon decreasing temperature (at the temperature range studied here); furthermore, the spatial range of the gradient of the segmental dynamics is similar close to RGO and GO (the range is slightly shorter close to PG). Despite these underlying aspects,
and
increases with decreasing temperature and increasing the concentration of surface functional groups. Note that the actual fraction of interfacial segments (dihedral angles that to belong the interfacial layers) is also surface–chemistry dependent (see
Section 4.3 for the values of the fraction of dihedral angles at the first layer,
); however, its surface–chemistry dependence is much weaker than that of
. The way that
is calculated explains these apparent discrepancies:
shows the fraction of segments that exhibit a
spectrum that is effectively separated from the bulk one (
) on the frequency axis.
Figure 11 clearly shows the meaning of
; for example, consider
Figure 11a: near PG, the segmental dynamics at the first and second layers is slower than the bulk melt; the fractions of segments at theses layers are
and
. However, because at
K, the
spectra of theses layers are not well separated from the bulk spectrum on the frequency axis,
, which is significantly lower than
(even
alone). Similarly, consider
Figure 11c,d: close to GO, at both
K and
K, the first and second layers are significantly slower than the bulk melt (the third layer is also slightly slower than bulk). The fractions of segments located at these layers do not significantly changes with temperature (
and
). However, because reducing temperature leads to the separation of the interfacial and bulk
spectra on the frequency axis, the increase of
with decreasing temperature is observed; at 580 K and 520 K,
and
, respectively (at 520 K,
, however still
). In short, at the studied temperature range,
increases with decreasing temperature, not because the actual fraction of the interfacial segments increases, but because the loss spectrum of the interfacial segments becomes more separated from the bulk spectrum. These discussions about
are useful for the interpretation of experimental dielectric spectroscopy results for thin films and nanocomposites.


