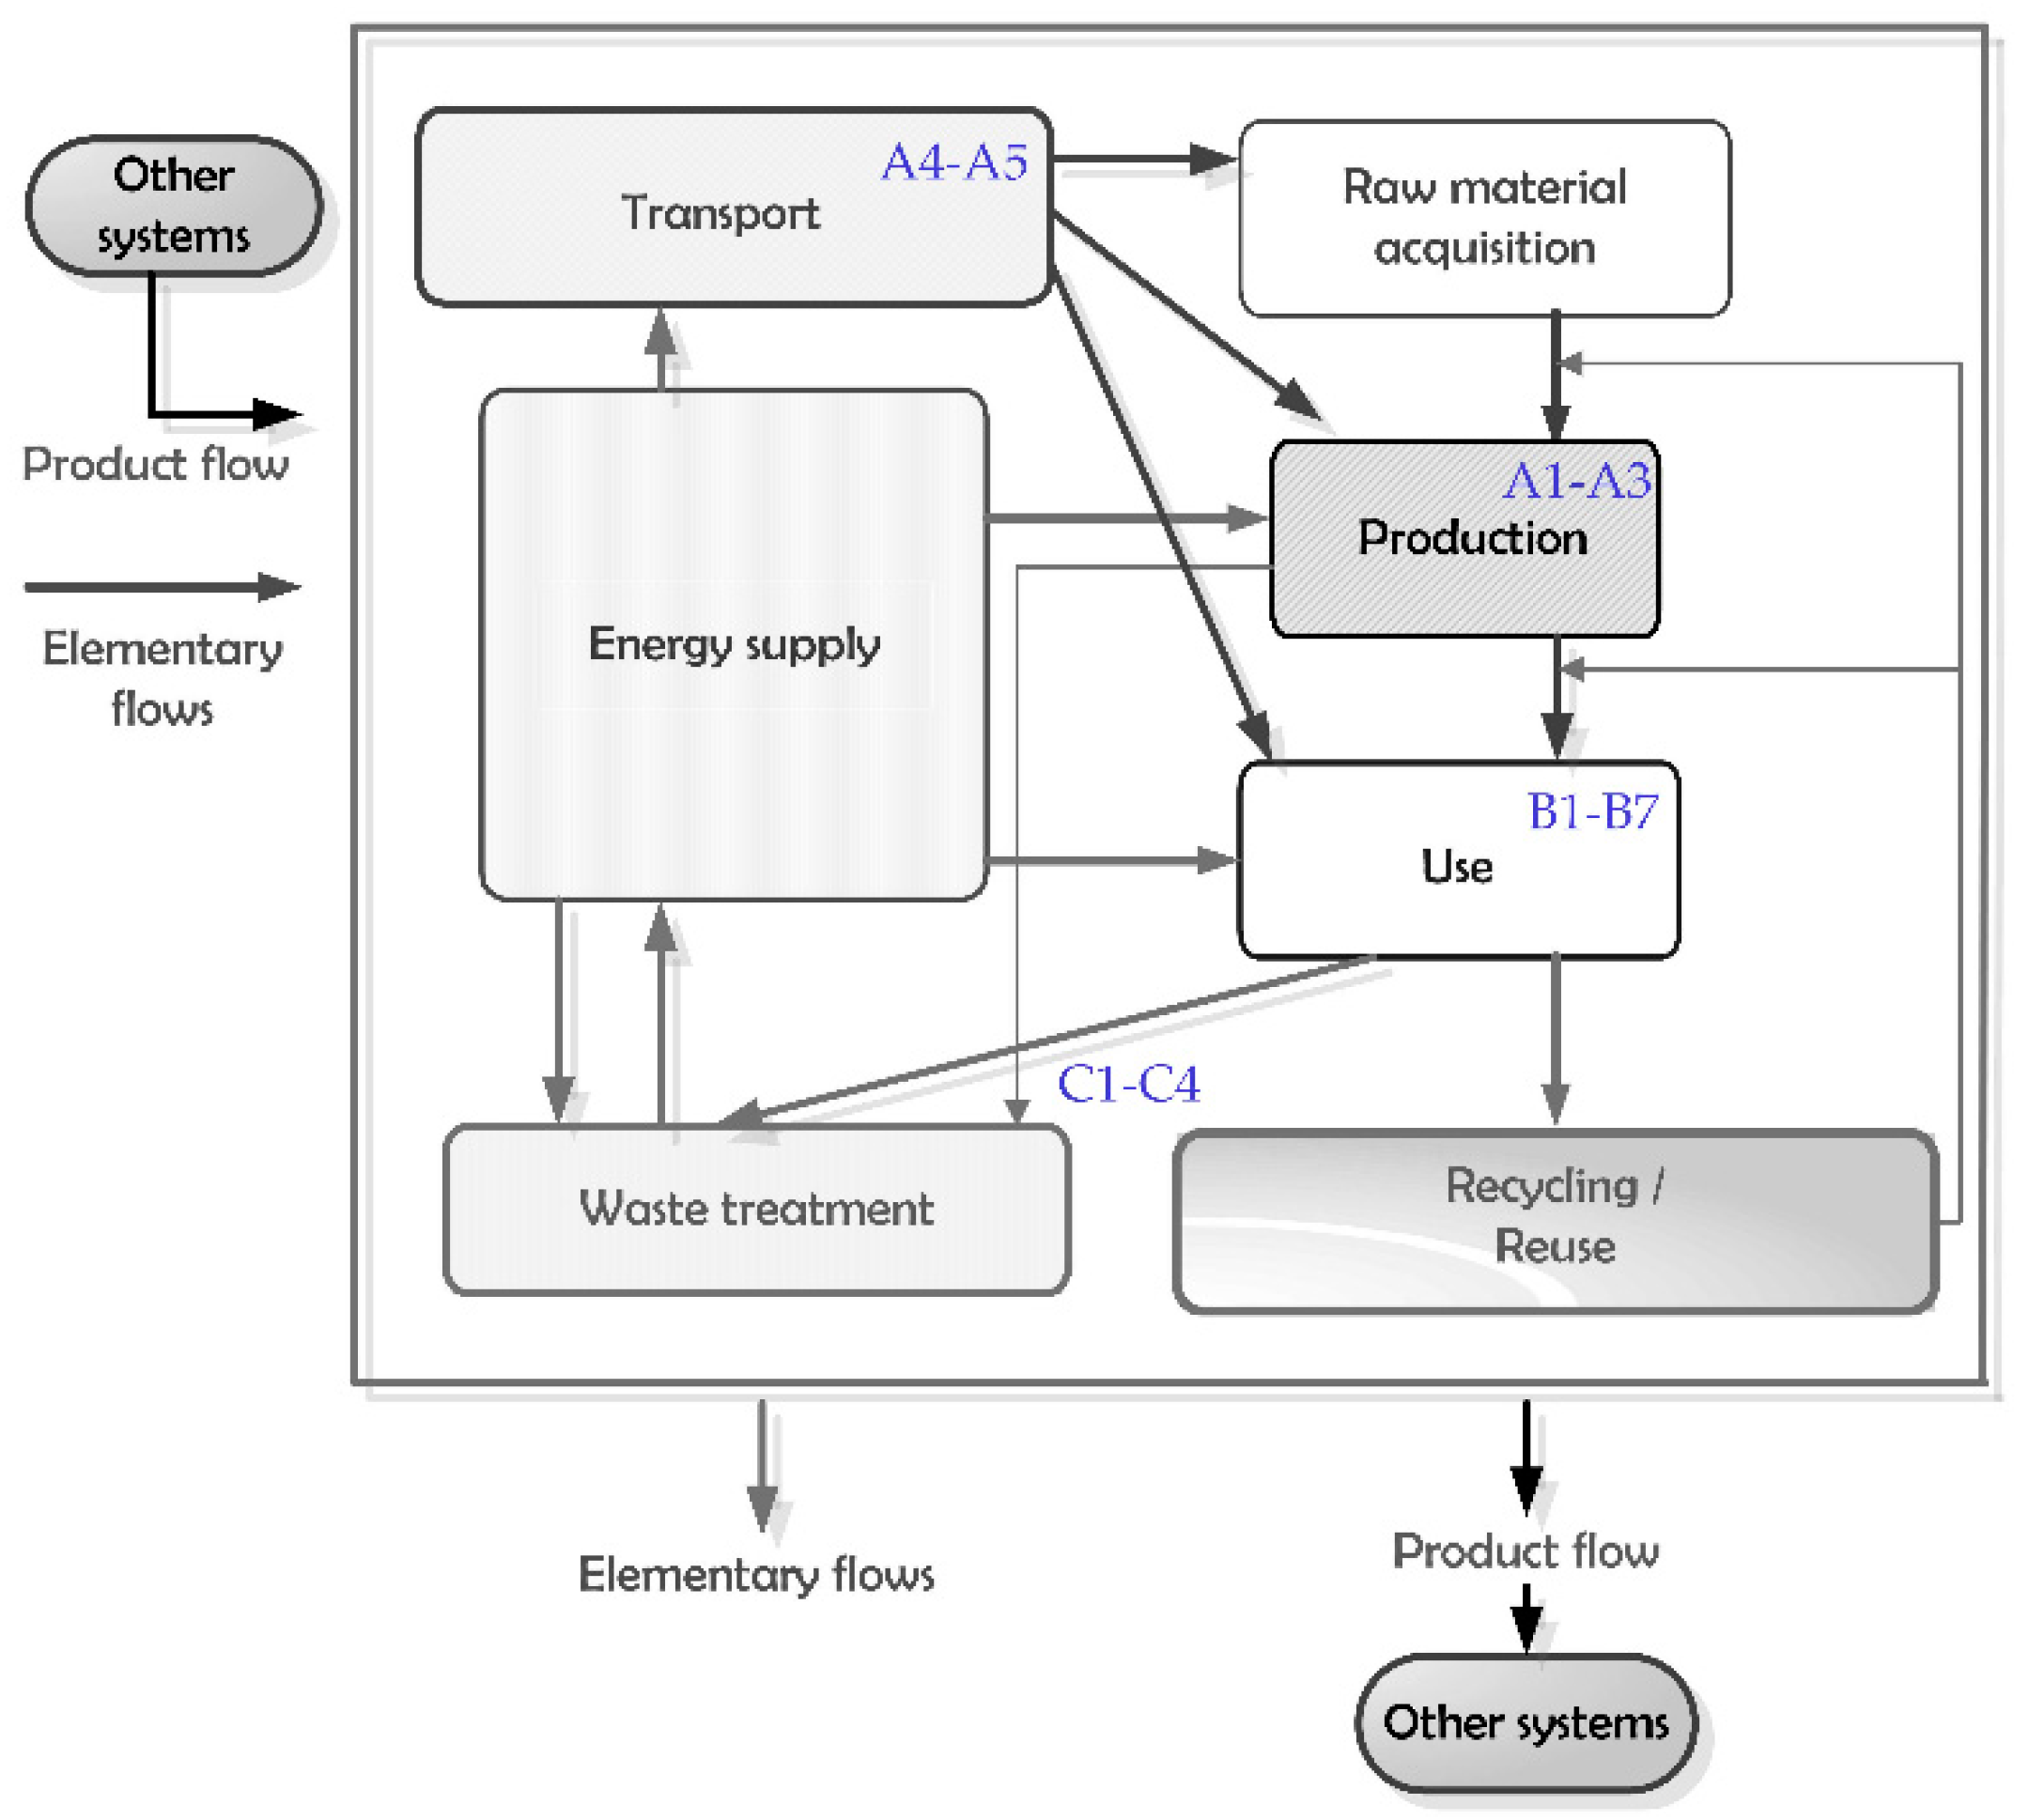
Figure 1.
Product life cycle by environmental product declaration modules.
Figure 1.
Product life cycle by environmental product declaration modules.
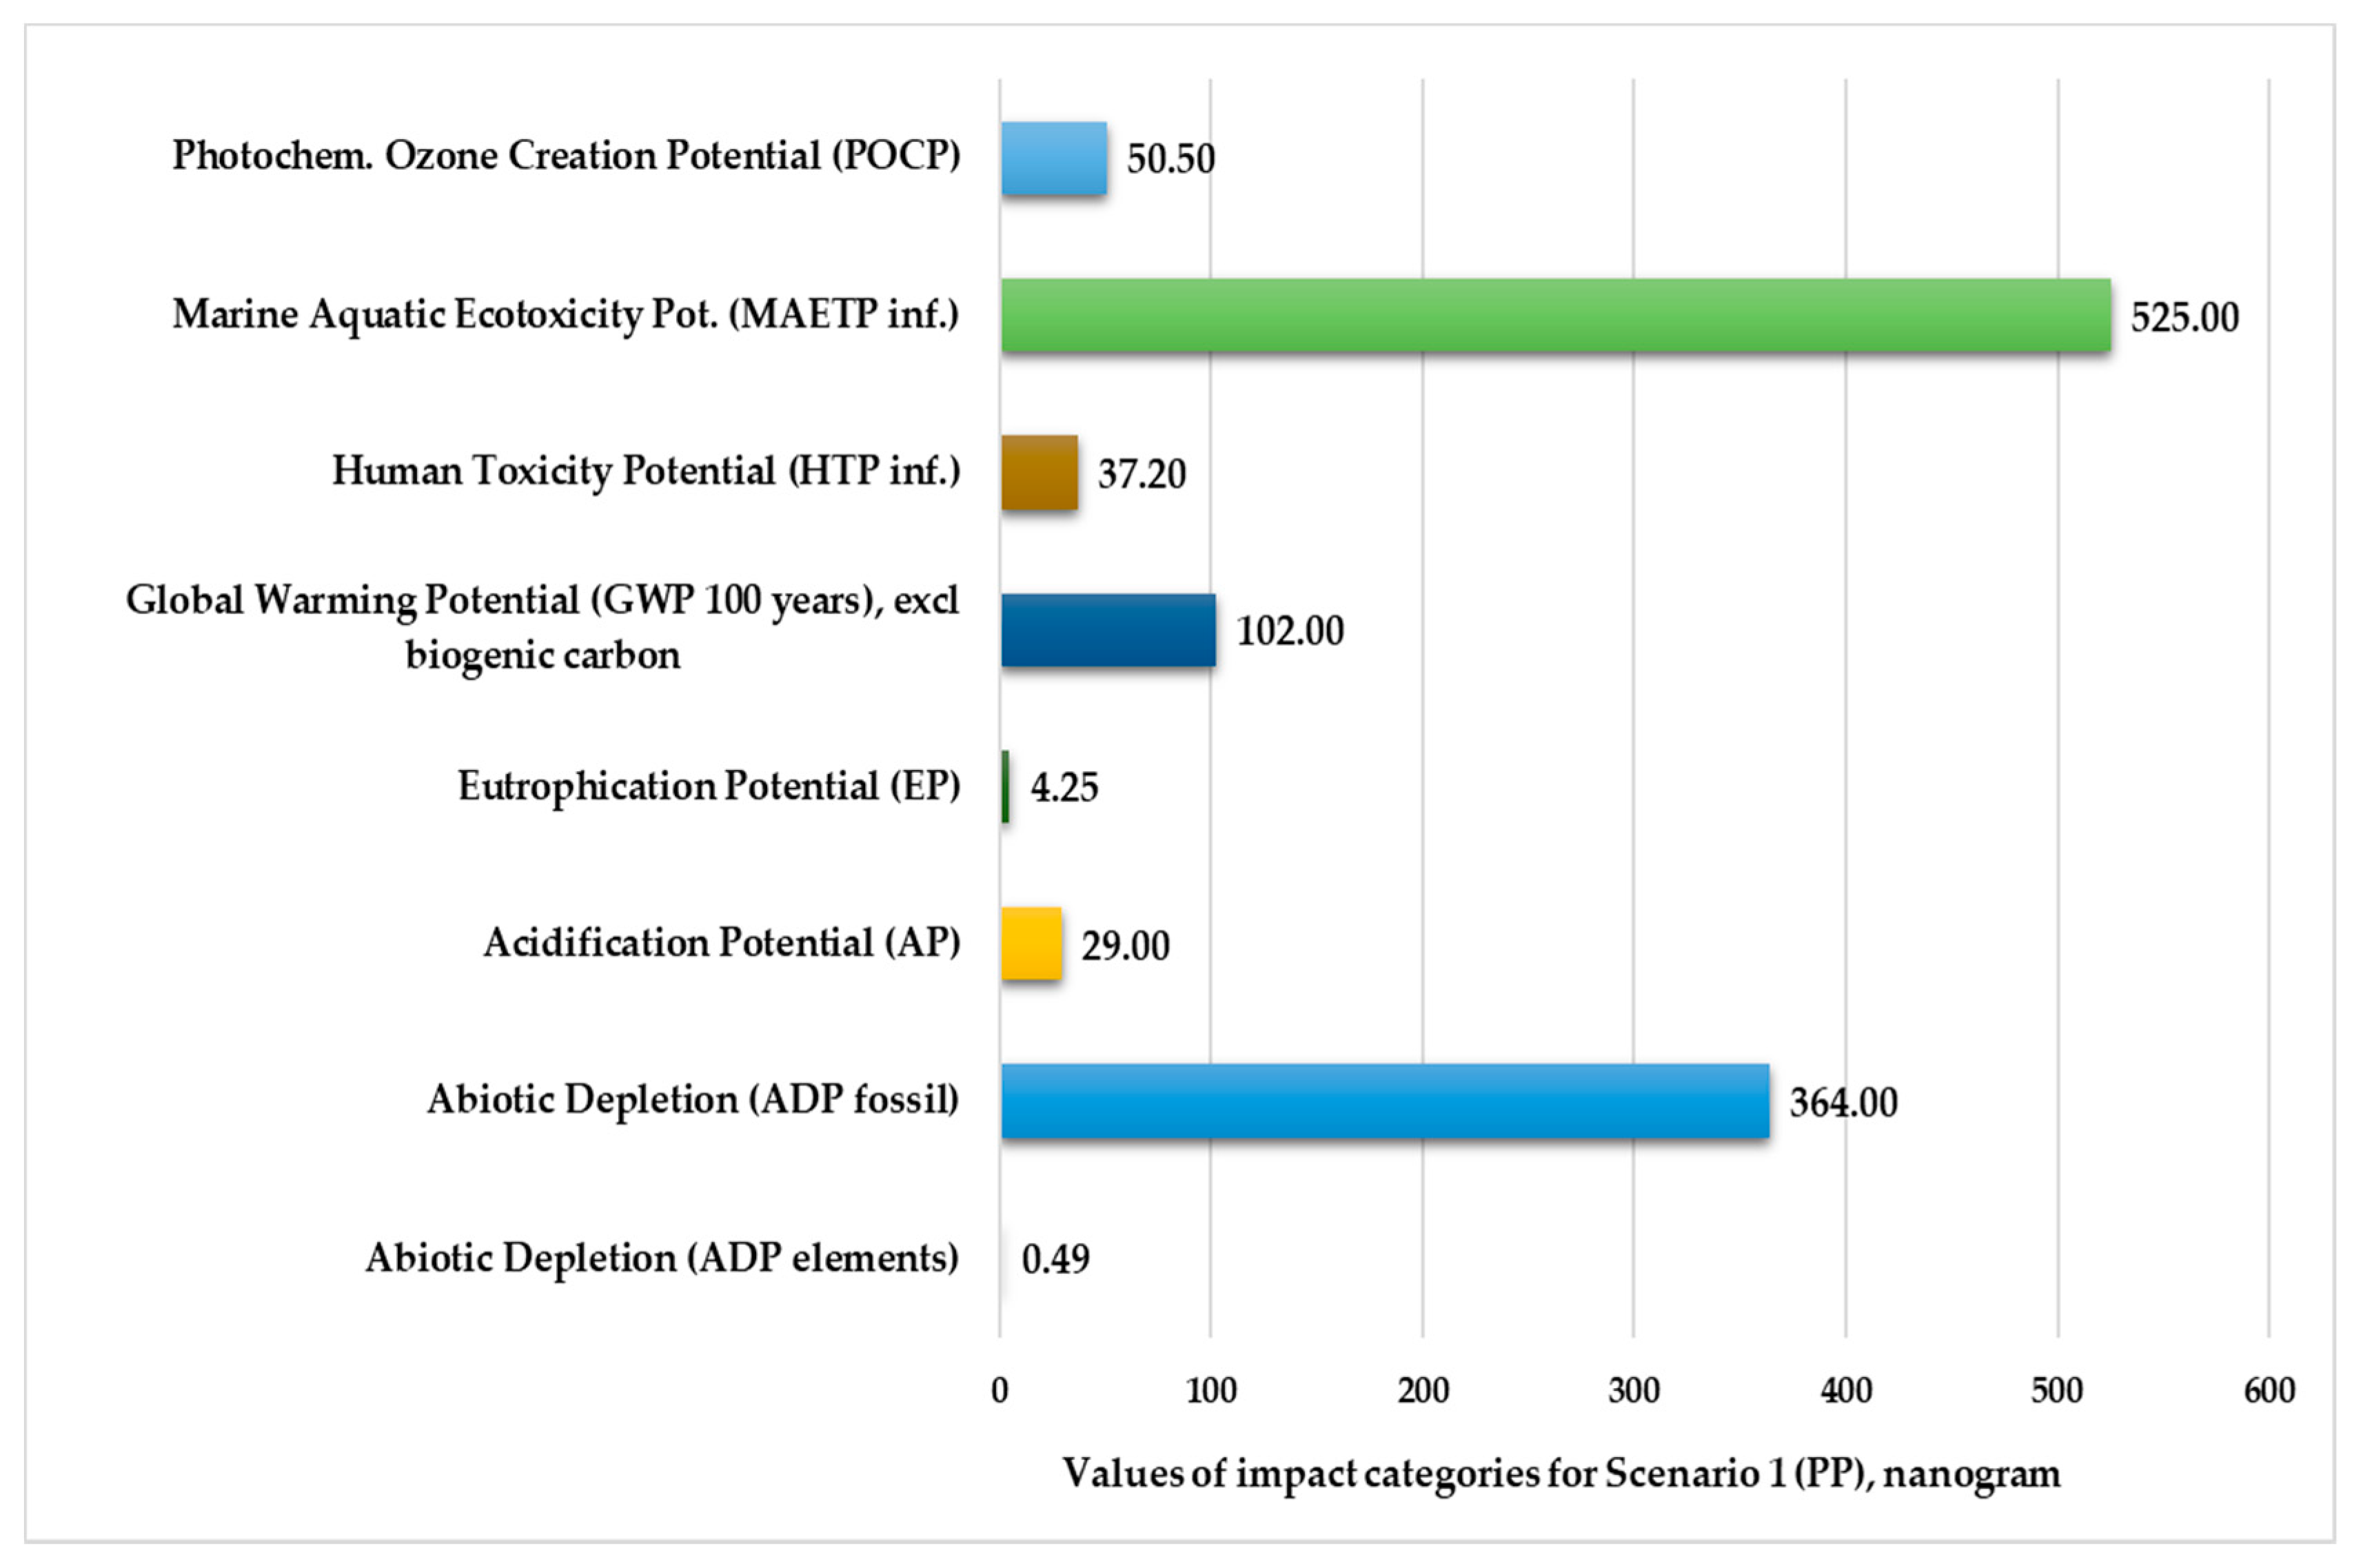
Figure 2.
Environmental impact categories for Scenario 1 in the production stage with transport (functional unit: 28 kg polypropylene product. Normalization reference: CML 2016, EU 25+3, year 2000, excl. biogenic carbon. Weighting method: thinkstep LCIA Survey 2012, Europe, CML 2016, excl. biogenic carbon).
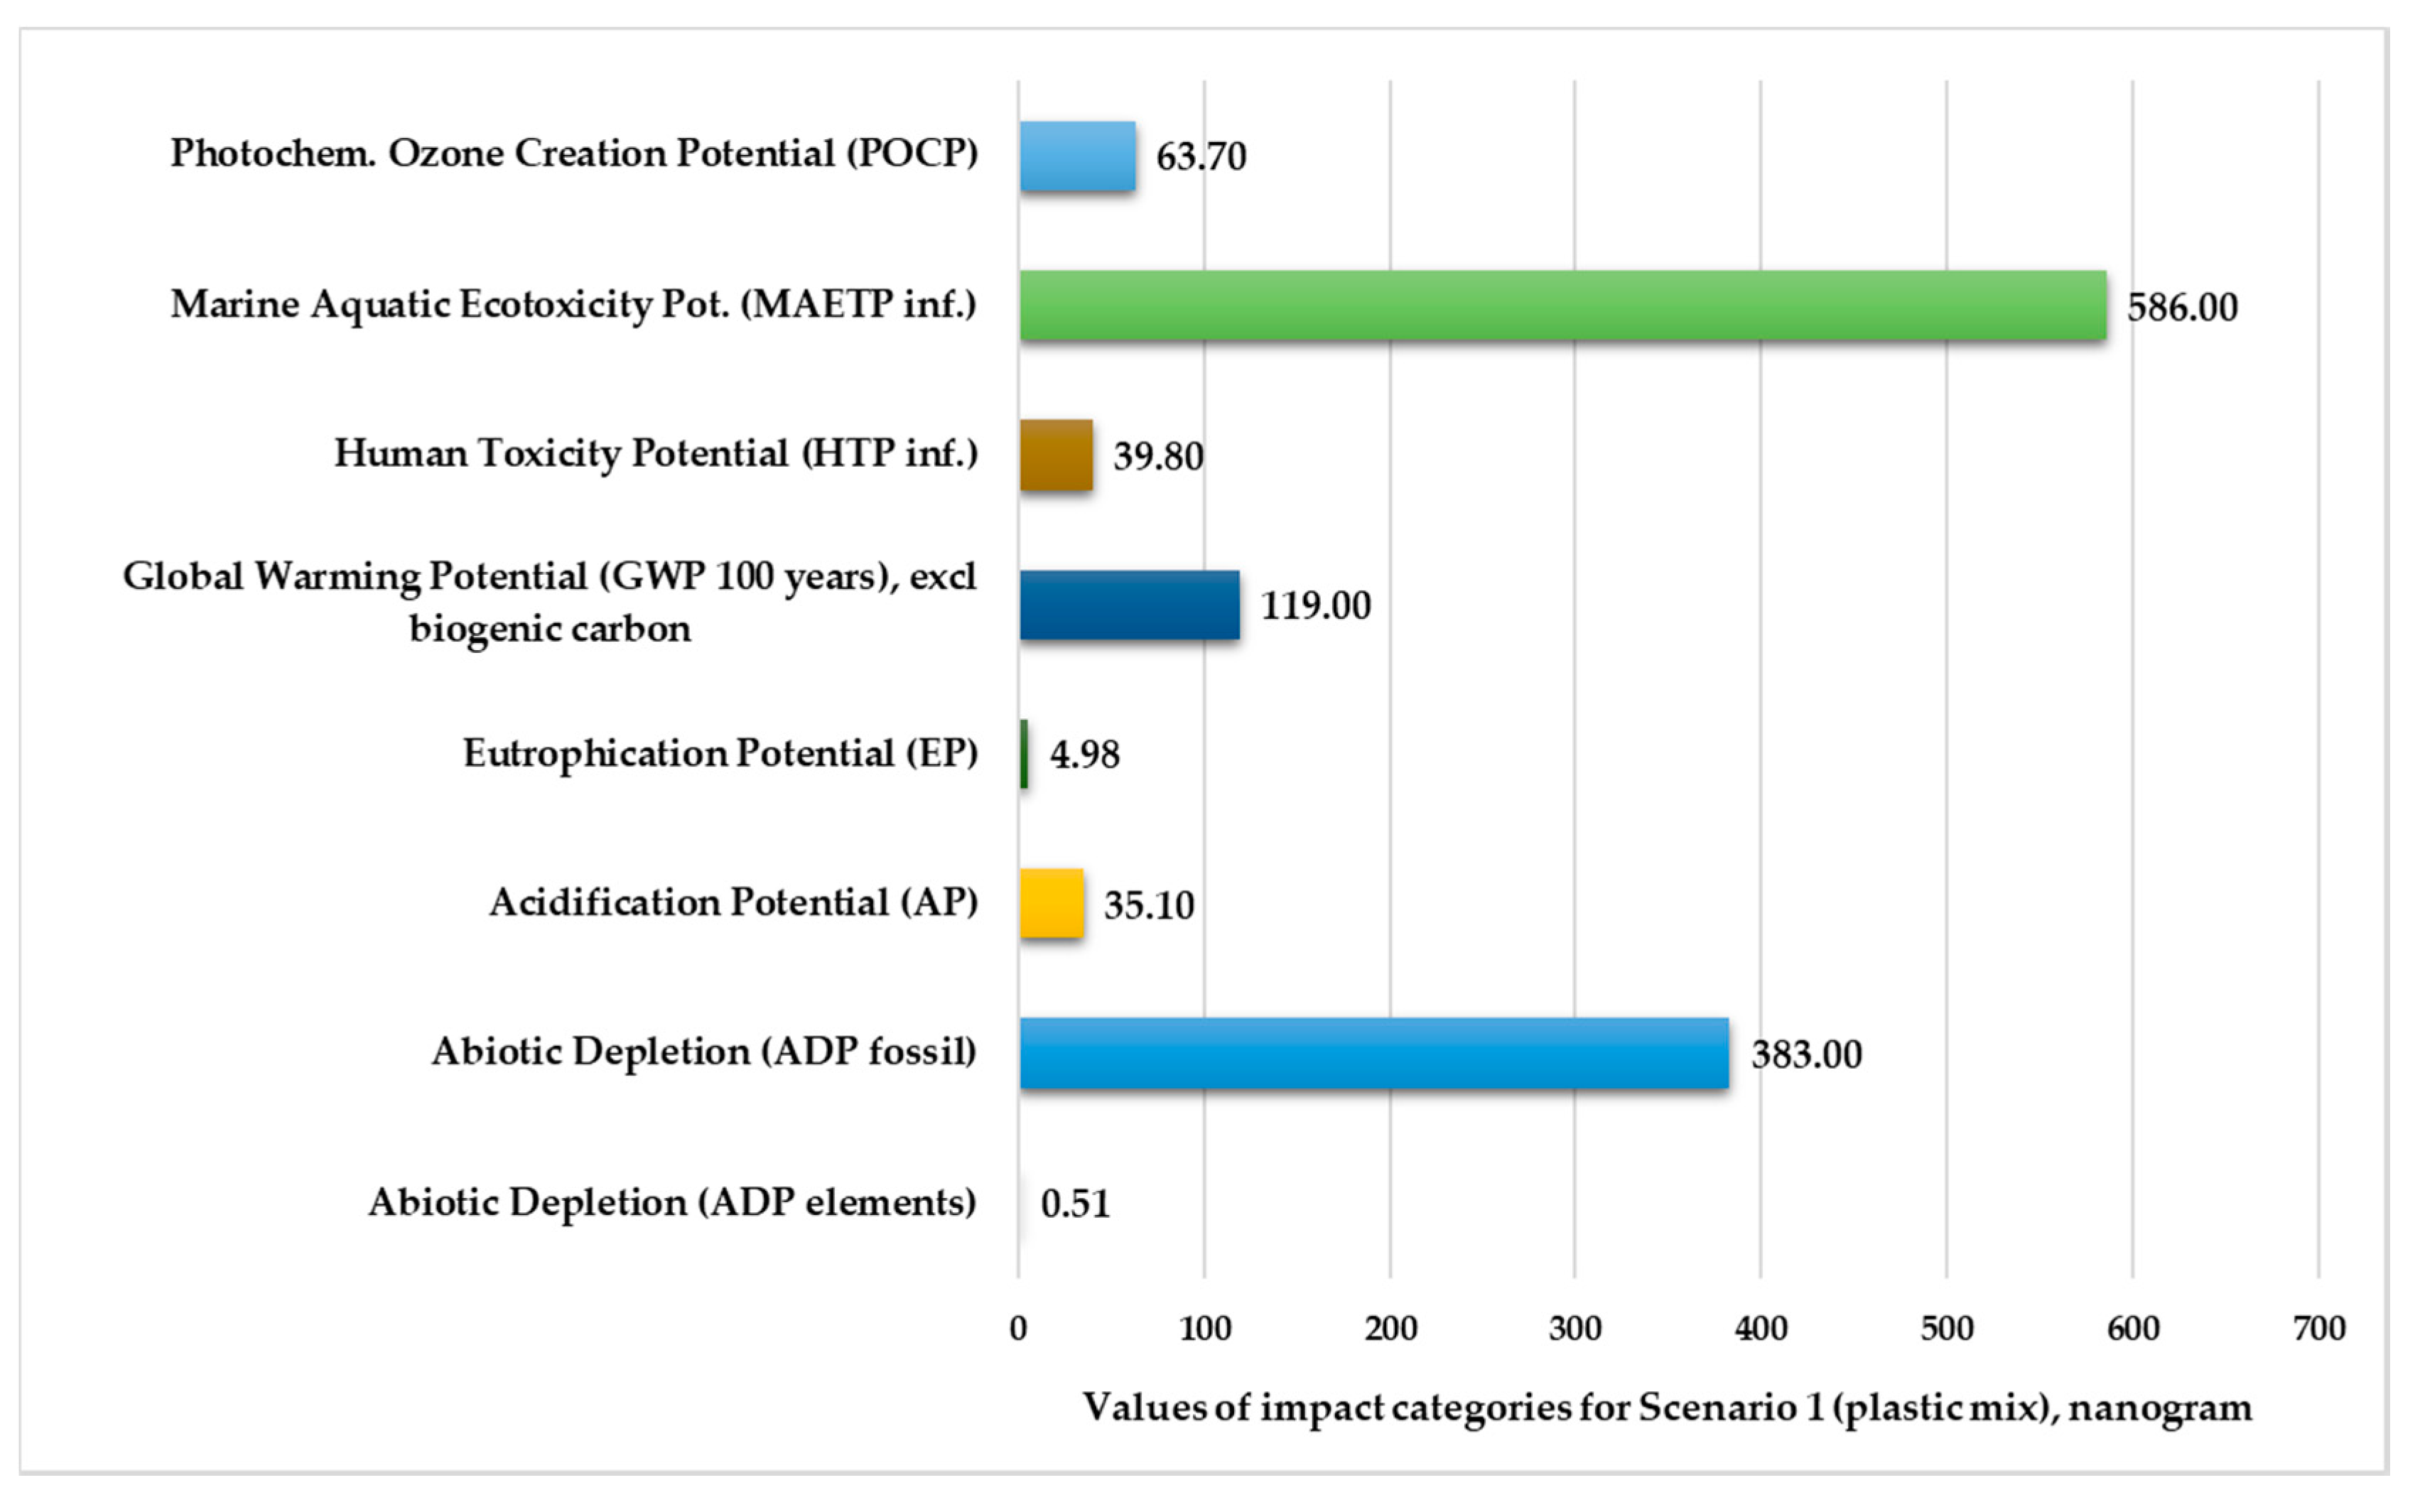
Figure 3.
Environmental impact categories for Scenario 1 in the production stage with transport (functional unit: 28 kg plastic mix product).
Figure 3.
Environmental impact categories for Scenario 1 in the production stage with transport (functional unit: 28 kg plastic mix product).
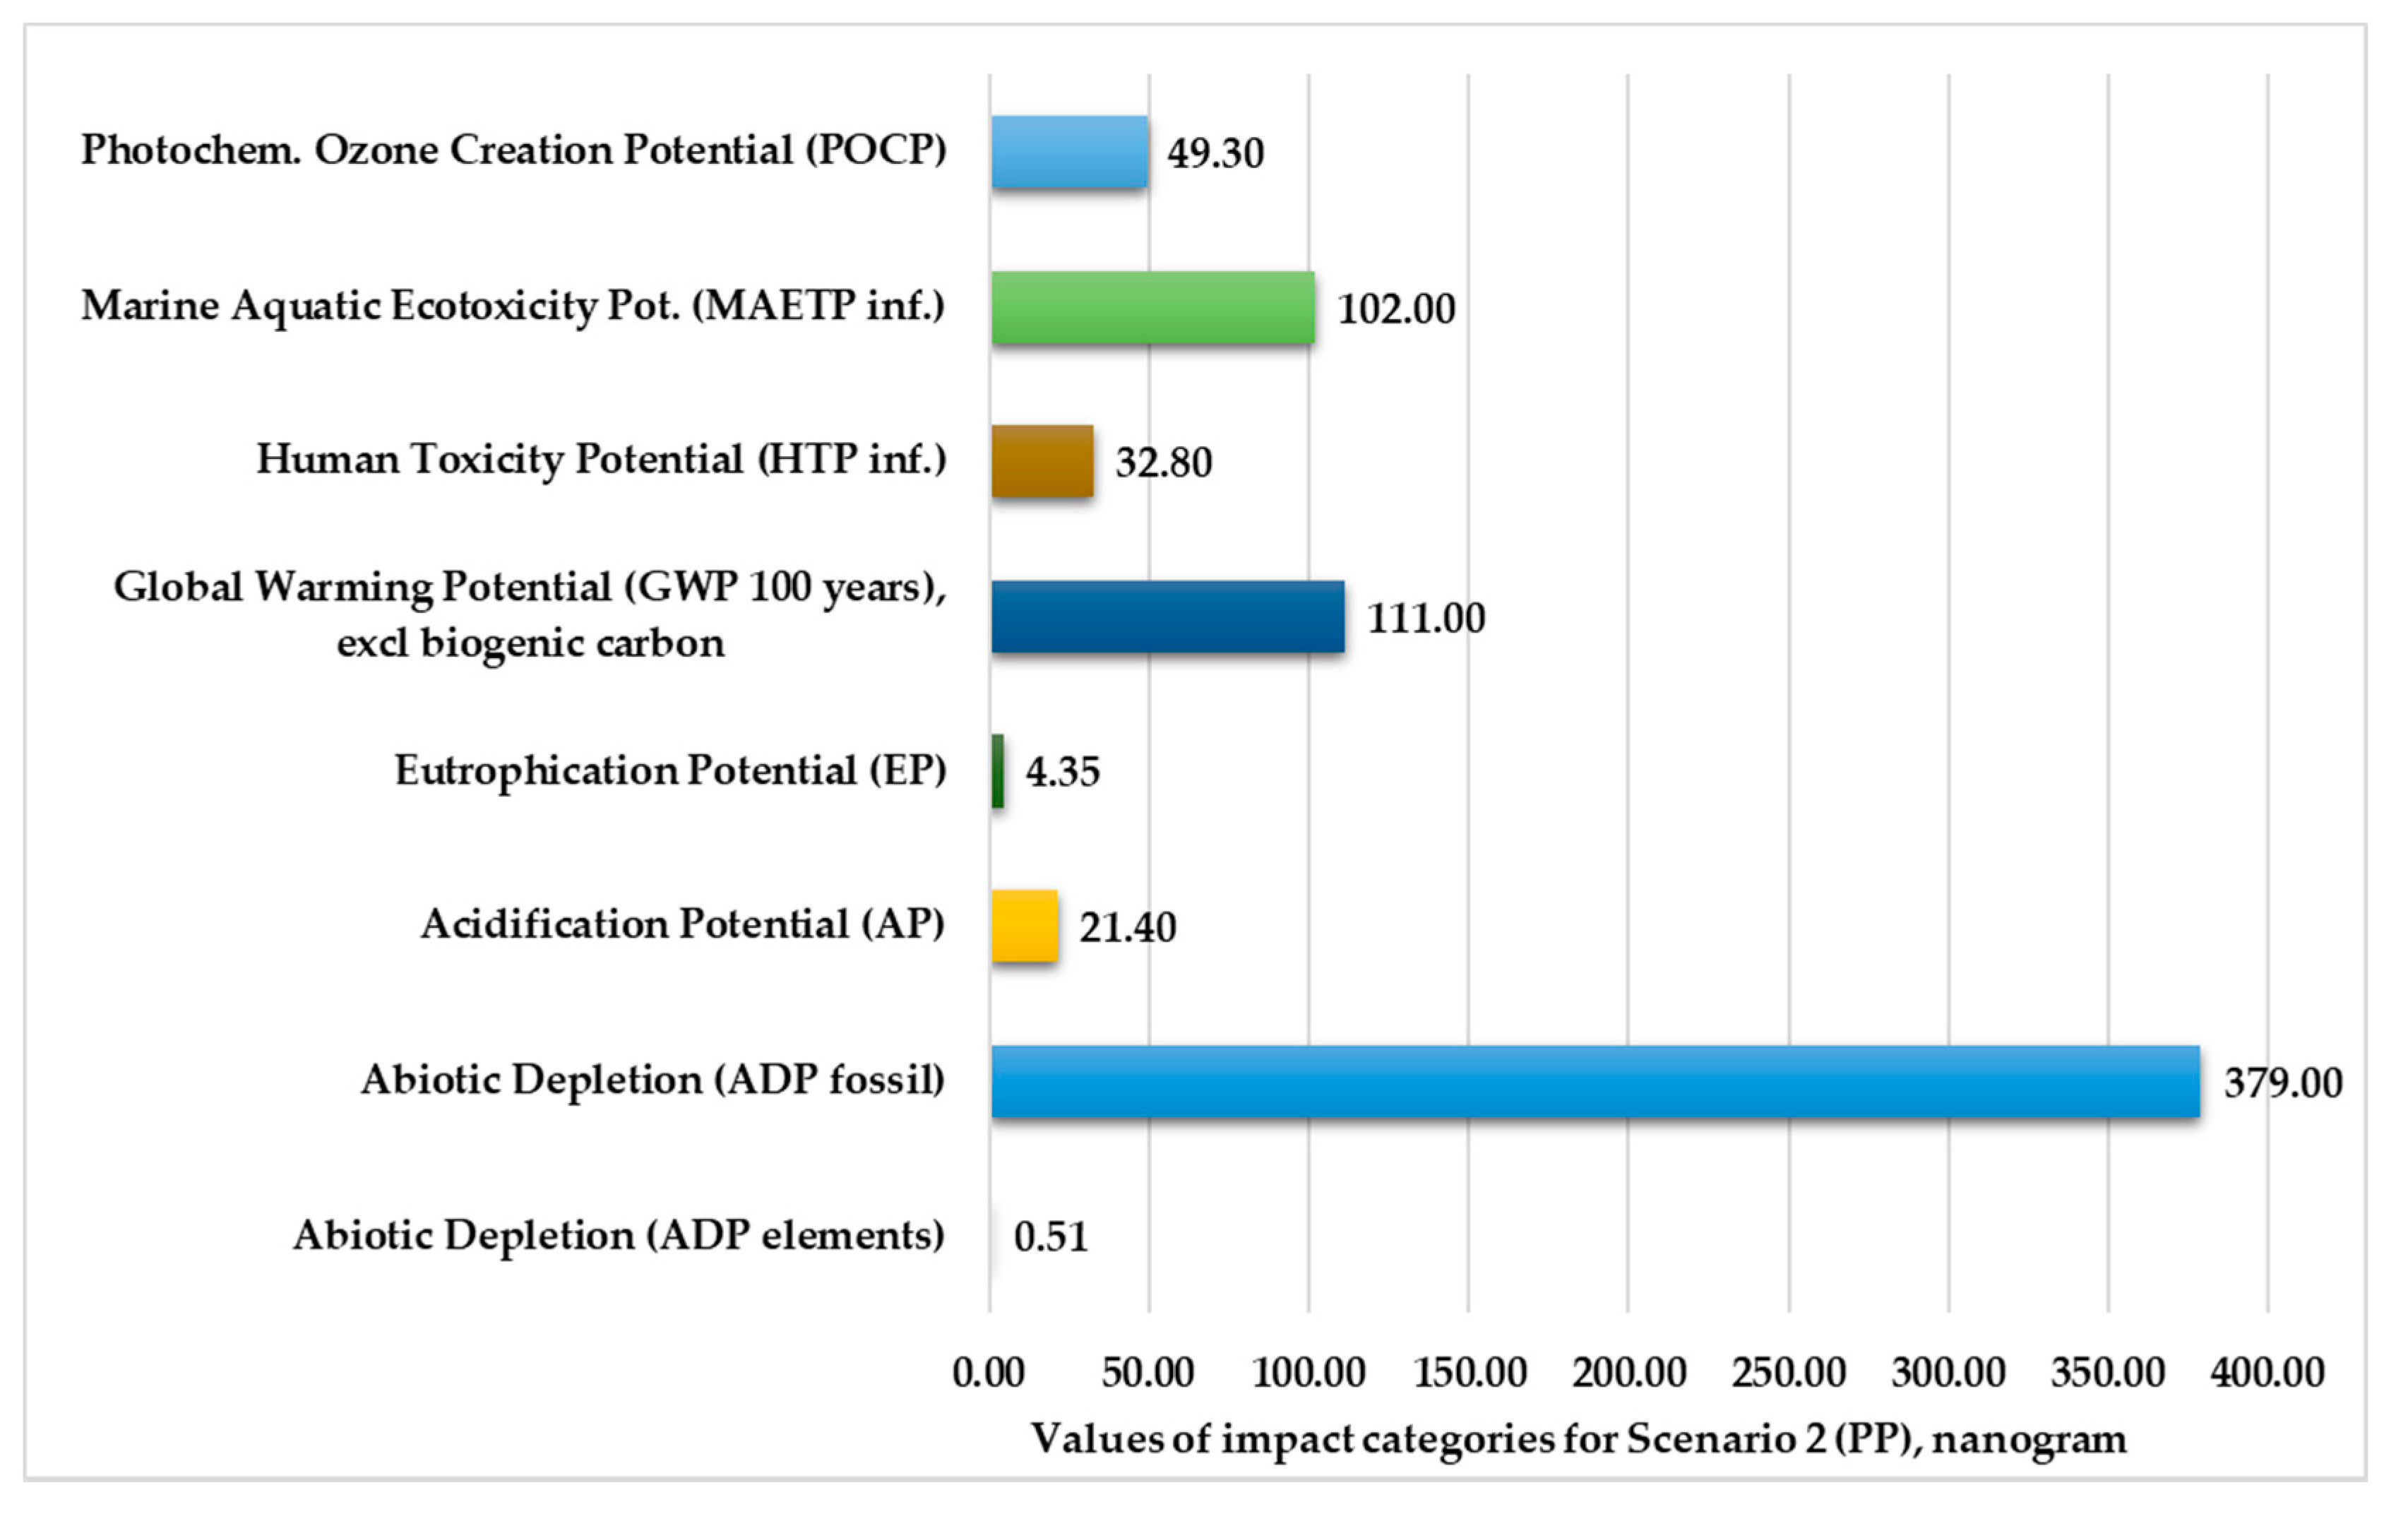
Figure 4.
Environmental impact categories for Scenario 2 in the production stage with transport.
Figure 4.
Environmental impact categories for Scenario 2 in the production stage with transport.
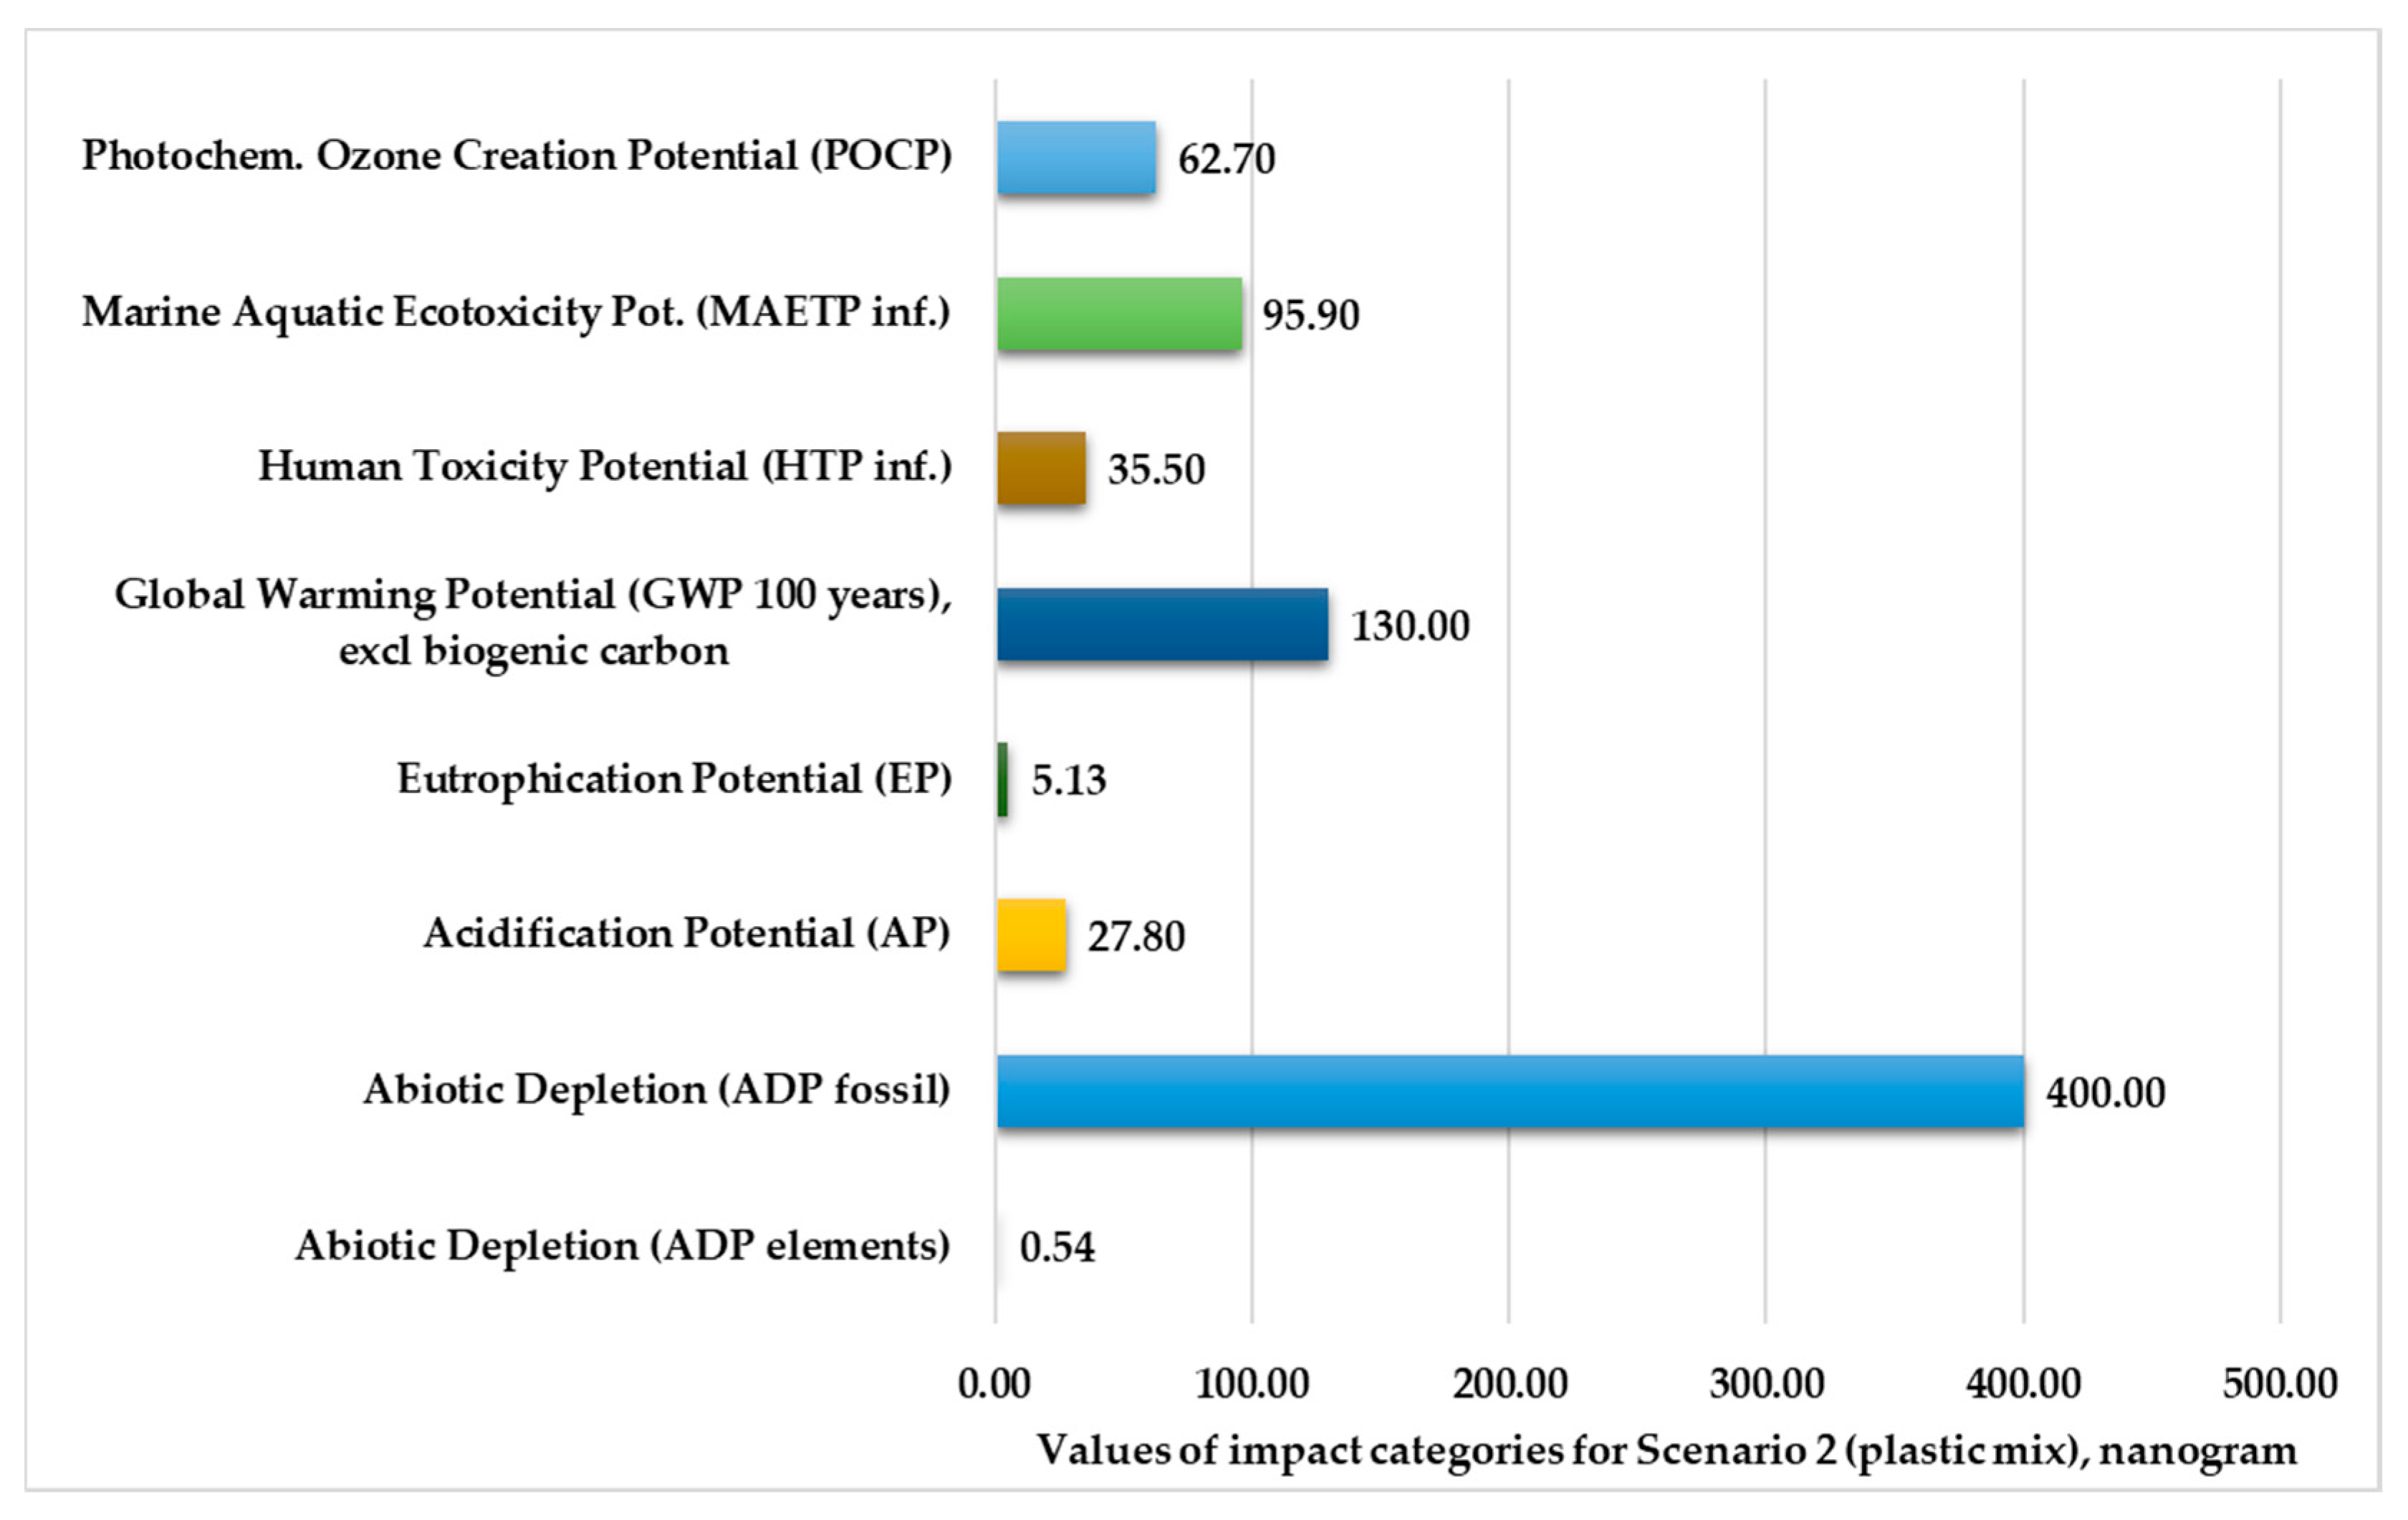
Figure 5.
Environmental impact categories for Scenario 2 in the production stage with transport (functional unit: 28 kg mixed-plastic product).
Figure 5.
Environmental impact categories for Scenario 2 in the production stage with transport (functional unit: 28 kg mixed-plastic product).
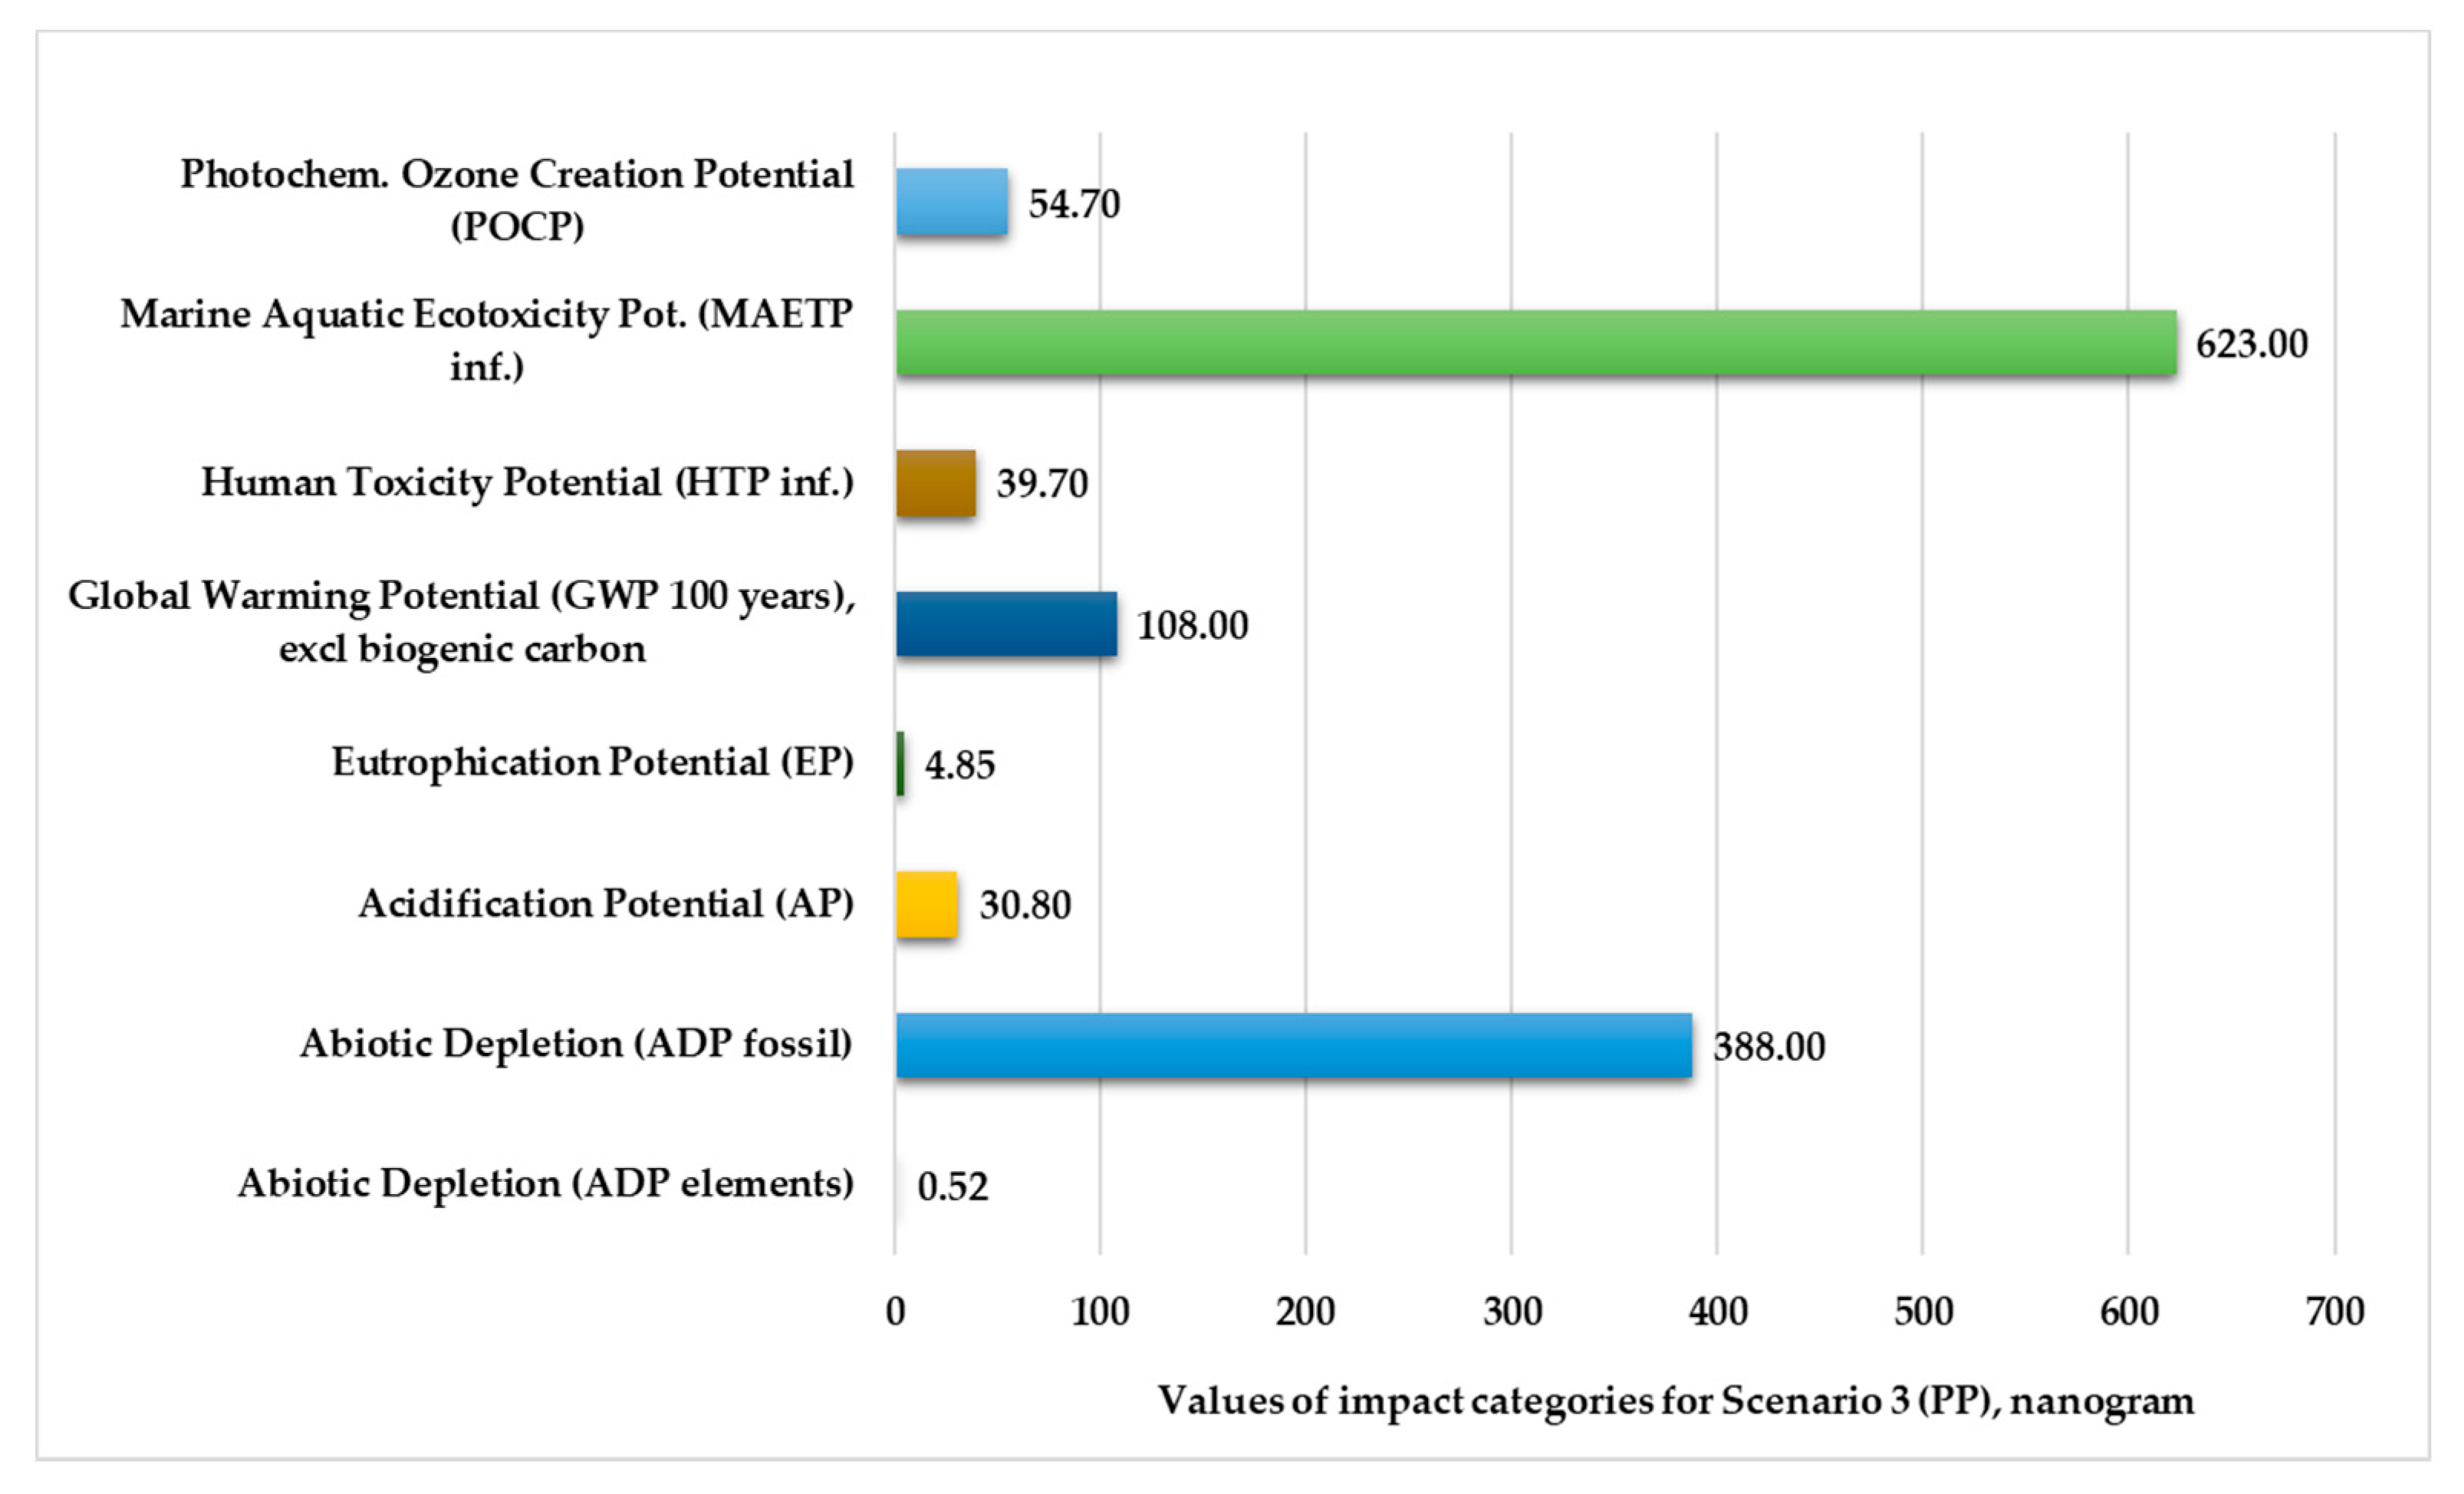
Figure 6.
Environmental impact categories for Scenario 3 in the production stage with transport (functional unit: 28 kg polypropylene product. Normalization reference: CML 2016, EU 25+3, year 2000, excl. biogenic carbon. Weighting method: thinkstep LCIA Survey 2012, Europe, CML 2016, excl. biogenic carbon).
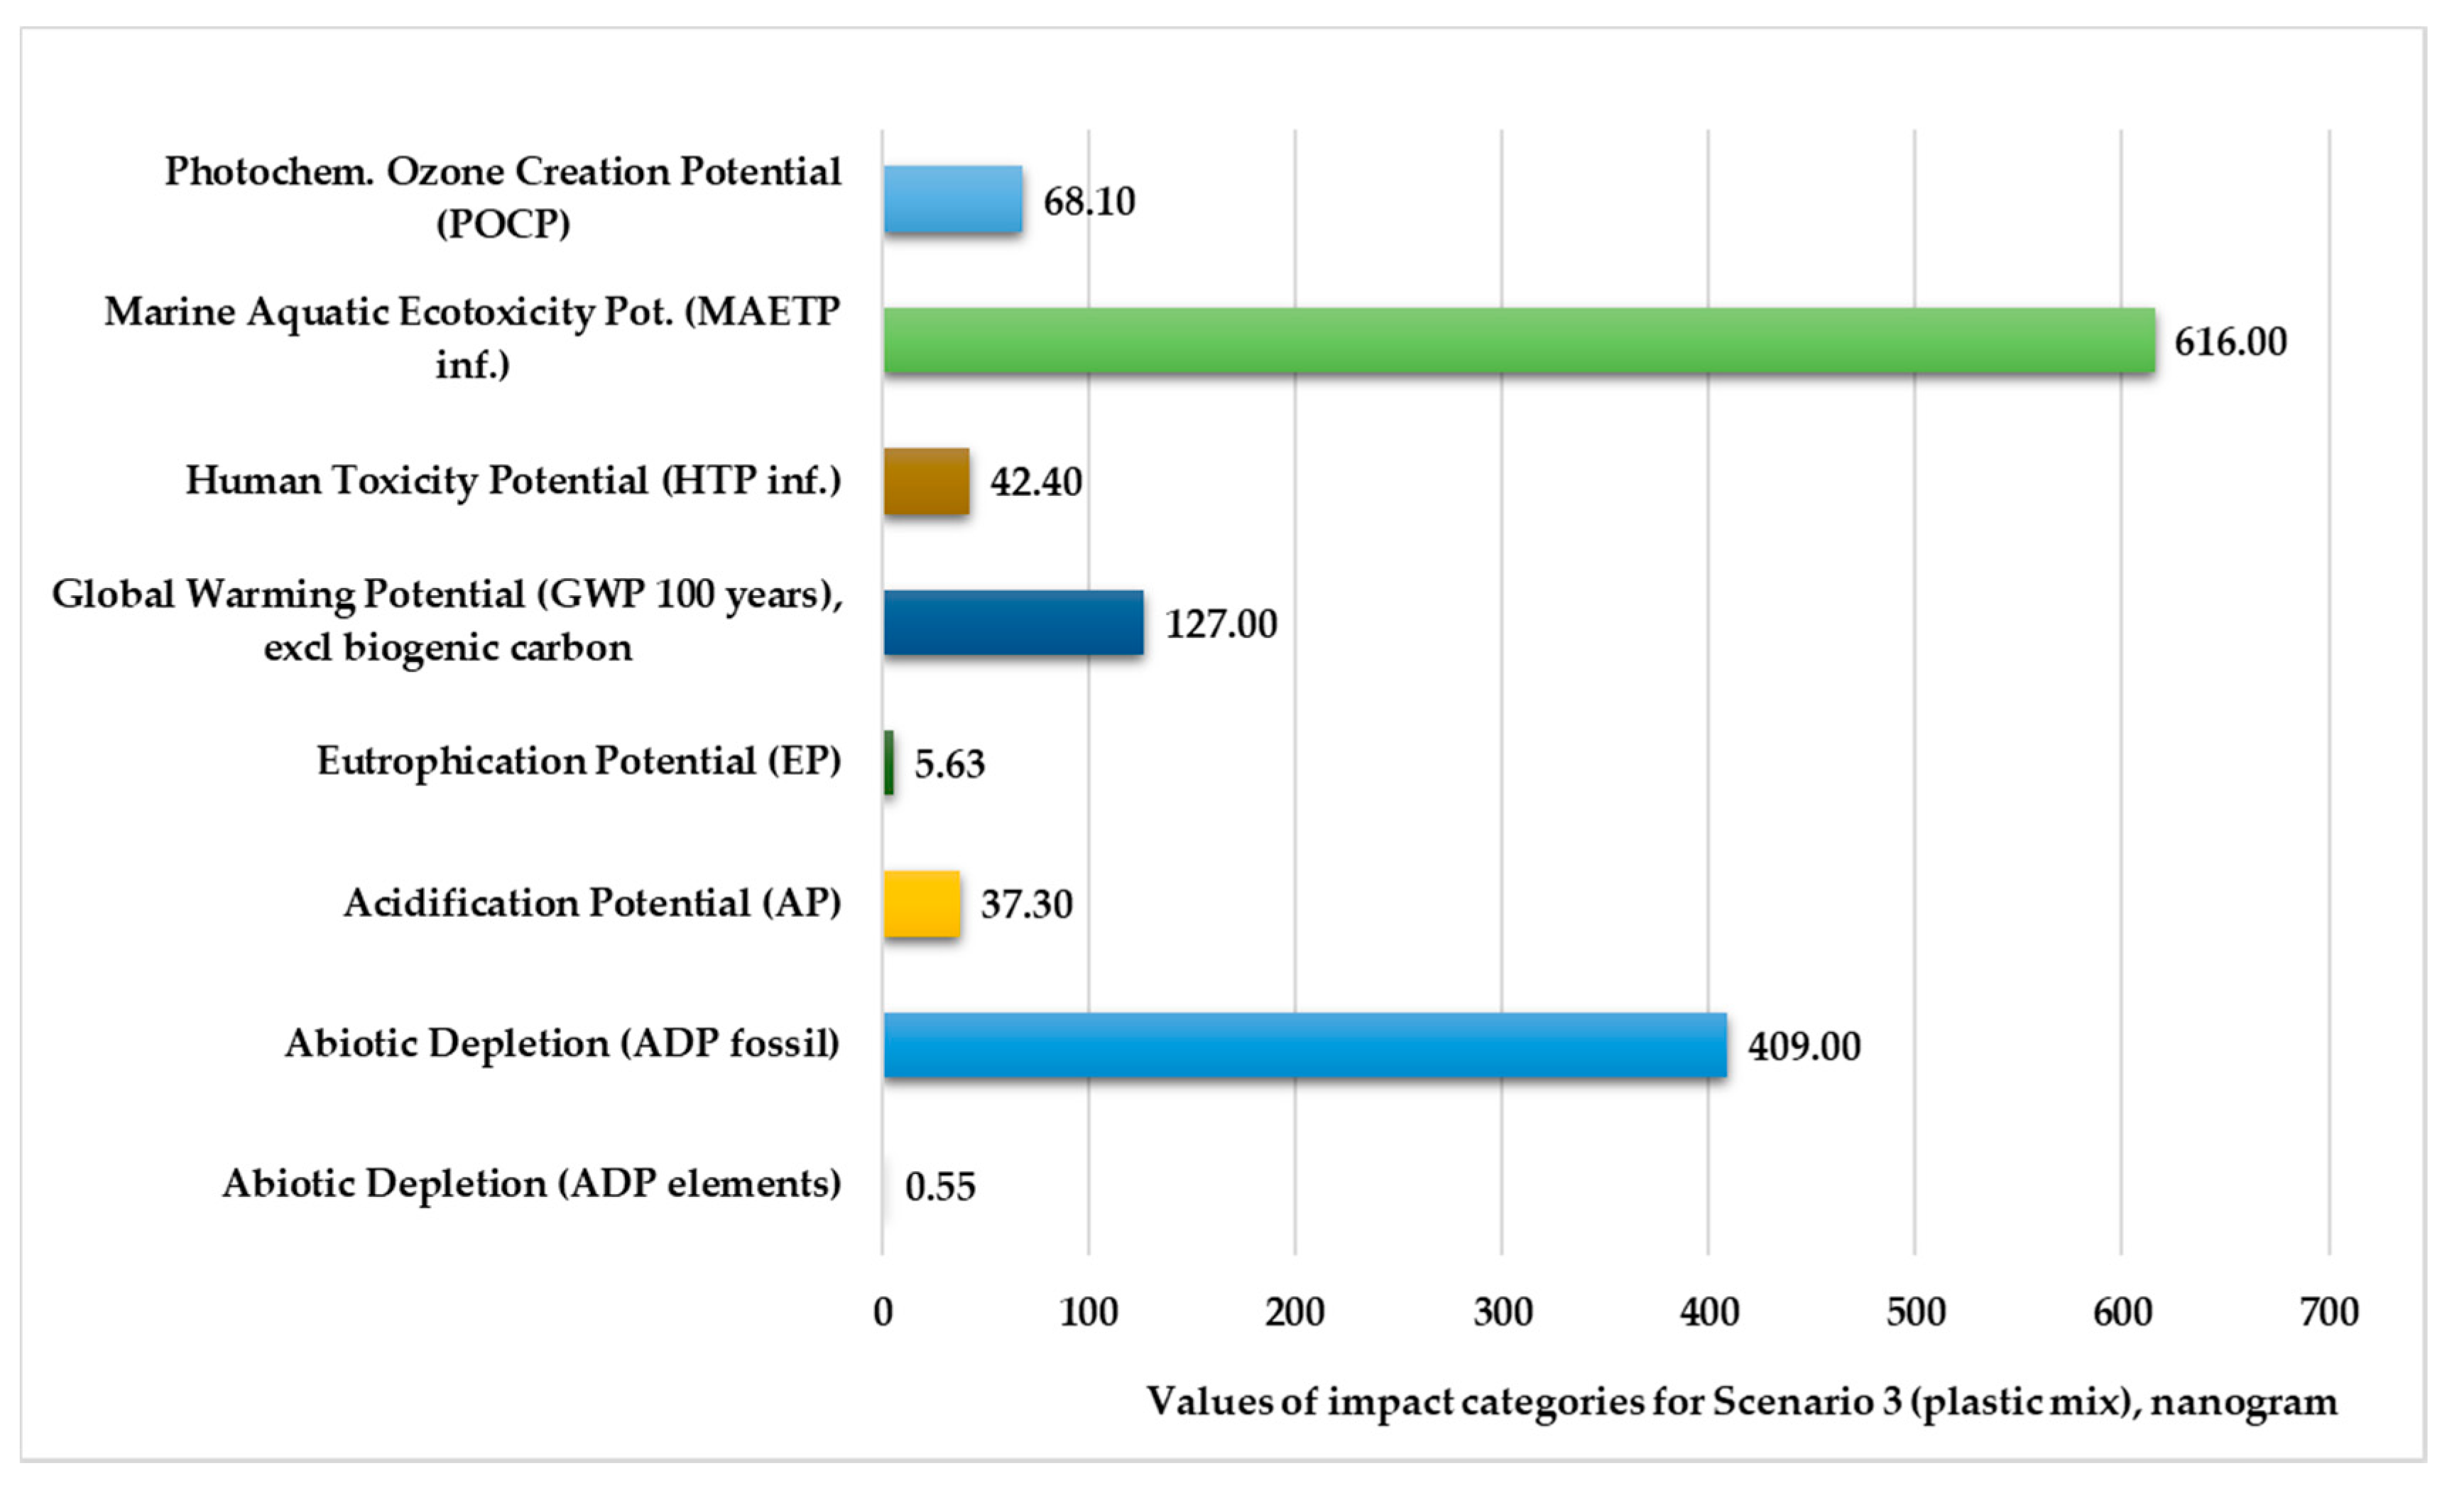
Figure 7.
Environmental impact categories for Scenario 3 in the production stage with transport (functional unit: 28 kg mixed-plastic product).
Figure 7.
Environmental impact categories for Scenario 3 in the production stage with transport (functional unit: 28 kg mixed-plastic product).
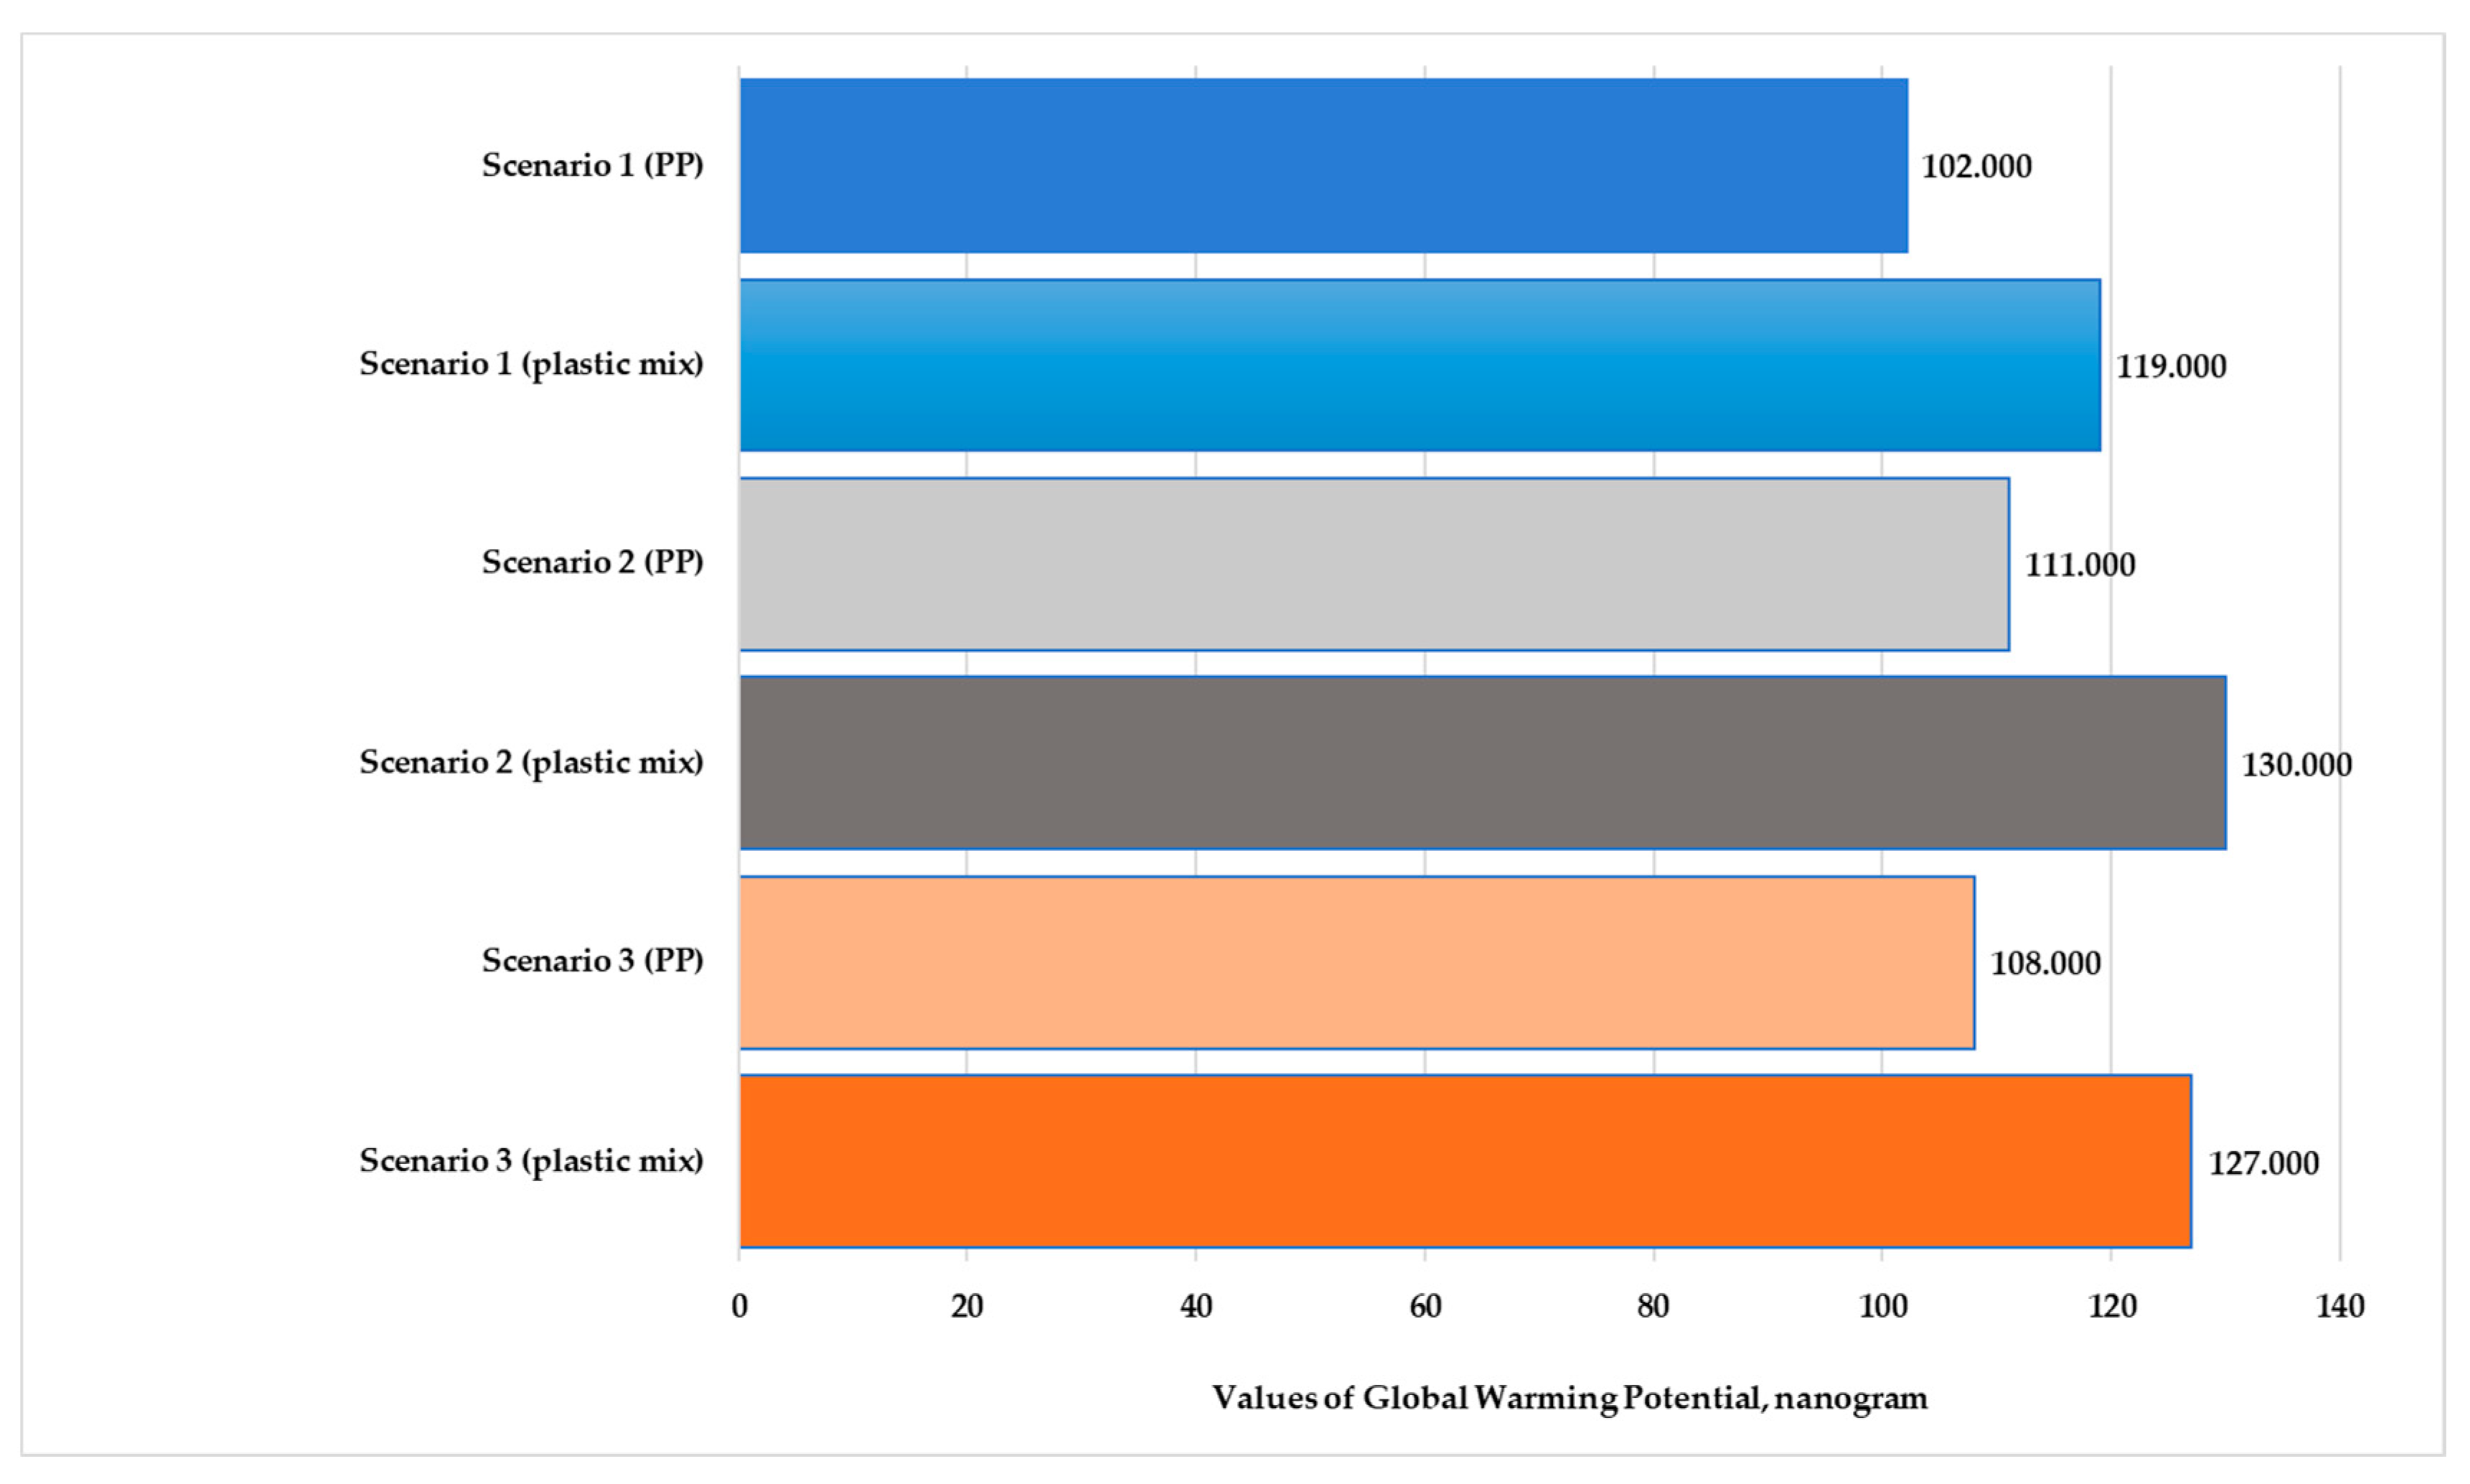
Figure 8.
Values of global warming potential for polypropylene and mixed-plastic products for the different scenarios (functional unit: 28 kg product. Normalization reference: CML 2016, EU 25+3, year 2000, excl. biogenic carbon. Weighting method: thinkstep LCIA Survey 2012, Europe, CML 2016, excl. biogenic carbon).
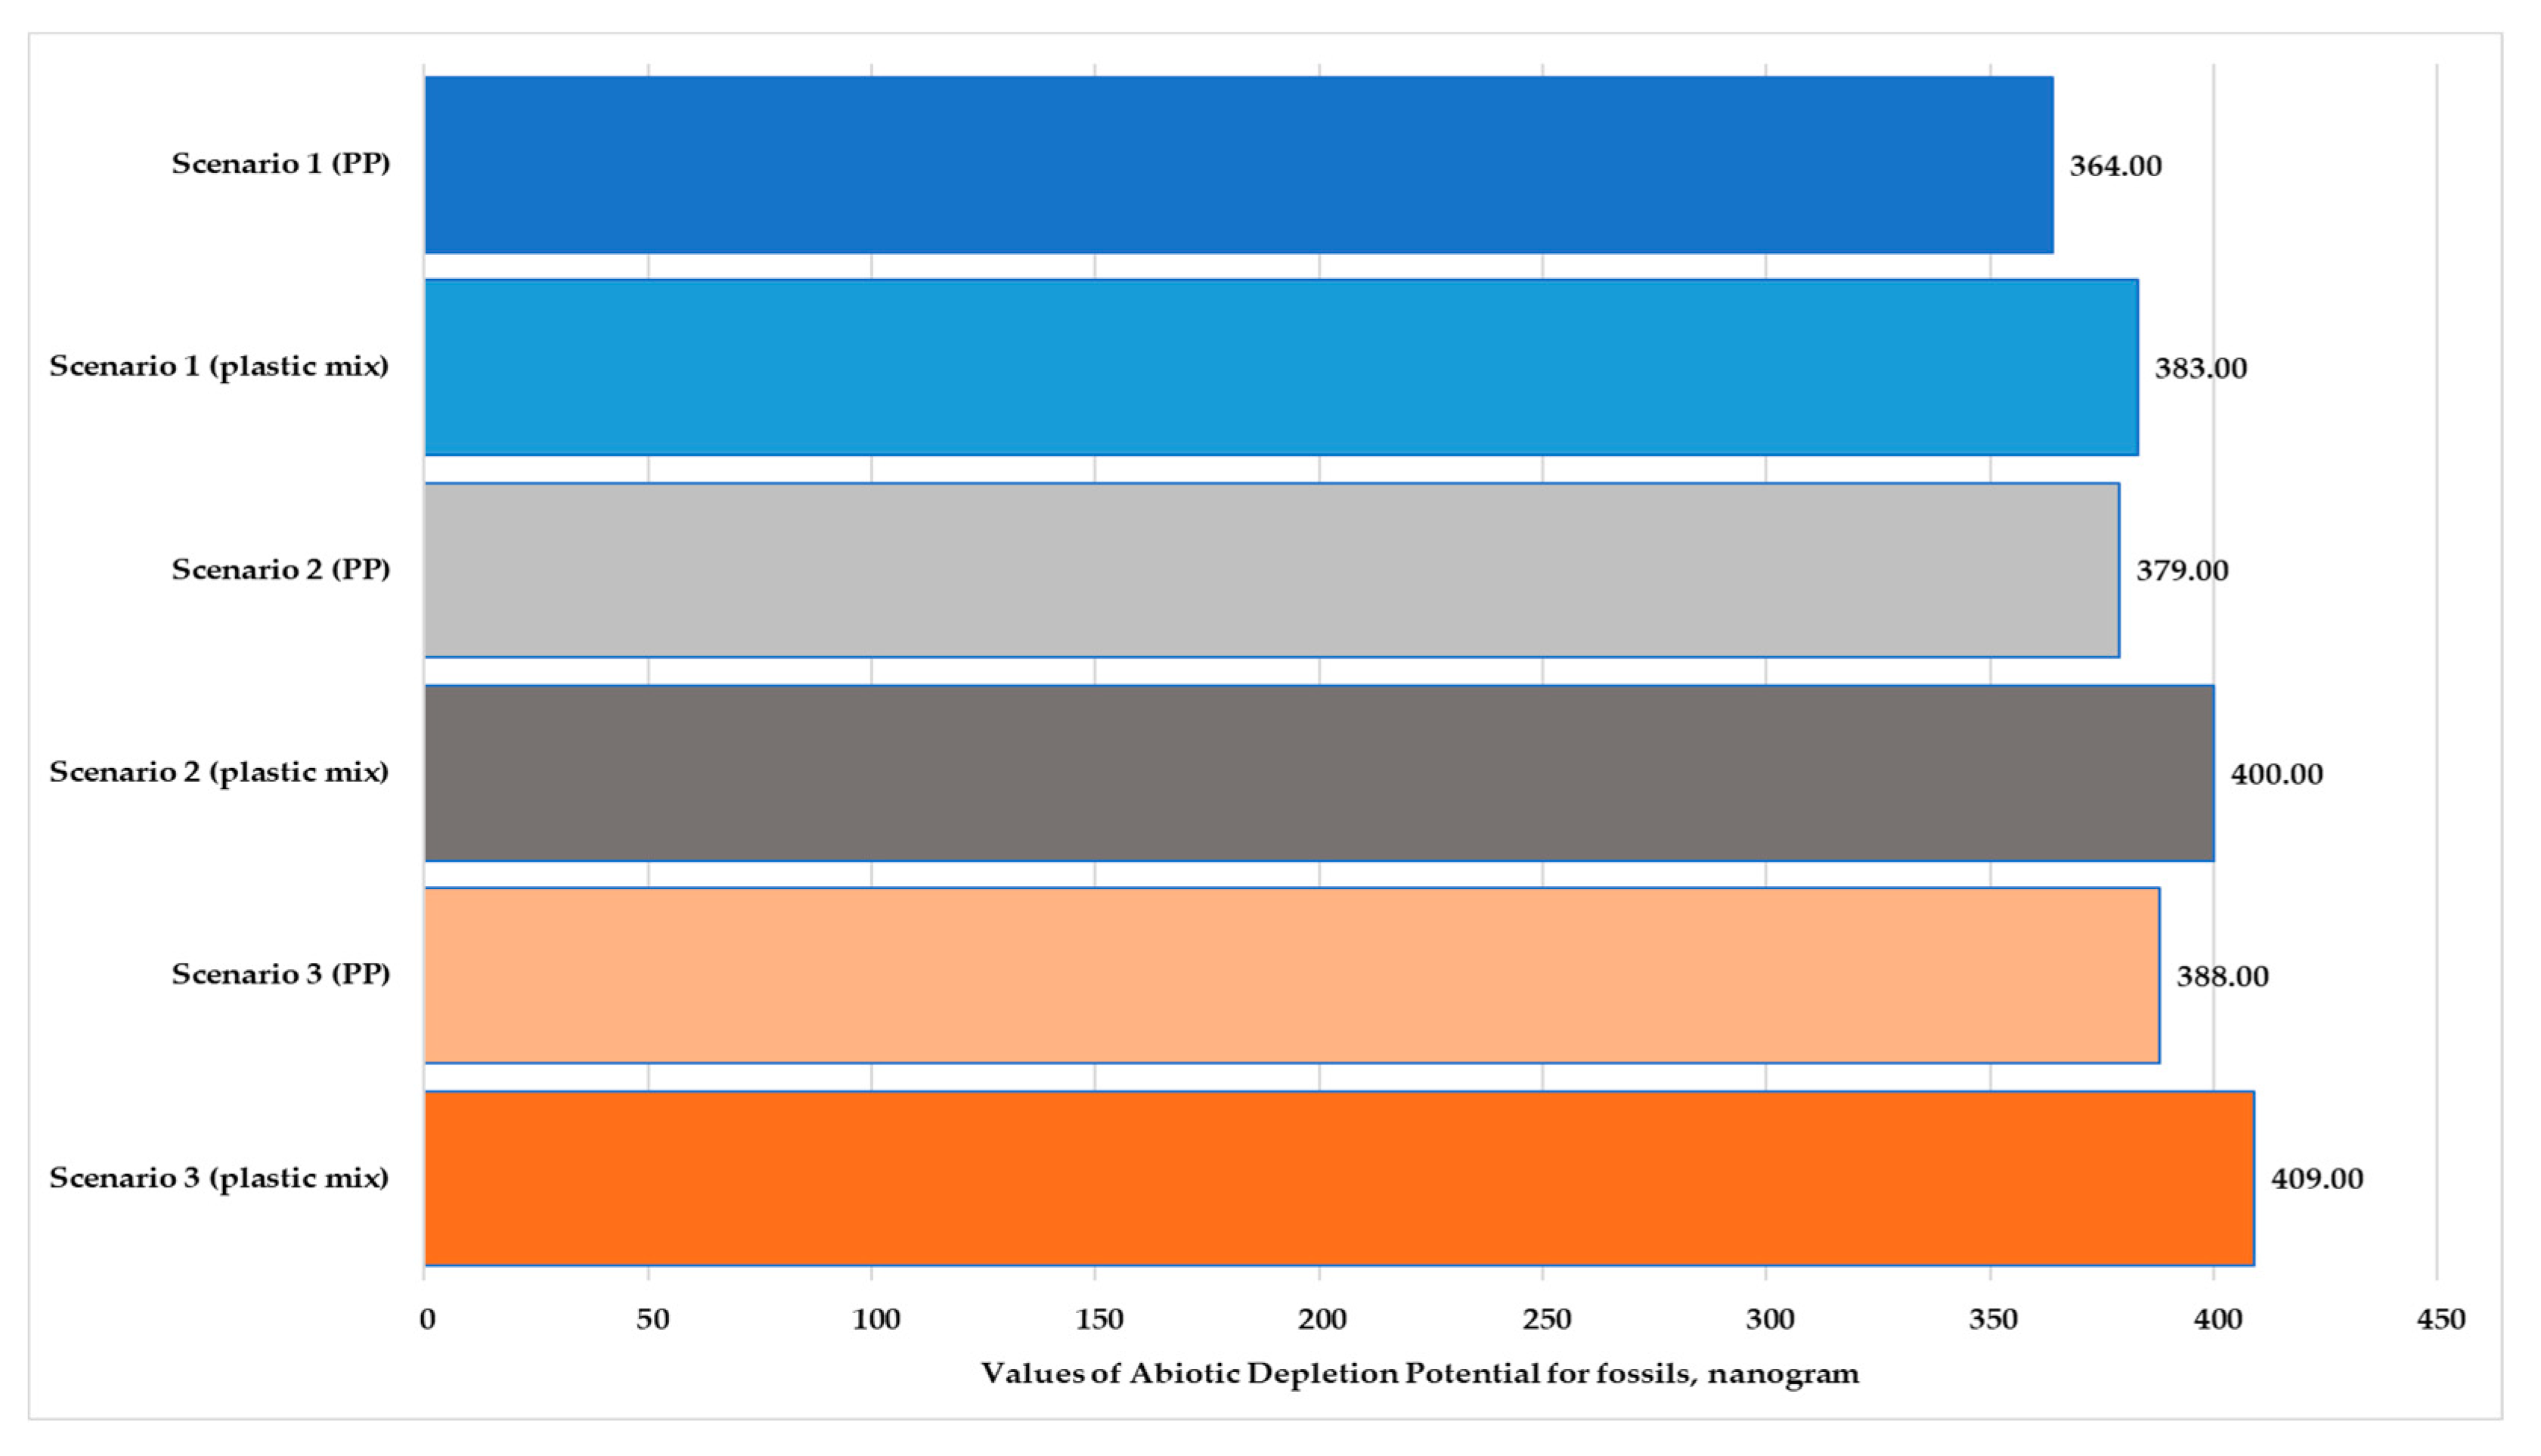
Figure 9.
Values of abiotic depletion for fossil fuels of polypropylene and plastic mix products for the different scenarios (functional unit: 28 kg product. Normalization reference: CML 2016, EU 25+3, year 2000, excl. biogenic carbon. Weighting method: thinkstep LCIA Survey 2012, Europe, CML 2016, excl. biogenic carbon).
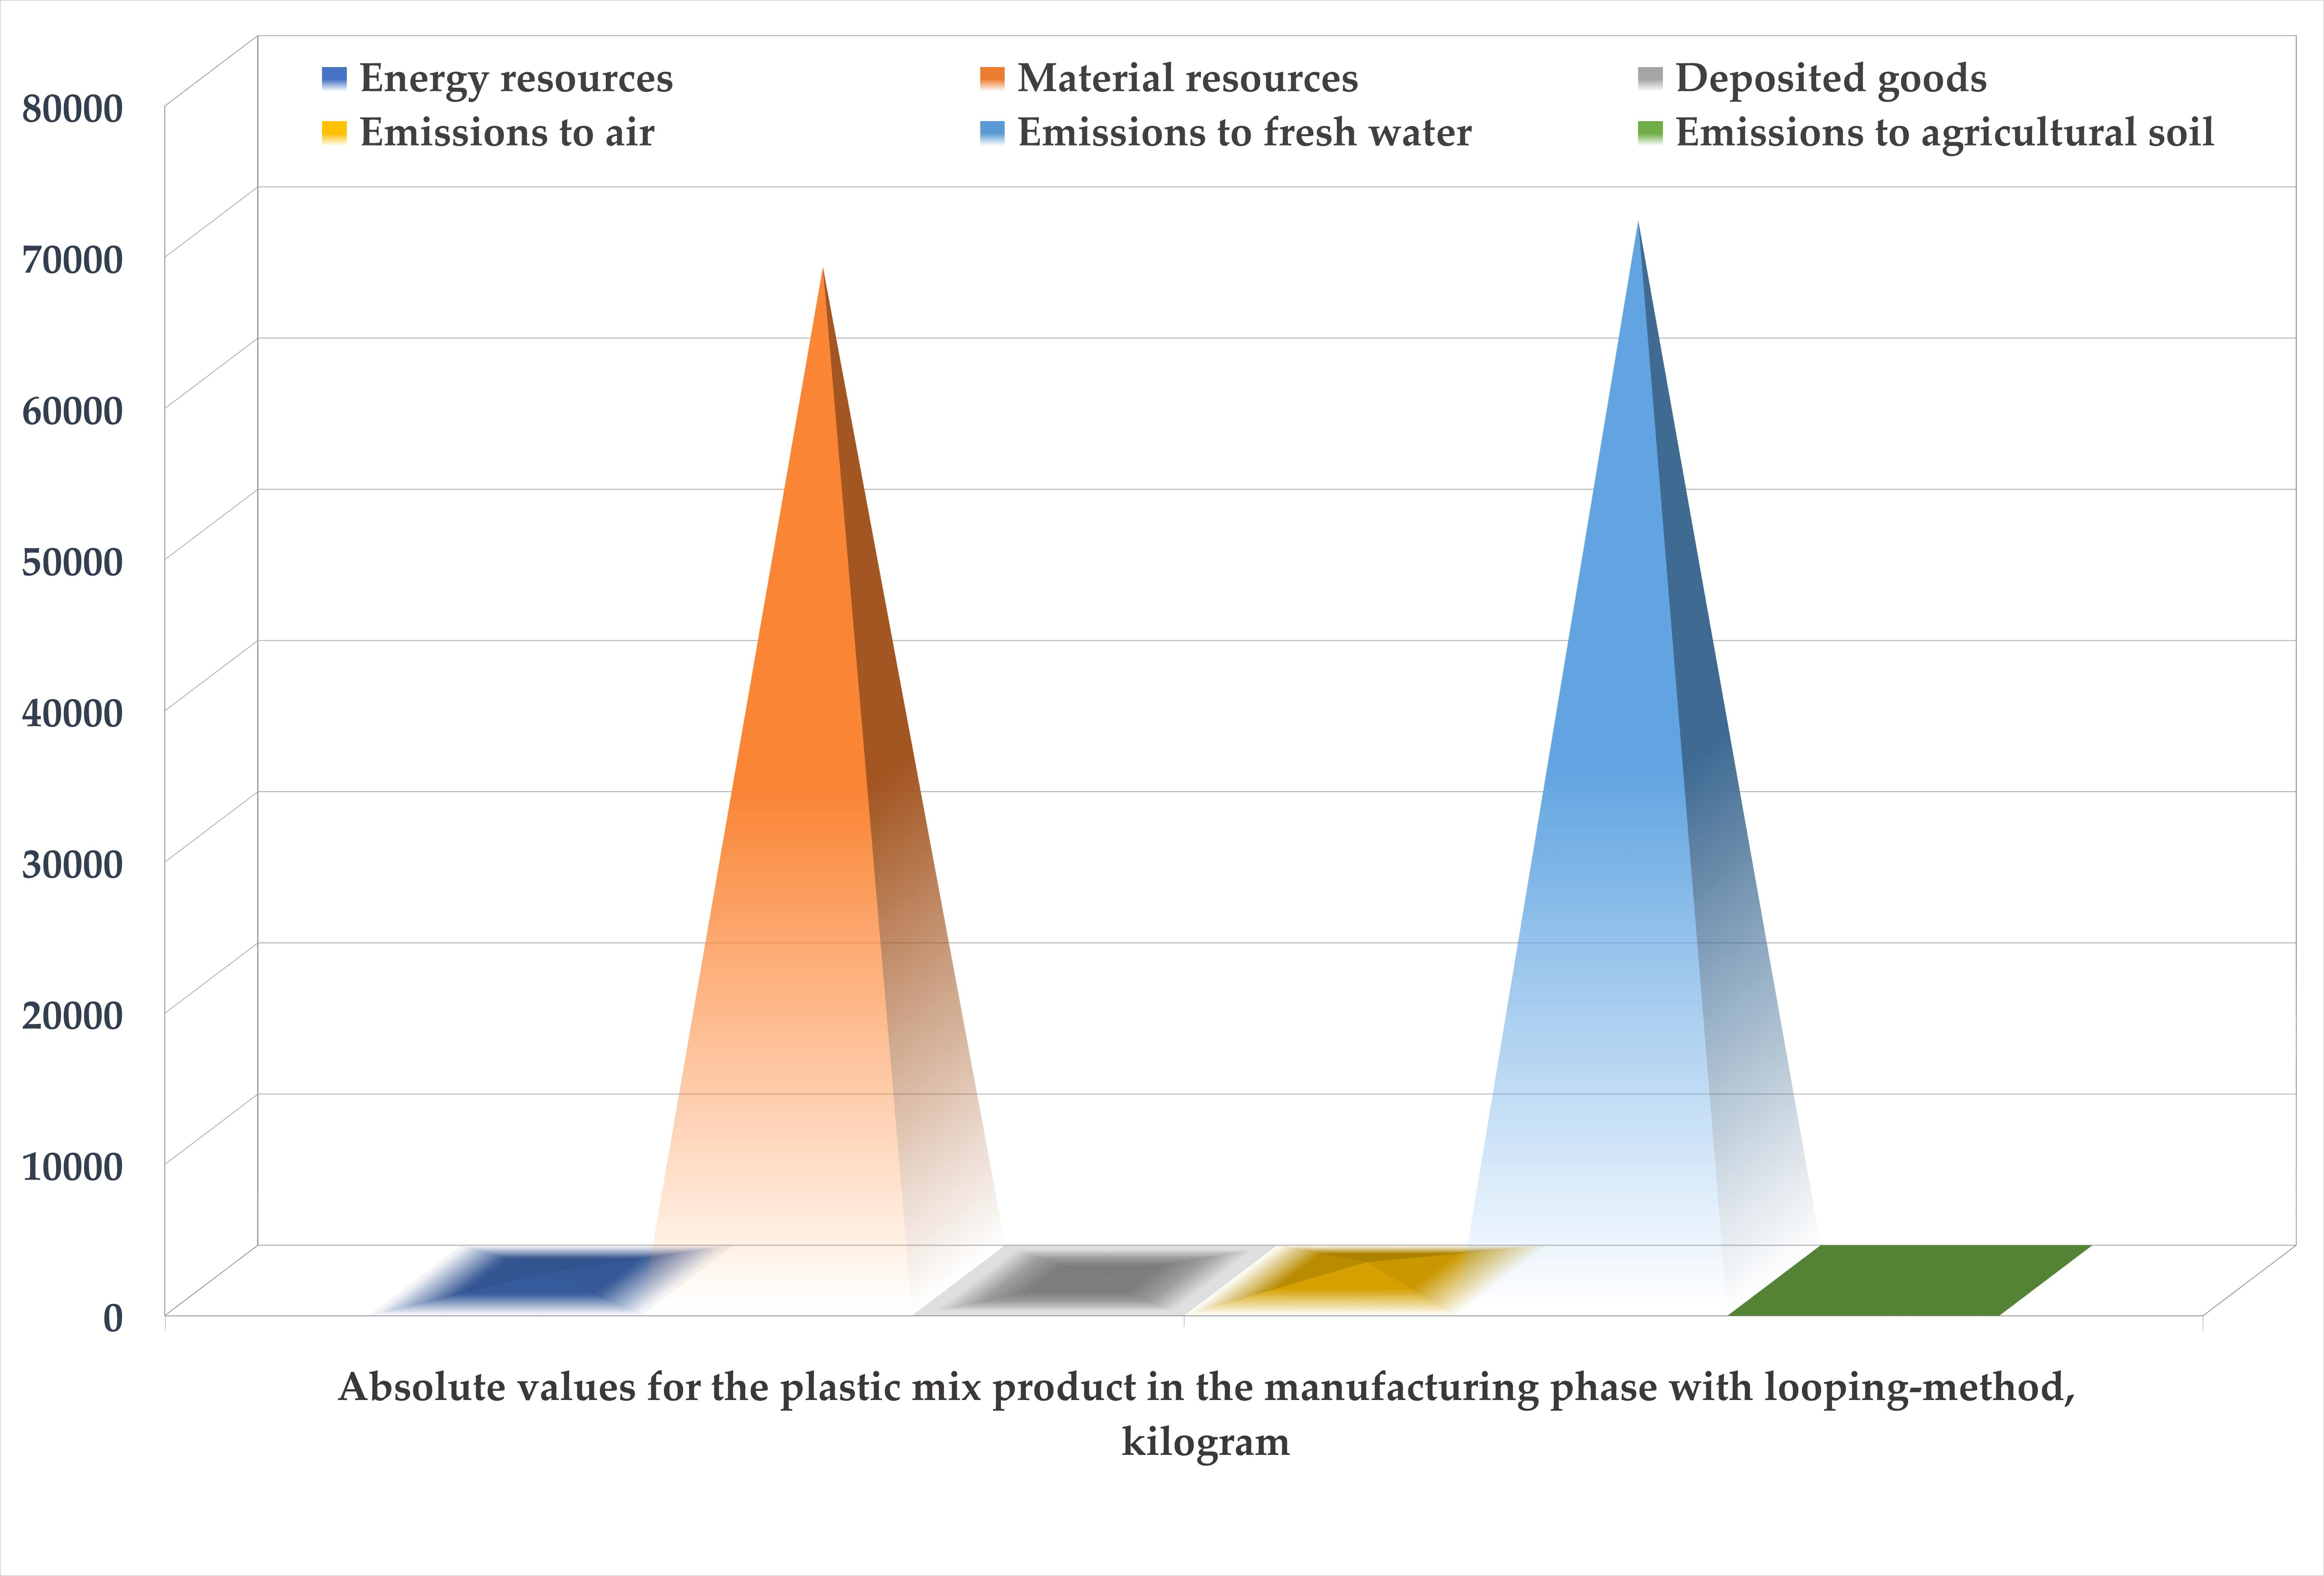
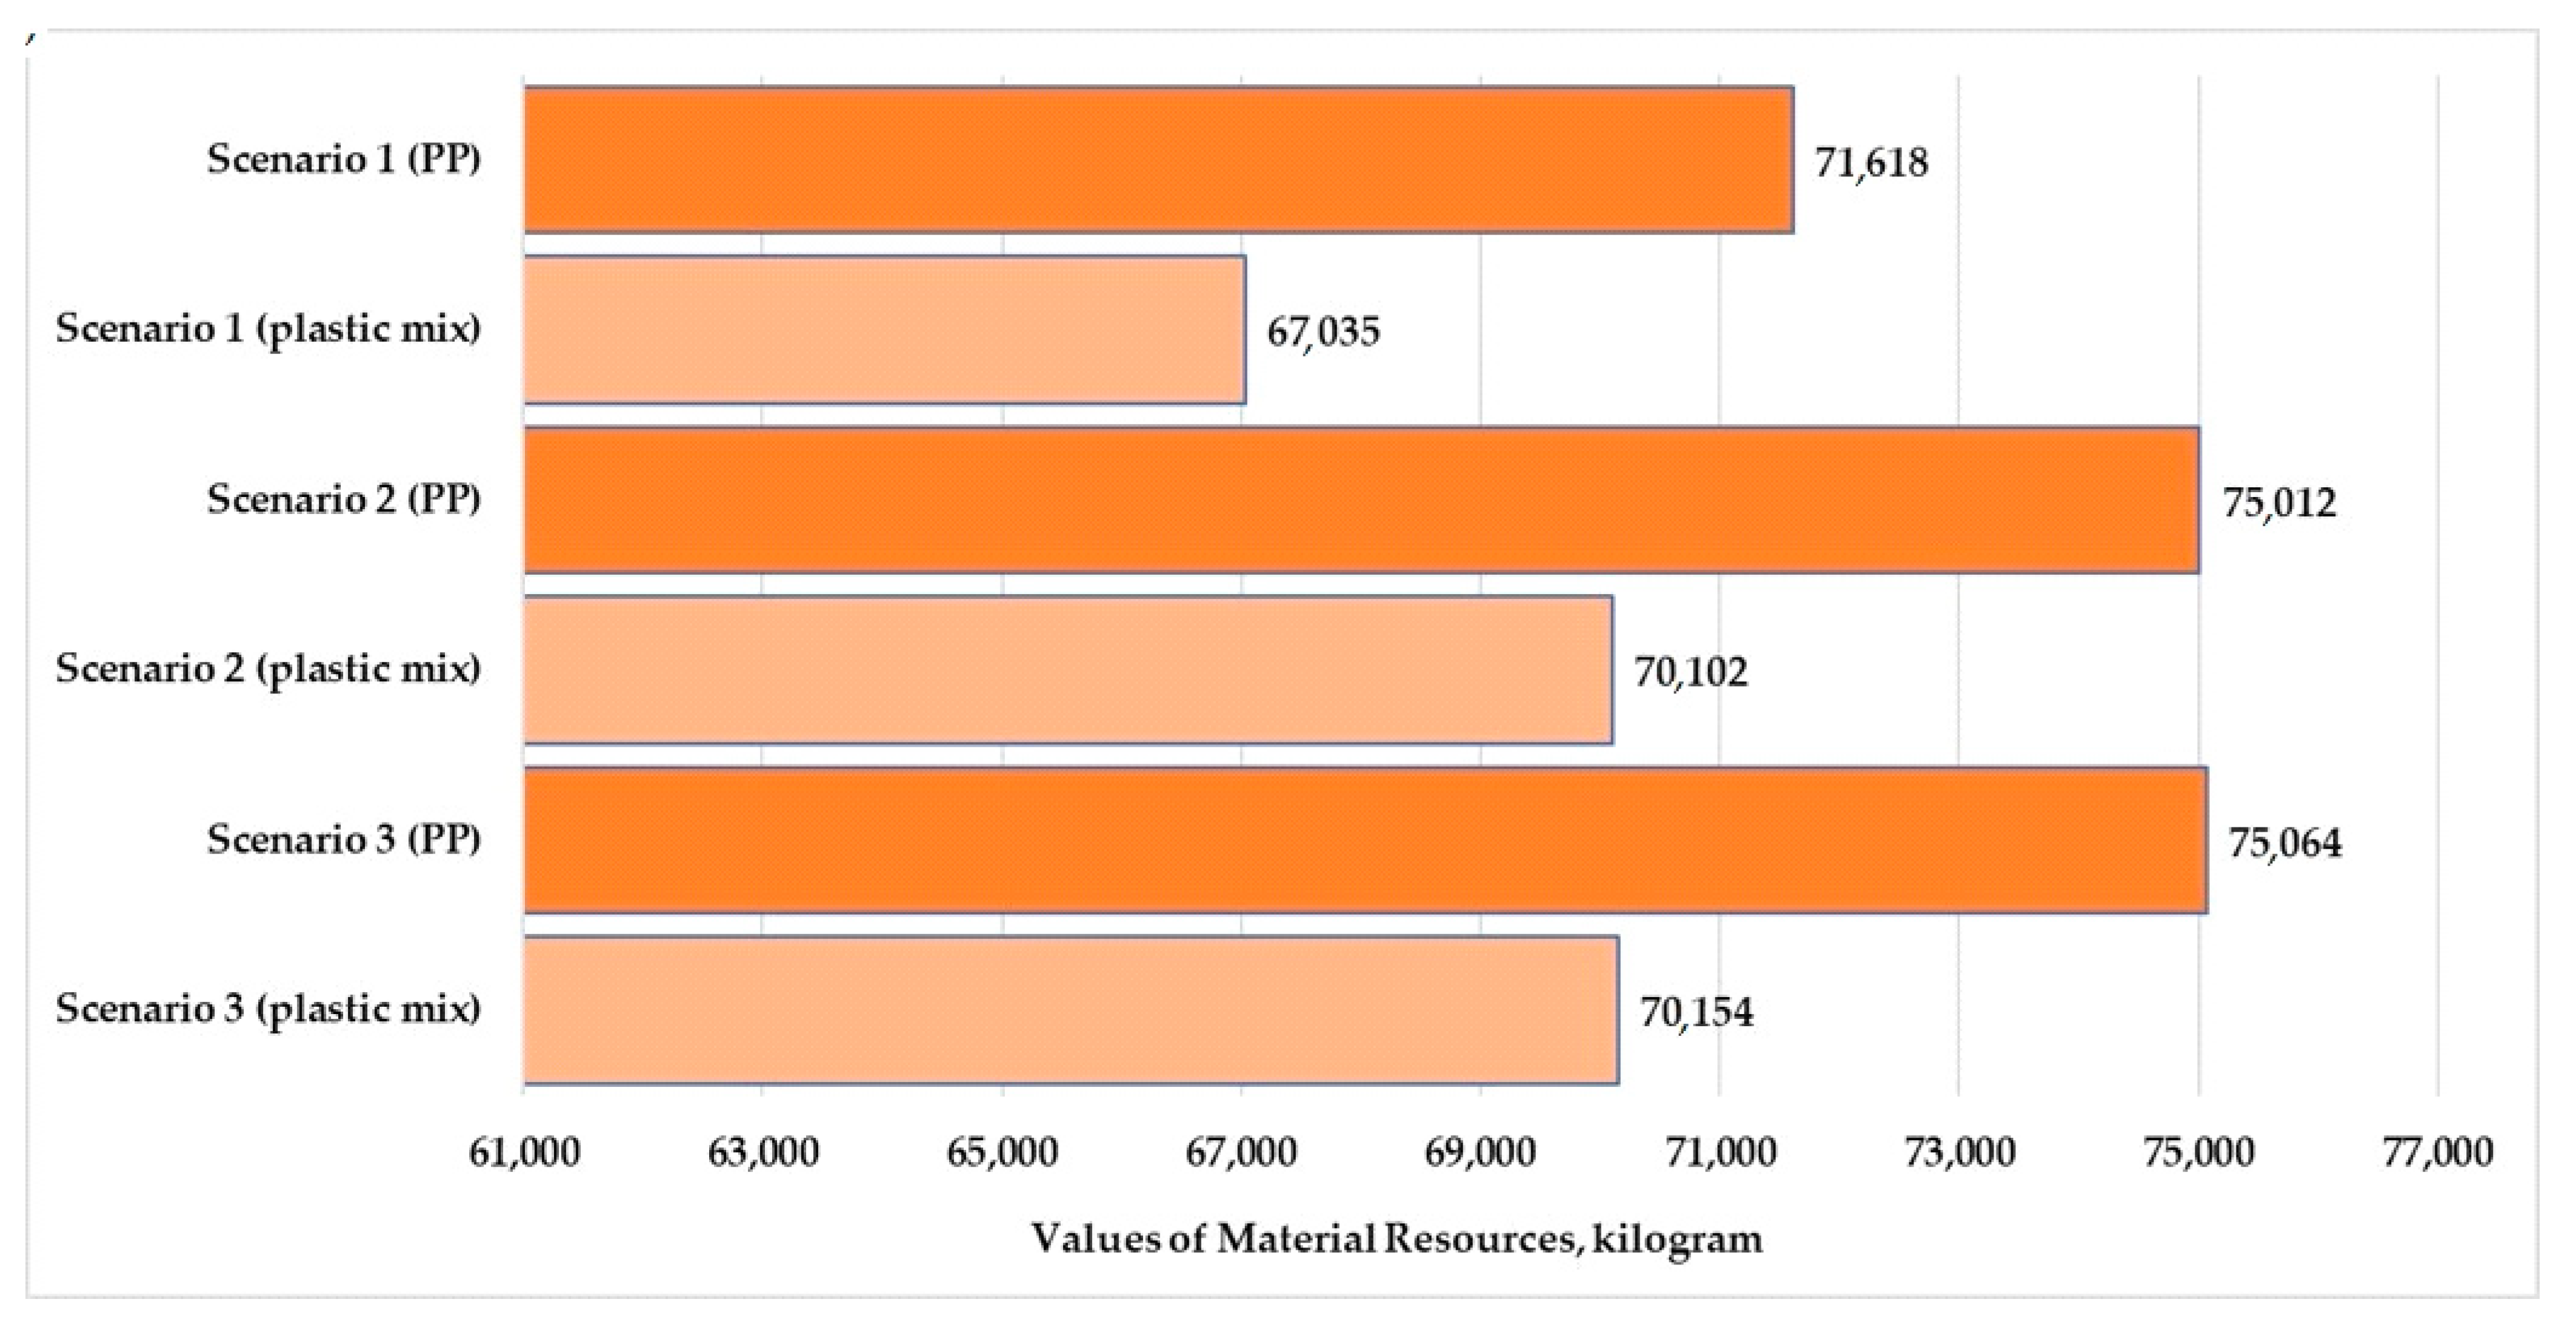
Figure 10.
Values of material resources for polypropylene and mixed-plastic products for the different scenarios (functional unit: 28 kg product).
Figure 10.
Values of material resources for polypropylene and mixed-plastic products for the different scenarios (functional unit: 28 kg product).
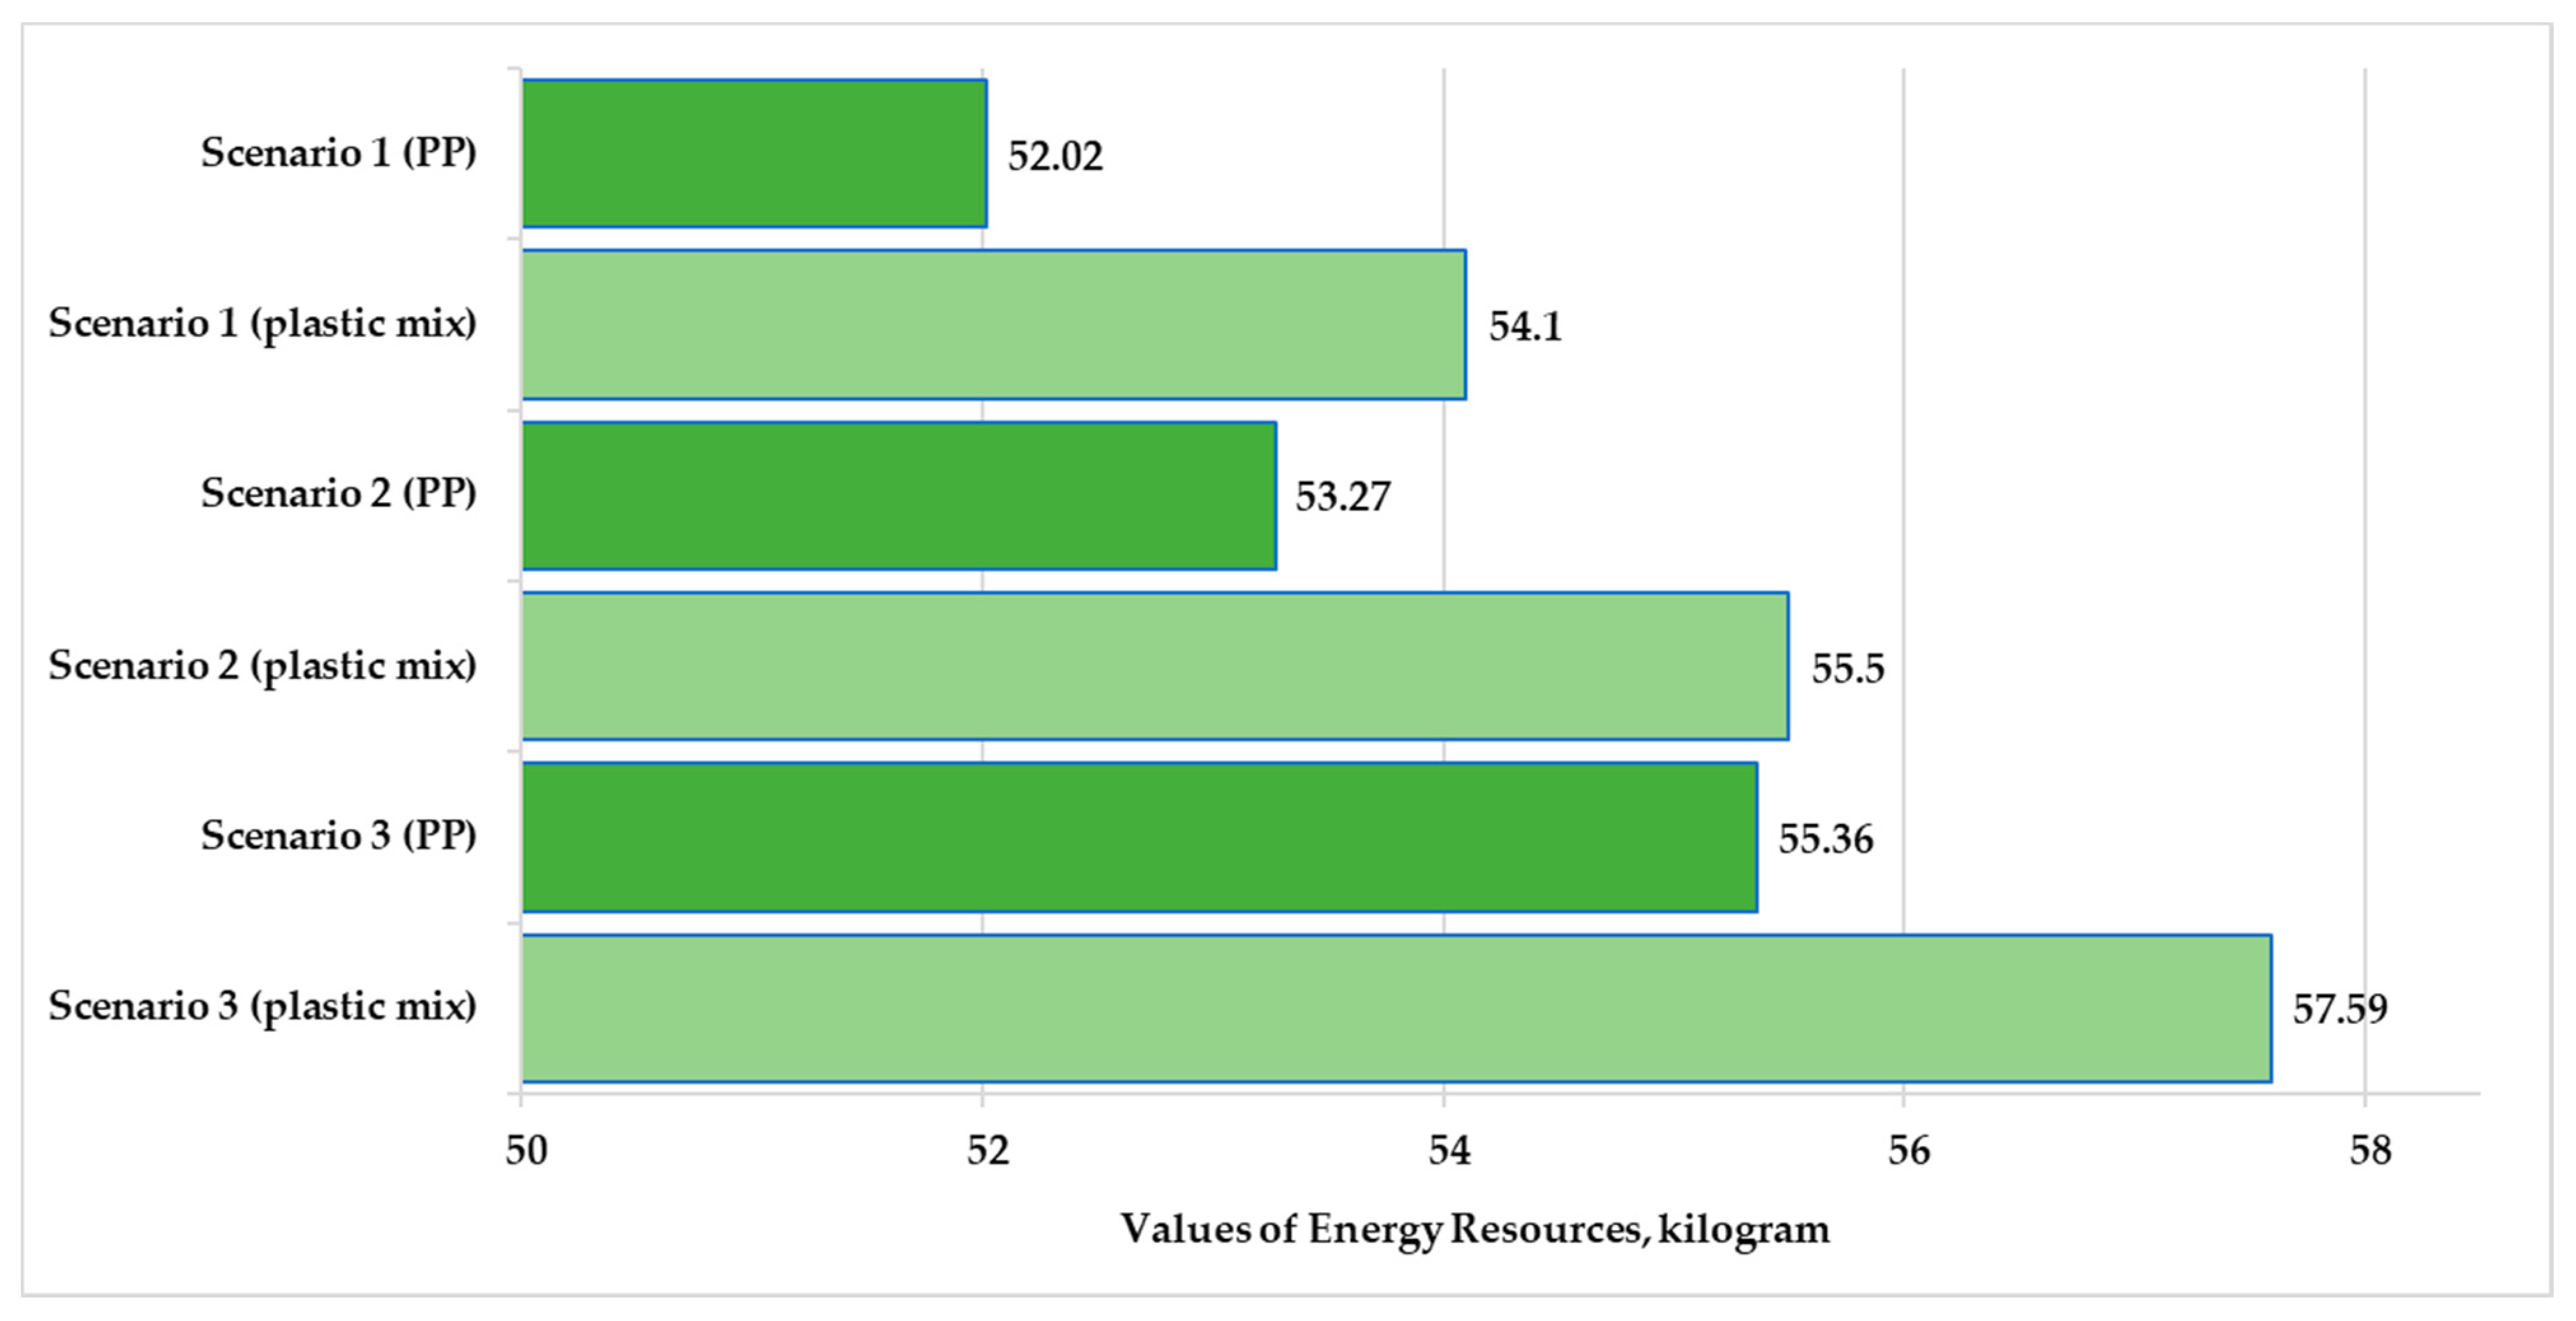
Figure 11.
Values of energy resources for polypropylene and mixed-plastic products for the different scenarios (functional unit: 28 kg product).
Figure 11.
Values of energy resources for polypropylene and mixed-plastic products for the different scenarios (functional unit: 28 kg product).
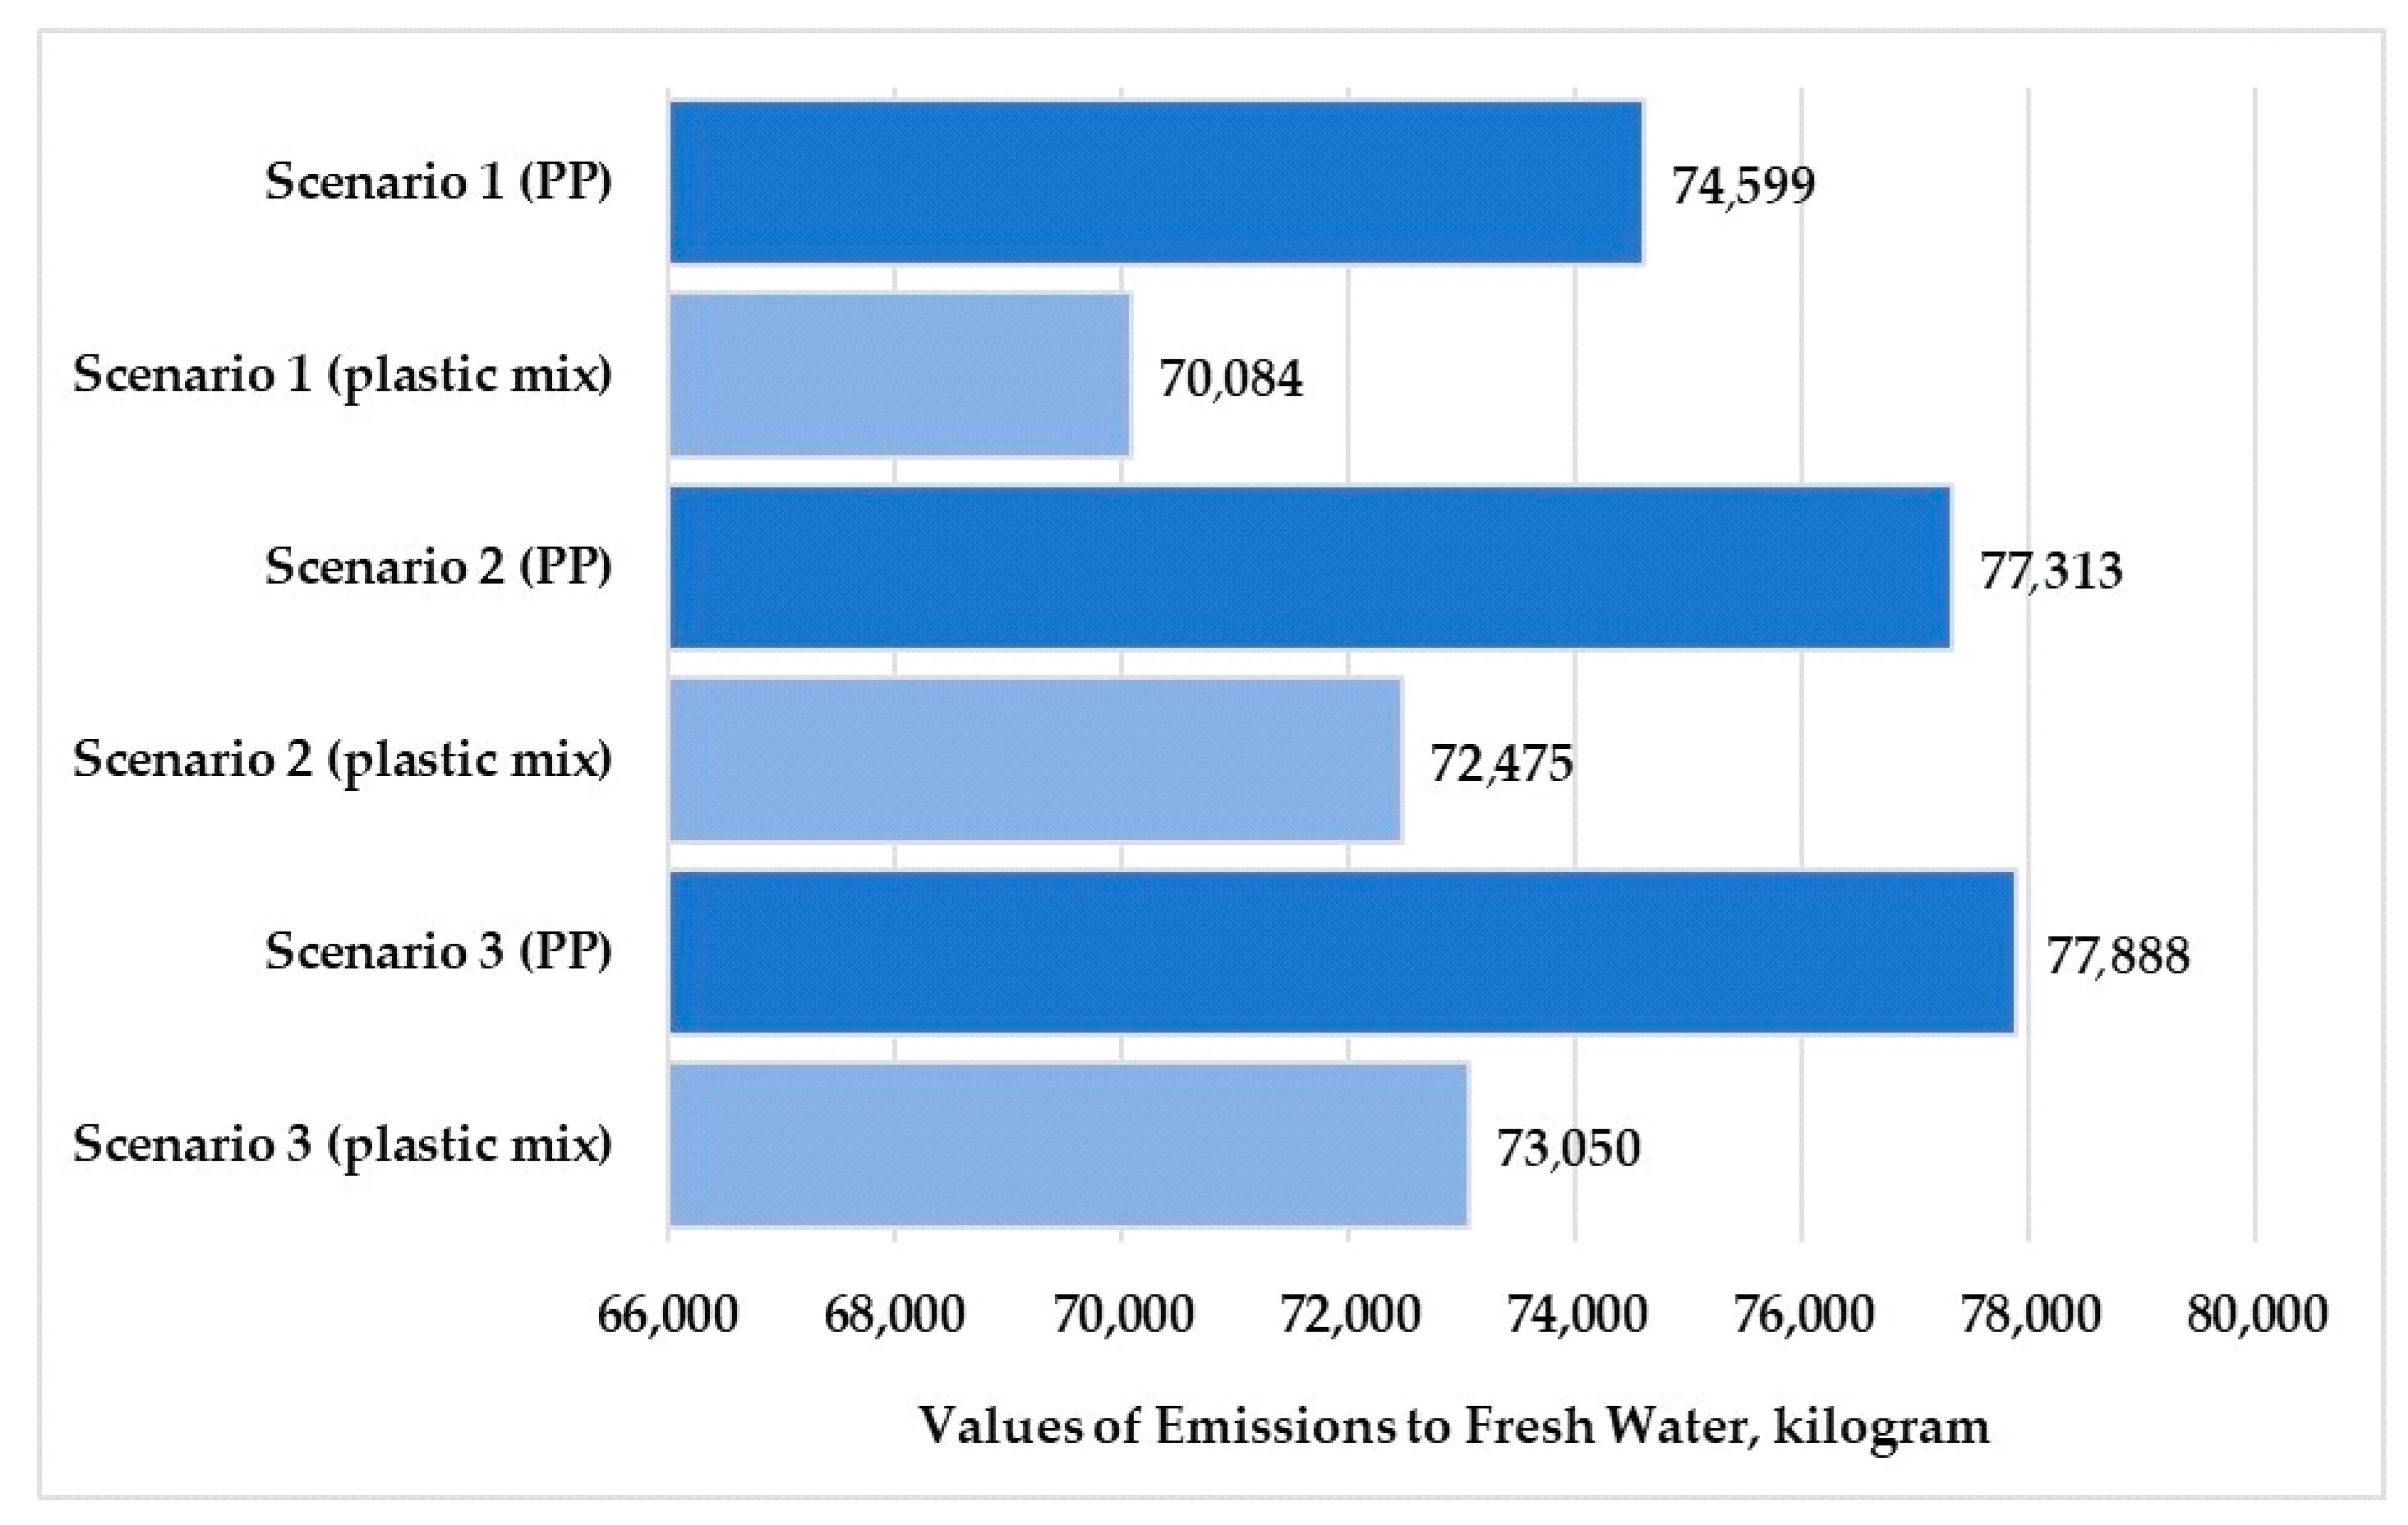
Figure 12.
Values of emissions to fresh water for polypropylene and mixed-plastic products for the different scenarios (functional unit: 28 kg product).
Figure 12.
Values of emissions to fresh water for polypropylene and mixed-plastic products for the different scenarios (functional unit: 28 kg product).
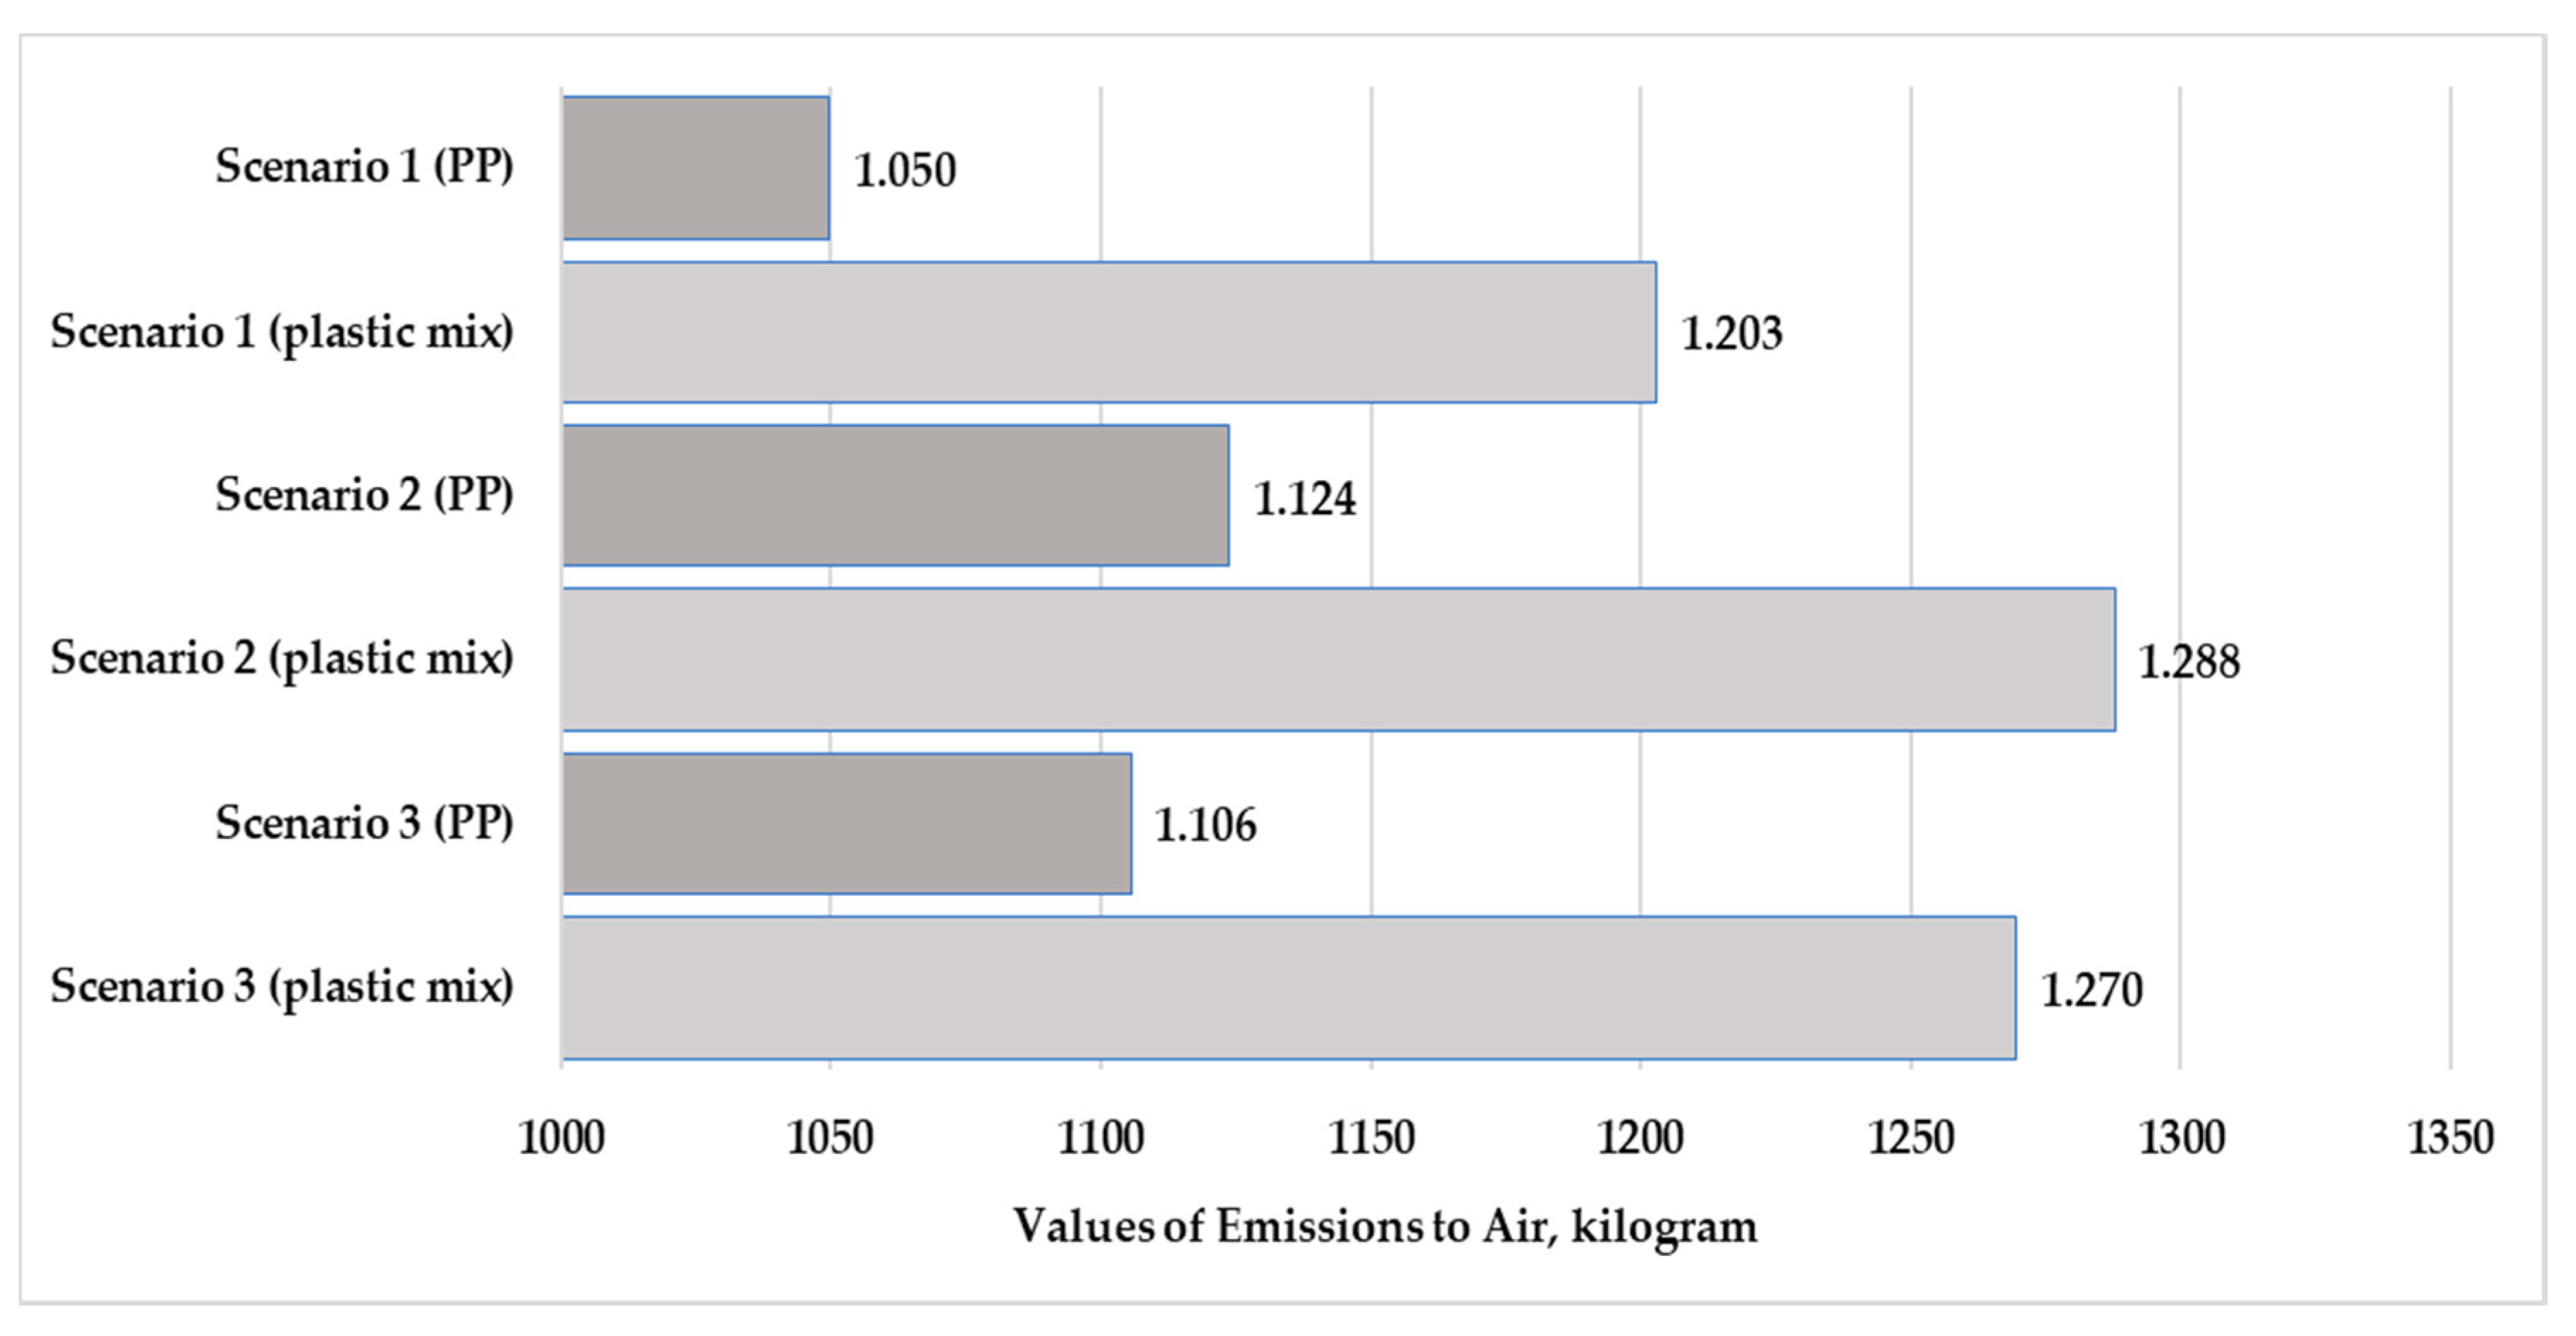
Figure 13.
Values of emissions to air for polypropylene and mixed-plastic mix products for the different scenarios (functional unit: 28 kg product).
Figure 13.
Values of emissions to air for polypropylene and mixed-plastic mix products for the different scenarios (functional unit: 28 kg product).
Table 1.
The examined environmental impact categories [
28,
29].
Table 1.
The examined environmental impact categories [
28,
29].
| Impact Categories | Equivalent |
|---|
| Abiotic Depletion ADP elements, ADPE | kg Sb Equivalent |
| Abiotic Depletion ADP fossil, ADPF | MJ |
| Acidification Potential AP | kg SO2 Equivalent |
| Eutrophication Potential EP | kg Phosphate Equivalent |
| Freshwater A. Ecot. P. FAETP inf. | kg DCB Equivalent |
| Global Warming Pot. GWP 100 years | kg CO2 Equivalent |
| Human Toxicity Potential HTP inf. | kg DCB Equivalent |
| Marine A. Ecotox. Pot. MAETP inf. | kg DCB Equivalent |
| Photochem. Ozone Creat. Pot. POCP | kg Ethylene Equivalent |
| Terrestric Ecotox. Pot. TETP inf. | kg DCB Equivalent |
| Ozone Depletion Pot. ODP steady state | kg R11 Equivalent |
Table 2.
Environmental impacts in the production stage of the plastic products for Scenario 1 (functional unit: 1 kg of plastic product. Normalization reference: CML 2016, EU 25+3, year 2000, excluding biogenic carbon. Weighting method: thinkstep LCIA Survey 2012, Europe, CML 2016, excluding biogenic carbon).
| Impact Categories | PP (ng) | Plastic Mix (ng) | Difference (%) |
|---|
| Abiotic Depletion ADP fossil | 364.000 | 383.000 | 5.00 |
| Acidification Potential AP | 29.00 | 35.10 | 17.00 |
| Eutrophication Potential EP | 4.25 | 4.98 | 15.00 |
| Global Warming Pot. GWP 100 years | 102.000 | 119.000 | 14.00 |
| Human Toxicity Potential HTP inf. | 37.20 | 38.90 | 4.00 |
| Marine A. Ecotox. Pot. MAETP inf. | 525.00 | 586.00 | 10.00 |
| Photochem. Ozone Creat. Pot. POCP | 50.50 | 63.70 | 21.00 |
| Abiotic Depletion ADP elements | 0.49 | 0.51 | 4.00 |
Table 3.
Environmental impacts in the production stage of the plastic products for Scenario 2 (functional unit: 1 kg of plastic product. Normalization reference: CML 2016, EU 25+3, year 2000, excluding biogenic carbon. Weighting method: thinkstep LCIA Survey 2012, Europe, CML 2016, excluding biogenic carbon).
| Impact Categories | PP (ng) | Plastic Mix (ng) | Difference (%) |
|---|
| Abiotic Depletion ADP fossil | 379.000 | 400.000 | 5.00 |
| Acidification Potential AP | 21.40 | 27.80 | 23.00 |
| Eutrophication Potential EP | 4.35 | 5.13 | 15.00 |
| Global Warming Pot. GWP 100 years | 111.000 | 130.000 | 15.00 |
| Human Toxicity Potential HTP inf. | 32.80 | 35.50 | 8.00 |
| Marine A. Ecotox. Pot. MAETP inf. | 102.00 | 95.90 | 6.00 |
| Photochem. Ozone Creat. Pot. POCP | 49.30 | 62.70 | 21.00 |
| Abiotic Depletion ADP elements | 0.51 | 0.54 | 6.00 |
Table 4.
Environmental impacts in the production stage of the plastic products for Scenario 3 (functional unit: 1 kg of plastic product. Normalization reference: CML 2016, EU 25+3, year 2000, excluding biogenic carbon. Weighting method: thinkstep LCIA Survey 2012, Europe, CML 2016, excluding biogenic carbon).
| Impact Categories | PP (ng) | Plastic Mix (ng) | Difference (%) |
|---|
| Abiotic Depletion ADP fossil | 388.000 | 409.000 | 5.00 |
| Acidification Potential AP | 30.80 | 37.30 | 18.00 |
| Eutrophication Potential EP | 4.85 | 5.63 | 14.00 |
| Global Warming Pot. GWP 100 years | 108.000 | 127.000 | 15.00 |
| Human Toxicity Potential HTP inf. | 39.70 | 42.40 | 7.00 |
| Marine A. Ecotox. Pot. MAETP inf. | 623.000 | 616.000 | 2.00 |
| Photochem. Ozone Creat. Pot. POCP | 54.70 | 68.10 | 20.00 |
| Abiotic Depletion ADP elements | 0.52 | 0.55 | 6.00 |
Table 5.
Environmental impacts of the polypropylene product for different scenarios (functional unit: 1 kg of polypropylene product. Normalization reference: CML 2016, EU 25+3, year 2000, excluding biogenic carbon. Weighting method: thinkstep LCIA Survey 2012, Europe, CML 2016, excluding biogenic carbon).
| Environmental Impacts of PP Product | Scenario 1 (ng) | Scenario 2 (ng) | Scenario 3 (ng) |
|---|
| Abiotic Depletion ADP fossil | 364.000 | 379.000 | 388.000 |
| Acidification Potential AP | 29.00 | 21.40 | 30.80 |
| Eutrophication Potential EP | 4.25 | 4.35 | 4.85 |
| Global Warming Pot. GWP 100 years | 102.000 | 111.000 | 108.000 |
| Human Toxicity Potential HTP inf. | 37.20 | 32.80 | 39.70 |
| Marine A. Ecotox. Pot. MAETP inf. | 525.00 | 102.00 | 623.000 |
| Photochem. Ozone Creat. Pot. POCP | 50.50 | 49.30 | 54.70 |
| Abiotic Depletion ADP elements | 0.49 | 0.51 | 0.52 |
Table 6.
Environmental impacts of the mixed-plastic product for different scenarios (functional unit: 1 kg of plastic mix product. Life cycle impact assessment method: CML 2016).
Table 6.
Environmental impacts of the mixed-plastic product for different scenarios (functional unit: 1 kg of plastic mix product. Life cycle impact assessment method: CML 2016).
| Environmental Impacts of Plastic Mix Product | Scenario 1 (ng) | Scenario 2 (ng) | Scenario 3 (ng) |
|---|
| Abiotic Depletion ADP fossil | 383.000 | 400.000 | 409.000 |
| Acidification Potential AP | 35.10 | 27.80 | 37.30 |
| Eutrophication Potential EP | 4.98 | 5.13 | 5.63 |
| Global Warming Pot. GWP 100 years | 119.000 | 130.000 | 127.000 |
| Human Toxicity Potential HTP inf. | 38.90 | 35.50 | 42.40 |
| Marine A. Ecotox. Pot. MAETP inf. | 586.00 | 95.90 | 616.000 |
| Photochem. Ozone Creat. Pot. POCP | 63.70 | 62.70 | 68.10 |
| Abiotic Depletion ADP elements | 0.51 | 0.54 | 0.55 |


