
Preparation of Graphene Oxide/Cellulose Composites with Microcrystalline Cellulose Acid Hydrolysis Using the Waste Acids Generated by the Hummers Method of Graphene Oxide Synthesis

Abstract
:1. Introduction
2. Materials and Methods
2.1. Materials and Chemicals
2.2. Graphene Oxide (GO) Preparation
2.3. Preparation of the GO/MCC Composite
2.4. Characterization
3. Results
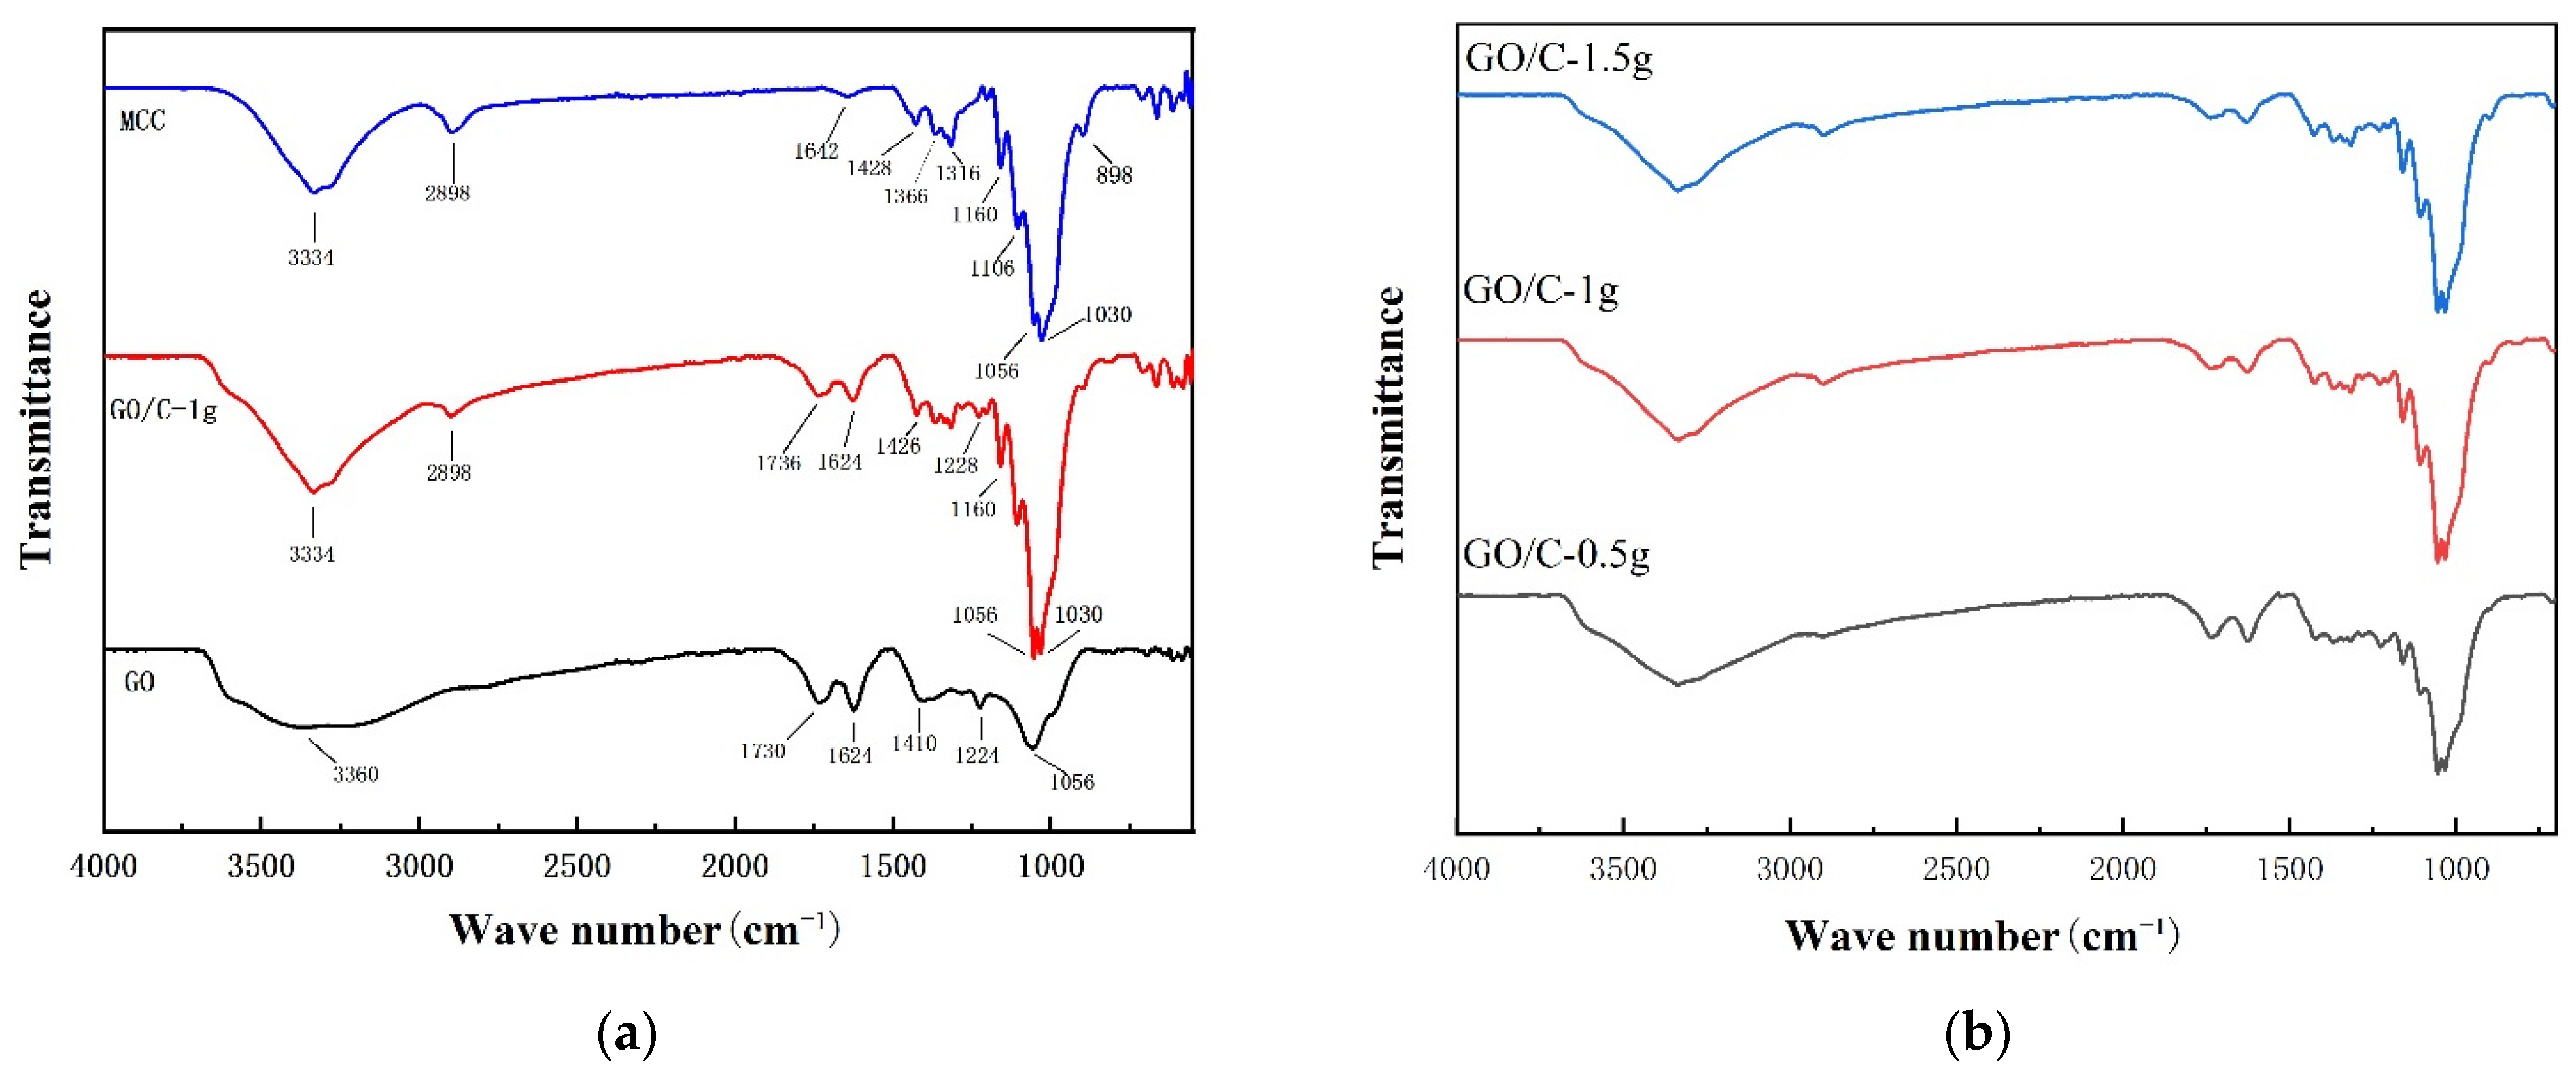
3.1. FTIR
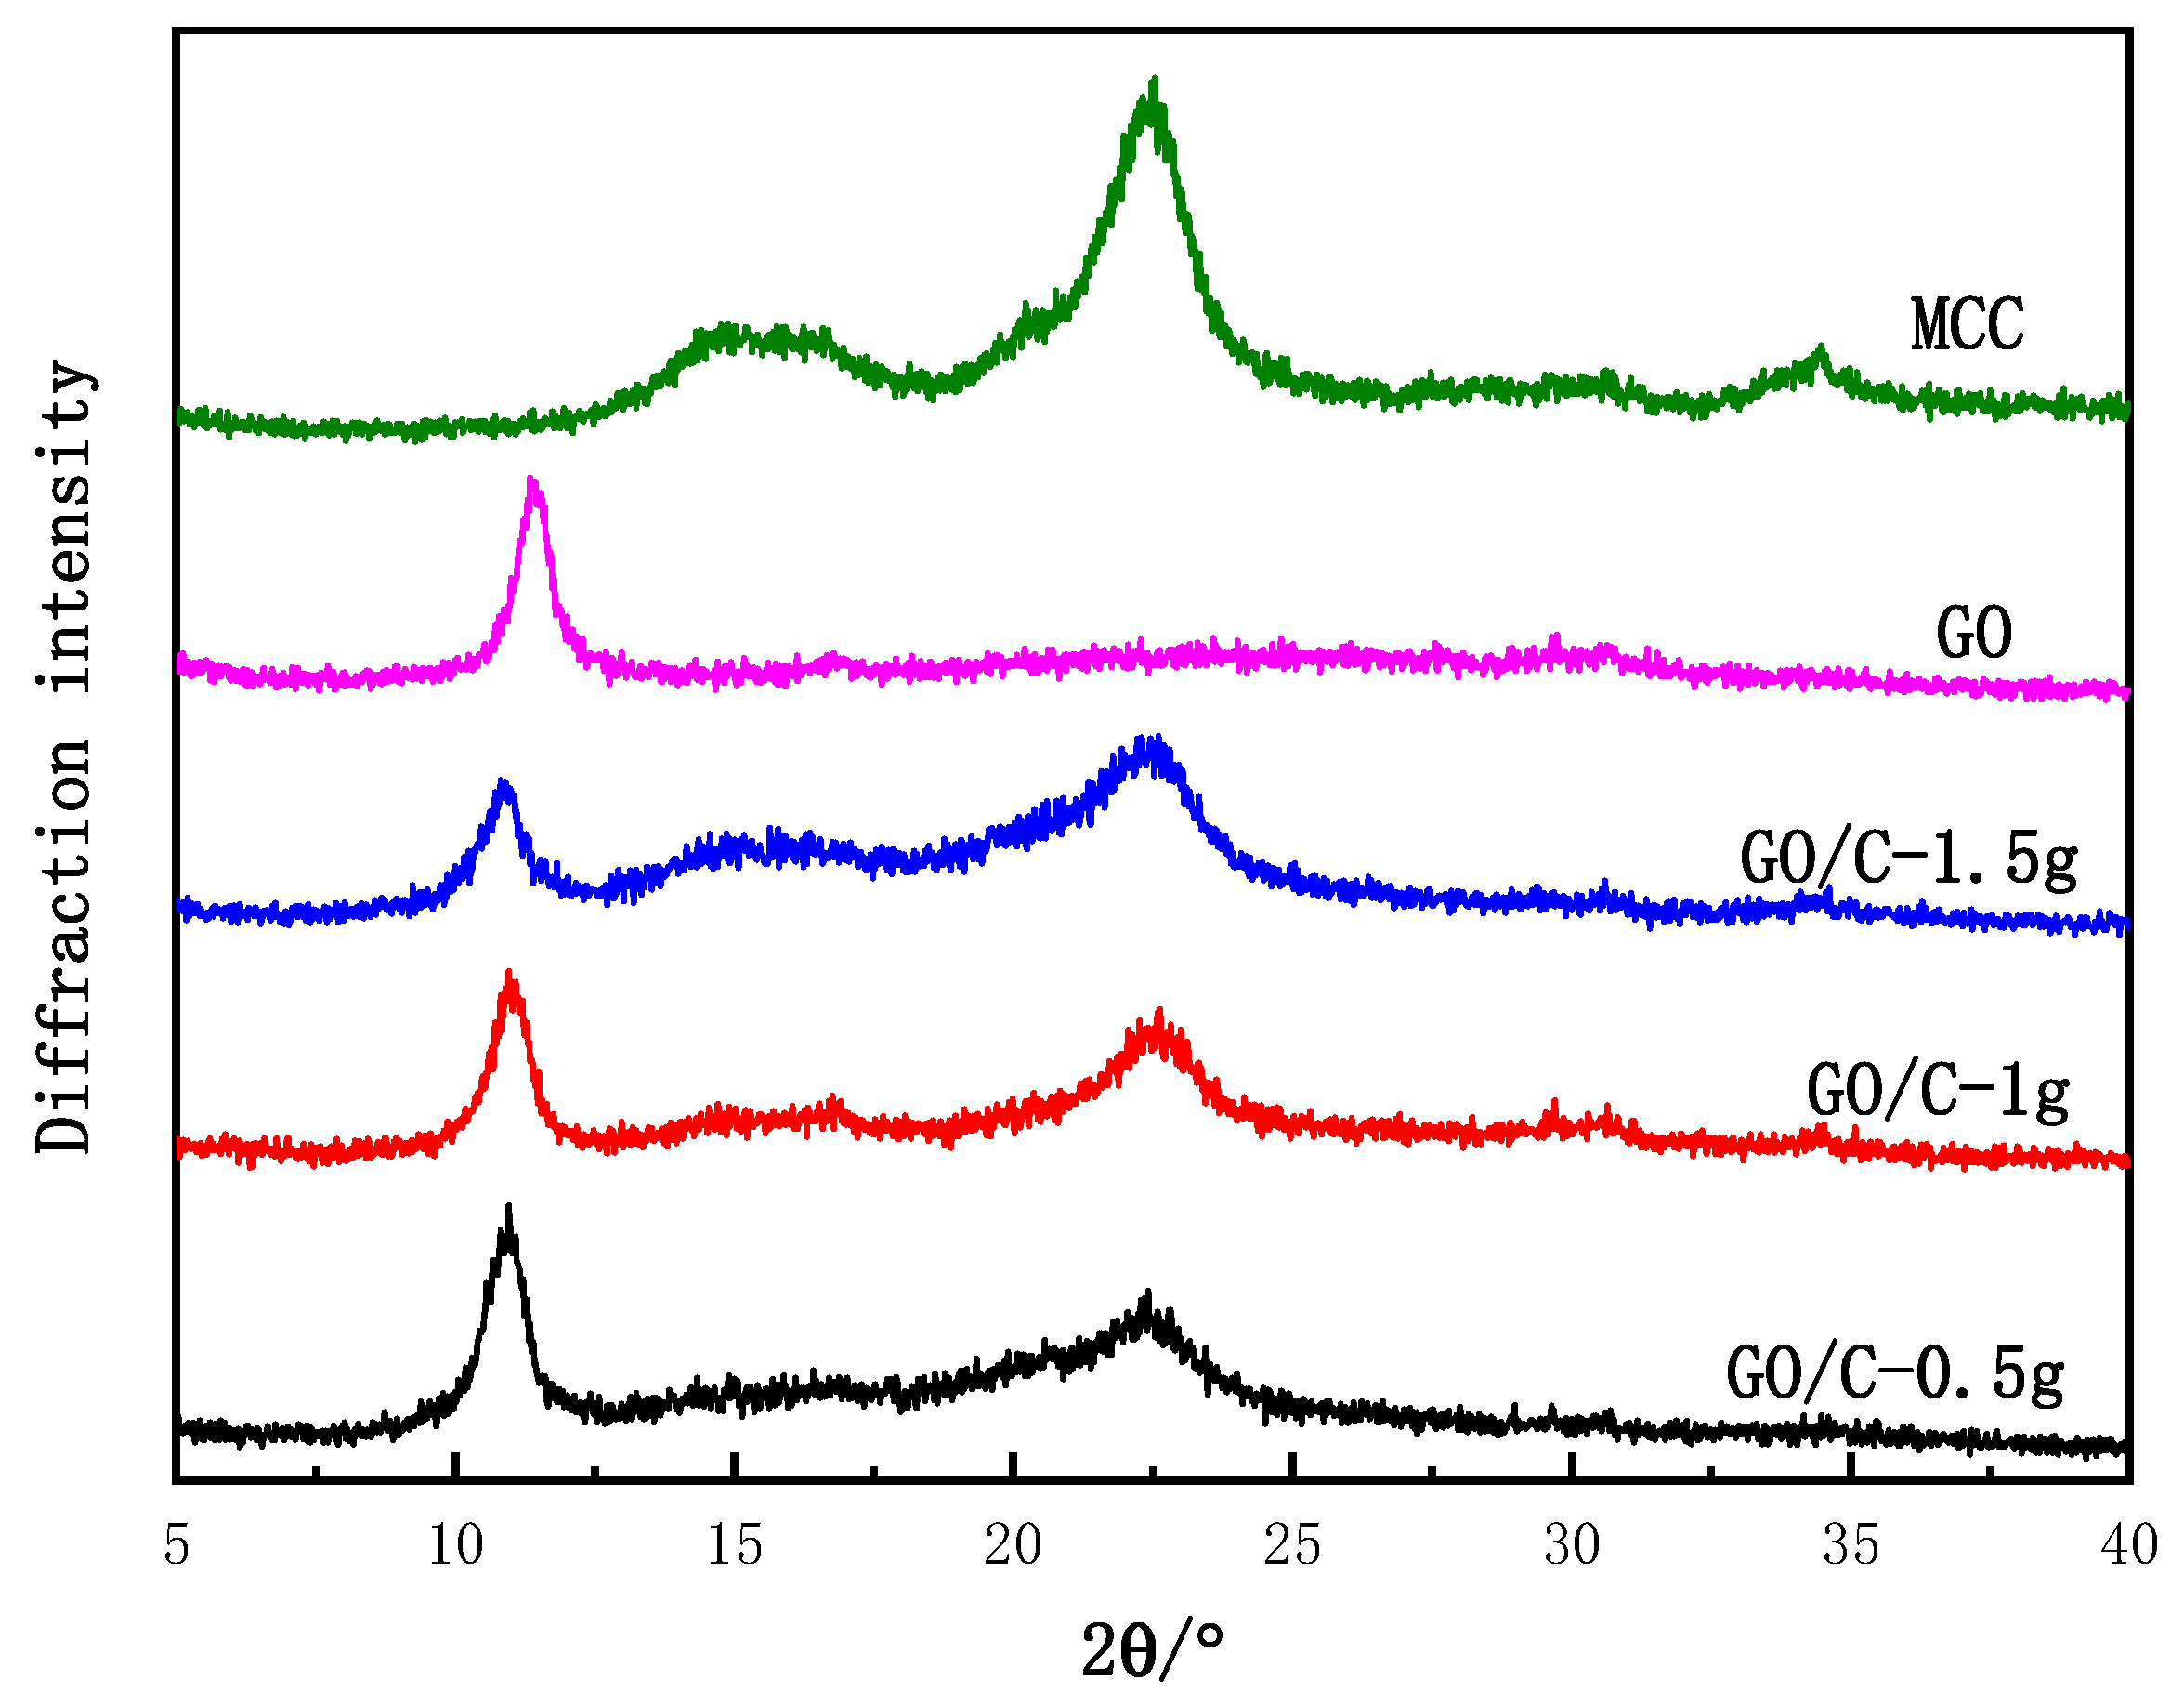
3.2. XRD
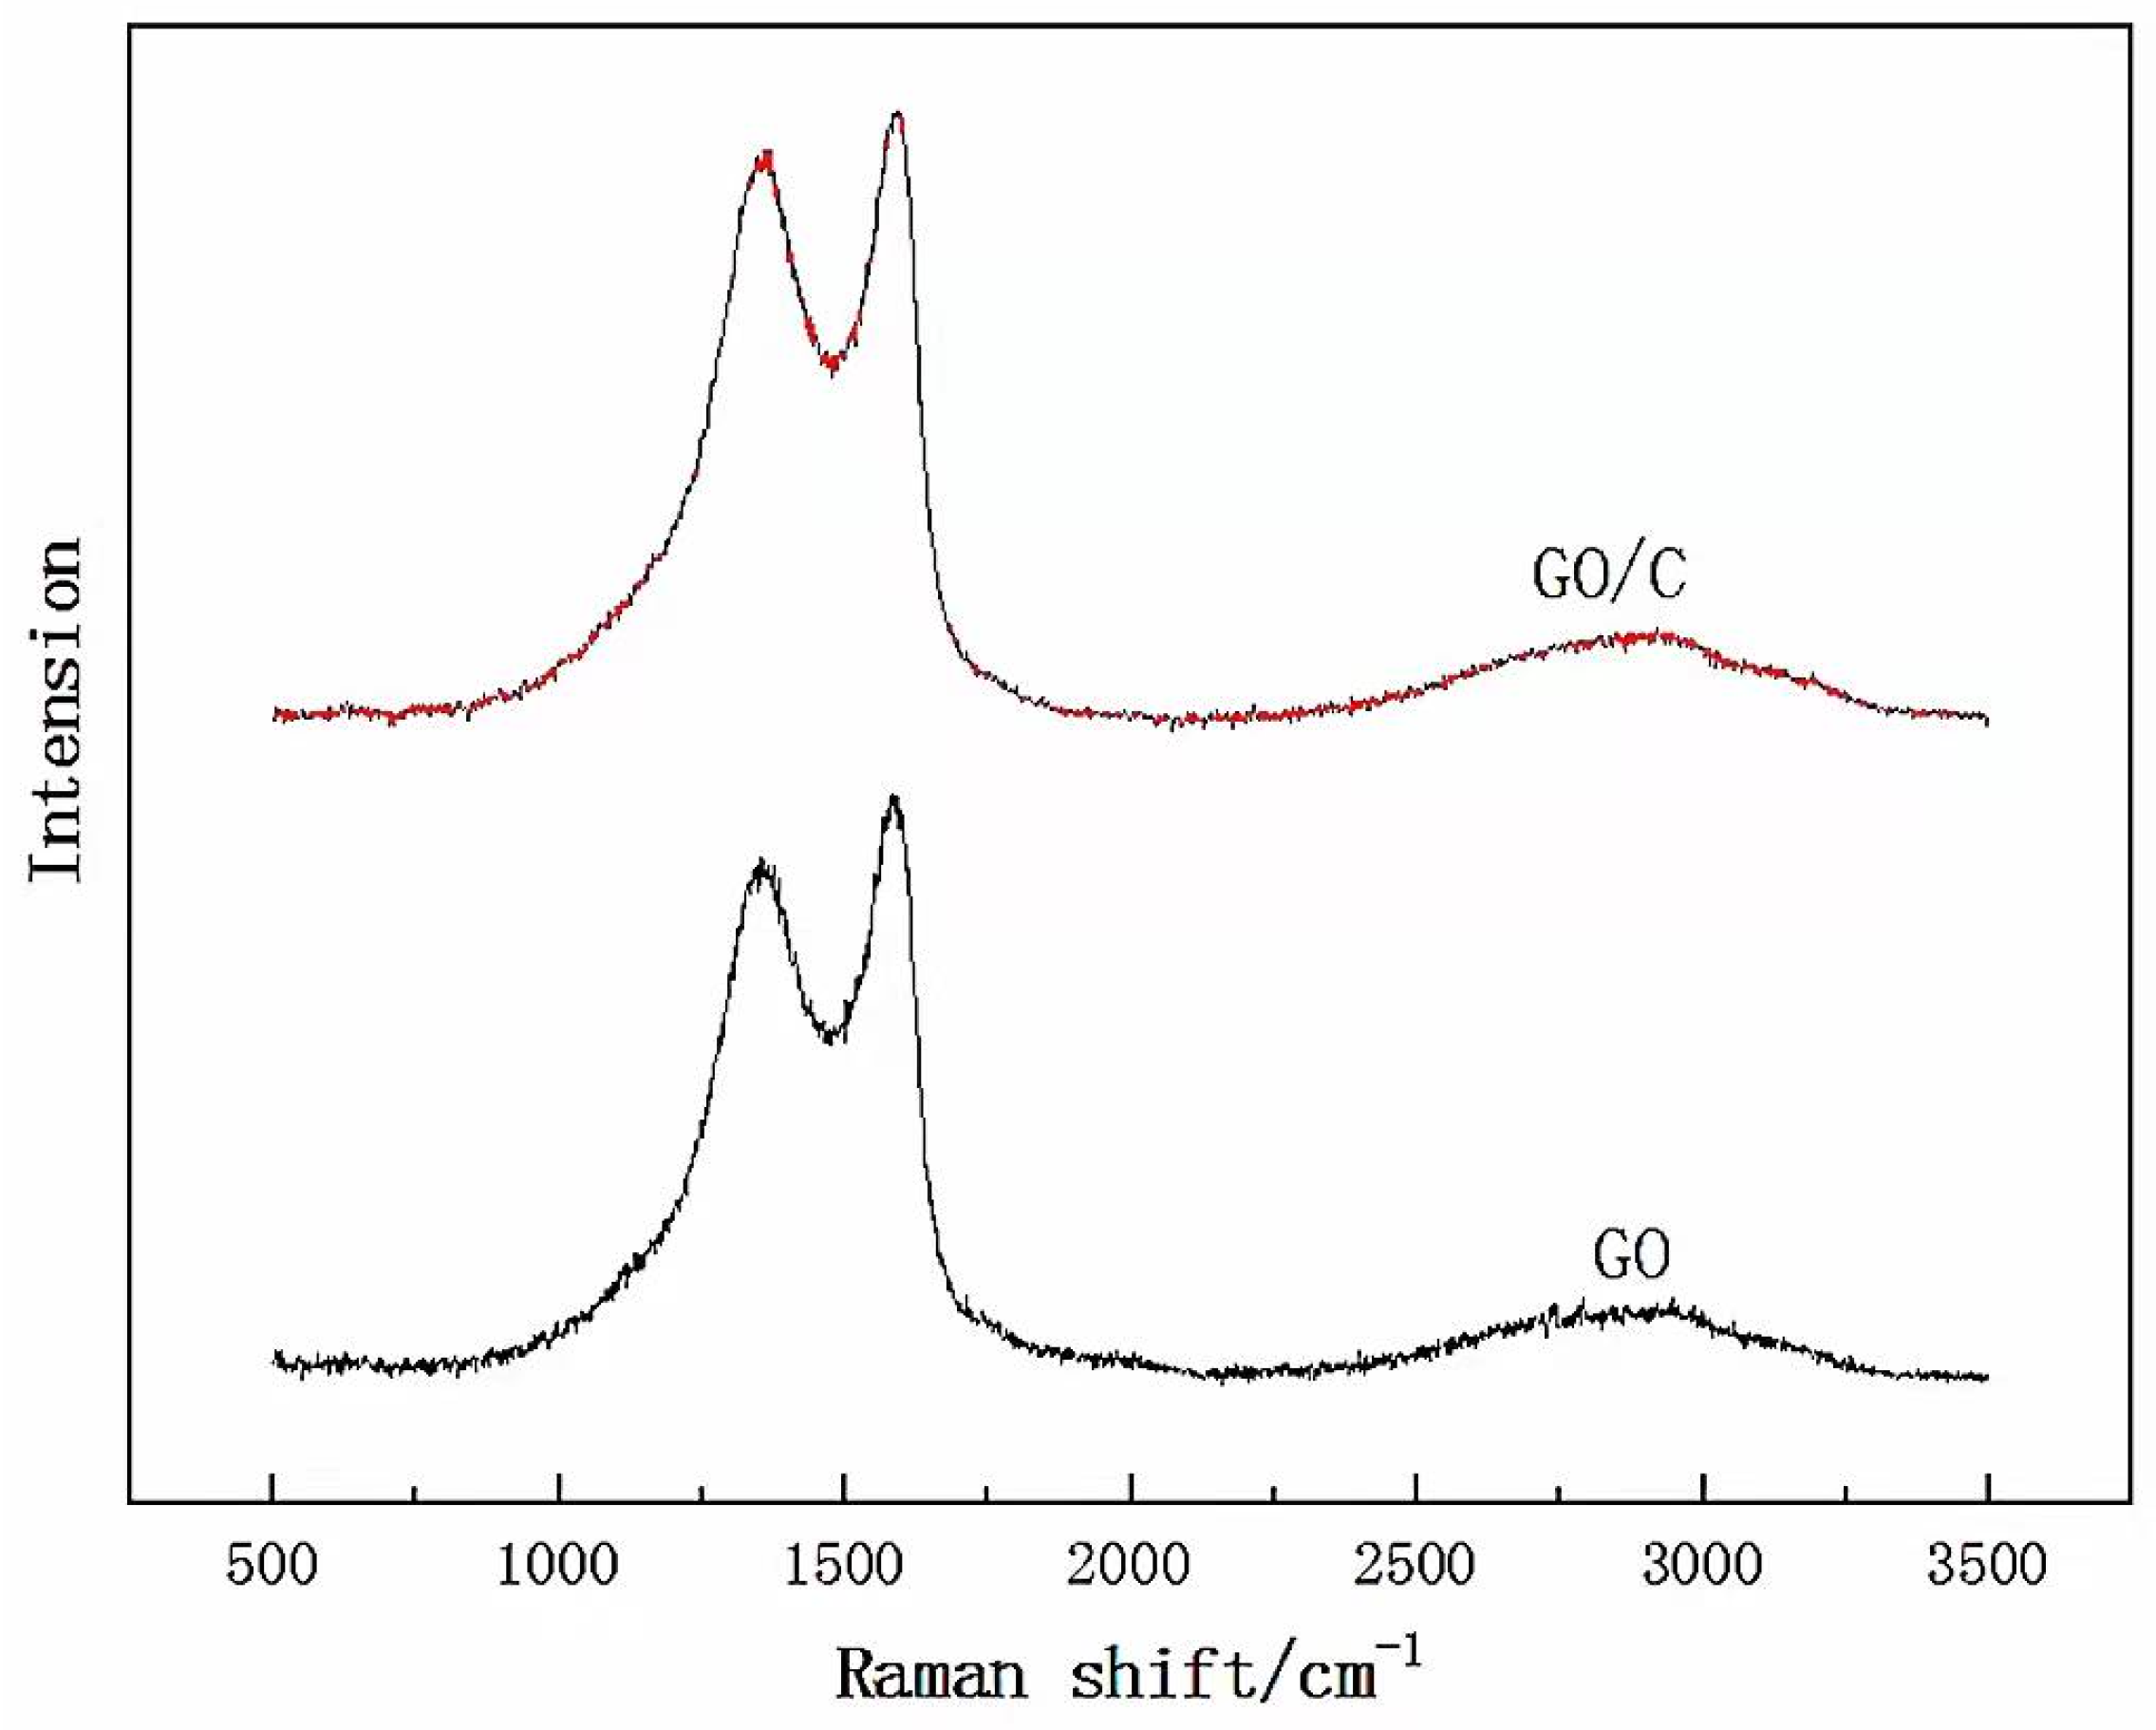
3.3. RDS
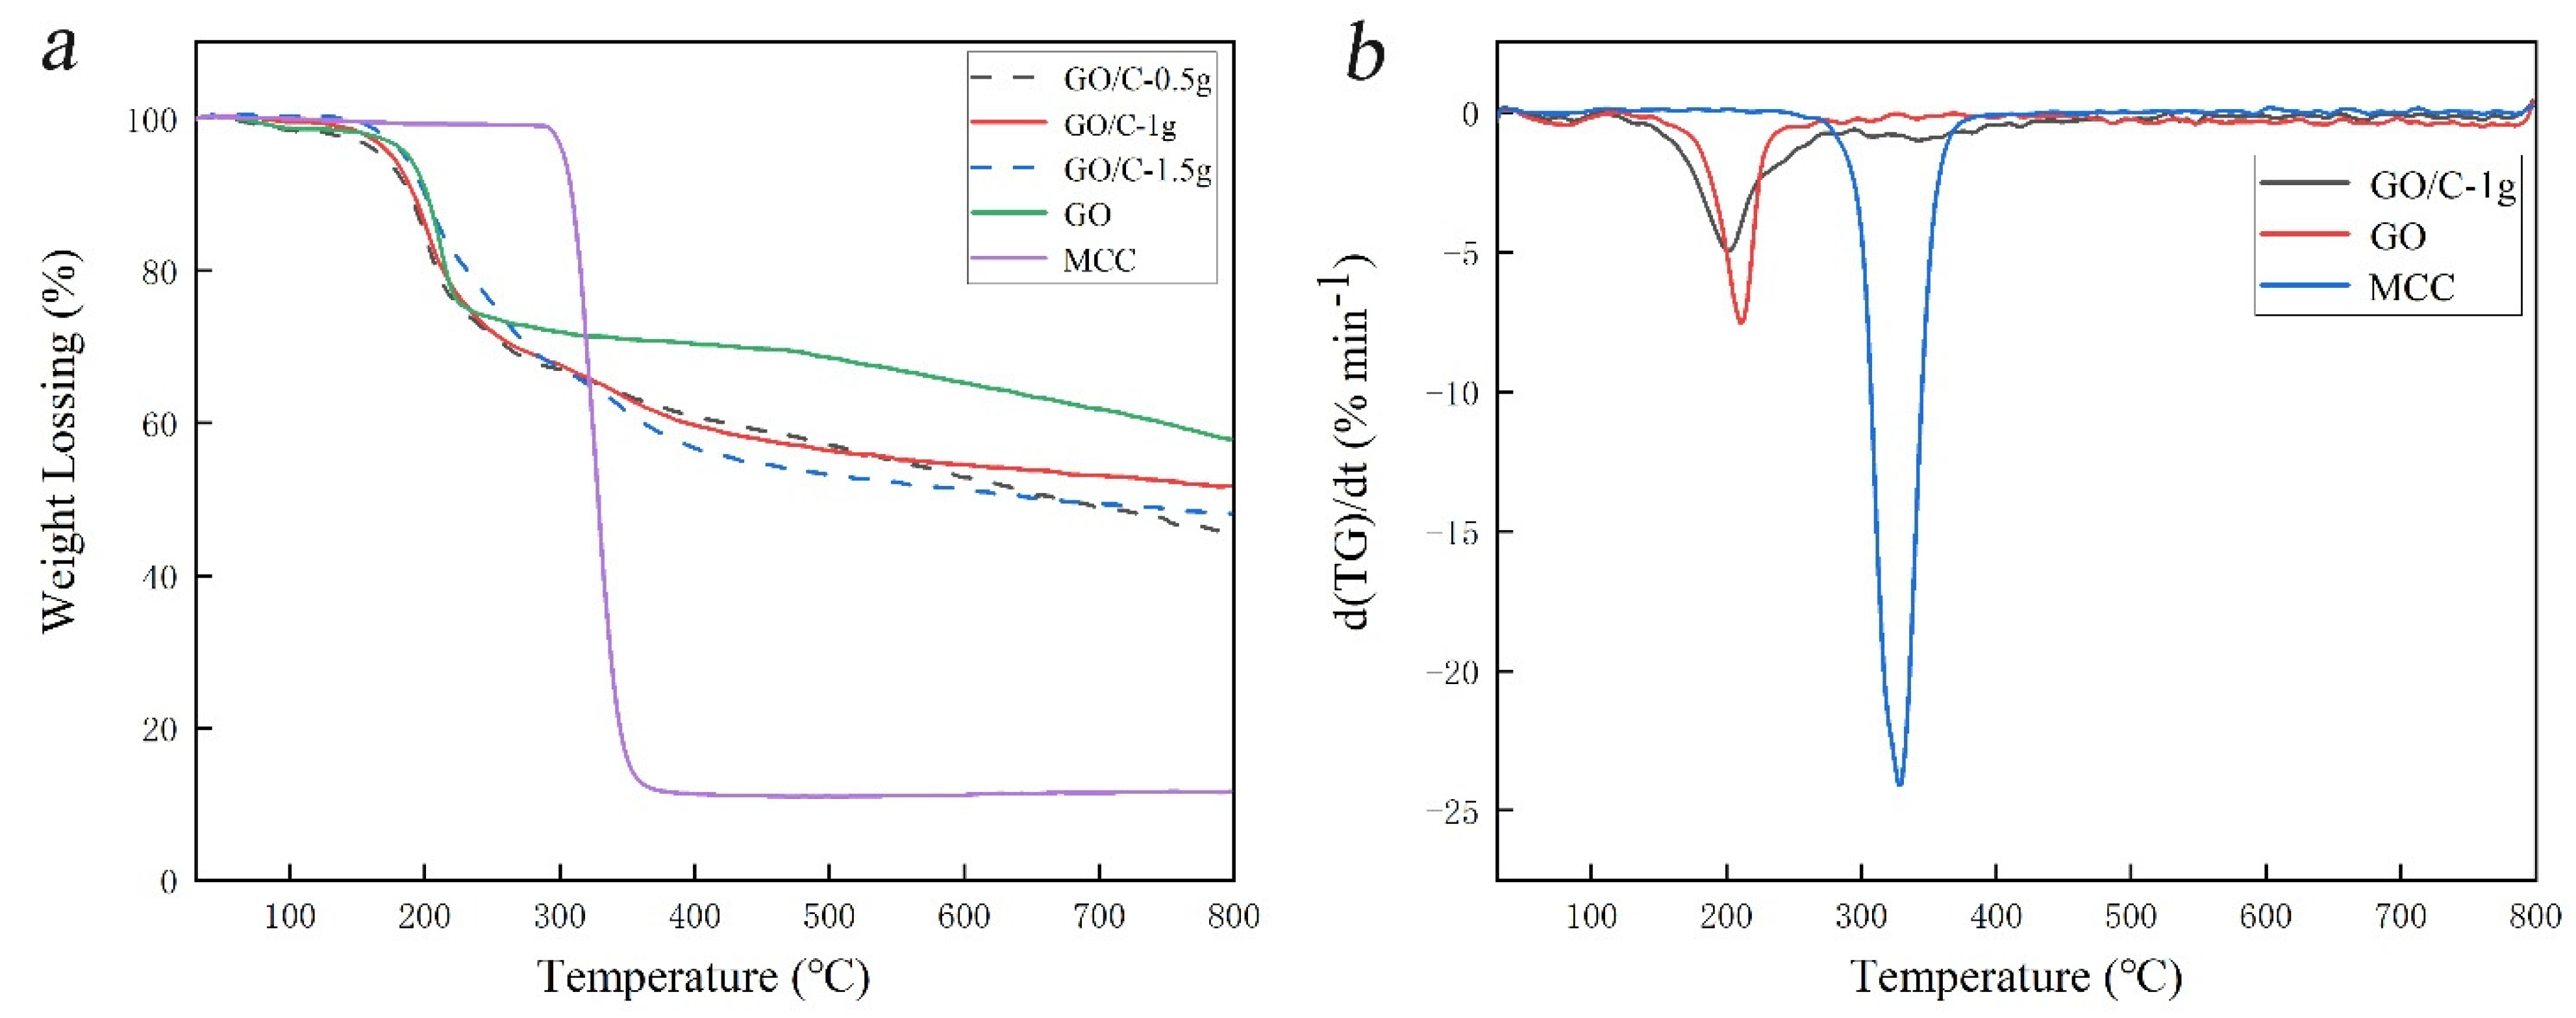
3.4. TG
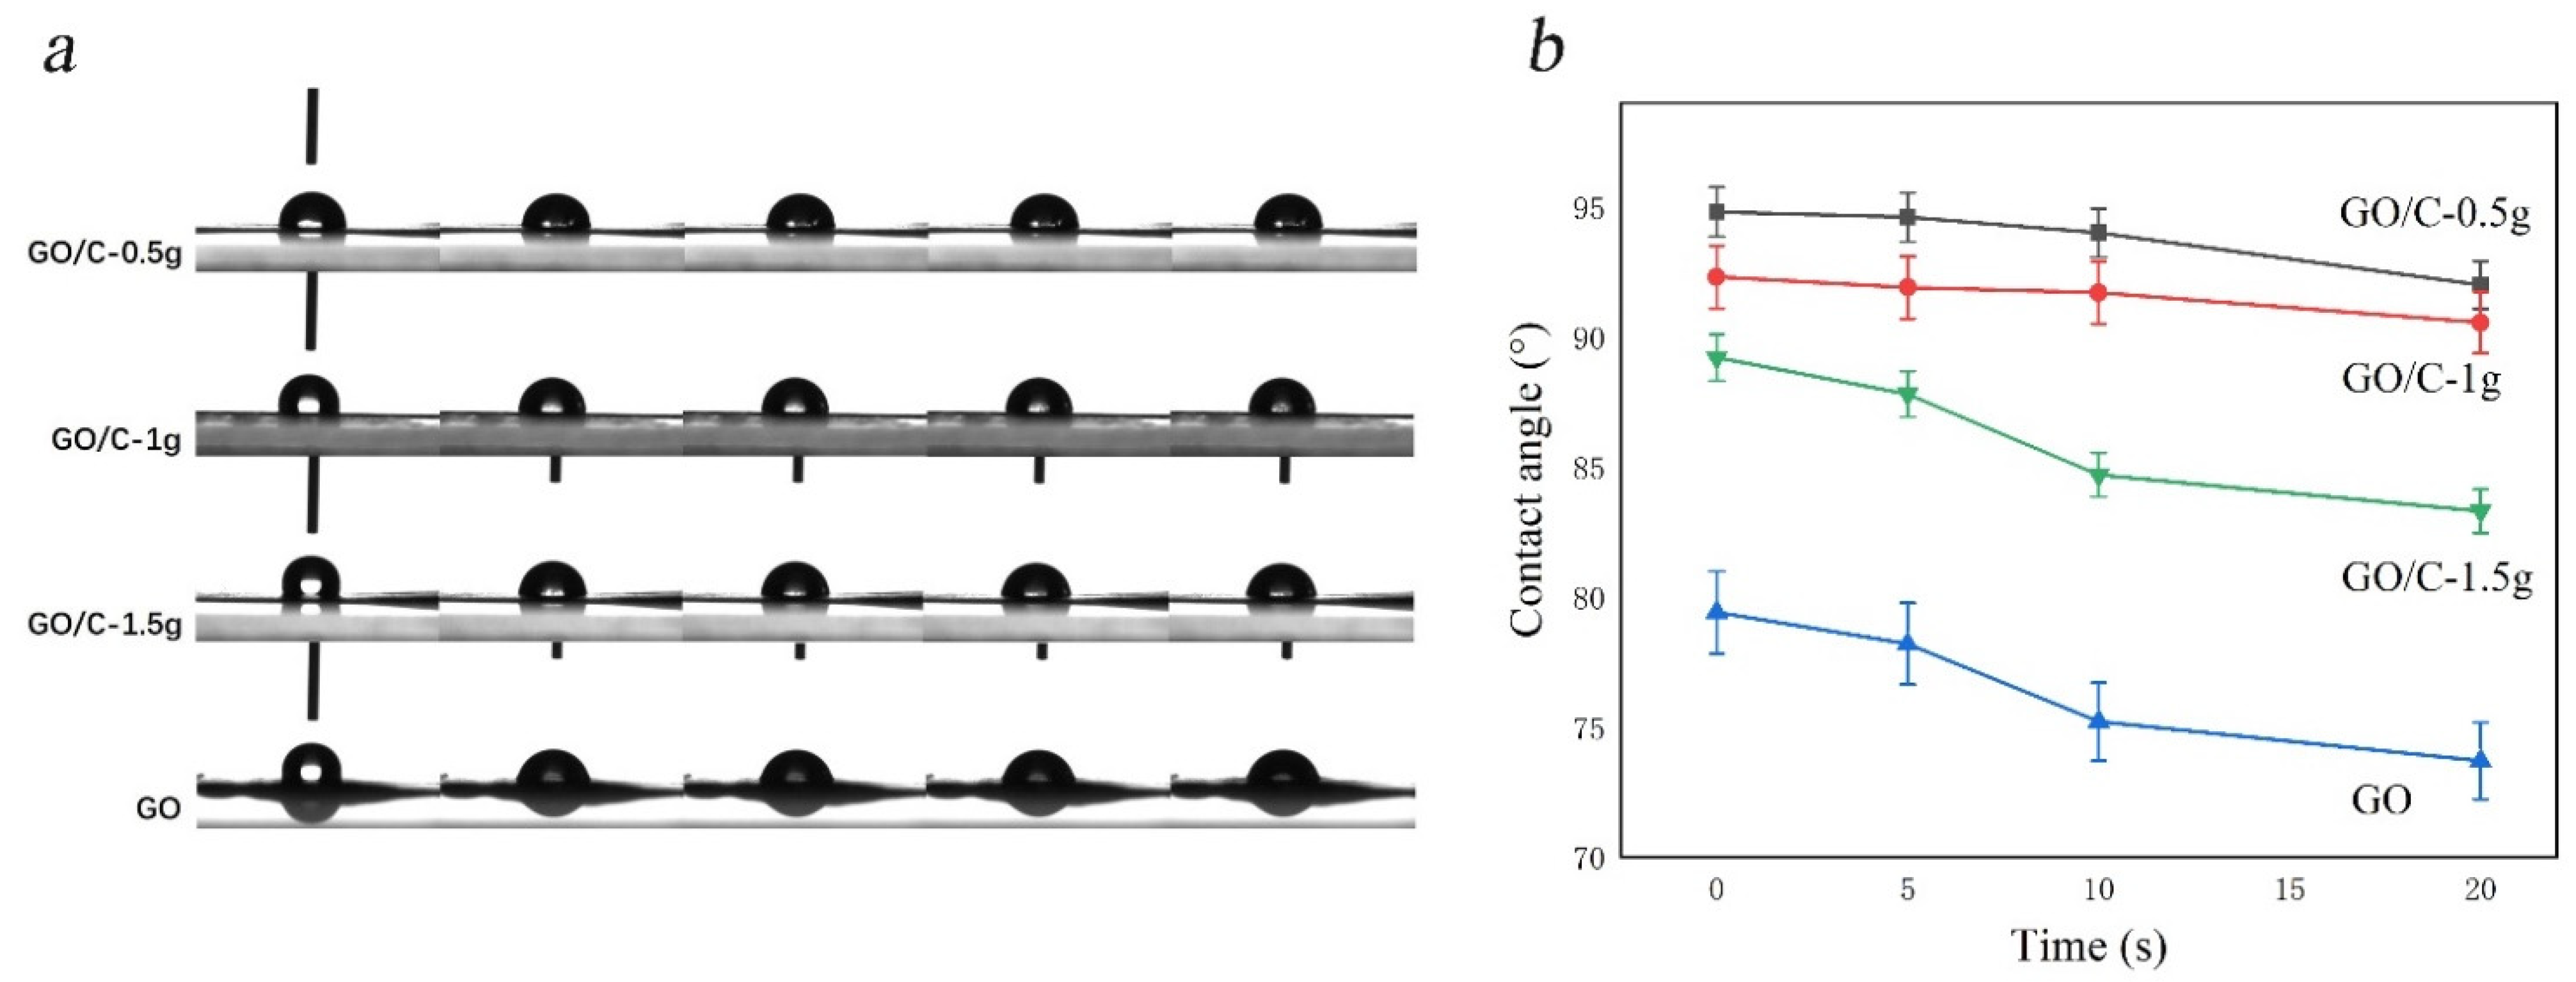
3.5. Contact Angle Test the Initials
4. Conclusions
Author Contributions
Funding
Institutional Review Board Statement
Informed Consent Statement
Data Availability Statement
Conflicts of Interest
References
- Korhonen, J.T.; Kettunen, M.; Ras, R.H.A.; Ikkala, O. Hydrophobic Nanocellulose Aerogels as Floating, Sustainable, Reusable, and Recyclable Oil Absorbents. ACS Appl. Mater. Interfaces 2011, 3, 1813–1816. [Google Scholar] [CrossRef] [PubMed]
- Ulker, Z.; Erkey, C. An emerging platform for drug delivery: Aerogel based systems. J. Control. Release 2014, 177, 51–63. [Google Scholar] [CrossRef]
- Wang, X.Y.; Xie, P.B.; Wan, K.; Miao, Y.Y.; Liu, Z.B.; Li, X.J.; Wang, C.X. Mechanically Strong, Low Thermal Conductivity and Improved Thermal Stability Polyvinyl Alcohol–Graphene–Nanocellulose Aerogel. Gels 2021, 7, 170. [Google Scholar] [CrossRef] [PubMed]
- Li, M.Z.; Wang, X.Y.; Zhao, R.; Miao, Y.Y.; Liu, Z.B. A novel graphene-based micro/nano architecture with high strength and conductivity inspired by multiple creatures. Sci. Rep. 2021, 11, 1387. [Google Scholar] [CrossRef]
- Wang, X.Y.; Wan, K.; Xie, P.B.; Miao, Y.Y.; Liu, Z.B. Ultralight, High Capacitance, Mechanically Strong Graphene-Cellulose Aerogels. Molecules 2021, 26, 4891. [Google Scholar] [CrossRef] [PubMed]
- Li, M.Z.; Miao, Y.Y.; Zhai, X.Y.; Yin, Y.X.; Zhang, Y.T.; Jian, Z.B.; Wang, X.Y.; Sun, L.P.; Liu, Z.B. Preparation of and research on bioinspired graphene oxide/nanocellulose/polydopamine ternary artificial nacre. Mater. Des. 2019, 181, 107961. [Google Scholar] [CrossRef]
- Nair, R.R.; Wu, H.A.; Jayaram, P.N.; Grigorieva, I.V.; Geim, A.K. Unimpeded Permeation of Water Through Helium-Leak-Tight Graphene-Based Membranes. Science 2012, 335, 442–444. [Google Scholar] [CrossRef] [Green Version]
- Chen, J.; Li, C.; Shi, G.Q. Graphene Materials for Electrochemical Capacitors. J. Phys. Chem. Lett. 2013, 4, 1244–1253. [Google Scholar] [CrossRef]
- Feng, Y.; Wang, Z.W.; Zhang, R.X.; Lu, Y.Y.; Huang, Y.Q.; Shen, H.X.; Lv, X.M.; Liu, J. Anti-fouling graphene oxide based nanocomposites membrane for oil-water emulsion separation. Water Sci. Technol. 2018, 77, 1179–1185. [Google Scholar] [CrossRef] [PubMed]
- Li, Q.Z.; Fan, F.; Wang, Y.; Feng, W.; Ji, P.J. Enzyme Immobilization on Carboxyl-Functionalized Graphene Oxide for Catalysis in Organic Solvent. Ind. Eng. Chem. Res. 2013, 52, 6343–6348. [Google Scholar] [CrossRef]
- Liu, J.; Xue, Y.H.; Gao, Y.X.; Yu, D.S.; Durstock, M.; Dai, L.M. Hole and Electron Extraction Layers Based on Graphene Oxide Derivatives for High-Performance Bulk Heterojunction Solar Cells. Adv. Mater. 2012, 24, 2228–2233. [Google Scholar] [CrossRef] [PubMed]
- Cakici, M.; Reddy, K.R.; Alonso-Marroquin, F. Advanced electrochemical energy storage supercapacitors based on the flexible carbon fiber fabric-coated with uniform coral-like MnO2 structured electrodes. Chem. Eng. J. 2017, 309, 151–158. [Google Scholar] [CrossRef]
- Kumar, S.; Bukkitgar, S.D.; Singh, S.; Singh, V.; Reddy, K.R.; Shetti, N.P.; Reddy, C.V.; Sadhu, V.; Naveen, S. Electrochemical Sensors and Biosensors Based on Graphene Functionalized with Metal Oxide Nanostructures for Healthcare Applications. ChemistrySelect 2019, 4, 5322–5337. [Google Scholar] [CrossRef]
- Shetti, N.P.; Malode, S.J.; Nayak, D.S.; Bagihalli, G.B.; Reddy, K.R.; Ravindranadh, K.; Reddy, C.V. A novel biosensor based on graphene oxide-nanoclay hybrid electrode for the detection of Theophylline for healthcare applications. Microchem. J. 2019, 149, 103985. [Google Scholar] [CrossRef]
- Liu, F.C.; Tang, N.J.; Tang, T.; Liu, Y.; Feng, Q.; Zhong, W.; Du, Y.W. Photochemical doping of graphene oxide with nitrogen for photoluminescence enhancement. Appl. Phys. Lett. 2013, 103, 123108. [Google Scholar] [CrossRef]
- Feicht, P.; Siegel, R.; Thurn, H.; Neubauer, J.W.; Seuss, M.; Szabo, T.; Talyzin, A.V.; Halbig, C.E.; Eigler, S.; Kunz, D.A.; et al. Systematic evaluation of different types of graphene oxide in respect to variations in their in-plane modulus. Carbon 2017, 114, 700–705. [Google Scholar] [CrossRef] [Green Version]
- Song, C.; Kim, S. Preparation and Electrochemical Characterization of Pt-Supported Flake-like Graphitic Carbon Nitride on Reduced Graphene Oxide as Fuel Cell Catalysts. J. Electrochem. Soc. 2015, 162, 1181–1190. [Google Scholar] [CrossRef]
- Chen, J.; Yao, B.W.; Li, C.; Shi, G.Q. An improved Hummers method for eco-friendly synthesis of graphene oxide. Carbon 2013, 64, 225–229. [Google Scholar] [CrossRef]
- Marcano, D.C.; Kosynkin, D.V.; Berlin, J.M.; Sinitskii, A.; Sun, Z.Z.; Slesarev, A.; Alemany, L.B.; Lu, W.; Tour, J.M. Improved Synthesis of Graphene Oxide. ACS Nano 2010, 4, 4806–4814. [Google Scholar] [CrossRef]
- Yu, H.T.; Zhang, B.W.; Bulin, C.K.; Li, R.H.; Xing, R.G. High-efficient Synthesis of Graphene Oxide Based on Improved Hummers Method. Sci. Rep. 2016, 6, 36143. [Google Scholar] [CrossRef] [Green Version]
- Guo, M.H.; Jiang, Y.H.; Zhang, S. Photocatalytic Degradation of Methyl Orange by Cerium Zirconium Solid Solution Prepared from Wood Fiber Bionics. J. For. Eng. 2021, 37, 50–55. [Google Scholar]
- Chen, W.S.; Yu, H.P.; Lee, S.Y.; Wei, T.; Li, J.; Fan, Z.J. Nanocellulose: A promising nanomaterial for advanced electrochemical energy storage. Chem. Soc. Rev. 2018, 47, 2837–2872. [Google Scholar] [CrossRef]
- Geng, H.Q.; Jin, H.; Zhou, X.J.; Lu, J.B.; Li, X.L.; Zhao, J.Y. Evaluation and Quantification of Wood 3D Pore Structure via X-CT Technology. J. For. Eng. 2021, 37, 43–49. [Google Scholar]
- Lisuzzo, L.; Wicklein, B.; Lo Dico, G.; Lazzara, G.; del Real, G.; Aranda, P.; Ruiz-Hitzky, E. Functional biohybrid materials based on halloysite, sepiolite and cellulose nanofibers for health applications. Dalton Trans. 2020, 49, 3830–3840. [Google Scholar] [CrossRef] [Green Version]
- Lisuzzo, L.; Caruso, M.R.; Cavallaro, G.; Milioto, S.; Lazzara, G. Hydroxypropyl Cellulose Films Filled with Halloysite Nanotubes/Wax Hybrid Microspheres. Ind. Eng. Chem. Res. 2021, 60, 1656–1665. [Google Scholar] [CrossRef]
- Solovov, R.; Perevoznikova, A.; Seliverstov, A.; Shapagin, A.; Fedoseev, A.; Milyutin, V.; Ershov, B. Physicochemical and sorptive properties of a phosphorylated mercerized cotton fabric. Polymers 2021, 13, 3756. [Google Scholar] [CrossRef] [PubMed]
- Zeng, H.; Hu, Z.; Peng, C.; Deng, L.; Liu, S. Effective adsorption and sensitive detection of Cr(VI) by chitosan/cellulose nanocrystals grafted with carbon dots composite hydrogel. Polymers 2021, 13, 3788. [Google Scholar] [CrossRef]
- Siro, I.; Plackett, D. Microfibrillated cellulose and new nanocomposite materials: A review. Cellulose 2010, 17, 459–494. [Google Scholar] [CrossRef]
- Wang, J.X.; Hao, L.; Wang, J.J.; Wang, Y.C. Processes and Performances of Chinese Oak Veneers Modified with Low-salt Rective Red Dyes. J. For. Eng. 2020, 36, 51–57. [Google Scholar]
- Zhang, J.; Cao, Y.W.; Feng, J.C.; Wu, P.Y. Graphene-Oxide-Sheet-Induced Gelation of Cellulose and Promoted Mechanical Properties of Composite Aerogels. J. Phys. Chem. C 2012, 116, 8063–8068. [Google Scholar] [CrossRef]
- Miao, Y.Y.; Zhang, C.Y.; Huang, D.J.; Tian, L.; Zhao, T.J.; Zhai, X.Y.; Liu, Z.B. Preparation of graphene oxide /cellulose composite in mixed acid solution derived from Hummers method. J. For. Eng. 2018, 3, 97–102. [Google Scholar]
- Wei, X.; Huang, T.; Yang, J.H.; Zhang, N.; Wang, Y.; Zhou, Z.W. Green synthesis of hybrid graphene oxide/microcrystalline cellulose aerogels and their use as superabsorbents. J. Hazard. Mater. 2017, 335, 28–38. [Google Scholar] [CrossRef] [PubMed]
- Hong, B.J.; Compton, O.C.; An, Z.; Eryazici, I.; Nguyen, S.T. Successful Stabilization of Graphene Oxide in Electrolyte Solutions: Enhancement of Biofunctionalization and Cellular Uptake. ACS Nano 2012, 6, 63–73. [Google Scholar] [CrossRef] [Green Version]
- Mianehrow, H.; Moghadam, M.H.M.; Sharif, F.; Mazinani, S. Graphene-oxide stabilization in electrolyte solutions using hydroxyethyl cellulose for drug delivery application. Int. J. Pharm. 2015, 484, 276–282. [Google Scholar] [CrossRef] [PubMed]
- Ferreira, E.S.; da Silva, D.S.; Burgo, T.A.L.; Batista, B.C.; Galembeck, F. Graphite exfoliation in cellulose solutions. Nanoscale 2017, 9, 10219–10226. [Google Scholar] [CrossRef] [PubMed]
- Kim, C.J.; Khan, W.; Kim, D.H.; Cho, K.S.; Park, S.Y. Graphene oxide/cellulose composite using NMMO monohydrate. Carbohydr. Polym. 2011, 86, 903–909. [Google Scholar] [CrossRef]
- Gao, K.Z.; Shao, Z.Q.; Wu, X.; Wang, X.; Li, J.; Zhang, Y.H.; Wang, W.J.; Wang, F.J. Cellulose nanofibers/reduced graphene oxide flexible transparent conductive paper. Carbohydr. Polym. 2013, 97, 243–251. [Google Scholar] [CrossRef] [PubMed]
- Yang, J.; Zhang, E.W.; Li, X.F.; Zhang, Y.T.; Qu, J.; Yu, Z.Z. Cellulose/graphene aerogel supported phase change composites with high thermal conductivity and good shape stability for thermal energy storage. Carbon 2016, 98, 50–57. [Google Scholar] [CrossRef]
- Li, Y.Y.; Zhu, H.L.; Zhu, S.Z.; Wan, J.Y.; Liu, Z.; Vaaland, O.; Lacey, S.; Fang, Z.Q.; Dai, H.Q.; Li, T.; et al. Hybridizing wood cellulose and graphene oxide toward high-performance fibers. NPG Asia Mater. 2015, 7, e150. [Google Scholar] [CrossRef] [Green Version]
- Zhang, Y.M.; Wang, F.; Zhang, D.D.; Chen, J.; Zhu, H.; Zhou, L.C.; Chen, Z. New type multifunction porous aerogels for supercapacitors and absorbents based on cellulose nanofibers and graphene. Mater. Lett. 2017, 208, 73–76. [Google Scholar] [CrossRef]
- Song, L.F.; Li, Y.Q.; Xiong, Z.Q.; Pan, L.L.; Luo, Q.Y.; Xu, X.; Lu, S.R. Water-Induced shape memory effect of nanocellulose papers from sisal cellulose nanofibers with graphene oxide. Carbohydr. Polym. 2018, 179, 110–117. [Google Scholar] [CrossRef]
- Zhang, X.M.; Liu, X.Q.; Zheng, W.G.; Zhu, J. Regenerated cellulose/graphene nanocomposite films prepared in DMAC/LiCl solution. Carbohydr. Polym. 2012, 88, 26–30. [Google Scholar] [CrossRef]
- Han, D.L.; Yan, L.F.; Chen, W.F.; Li, W.; Bangal, P.R. Cellulose/graphite oxide composite films with improved mechanical properties over a wide range of temperature. Carbohydr. Polym. 2011, 83, 966–972. [Google Scholar] [CrossRef]
- Zhang, C.; Zhang, R.Z.; Ma, Y.Q.; Guan, W.B.; Wu, X.L.; Liu, X.; Li, H.; Du, Y.L.; Pan, C.P. Preparation of Cellulose/Graphene Composite and Its Applications for Triazine Pesticides Adsorption from Water. ACS Sustain. Chem. Eng. 2015, 3, 396–405. [Google Scholar] [CrossRef]
- Sadasivuni, K.K.; Kafy, A.; Zhai, L.D.; Ko, H.U.; Mun, S.; Kim, J. Transparent and Flexible Cellulose Nanocrystal/Reduced Graphene Oxide Film for Proximity Sensing. Small 2015, 11, 994–1002. [Google Scholar] [CrossRef]
- Kafy, A.; Sadasivuni, K.K.; Kim, H.C.; Akther, A.; Kim, J. Designing flexible energy and memory storage materials using cellulose modified graphene oxide nanocomposites. Phys. Chem. Chem. Phys. 2015, 17, 5923–5931. [Google Scholar] [CrossRef]
- Tucureanu, V.; Matei, A.; Avram, A.M. FTIR Spectroscopy for Carbon Family Study. Crit. Rev. Anal. Chem. 2016, 46, 502–520. [Google Scholar] [CrossRef] [PubMed]
- Chen, W.F.; Yan, L.F.; Bangal, P.R. Preparation of graphene by the rapid and mild thermal reduction of graphene oxide induced by microwaves. Carbon 2010, 48, 1146–1152. [Google Scholar] [CrossRef]
- Li, D.; Muller, M.B.; Gilje, S.; Kaner, R.B.; Wallace, G.G. Processable aqueous dispersions of graphene nanosheets. Nat. Nanotechnol. 2008, 3, 101–105. [Google Scholar] [CrossRef]
- Atienza, J.; Aragon, P.; Herrero, M.A.; Puchades, R.; Maquieira, A. State of the art in the determination of MTBE in natural waters and soils. Crit. Rev. Anal. Chem. 2005, 35, 317–337. [Google Scholar] [CrossRef]
- Stobinski, L.; Lesiak, B.; Malolepszy, A.; Mazurkiewicz, M.; Mierzwa, B.; Zemek, J.; Jiricek, P.; Bieloshapka, I. Graphene oxide and reduced graphene oxide studied by the XRD, TEM and electron spectroscopy methods. J. Electron Spectrosc. Relat. Phenom. 2014, 195, 145–154. [Google Scholar] [CrossRef]
- Yao, W.Q.; Weng, Y.Y.; Catchmark, J.M. Improved cellulose X-ray diffraction analysis using Fourier series modeling. Cellulose 2020, 27, 5563–5579. [Google Scholar] [CrossRef]
- Henrique, M.A.; Neto, W.P.F.; Silverio, H.A.; Martins, D.F.; Gurgel, L.V.A.; Barud, H.D.; de Morais, L.C.; Pasquini, D. Kinetic study of the thermal decomposition of cellulose nanocrystals with different polymorphs, cellulose I and II, extracted from different sources and using different types of acids. Ind. Crops Prod. 2015, 76, 128–140. [Google Scholar] [CrossRef] [Green Version]
- Devan, P.K.; Mahalakshmi, N.V. Study of the performance, emission and combustion characteristics of a diesel engine using poon oil-based fuels. Fuel Process. Technol. 2009, 90, 513–519. [Google Scholar] [CrossRef]
- Scully, S.F.; Bissessur, R.; MacLean, K.W.; Dahn, D.C. Inclusion of poly[bis(methoxyethoxyethoxy)phosphazene] into layered graphite oxide. Solid State Ion. 2009, 180, 216–221. [Google Scholar] [CrossRef]
- Roman, M.; Winter, W.T. Effect of sulfate groups from sulfuric acid hydrolysis on the thermal degradation behavior of bacterial cellulose. Biomacromolecules 2004, 5, 1671–1677. [Google Scholar] [CrossRef]
- Oksman, K.; Etang, J.A.; Mathew, A.P.; Jonoobi, M. Cellulose nanowhiskers separated from a bio-residue from wood bioethanol production. Biomass Bioenergy 2011, 35, 146–152. [Google Scholar] [CrossRef]
- Leppanen, K.; Andersson, S.; Torkkeli, M.; Knaapila, M.; Kotelnikova, N.; Serimaa, R. Structure of cellulose and microcrystalline cellulose from various wood species, cotton and flax studied by X-ray scattering. Cellulose 2009, 16, 999–1015. [Google Scholar] [CrossRef]
- Kupiainen, L.; Ahola, J.; Tanskanen, J. Distinct Effect of Formic and Sulfuric Acids on Cellulose Hydrolysis at High Temperature. Ind. Eng. Chem. Res. 2012, 51, 3295–3300. [Google Scholar] [CrossRef]
- Huang, W.J.; Wang, Y.X.; Zhang, L.N.; Chen, L.Y. Rapid dissolution of spruce cellulose in H2SO4 aqueous solution at low temperature. Cellulose 2016, 23, 3463–3473. [Google Scholar] [CrossRef]
- Chen, W.S.; Yu, H.P.; Liu, Y.X.; Jiang, N.X.; Chen, P. A Method for Isolating Cellulose Nanofibrils from Wood and Their Morphological Characteristics. Acta Polym. Sin. 2010, 41, 1320–1326. [Google Scholar] [CrossRef]
- Elazzouzi-Hafraoui, S.; Nishiyama, Y.; Putaux, J.L.; Heux, L.; Dubreuil, F.; Rochas, C. The shape and size distribution of crystalline nanoparticles prepared by acid hydrolysis of native cellulose. Biomacromolecules 2008, 9, 57–65. [Google Scholar] [CrossRef] [PubMed]
- Gao, Y.R.; Huang, P.; Sun, P.P.; Wu, M.; Huang, Y. Preparation and Application of Graphene/Cellulose Composites. Prog. Chem. 2016, 28, 647–656. [Google Scholar]


| Peak Position | Peak Intensity | Half-Height Width | Integral Area | R | |||||
|---|---|---|---|---|---|---|---|---|---|
| D | G | D | G | D | G | D | G | Value | |
| GO | 1371.05 | 1585.88 | 959.16 | 1002.08 | 282.21 | 107.28 | 430,892.93 | 275,297.52 | 1.57 |
| GO/C-1 g | 1368.72 | 1588.97 | 1041.26 | 1057.33 | 288.41 | 103.90 | 476,112.35 | 294,397.92 | 1.62 |
| Sample Code | 1T0/°C | 2Tmax/°C | 3Tf/°C | 4M800/% |
|---|---|---|---|---|
| MCC | 307 | 328.8 | 345.0 | 11.66 |
| GO | 194 | 211.0 | 223.1 | 57.79 |
| GO/C-0.5 g | 177 | 201.7 | 233.6 | 45.53 |
| GO/C-1 g | 175 | 201.6 | 253.7 | 51.84 |
| GO/C-1.5 g | 169 | 204.0 | 297.2 | 48.12 |
Publisher’s Note: MDPI stays neutral with regard to jurisdictional claims in published maps and institutional affiliations. |
© 2021 by the authors. Licensee MDPI, Basel, Switzerland. This article is an open access article distributed under the terms and conditions of the Creative Commons Attribution (CC BY) license (https://creativecommons.org/licenses/by/4.0/).
Share and Cite
Miao, Y.; Wang, X.; Liu, Y.; Liu, Z.; Chen, W. Preparation of Graphene Oxide/Cellulose Composites with Microcrystalline Cellulose Acid Hydrolysis Using the Waste Acids Generated by the Hummers Method of Graphene Oxide Synthesis. Polymers 2021, 13, 4453. https://doi.org/10.3390/polym13244453
Miao Y, Wang X, Liu Y, Liu Z, Chen W. Preparation of Graphene Oxide/Cellulose Composites with Microcrystalline Cellulose Acid Hydrolysis Using the Waste Acids Generated by the Hummers Method of Graphene Oxide Synthesis. Polymers. 2021; 13(24):4453. https://doi.org/10.3390/polym13244453
Chicago/Turabian StyleMiao, Yuanyuan, Xiuya Wang, Yixing Liu, Zhenbo Liu, and Wenshuai Chen. 2021. "Preparation of Graphene Oxide/Cellulose Composites with Microcrystalline Cellulose Acid Hydrolysis Using the Waste Acids Generated by the Hummers Method of Graphene Oxide Synthesis" Polymers 13, no. 24: 4453. https://doi.org/10.3390/polym13244453