
New Considerations on the Determination of the Apparent Shear Viscosity of Polymer Melt with Micro Capillary Dies


Abstract
:
1. Introduction
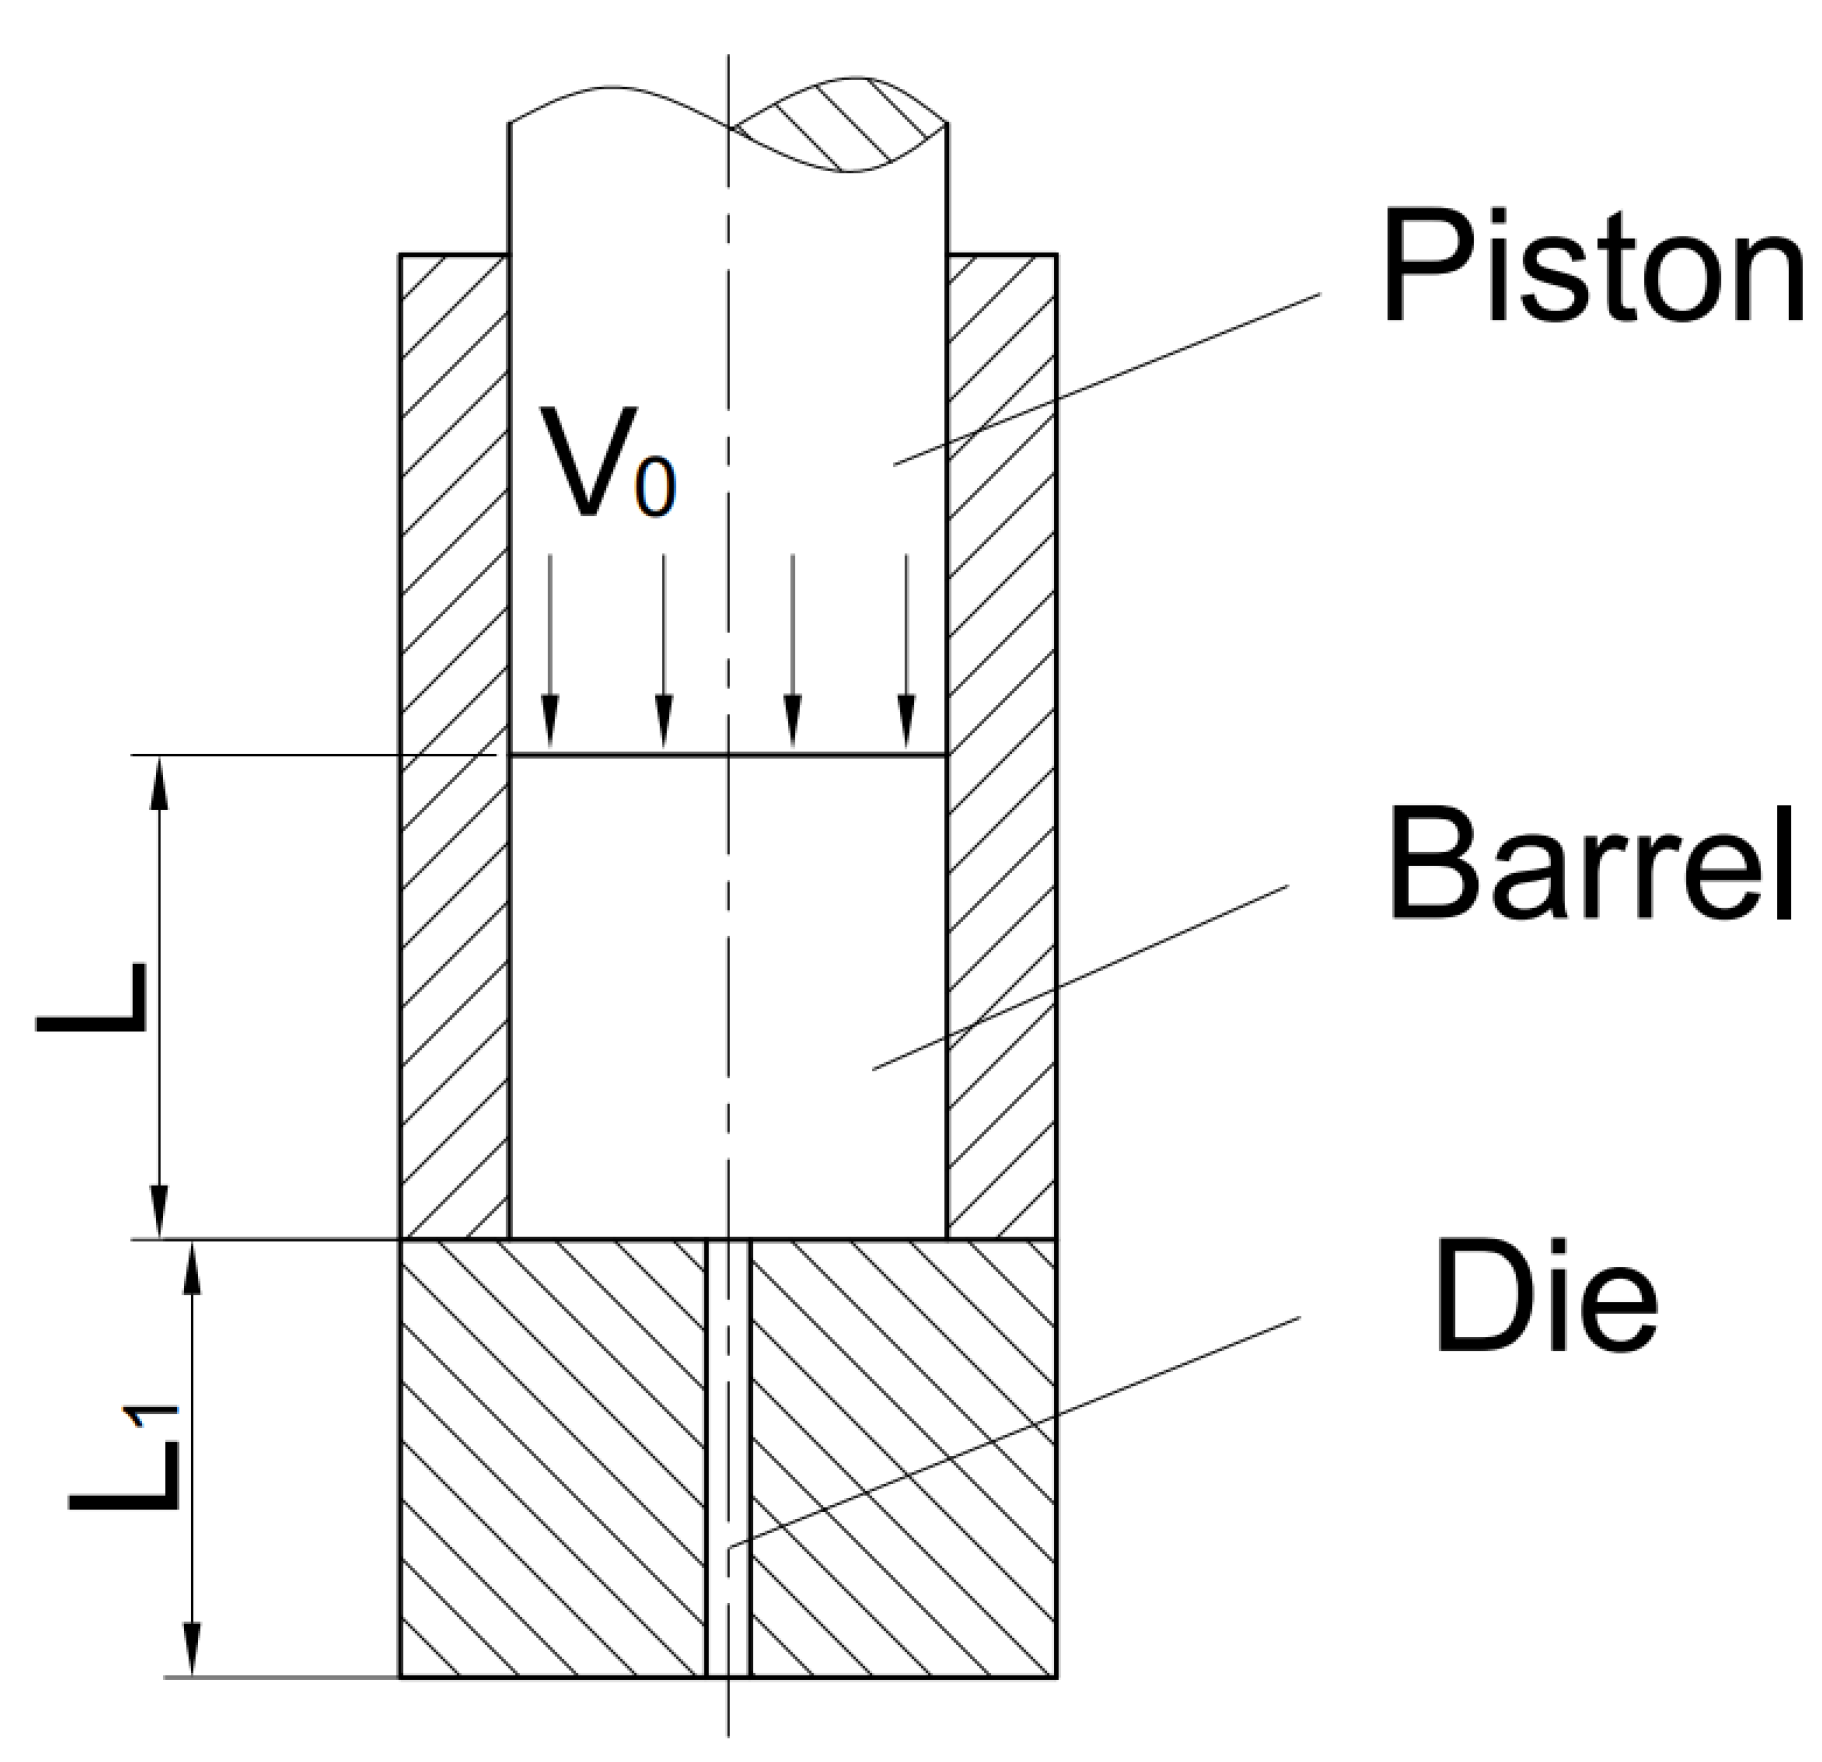
2. Modeling
- the initial pressure in the barrel is 0 Pa;
- the melt is a Newtonian fluid, its apparent shear viscosity η does not change with the shear rate;
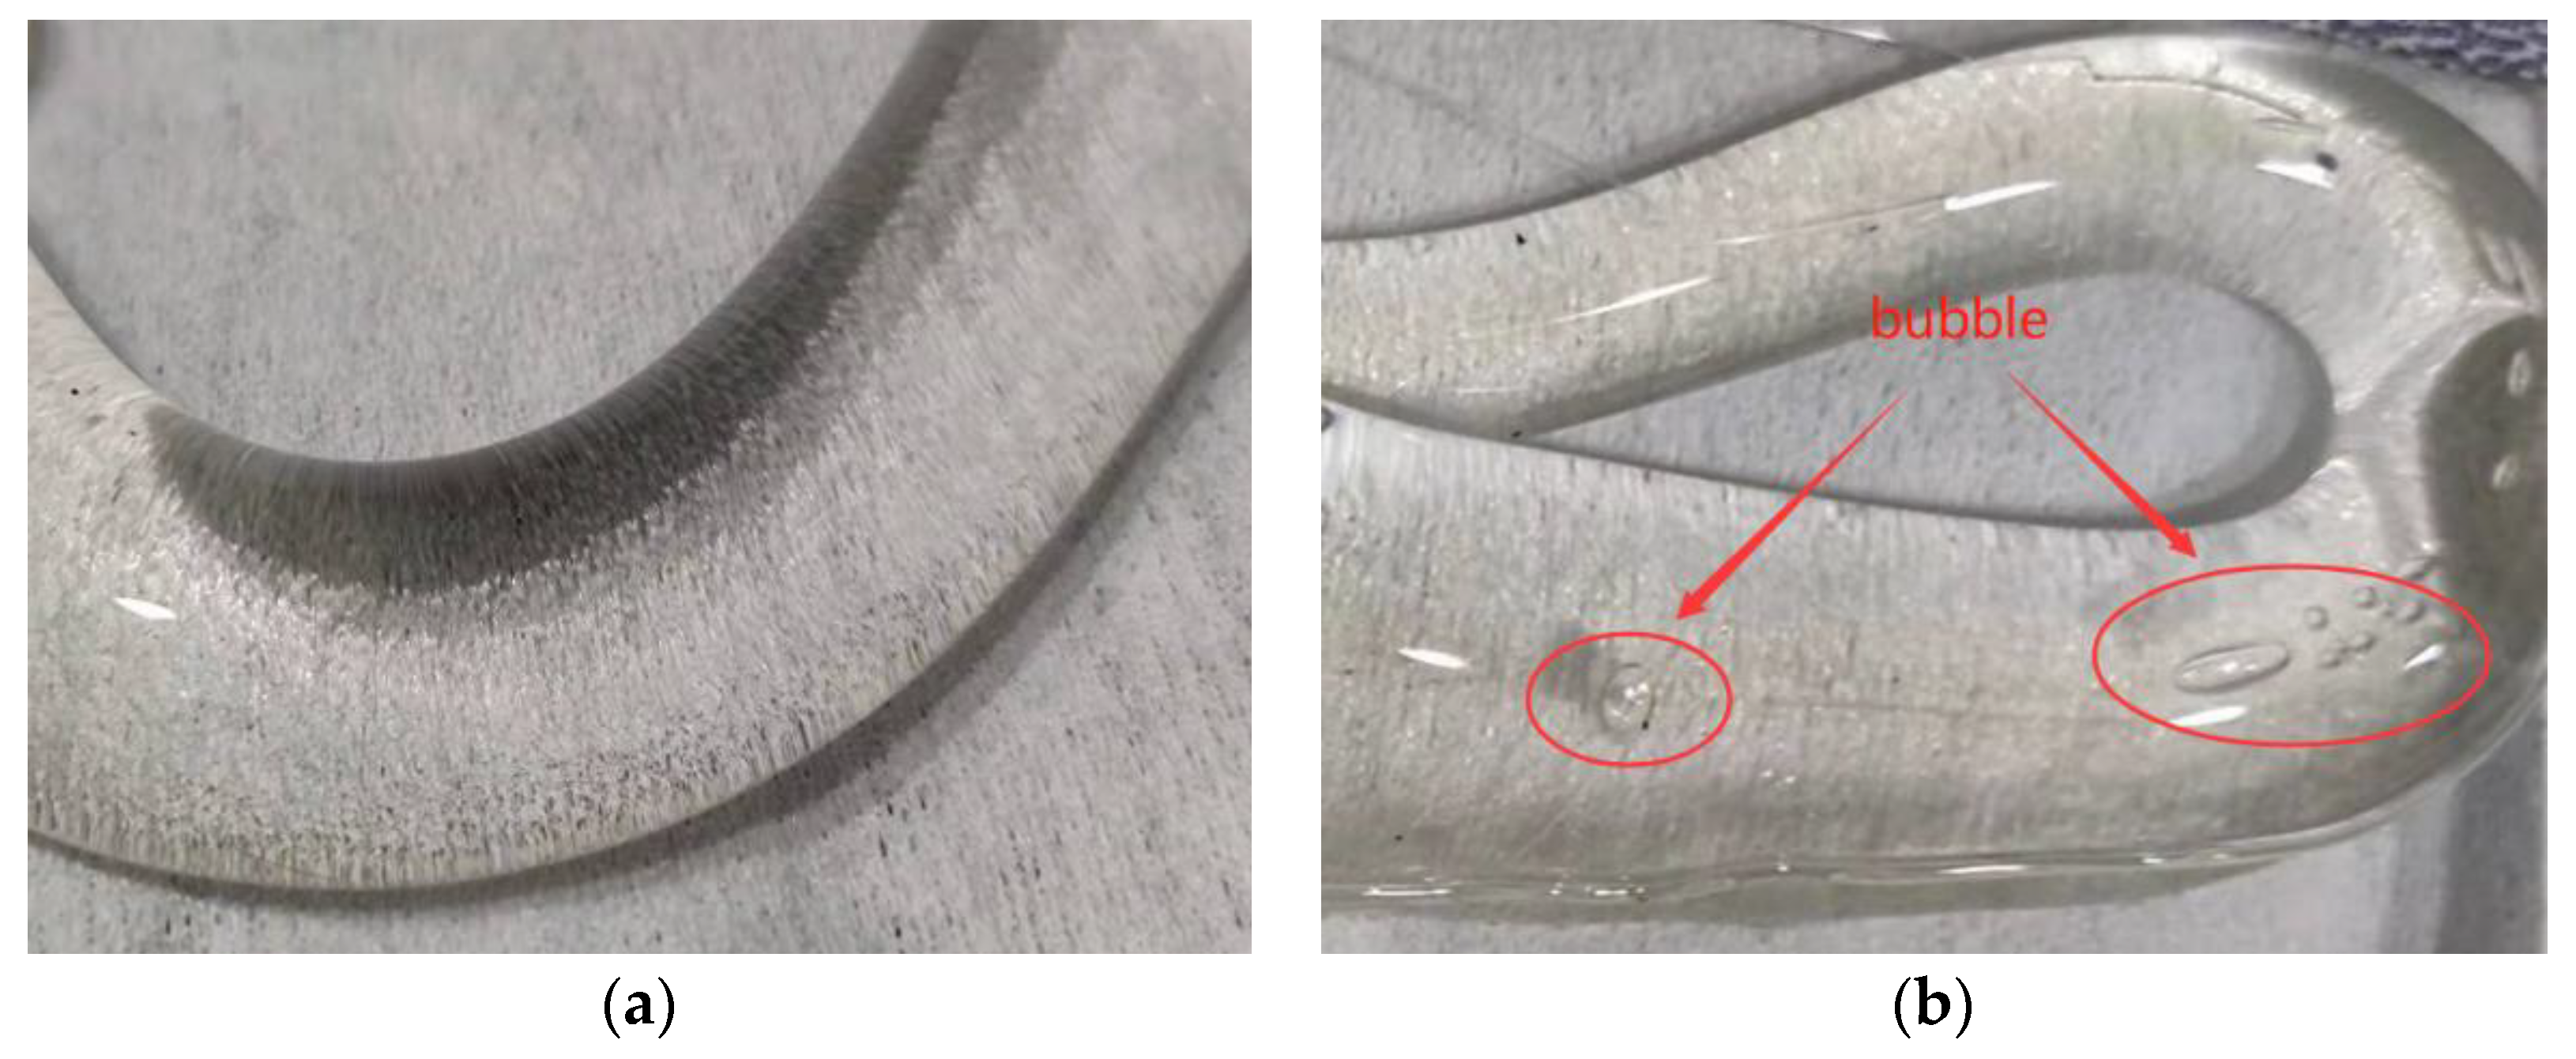
- the polymer in the barrel is completely melted without bubbles;
- the pressure in the barrel is the same, and there are no drag losses;
3. Experimentation
3.1. Material
3.2. Equipment
3.3. Methodology
3.3.1. Apparent Shear Viscosity Measurement
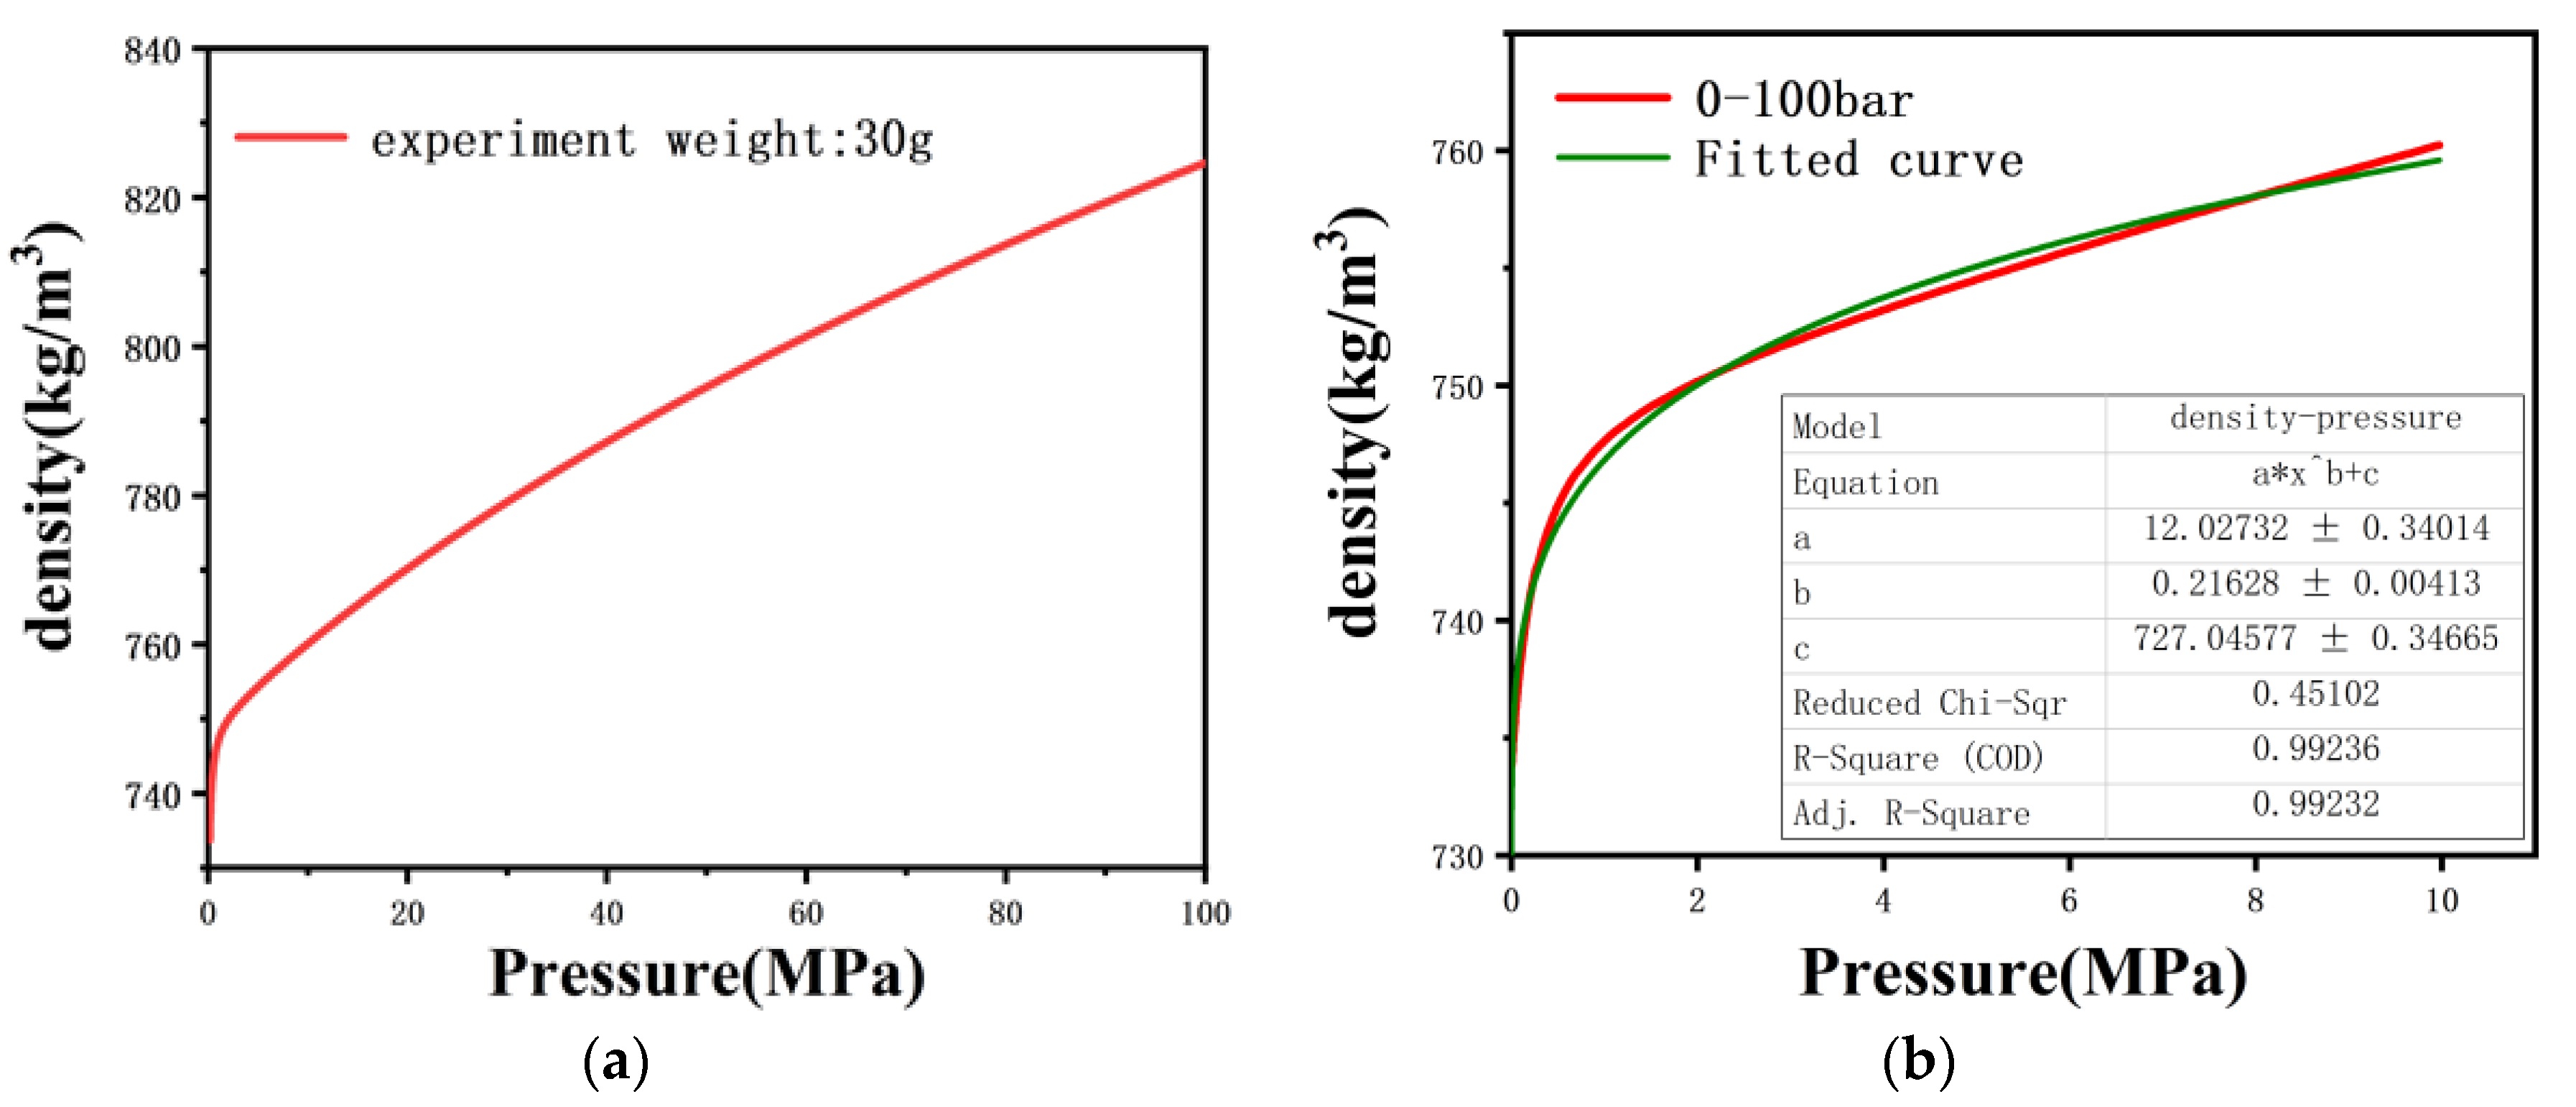
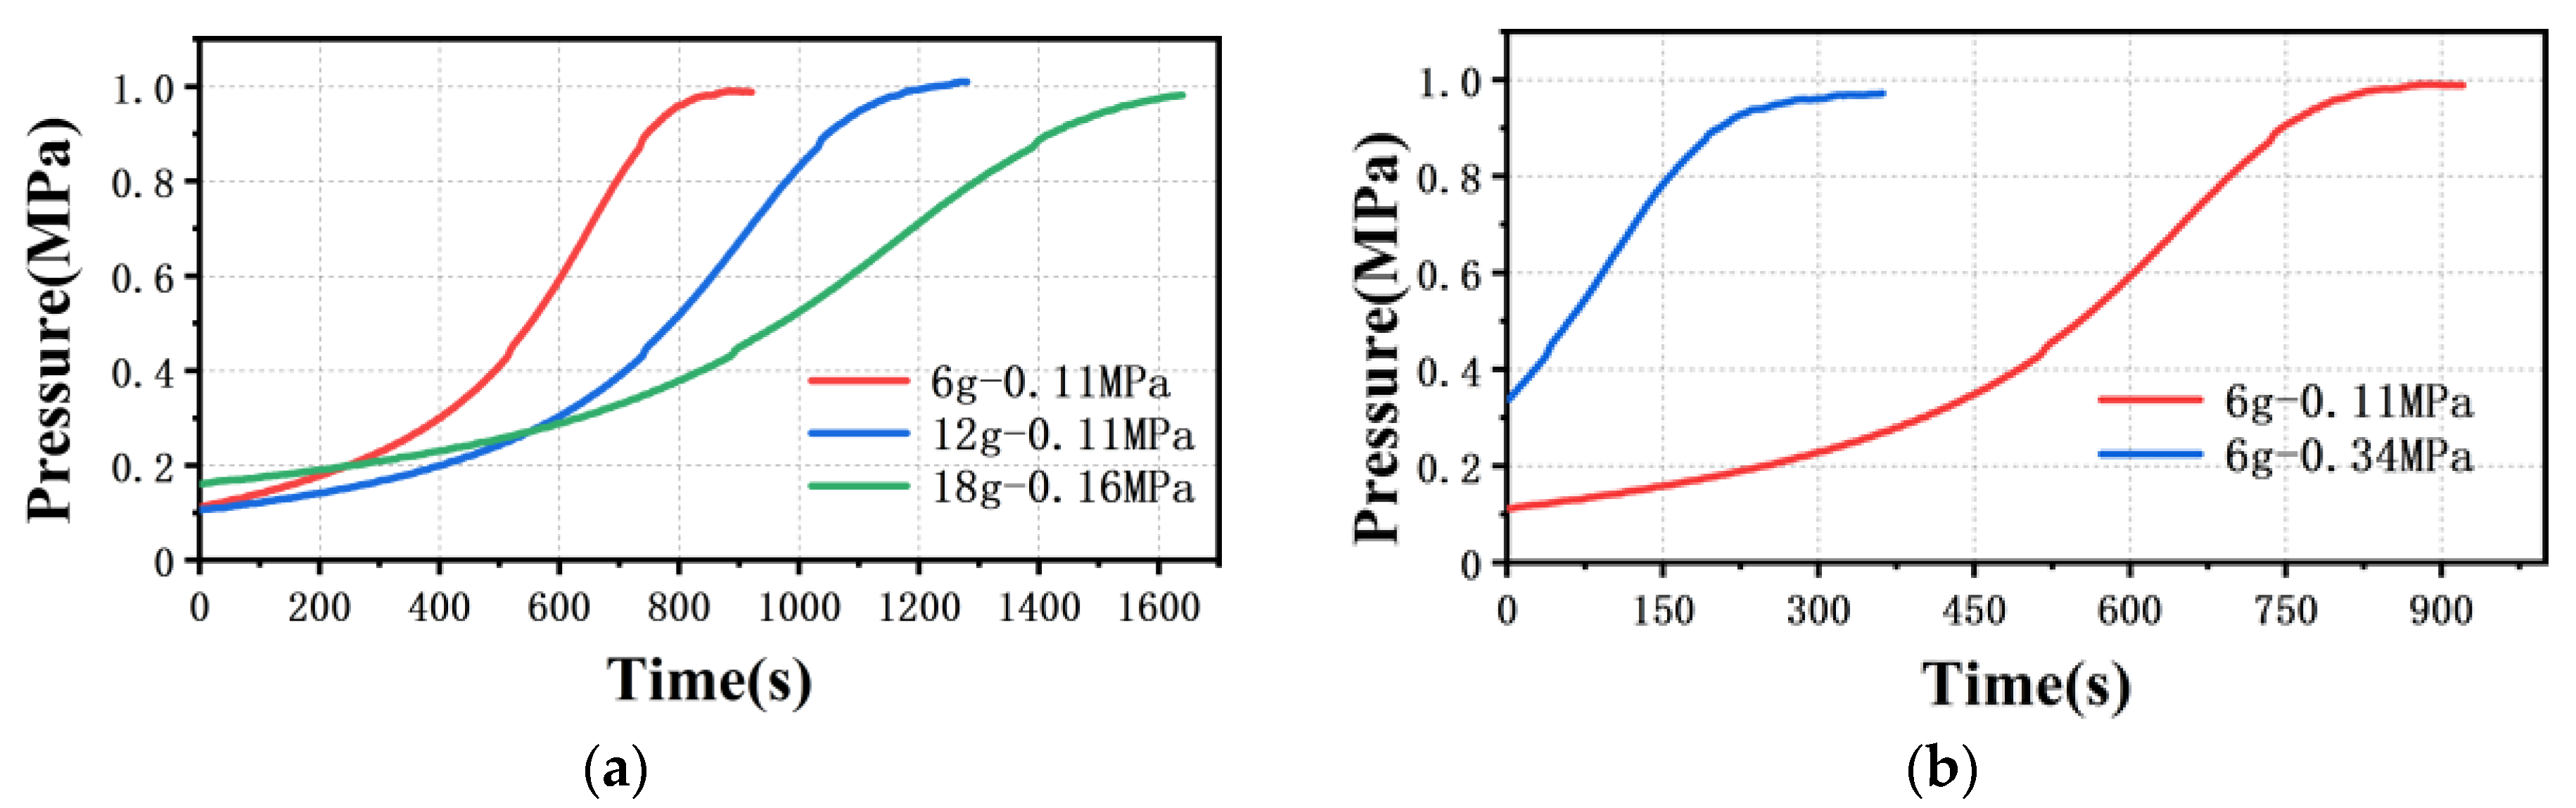
3.3.2. Compressibility Measurement
4. Results and Discussion
4.1. Size Effect of the Micro Capillary Dies
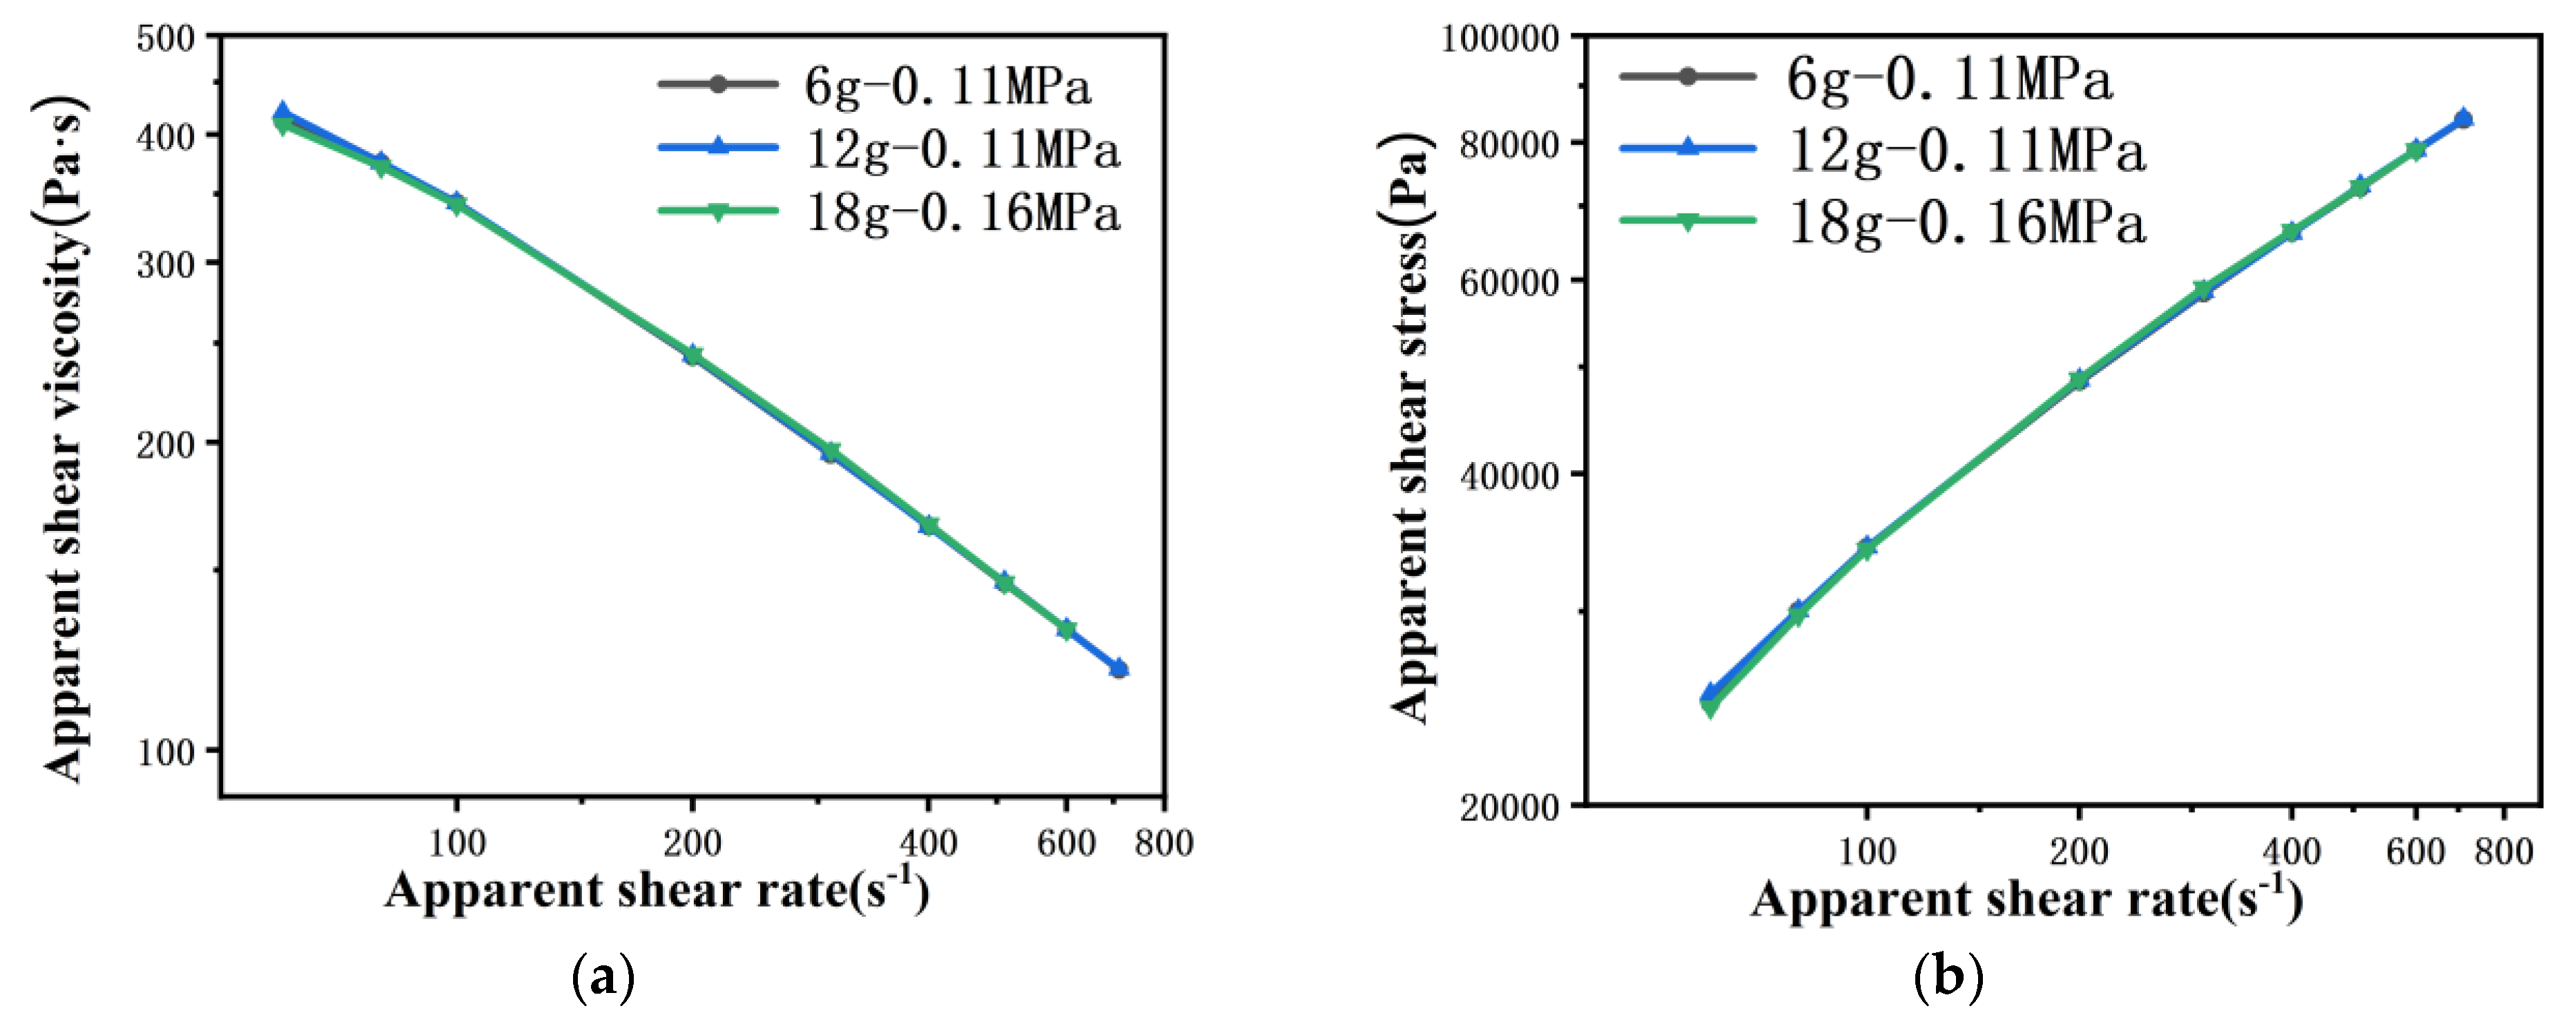
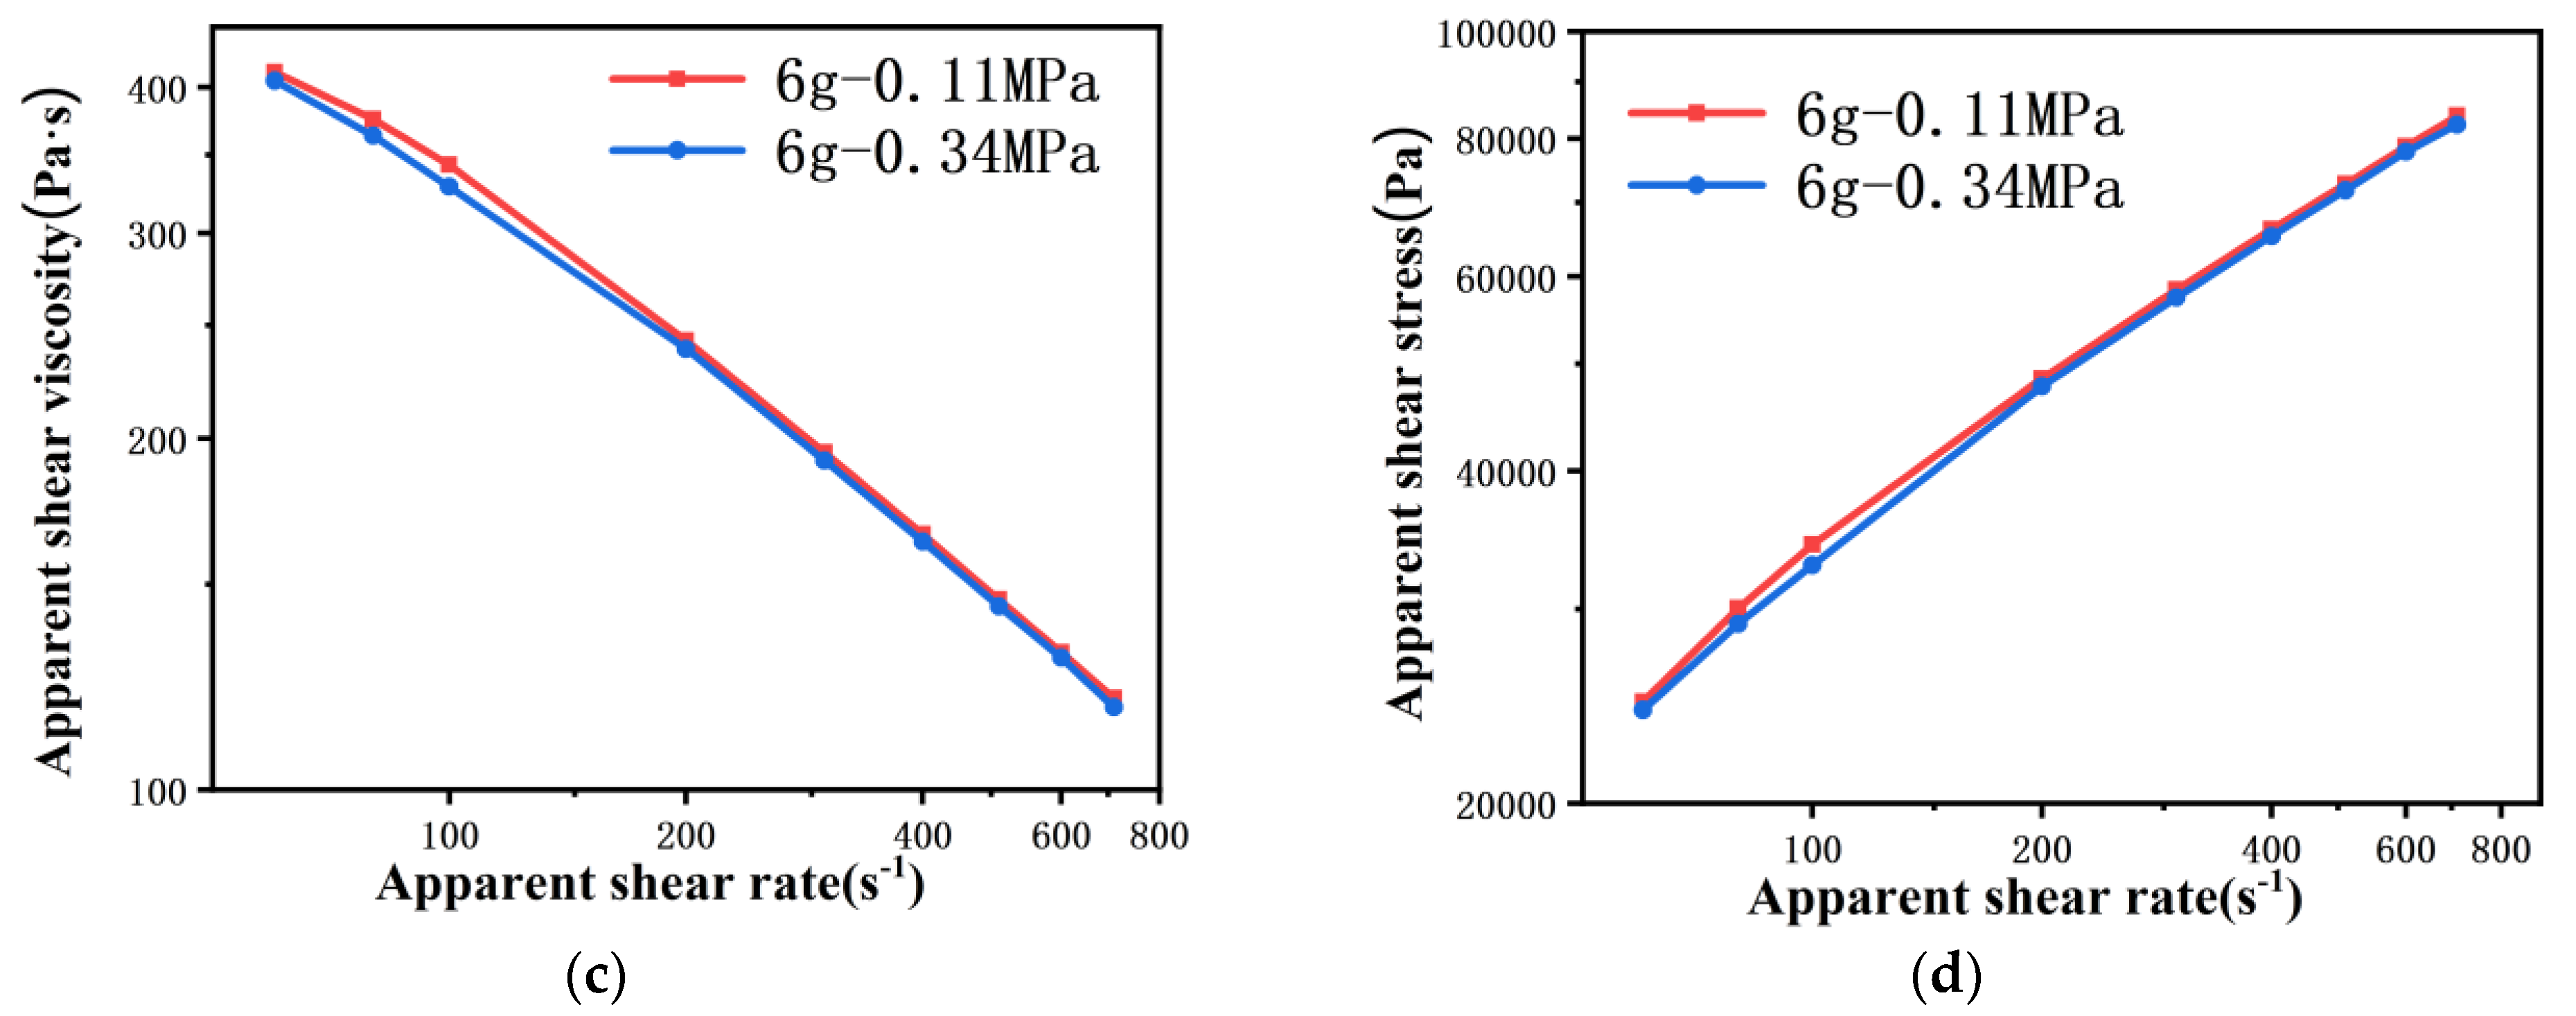
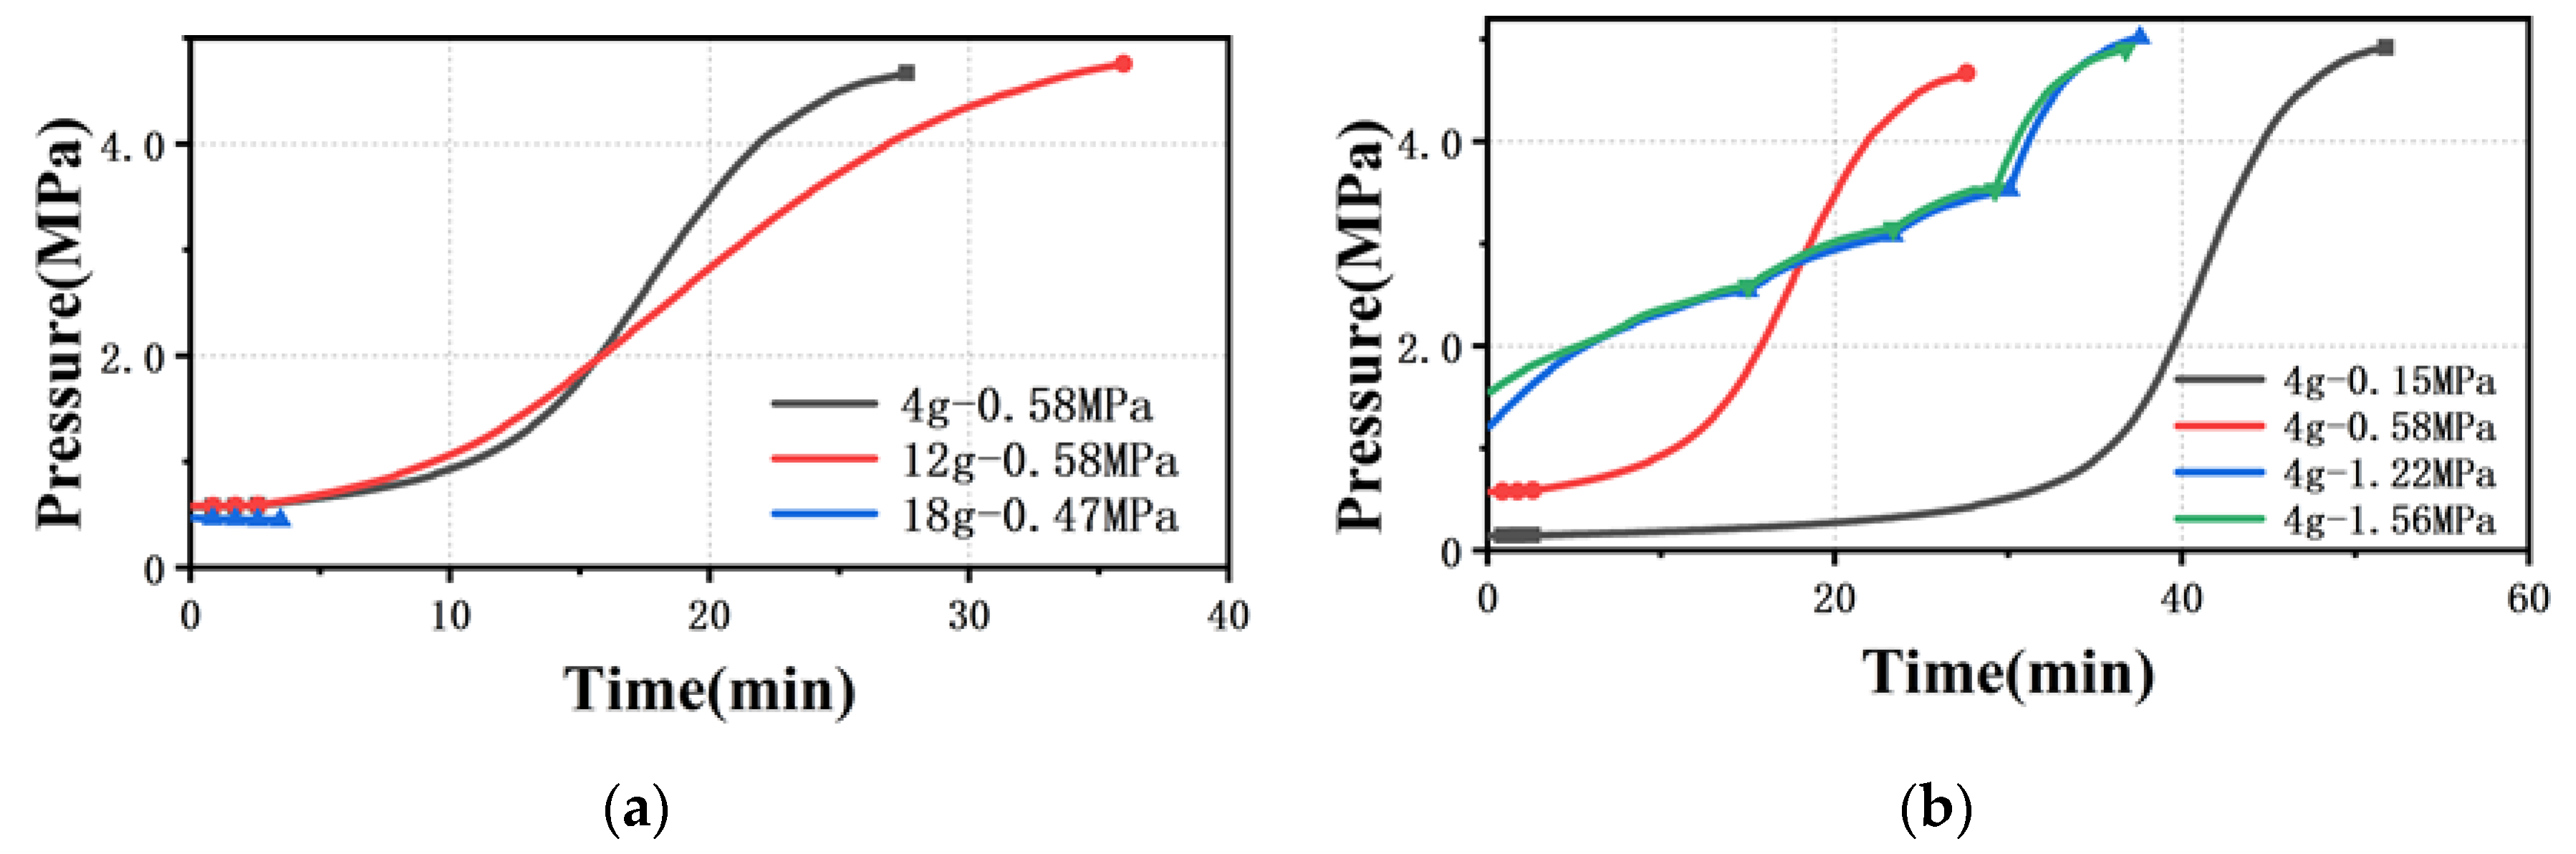
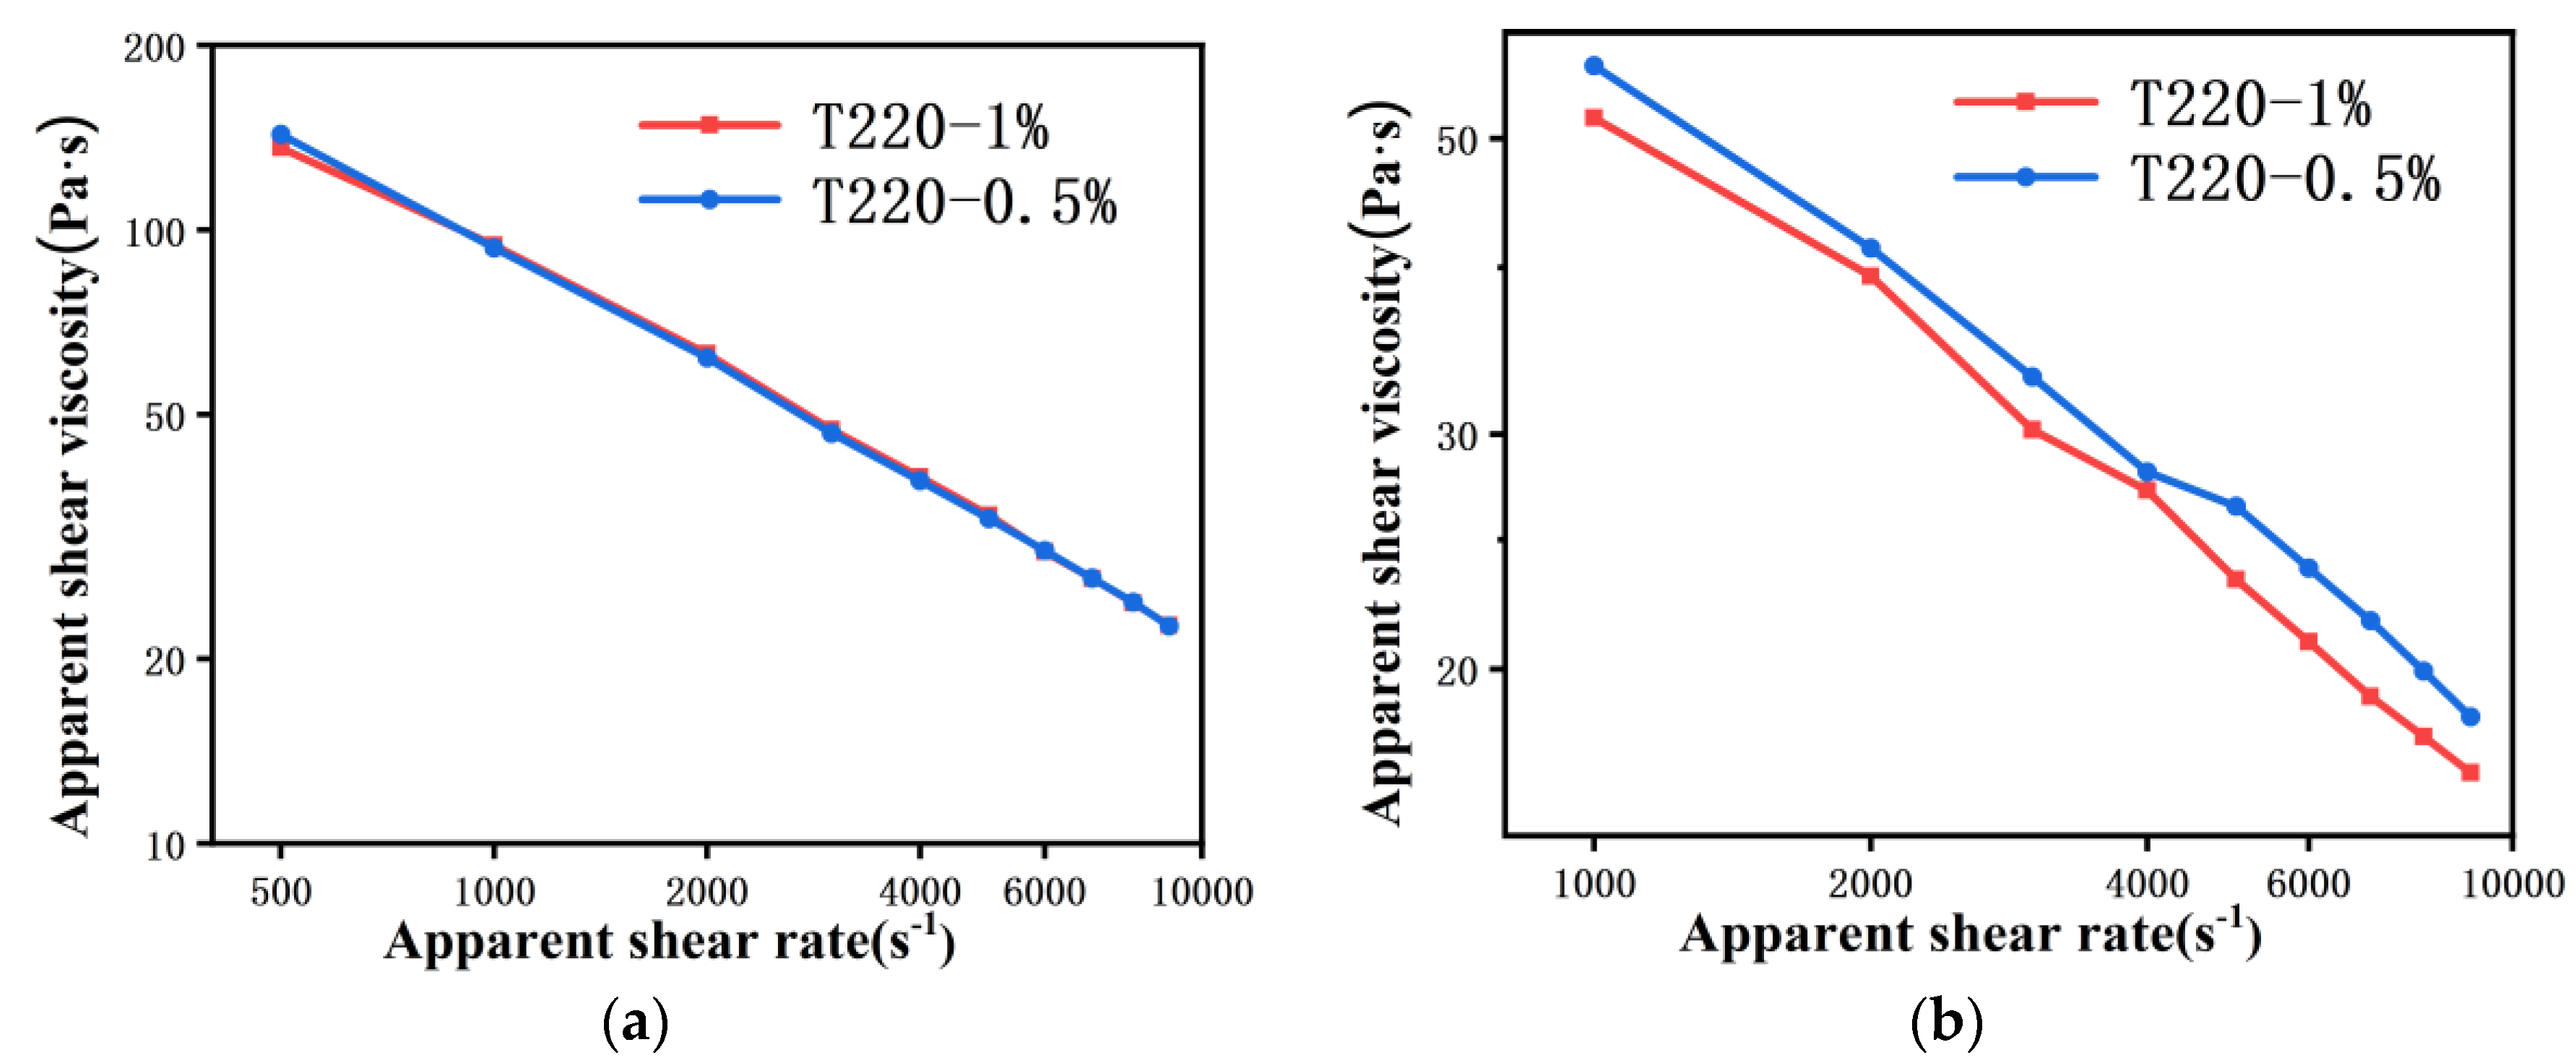
4.1.1. Apparent Shear Viscosity of Polymer Melt Flowing through 500 μm Capillary Die
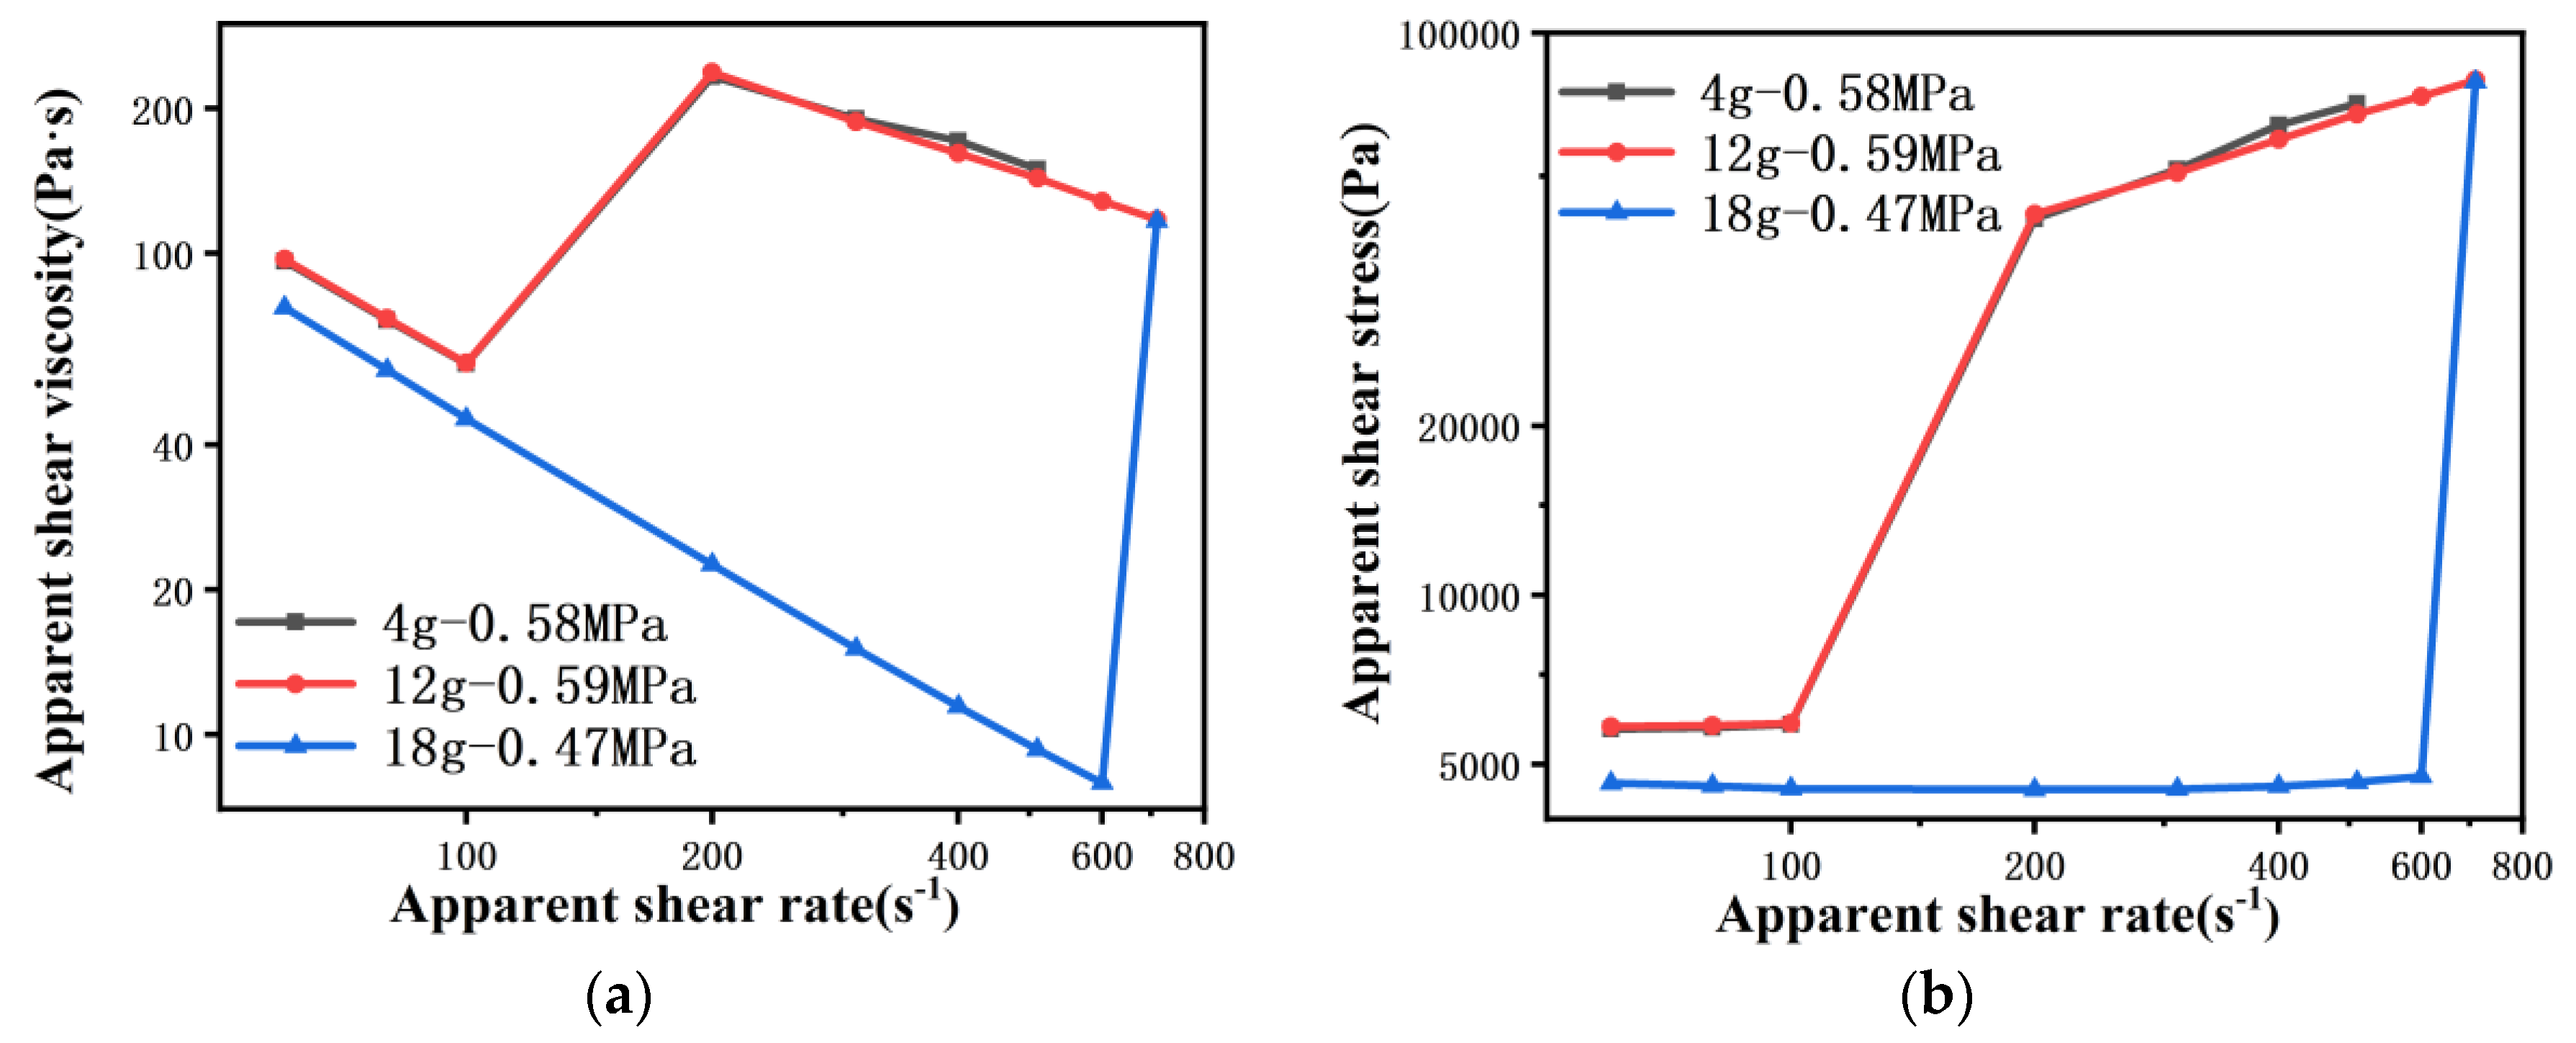
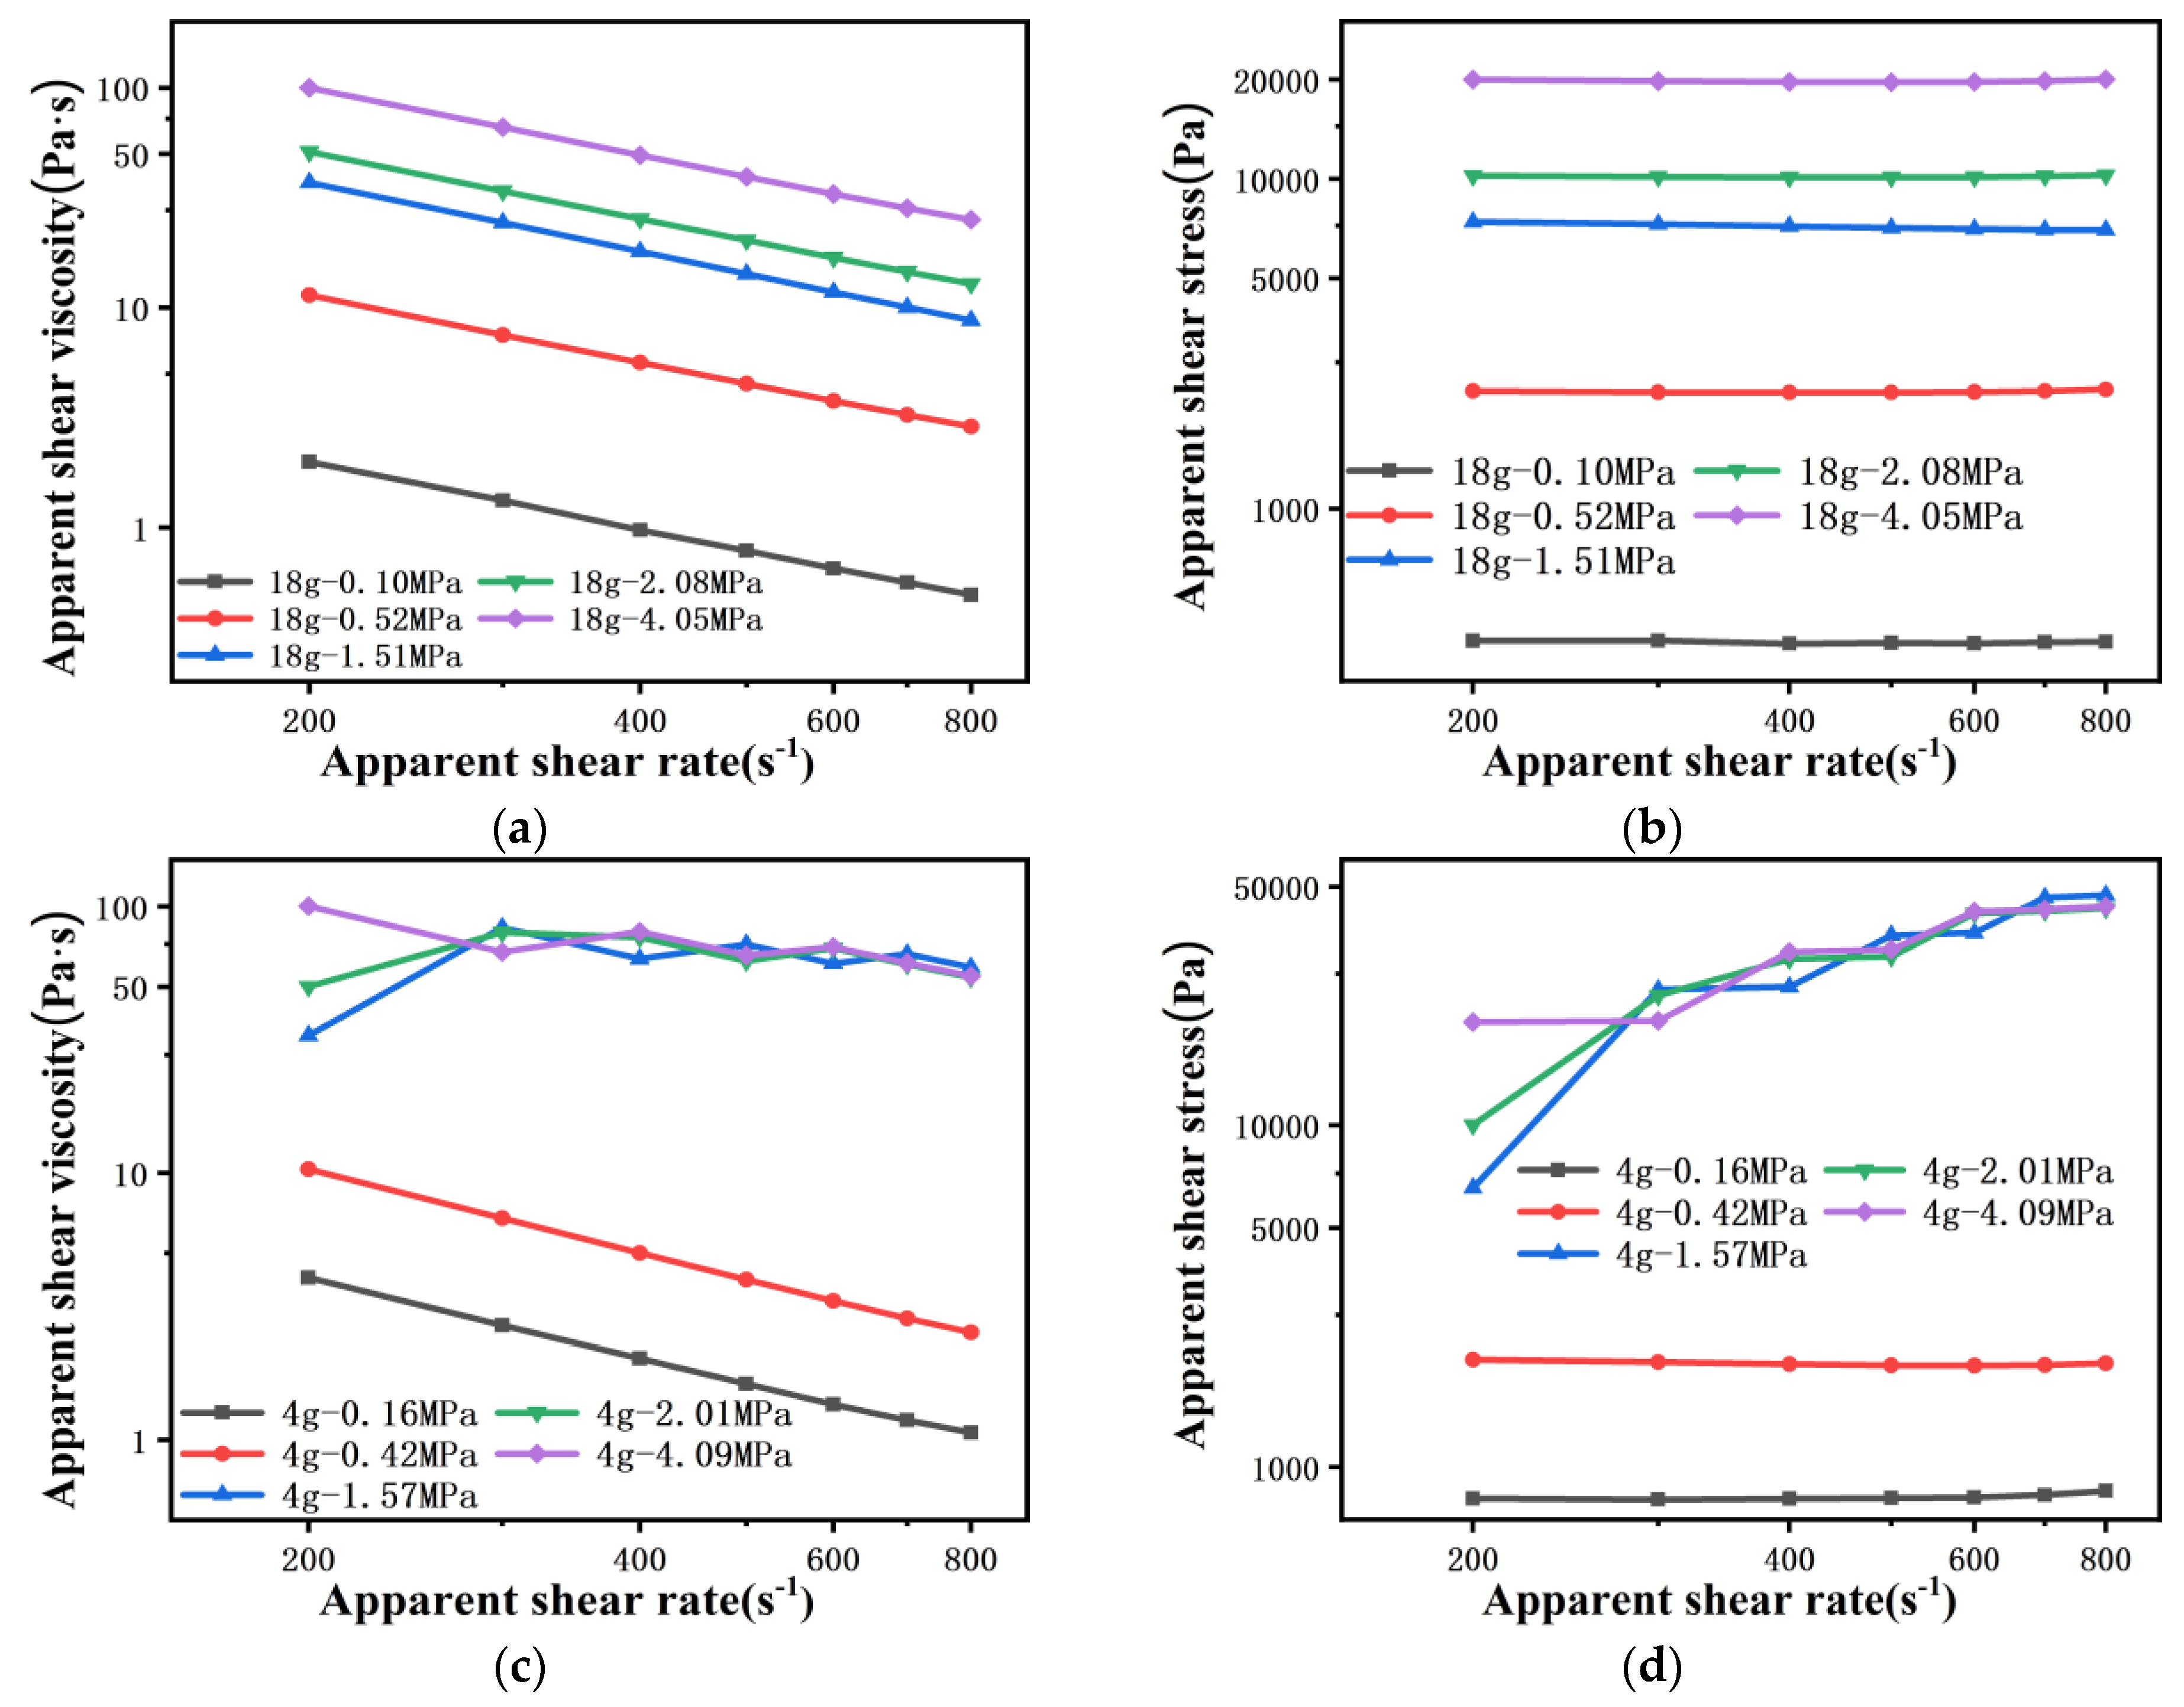
4.1.2. Apparent Shear Viscosity of Polymer Melt Flowing through 200 μ m Capillary Die
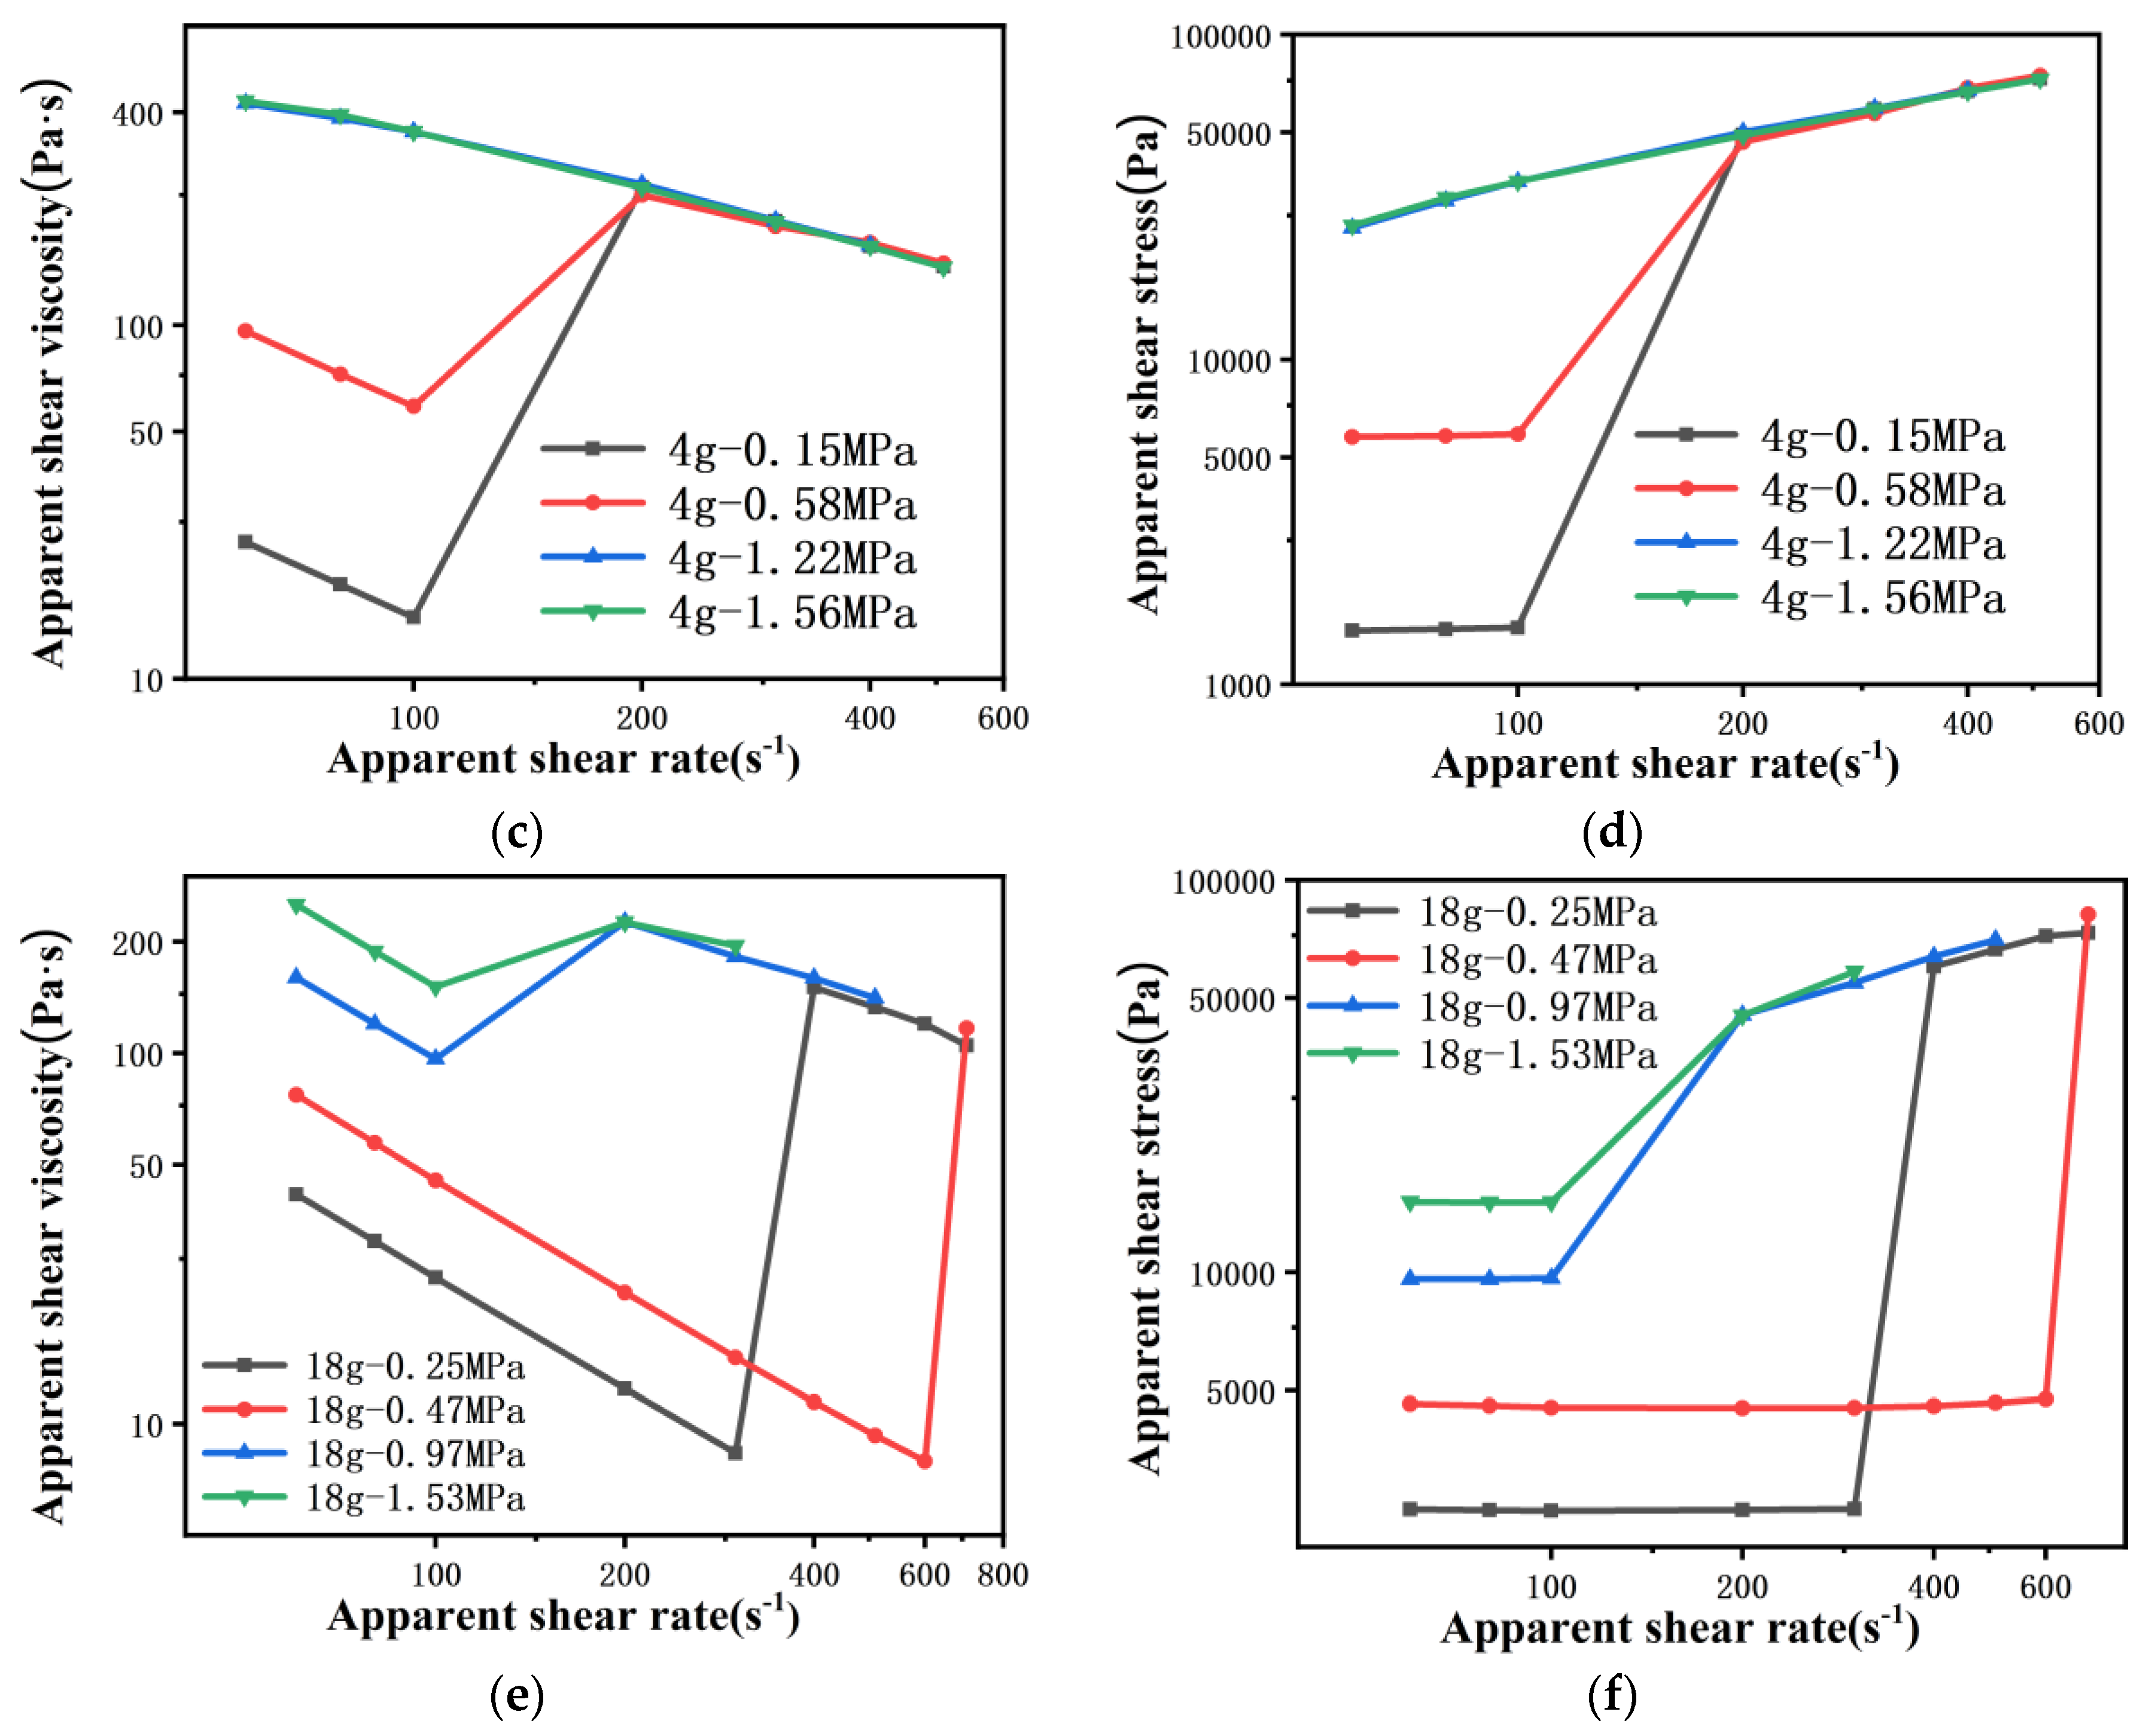
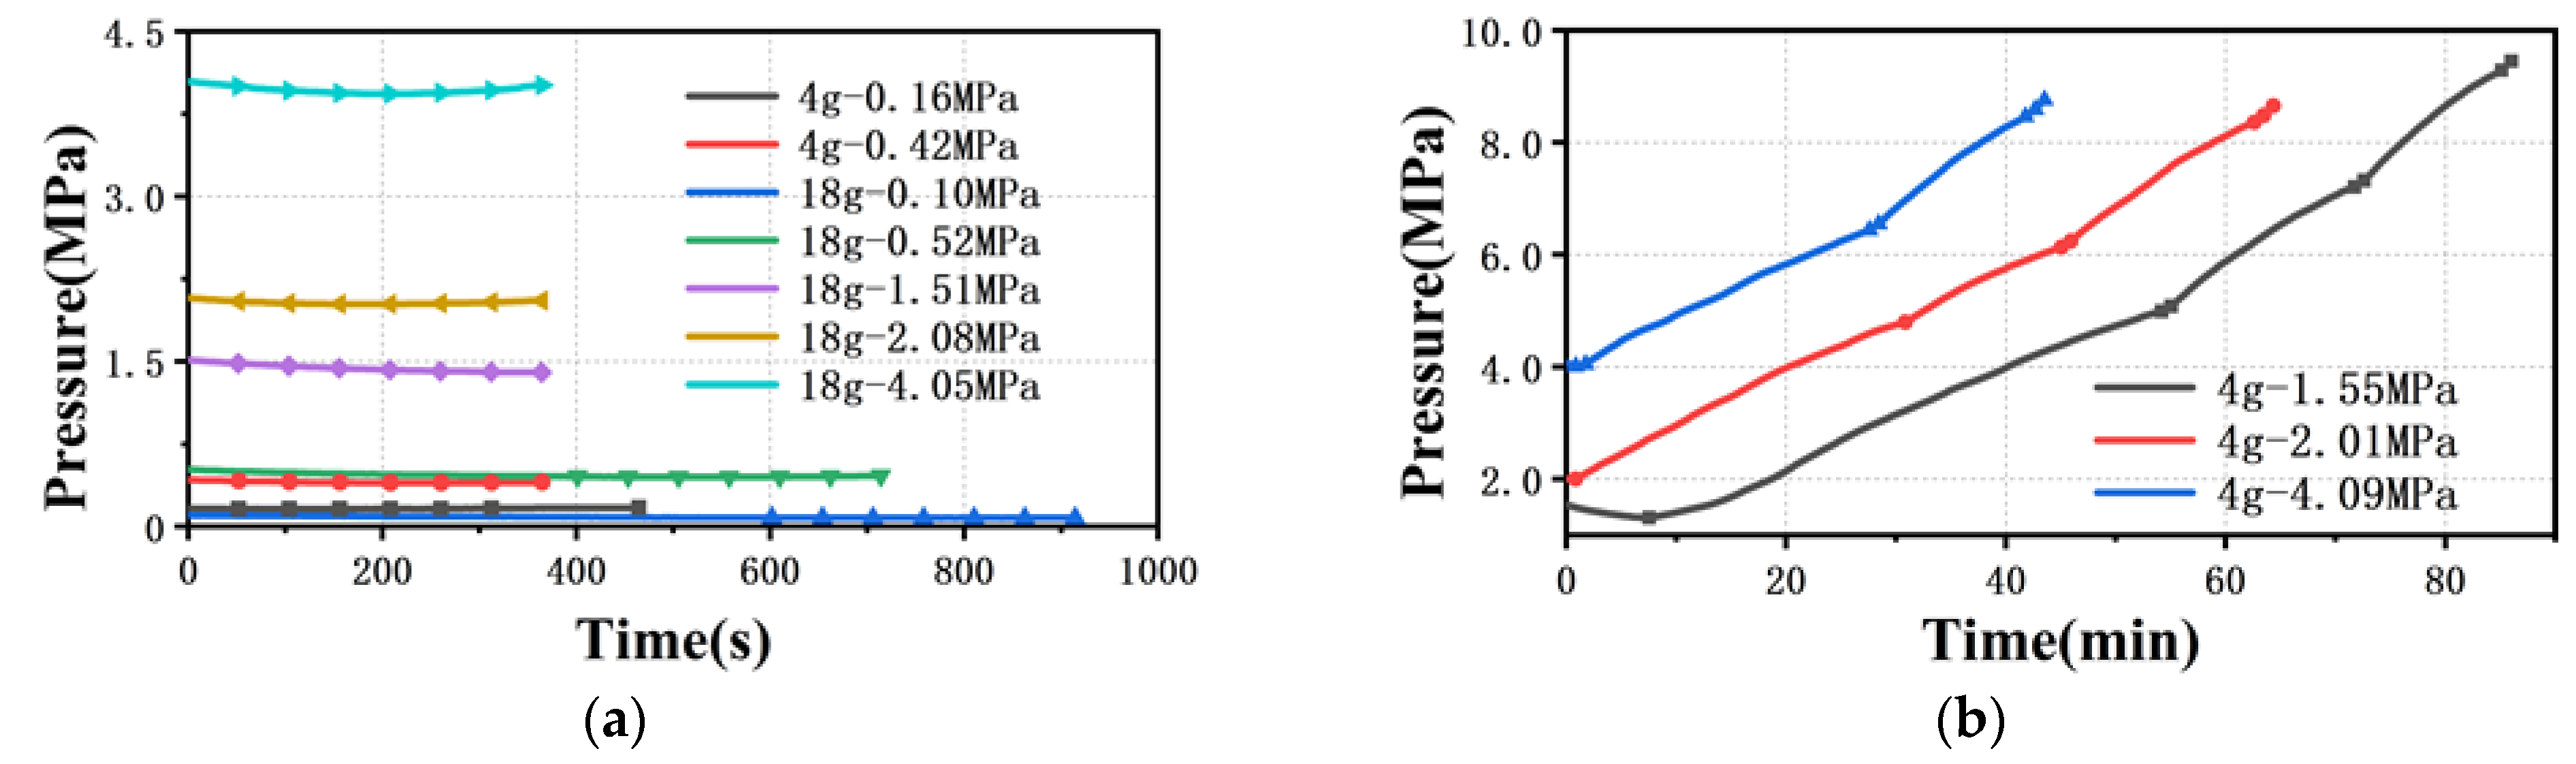
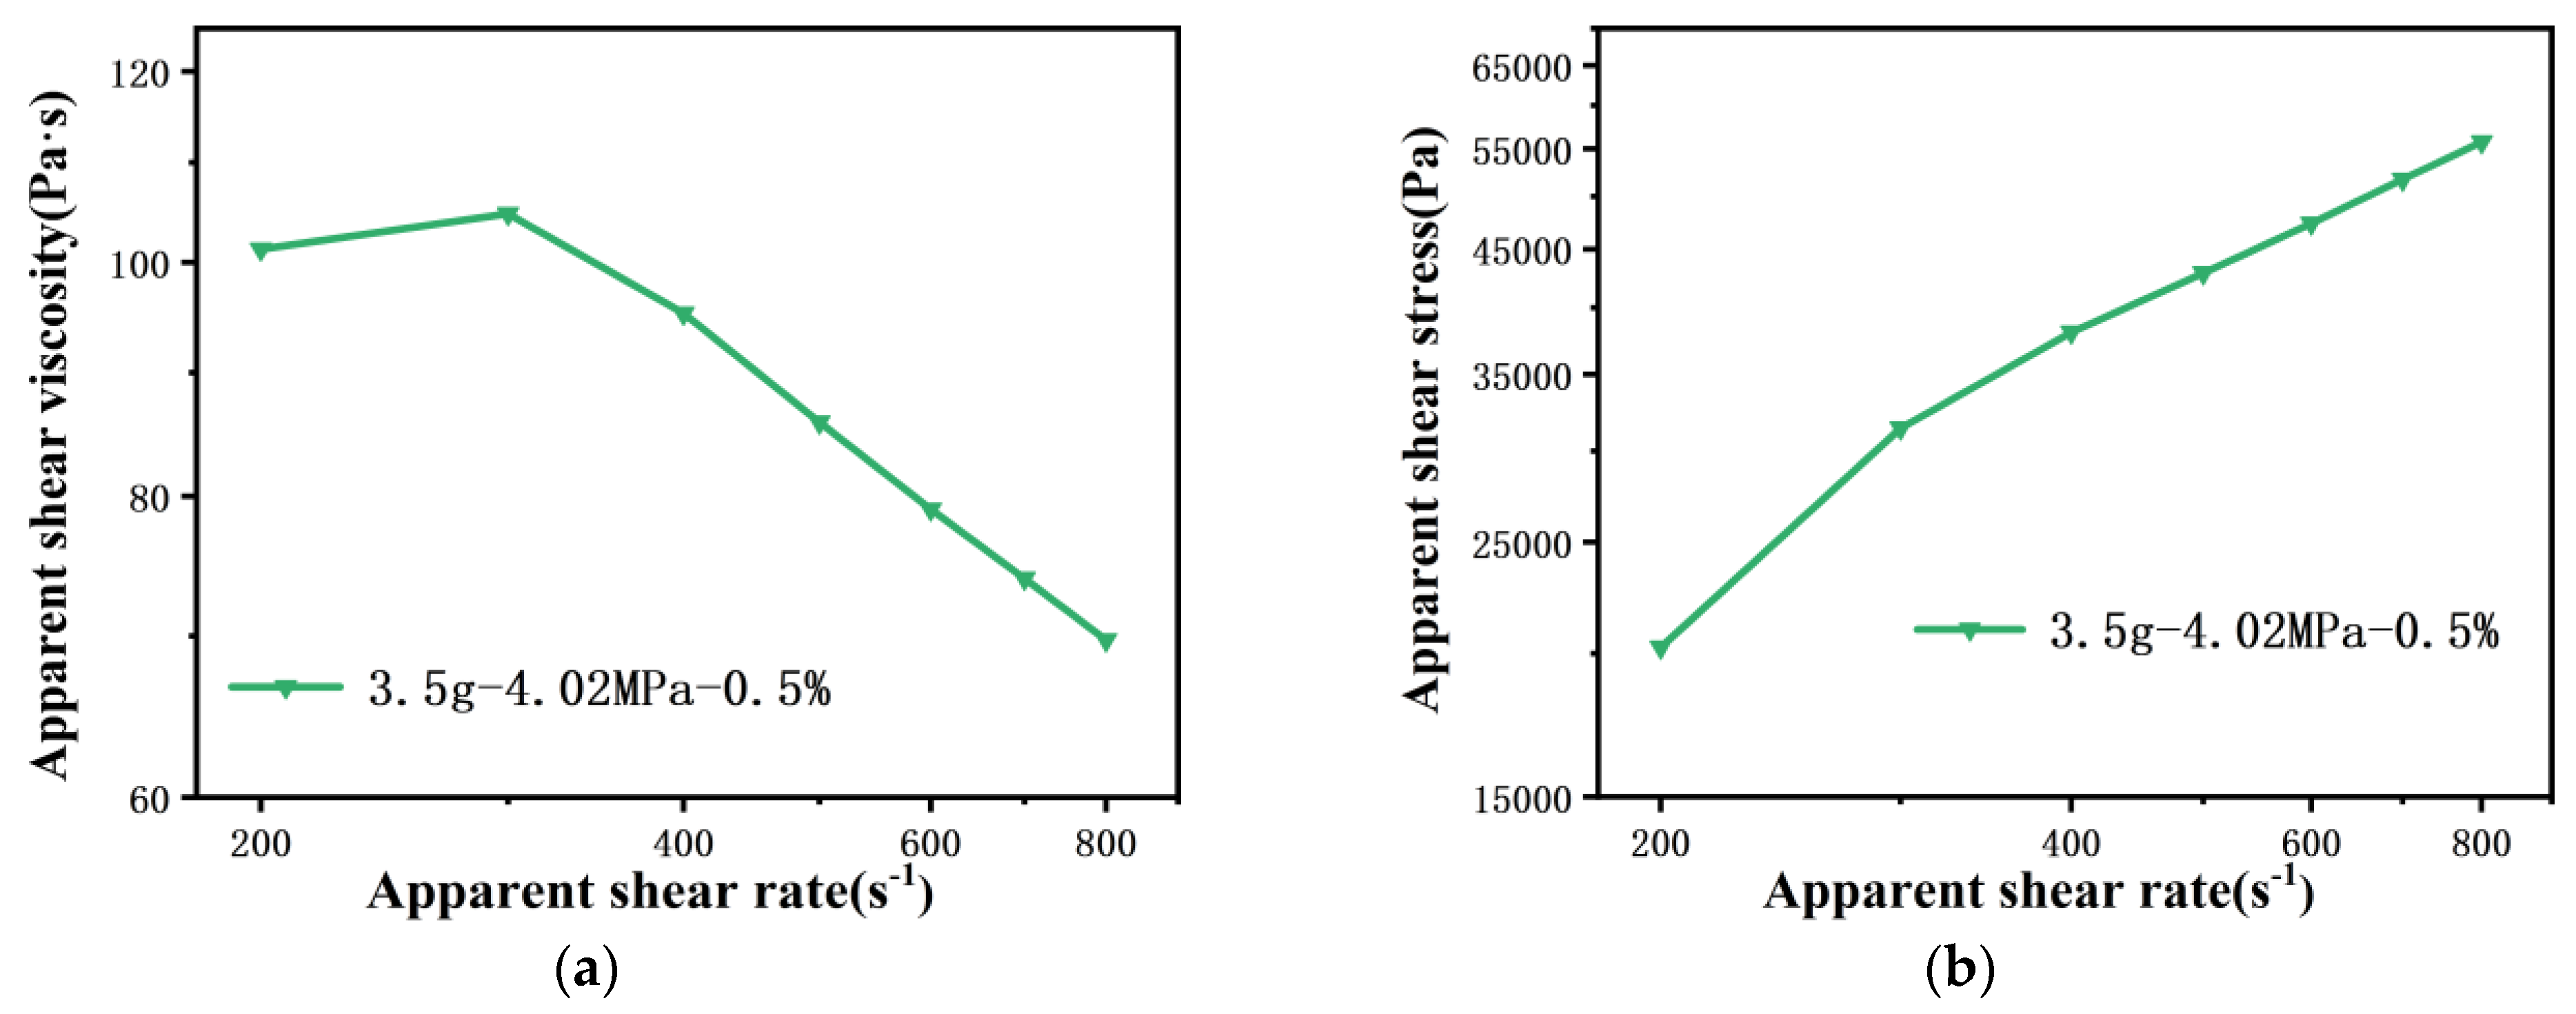
4.1.3. Apparent Shear Viscosity of Polymer Melt Flowing through 100 Capillary Die
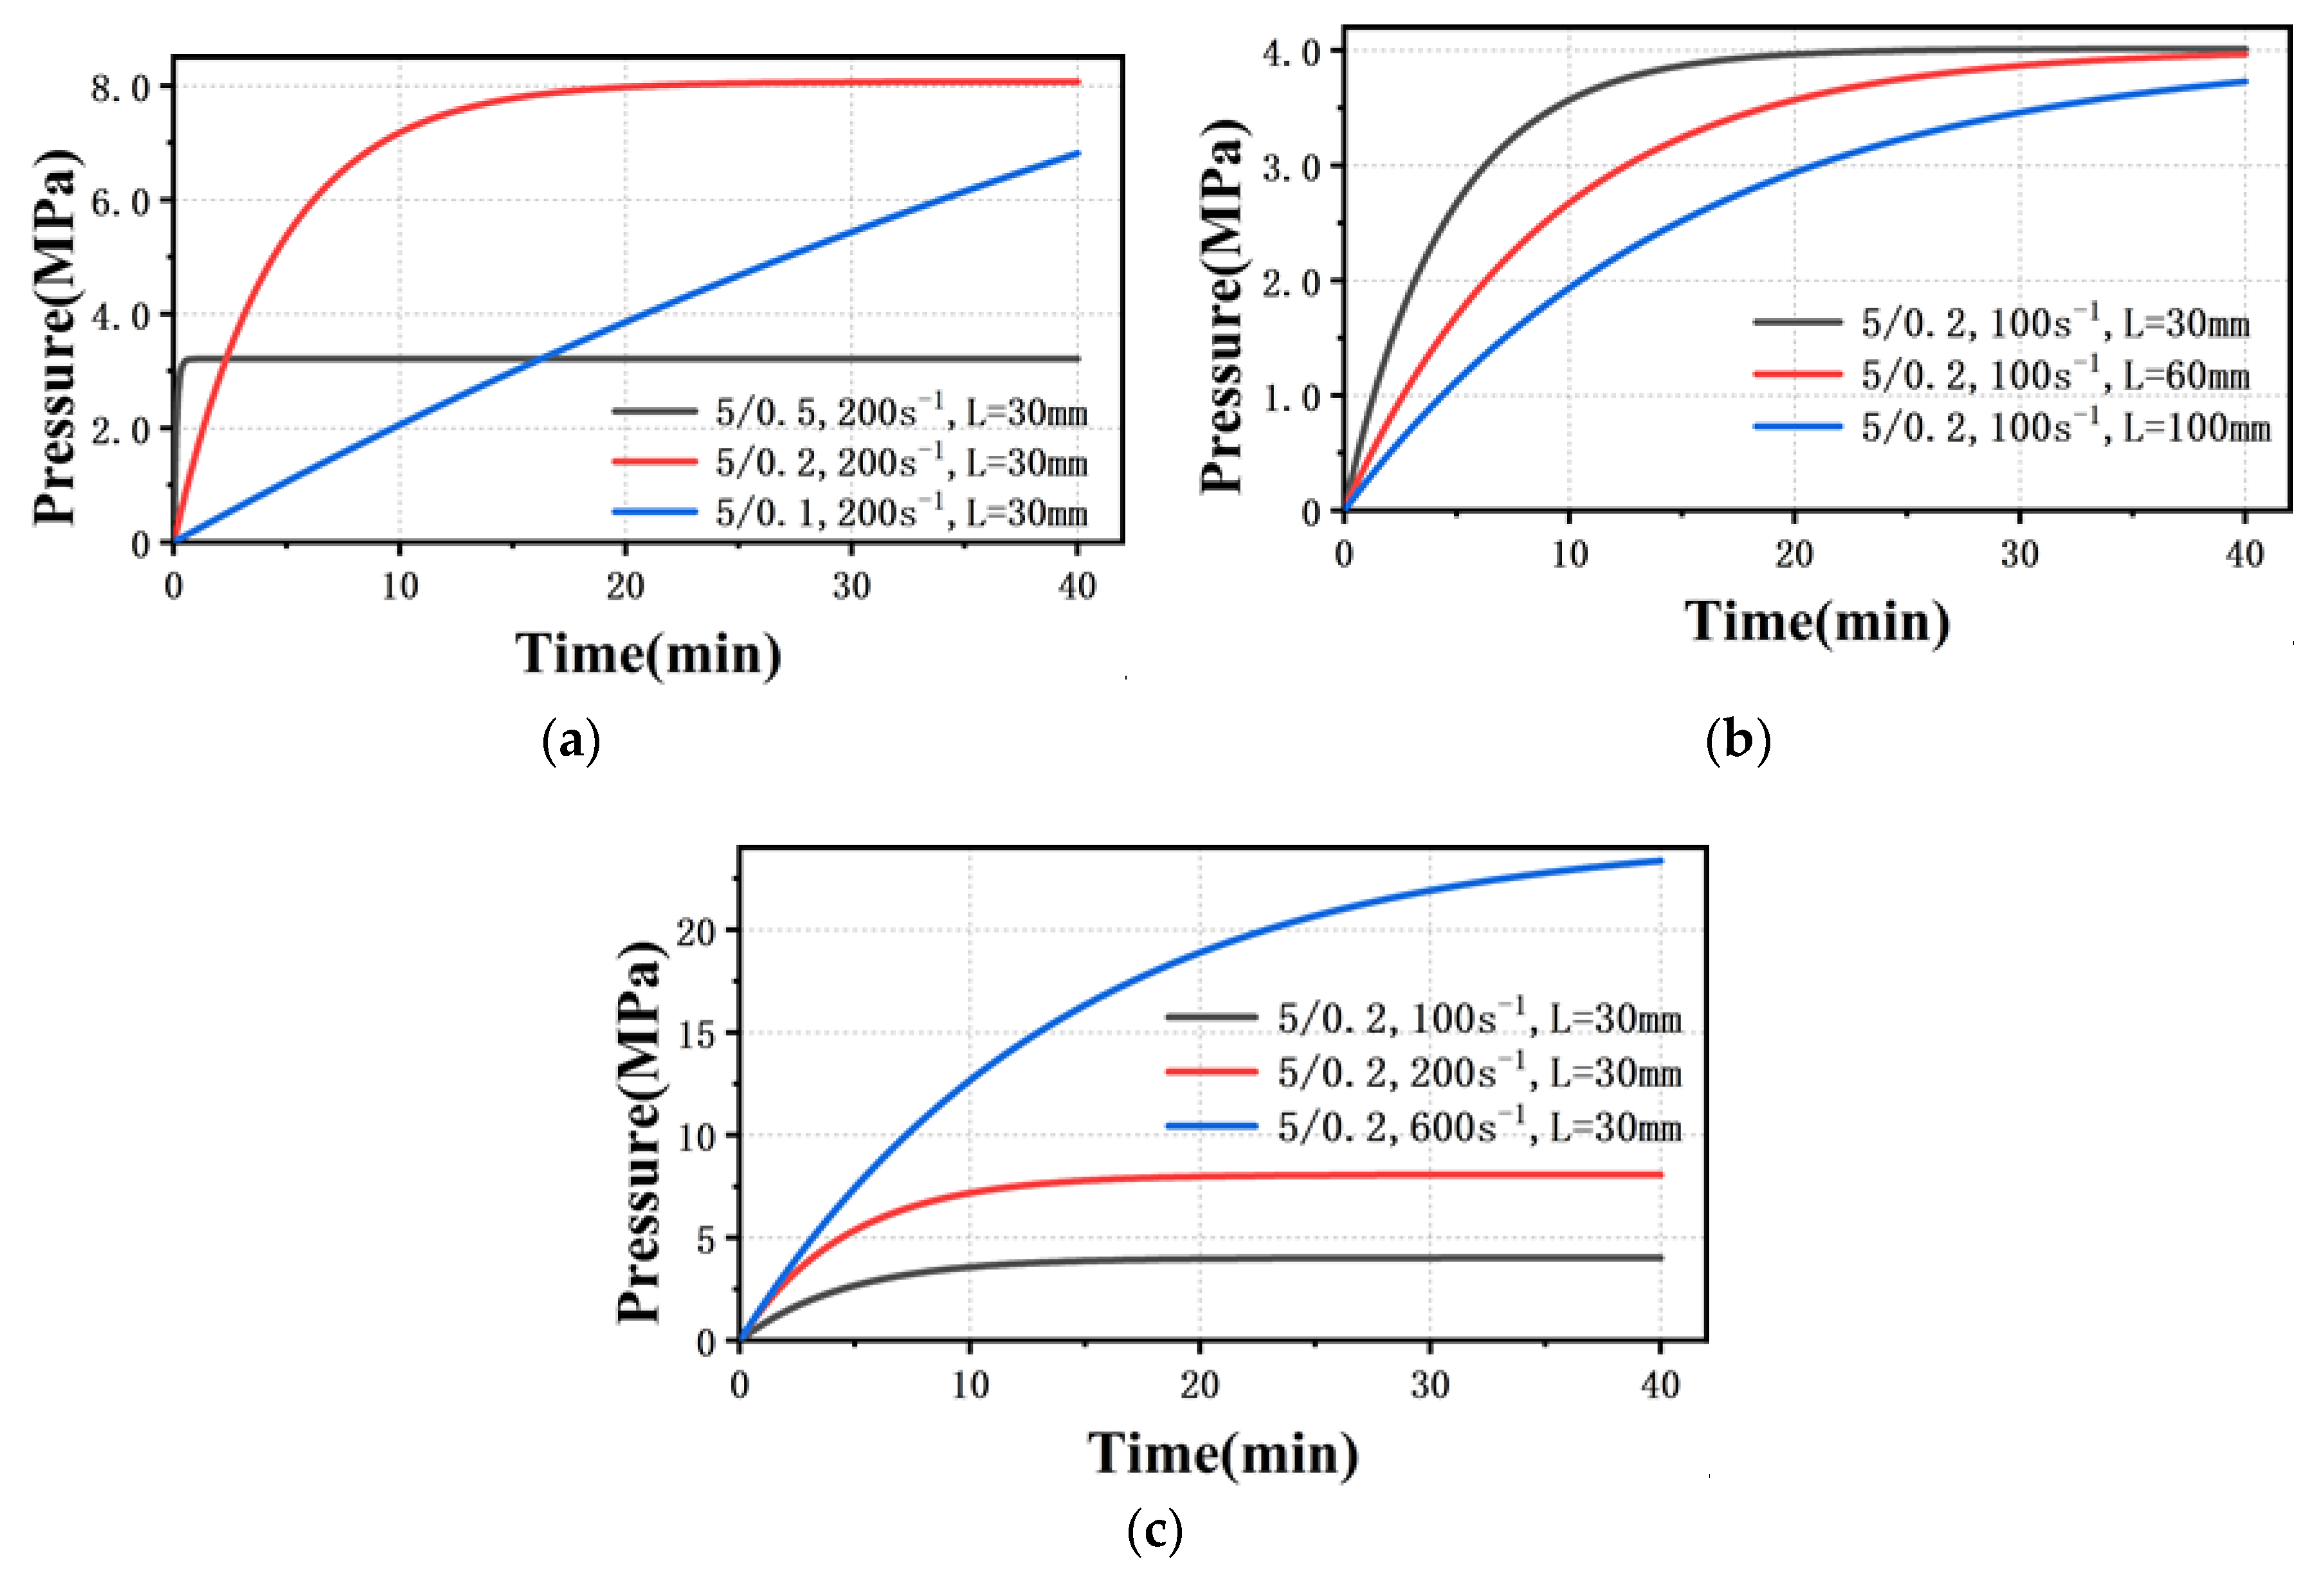
4.2. Theoretical Interpretations
5. Conclusions
Author Contributions
Funding
Institutional Review Board Statement
Informed Consent Statement
Data Availability Statement
Acknowledgments
Conflicts of Interest
References
- Vella, P.; Farrugia, P.; Rochman, A.; Camilleri, C. Design optimisation of an optical component used in an endoscopic micro distal end fabricated with two-shot injection moulding. In Proceedings of the 2018 IEEE 9th International Conference on Mechanical and Intelligent Manufacturing Technologies (ICMIMT), Cape Town, South Africa, 10–13 February 2018; pp. 182–186. [Google Scholar]
- Wlodarski, P.G.; Pittman, J.F.T. Replication of surface micro-features using variothermal injection molding: Application to micro-fluidics. Polym. Eng. Sci. 2018, 58, 1726–1738. [Google Scholar] [CrossRef] [Green Version]
- Majlis, B.Y. MEMS and lab on chip: Interfacing macro to nano world. In Proceedings of the RSM 2013 IEEE Regional Symposium on Micro and Nanoelectronics, Daerah Langkawi, Malaysia, 25–27 September 2013; p. vii. [Google Scholar]
- Tosello, G.; Costa, F.S. High precision validation of micro injection molding process simulations. J. Manuf. Process. 2019, 48, 236–248. [Google Scholar] [CrossRef]
- Attia, U.M.; Marson, S.; Alcock, J.R. Micro-injection moulding of polymer microfluidic devices. Microfluid. Nanofluid. 2009, 7, 1. [Google Scholar] [CrossRef] [Green Version]
- Lucchetta, G.; Sorgato, M.; Carmignato, S.; Savio, E. Investigating the technological limits of micro-injection molding in replicating high aspect ratio micro-structured surfaces. CIRP Ann.-Manuf. Technol. 2014, 63, 521–524. [Google Scholar] [CrossRef]
- Zhang, H.; Fang, F.; Gilchrist, M.D.; Zhang, N. Precision replication of micro features using micro injection moulding: Process simulation and validation. Mater. Des. 2019, 177, 107829. [Google Scholar] [CrossRef]
- Yu, L.; Koh, C.G.; Lee, L.J.; Koelling, K.W.; Madou, M.J. Experimental investigation and numerical simulation of injection molding with micro-features. Polym. Eng. Sci. 2002, 42, 871–888. [Google Scholar] [CrossRef]
- Yao, D.; Kim, B. Simulation of the filling process in micro channels for polymeric materials. J. Micromech. Microeng. 2002, 12, 604. [Google Scholar] [CrossRef]
- Mackley, M.R.; Hassell, D.G. The multipass rheometer a review. J. Nonnewton. Fluid Mech. 2011, 166, 421–456. [Google Scholar] [CrossRef]
- Lu, J.; Qiang, Y.; Wu, W.; Jiang, B. Experimental study on viscosity properties of cyclic olefin copolymer (COC) flowing through micro capillary dies. Polym. Test. 2020, 89, 106635. [Google Scholar] [CrossRef]
- Chien, R.-D.; Jong, W.-R.; Chen, S.-C. Study on rheological behavior of polymer melt flowing through micro-channels considering the wall-slip effect. J. Micromech. Microeng. 2005, 15, 1389–1396. [Google Scholar] [CrossRef]
- Chen, C.-S.; Chen, S.-C.; Liaw, W.-L.; Chien, R.-D. Rheological behavior of POM polymer melt flowing through micro-channels. Eur. Polym. J. 2008, 44, 1891–1898. [Google Scholar] [CrossRef]
- Hatzikiriakos, S.G.; Dealy, J.M. Wall slip of molten high density polyethylenes. II. Capillary rheometer studies. J. Rheol. 1992, 36, 703–741. [Google Scholar] [CrossRef]
- Hatzikiriakos, S.G.; Dealy, J.M. Start-up pressure transients in a capillary rheometer. Polym. Eng. Sci. 1994, 34, 493–499. [Google Scholar] [CrossRef]
- Pérez-Trejo, L.; Pérez-González, J.; De Vargas, L. About the determination of the steady state flow for polymer melts in capillary rheometers. Polym. Test. 2001, 20, 523–531. [Google Scholar] [CrossRef]
- Mitsoulis, E.; Delgadillo-Velazquez, O.; Hatzikiriakos, S.G. Transient capillary rheometry: Compressibility effects. J. Nonnewton. Fluid Mech. 2007, 145, 102–108. [Google Scholar] [CrossRef]
- Du, R.; Sun, H.; Zhang, X.; Tang, P. A semi-empirical approach to evaluating rise time of power-law fluids in a capillary rheometer. J. Nonnewton. Fluid Mech. 2018, 254, 51–61. [Google Scholar] [CrossRef]
- Tanguy, P.A.; Grygiel, J.M. A slightly compressible transient finite element model of the packing phase in injection molding. Polym. Eng. Sci. 1993, 33, 1229–1237. [Google Scholar] [CrossRef]
- Tutar, M.; Karakus, A. Injection Molding Simulation of a Compressible Polymer. J. Polym. Eng. 2009, 29, 355–384. [Google Scholar] [CrossRef]
- Pollak, S.; Hüttemann, S.; Quiñones-Cisneros, S.E.; Weidner, E. Development and calibration of a high pressure high shear rate capillary rheometer. J. Pet. Sci. Eng. 2017, 157, 581–587. [Google Scholar] [CrossRef]
- Wang, Z.Y.; Lam, Y.C.; Chen, X.; Joshi, S.C. Viscosity corrections for concentrated suspension in capillary flow with wall slip. AIChE J. 2010, 56, 1447–1455. [Google Scholar] [CrossRef]
- Kim, S.; Dealy, J.M. Design of an orifice die to measure entrance pressure drop. J. Rheol. 2001, 45, 1413–1419. [Google Scholar] [CrossRef]
- Chung, C.I. Compressibility of polyethylene melts at low pressures. J. Appl. Polym. Sci. 1971, 15, 1277–1281. [Google Scholar] [CrossRef]


| Properties | Unit | Test Method | Typical Value |
|---|---|---|---|
| Melt Index | g/10 min | ISO1133 | 15 |
| Density | g/cm3 | ISO1183 | 0.90 |
| Melting Point | °C | DSC | 146 |
| Heat Deflection Temperature | °C | ISO75 | 95 |
| Vicat Softening Temperature | °C | ISO306 | 125 |
| Tensile Strength at Yield | MPa | ISO527 | 28 |
| Tensile Elongation at Break | % | ISO527 | 300 |
| Rockwell Hardness | R scale | ISO2039 | 98 |
| Flexural Modulus | MPa | ISO178 | 1050 |
| Mold Shrinkage | % | FPC Method | 1.3–1.7 |
| Parameter | Value Range |
|---|---|
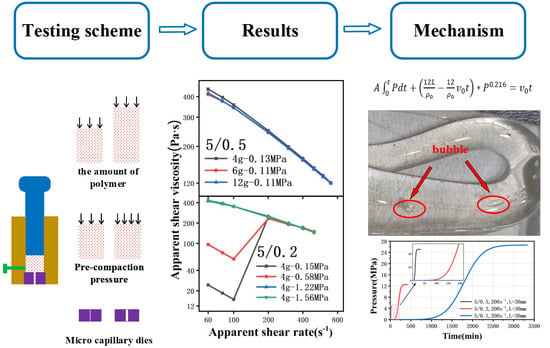
| die diameter (μm) | 500, 200, 100 |
| the amount of polymer initially in the barrel (g) | 4, 6, 12, 18 |
| pre-compaction pressure (MPa) | 0.1, 0.3, 0.5, 1.2, 1.5, 2.0, 4.0 |
| experiment temperature (°C) | 220 |
| shear rate (s−1) | 60, 80, 100, 200, 300, 400, 500, 600, 700, 800 |
| Parameter Combinations | 60 s−1 | 80 s−1 | 100 s−1 |
|---|---|---|---|
| 4 g−0.15 MPa | 0.36% | 0.42% | 0.24% |
| 4 g−0.58 MPa | 0.09% | 0.24% | 0.77% |
| 12 g−0.58 MPa | 0.38% | 0.31% | 0.53% |
| 18 g−0.47 MPa | 0.66% | 0.55% | 0.59% |
| Die Size (mm) | |||
|---|---|---|---|
| 5/0.5 | 4.3410−9 | 400 | 10−9 |
| 5/0.2 | 1.1110−10 | ||
| 5/0.1 | 6.9410−12 |
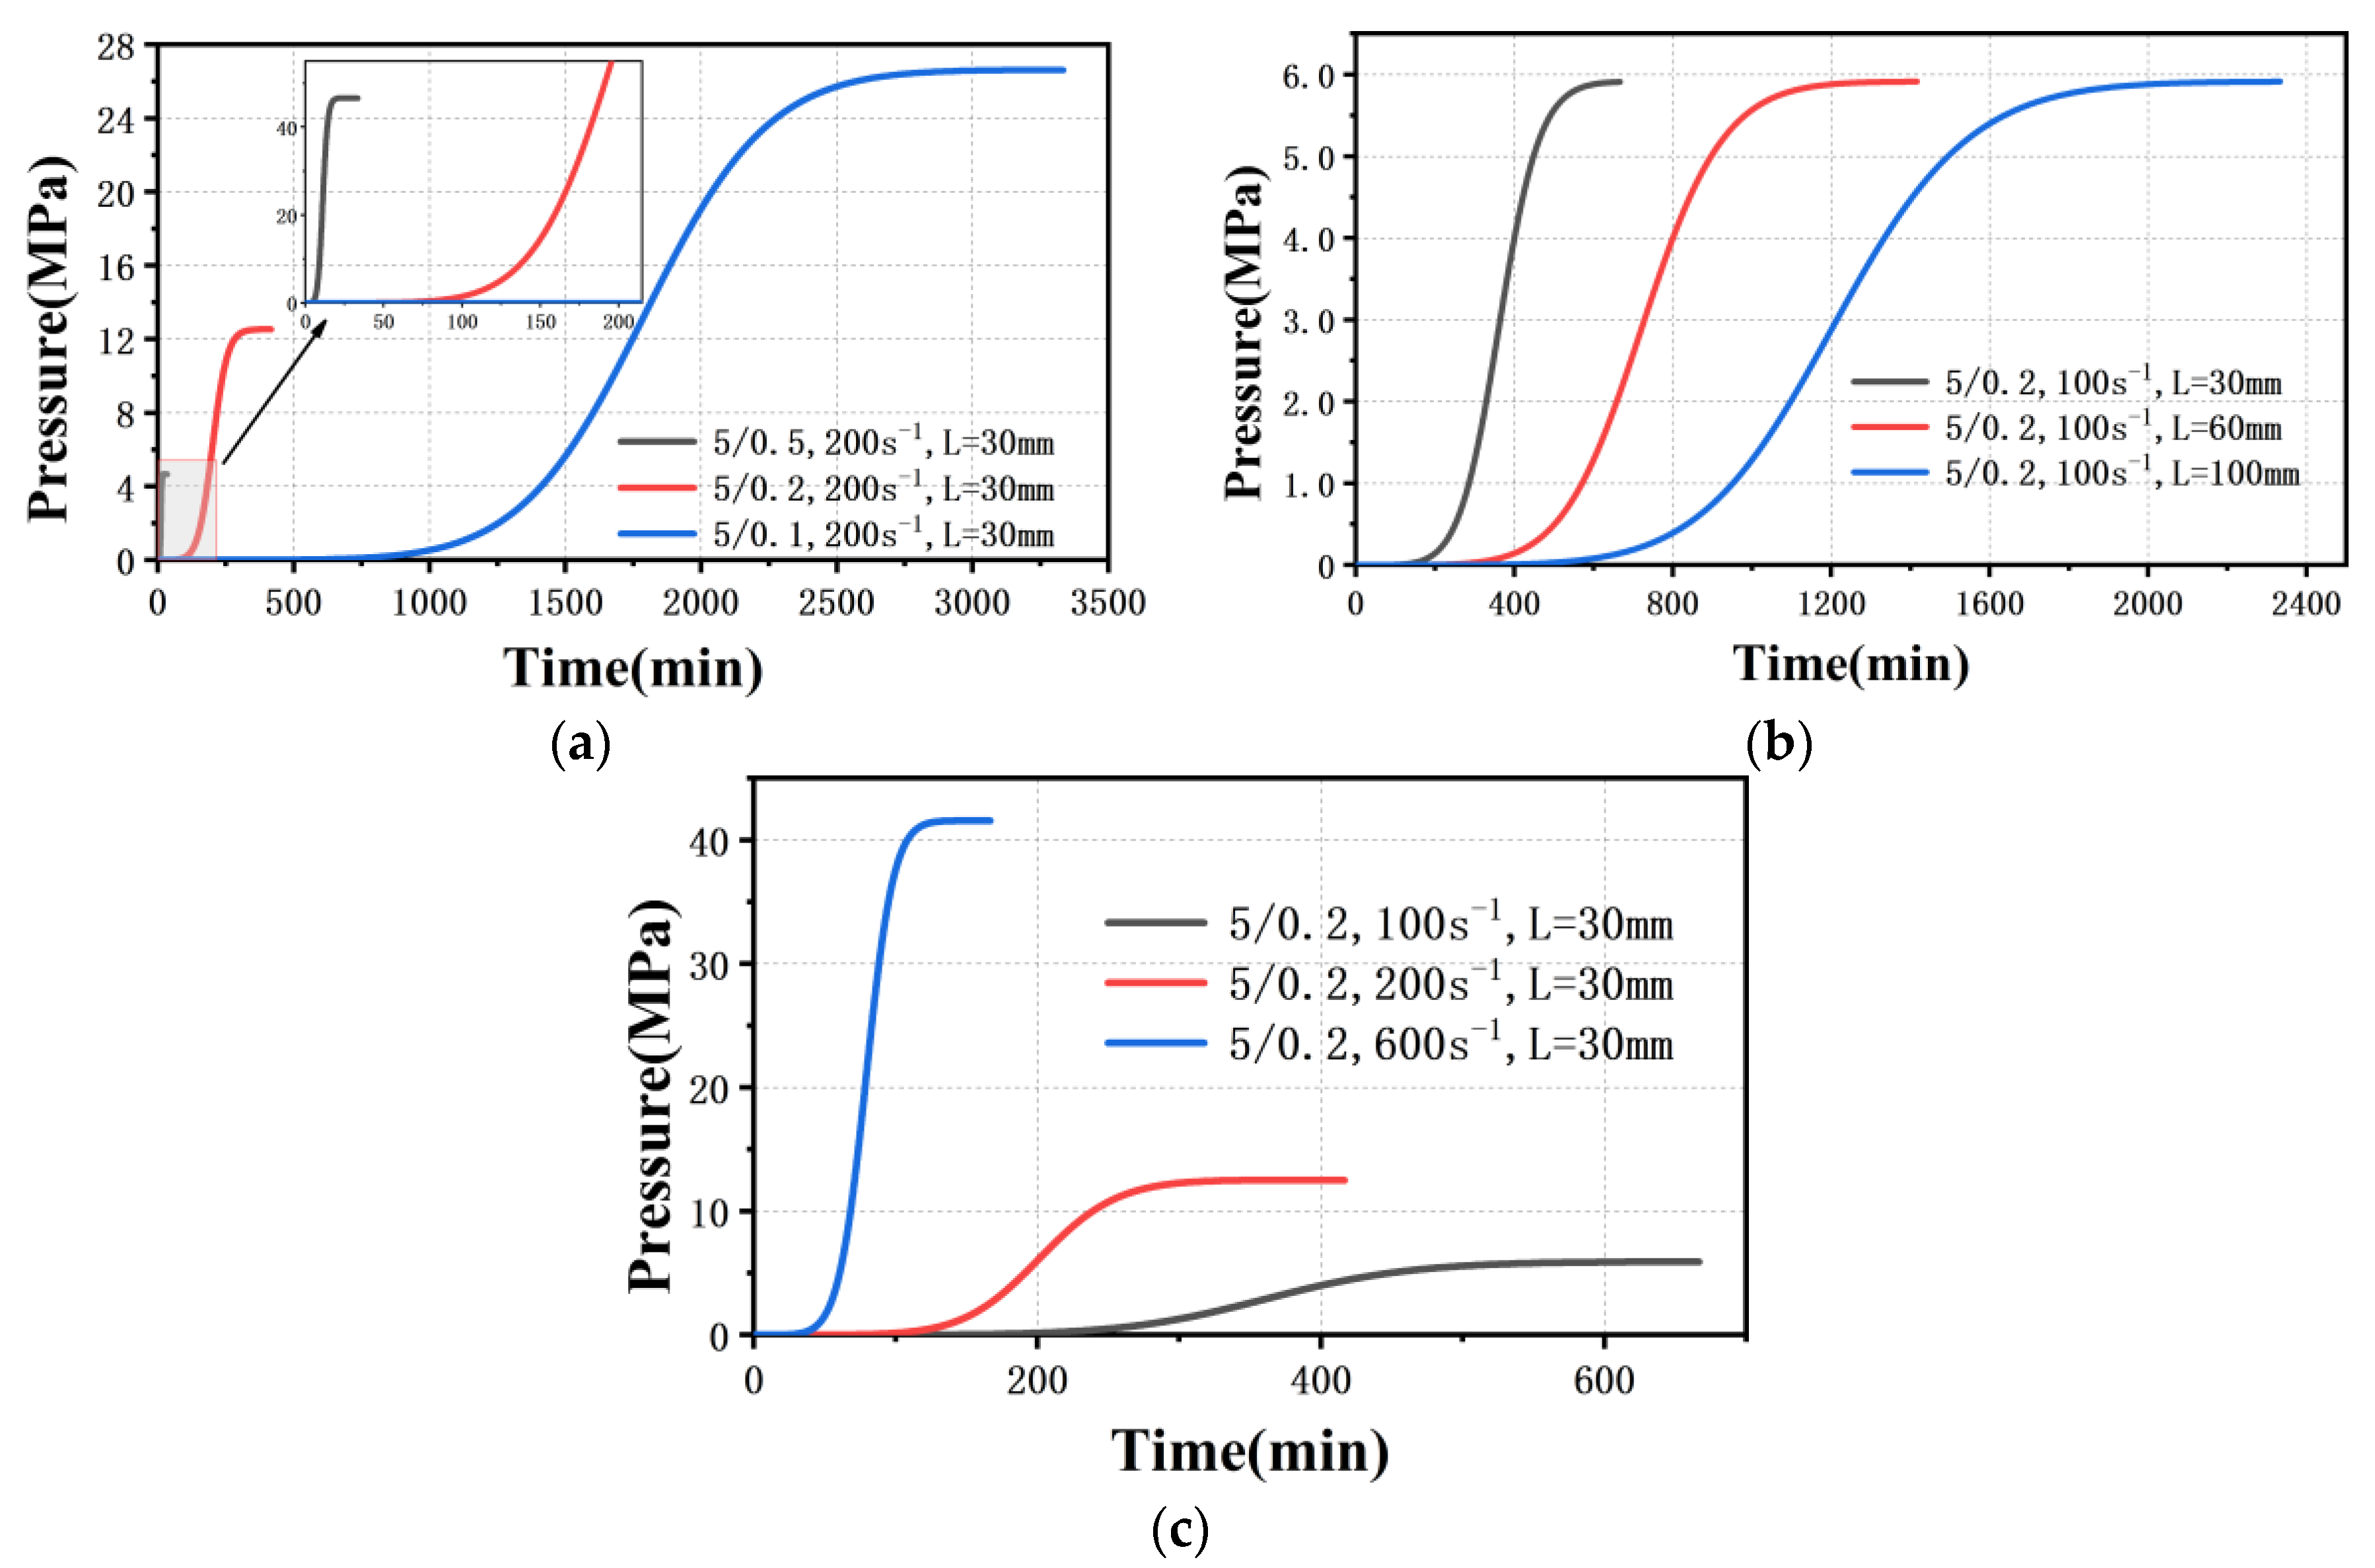
| Category | The Comparison Parameters | The Same Parameters |
|---|---|---|
| Different amounts of material | L = 30 mm | 5/0.2 (mm) 00 s−1 |
| L = 60 mm | ||
| L = 100 mm | ||
| Different die sizes | 5/0.5 (mm) | L = 30 mm 00 s−1 |
| 5/0.2 (mm) | ||
| 5/0.1 (mm) | ||
| Different shear rates | 00 s−1 | 5/0.2 (mm) L = 30 mm |
| = 200 s−1 | ||
| = 600 s−1 |
| Parameters | |||
|---|---|---|---|
| Value | 12 | 0.216 | 727 |
Publisher’s Note: MDPI stays neutral with regard to jurisdictional claims in published maps and institutional affiliations. |
© 2021 by the authors. Licensee MDPI, Basel, Switzerland. This article is an open access article distributed under the terms and conditions of the Creative Commons Attribution (CC BY) license (https://creativecommons.org/licenses/by/4.0/).
Share and Cite
Wu, W.; Zeng, K.; Zhao, B.; Duan, F.; Jiang, F. New Considerations on the Determination of the Apparent Shear Viscosity of Polymer Melt with Micro Capillary Dies. Polymers 2021, 13, 4451. https://doi.org/10.3390/polym13244451
Wu W, Zeng K, Zhao B, Duan F, Jiang F. New Considerations on the Determination of the Apparent Shear Viscosity of Polymer Melt with Micro Capillary Dies. Polymers. 2021; 13(24):4451. https://doi.org/10.3390/polym13244451
Chicago/Turabian StyleWu, Wangqing, Ke Zeng, Baishun Zhao, Fengnan Duan, and Fengze Jiang. 2021. "New Considerations on the Determination of the Apparent Shear Viscosity of Polymer Melt with Micro Capillary Dies" Polymers 13, no. 24: 4451. https://doi.org/10.3390/polym13244451