
Analysis of Acrylic and Methacrylic Networks through Pyrolysis-GC/MS

Abstract
:1. Introduction
2. Materials and Methods
3. Results
3.1. Prerequisites
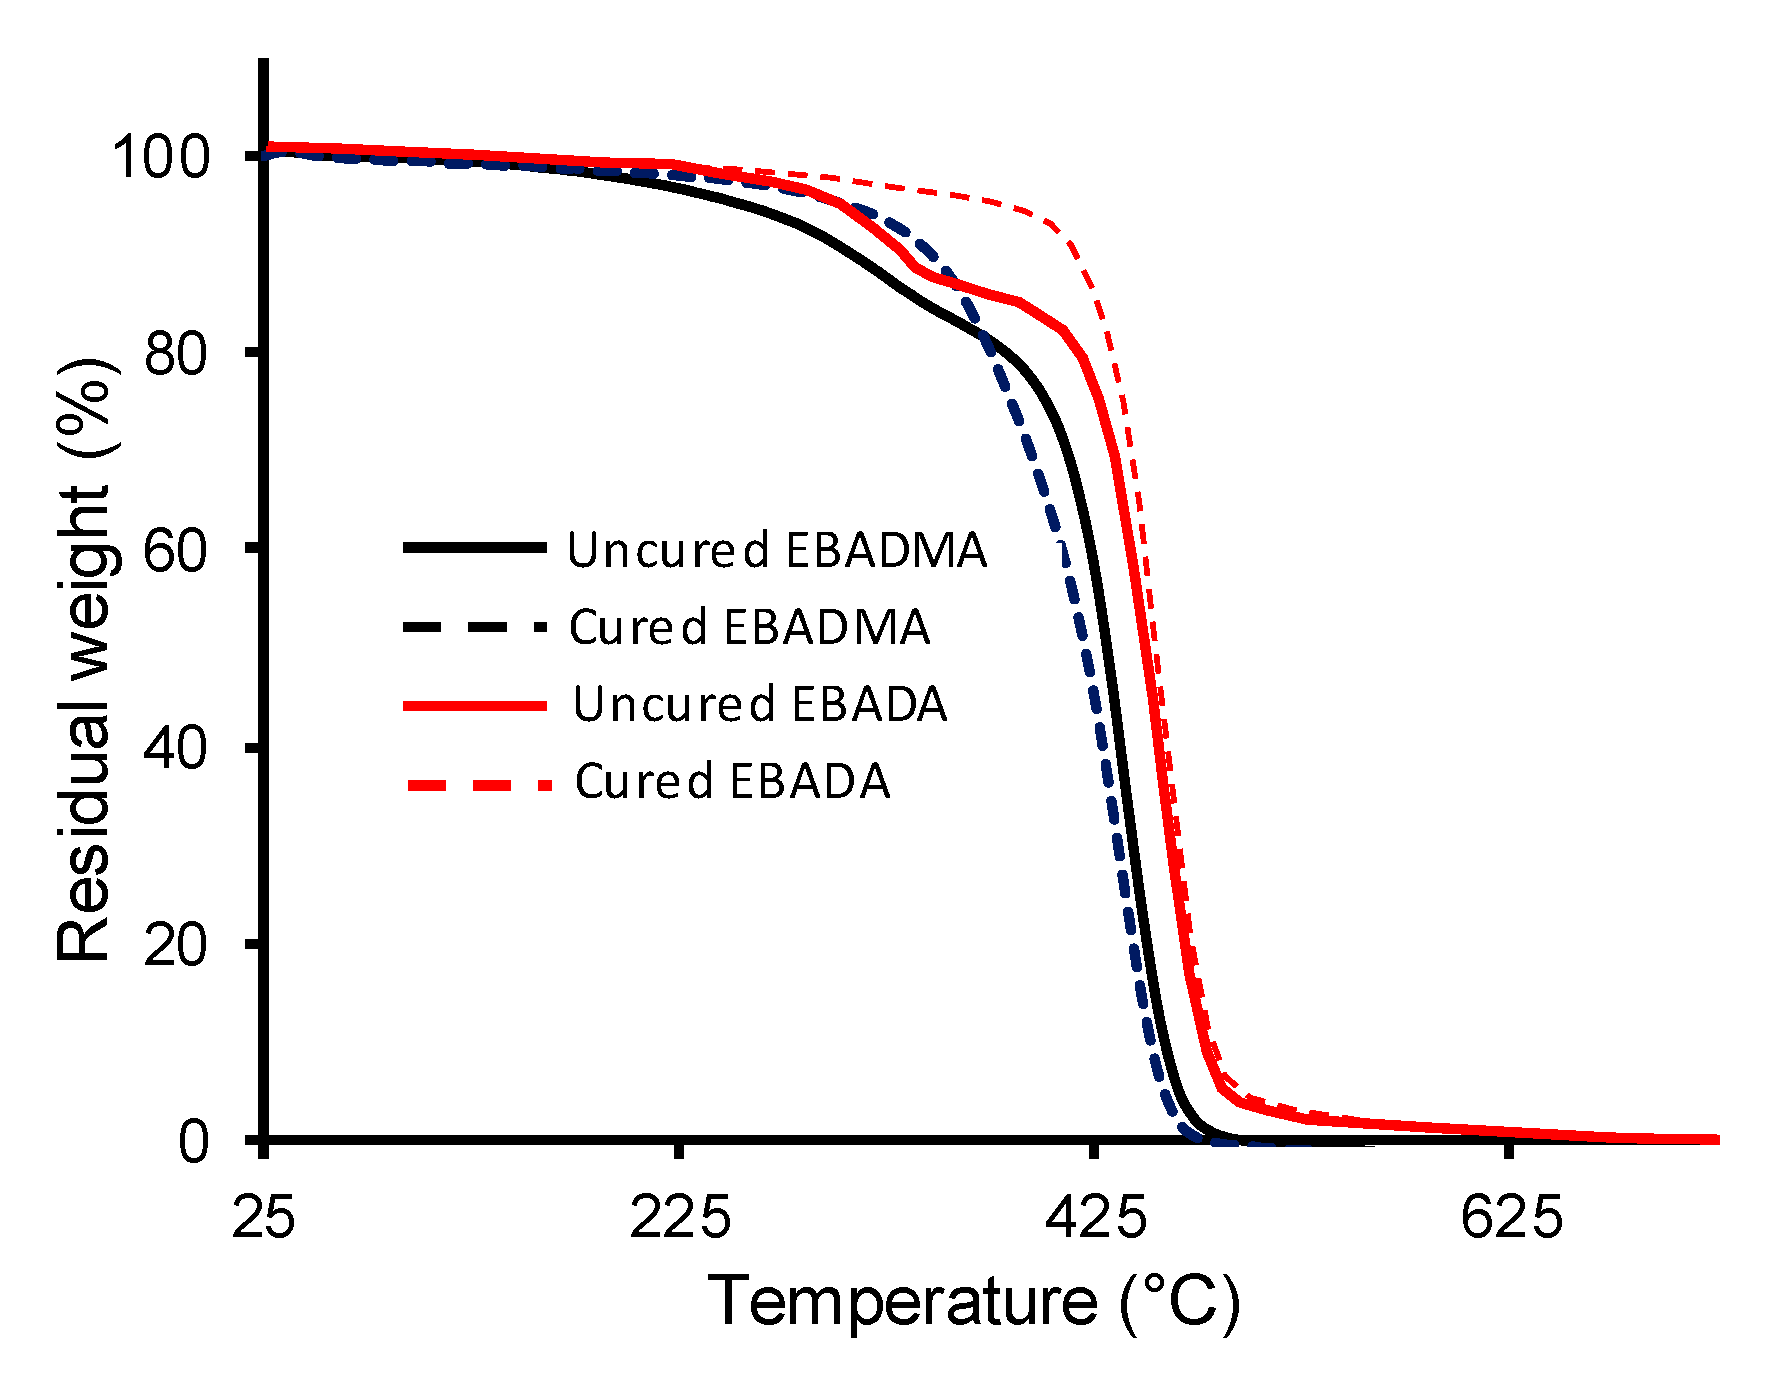
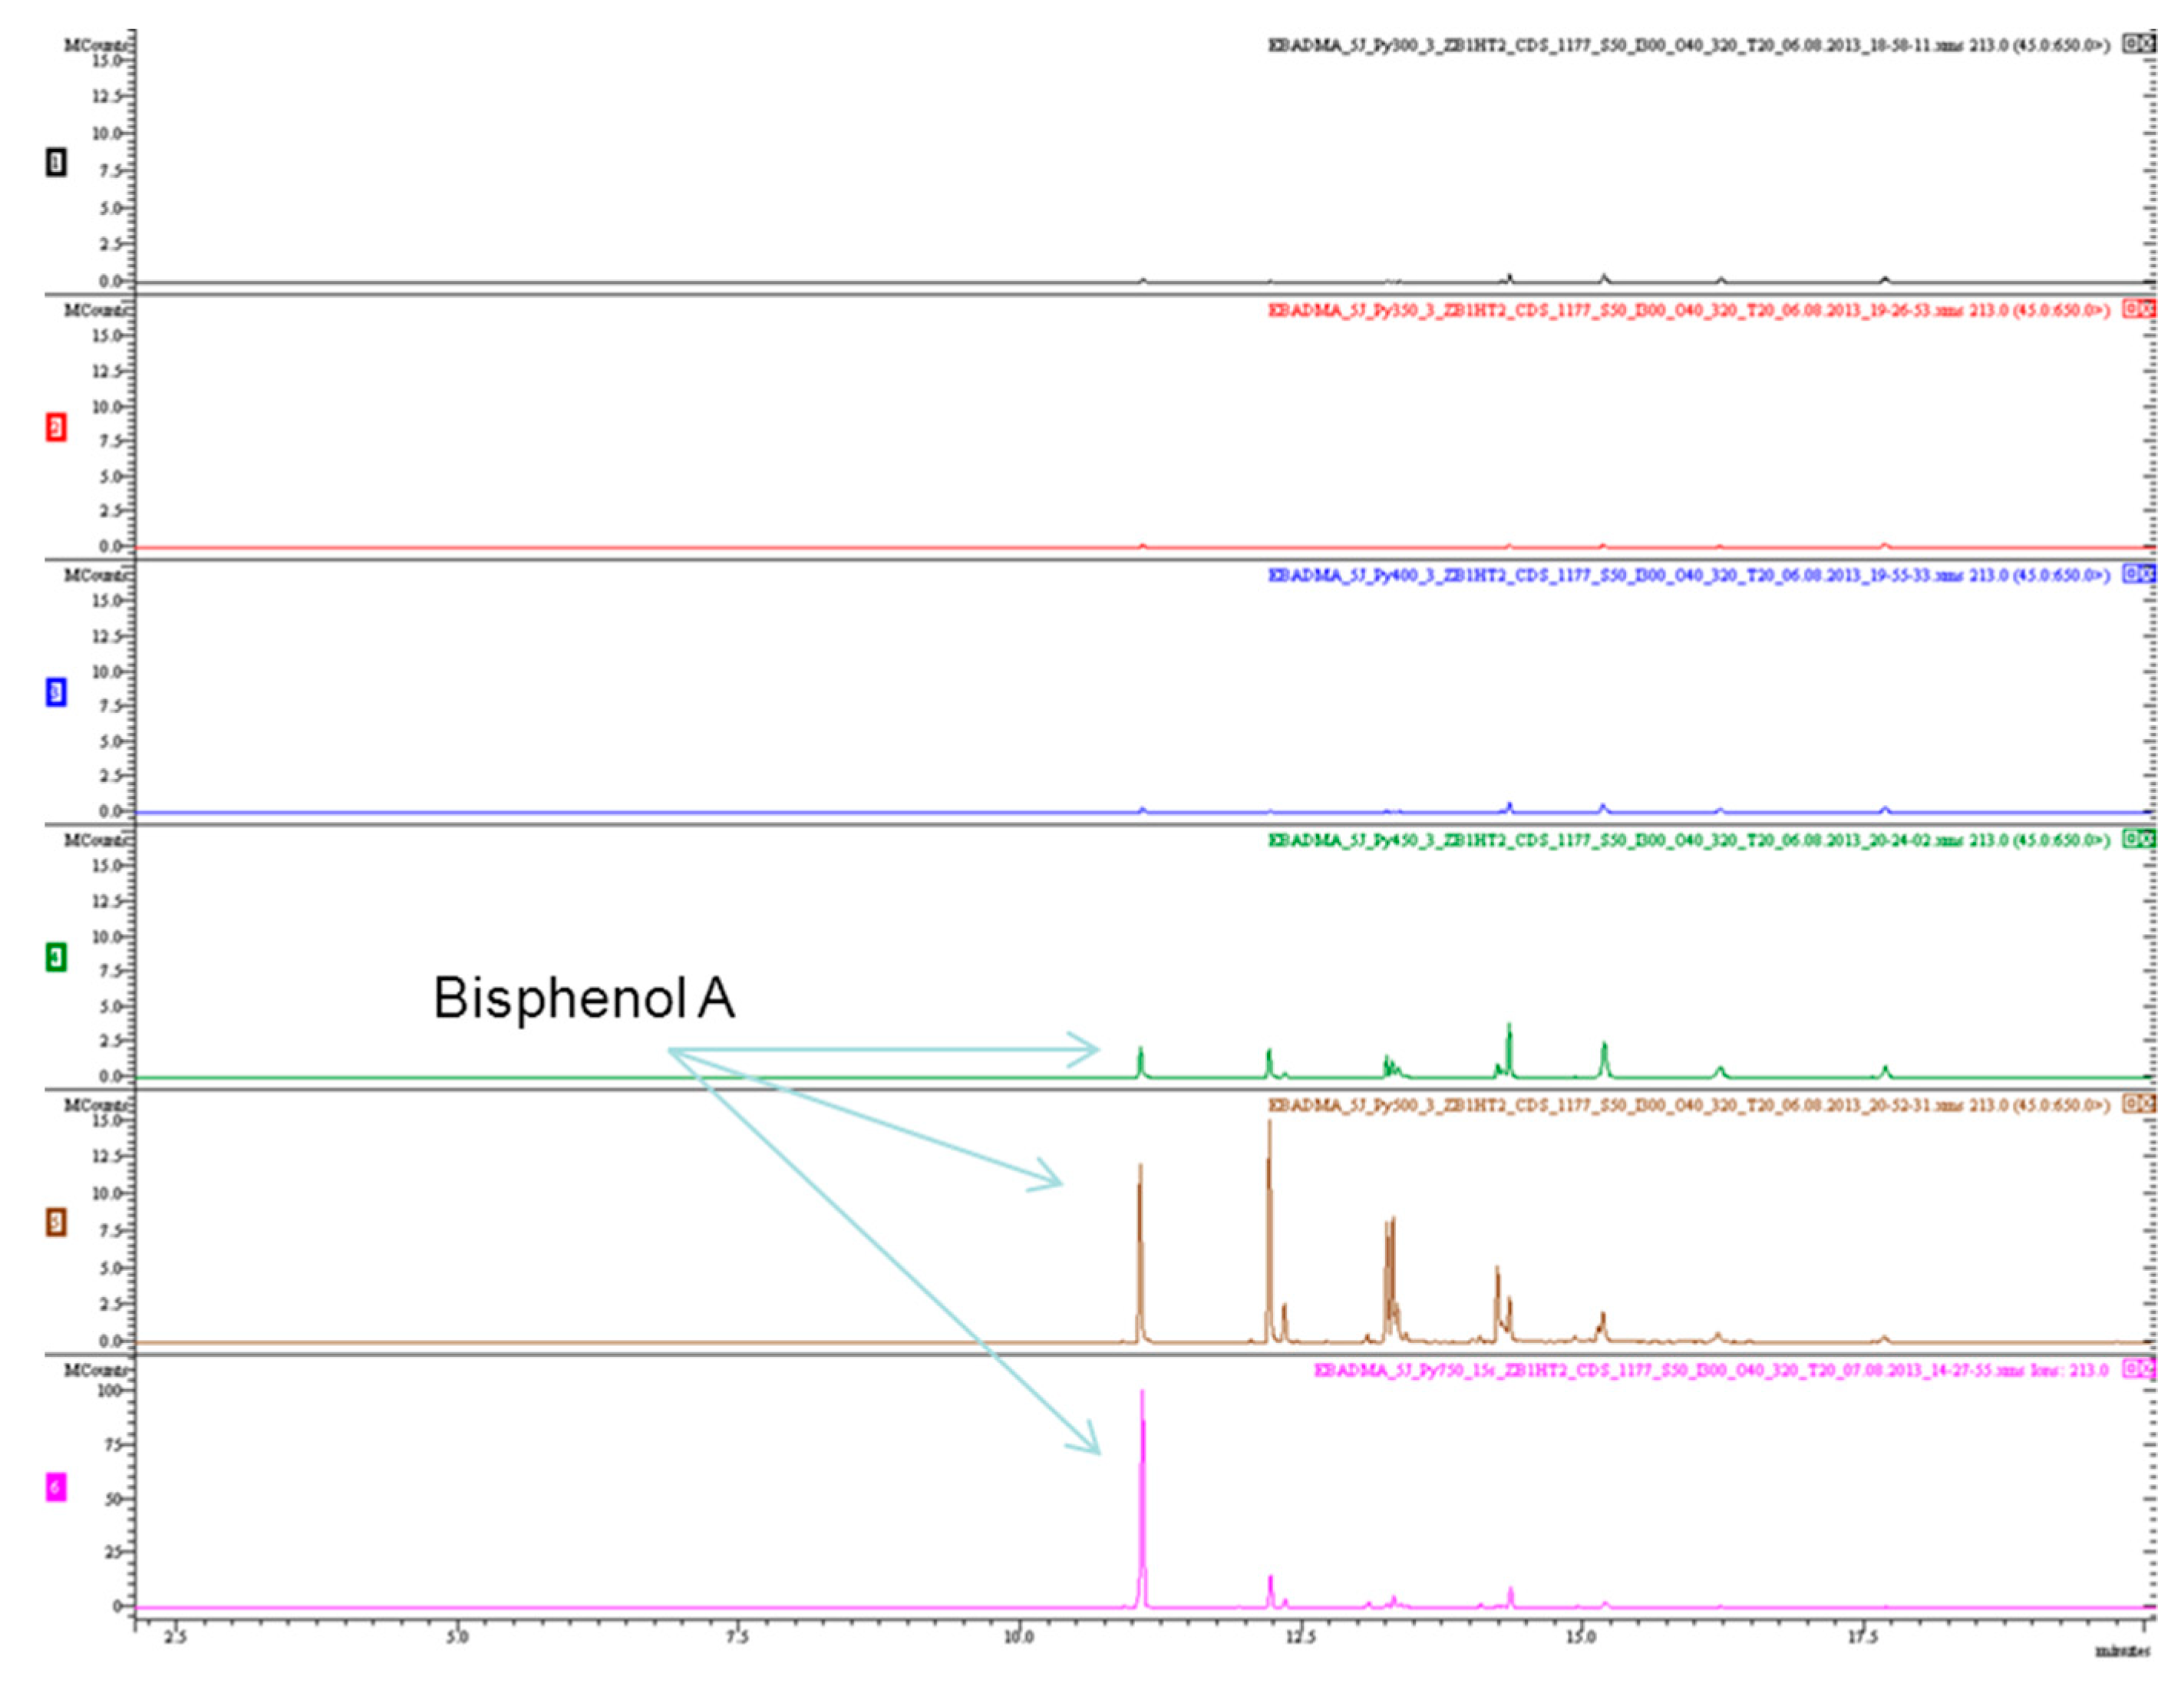
3.2. Degassing Temperature Determination
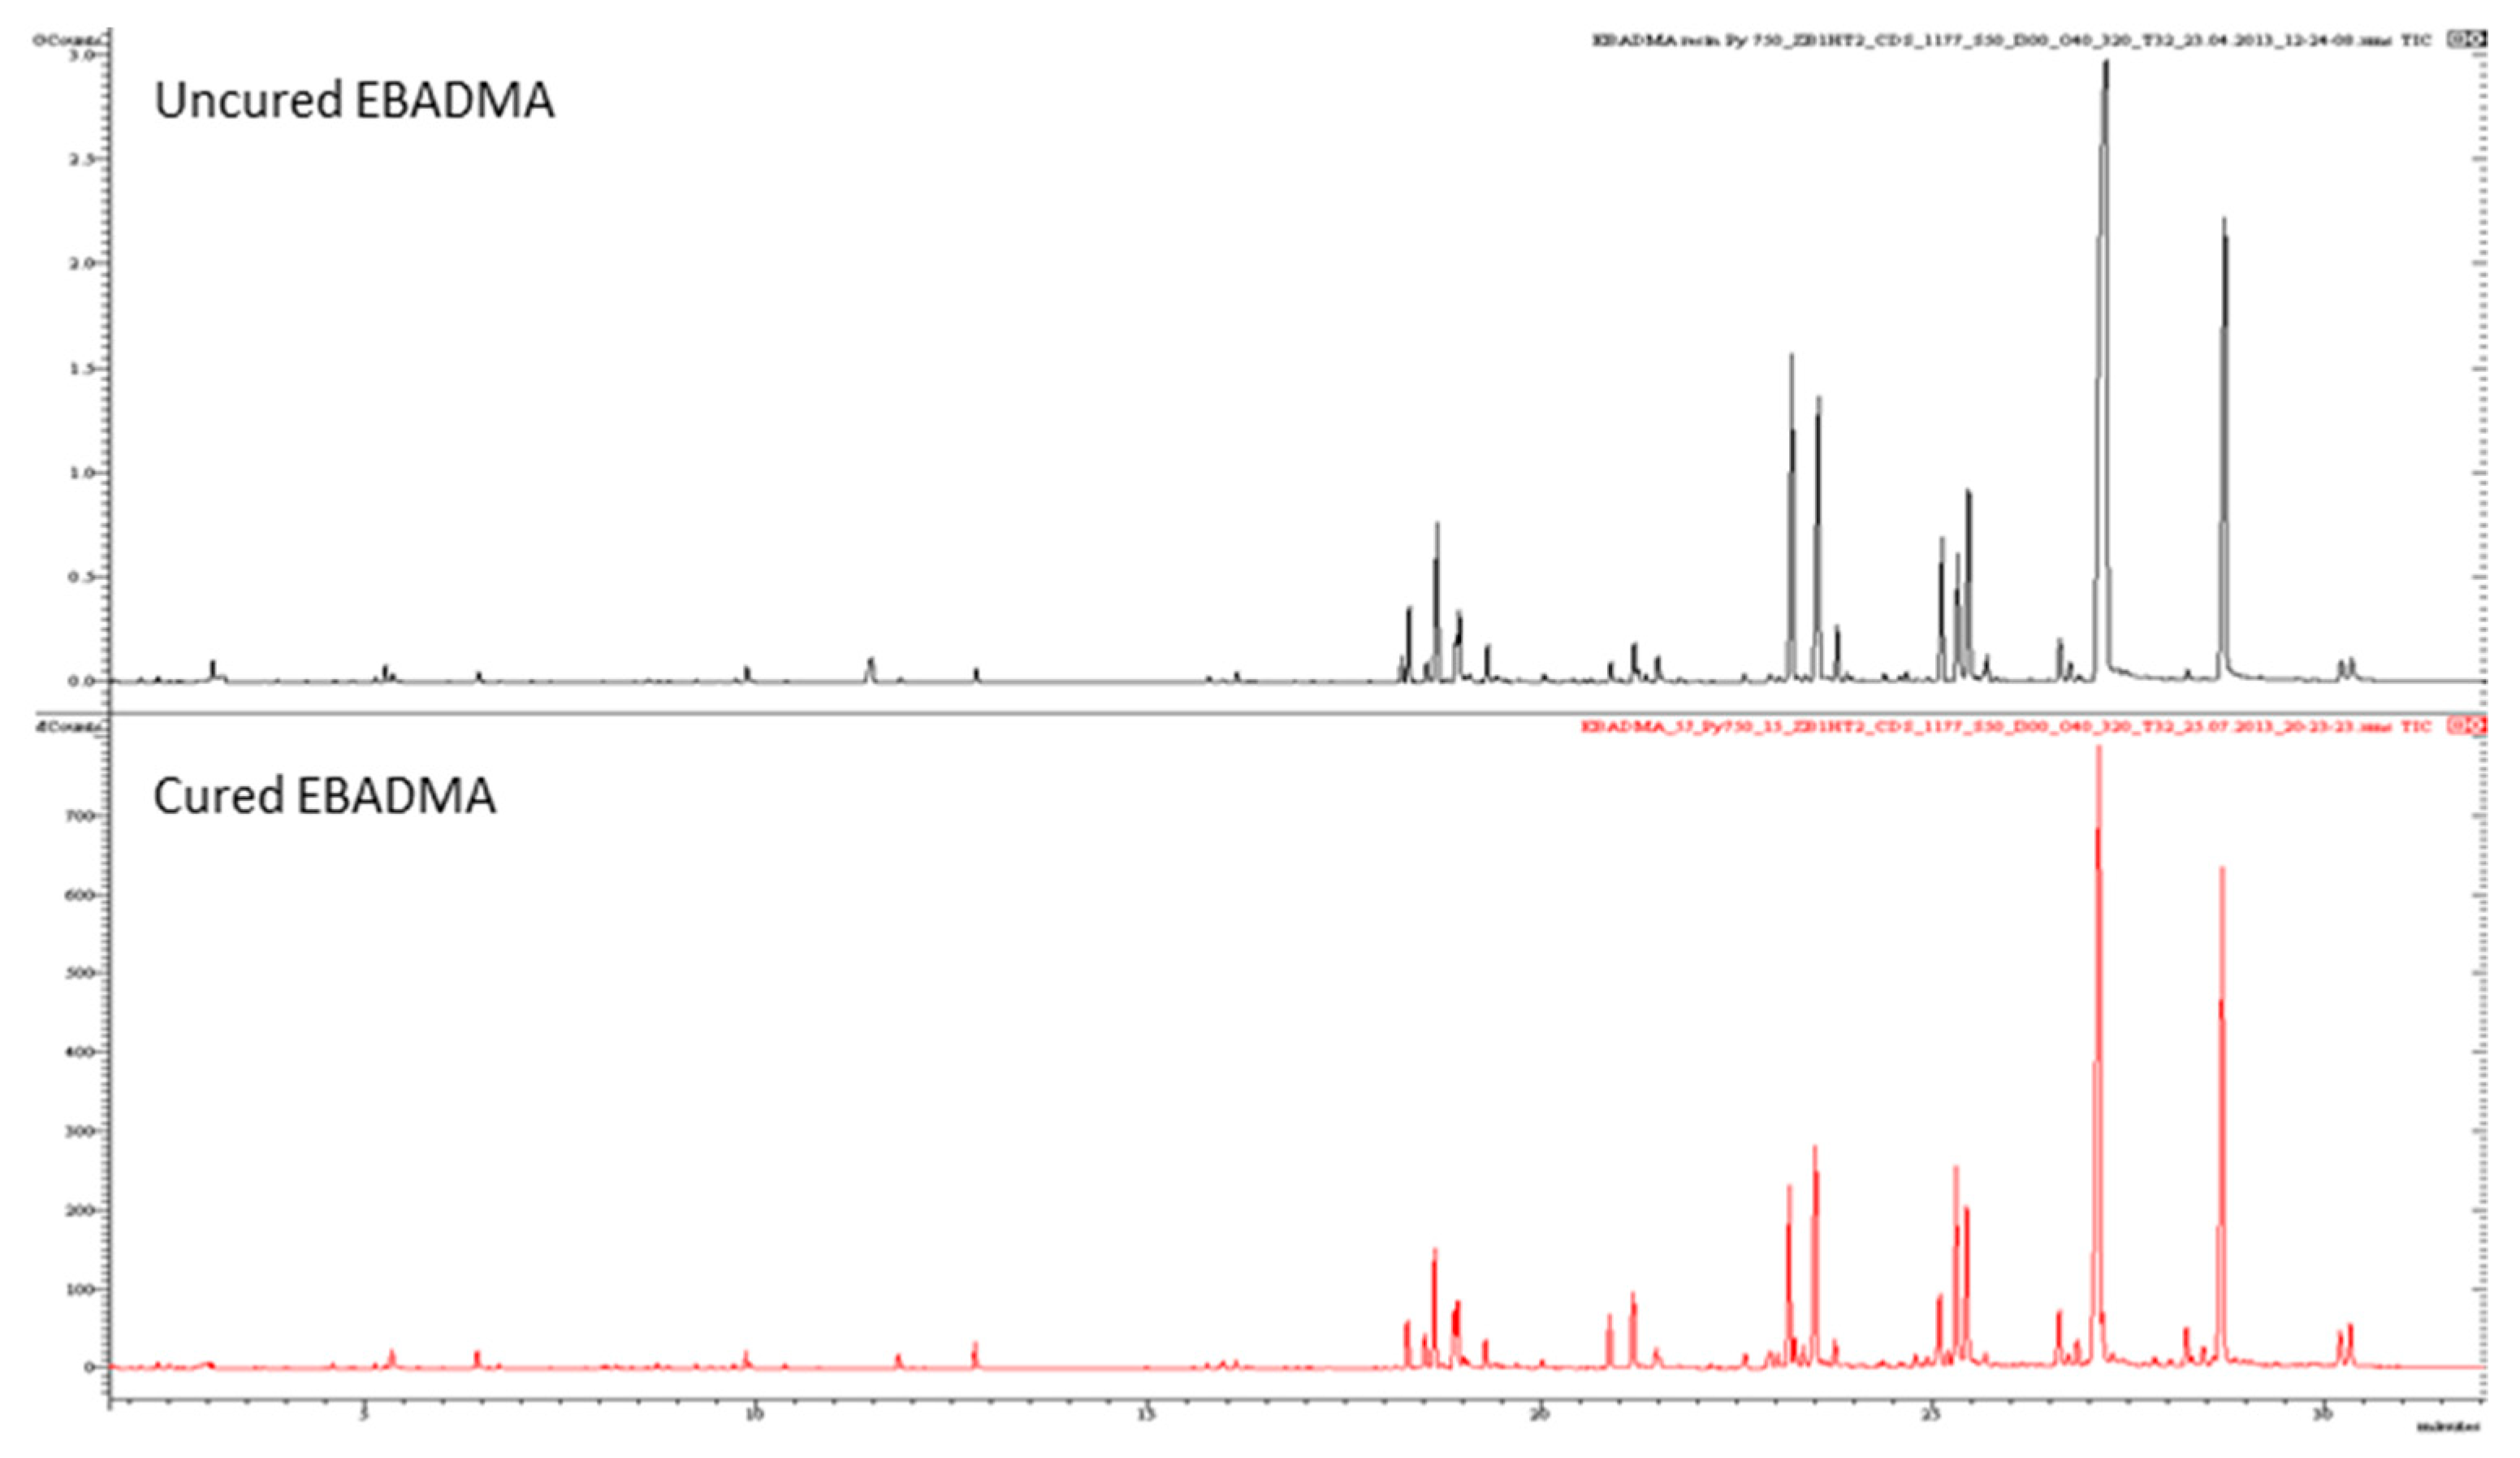
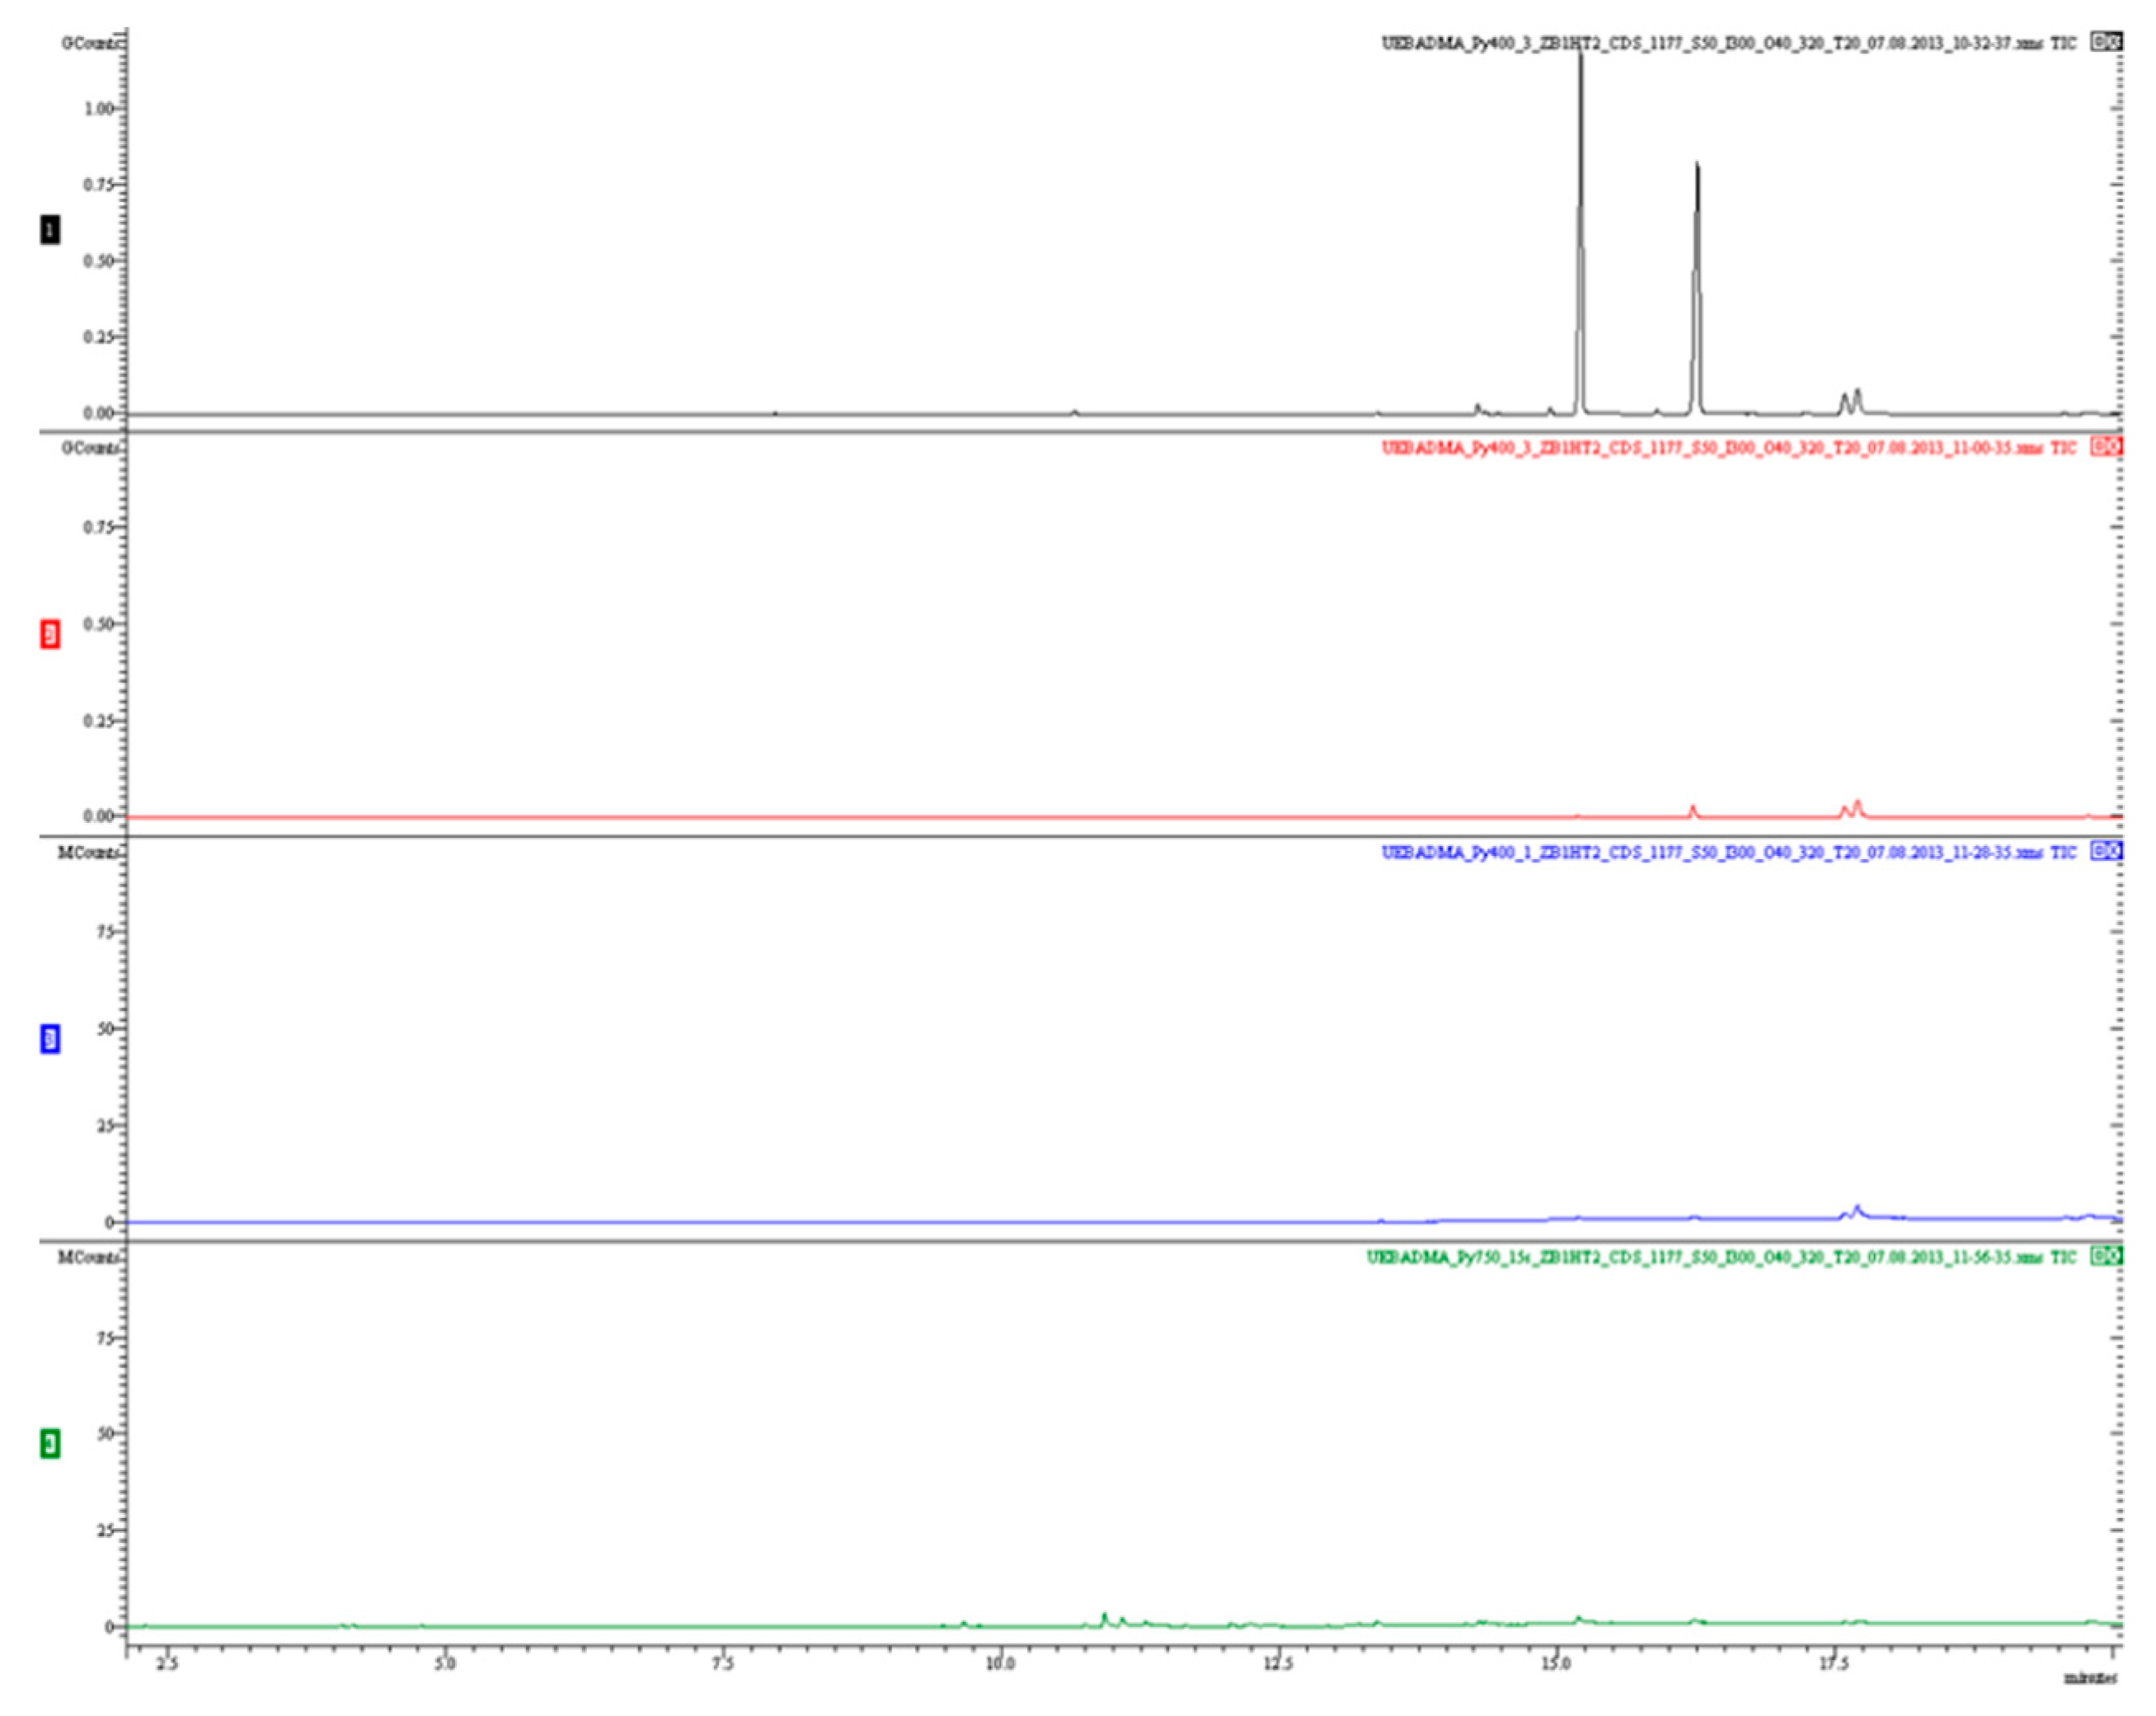
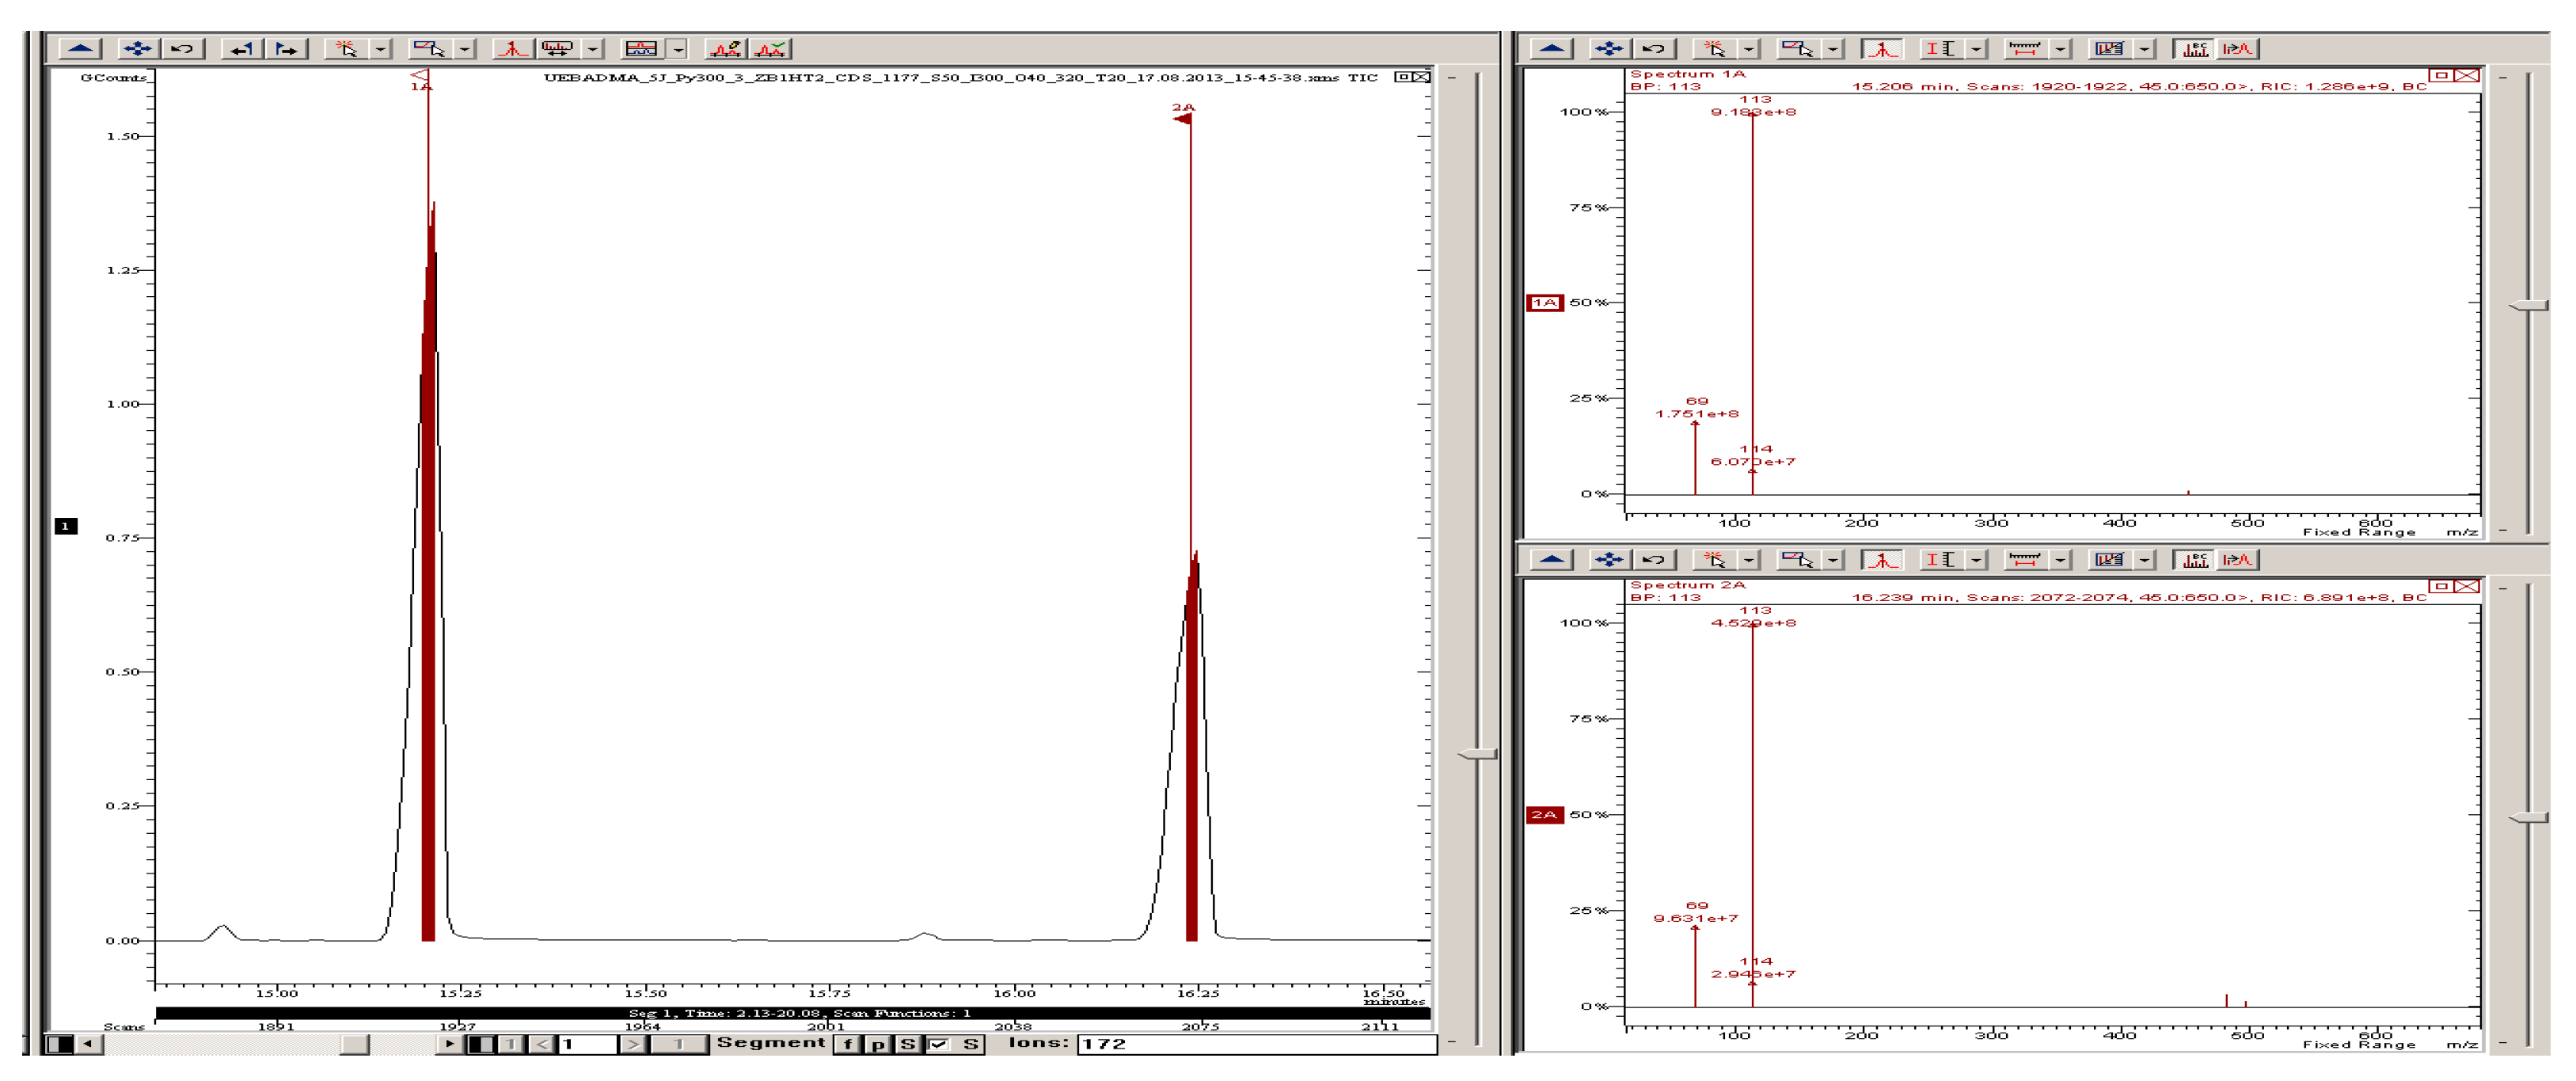
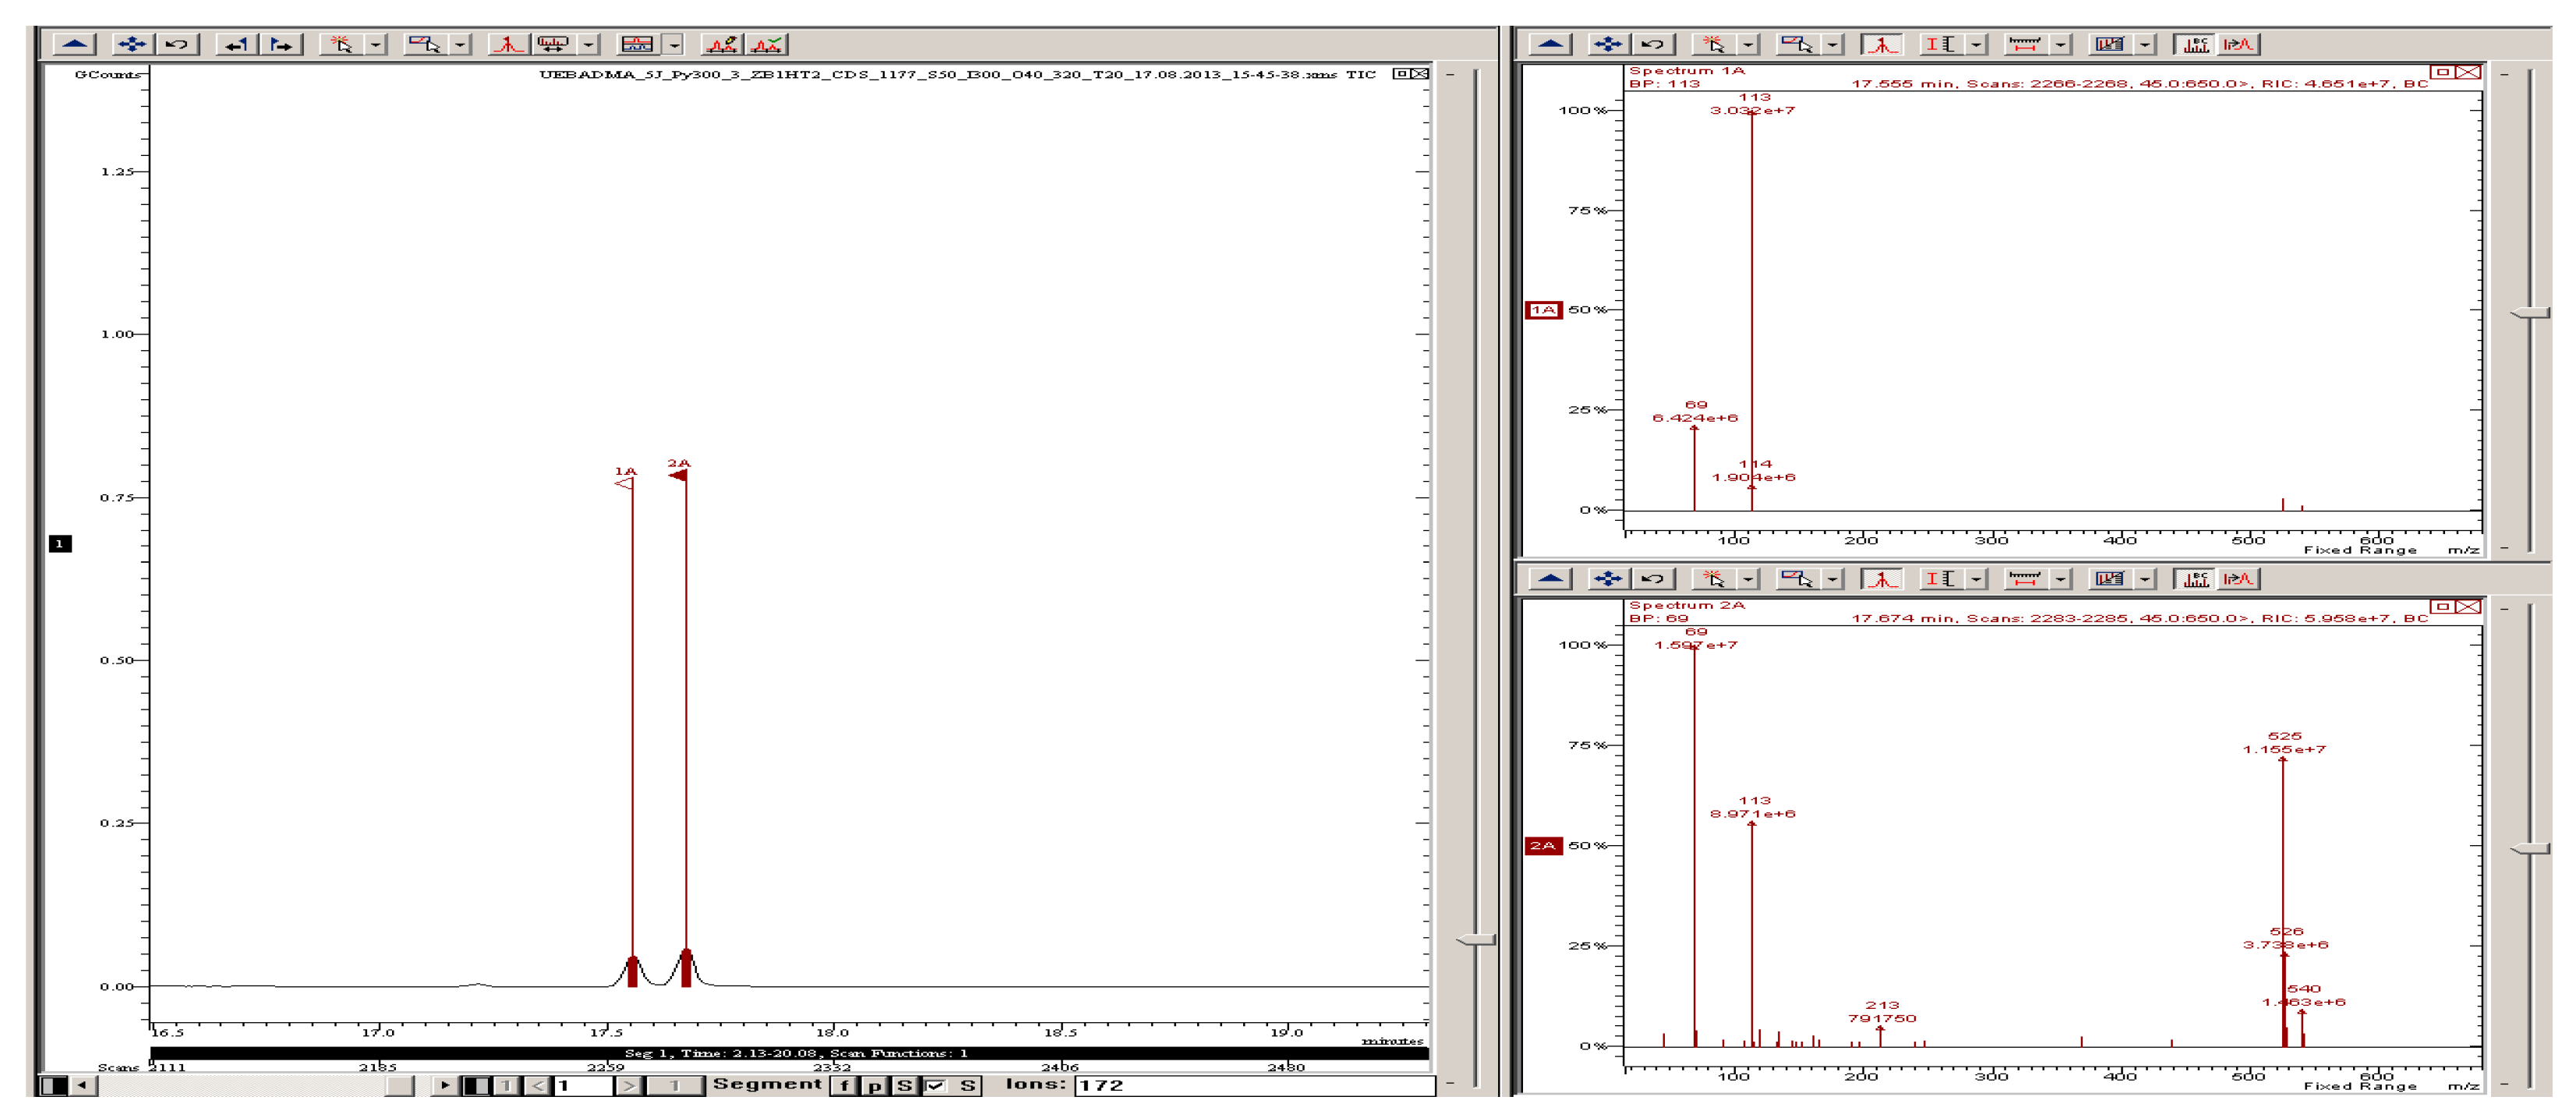
3.3. Analysis of Uncured EBADMA Resin
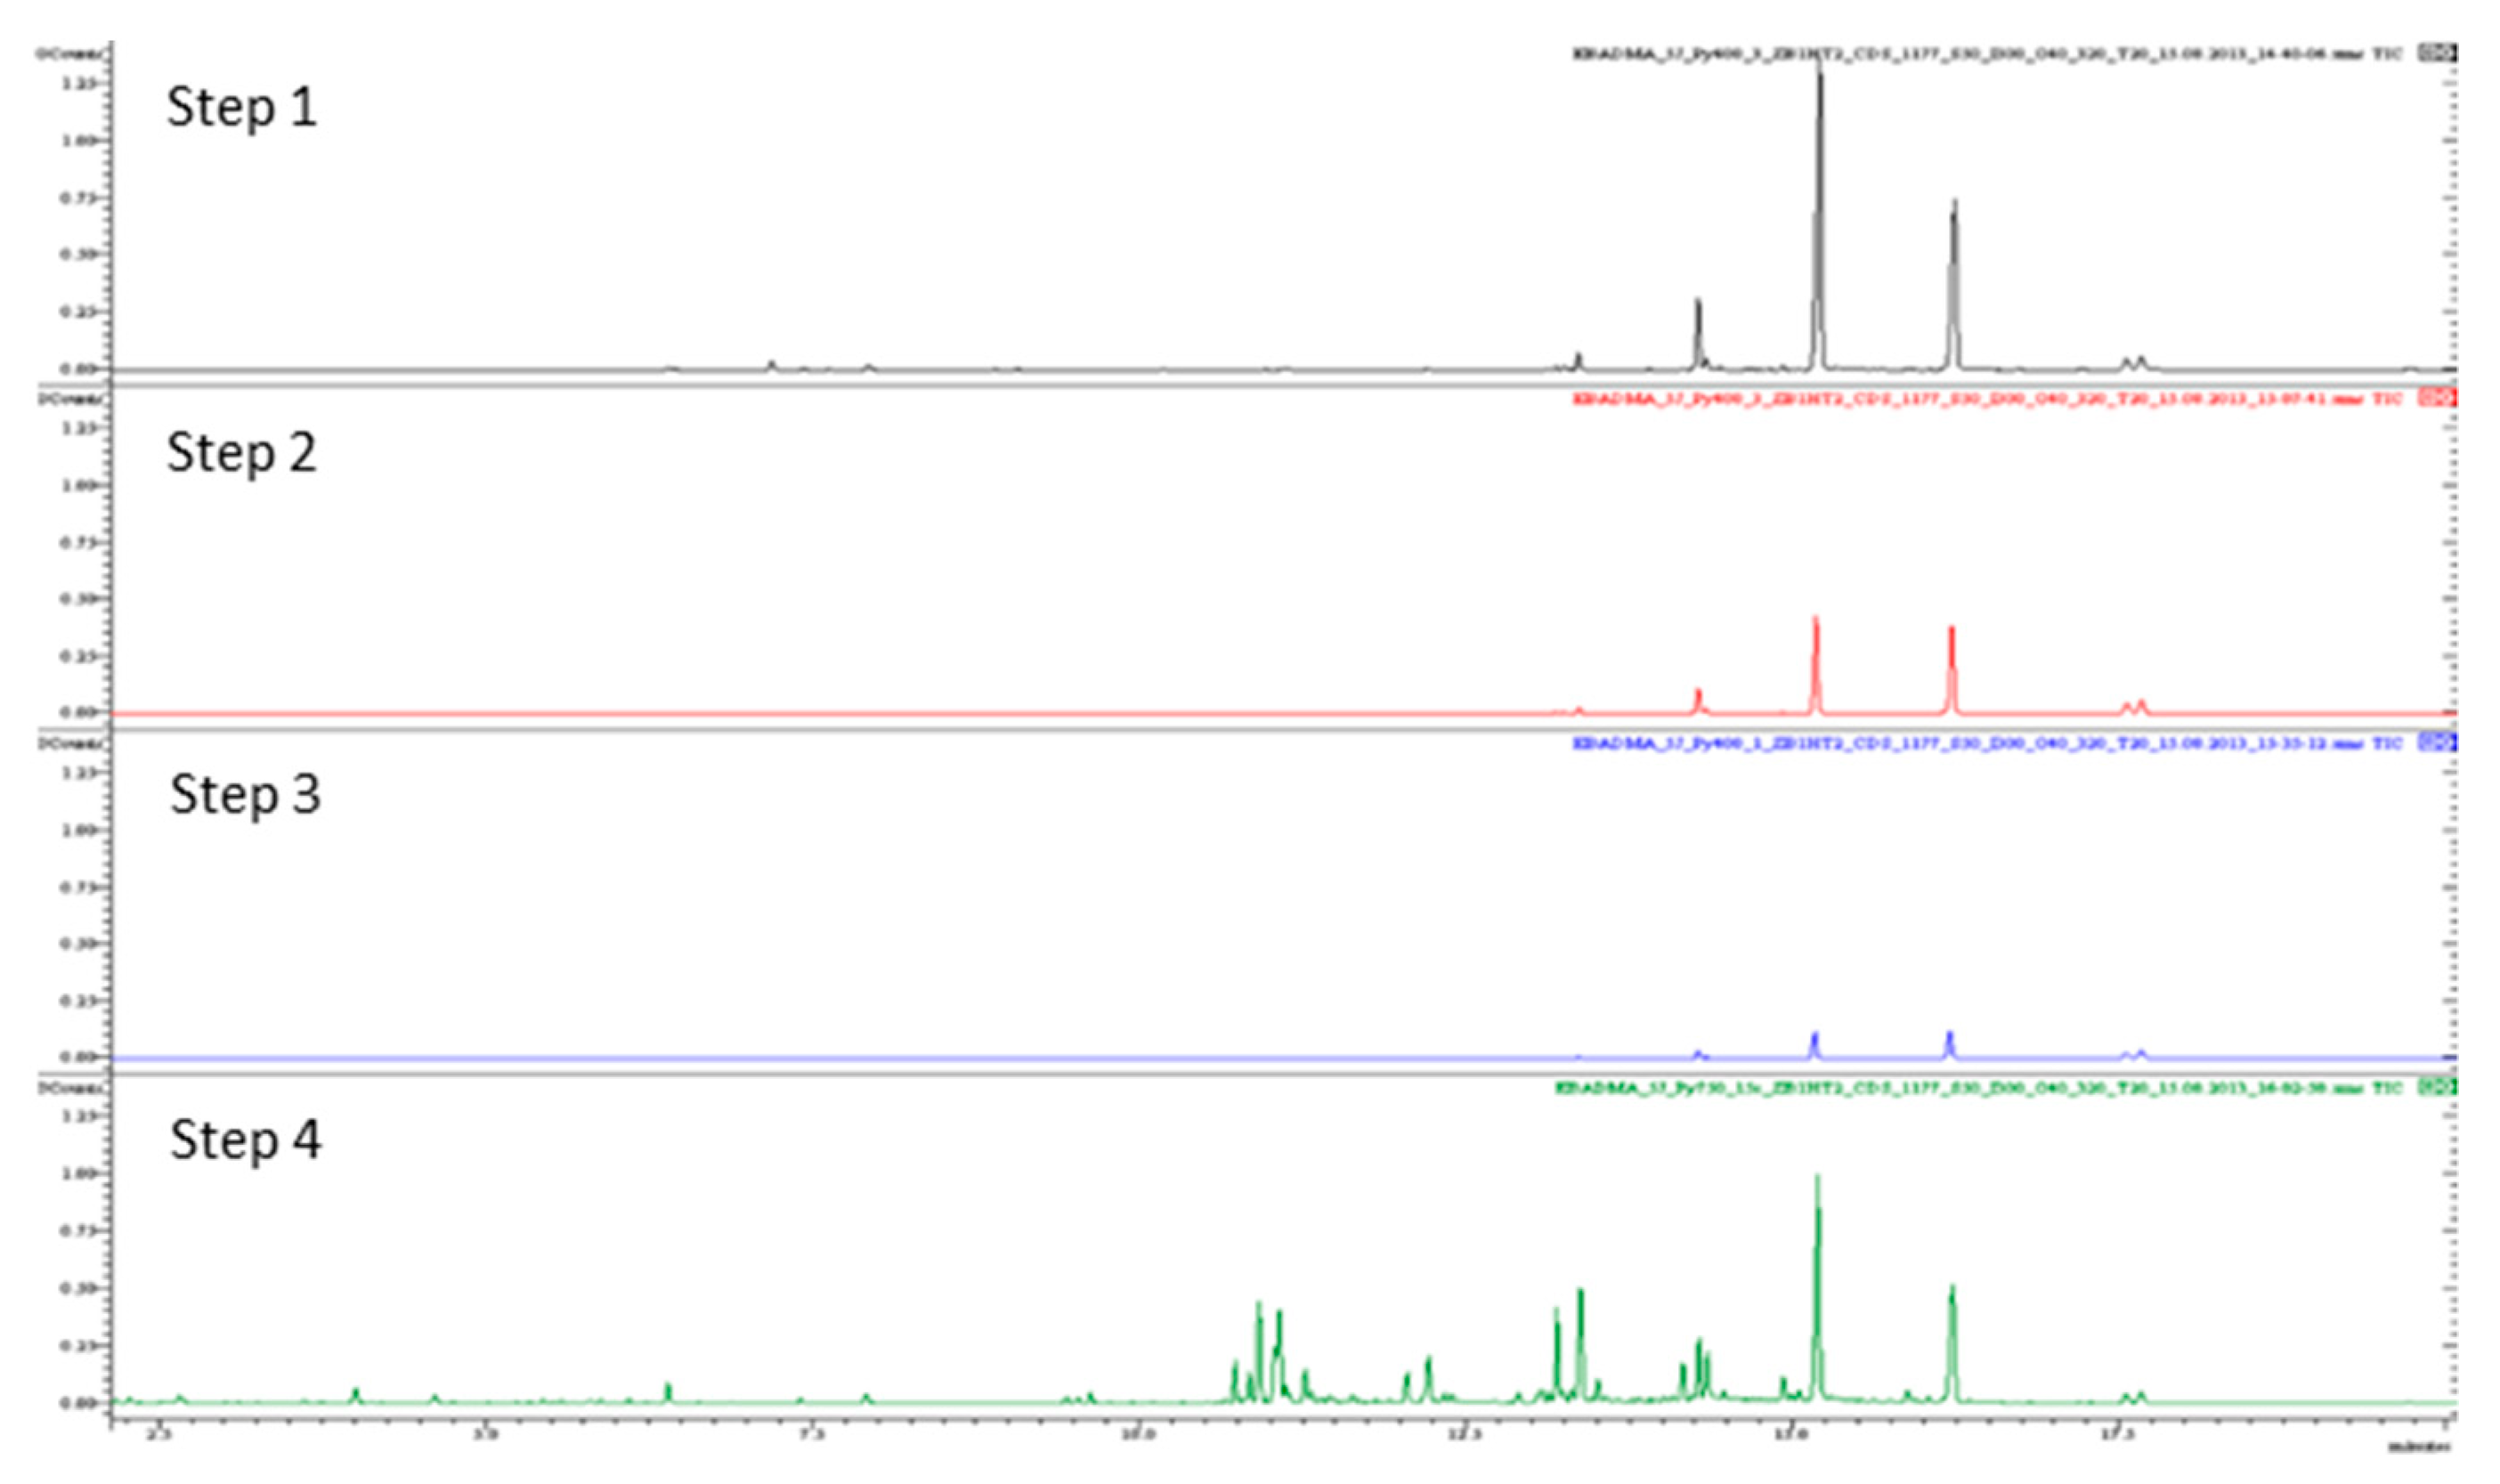
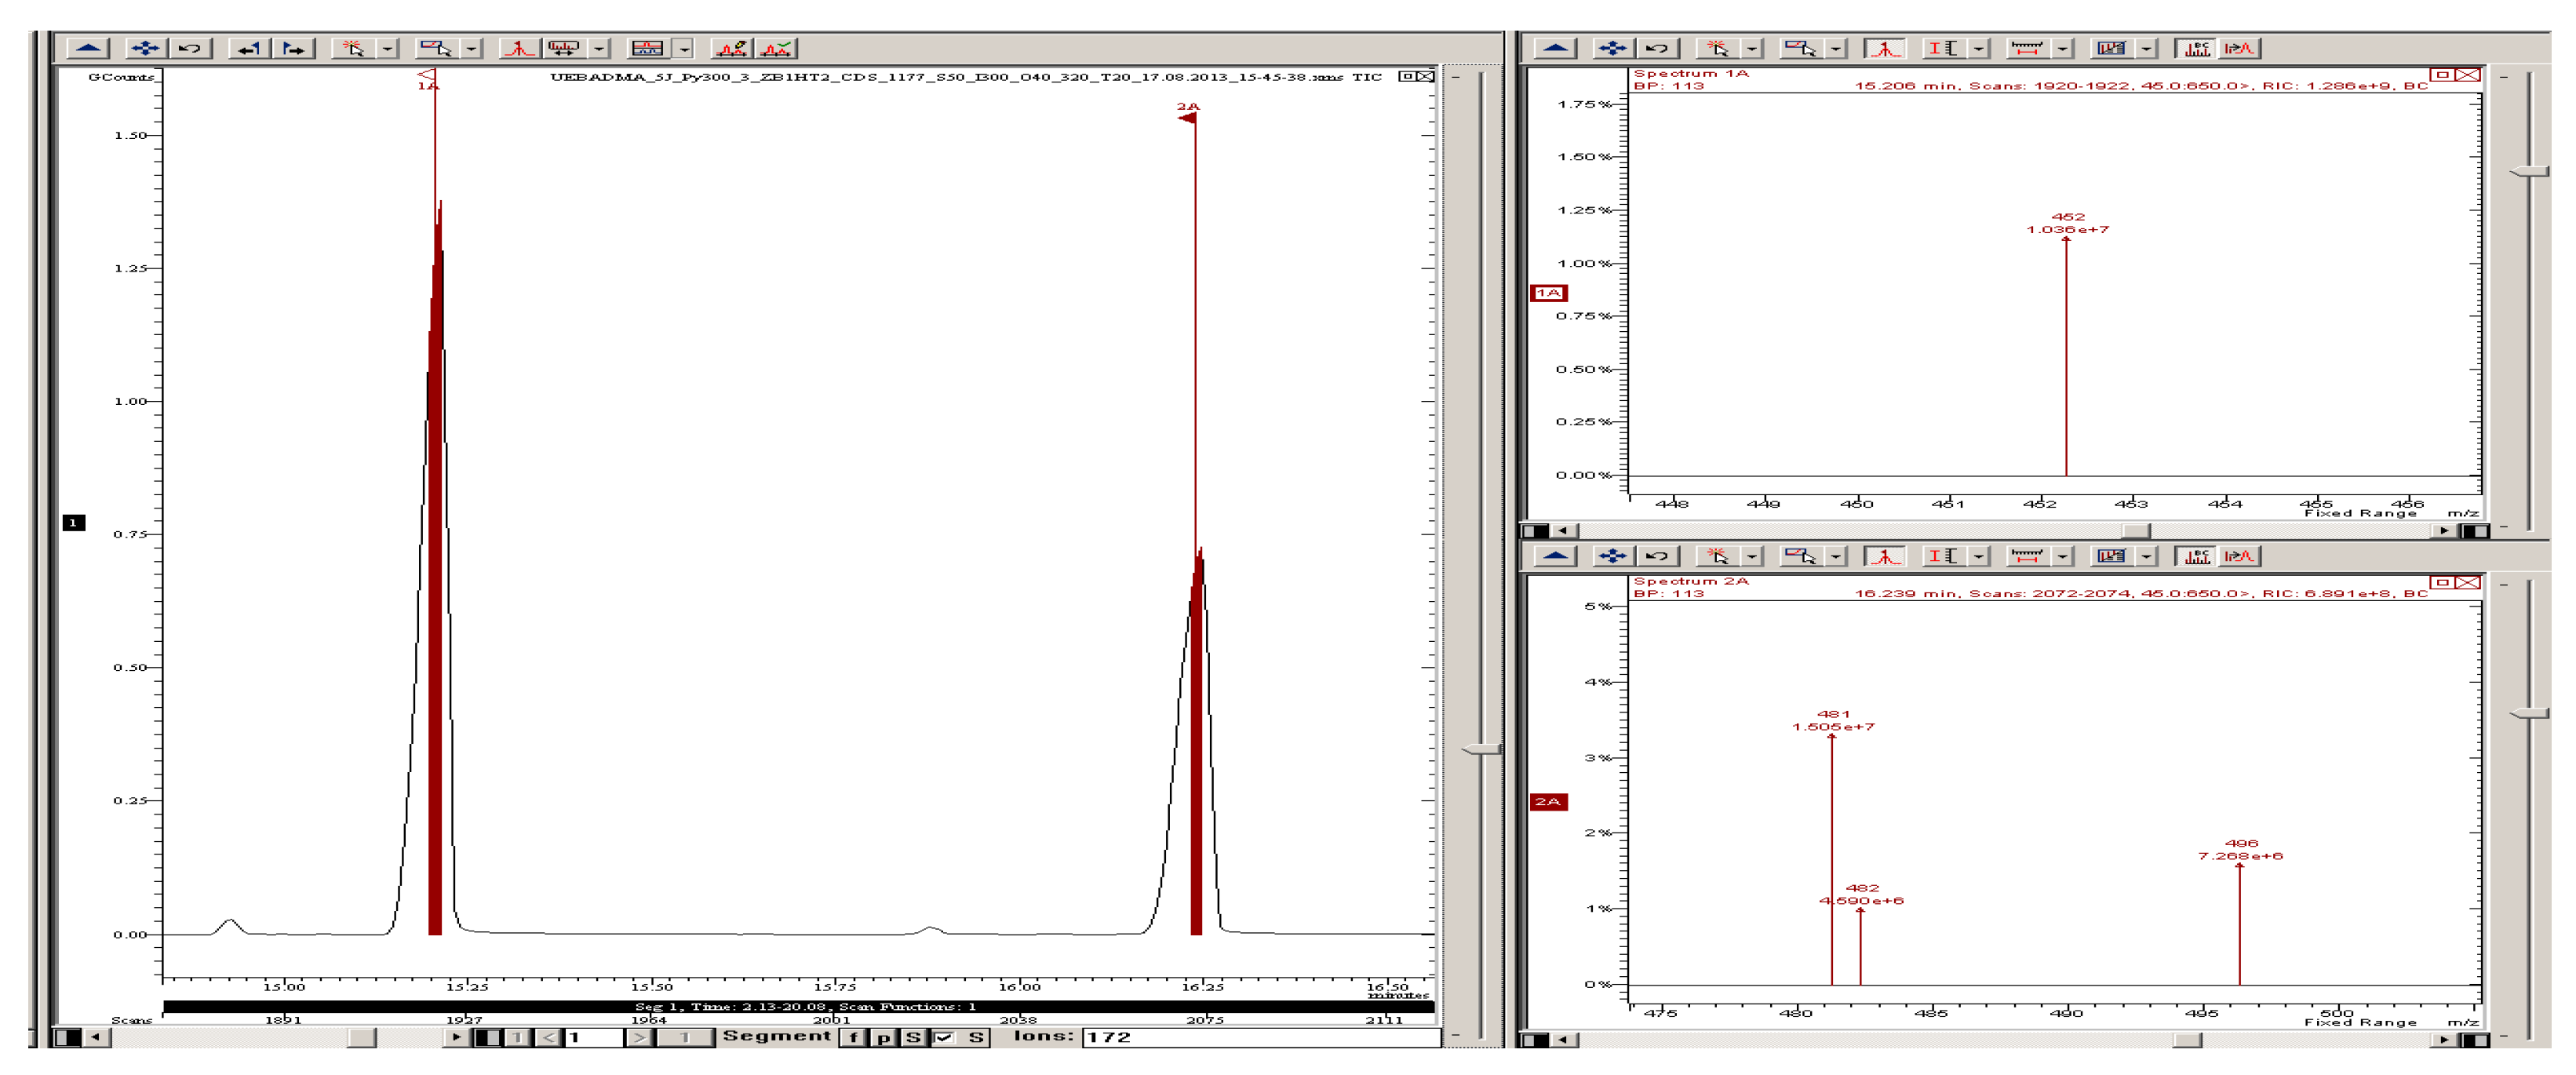
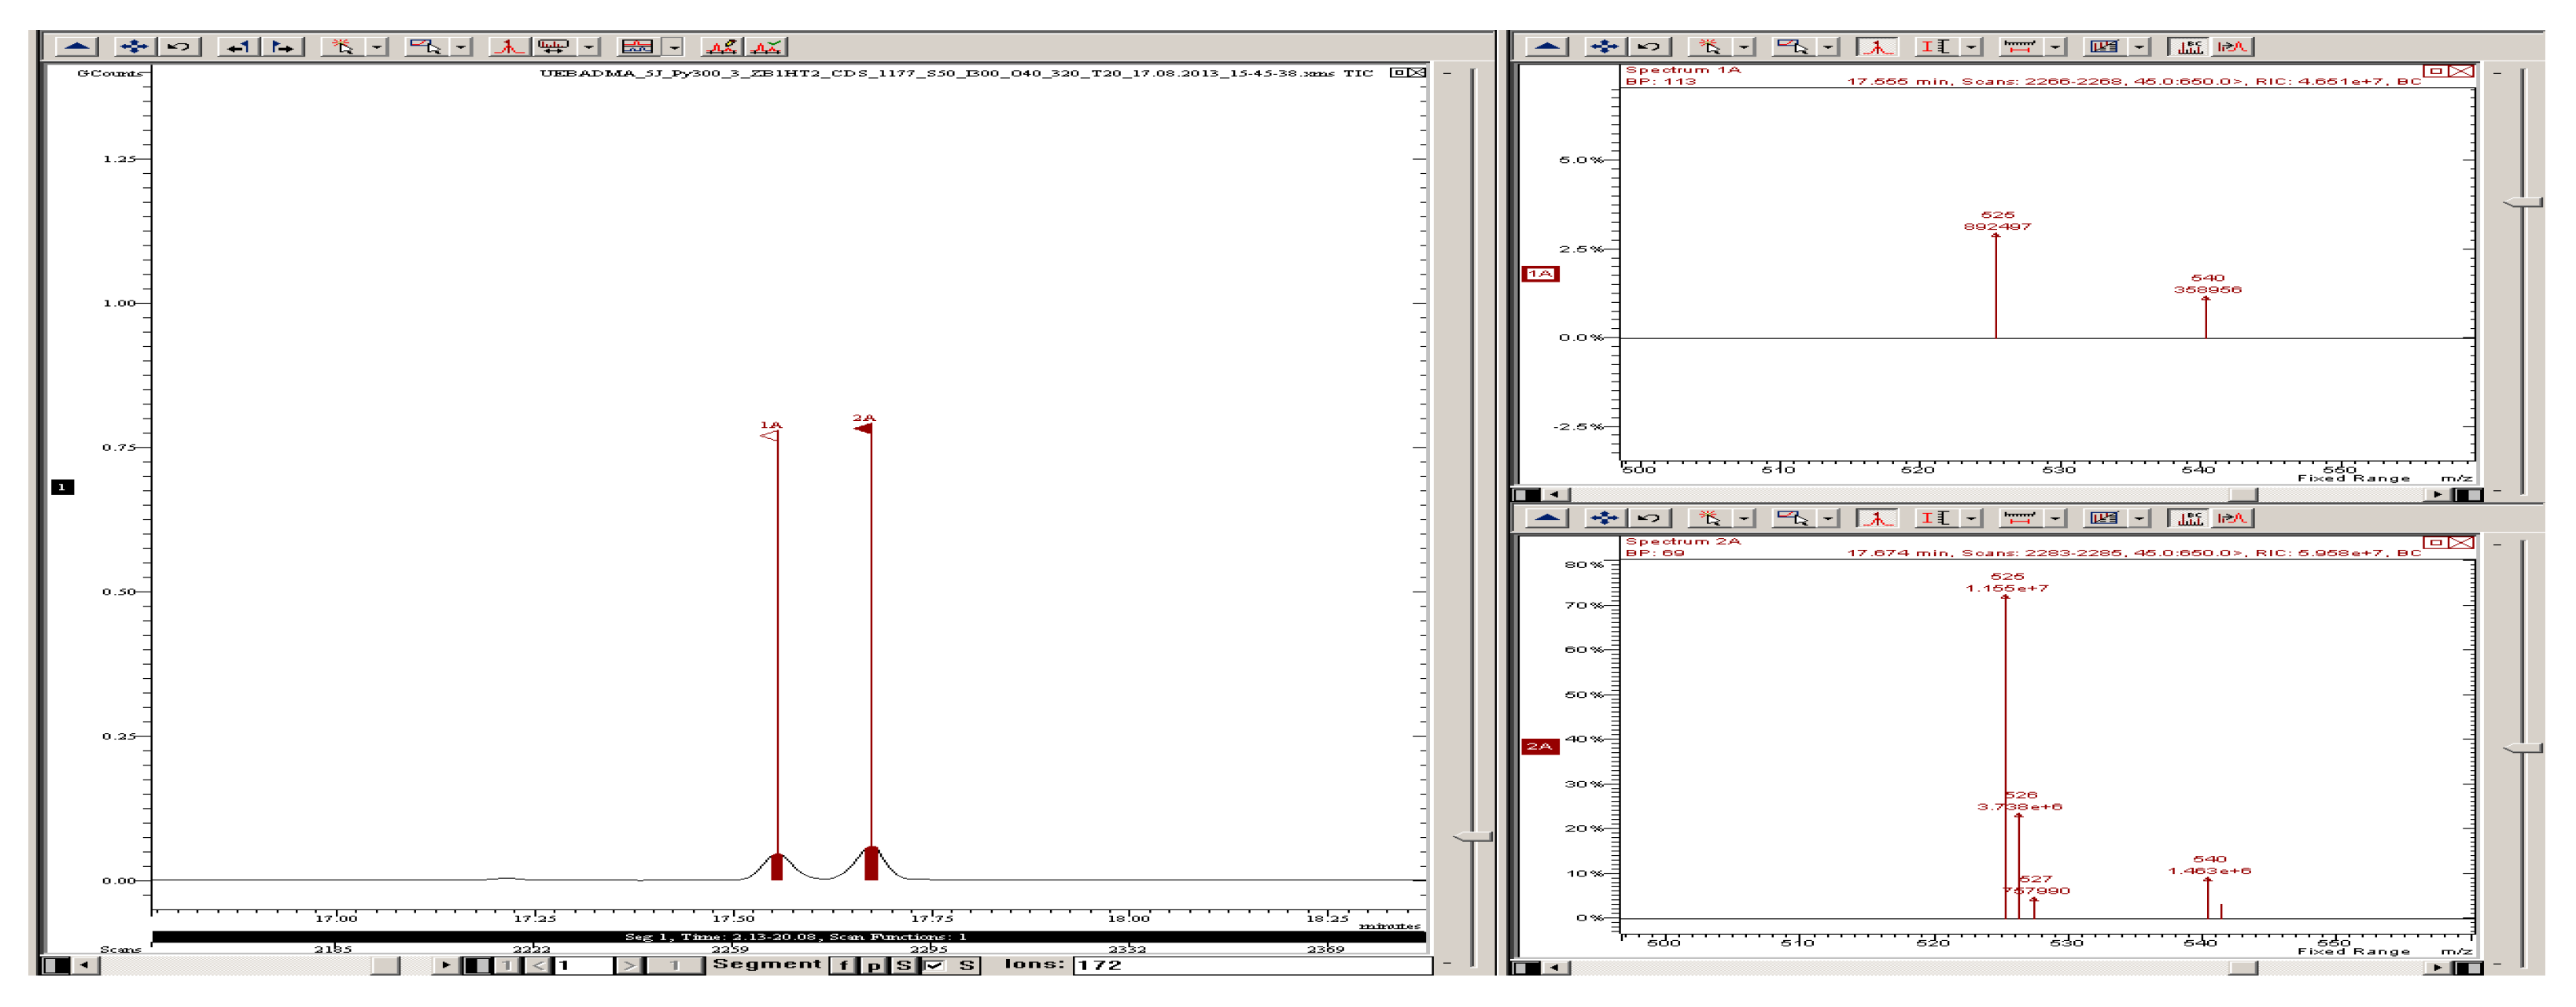
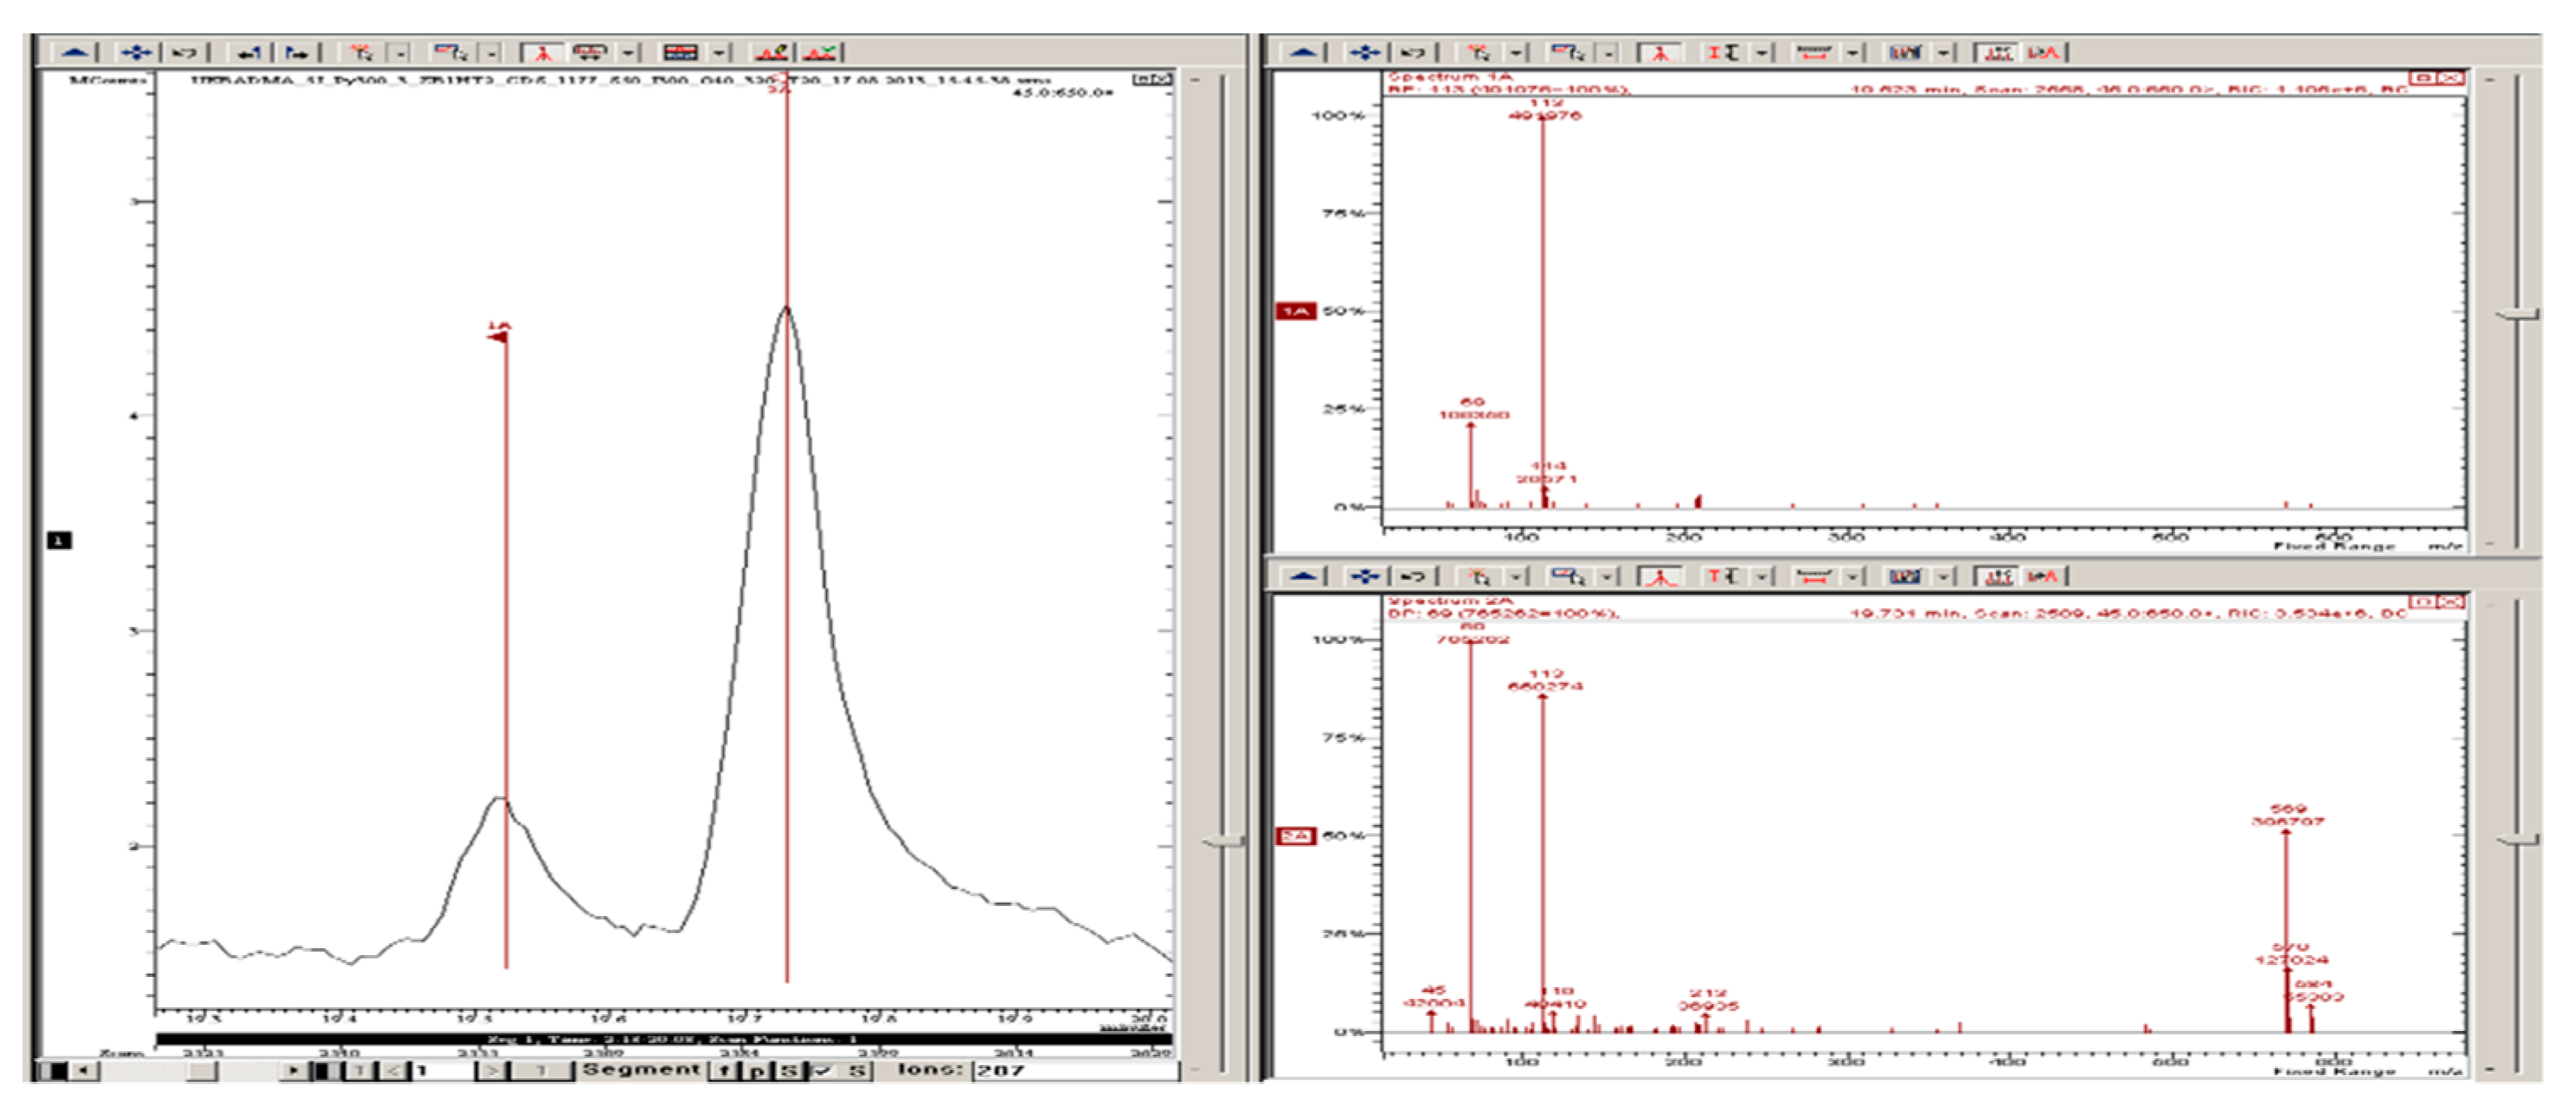
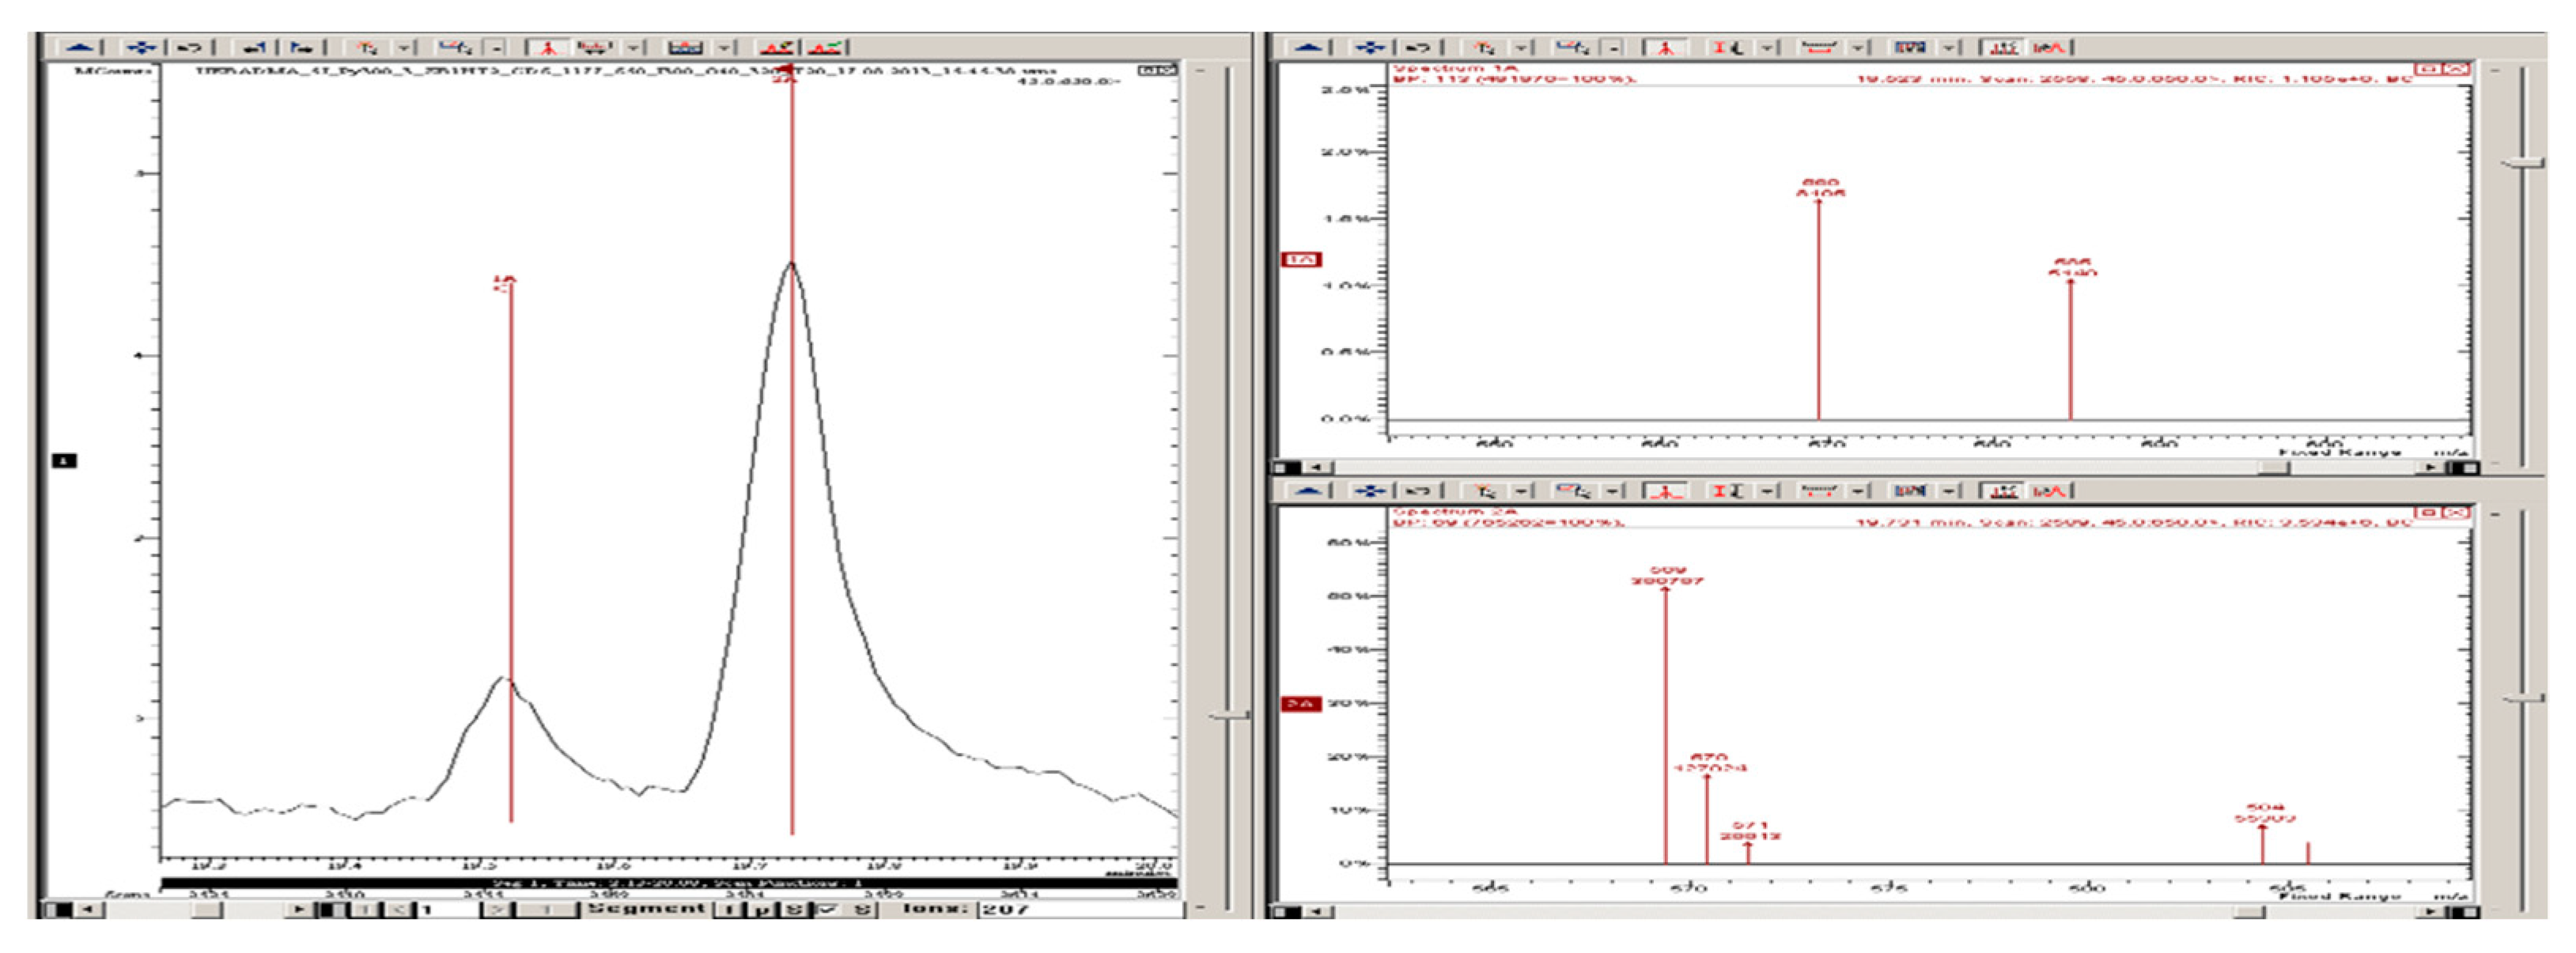
3.4. Analysis of 5 J/cm2 Cured EBADMA Resin
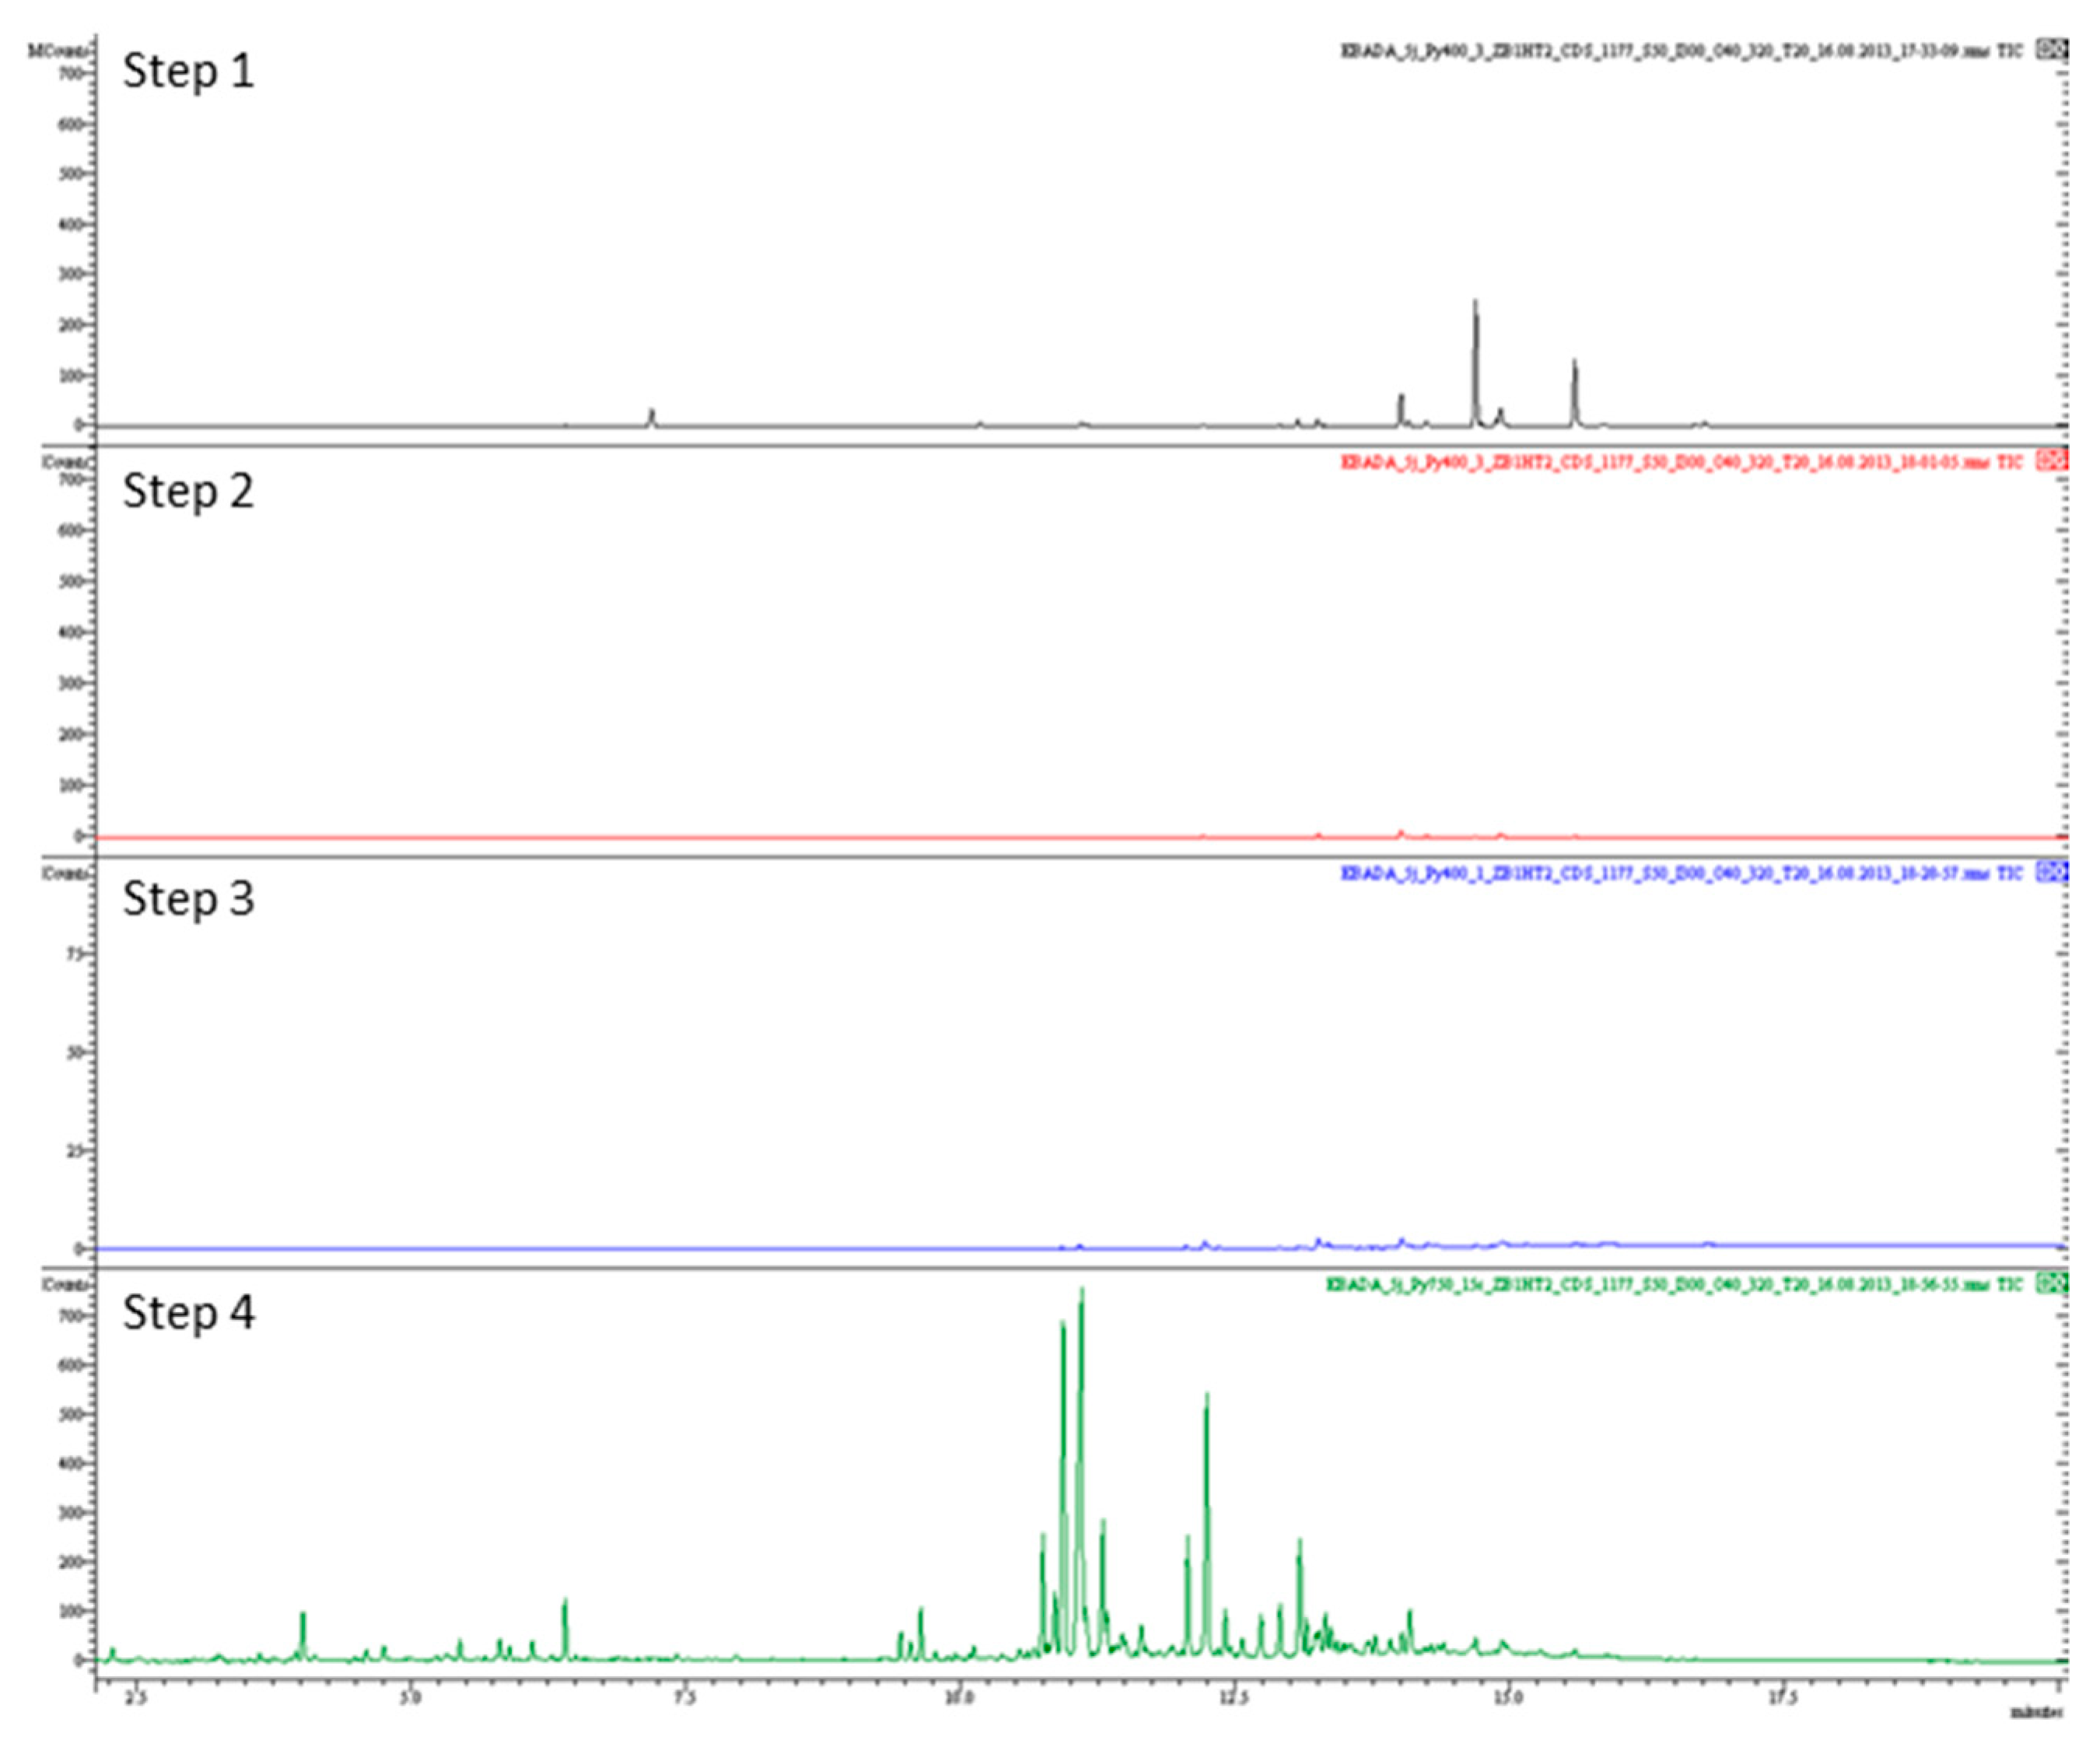
3.5. EBADA Uncured Resin Analysis
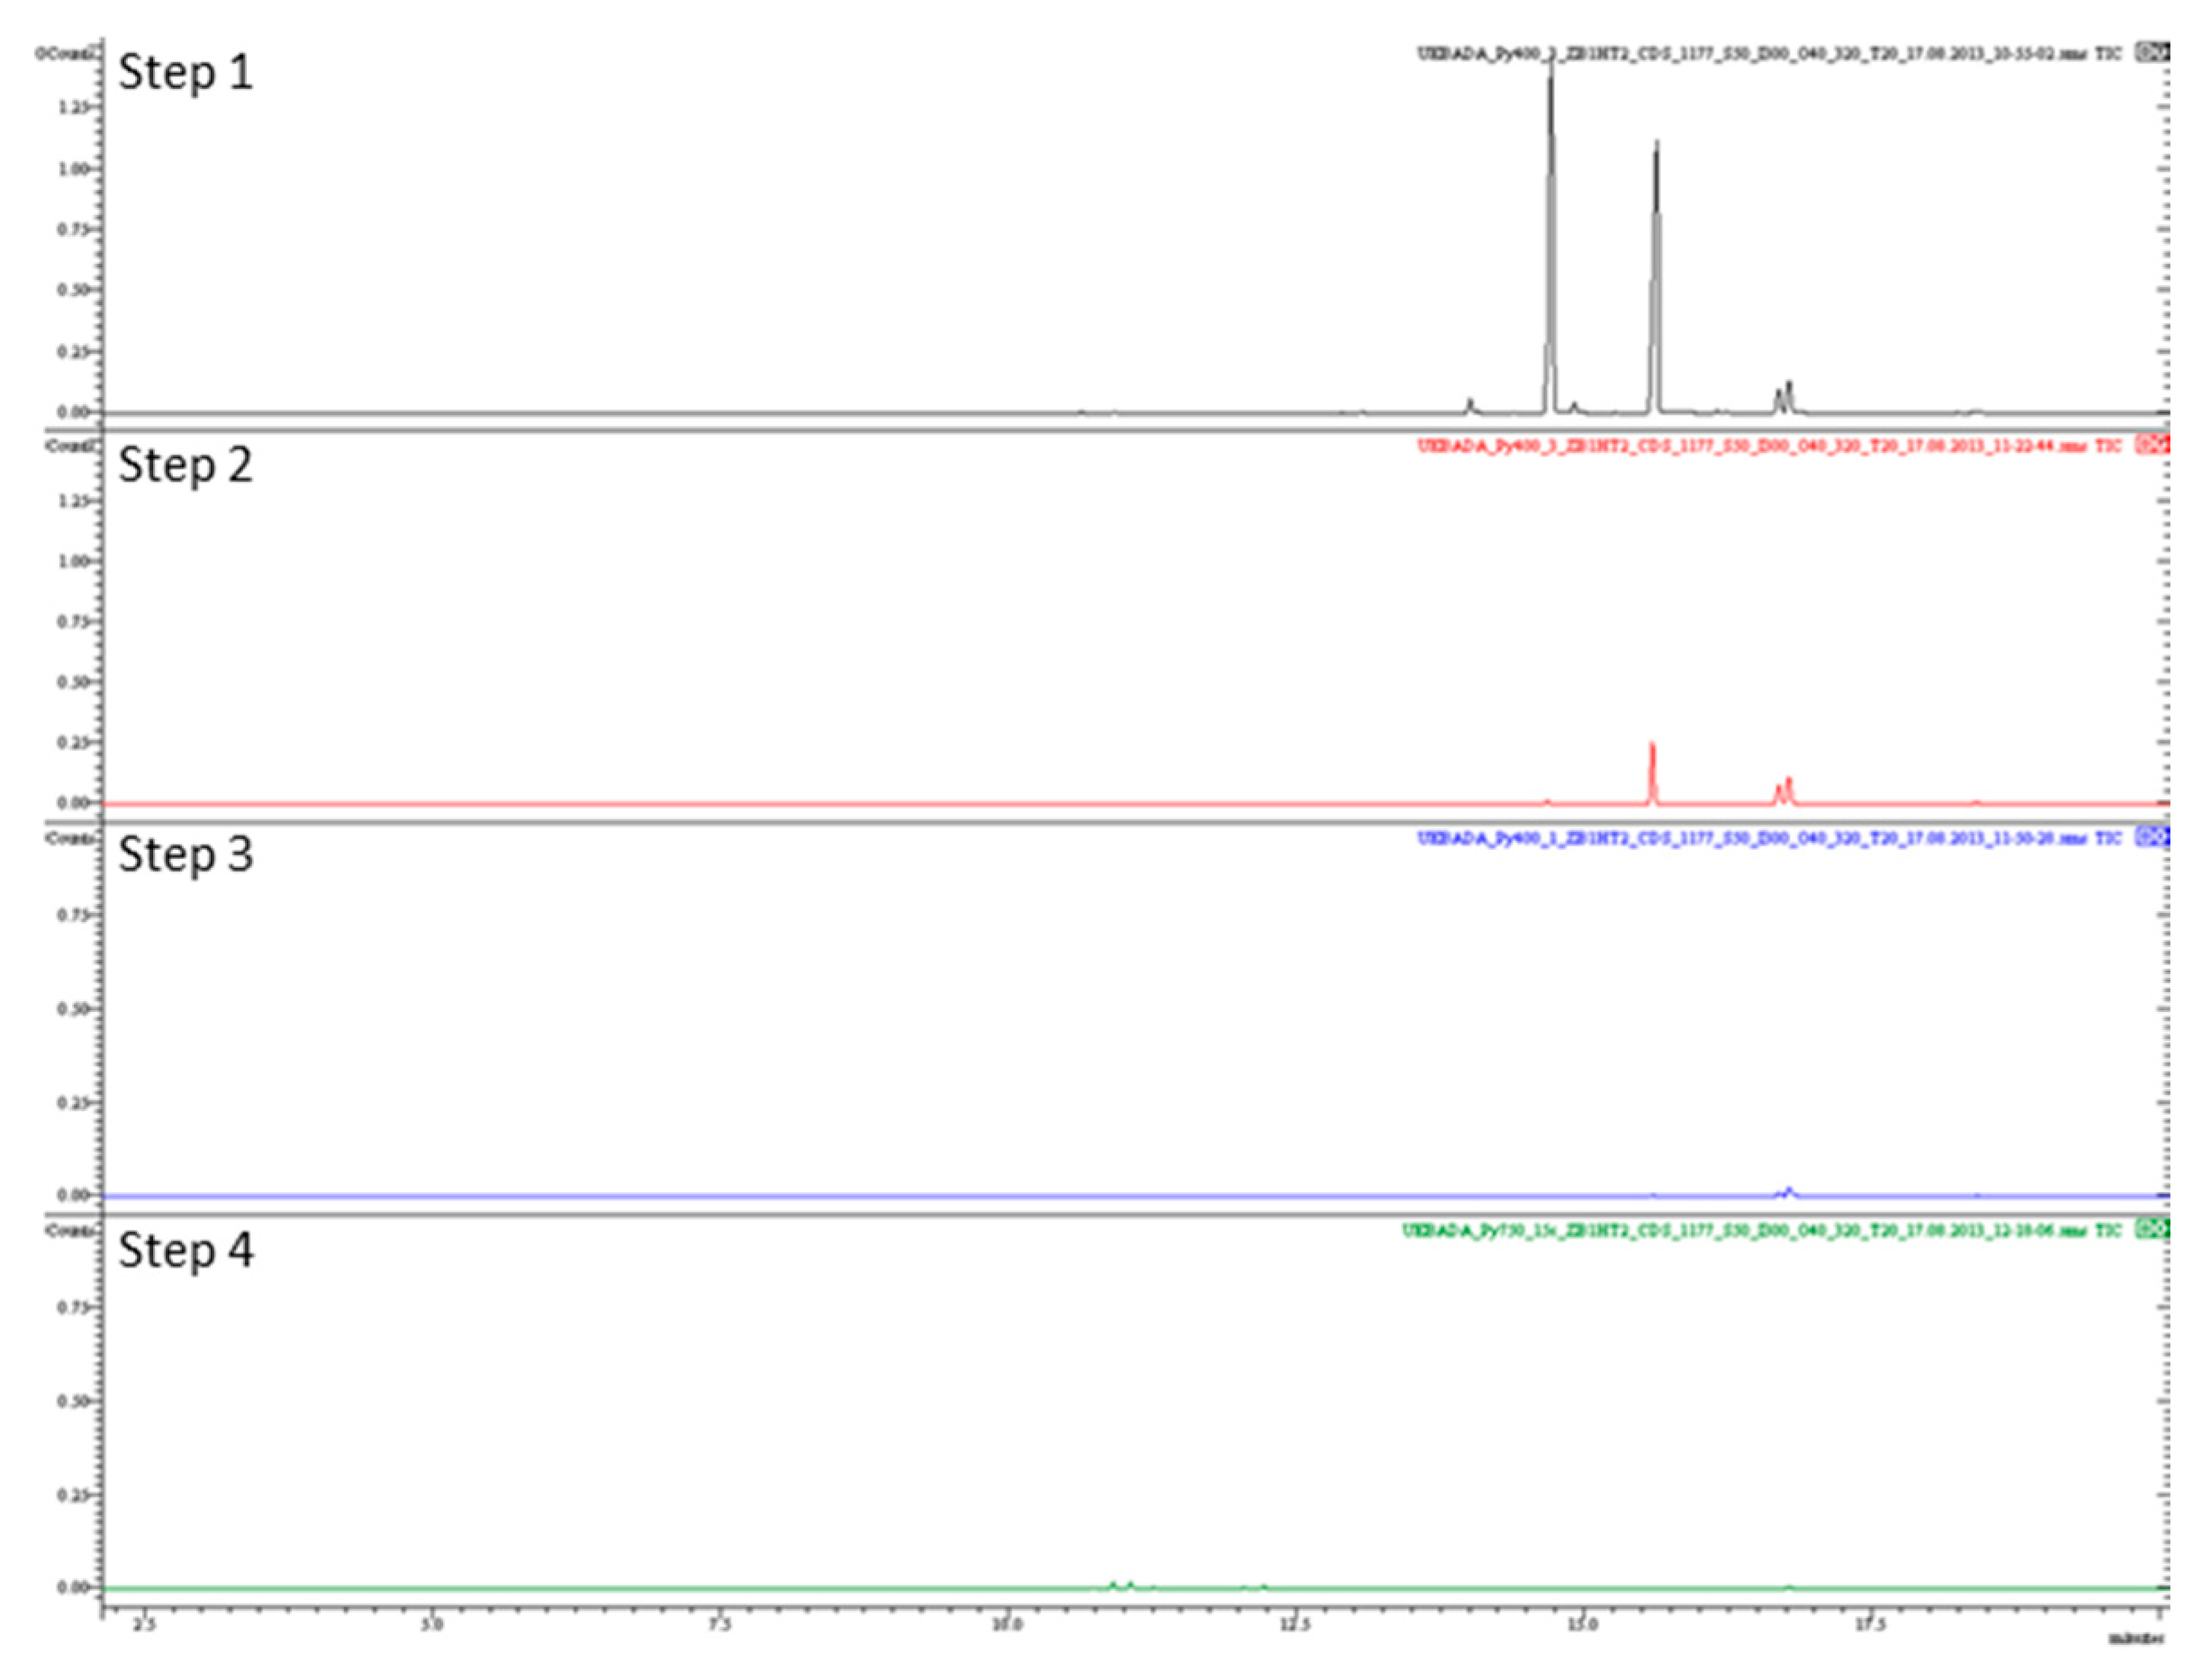
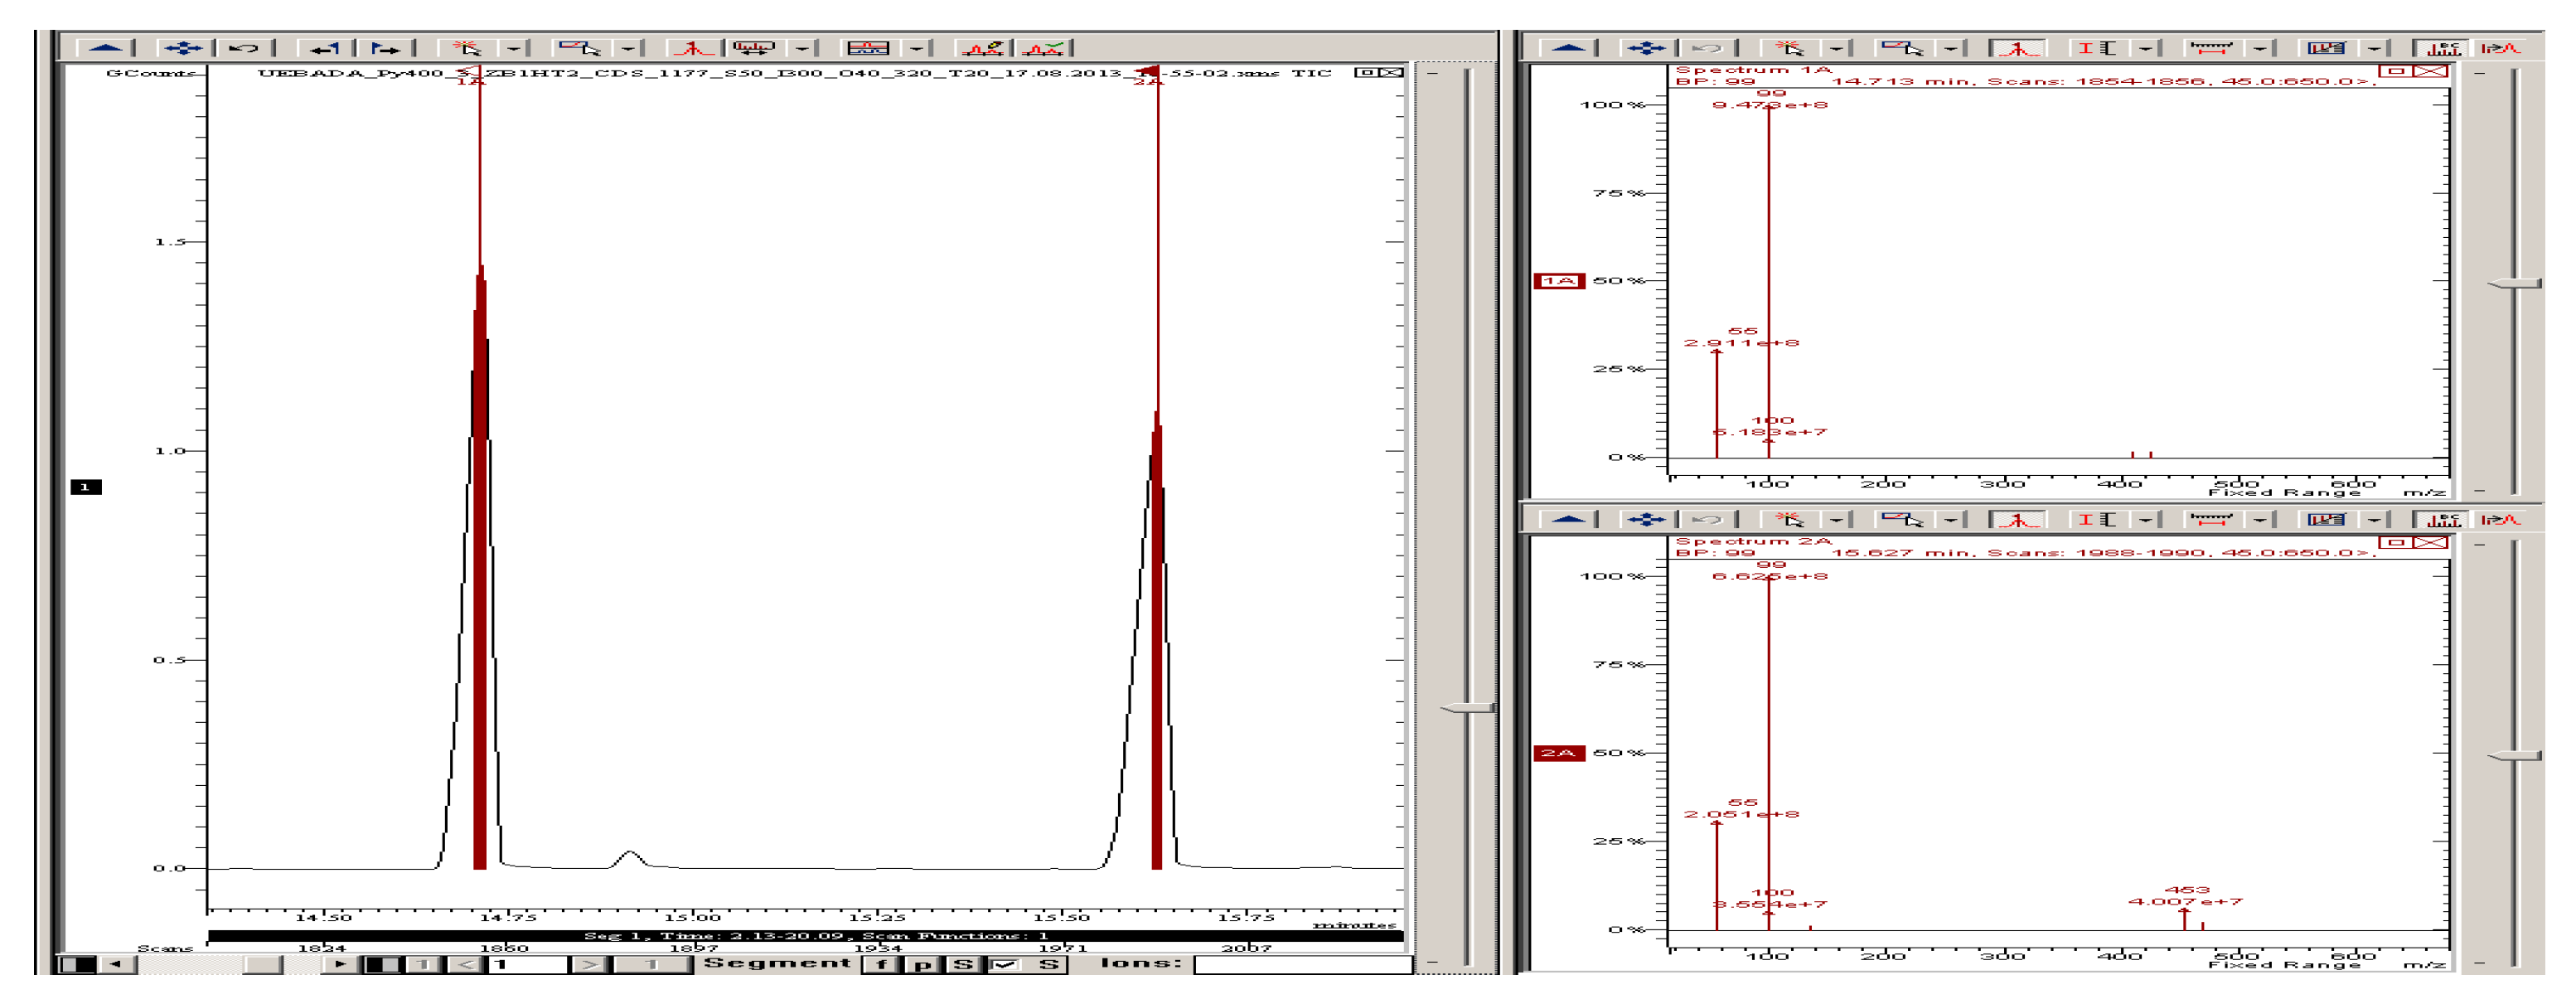
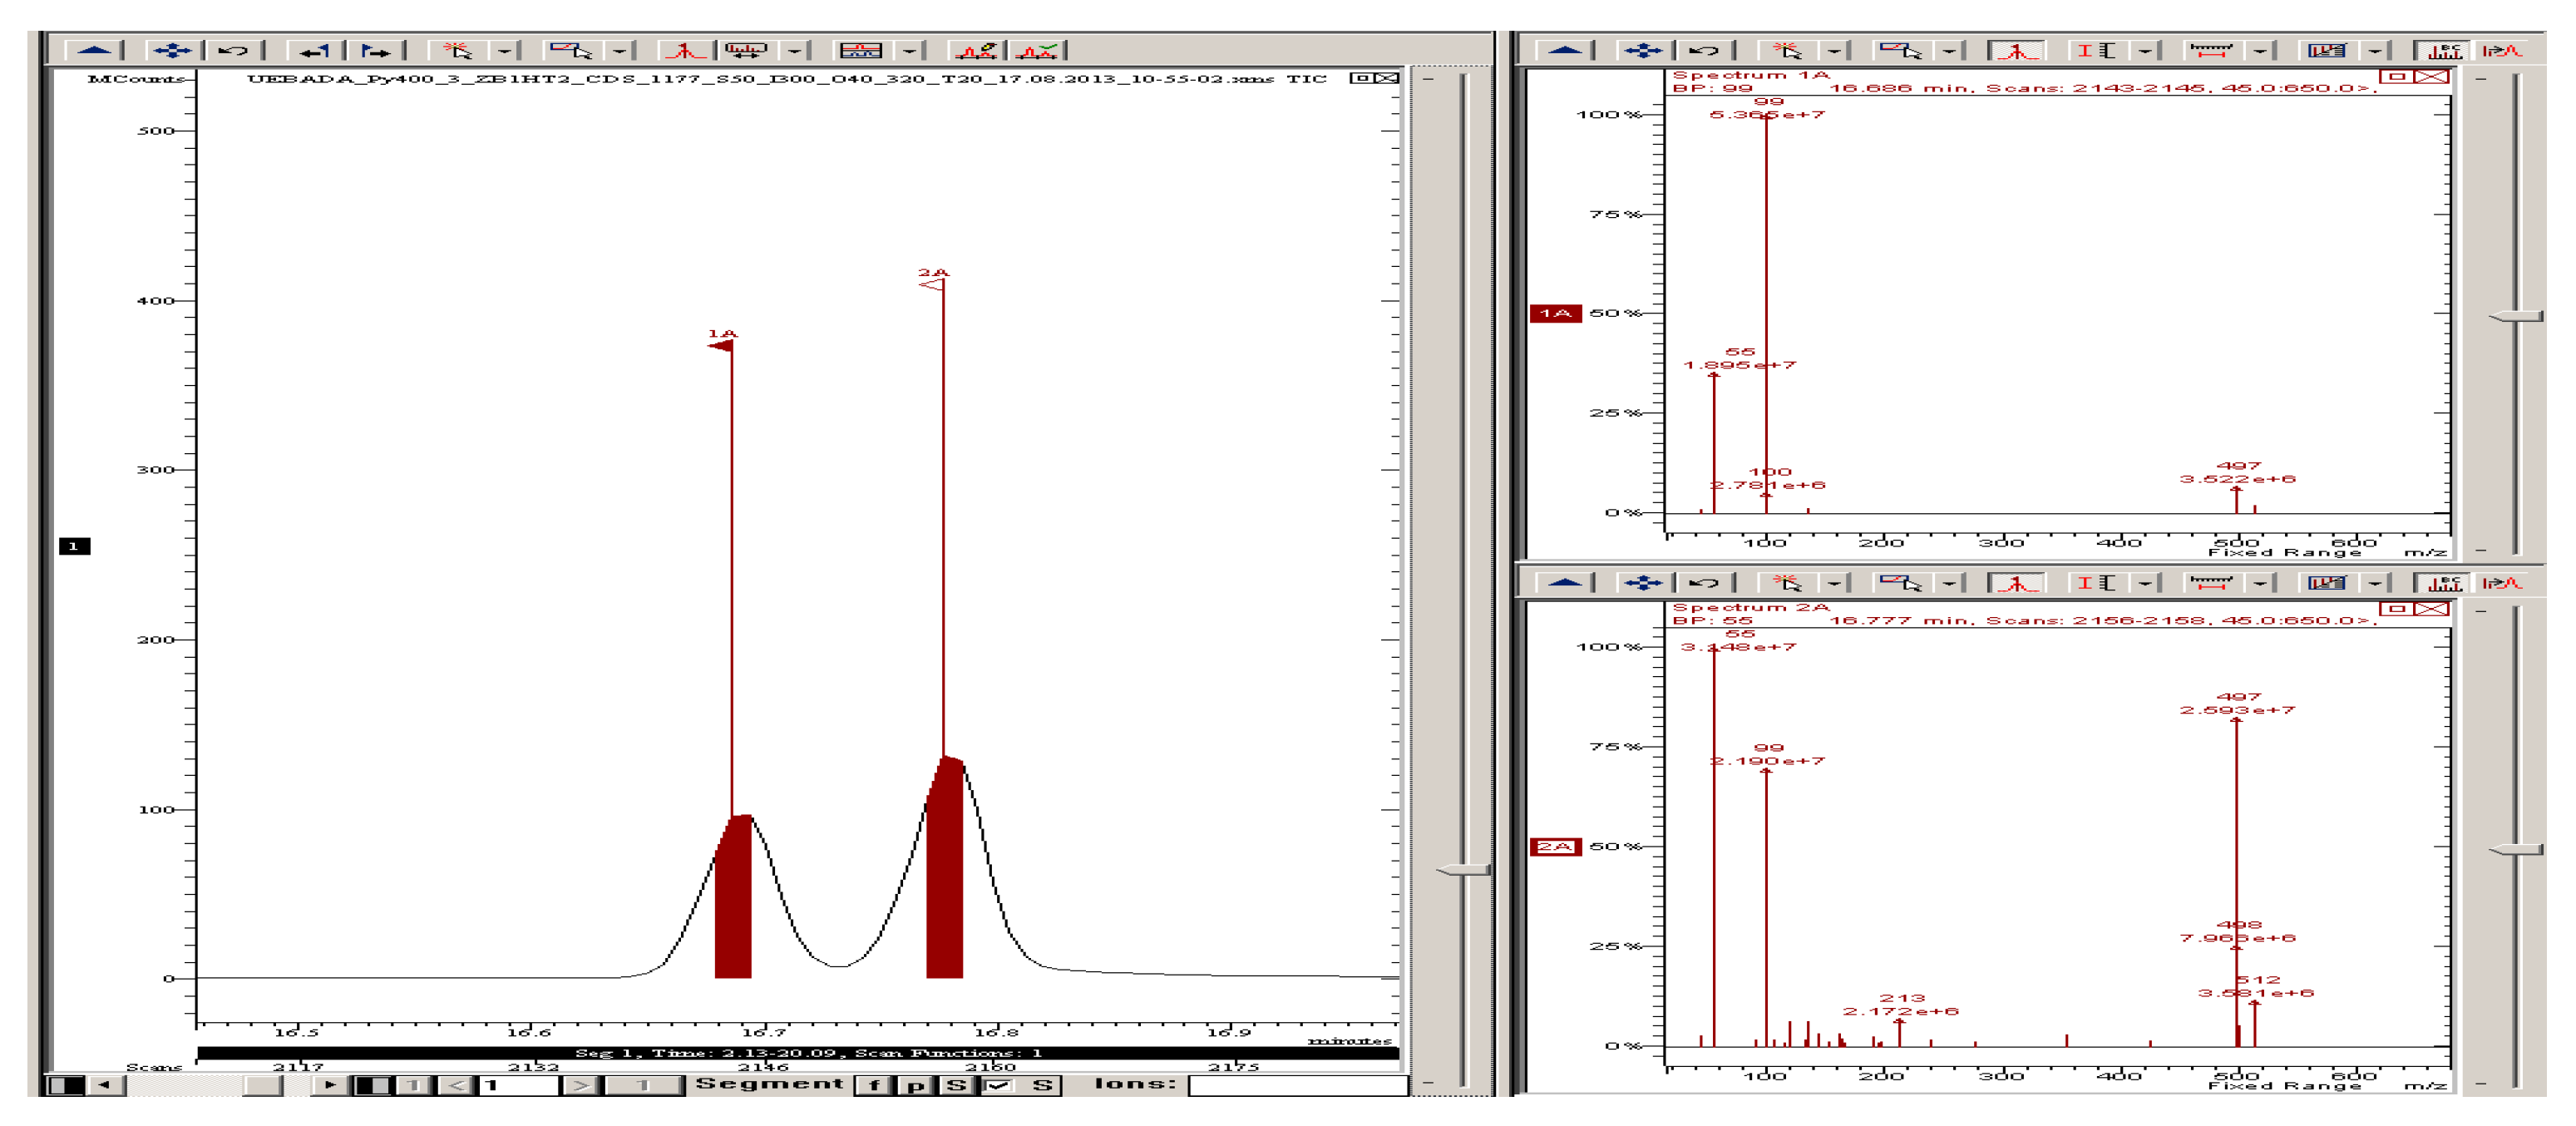
3.6. Analysis of 5 J/cm2 Cured EBADA Resin
4. Conclusions
Author Contributions
Funding
Institutional Review Board Statement
Informed Consent Statement
Data Availability Statement
Conflicts of Interest
Appendix A

| Pyrolysis | parameters |
| Helium purge flow rate | 20 PSIG |
| Interface temperature in rest mode | 60 °C |
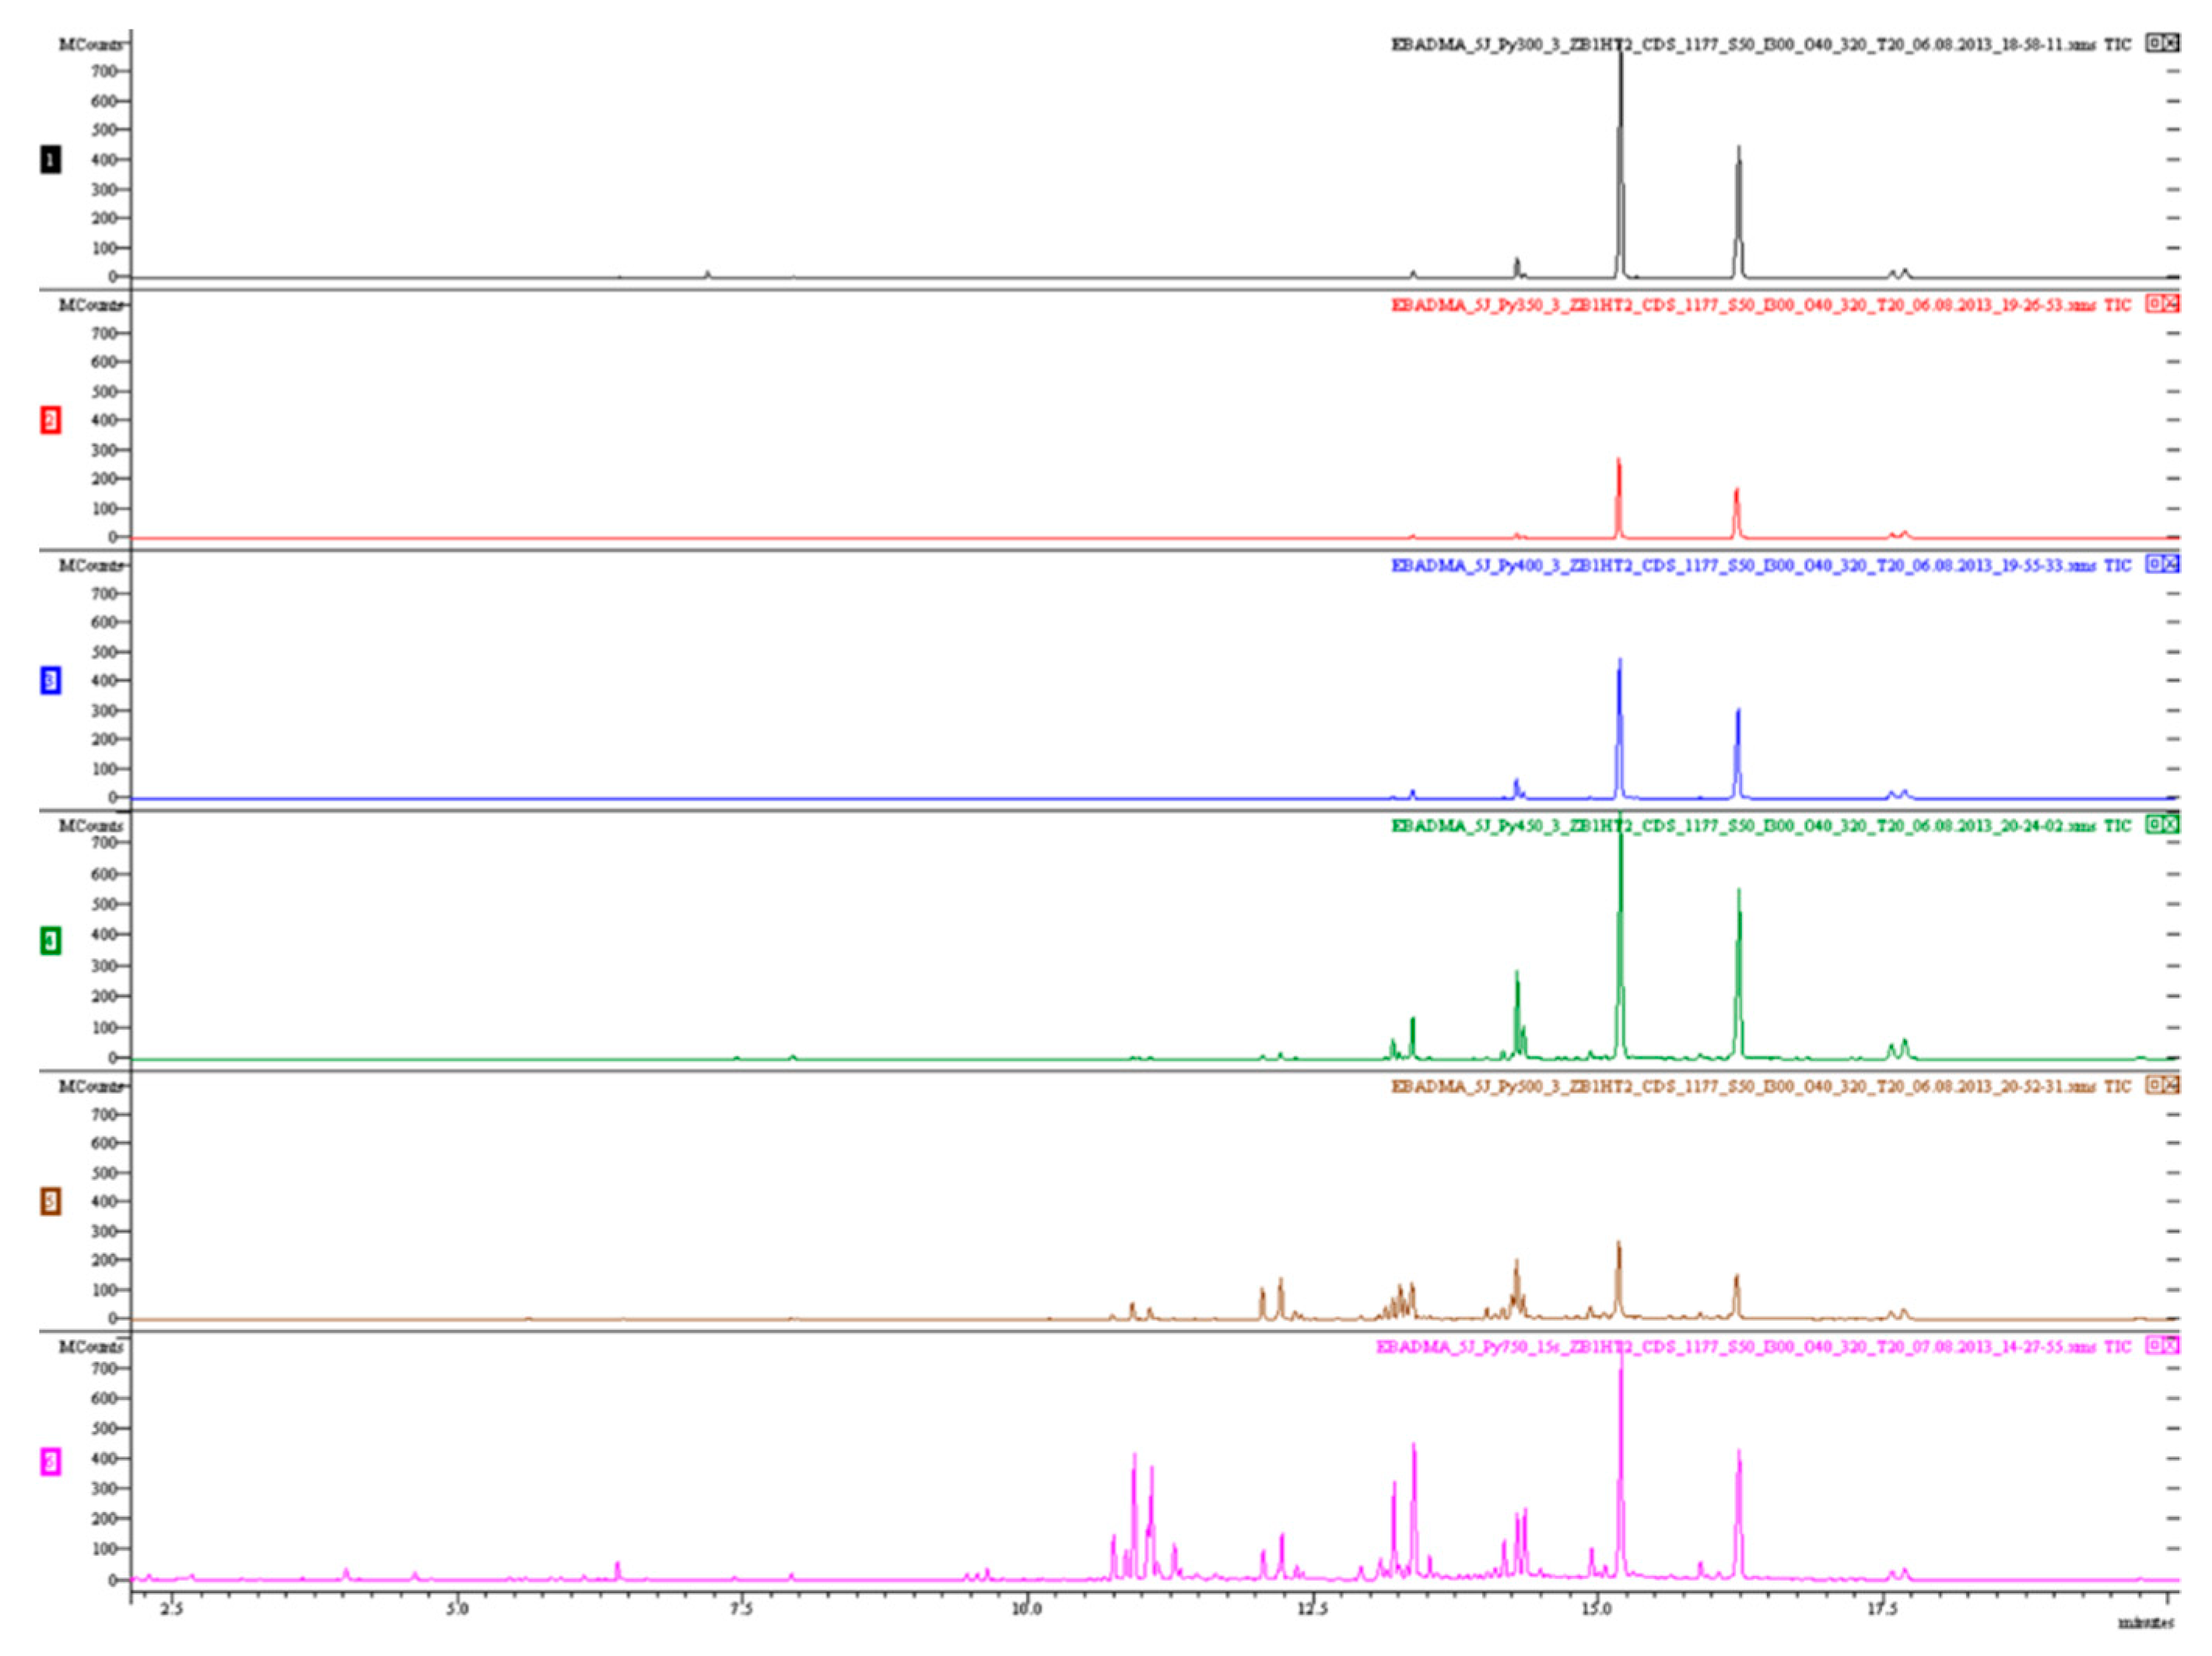
| Interface temperature during pyrolysis | 300 °C |
| Heating rate | 20,000 °C/s |
| Volatiles collection time | 4 min |
| Valve oven temperature | 300 °C |
| Transfer line temperature | 300 °C |
| GC | parameters |
| Oven temperature | 40 °C |
| Volatiles concentration time to column | 2 min |
| Injector temperature | 300 °C |
| Split ratio | 1/50 |
| Gas carrier flow rate | Helium 20 PSIG |
| GC oven temperature program |
|
| MS triplet quadrupole | detector parameters |
| Transfer line temperature | 280 °C |
| Source temperature | 260 °C |
| Source type | EI at 70 eV |
| m/z scan range | 45 to 650 |
| Softwares | |
| CDS 5000 Pyroprobe V. 4.02 | |
| Varian MS Workstation V. 6.9 | |
| NIST Database NIST MS search 2.0 | |
| AMDIS V. 2.64 | |


References
- Decker, C.; Moussa, K. A new method for monitoring ultra-fast photopolymerizations by real-time infra-red (RTIR) spectroscopy. Makromol. Chem. 1988, 189, 2381–2394. [Google Scholar] [CrossRef]
- Scherzer, T.; Decker, U. Real-time FTIR–ATR spectroscopy to study the kinetics of ultrafast photopolymerization reactions induced by monochromatic UV light. Vib. Spectr. 1999, 19, 385–398. [Google Scholar] [CrossRef]
- Palanisamy, A.; Rao, B.S. Photo-DSC and dynamic mechanical studies on UV curable compositions containing diacrylate of ricinoleic acid amide derived from castor oil. Prog. Org. Coat. 2007, 60, 161–169. [Google Scholar] [CrossRef]
- Steeman, P.A.M.; Dias, A.A.; Wienke, D.; Zwartkruis, T. Polymerization and Network Formation of UV-Curable Systems Monitored by Hyphenated Real-Time Dynamic Mechanical Analysis and Near-Infrared Spectroscopy. Macromolecules 2004, 37, 7001–7007. [Google Scholar] [CrossRef]
- Morgan, D.; Kalachandra, S.; Shobha, H.; Gunduz, N.; Stejskal, E. Analysis of a dimethacrylate copolymer (Bis-GMA and TEGDMA) network by DSC and 13C solution and solid-state NMR spectroscopy. Biomaterials 2000, 21, 1897. [Google Scholar] [CrossRef]
- Lungu, A.; Neckers, D. Cross-polarization magic-angle spinning 13C nuclear magnetic resonance study of the homogeneity of some photopolymerized acrylic networks. Macromolecules 1995, 28, 8147. [Google Scholar] [CrossRef]
- Litvinov, V.; Dias, A. Analysis of network structure of UV-cured acrylates by 1H NMR relaxation, 13C NMR spectroscopy, and dynamic mechanical experiments. Macromolecules 2001, 34, 4051. [Google Scholar] [CrossRef]
- Courtecuisse, F.; Karasu, F.; Allonas, X.; Croutxé-Barghorn, C.; Van der Ven, L. Confocal Raman microscopy study of several factors known to influence the oxygen inhibition of acrylate photopolymerization under LED. Prog. Org. Coat. 2016, 92, 1. [Google Scholar] [CrossRef]
- Courtecuisse, F.; Cerezo, J.; Croutxé-Barghorn, C.; Dietlin, C.; Allonas, X. Depth characterization by confocal raman microscopy of oxygen inhibition in free radical photopolymerization of acrylates: Contribution of the thiol chemistry. J. Polym. Sci. Part A Polym. Chem. 2013, 51, 635. [Google Scholar] [CrossRef]
- Malucelli, G.; Gozzelino, G.; Bongiovanni, R.; Priola, A. Photopolymerization of poly (tetramethylene ether) glycol diacrylates and properties of the obtained networks. Polymer 1996, 37, 2565. [Google Scholar] [CrossRef]
- Priola, A.; Gozzelino, G.; Ferrero, F.; Malucelli, G. Properties of polymeric films obtained from uv cured poly (ethylene glycol) diacrylates. Polymer 1993, 34, 3653. [Google Scholar] [CrossRef]
- Boudraa, K.; Bouchaour, T.; Maschke, U. Swelling of Acrylic Interpenetrating Polymer Networks in Liquid Crystals. Macromol. Symp. 2008, 273, 33–37. [Google Scholar] [CrossRef]
- Matsubara, H.; Hata, S.-I.; Kondo, Y.; Ishida, Y.; Takigawa, H.; Ohtani, H. Characterization of cross-linking structures in UV-cured acrylic ester resin by MALDI-MS combined with supercritical methanolysis. Anal. Sci. 2006, 22, 1403. [Google Scholar] [CrossRef] [PubMed] [Green Version]
- Sanai, Y.; Kubota, K. Effect of UV-curing conditions on the polymer structures: A comparison between coating and adhesive. Polym. J. 2020, 52, 1153. [Google Scholar] [CrossRef]
- Matsubara, H.; Kataoka, H.; Ohtani, H. Characterization of network structure in radiation-cured resins of polyfunctional acrylic ester and N-vinylpyrrolidone by MALDI-MS combined with supercritical methanolysis. Polym. Chem. 2010, 1, 1056. [Google Scholar] [CrossRef]
- Nakagawa, H.; Tsuge, S.; Murakami, K. Characterization of sulphur-cured rubbers by high-resolution pyrolysis-gas chromatography with flame photometric detection. J. Anal. Appl. Pyrolysis 1986, 10, 31. [Google Scholar] [CrossRef]
- Nakagawa, H.; Tsuge, S. Characterization of styrene-divinylbenzene copolymers by high-resolution pyrolysis-gas chromatography. Macromolecules 1985, 18, 2068. [Google Scholar] [CrossRef]
- Nakagawa, H.; Wakatsuka, S.; Ohtani, H.; Tsuge, S.; Koyama, T. High-resolution pyrolysis-gas chromatography for the study of epoxy resins cured with prepolymers of varying molecular weight. Polymer 1992, 33, 4556. [Google Scholar] [CrossRef]
- Nakagawa, H.; Tsuge, S.; Koyama, T. Studies on thermal degradation of epoxy resins by high-resolution pyrolysis-gas chromatography. J. Anal. Appl. Pyrolysis 1987, 12, 97. [Google Scholar] [CrossRef]
- Tsuge, S.; Ohtani, H.; Matsubara, H.; Ohsawa, M. Some empirical considerations on the pyrolysis-gas chromatographic conditions required to obtain characteristic and reliable high-resolution pyrograms for polymer samples. J. Anal. Appl. Pyrolysis 1987, 11, 181. [Google Scholar] [CrossRef]
- Kawai, K.; Kondo, H.; Ohtani, H. Characterization of cross-linking structure in terephthalate polyesters formed through material recycling process by pyrolysis-gas chromatography in the presence of organic alkali. Polym. Degrad. Stab. 2008, 93, 1781. [Google Scholar] [CrossRef]
- Tsuge, S.; Ohtani, H. Structural characterization of polymeric materials by Pyrolysis—GC/MS. Polym. Degrad. Stab. 1997, 58, 109. [Google Scholar] [CrossRef]
- Evans, S.; Haines, P.; Skinner, G. Pyrolysis–gas-chromatographic study of a series of polyester thermosets. J. Anal. Appl. Pyrolysis 2000, 55, 13. [Google Scholar] [CrossRef]
- Pionteck, J.; Hu, J.; Pompe, G.; Albrecht, V.; Schulze, U.; Borsig, E. Characterisation of radiation behaviour of polyethylene/polymethacrylates interpenetrating polymer networks. Polymer 2000, 41, 7915. [Google Scholar] [CrossRef]
- Matsubara, H.; Yoshida, A.; Ohtani, H.; Tsuge, S. Compositional analysis of UV-cured acrylic ester resins by pyrolysis–gas chromatography in the presence of organic alkali. J. Anal. Appl. Pyrolysis 2002, 64, 159. [Google Scholar] [CrossRef]
- Matsubara, H.; Yoshida, A.; Kondo, Y.; Tsuge, S.; Ohtani, H. Characterization of Network Structures in UV-Cured Acrylic Ester Resin by Pyrolysis-Gas Chromatography in the Presence of Organic Alkali. Macromolecules 2003, 36, 4750. [Google Scholar] [CrossRef]
- Matsubara, H.; Ohtani, H. Evaluation of molecular weight of original epoxy acrylates in UV-cured resins by pyrolysis-gas chromatography in the presence of organic alkali. J. Anal. Appl. Pyrolysis 2006, 75, 226. [Google Scholar] [CrossRef]
- Matsubara, H.; Ohtani, H. Rapid and sensitive determination of the conversion of UV-cured acrylic ester resins by pyrolysis-gas chromatography in the presence of an organic alkali. Anal. Sci. 2007, 23, 513. [Google Scholar] [CrossRef] [PubMed] [Green Version]
- Wampler, T.P. Applied Pyrolysis Handbook; CRC Press: Boca Raton, FL, USA, 2007. [Google Scholar]
- Lehrle, R. Polymer pyrolysis mechanisms: Experimental approaches for investigating them. J. Anal. Appl. Pyrolysis 1987, 11, 55. [Google Scholar] [CrossRef]


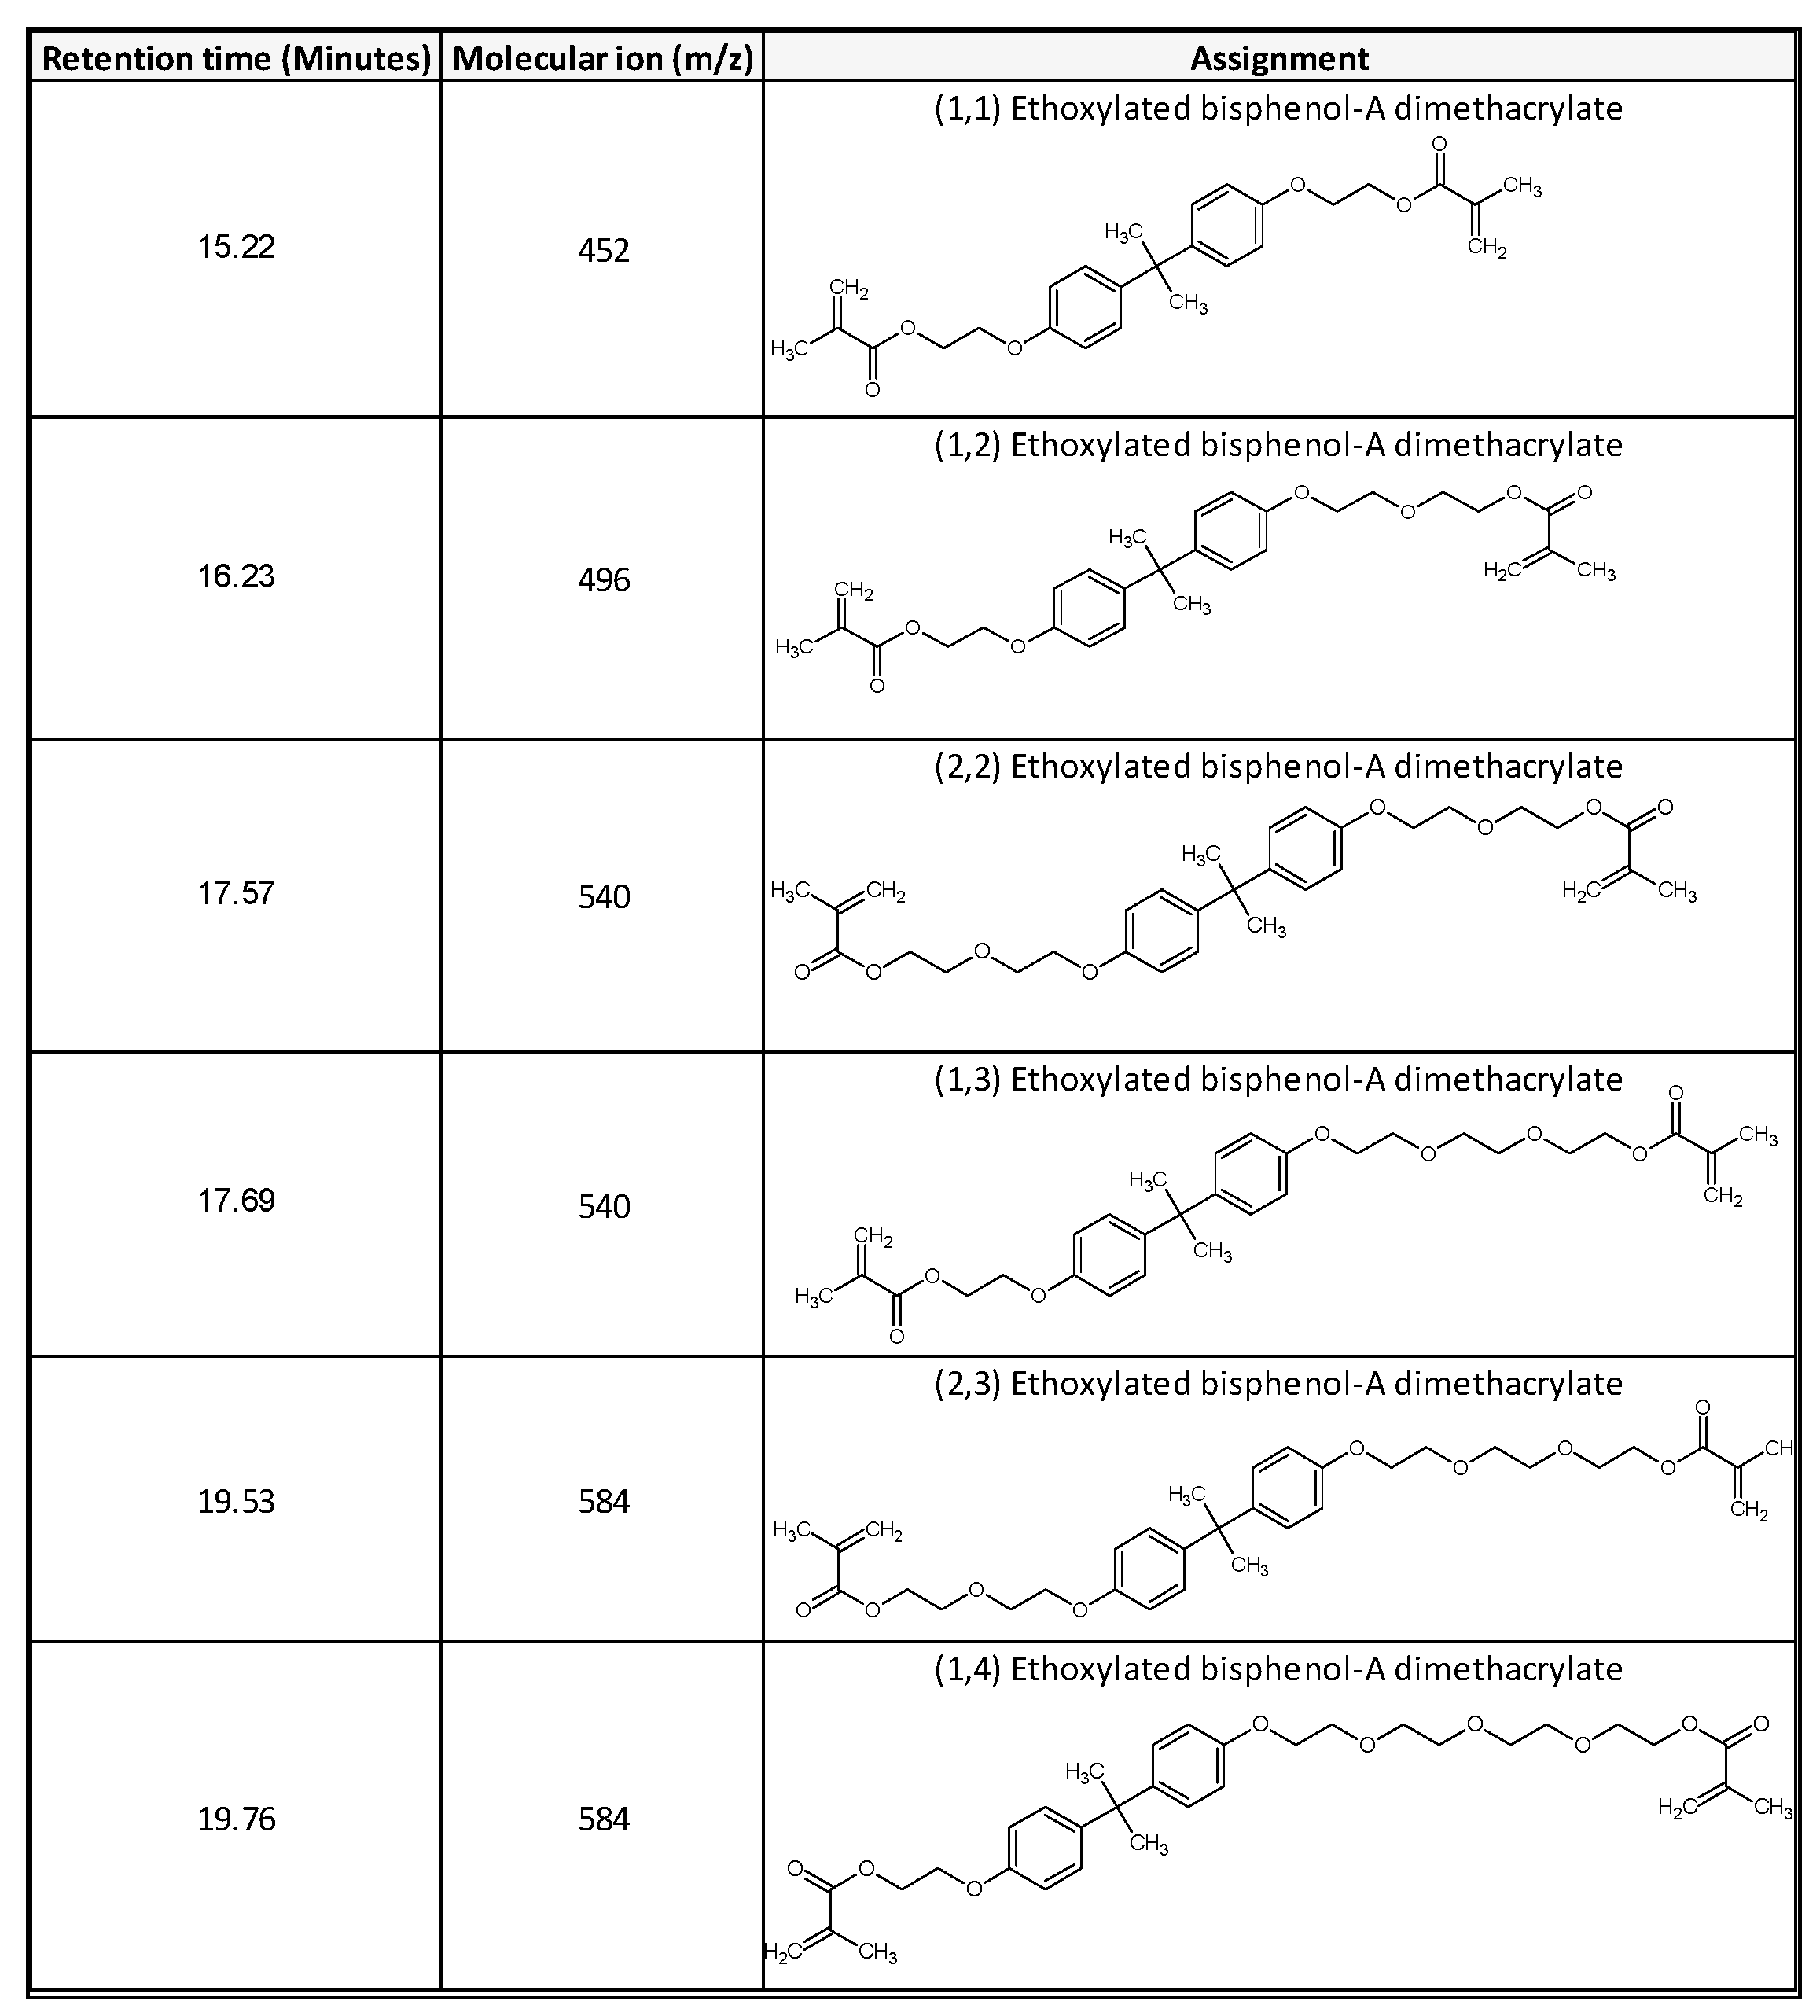
| (1,1) EBADMA | (1,2) EBADMA | (2,2) EBADMA | (1,3) EBADMA | (2,3) EBADMA | (1,4) EBADMA | |
|---|---|---|---|---|---|---|
| Mw (g/mol) | 452 | 496 | 540 | 540 | 584 | 584 |
| RT (min) | 15.22 | 16.23 | 17.57 | 17.69 | 19.53 | 19.76 |
| Step 1 counts/s | 8.22 × 10⁹ | 3.73 × 10⁹ | 8.57 × 10⁷ | 1.40 × 10⁸ | ||
| Step 2 counts/s | 3.91 × 10⁸ | 2.86 × 10⁹ | 2.05 × 10⁸ | 2.92 × 10⁸ | ||
| Step 3 counts/s | 1.06 × 10⁷ | 4.44 × 10⁸ | 1.45 × 10⁸ | 2.31 × 10⁸ | ||
| Step 4 counts/s | 4.47 × 10⁷ | 7.11 × 10⁷ | 6.01 × 10⁷ | 1.00 × 10⁸ | ||
| Distribution (%) | 50.9 | 41.7 | 2.9 | 4.5 |
| (1,1) EBADMA | (1,2) EBADMA | (2,2) EBADMA | (1,3) EBADMA | |
|---|---|---|---|---|
| Step 1 counts | 3.33 × 10⁹ | 1.98 × 10⁹ | 1.25 × 10⁸ | 1.62 × 10⁸ |
| Step 2 counts | 7.91 × 10⁸ | 8.60 × 10⁹ | 1.23 × 10⁸ | 1.70 × 10⁸ |
| Step 3 counts | 2.11 × 10⁷ | 2.56 × 10⁸ | 6.47 × 10⁸ | 1.04 × 10⁸ |
| Step 4 counts | 2.22 × 10⁹ | 1.15 × 10⁹ | 1.15 × 10⁹ | 1.15 × 10⁹ |
| Distribution (%) | 52.8 | 38.0 | 3.8 | 5.3 |
| Conversion (%) | 69.2 | 72.9 | 71.6 | 71.2 |
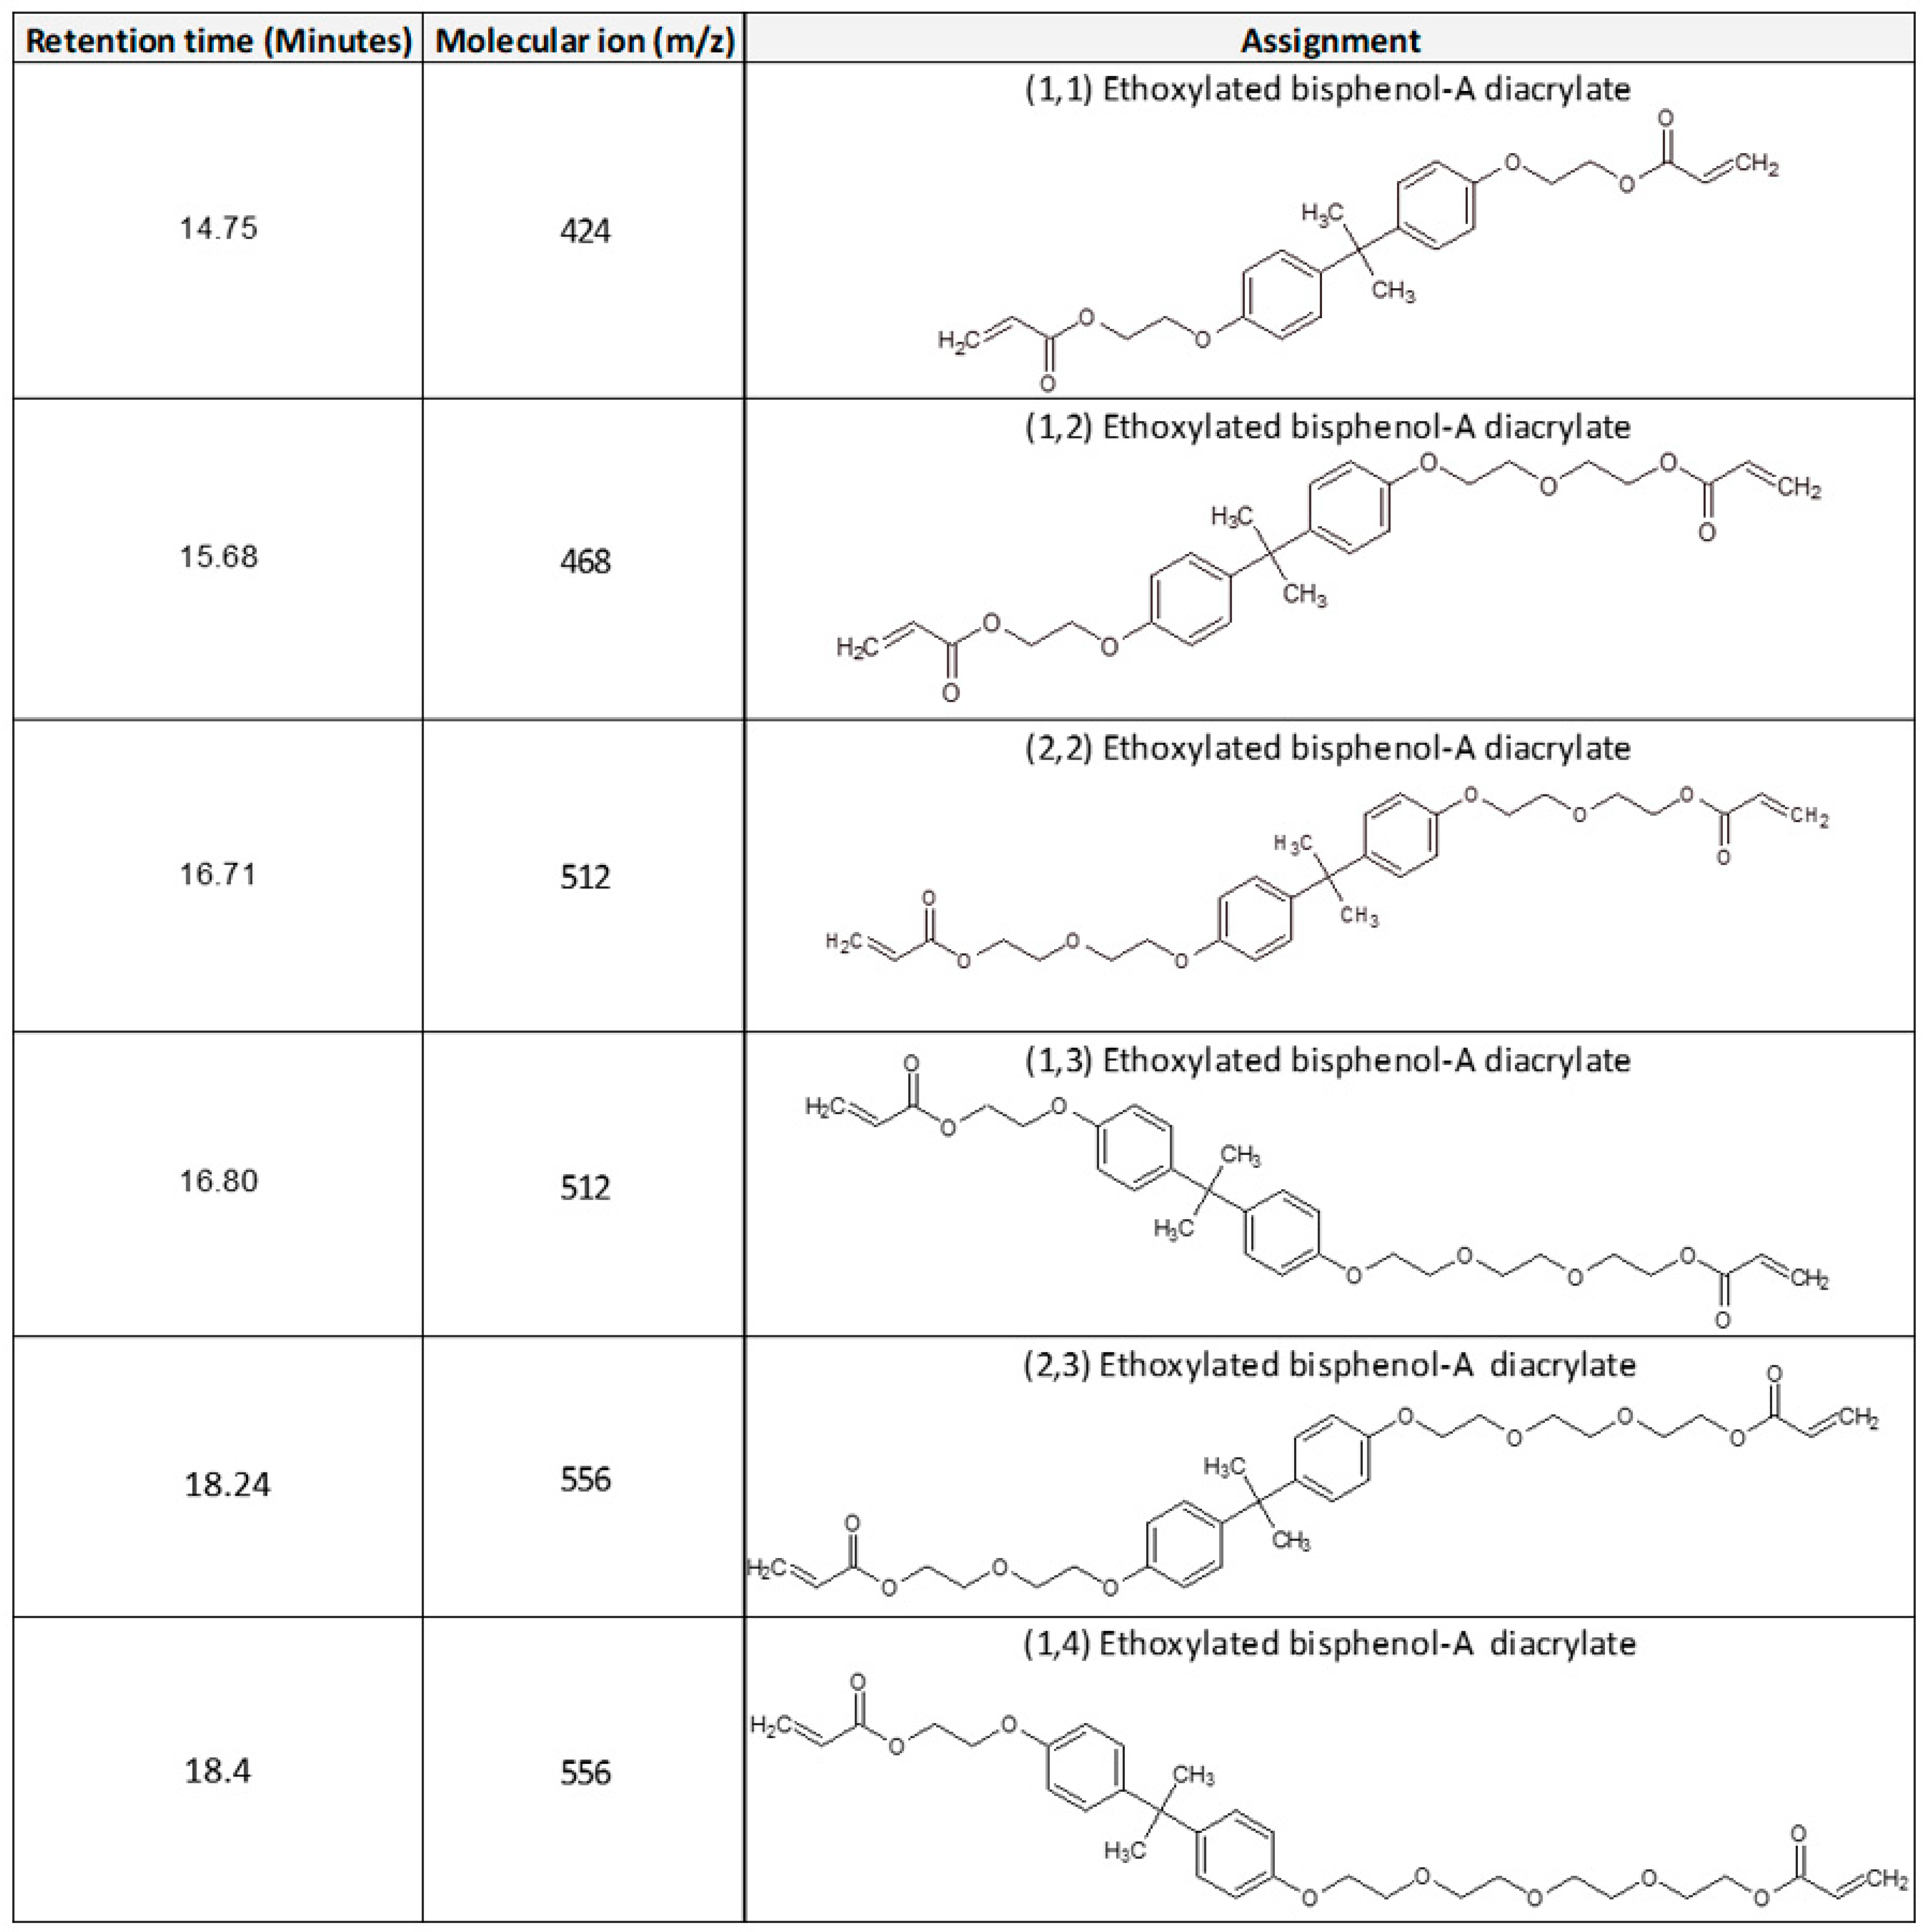
| (1,1) EBADA | (1,2) EBADA | (2,2) EBADA | (1,3) EBADA | (2,3) EBADA | (1,4) EBADA | |
|---|---|---|---|---|---|---|
| Mw (g/mol) | 424 | 468 | 512 | 512 | 556 | 556 |
| RT (min) | 14.75 | 15.68 | 16.71 | 16.80 | 18.24 | 18.4 |
| Step 1 counts | 5.55 × 10⁹ | 3.50 × 10⁹ | 2.31 × 10⁸ | 3.25 × 10⁸ | ||
| Step 2 counts | 5.20 × 10⁷ | 1.95 × 10⁹ | 2.49 × 10⁸ | 3.67 × 10⁸ | ||
| Step 3 counts | 3.89 × 10⁶ | 1.47 × 10⁸ | 1.32 × 10⁸ | 2.34 × 10⁸ | ||
| Step 4 counts | 9.32 × 10⁶ | 9.32 × 10⁶ | 2.60 × 10⁷ | 6.19 × 10⁷ | ||
| Distribution (%) | 43.7 | 43.6 | 5.0 | 7.7 |
| (1,1) EBADA | (1,2) EBADA | (2,2) EBADA | (1,3) EBADA | |
|---|---|---|---|---|
| Step 1 counts | 3.83 × 10⁸ | 2.32 × 10⁸ | 1.16 × 10⁷ | 1.84 × 10⁷ |
| Step 2 counts | 4.21 × 10⁶ | 4.67 × 10⁶ | 1.50 × 10⁶ | 2.83 × 10⁶ |
| Step 3 counts | 1.99 × 10⁶ | 0 | 0 | 0 |
| Step 4 counts | 0 | 0 | 0 | 0 |
| Distribution (%) | 58.9 | 35.9 | 2.0 | 3.2 |
| Conversion (%) | 96.1 | 97.7 | 99.1 | 99.1 |
Publisher’s Note: MDPI stays neutral with regard to jurisdictional claims in published maps and institutional affiliations. |
© 2021 by the authors. Licensee MDPI, Basel, Switzerland. This article is an open access article distributed under the terms and conditions of the Creative Commons Attribution (CC BY) license (https://creativecommons.org/licenses/by/4.0/).
Share and Cite
Belbakra, Z.; Napoli, A.; Cherkaoui, Z.; Allonas, X. Analysis of Acrylic and Methacrylic Networks through Pyrolysis-GC/MS. Polymers 2021, 13, 4349. https://doi.org/10.3390/polym13244349
Belbakra Z, Napoli A, Cherkaoui Z, Allonas X. Analysis of Acrylic and Methacrylic Networks through Pyrolysis-GC/MS. Polymers. 2021; 13(24):4349. https://doi.org/10.3390/polym13244349
Chicago/Turabian StyleBelbakra, Zakaria, Alessandro Napoli, Zoubair Cherkaoui, and Xavier Allonas. 2021. "Analysis of Acrylic and Methacrylic Networks through Pyrolysis-GC/MS" Polymers 13, no. 24: 4349. https://doi.org/10.3390/polym13244349